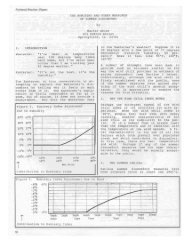
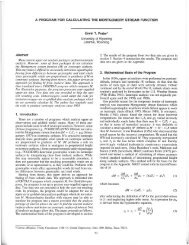
Volume 24 Numbers 1, 2 June 2000 53 Monthly Distribution <strong>of</strong> Events 14 ,n., 12 I ". " 10 /4-.. ' S //.. ", ~-~\", 6 A:: ~ 4 //.~: ".~, 2 .. -L~':" ',~~ 0 I I I I I I I I I I I J F M A M J J A S 0 N 0 Tornado -_. Major Severe • II" I. I Minor Severe _1_' No Severe Tor Maj Min Non Total 1989 4 8 4 2 18 1990 8 4 7 13 32 1991 4 11 12 10 37 1992 8 7 6 8 29 1993 13 7 8 4 32 Fig. 1. The monthly distribution <strong>of</strong> thunders<strong>to</strong>rm days used in this study for each <strong>of</strong> <strong>the</strong> 4 severe categories (upper portion). The lower portion shows <strong>the</strong> distribution <strong>of</strong> thunders<strong>to</strong>rm days by year for each <strong>of</strong> <strong>the</strong> 4 severe categories. entiate <strong>the</strong> atmospheric conditions that produce <strong>to</strong>rnadic thunders<strong>to</strong>rm days, major! severe thunders<strong>to</strong>rm days, and minor severe thunders<strong>to</strong>rm days. In <strong>the</strong> third step, Maglaras and LaPenta (1997) (hereafter referred <strong>to</strong> as ML97) described <strong>the</strong> <strong>development</strong> <strong>of</strong> an equation <strong>to</strong> make conditional <strong>forecast</strong>s <strong>of</strong> <strong>the</strong> <strong>severity</strong> <strong>of</strong> a thunders<strong>to</strong>rm day given <strong>the</strong> occurrence <strong>of</strong> thunders<strong>to</strong>rms. The equation developed in ML97 provides guidance on <strong>forecast</strong>ing <strong>to</strong>rnadic, non-<strong>to</strong>rnadic but severe, and non-severe thunders<strong>to</strong>rm days. However, <strong>the</strong>ir equation didn't identify whe<strong>the</strong>r <strong>the</strong> main threat from non-<strong>to</strong>rnadic severe s<strong>to</strong>rms would be damaging winds or large <strong>hail</strong> (diameter .75 inch or larger). This study uses <strong>the</strong> data set developed 1 Major severe wea<strong>the</strong>r days were defined as those days with 10 or more severe wea<strong>the</strong>r reports in <strong>the</strong> nor<strong>the</strong>astern United States, and minor severe wea<strong>the</strong>r days were defined as those days with less than 10 events. The nor<strong>the</strong>astern United States as defined in L95, ML97 and in this paper includes New York, New England, New Jersey and Pennsylvania. in <strong>the</strong> previous studies, LM93, L95 and ML97, <strong>to</strong> develop conditional <strong>forecast</strong> <strong>equations</strong> <strong>to</strong> <strong>predict</strong> <strong>the</strong> overall <strong>severity</strong> <strong>of</strong> <strong>hail</strong> days by category, and <strong>the</strong> expected maximum <strong>hail</strong> size in New York State. The purpose <strong>of</strong> <strong>the</strong>se <strong>equations</strong> is <strong>to</strong> provide objective statistical guidance based on <strong>the</strong> <strong>forecast</strong>er's subjective assessment <strong>of</strong> <strong>the</strong> general atmospheric conditions expected at <strong>the</strong> time <strong>of</strong> <strong>the</strong> event. 2, Data In LM93, <strong>the</strong> general atmospheric conditions that were associated with <strong>to</strong>rnadoes in New York State on 24 days from 1989 <strong>to</strong> 1992 were examined. In L95, 111 days from 1989 <strong>to</strong> 1993 with severe wea<strong>the</strong>r in New York State were examined, 37 <strong>of</strong> which produced <strong>to</strong>rnadoes. In that study, an analysis was carried out <strong>to</strong> differentiate <strong>the</strong> general atmospheric conditions that were associated with <strong>to</strong>rnadic thunders<strong>to</strong>rm days, major severe thunders<strong>to</strong>rm days, and minor severe thunders<strong>to</strong>rm days. The data on <strong>the</strong> <strong>to</strong>rnadic and severe thunders<strong>to</strong>rm days were obtained from S<strong>to</strong>rm Data (U.S. Department <strong>of</strong> Commerce 1989-1993). In ML97 a statistical analysis was carried out <strong>to</strong> develop an equation <strong>to</strong> make conditional <strong>forecast</strong>s <strong>of</strong> <strong>the</strong> <strong>severity</strong> <strong>of</strong> a thunders<strong>to</strong>rm day given <strong>the</strong> occurrence <strong>of</strong> thunders<strong>to</strong>rms. The purpose <strong>of</strong> <strong>the</strong> equation was <strong>to</strong> provide objective statistical guidance <strong>to</strong> <strong>forecast</strong>ers, using many <strong>of</strong> <strong>the</strong> methods and <strong>to</strong>ols <strong>forecast</strong>ers had been using for years <strong>to</strong> make subjective assessments <strong>of</strong> <strong>the</strong> potential for severe convection. The equation's objective output was based on <strong>the</strong> <strong>forecast</strong>er's subjective assessment <strong>of</strong> <strong>the</strong> general atmospheric conditions expected at <strong>the</strong> time <strong>of</strong> <strong>the</strong> event. That analysis was performed using thunders<strong>to</strong>rm data from L95 as part <strong>of</strong> <strong>the</strong> <strong>development</strong>al sample. These data included 37 <strong>to</strong>rnadic thunders<strong>to</strong>rm days, 37 major severe thunders<strong>to</strong>rm days, and 37 minor severe thunders<strong>to</strong>rm days. In order <strong>to</strong> include a sample <strong>of</strong> non-severe thunders<strong>to</strong>rm days, that data set (L95) was expanded <strong>to</strong> include an additional 37 days where thunders<strong>to</strong>rms occurred, but no severe wea<strong>the</strong>r was reported. The distributions <strong>of</strong> <strong>the</strong>se thunders<strong>to</strong>rm days by month and by year are shown in Fig. 1. The <strong>equations</strong> developed in this study are based on <strong>the</strong> 148 days used in ML97 for <strong>the</strong> period from January 1989 through December 1993. For each <strong>of</strong> <strong>the</strong> 148 days used, a sounding was constructed <strong>to</strong> approximate <strong>the</strong> synoptic-scale atmospheric conditions at <strong>the</strong> time <strong>of</strong> <strong>the</strong> event. Actual atmospheric soundings from across <strong>the</strong> nor<strong>the</strong>astern United States were examined, and <strong>the</strong> sounding that was considered <strong>to</strong> be most representative <strong>of</strong> <strong>the</strong> airmass over <strong>the</strong> location where <strong>to</strong>rnadoes, severe or non-severe thunders<strong>to</strong>rms occurred was selected. This sounding was <strong>the</strong>n modified using <strong>the</strong> Skew-T Hodograph Analysis and Research Program (SHARP) (Hart and Korotky 1991) for observed surface temperature, dewpoint and wind from a surface observation site near <strong>the</strong> location and at <strong>the</strong> time <strong>of</strong> <strong>the</strong> thunders<strong>to</strong>rms. On a few occasions, additional subjective modifications were made if significant <strong>the</strong>rmal advection al<strong>of</strong>t was evident, or changes <strong>to</strong> <strong>the</strong> vertical wind pr<strong>of</strong>ile were warranted due <strong>to</strong> wind speed and/or direction changes al<strong>of</strong>t.
54 National Wea<strong>the</strong>r Digest Table 1. Definitions <strong>of</strong> <strong>hail</strong> size categories and <strong>of</strong> number <strong>of</strong> event categories. Hail size Hail Size Event Number category (in.) category <strong>of</strong> events Table 2.