development of forecast equations to predict the severity of hail ...
development of forecast equations to predict the severity of hail ...
development of forecast equations to predict the severity of hail ...

Create successful ePaper yourself
Turn your PDF publications into a flip-book with our unique Google optimized e-Paper software.
56<br />
National Wea<strong>the</strong>r Digest<br />
regression program for both <strong>equations</strong>. However, once<br />
<strong>the</strong> CAPE was selected first, <strong>the</strong> LI became unimportant<br />
(despite <strong>the</strong> high correlation <strong>to</strong> <strong>the</strong> <strong>development</strong> sample)<br />
and does not appear in ei<strong>the</strong>r equation because it substantially<br />
duplicates <strong>the</strong> information presented by CAPE<br />
(<strong>the</strong>se two variables were also highly correlated with<br />
each o<strong>the</strong>r). Similarly, <strong>the</strong> EHI was highly correlated <strong>to</strong><br />
<strong>the</strong> <strong>development</strong> samples, but it does not appear in <strong>the</strong><br />
equation because <strong>the</strong> information it provides has already<br />
been accounted for by <strong>the</strong> CAPE and SRH. In contrast,<br />
<strong>the</strong> WBZCAT was <strong>the</strong> least correlated predic<strong>to</strong>r individually,<br />
but was selected as <strong>the</strong> third predic<strong>to</strong>r by <strong>the</strong> iterative<br />
regression process (after <strong>the</strong> CAPE and SRH had<br />
already been selected), because it had virtually no correlation<br />
with <strong>the</strong> o<strong>the</strong>r predic<strong>to</strong>rs and, thus, <strong>the</strong> information<br />
it provided had not already been accounted for.<br />
Observations and numerical simulations indicate<br />
wind shear is important in organizing convection. (e.g.,<br />
Fawbush and Miller 1954; Weisman and Klemp 1984).<br />
Given sufficient instability, increasing wind shear favors<br />
more organized multicellular and supercellular s<strong>to</strong>rms<br />
(Weisman and Klemp 1986). Observational experience<br />
suggests that very large <strong>hail</strong> is usually associated with<br />
supercells and well-organized multicellular systems<br />
(Johns and Doswell 1992). In addition, vertical shear<br />
may contribute <strong>to</strong> updraft strength. Brooks and<br />
Wilhelmson (1990) used numerical simulations <strong>to</strong> examine<br />
<strong>the</strong> relationship <strong>of</strong> updraft intensity <strong>to</strong> curvature<br />
shear <strong>of</strong> <strong>the</strong> environmental winds as measured by SRH.<br />
They concluded that this low-level shear as measured by<br />
SRH enhanced updraft intensity.<br />
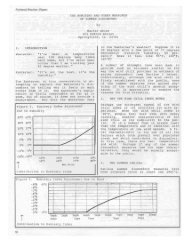
The <strong>the</strong>rmal structure <strong>of</strong> <strong>the</strong> troposphere plays a role<br />
in <strong>the</strong> occurrence and size <strong>of</strong> <strong>hail</strong> at <strong>the</strong> surface <strong>of</strong> <strong>the</strong><br />
earth. Melting <strong>of</strong> a <strong>hail</strong>s<strong>to</strong>ne as it falls is related <strong>to</strong> its<br />
initial size, <strong>the</strong> depth <strong>of</strong> <strong>the</strong> above-freezing layer<br />
through which it falls and <strong>the</strong> temperature <strong>of</strong> this layer.<br />
The WBZ level approximates <strong>the</strong> height <strong>of</strong> <strong>the</strong> freezing<br />
level in <strong>the</strong> downdraft air <strong>of</strong> <strong>the</strong> thunders<strong>to</strong>rm. The<br />
higher <strong>the</strong> WBZ level and <strong>the</strong> warmer <strong>the</strong> air below it,<br />
<strong>the</strong> greater <strong>the</strong> melting and <strong>the</strong> lower <strong>the</strong> likelihood<br />
that large <strong>hail</strong>s<strong>to</strong>nes would reach <strong>the</strong> ground (Johns<br />
and Doswell 1992). The lower <strong>the</strong> WBZ level and <strong>the</strong><br />
colder <strong>the</strong> air below it, <strong>the</strong> less melting. However, WBZ<br />
levels that are <strong>to</strong>o low usually are indicative <strong>of</strong> atmospheric<br />
conditions that are not favorable for severe convection.<br />
Even if severe convection does occur, <strong>the</strong> convection<br />
will be shallow and not be conducive <strong>to</strong> <strong>the</strong> formation<br />
<strong>of</strong> large <strong>hail</strong>s<strong>to</strong>nes. Therefore, Miller (1972) felt<br />
that <strong>the</strong> probability <strong>of</strong> <strong>hail</strong> was greatest when <strong>the</strong> WBZ<br />
was within a certain range. In this study <strong>the</strong> WBZ (and<br />
<strong>the</strong> actual environmental freezing level) showed little<br />
correlation <strong>to</strong> <strong>hail</strong> size or <strong>hail</strong> <strong>severity</strong> category.<br />
However, <strong>the</strong> deviation <strong>of</strong> <strong>the</strong> WBZ from a given value<br />
was examined and this significantly improved <strong>the</strong> correlation.<br />
Using <strong>the</strong> deviation from 10,000 ft provided<br />
<strong>the</strong> best results. (The average WBZ for <strong>the</strong> <strong>development</strong><br />
data cases with severe <strong>hail</strong> was 10,900 ft). Forecaster<br />
experience indicated that an observed WBZ below this<br />
preferred level was not as detrimental as a deviation<br />
above <strong>the</strong> preferred level. This is because <strong>the</strong>re would<br />
be less time for a falling <strong>hail</strong>s<strong>to</strong>ne <strong>to</strong> melt when WBZ<br />
values exhibit a negative deviation. WBZ categories<br />
\<br />
based on <strong>the</strong> deviation from an ideal WBZ level were<br />
created (Table 3), and <strong>the</strong>se values were used in <strong>the</strong><br />
<strong>forecast</strong> equation.<br />
b. Evaluation <strong>of</strong> <strong>the</strong> <strong>predict</strong>ion <strong>equations</strong><br />
An evaluation <strong>of</strong> <strong>the</strong> <strong>equations</strong> on <strong>the</strong> <strong>development</strong><br />
sample <strong>of</strong> 123 cases revealed <strong>the</strong> following. The CAT<br />
equation showed an overall correlation with <strong>the</strong> <strong>development</strong><br />
sample <strong>of</strong> .50, while <strong>the</strong> correlation <strong>of</strong> <strong>the</strong> SIZE<br />
equation was .46. As a result, <strong>the</strong> <strong>equations</strong> account for<br />
25% (or nearly 25% percent) <strong>of</strong> <strong>the</strong> variance <strong>of</strong> <strong>the</strong> dependent<br />
variable for <strong>the</strong> CAT (SIZE) equation. The <strong>equations</strong><br />
were tested for significance using <strong>the</strong> F-test, and <strong>the</strong> F<br />
test showed that <strong>the</strong> regression analysis results were significant<br />
at <strong>the</strong> 99% confidence level for both <strong>equations</strong>.<br />
The <strong>predict</strong>ed mean value <strong>of</strong> <strong>the</strong> CAT (SIZE) equation<br />
was 5.04 (1.034), with a mean square error <strong>of</strong> 1.560<br />
(0.509). The residuals showed independence with near<br />
zero mean (a 0.096 mean for <strong>the</strong> CAT equation and a -<br />
0.060 mean for <strong>the</strong> SIZE equation). In addition, <strong>the</strong> residuals<br />
were evenly distributed around <strong>the</strong> mean.<br />
The <strong>equations</strong> were also evaluated on a validation<br />
sample <strong>of</strong> 25 cases. Using <strong>the</strong> categories provided in<br />
Table 2, <strong>the</strong> test results showed that <strong>the</strong> CAT equation<br />
was able <strong>to</strong> <strong>forecast</strong> <strong>the</strong> correct <strong>hail</strong> category 13 out <strong>of</strong> 25<br />
times. Of <strong>the</strong> 12 incorrect <strong>forecast</strong>s, none were incorrect<br />
by more than one category.<br />
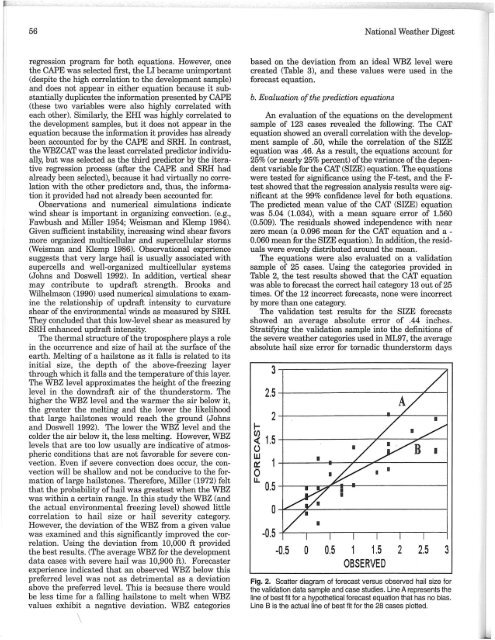
The validation test results for <strong>the</strong> SIZE <strong>forecast</strong>s<br />
showed an average absolute error <strong>of</strong> .44 inches.<br />
Stratifying <strong>the</strong> validation sample in<strong>to</strong> <strong>the</strong> definitions <strong>of</strong><br />
<strong>the</strong> severe wea<strong>the</strong>r categories used in ML97, <strong>the</strong> average<br />
absolute <strong>hail</strong> size error for <strong>to</strong>rnadic thunders<strong>to</strong>rm days<br />
l-<br />
(/)<br />
3<br />
2.5<br />
2<br />