Annual Report Annual Report - NZX
Annual Report Annual Report - NZX
Annual Report Annual Report - NZX

You also want an ePaper? Increase the reach of your titles
YUMPU automatically turns print PDFs into web optimized ePapers that Google loves.
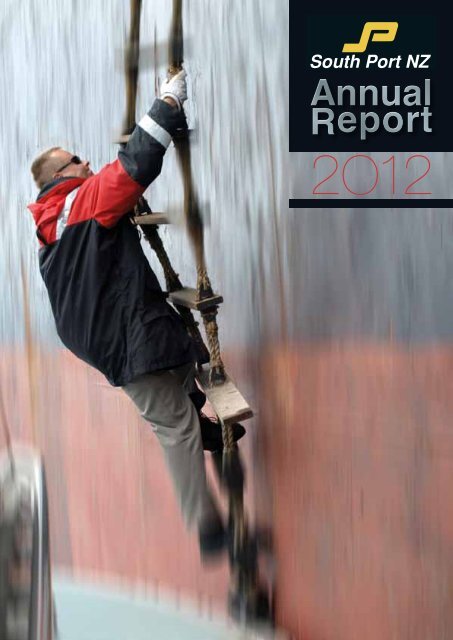
<strong>Annual</strong><br />
<strong>Report</strong><br />
2O12
Contents<br />
Inside front cover: Financial Calendar<br />
1 South Port Facts and Company Profile<br />
2 Significant Events 2011/12<br />
3 Financial Results in Brief<br />
4-12 Review of Operations<br />
13 Directors’ Profiles and Photo<br />
14, 15 Statutory <strong>Report</strong> of Directors<br />
16 Statutory Disclosure in Relation to Shareholders<br />
17, 18 Corporate Governance<br />
19 Health & Safety and Environment<br />
20, 21 Mediterranean Shipping Company – Service Overview<br />
22-25 Profile – Focus on Staff<br />
26, 27 Port Infrastructure<br />
28 Auditors’ <strong>Report</strong><br />
29 Statement of Comprehensive Income/Statement of Changes in Equity<br />
30 Statement of Financial Position<br />
31 Statement of Cash Flows<br />
32-49 Notes to the Financial Statements<br />
50 Five Year Financial Summary<br />
51 Glossary of Port and Shipping Terms<br />
52 Directory<br />
Inside back cover: Southern Region Production Locations<br />
Financial Calendar<br />
23 August 2012 • 2012 Full Year Profit Announcement Date<br />
21 September 2012 • Close of Share Register for Entitlement to Final Dividend<br />
30 October 2012 • Proxies must be lodged by 10.45 a.m.<br />
1 November 2012 • <strong>Annual</strong> Meeting – 10.45 a.m.<br />
Venue: South Port Board Room, Island Harbour, Bluff<br />
9 November 2012 • Final Dividend Payment mailed<br />
7 February 2013 • 2013 Interim Profit Announcement<br />
March 2013<br />
• 2013 Interim Dividend Payment<br />
30 June 2013 • Financial Year End<br />
Cover illustration – Pilot, Ruslan Mitlash, boarding “MSC Sardinia” in Foveaux Strait<br />
Inside front cover illustration – Tug “Monowai“ at left and “MSC London” departing Bluff with the “Mandarin Arrow” at the Tiwai Wharf
South Port Facts<br />
• Owns and manages assets which have a book value of $35 million<br />
• Directly employs more than 65 full time equivalent staff<br />
• Is the only Southland based company listed on <strong>NZX</strong> – market capitalisation as at 30 June 2012 equates to<br />
$80 million<br />
• Handles in excess of 2.6 million tonnes of cargo in a normal trading year<br />
• Offers full container, break-bulk and bulk cargo capability and services the following main cargoes:<br />
Import – alumina, petroleum products, fertiliser, acid, fish, stock food and cement<br />
Export – aluminium, timber, logs, dairy, meat by-products and wood chips<br />
• Has split its land-based operating resource into four main divisions – warehousing & packing, containers,<br />
cool & cold storage and dairy<br />
• Undertakes its primary port operation on a 40 ha man-made Island Harbour situated at Bluff<br />
• Operates a separate dedicated fuel berth at Bluff Town Wharf plus provides the Tiwai Wharf facility to NZAS<br />
under a long term licence<br />
• Services vessels carrying approx 1.0 million tonnes of cargo destined for movement across the Tiwai Wharf<br />
each year, of which 2/3 is raw material imports while 1/3 is finished aluminium product<br />
• Has approximately 8 ha of on-port land available for further port development or industry establishment<br />
Company Profile<br />
Southland<br />
BLUFF<br />
South Port New Zealand Ltd (South Port) is the southern most commercial port in New Zealand,<br />
located at Bluff and operating on a year round, 24 hour basis. It is situated in the rich productive<br />
province of Southland which is responsible for generating a sizeable proportion of New Zealand’s<br />
total exports by value. The region’s major cargo producing sites are situated within 30 to 80 km<br />
of the Port.<br />
The Port of Bluff has been operating since 1877 while the Company was formed in 1988 having<br />
taken over the assets and liabilities of the former Southland Harbour Board.<br />
South Port was listed on the NZ Stock Exchange (<strong>NZX</strong>) in 1994 and has Environment Southland,<br />
the region’s local government environmental agency, as its 66% majority shareholder.<br />
1
Significant Events 2011/12<br />
• Achieved $5.99 million profit result (2011<br />
$6.26 million) driven by buoyant cargo volumes across<br />
a range of sectors. Current year normalised profit was $5.72<br />
million [sale proceeds from crane exceeded book value by<br />
$270,000] versus $6.0 million last year.<br />
• Declared improved dividend of 20.0 cents<br />
per share (2011 dividend 20.0 cents).<br />
• Cargo volume lifted by 2% or 50,000 tonnes to<br />
establish new record of 2.69 million tonnes<br />
(2011 - 2.64 million). Increase largely attributable to uplifts<br />
in wood chips, fertiliser, petroleum and stock food.<br />
• Wood chip cargo registered record level and<br />
exceeded 250,000 tonnes. Sawn timber tonnages<br />
also strengthened against difficult trading back drop.<br />
• Reduction in log demand driven by lower<br />
Chinese consumption meant this cargo category fell<br />
by 90,000 tonnes representing a 27% decline.<br />
• Stock food imports more than doubled<br />
compared to the prior year throughput with<br />
molasses and palm kernel registering significant lifts.<br />
• A 6,000 m2 additional dry warehouse to be<br />
located on the Island Harbour was committed to, with<br />
construction scheduled over the next 6 months.<br />
• Containerised cargo sat at 32,500 TEU per<br />
annum versus 33,000 in 2011. MSC weekly service secured<br />
regular support from regional importers and exporters.<br />
• Operating personnel secured improved productivity<br />
during period from new Liebherr mobile harbour crane<br />
assisting prompt turnaround of MSC vessels.<br />
• Consistent dairy export volumes were handled while<br />
a noticeable lift in imported lactose product<br />
was warehoused/distributed on behalf of Fonterra.<br />
• Continuing strong fertiliser tonnages flowed<br />
through the Port while petroleum import levels matched<br />
the previous all-time record set in 2005.<br />
• Due to customers encountering slow moving products and<br />
challenging market conditions, Cold Storage division<br />
again experienced firm demand.<br />
• Solid Energy completed construction of its $25 million<br />
briquette plant in Eastern Southland. Potential<br />
exists to upscale this process.<br />
• OMV consortium combined with Shell NZ to<br />
form a new Great South Basin licence holding<br />
entity, from which an exploration decision is pending.<br />
• Solid Energy progressing assessment of the viability of a<br />
lignite-to-urea conversion plant in Southland via<br />
a detailed feasibility study.<br />
• New Hyster Reach Stacker plant commissioned<br />
during period providing greater flexibility and lifting<br />
capacity for containerised cargo.<br />
• Southland Cool Stores cold storage business<br />
acquired August 2012.<br />
• Gains recorded in the Health & Safety area through<br />
achieving highest level of safety<br />
accreditation under ACC Workplace Safety<br />
Management Programme, plus adoption of random<br />
drug and alcohol testing.<br />
The new Hyster<br />
Reach Stacker<br />
2
Financial Results in Brief<br />
$m<br />
6.0<br />
5.0<br />
4.0<br />
3.0<br />
2.0<br />
1.0<br />
$2.5m<br />
Surplus after Tax<br />
1<br />
$4.1m<br />
$3.1m<br />
$5.2m<br />
1<br />
$6.0m $6.3m<br />
$6.0m<br />
$m<br />
12.0<br />
10.0<br />
8.0<br />
6.0<br />
4.0<br />
2.0<br />
Operating Cash Flow<br />
$3.7m<br />
$6.4m<br />
$4.9m<br />
$12.8m<br />
$6.7m<br />
2<br />
%<br />
90<br />
85<br />
80<br />
75<br />
70<br />
92.8%<br />
Equity Ratio<br />
87.8%<br />
80.9%<br />
85.0%<br />
84.9%<br />
2008 2009 2010 2011 2012<br />
1: Restated profit with one-off deferred tax<br />
adjustments reflected.<br />
2008 2009 2010 2011 2012 2008 2009 2010 2011 2012<br />
2: Includes NZAS arbitration settlement.<br />
In Thousands of New Zealand Dollars 2012 2011<br />
Revenue $26,465 $25,343<br />
Surplus after tax $5,989 $6,258<br />
Cashflow from operating activities $6,721 $12,806<br />
Total assets $34,812 $33,907<br />
Total equity $29,572 $28,827<br />
Shareholders’ equity ratio 84.9% 85.0%<br />
Earnings per share 22.8c 23.9c<br />
Dividends declared per share 20.00c 20.00c<br />
Net asset backing per share $1.13 $1.10<br />
Return on shareholders’ funds 20.5% 22.3%<br />
Cargo throughput (000’s tonnes) 2,691 2,636<br />
Dividends per Share<br />
Return on Equity<br />
Return on Assets<br />
c<br />
21<br />
18<br />
15<br />
12<br />
9<br />
6<br />
9.50c<br />
13.50c<br />
17.00c<br />
20.00c<br />
20.00c<br />
%<br />
24<br />
20<br />
16<br />
12<br />
8<br />
9.4%<br />
15.0%<br />
11.4%<br />
22.3%<br />
20.5%<br />
%<br />
25<br />
20<br />
15<br />
10<br />
14.0%<br />
18.8%<br />
23.1%<br />
26.2%<br />
25.3%<br />
3<br />
4<br />
5<br />
2008 2009 2010 2011 2012 2008 2009 2010 2011 2012 2008 2009 2010 2011 2012<br />
3
Review of<br />
Operations<br />
Overview<br />
During a period in which several significant world markets<br />
continued to come under economic pressure, South Port<br />
was pleased to post another strong trading result. Aided by a<br />
primary-produce sector that has demonstrated durability, total<br />
cargo volume passing through the Port represented a record<br />
level for the second consecutive year.<br />
It should be acknowledged that a number of customers<br />
encountered challenging operating conditions in the past<br />
season and this created either slow moving inventory or<br />
reduced margins for these businesses.<br />
The reported after tax profit of $5.99 million (2011 – $6.26<br />
million) included a one-off tax-paid adjustment of $270,000<br />
as the sale proceeds from the sale of a surplus mobile harbour<br />
crane exceeded the book value. Reversing this adjustment<br />
results in a 2012 normalised profit of $5.72 million compared<br />
with $5.98 million in the prior year.<br />
Normalised Profit Table<br />
reflecting $ millions 2012 2011<br />
Net Surplus After Income Tax 5.99 6.26<br />
One-off Gain on Asset Sale / Deferred<br />
Tax Adjustment (0.27) (0.28)<br />
Restated Profit $5.72 $5.98<br />
Mark O’Connor and Rex Chapman<br />
with black pottery vase presented to South Port<br />
by Lanshan Harbour Co., China on signing of<br />
Agreement on Technical Co-operation<br />
The above result can be considered extremely creditable when<br />
shareholders take into account the fact that the Company<br />
had to absorb much higher operating costs in the reported<br />
period. The cost of establishing appropriate resources to<br />
handle a sustained lift in base cargo, the effect of increased<br />
depreciation on large scale plant (mobile harbour crane and<br />
top lifter forklifts) and significantly higher insurance charges<br />
reflected in the bottom line result. Shareholders will be aware<br />
that South Port achieved a 25% lift in cargo volume during<br />
2011 (compared to the average annual tonnage level of the<br />
three previous financial years) and this on-going activity gain<br />
can only be supported with additional personnel, plant and<br />
infrastructure.<br />
Number of Containers<br />
(TEU Equivalents)<br />
Breakdown of Cargo<br />
(Bulk/Break-bulk/Containers tonnage)<br />
bulk break-bulk containers<br />
10,700<br />
124,000<br />
23,800<br />
28,900<br />
32,700<br />
32,400<br />
1,779,000<br />
1,428,000<br />
1,673,000<br />
2,034,000<br />
2,086,000<br />
346,000<br />
203,000<br />
245,000<br />
261,000<br />
264,000<br />
232,000<br />
250,000<br />
340,000<br />
342,000<br />
2008 2009 2010 2011 2012<br />
2008 2009 2010 2011 2012 2008 2009 2010 2011 2012 2008 2009 2010 2011 2012<br />
4
Liehberr LHM 400 mobile<br />
crane loading container<br />
onto an MSC vessel<br />
‘‘<br />
The global container shipping<br />
market has sustained<br />
significant losses and this has<br />
necessitated both schedule<br />
and tariff rate realignment...”<br />
Cargo Activity<br />
Unlike the previous period when all cargo categories were either<br />
steady or improved, the 2012 year delivered a mix of volume gains and<br />
losses across a range of sectors. Fortunately, overall gains outweighed<br />
losses and in the past 12 months a fresh annual volume record of 2.69<br />
million tonnes was established (2011 – 2.64 million tonnes).<br />
Products recording substantial volume increases included<br />
petroleum, stock food, sawn timber and wood chips. Trades<br />
registering noticeable declines were logs and NZAS import<br />
products. Containerised cargo activity was stable with total TEU<br />
(twenty foot container unit measure) volume reflecting 32,500<br />
(2011 – 33,000).<br />
Containers<br />
(Vanned / Devanned)<br />
Crane Productivity<br />
(moves per hour)<br />
Ship Calls<br />
1,200<br />
12.5<br />
4,900<br />
4,900<br />
5,700<br />
15.6<br />
15.0<br />
15.4<br />
17.81<br />
246<br />
252<br />
284<br />
6,900<br />
336<br />
328<br />
2008 2009 2010 2011 2012 2008 2009 2010 2011 2012 2008 2009 2010 2011 2012<br />
5
Comparative Cargo Breakdown<br />
2012<br />
IMPORTS: 62%<br />
EXPORTS: 38%<br />
Comparative Cargo Breakdown<br />
2011<br />
IMPORTS: 60%<br />
EXPORTS: 40%<br />
Other 2%<br />
Other 2%<br />
NZAS imports<br />
32%<br />
NZAS<br />
exports<br />
11%<br />
NZAS imports<br />
34%<br />
NZAS<br />
exports<br />
12%<br />
Agricultural products 4%<br />
Agricultural products 4%<br />
Stock food 5%<br />
Fertiliser<br />
10%<br />
Forest<br />
products<br />
21%<br />
Stock food 2%<br />
Sulphuric acid 3%<br />
Petroleum<br />
products<br />
9%<br />
Other 3%<br />
Fertiliser<br />
11%<br />
Forest<br />
products<br />
22%<br />
Sulphuric acid 2%<br />
Petroleum<br />
products<br />
8%<br />
Other 3%<br />
Barbara Zhang, NAC Trading Ltd, Rex<br />
Chapman, Shang Jinrui, Lanshan Harbour<br />
Co. and Mark O’Connor at Lanshan Port<br />
China. In background is vessel “Maple<br />
Fortitude” unloading logs which had been<br />
uplifted from Bluff in early May<br />
The global container shipping market has sustained significant<br />
losses and this has necessitated both schedule and tariff rate<br />
realignment.<br />
While this can create disruption and financial adjustment for cargo<br />
providers, it is also important that the companies providing these<br />
international connections are in a position to maintain viable<br />
shipping services. South Port is appreciative of the global linkage<br />
that MSC provides to the region through its weekly Capricorn<br />
container shipping call.<br />
Caught-up in a perfect economic storm, New Zealand Aluminium<br />
Smelters (NZAS), which now forms part of the Pacific Aluminium<br />
Group, was forced to reduce its production capacity by<br />
approximately 15%. This action was necessary due to the<br />
deterioration of market conditions, including the uncertainty<br />
around electricity market pricing, the high exchange rate and<br />
low aluminium prices.<br />
Previous strong demand that was evident for logs originating from<br />
New Zealand diminished noticeably over the past 12 months.<br />
In the case of South Port the volume fell by 90,000 tonnes or<br />
approximately 27%. Offsetting this decline were lifts in both<br />
woodchip and sawn timber exports.<br />
The dairy sector again proved to be resilient and in the South Port<br />
environment offers a growing range of import and export cargoes.<br />
These include the import of manufacturing ingredients (lactose),<br />
packaging materials, caustic soda, stock food and the export of<br />
finished dairy product. Of note the volume of imported Fonterra<br />
lactose warehoused by South Port showed a marked increase.<br />
Fertiliser tonnages imported through Bluff in 2012 remained at<br />
all-time-highs and linked to general economic activity in the<br />
region petroleum cargoes matched the previous record level<br />
established back in 2005. The cold storage division again provided<br />
an important contribution to the overall result. Sluggish market<br />
conditions for meat, fish and other cold storage products meant<br />
that higher levels of inventory existed during the second half of<br />
the financial year.<br />
Other Operational Events<br />
Southland Cool Stores – In late July 2012 South Port entered into<br />
an agreement to purchase the cold storage business of Southland<br />
Cool Stores Ltd located at Bluff. The transaction was dependent<br />
on the successful outcome of a due diligence process and it was<br />
subsequently confirmed that the business acquisition would<br />
proceed. A long term lease of the former Southland Cool Stores<br />
premises was executed as part of the transaction and integration of<br />
this operating site with South Port’s existing cold storage division<br />
is now underway.<br />
Sale of Surplus Mobile Harbour Crane – During January 2012,<br />
South Port entered into a contract to realise a surplus mobile<br />
harbour crane. The Liebherr LHM320 crane being sold was<br />
replaced by a larger and more modern crane approximately<br />
12 months ago and this new plant is servicing customers very<br />
effectively. Sale proceeds exceeded the carrying cost of the asset<br />
by an after-tax amount of $270,000.<br />
NZAS and Pacific Aluminium – In October 2011 Rio Tinto<br />
announced that following a strategic review it would be<br />
streamlining its aluminium production division and divesting<br />
several world-wide assets at an appropriate time in the future.<br />
As a consequence it elected to transfer six Australian and New<br />
Zealand assets into a new business called Pacific Aluminium.<br />
Included in the group of transferred assets is NZAS which operates<br />
the aluminium production facility located on Tiwai Peninsula<br />
alongside Bluff Harbour.<br />
6
further dry warehousing<br />
the Island Harbour at Bluff in order<br />
‘‘constructing<br />
to cater for anticipated future<br />
regional cargo growth.”<br />
Proposed new Shed 7 etched in<br />
orange alongside the present Shed 4<br />
This significant customer of South Port has signalled that while it is<br />
now part of a different business structure it is very much operating<br />
on a “business as usual” basis and that any potential future sale is<br />
likely to be to a new owner with a long-term operating view. It is<br />
also worthwhile noting that NZAS has a significant “take or pay”<br />
electricity contract with Meridian Energy which covers an 18 year<br />
period through to 2030. It was recently reported that NZAS is in<br />
discussions with Meridian concerning this electricity contract.<br />
Shareholders should be aware that the dedicated Tiwai Wharf<br />
and Access Bridge used by NZAS is covered by a 35 year Licence<br />
(Lease) Agreement which took effect from 2008.<br />
Forestry Exports – As noted under the cargo commentary, a<br />
sizeable decline in log export activity occurred during the final<br />
three quarters of the 2012 financial year. Expectations from forestry<br />
customers are that more favourable trading conditions will be reestablished<br />
in the New Zealand Spring period. Fortunately, strong<br />
outflows of wood chip product and higher sawn timber tonnages<br />
offset the log volume decrease.<br />
Lanshan Port Relationship Agreement – In June 2012 South<br />
Port’s Chairman and Chief Executive travelled to China to enter<br />
into an Agreement on Technical Co-operation (TCO) with Lanshan<br />
Harbour Co Ltd (Lanshan Port). Situated in the Eastern part<br />
of Shandong Province approximately in the middle of China’s<br />
coastline, and forming part of the larger Rizhao Port Group,<br />
Lanshan Port is the largest export destination for NZ pinus radiata<br />
logs. The Company considers itself privileged to be able to form<br />
this type of relationship and looks forward to exploring further<br />
technical and trade opportunities with its Chinese counterpart.<br />
Whilst in China the South Port representatives also met with other<br />
significant businesses located in Shandong province. The approach<br />
by Lanshan Port and the subsequent completion of a TCO was<br />
facilitated by South Port’s Chinese customer NAC Trading Ltd whose<br />
Marketing Manager Barbara Zhang travelled with the South Port<br />
personnel. There is no doubt that the Chinese market represents<br />
an important prospect for New Zealand exporters but it is essential<br />
that appropriate time and effort be invested by businesses to<br />
understand the market and the niche opportunities that exist.<br />
Additional Dry Warehousing – South Port announced to<br />
shareholders in October 2011 that it would be constructing further<br />
dry warehousing on the Island Harbour at Bluff in order to cater<br />
for anticipated future regional cargo growth.<br />
Design options and costings have been finalised and the construction<br />
of this asset will occur over the coming six months. In addition, lease<br />
negotiations with prospective tenants are well advanced.<br />
International Shipping Line Consolidation – As highlighted<br />
previously, the 2011/2012 period was noteworthy for the<br />
continuing action of mainly container shipping lines to rationalise<br />
their global operations. This is being achieved through business<br />
alliances and vessel sharing arrangements which are designed to<br />
reduce operating costs in what can only be described as a brutal<br />
freight market. This is partly attributable to the economic events<br />
occurring in Europe which have severely impacted trade volumes<br />
flowing between that market and Asia. Industry commentators<br />
predict that a sizeable percentage of the world-wide container<br />
shipping fleet will have to be laid up in the coming year as<br />
contracted larger new-build vessels come into the system.<br />
7
South Port’s No. 1 cold store storing<br />
pet food and various fish species<br />
cold storage division<br />
provided an important contribution<br />
‘‘The<br />
to the overall result...”<br />
Port Infrastructure Developments – Significant ‘capex’ outlays<br />
during the 2012 financial year related to:<br />
• Acquiring a Hyster container reach stacker plus a back-up<br />
container spreader for the Liebherr mobile harbour crane;<br />
• Undertaking a further stage of the container terminal paving<br />
upgrade; and<br />
• Completing safety/security fencing for the container terminal<br />
area including the installation of automated gates.<br />
The Company also continued to implement requirements of the<br />
medium term focused Asset Maintenance Plan developed for its<br />
major infrastructure in 2006/2007.<br />
Insurance Renewal – Providers of cover in the international<br />
insurance market continue to be risk adverse and therefore it<br />
was pleasing to be able to place 100% of its required insurance<br />
by the 1 July policy anniversary date. Being part of an insurance<br />
collective involving several New Zealand Port Companies has<br />
provided advantages for South Port but this did not prevent a<br />
further premium increase being incurred.<br />
Financial<br />
2012 Financial Result (comparatives shown in brackets)<br />
• Revenue from Port and warehousing operations increased by<br />
4% to $26.0 million ($25.1 million).<br />
• Consistent with the additional resources deployed within<br />
the business, operating profit before financing costs and tax<br />
declined by 5% to $8.3 million ($8.7 million).<br />
• Net financing costs for the Group were $375,000 ($339,000).<br />
• The Group’s overall result was an after tax surplus of $5.99<br />
million ($6.26 million), which represented a 4% decrease on<br />
the previous year.<br />
• Based on the reported result, earnings per share were 22.8 cents<br />
(23.9 cents per share).<br />
• Total equity is $29.6 million ($28.8 million) after allowing for<br />
dividend payments during the period of $5.25 million ($4.72<br />
million).<br />
• Group equity includes issued capital of $9.4 million ($9.4 million),<br />
which is made up of 26,234,898 ordinary shares.<br />
• Total Group assets stand at $34.8 million ($33.9 million).<br />
• Net tangible asset backing per share equates to $1.13 ($1.10<br />
per share).<br />
• Current assets amount to $5.0 million ($3.4 million), whereas<br />
current liabilities remain constant at $4.5 million ($4.5 million).<br />
This creates a net working capital position of positive $0.5 million<br />
versus negative $1.1 million last year.<br />
• Term liabilities now total $0.8 million ($0.5 million).<br />
• Property, Plant and Equipment stood at $29.8 million ($30.5<br />
million).<br />
Dividends<br />
Shareholders will be aware Directors have adopted an ongoing<br />
policy of assessing South Port’s dividend flow after taking into<br />
consideration both its Free Cash Flows (FCF) and its reported<br />
profitability. For the purpose of this policy FCF is interpreted as<br />
being annual operating cash flow less net capital expenditure in<br />
the same period.<br />
In establishing the level of dividend payment Directors’ took into<br />
account the Company’s profit outlook, plus its ability to fund<br />
growth capital expenditure. Accordingly, the Board elected to pay<br />
a final dividend of 14.5 cents. This translates to a full year dividend<br />
of 20.0 cents (2011 – 20.0 cents).<br />
Full imputation credits will be attached to all distributions. The<br />
dividend payment represents a gross return of 9.4% (net 6.6%)<br />
based on a share price of $3.05 as at 30 June 2012. A dividend<br />
payout ratio of 88% results for 2012 (using reported NPAT) and the<br />
Board has assessed that an approximate 90% - 95% distribution<br />
should be targeted in the foreseeable future.<br />
8
Safety<br />
South Port’s on-going commitment to workplace safety was<br />
further enhanced during the period through the introduction of<br />
random drug and alcohol testing.<br />
Staff are extremely conscious of the need to ensure their fellow<br />
workers are not impaired when undertaking daily tasks and<br />
willingly undertook pre-implementation training plus adopted<br />
the new testing regime in a constructive manner.<br />
The Company also gained a tertiary level accreditation for the<br />
ACC Workplace Safety Management Programme (WSMP) and<br />
this highest achievable level under WSMP further reinforces South<br />
Port’s intention to seek continuous improvement in Health and<br />
Safety.<br />
In addition, a number of items making-up the capital expenditure<br />
programme contained a linkage to achieving South Port’s health<br />
and safety targets. Isolating the container terminal area via<br />
safety/security fencing is an example of this approach.<br />
are extremely conscious of<br />
the need to ensure their fellow<br />
‘‘Staff<br />
workers are not impaired when<br />
undertaking daily tasks...”<br />
Staff Contribution<br />
A new all-time cargo record speaks volumes for the hard work<br />
and dedication demonstrated by South Port’s workforce during<br />
the past 12 months. South Port operates in a demanding sector<br />
where efficient product movement is critical for customer cashflow<br />
and profitability. Securing productivity gains and operating<br />
cost containment are real ways of demonstrating to our customers<br />
that their business is important and thanks are extended to all staff<br />
for delivering on these objectives.<br />
Board Composition<br />
Mr Rick Christie and Mr Tommy Foggo retire this year by rotation<br />
and being eligible, offer themselves for re-election.<br />
The Company has received no other Director nominations.<br />
Murray Black, Rob Goodman and<br />
Rex Philpot securing a vessel’s lines<br />
Environment<br />
Operations were undertaken throughout the year in accordance<br />
with all existing resource consent conditions. South Port’s primary<br />
environmental responsibilities are subject to two different<br />
planning instruments; the Invercargill District Plan administered<br />
by the Invercargill City Council and the Regional Coastal Plan for<br />
Southland which is administered by Environment Southland.<br />
In the past 12 months there have been no significant new capital<br />
projects that impacted on the environment.<br />
Share Price<br />
from 1 July 2008 to 30 June 2012<br />
$3.60<br />
$3.50<br />
$3.40<br />
$3.30<br />
$3.20<br />
$3.10<br />
$3.00<br />
$2.90<br />
$2.80<br />
$2.70<br />
$2.60<br />
$2.50<br />
$2.40<br />
$2.30<br />
$2.20<br />
$2.10<br />
$2.00<br />
$1.90<br />
$1.80<br />
$1.70<br />
$1.60<br />
$1.50<br />
2008<br />
2009 2010 2011 2012<br />
JUL JUL SEP SEP NOV NOV JAN JAN MAR MAR MAY MAY JUL JUL SEP SEP NOV NOV JAN JAN MAR MAR MAY MAY JUL JUL SEP SEP NOV NOV JAN JAN MAR MAR MAY MAY JUL JUL SEP SEP NOV NOV JAN JAN MAR MAR MAY MAY JUL JUL<br />
9
Community and Regional Assistance<br />
Sponsorship of local sporting and cultural groups is part of a longterm<br />
commitment to support the community and region in which<br />
South Port operates. Organisations that received sponsorship<br />
assistance over the past financial year included:<br />
• Bluff Coastguard<br />
• Te Ara o Kiwa Sea Scouts<br />
• Bluff Hill/Motupohue Environment Trust – pest eradication<br />
programme<br />
• Bluff Maritime Museum<br />
• Bluff Oyster & Seafood Festival<br />
• Bluff Rugby Club<br />
• Bluff Yacht Club<br />
• Bluff schools, Bluff Promotions and various other local sporting<br />
organisations<br />
• James Hargest College Rugby Club<br />
• Rugby Southland<br />
• Southland Cricket Association<br />
• Young Enterprise Scheme (YES)<br />
South Port continued its primary sponsorship of the Southland<br />
Export Forum providing financial assistance to administer the forum<br />
and facilitate the holding of a number of events. In addition, the<br />
Company assisted with sponsoring the bi-annual Southland Export<br />
Recognition Dinner which was held in early September 2012.<br />
Further, on-going scholarship assistance comprises of both<br />
community and staff categories, with scholarships this year being<br />
awarded to Jesse Goodman and Darcy Kerr. Jesse is studying towards<br />
a Diploma in Nautical Science at the New Zealand Maritime College<br />
in Auckland and has the long term goal of becoming a Harbour Pilot.<br />
Darcy is enrolled at SIT to complete a Bachelor of Audio Production<br />
and once qualified would like to secure a career in the music industry.<br />
Energy Sector<br />
Oil & Gas Exploration – As outlined in the 2011 <strong>Annual</strong> <strong>Report</strong>, the<br />
most significant exploration licence in Great South Basin (GSB) is<br />
held by a consortium comprising Shell GSB Ltd (50%), OMV NZ Ltd<br />
(18%), PTTEP NZ Ltd (18%) and Mitsui E&P Australia Pty Ltd (14%).<br />
This consortium completed an extensive 3D seismic acquisition<br />
project over the most recent summer. The state-of-the-art seismic<br />
vessel Polarcus Alima undertook the seismic work in the North<br />
Eastern area of GSB.<br />
Processing of the seismic data is underway with indications<br />
suggesting this will take until early to mid-2013 to interpret and<br />
draw conclusions on the detailed geological portrait.<br />
South Port and regional stakeholders continue to interact with the<br />
oil and gas exploration companies and remain optimistic about<br />
the energy potential available in GSB.<br />
Whilst there are no assurances that South Port will secure future oil<br />
and gas industry activity, it is useful to restate several advantages<br />
that Bluff is able to provide over its competitors when it comes to<br />
meeting the requirements of an exploration base:<br />
• Bluff was selected as the base for previous GSB exploration<br />
• South Port can offer extensive lay down storage areas directly<br />
on the Port<br />
• Refuelling support vessels and the provision of diesel supplies<br />
for rig operations are more easily accessible than other ports<br />
(note support vessels normally require 7 – 8 metres draft which<br />
can be comfortably provided at Bluff Port)<br />
• A wide selection of dedicated service berths are available<br />
• South Port has established expertise handling project and<br />
break-bulk cargoes<br />
• The Southland region has a more extensive engineering<br />
resource as a result of companies servicing the NZAS aluminium<br />
smelter and the meat processing, dairy and forestry industries<br />
over several decades<br />
Vessel “Super Challenge” discharging stock<br />
food via hopper to road transport<br />
Products recording substantial volume<br />
increases included petroleum, stock<br />
‘‘food, sawn timber and wood chips”<br />
10
outflows of wood chip product<br />
and higher sawn timber tonnages<br />
‘‘Strong<br />
offset the log volume decrease...”<br />
Wood chip stockpile with vessel “New Oji Pioneer”<br />
loading chips via a ship loader in background<br />
• Local government in the region also has a reputation of being<br />
willing to try harder to address the needs of new commercial<br />
ventures while still meeting the requirements of their local<br />
stakeholders.<br />
Shareholders need to also be aware that should oil & gas industry<br />
participants choose to undertake exploration drilling in the<br />
GSB, the choice of an exploration supply/support base will be<br />
significantly influenced by the ultimate location of the exploratory<br />
wells.<br />
Development of Southland’s Lignite Resource – Solid Energy<br />
through direct land ownership and option agreements has access<br />
to approximately 1.4 billion tonnes of lignite in Eastern Southland.<br />
It has conveyed its long term intention to develop this resource by<br />
listing potential future options under a “Staircase of Opportunity”<br />
framework. This term describes the planned investment over<br />
time in progressively more capital intensive processes which will<br />
convert the low grade lignite material into more valuable end<br />
products such as briquettes and urea fertiliser.<br />
This development journey has begun with the construction of a<br />
briquette conversion plant at Mataura in Eastern Southland. Having<br />
commenced operation in August 2012, the $25 million briquette<br />
plant is expected to produce 90,000 tonnes of higher grade fuel<br />
units using approximately 150,000 tonnes of lignite as raw material.<br />
During the past 12 months the Solid Energy Board has also<br />
committed funding for a full feasibililty study into the potential<br />
area for converting lignite into urea. This comprehensive study will<br />
cover off such areas as; most suitable technology, potential sites,<br />
visual/noise impact, heritage & cultural effect, air/water, transport,<br />
electricity needs, geo-tech, construction requirements, capital<br />
raising opportunities and overall project viability.<br />
Solid Energy has gone to some lengths to highlight to stakeholders<br />
that it will take full responsibility for greenhouse gas emissions<br />
associated with its lignite related projects including the full cost of<br />
carbon. Solid Energy plans to meet its carbon obligations through<br />
a range of approaches and technologies including processes to<br />
reduce production emissions, offsetting emissions by planting<br />
trees and purchasing carbon credits.<br />
L&M Energy – This operator continues to advance its Coal Seam<br />
Gas project in Western Southland as well as evaluating other<br />
energy-related developments. If the reserves are viable, Coal<br />
Seam Gas could be redirected to commercial users, converted<br />
into transport fuels or used to generate electricity. In addition<br />
L&M Energy is assessing whether Shale Gas reserves exist in<br />
commercial quantities in the Waiau Basin (Western Southland).<br />
Based on available data, compiled by L&M Energy over a period<br />
of time, the Waiau Basin shales compare very favourably to the<br />
best USA shale gas plays.<br />
Wind-Farm Project Timing – Previous shareholder communications<br />
have outlined that there are three regional wind-farm projects<br />
currently in the planning stage.<br />
• A smaller scale 8MW project has been earmarked for Flat Hill<br />
near Bluff by Energy 3. This development has been appealed<br />
to the Environmental Court on the grounds that the cultural<br />
heritage of the area was not respected.<br />
• TrustPower Ltd has obtained resource consents from the Gore<br />
District Council to build a wind farm at Kaiwera Downs, east of<br />
Gore. The consents allow for the installation of up to 240 MW of<br />
electricity or a maximum of 83 towers. It is expected that should<br />
the project become viable this wind farm would be developed<br />
over a 2 to 3 year period.<br />
11
• Factors impacting viability (and therefore timing) include<br />
exchange rates, wind turbine availability, sector pricing,<br />
potential new industry establishment and electricity demand<br />
in the region. Notwithstanding these influences, Kaiwera Downs<br />
is the only consented renewable energy project of scale in<br />
Southland and will be the first to proceed when conditions are<br />
right.<br />
• Genesis Energy purchased the Slopedown Wind Farm<br />
development from Wind Prospect CWP (NZ). This potential<br />
wind farm site is located in Eastern Southland approximately<br />
50km to the East of Invercargill. Wind Prospect CWP (NZ)<br />
Ltd had been involved in this project for a number of years,<br />
undertaking environmental and technical work required to<br />
lodge the necessary resource consents. Genesis Energy assessed<br />
the work completed to date and aims to progress the project<br />
in the medium term.<br />
Outlook<br />
As we move forward into the 2013 financial year it is apparent that<br />
global markets still face a number of significant challenges. It is<br />
likely that New Zealand will not be immune from the economic<br />
ills that are being suffered by a wide range of countries around<br />
the world. An unhealthy European zone does not bode well for<br />
our key Asian trading partners who rely on Europe to purchase<br />
their manufactured goods.<br />
Further, the USA market still appears to be stuttering with no<br />
upward economic trends evident and China’s superior growth<br />
levels are finally beginning to wane. Monthly indicators suggest<br />
that the slowing in China’s growth may have stabilised. However,<br />
should conditions in USA and Europe deteriorate further, the<br />
Chinese authorities will need to consider other measures if they<br />
are to meet the current 7.5% growth target.<br />
The international trading conditions currently being experienced<br />
will cause certain sectors to be buffeted around while others<br />
will still continue to perform well. For a number of South Port’s<br />
customers it will be a matter of bracing themselves for the bumpy<br />
road that lies ahead. Cost containment and prudent management<br />
will be essential business tools and South Port will be focusing on<br />
these components within its own business.<br />
On the local front commentators’ consistently outline that because<br />
New Zealand’s economic recovery is so closely linked to the global<br />
situation, risks facing business growth lie firmly on the negative<br />
side of the ledger. Whilst New Zealand is better placed than many<br />
other nations, it is likely to be some time before economic growth<br />
returns to stimulatory levels.<br />
Fortunately our country still possesses a number of comparative<br />
advantages which will continue to assist New Zealand to operate<br />
as an active trading nation. Some of these advantages include<br />
water, climate, productive land, food safety, a large exclusive<br />
economic zone, minerals, energy and the brand “NZ Inc.” .<br />
Despite this rather bearish background South Port is optimistic<br />
that a stable level of tax-paid profit can be achieved for the 2013<br />
financial year. As in the past an update of the earnings outlook<br />
will be provided by the Company at the time of releasing its<br />
interim result.<br />
R.T. CHAPMAN<br />
Chairman<br />
M.P. O’CONNOR<br />
Chief Executive<br />
3,000,000<br />
Historic Trade Figures 1922-2012<br />
(tonnes)<br />
2,500,000<br />
2,000,000<br />
2<br />
1,500,000<br />
1<br />
1,000,000<br />
500,000<br />
0<br />
1922 1925 1928 1931 1934 1937 1940 1943 1946 1949 1952 1955 1958 1961 1964 1967 1970 1973 1976 1979 1982 1985 1988 1991 1994 1997 2000 2003 2006 2009 2012<br />
1 – 1993 9 month period due to change in financial year end<br />
2 – 2009 drop in tonnage due to 30% decrease in NZAS throughput attributable to a pot-line outage<br />
12
Directors , from left: Jeremy McClean, Rick Christie, Rex Chapman, Thomas Foggo, Graham Heenan, Philip Cory-Wright<br />
Directors’ Profiles<br />
REX THOMAS CHAPMAN<br />
LLB, Chairman<br />
Mr Chapman is a Senior Litigation and Commercial Partner in<br />
Invercargill Law Firm Cruickshank Pryde.<br />
RICHARD (RICK) GORDON MAXWELL CHRISTIE<br />
MSc (Hons), AFInstD, CRSNZ<br />
Mr Christie is a Company Director based in Wellington. He is currently<br />
a Director and Chairman of a number of public and private<br />
companies. He has also held a number of government appointments<br />
and was a Chief Executive for many years prior to becoming<br />
a professional Director. In 2011 he was made a Companion of the<br />
Royal Society of New Zealand.<br />
PHILIP WADE CORY-WRIGHT<br />
BCA, LLB (Hons)<br />
Mr Cory-Wright is a Company Director and a Strategic Adviser<br />
based in Auckland. He has recently been appointed as one of<br />
the Establishment Board Directors on the new Local Government<br />
Funding Agency established to lower the funding costs<br />
and improve the terms of borrowing for local councils in New<br />
Zealand. He has specialised in infrastructure businesses and recent<br />
roles include being an adviser to Kordia, Solid Energy, Auckland<br />
Airport and ACC.<br />
THOMAS McCUISH FOGGO<br />
Mr Foggo is based in Invercargill and is the Southland Manager for<br />
Sanford. He has held senior management positions and Directorships<br />
in the Seafood Industry for over 36 years and has for the past<br />
17 years been a Director of Live Lobster Southland. He is also a<br />
Government appointed Director of Invercargill Airport.<br />
GRAHAM DOUGLAS HEENAN<br />
BCom, AFInstD, FNZIM<br />
Based in Christchurch, Mr Heenan is Chairman of DB South Island<br />
Brewery, Dairyworks, Abbott Group and Hanmer Springs Thermal<br />
Pools & Spa. He is a Director of Intercity Group and is a past Director<br />
of PrimePort Timaru, Canterbury District Health Board, Hellers and<br />
the TAB. Mr Heenan also acts as a consultant to several companies.<br />
JEREMY JAMES McCLEAN<br />
BCom, CA<br />
Mr McClean is a practising Chartered Accountant in Southland. He<br />
is a principal in Invercargill accounting firm Malloch McClean Ltd,<br />
holds a Public Practice Certificate with the New Zealand Institute of<br />
Chartered Accountants and is a Justice of the Peace. Mr McClean<br />
has provided business advice to a number of Southland rural and<br />
urban businesses for more than 30 years.<br />
13
Statutory <strong>Report</strong> of Directors<br />
The Directors have pleasure in submitting their 2012 <strong>Report</strong> and<br />
Financial Statements.<br />
Principal activities<br />
The Company is primarily engaged in the commercial operation<br />
of the Port of Bluff. There has been no significant change in the<br />
nature of the Company’s business during the year.<br />
Accounting period<br />
The financial statements are for the 12 month period from 1 July<br />
2011 to 30 June 2012.<br />
Results<br />
The Company recorded a surplus for the period of $5,989,000.<br />
Disclosure of share dealing by directors<br />
Directors acquired no additional equity securities in the Company<br />
since the date of the last <strong>Annual</strong> Meeting.<br />
Dividend<br />
The Directors have declared an ordinary dividend of $5,772,000<br />
for the period ended 30 June 2012 including the final dividend<br />
amount of $4,329,000 payable in November 2012.<br />
Directors and officers liability insurance<br />
The Company has arranged directors and officers’ liability<br />
insurance with Vero Liability Insurance Ltd. This cover insures<br />
Directors against liabilities to other parties that may arise from<br />
their positions as Directors. The insurance does not cover liabilities<br />
arising from criminal actions.<br />
Remuneration of directors<br />
Directors’ remuneration for the 12 month period ended 30 June<br />
2012 was as follows:<br />
J.A. Harrington* (resigned September 2011) $36,750<br />
R.T. Chapman $50,400<br />
R.G.M. Christie $29,000<br />
P.W. Cory-Wright $29,000<br />
T.M. Foggo $29,000<br />
G.D. Heenan $29,000<br />
J.J. McClean (appointed September 2011) $21,750<br />
*Includes retiring allowance<br />
No other benefits have been provided by the Company to a<br />
Director or in any other capacity. No loans have been made by<br />
the Company to a Director nor has the Company guaranteed any<br />
debts incurred by a Director.<br />
Directors’ shareholding<br />
There is currently no beneficial shareholding held by Directors.<br />
Remuneration of employees<br />
Section 211(1)(g) of the New Zealand Companies Act 1993<br />
requires disclosure of remuneration and other benefits, including<br />
redundancy and other payments made on termination of<br />
employment, in excess of $100,000 per year, paid in respect of<br />
the current year by the Company to any employees who are not<br />
Directors of the Company.<br />
Remuneration<br />
Number of<br />
Employees<br />
$110,001 - $120,000 2<br />
$120,001 - $130,000 1<br />
$130,001 - $140,000 1<br />
$160,001 - $170,000 1<br />
$170,001 - $180,000 1<br />
$180,001 - $190,000 1<br />
$200,001 - $210,000 3<br />
$270,001 - $280,000 1<br />
The Chief Executive Officer’s employment contract is reviewed<br />
annually by the Board. It is not a fixed term contract.<br />
The remuneration of senior management is reviewed annually and<br />
is determined in a transparent, deliberate and objective manner.<br />
Accounting policies<br />
There were no changes in accounting policies during the period.<br />
All policies are consistent with those applied in the previous year.<br />
Audit & RISK committee<br />
The Company has a formally constituted Audit & Risk Committee<br />
comprising Messrs G.D. Heenan (Chairman), R.T. Chapman and<br />
J.J. McClean.<br />
It is the role of the Audit & Risk Committee to review the Company’s<br />
financial statements and announcements, liaise directly with<br />
the Company’s Auditors and review the Company’s accounting<br />
policies, practices, risk managment and related matters.<br />
Auditor’s remuneration<br />
During the year $33,572 was paid to the Company’s Auditors,<br />
WHK, for audit services carried out as agent for the Controller and<br />
Auditor-General. The Company did not pay the Auditors for any<br />
advice or guidance on other matters.<br />
Interest register<br />
The Company maintains an Interest Register in which particulars<br />
of certain transactions and matters involving the Directors<br />
are recorded. Entries in the Interests Register must in turn be<br />
disclosed in the <strong>Annual</strong> <strong>Report</strong>. No material transaction entries<br />
were recorded in the Interests Register for the period 1 July 2011<br />
to 30 June 2012.<br />
USE OF COMPANY INFORMATION<br />
During the year the Board received no notices from Directors of<br />
the Company information received in their capacity as Directors<br />
which would not otherwise have been available to them.<br />
Notice and pause provisions<br />
The Company has adopted “notice and pause” provisions in its<br />
Constitution.<br />
14
Disclosure of interest<br />
Pursuant to Section 140 of the Companies Act 1993, Directors<br />
have disclosed interests in the following entities with which<br />
the Company conducts or may conduct business from time<br />
to time:<br />
Mr R.T. Chapman<br />
Position<br />
J. Crooks & Sons Ltd Solicitor<br />
Forklifts NZ Ltd<br />
Solicitor<br />
Prime Range Meats Ltd<br />
Solicitor<br />
Southland Veneers Ltd<br />
Solicitor<br />
Transport Rentals Ltd<br />
Solicitor<br />
Winton Stock Feed Ltd<br />
Solicitor<br />
Mr R.G.M. Christie<br />
Solnet Solutions Ltd<br />
Director<br />
Ultimate Goal<br />
“South Port New Zealand Limited<br />
will be the best distribution cost<br />
option for all Southern region<br />
importers and exporters through<br />
the delivery of innovative solutions.”<br />
Mr P.W. Cory-Wright<br />
Local Government Funding Agency<br />
Mr T.M. Foggo<br />
Barnes Oysters Ltd<br />
Bluff Oyster Management Co. Ltd<br />
Invercargill Airport Ltd<br />
Live Lobster Southland 1995 Ltd<br />
Sanford Ltd<br />
Mr G.D. Heenan<br />
InterCity Group Ltd<br />
Mr J.J. McClean<br />
R.T. CHAPMAN<br />
Chairman of Directors<br />
Director<br />
Director<br />
Director<br />
Director<br />
Director<br />
Branch Manager<br />
Director<br />
Nil<br />
Key Objectives<br />
• To increase customer usage of South Port and<br />
improve customer satisfaction.<br />
• To make the best use of South Port’s resources<br />
and develop the assets of Bluff Harbour.<br />
• To improve returns to shareholders and create<br />
positive value.<br />
• To achieve differentiation in the market and gain<br />
competitive advantage over other operators in<br />
the transport sector.<br />
• To assist the establishment of new industry<br />
and the growth of existing businesses in the<br />
southern region.<br />
G.D. HEENAN<br />
Director<br />
Dated 23 August 2012<br />
15
Statutory Disclosure in Relation to Shareholders<br />
as at 30 JUNE 2012<br />
SIZE OF HOLDING<br />
Size of Number of Ordinary Percent<br />
Holding Shareholders Shareholding Holders<br />
1 - 1,000 248 181,361 .69<br />
1,001 - 5,000 372 1,062,599 4.05<br />
5,001 - 10,000 79 624,335 2.38<br />
10,001 - 100,000 59 1,451,322 5.53<br />
100,001 and over 8 22,915,281 87.35<br />
Total Number of Shareholders: 766 26,234,898 100.00<br />
PRICES FOR SHARES TRADED DURING THIS YEAR<br />
AS AT 30 JUNE 2012 High Low<br />
$3.05 $3.60 $3.01<br />
TOP TWENTY ORDINARY SHAREHOLDINGS<br />
Shareholder Holding Percent<br />
Southland Regional Council (Environment Southland) 17,441,573 66.48<br />
National Nominees New Zealand Ltd 1,340,925 5.11<br />
Russell John Field & Anthony James Palmer 1,334,731 5.09<br />
K & M Douglas Trust 1,021,684 3.89<br />
Douglas Family Trust 516,787 1.97<br />
Douglas Irrevocable Descendents Trust 506,192 1.93<br />
MA Janssen Ltd 381,403 1.45<br />
JPMorgan Chase Bank N.A. 205,050 .78<br />
Daniel Martin Noonan 175,364 .67<br />
Kenneth Ritchie Anderson 77,184 .29<br />
Pauline Ann Stapel & Stephen Thomas McKee 70,881 .27<br />
Glenn Owen Johnston 60,000 .23<br />
Howard Cedric Zingel 56,778 .22<br />
Lynn Landmark Zingel 56,778 .22<br />
Custodial Services Ltd 56,000 .21<br />
Herbert Charles Wilson 54,000 .21<br />
David Grindell 50,000 .19<br />
Tarewai Fishing Co. Ltd 47,656 .18<br />
Ian Gerald Arnot 43,978 .17<br />
Henry James Williams 37,685 .14<br />
SUBSTANTIAL SECURITY HOLDERS<br />
As at 30 June 2012 the following persons have given notice (in terms of the Securities Markets Act 1988) that they are substantial security holders<br />
in South Port New Zealand Limited. The number of shares shown is at the date of the last advice received from the substantial security holders.<br />
Holder No. of Shares % of Issued Capital Date of Notice<br />
Southland Regional Council 17,441,573 66.48 20 October 2000<br />
K & M Douglas Trust, Douglas Family Trust,<br />
Douglas Irrevocable Descendents Trust 2,044,663 7.79 24 December 2009<br />
Russell John Field & Anthony James Palmer 1,334,731 5.09 28 October 2010<br />
16
Corporate Governance<br />
The Board of South Port New Zealand Limited is committed to<br />
ensuring that the Company adheres to best practice governance<br />
principles and maintains the highest ethical standards. The Board<br />
believes that good governance is based on a set of principles and<br />
behaviours that provide a clear basis for the Company’s everyday<br />
activities to ensure transparency, fairness and recognition of the<br />
interests of South Port’s stakeholders.<br />
Following a review of its governance practices the Board adopted<br />
a Code of Corporate Governance which is available at www.<br />
southport.co.nz. The Code has been developed after considering<br />
contemporary best practice and principles contained in the New<br />
Zealand Stock Exchange Corporate Governance Best Practice<br />
Code issued in October 2003 and the Port Companies Act 1988.<br />
Code of Ethics<br />
The Company expects its employees and Directors to maintain<br />
high ethical standards. A Code of Ethics has been adopted as<br />
part of the corporate governance framework and is monitored<br />
by the Board. The Company’s Code of Ethics has been published<br />
and made available to all Directors and staff. This key corporate<br />
governance document is available on the Company’s website<br />
(www.southport.co.nz).<br />
The Code of Ethics addresses, amongst other things:<br />
• conflicts of interest;<br />
• receipt of gifts;<br />
• corporate opportunities;<br />
• confidentiality;<br />
• expected behaviours;<br />
• delegated authority;<br />
• director responsibilities; and<br />
• reporting issues regarding breaches of the Code of Ethics,<br />
legal obligations and other policies of the Company.<br />
The South Port Board and management are not aware of any<br />
breaches of the Code of Ethics during the period.<br />
Responsibilities of the Board<br />
The business and affairs of the Company are managed under<br />
the direction of the Board of Directors. The South Port Board is<br />
collectively accountable to shareholders for the performance<br />
of the Company. Directors, in carrying out their responsibilities,<br />
undertake to act in the best interests of the Company, its<br />
shareholders and its other stakeholders in accordance with<br />
applicable law.<br />
Key responsibilities of the Board include:<br />
• to review and approve the strategic, business and financial<br />
plans prepared by management and to develop a depth of<br />
knowledge of the Company’s business so as to understand and<br />
question the assumptions upon which such plans are based;<br />
• to monitor the Company’s performance against its approved<br />
strategic, business and financial plans;<br />
• to review the Company’s Code of Ethics from time to time;<br />
• to select and appoint (and, if appropriate, remove from office)<br />
the Chief Executive, determine his/her conditions of service and<br />
monitor his/her performance against established objectives;<br />
• to review the Company’s remuneration policy at least annually;<br />
and<br />
• to monitor South Port’s regulatory and legislative compliance<br />
and risk management processes.<br />
The Board delegates management of the day-to-day affairs and<br />
management responsibilities of the Company to achieve the<br />
strategic direction and goals determined by the Board.<br />
Board Composition<br />
At present, there are six Independent non-executive Directors on<br />
the Board including a non-executive Chairman. The biography of<br />
each Board member is set out in the “Directors’ Profiles” section<br />
of this annual report.<br />
The size and composition of the Board is subject to the limits<br />
imposed by South Port’s constitution and in accordance with<br />
the provisions of the Port Companies Act 1988. The constitution<br />
requires the Board to comprise of a minimum number of six<br />
Directors. Under the <strong>NZX</strong> Listing Rules the Board is required to<br />
maintain at least two Independent Directors.<br />
The criteria for Director Independence is outlined in the Company’s<br />
Corporate Governance Code which can be found on the<br />
Company’s website (www.southport.co.nz).<br />
Pursuant to the Company’s Constitution, one third of the Directors<br />
retire by rotation at each <strong>Annual</strong> Meeting, but are eligible for<br />
reappointment by shareholders.<br />
The Board conducts regular performance reviews to consider the<br />
appropriate mix of skills required by the Board to maximise its<br />
effectiveness and its contribution to the Company.<br />
Audit & RISK Committee<br />
The Audit & Risk Committee provides the Board with assistance<br />
in fulfilling their responsibilities to shareholders, the investment<br />
community and others for overseeing the Company’s financial<br />
statements, financial reporting processes, internal accounting<br />
systems, financial controls and South Port’s relationship with its<br />
independent auditors.<br />
The Committee is governed by an Audit & Risk Committee<br />
Charter adopted by the Board in August 2004 which is<br />
available on the Company’s website (www.southport.co.nz)<br />
as an Appendix to the Corporate Governance Code. The<br />
Board regularly reviews the performance of the Committee in<br />
accordance with the Charter.<br />
The Audit & RIsk Committee Charter includes an external audit<br />
policy to ensure there are processes in place to satisfy the Board<br />
as to the quality and independence of the external auditors.<br />
The Committee comprises of three independent non-executive<br />
members of the Board of Directors.<br />
The Committee Chairman, also appointed by the Board, cannot<br />
also be the Chairman of the Company. Graham Heenan is the<br />
Audit & Risk Committee Chairman. At least one member of the<br />
Committee must have an accounting or financial background;<br />
both Graham Heenan and Jeremy McClean are or have been<br />
members of the New Zealand Institute of Chartered Accountants.<br />
17
Corporate Governance continued...<br />
Directors’ Attendance at Meetings – 1 July 2011 to 30 June 2012<br />
Total Meetings 1 9 2<br />
R.T. Chapman 1 9 2<br />
R.G.M. Christie 1 8 –<br />
P.W. Cory-Wright 1 9 –<br />
T.M. Foggo – 8 –<br />
J.A. Harrington* 1 1 1<br />
G.D. Heenan 1 9 2<br />
J.J. McClean** 1 7 1<br />
* J.A. Harrington resigned 27 September 2011<br />
** J.J. McClean appointed 27 September 2011<br />
Risk Management<br />
Effective management of all types of risk (financial and nonfinancial)<br />
is a fundamental part of the Company’s business strategy.<br />
The Audit & Risk Committee is responsible for overseeing risk<br />
management practices and works closely with Management,<br />
external advisors and the Company’s auditors to ensure that risk<br />
management issues are properly identified and addressed.<br />
The Company has a separate Risk Management Committee<br />
which meets annually to review changes to the risk profile of<br />
the business and to consider ways of mitigating additional<br />
risks identified. A Director currently sitting on the Audit & Risk<br />
Committee is appointed to the Risk Management Committee as<br />
a Board representative.<br />
Continuous Disclosure<br />
<strong>Annual</strong><br />
Meeting<br />
Board<br />
Meeting<br />
Audit & Risk<br />
Committee<br />
In accordance with the <strong>NZX</strong> Listing Rules, the Company is required<br />
to disclose to the market matters which could be expected to have<br />
a material effect on the price or value of the Company’s shares.<br />
Management processes are in place to ensure that all material<br />
matters which may require disclosure are promptly reported to<br />
the Board through established reporting lines. Matters reported<br />
are assessed as and when required by the <strong>NZX</strong> Listing Rules,<br />
advised to the market. The Chairman and Chief Executive are<br />
responsible for communications with <strong>NZX</strong> and for ensuring that<br />
such information is not provided to any person or organisation<br />
until <strong>NZX</strong> has confirmed its release to the market.<br />
All material announcements are posted on the Company’s website<br />
www.southport.co.nz.<br />
• Provides a website which contains media releases, current and<br />
past annual reports, dividend histories, notices of meeting and<br />
other information about the Company,<br />
• Makes available printed half year and annual reports and<br />
encourages shareholders to access these documents on the<br />
website and to receive advice of their availability by email,<br />
• Publishes press releases on issues/events that may have material<br />
information content that could impact on the price of its traded<br />
securities,<br />
• Issues additional explanatory memoranda where circumstances<br />
require, such as explanations of dividend changes and other<br />
explanatory memoranda as may be required by law,<br />
• Maintains regular contact with leading analysts and brokers<br />
who monitor the Company’s activities.<br />
Shareholder meetings are generally held at the Company’s place<br />
of business (Bluff ) at a time which best ensures full participation<br />
by shareholders.<br />
Full participation of shareholders at the <strong>Annual</strong> Meeting is<br />
encouraged to ensure a high level of accountability and<br />
identification with the Company’s strategies and goals.<br />
Shareholders have the opportunity to submit questions prior to<br />
each meeting and senior management and auditors are present<br />
to assist in answering any specific queries raised. There is also<br />
an opportunity for informal discussion with directors and senior<br />
management for a period after the meeting concludes.<br />
Senior Management Remuneration<br />
The Board is responsible for reviewing the remuneration of the<br />
Company’s senior management in consultation with the Chief<br />
Executive of the Company.<br />
The remuneration packages of senior management consist<br />
of a mixture of a base remuneration package and a variable<br />
remuneration component based on relevant performance<br />
measures.<br />
The remuneration policy for senior management is designed<br />
to attract, motivate and retain high quality employees who<br />
will enable the Company to achieve its short and long term<br />
objectives.<br />
A general and wider disclosure of senior management and other<br />
staff remuneration is included in the “Employee Remuneration”<br />
section set-out in the Statutory Information section of this <strong>Annual</strong><br />
<strong>Report</strong>, where the Company has disclosed in various escalating<br />
remuneration bands the number of employees and former<br />
employees whose remuneration, including benefits, exceeds<br />
$100,000.<br />
Shareholder Communication<br />
South Port seeks to ensure its shareholders are appropriately<br />
informed on its operations and results, with the delivery of timely<br />
and focused communication, and the holding of shareholder<br />
meetings in a manner conducive to achieving shareholder<br />
participation.<br />
To ensure shareholders have access to relevant information the<br />
Company:<br />
Board of Directors Remuneration<br />
According to the Company’s remuneration policy, directors should<br />
receive remuneration that is fair and reasonable in a competitive<br />
market for the skills, knowledge and experience required by the<br />
Company.<br />
Further detail can be found in the remuneration policy included<br />
in the Company’s Corporate Governance Code.<br />
18
Health & Safety and Environment<br />
Health & Safety<br />
Often ‘safety’ becomes the key focus for many companies and<br />
sometimes ‘health’ ends up receiving less attention. This past year<br />
South Port has put a significant emphasis on a number of wellness<br />
initiatives to help employees with their overall health. These have<br />
included staff receiving the opportunity to get individual advice<br />
on nutrition and fitness from a personal trainer, a weight loss<br />
competition (with the winner receiving a mystery escape weekend<br />
for 2), and subsidised entry to the ‘Global Corporate Challenge’<br />
which was a team based initiative. The Company gym also received<br />
an upgrade with new equipment purchases including a treadmill,<br />
elliptical cross trainer, and body analysis scales.<br />
The achievement of Tertiary level WSMP accreditation during<br />
the year was another indicator of the improving safety culture<br />
developing at South Port with the highest level under this scheme<br />
being achieved. The extension of our drug and alcohol testing<br />
system to include both random and pre-employment testing<br />
for all staff including casuals occurred throughout the year with<br />
results giving a very favourable 99% clearance rate.<br />
Traffic management improvements included the completion of<br />
the container yard fencing and gates, opening up of the roadway<br />
from Berth 8 to the ring road, and repainting of road markings.<br />
Improved walkways have also been added to assist with pedestrian<br />
safety.<br />
A continued focus on reducing hazards has resulted in no serious<br />
harm injuries to South Port employees over the 12 month period.<br />
The Lost Time Injury Frequency Rate (LTIFR) fell to a low of 1.3<br />
injuries in September 2011 but has since increased to finish the<br />
year at 3.37 injuries per 100,000 work hours. The previous year the<br />
LTIFR fell to a low of 2.14 and peaked at over 5 injuries per 100,000<br />
hours. Employees needing to visit the medical centre to have their<br />
eyes flushed due to dust intrusions were the most common injury<br />
throughout the year. In response to this, an additional requirement<br />
to wear safety glasses has been put in place for affected areas.<br />
Environment<br />
South Port continues to make a sustained effort to improve the<br />
practices of all port users and to help minimise the impact of<br />
operations on the environment. The on-going upgrade of the site<br />
code of practice and increased awareness of site users through<br />
higher levels of internal monitoring has seen improvements in<br />
many on-site processes.<br />
Initiatives such as the screening and re-use of fill extracted from the<br />
container yard upgrade and the safe disposal of 158 kgs of ozone<br />
depleting Halon gas sent to Australia are just a couple of notable<br />
examples of South Port minimising our environmental footprint.<br />
Unfortunately there were two minor oil spills in the marine<br />
environment reported during the year. Both incidents involved<br />
less than 20 litres of fuel and were promptly cleaned up to ensure<br />
minimal impact on the environment.<br />
During the next financial year South Port is engaging a<br />
specialist to conduct an energy audit which will ensure<br />
electricity & fuel resources are utilised efficiently. Additional<br />
monitoring of storm water run-off will also commence to<br />
ensure any potential contaminants are being trapped and<br />
dealt with appropriately.<br />
Throughout the year the Company’s operations were undertaken<br />
in accordance with all existing resource consents. <strong>Annual</strong><br />
analysis of the harbour dredge spoil continues to indicate that<br />
sediment quality is significantly below consented guidelines.<br />
South Port’s primary environmental responsibilities are subject<br />
to two different planning instruments; the Invercargill District<br />
Plan administered by the Invercargill City Council and the<br />
Regional Coastal Plan for Southland which is administered by<br />
Environment Southland.<br />
Lost Time Injury Frequency Rate<br />
(injuries per 100,000 work hours – 12 month rolling)<br />
5.5<br />
5<br />
per 100,000<br />
4.5<br />
4<br />
3.5<br />
3<br />
2.5<br />
2<br />
1.5<br />
1<br />
0.5<br />
0<br />
Jul11 Aug11 Sep11 Oct11 Nov11 Dec11 Jan12 Feb12 Mar12 Apr12 May12 Jun12<br />
Jul10 Aug10 Sep10 Oct10 Nov10 Dec10 Jan11 Feb11 Mar11 Apr11 May11 Jun11<br />
19
Mediterranean Shipping Company –<br />
Busan<br />
Jubail<br />
Dammam<br />
Jebel Ali<br />
Qingdao<br />
Shanghai<br />
Ningbo<br />
Yantian<br />
Hong Kong<br />
Kaohsiung<br />
Singapore<br />
Jakarta<br />
Port Louis<br />
Durban<br />
Coega<br />
Fremantle<br />
CAPRICORN<br />
service overview<br />
Bluff–Port Chalmers–Lyttelton–Wellington–Napier–Tauranga–Brisbane–Singapore–Jakarta–Fremantle–<br />
Adelaide–Melbourne–Sydney–Bluff<br />
CHEETAH<br />
Singapore–Port Louis–Durban–Coega<br />
FALCON<br />
Sydney–Melbourne–Adelaide–Fremantle–Singapore–Jebel Ali–Damman–Jubail<br />
kiwi<br />
Sydney–Melbourne–Nelson–Auckland–Tauranga–Lyttelton–Wellington–New Plymouth–Sydney<br />
NOUMEA<br />
Tauranga–Sydney–Brisbane–Noumea–Tauranga<br />
OCEANIA EXPRESS LOOP 1: Melbourne–Sydney–Tauranga–Oakland–Los Angeles–Auckland–Melbourne<br />
OCEANIA EXPRESS LOOP 2: Sydney–Melbourne–Port Chalmers–Napier–Tauranga–Auckland–Cristobal–Philadelphia–<br />
Charleston–Balboa–Auckland<br />
PANDA<br />
Melbourne–Sydney–Brisbane–Kaohsiung–Yantian–Hong Kong–Melbourne<br />
wallaby<br />
Fremantle–Melbourne–Sydney–Brisbane–Yokohama–Osaka–Busan–Qingdao–Shanghai–Ningbo–Fremantle<br />
20
Weekly Container Line Servicing Bluff<br />
Osaka<br />
Yokohama<br />
Oakland<br />
Los Angeles<br />
Charleston<br />
Philadelphia<br />
Trans-shipment<br />
to Europe<br />
Balboa<br />
Cristobal<br />
Trans-shipment<br />
to South America<br />
East Coast<br />
Trans-shipment<br />
to South America<br />
West Coast<br />
Noumea<br />
Brisbane<br />
Adelaide<br />
Sydney<br />
Melbourne<br />
Auckland<br />
New<br />
Tauranga<br />
Plymouth<br />
Napier<br />
Nelson<br />
Wellington<br />
Lyttelton<br />
Port Chalmers<br />
Bluff<br />
21
‘‘<br />
Cargo volumes<br />
have steadily<br />
grown over the<br />
past 3½ years<br />
I have worked at<br />
South Port ”<br />
Donna’s role as Finance<br />
Assistant involves<br />
completing monthly<br />
invoices and compiling<br />
trade and vessel statistics<br />
for the Port.<br />
Donna Goodman Finance Assistant<br />
Focus o<br />
‘‘<br />
In the last<br />
four seasons<br />
I have noticed a<br />
steady increase in<br />
production from<br />
Open Country<br />
Dairy ”<br />
Alastair works in the<br />
Open Country Dairy<br />
shed packing export milk<br />
powder containers and<br />
assisting with the receipt<br />
and marshalling of product<br />
from the customer’s<br />
Awarua Plant.<br />
Alastair McKerchar Warehouse Cargo Operator<br />
22
‘‘<br />
The Port’s new<br />
Liebherr LHM 400<br />
harbour crane has<br />
been an excellent<br />
investment.<br />
Container exchange<br />
rates have increased<br />
and the new model<br />
is great to operate ”<br />
Tyson Irwin R&D Cargo Operator<br />
Tyson is one of six mobile<br />
harbour crane operators.<br />
He also drives one of the<br />
container forklifts in the<br />
depot and assists with any<br />
general work within the<br />
terminal as required.<br />
n STAFF<br />
‘‘<br />
Night and<br />
day, a touch of<br />
wind and a bit of<br />
tide, pilotage<br />
completed safely,<br />
well done guys ”<br />
Bruce’s role is involved in<br />
the operation and daily<br />
maintenance of the Port’s<br />
two Voith Schnieder tugs.<br />
Bruce Jones Tug Bosun<br />
23
South Port<br />
cold store division<br />
has the coolest<br />
people working<br />
‘‘on the Port ”<br />
Kevin’s responsibilities<br />
include supervising labour<br />
within the cold store facility<br />
and ensuring records<br />
are created and retained<br />
for the various types of<br />
products stored at the Port.<br />
Kevin Flutey Cold Store Foreman<br />
Focus o<br />
‘‘<br />
My role in the<br />
R&D office involves<br />
communicating with<br />
customers, MSC,<br />
truck drivers, toplifter<br />
drivers and the<br />
other departments<br />
within South Port ”<br />
An integral part of<br />
Graham’s job is to provide<br />
administration support<br />
within the container<br />
terminal area.<br />
Graham Brown Receiving & Delivery Administrator<br />
24
‘‘<br />
I have worked on the<br />
Port for over 30 years<br />
and it’s the people<br />
I work with and the<br />
contractors I deal with<br />
that makes this job<br />
special. However that<br />
has not prevented me<br />
from getting the odd<br />
grey hair ”<br />
Blair Cousins Port Services Engineer<br />
Blair has worked as the<br />
Port Services Engineer<br />
since the early 90’s and<br />
his job involves general<br />
maintenance and<br />
supervision of capital<br />
projects on the Island<br />
Harbour.<br />
n STAFF<br />
‘‘<br />
Packing<br />
and devanning<br />
(unloading)<br />
containers onsite<br />
can benefit local<br />
importers and<br />
exporters ”<br />
Paul’s primary role is<br />
devanning imported<br />
containers off the weekly<br />
MSC Capricorn Service<br />
and packing aluminium,<br />
pebbles and timber for<br />
export markets.<br />
Paul Taylor Warehouse Cargo Operator<br />
25
Port<br />
Infrastructure<br />
1 Island Harbour<br />
comprises 40 ha, 10 shipping berths<br />
2 Tiwai Wharf<br />
owned by South Port and leased under a<br />
licence agreement to New Zealand Aluminum<br />
Smelters Ltd (NZAS)<br />
3 Vacant Land for Development<br />
available for future growth<br />
4 Town Wharf<br />
petroleum product discharge, bunkering<br />
5 Fishing Boat Piers<br />
72 inshore fishing boat berths<br />
6 R&D Office<br />
7 Administration Building<br />
8 Log Storage<br />
9 Cold Stores Complex<br />
39,500m 3 of storage capacity<br />
in 3 cold/cool stores<br />
10 Wood Chip Stockpile<br />
11 Syncrolift Dry Docking for Vessels<br />
boat construction and repair facility<br />
12 Mobile Harbour Crane<br />
Liebherr LHM 400<br />
(heavy lift capacity 100 tonnes)<br />
Dry Warehouses:<br />
11<br />
10<br />
9<br />
8<br />
9<br />
13 No.1 — 2,000m 2 Sanford Bluff<br />
14 No.2 — 1,400m 2 Cement/stock food<br />
storage<br />
8<br />
18<br />
15 No.3 — 3,300m 2 Packing and<br />
devanning store<br />
16 No.3A — 4,500m 2 Open Country Dairy<br />
product storage<br />
17 No.3B — 3,300m 2 Open Country Dairy<br />
product storage<br />
3<br />
18 No.4 — 5,900m 2 RD1 stockfood and<br />
Fonterra dairy storage<br />
19 No.5 — 5,500m 2 Fonterra product<br />
storage<br />
20 No.6 — 1,500m 2 Wilbur-Ellis (NZ)<br />
21 Dedicated Container Servicing Pad<br />
22 Bulk Storage Facilities –<br />
storing caustic soda, sulphuric acid, molasses<br />
and tallow<br />
23 Rail Marshalling Yard<br />
24 Island Harbour Access Bridge<br />
25 Entrance Channel<br />
26
2<br />
25<br />
4<br />
15<br />
17<br />
14<br />
13<br />
5<br />
3<br />
19<br />
20<br />
12<br />
16<br />
21<br />
7<br />
22<br />
22<br />
6<br />
1<br />
24<br />
23<br />
3<br />
27
INDEPENDENT AUDITOR'S REPORT<br />
TO THE READERS OF SOUTH PORT NEW ZEALAND LIMITED AND GROUP’S<br />
FINANCIAL STATEMENTS FOR THE YEAR ENDED 30 JUNE 2012<br />
Private Bag 90106<br />
Invercargill 9840<br />
The Auditor-General is the auditor of South Port New Zealand Limited (the company) and group. The Auditor-General has appointed me, Michael Lee, using<br />
the staff and resources of WHK South NZ, to carry out the audit of the financial statements of the company and group on her behalf.<br />
We have audited the financial statements of the company and group on pages 29 to 49, that comprise the statement of financial position as at 30 June 2012,<br />
the statement of comprehensive income, statement of changes in equity and statement of cash flows for the year ended on that date and the notes to the<br />
financial statements that include accounting policies and other explanatory information.<br />
Opinion on the financial statements<br />
In our opinion the financial statements of the company and group on pages 29 to 49:<br />
– comply with generally accepted accounting practice in New Zealand;<br />
– comply with International Financial <strong>Report</strong>ing Standards; and<br />
– give a true and fair view of the company’s and group’s:<br />
– financial position as at 30 June 2012;<br />
– financial performance, changes in equity and cash flows for the year ended on that date.<br />
Opinion on other legal requirements<br />
In accordance with the Financial <strong>Report</strong>ing Act 1993 we report that, in our opinion, proper accounting records have been kept by the company as far as<br />
appears from an examination of those records.<br />
Our audit was completed on 23rd August 2012. This is the date at which our opinion is expressed.<br />
The basis of our opinion is explained below. In addition, we outline the responsibilities of the Board of Directors and our responsibilities, and explain our<br />
independence.<br />
Basis of opinion<br />
We carried out our audit in accordance with the Auditor-General’s Auditing Standards, which incorporate the International Standards on Auditing (New<br />
Zealand). Those standards require that we comply with ethical requirements and plan and carry out our audit to obtain reasonable assurance about whether<br />
the financial statements are free from material misstatement.<br />
Material misstatements are differences or omissions of amounts and disclosures that would affect a reader’s overall understanding of the financial statements.<br />
If we had found material misstatements that were not corrected, we would have referred to them in our opinion.<br />
An audit involves carrying out procedures to obtain audit evidence about the amounts and disclosures in the financial statements. The procedures selected<br />
depend on our judgement, including our assessment of risks of material misstatement of the financial statements whether due to fraud or error. In making<br />
those risk assessments, we consider internal control relevant to the preparation of the company and group’s financial statements that give a true and fair view<br />
of the matters to which they relate. We consider internal control in order to design audit procedures that are appropriate in the circumstances but not for the<br />
purpose of expressing an opinion on the effectiveness of the company and group’s internal control.<br />
An audit also involves evaluating:<br />
– the appropriateness of accounting policies used and whether they have been consistently applied;<br />
– the reasonableness of the significant accounting estimates and judgements made by the Board of Directors;<br />
– the adequacy of all disclosures in the financial statements; and<br />
– the overall presentation of the financial statements.<br />
We did not examine every transaction, nor do we guarantee complete accuracy of the financial statements. In accordance with the Financial <strong>Report</strong>ing Act<br />
1993, we report that we have obtained all the information and explanations we have required. We believe we have obtained sufficient and appropriate audit<br />
evidence to provide a basis for our audit opinion.<br />
Responsibilities of the Board of Directors<br />
The Board of Directors is responsible for preparing financial statements that:<br />
– comply with generally accepted accounting practice in New Zealand; and<br />
– give a true and fair view of the company’s and group’s financial position, financial performance, changes in equity and cash flows.<br />
The Board of Directors is also responsible for such internal control as it determines is necessary to enable the preparation of financial statements that are free<br />
from material misstatement, whether due to fraud or error.<br />
The Board of Directors’ responsibilities arise from the Financial <strong>Report</strong>ing Act 1993 and the Port Companies Act 1988.<br />
Responsibilities of the Auditor<br />
We are responsible for expressing an independent opinion on the financial statements and reporting that opinion to you based on our audit. Our responsibility<br />
arises from section 15 of the Public Audit Act 2001 and section 19 of the Port Companies Act 1988.<br />
Independence<br />
When carrying out the audit, we followed the independence requirements of the Auditor-General, which incorporate the independence requirements of the<br />
New Zealand Institute of Chartered Accountants.<br />
In addition to the audit we have carried out assignments through Janet Copeland Law in the area of employment law services to the value of $3,774 and<br />
through Progressive Consulting Ltd for HR services to the value of $2,476, which are compatible with those independence requirements. Other than the audit<br />
and these assignments, we have no relationship with or interests in the Company or any of its subsidiaries.<br />
Michael Lee<br />
WHK South NZ<br />
On behalf of the Auditor-General<br />
Invercargill, New Zealand<br />
twentyf our<br />
WHK South NZ
Statement of Comprehensive Income<br />
OF SOUTH PORT NEW ZEALAND LIMITED for the year ended 30 JUNE 2012<br />
NOTE Group Company<br />
In Thousands of New Zealand Dollars 2012 2011 2012 2011<br />
Total operating revenues 5 26,038 25,148 26,038 25,148<br />
Total operating expenses 8 (15,325) (14,229) (15,325) (14,229)<br />
Gross profit 10,713 10,919 10,713 10,919<br />
Administrative expenses (2,387) (2,192) (2,387) (2,192)<br />
Operating profit before financing costs 8,326 8,727 8,326 8,727<br />
Financial income 11 80 11 80<br />
Financial expenses (386) (419) (386) (419)<br />
Net financing costs 7 (375) (339) (375) (339)<br />
Other income 6 416 115 416 115<br />
Surplus before income tax 8,367 8,503 8,367 8,503<br />
Income tax (2,378) (2,524) (2,376) (2,523)<br />
Adjustments relating to tax legislation changes — 279 — 279<br />
Total income tax 11 (2,378) (2,245) (2,376) (2,244)<br />
Net surplus after income tax 5,989 6,258 5,991 6,259<br />
Other comprehensive income<br />
Net change in fair value of available-for-sale investments 13 3 4 3 4<br />
Income tax — — — —<br />
Total other comprehensive surplus/(loss) after income tax 3 4 3 4<br />
Total comprehensive surplus/(loss) after income tax 5,992 6,262 5,994 6,263<br />
Basic earnings per share 18 $0.228 $0.239 $0.228 $0.239<br />
Statement of Changes in Equity<br />
OF SOUTH PORT NEW ZEALAND LIMITED for the year ended 30 JUNE 2012<br />
NOTE Group Company<br />
In Thousands of New Zealand Dollars 2012 2011 2012 2011<br />
Profit/(loss) after income tax 5,989 6,258 5,991 6,259<br />
Other comprehensive income/(loss) after income tax 3 4 3 4<br />
Total comprehensive income/(loss) for the period 5,992 6,262 5,994 6,263<br />
Distributions to shareholders 16 (5,247) (4,722) (5,247) (4,722)<br />
Movements in equity for the period 745 1,540 747 1,541<br />
Equity at the beginning of year 28,827 27,287 28,765 27,224<br />
Equity at end of year 16 29,572 28,827 29,512 28,765<br />
29
Statement of Financial Position<br />
OF SOUTH PORT NEW ZEALAND LIMITED AS AT 30 JUNE 2012<br />
NOTE Group Company<br />
In Thousands of New Zealand Dollars 2012 2011 2012 2011<br />
TOTAL EQUITY 16 29,572 28,827 29,512 28,765<br />
NON-CURRENT ASSETS<br />
Property, plant and equipment 12 29,760 30,500 29,760 30,500<br />
Investments 13 22 19 22 19<br />
Total non-current assets 29,782 30,519 29,782 30,519<br />
CURRENT ASSETS<br />
Cash 14 974 380 939 341<br />
Trade and other receivables 15 4,056 3,008 4,056 3,008<br />
Total current assets 5,030 3,388 4,995 3,349<br />
Total assets 34,812 33,907 34,777 33,868<br />
NON-CURRENT LIABILITIES<br />
Employee provisions 20 67 55 42 36<br />
Deferred tax liability 11(d) 303 105 321 121<br />
Other 23 397 378 397 378<br />
Total non-current liabilities 767 538 760 535<br />
CURRENT LIABILITIES<br />
Current borrowings 19 1,200 300 1,200 300<br />
Trade and other payables 22 1,827 2,339 1,923 2,422<br />
Provisions 20 657 755 595 696<br />
Other 23 789 1,148 787 1,150<br />
Total current liabilities 4,473 4,542 4,505 4,568<br />
Total liabilities 5,240 5,080 5,265 5,103<br />
TOTAL NET ASSETS 29,572 28,827 29,512 28,765<br />
Net asset backing per share $1.13 $1.10 $1.12 $1.10<br />
On behalf of the Board<br />
Dated 23 August 2012<br />
Chairman of Directors<br />
Director<br />
The accompanying notes form part of these financial statements<br />
30
Statement of Cash Flows<br />
OF SOUTH PORT NEW ZEALAND LIMITED for the year ended 30 JUNE 2012<br />
Note Group Company<br />
In Thousands of New Zealand Dollars 2012 2011 2012 2011<br />
CASH FLOWS FROM OPERATING ACTIVITIES<br />
Cash was provided by (applied to):<br />
Receipts from customers 24,994 29,077 24,994 29,077<br />
Payments to suppliers and employees (15,374) (13,467) (15,374) (13,467)<br />
Dividends received 1 1 1 1<br />
Interest received 10 39 10 39<br />
Interest paid (339) (334) (339) (334)<br />
Income taxes paid (2,538) (2,614) (2,538) (2,613)<br />
Net goods and services tax paid (33) 104 (29) 96<br />
Net cash flow from operating activities 26 6,721 12,806 6,725 12,799<br />
CASH FLOWS FROM INVESTING ACTIVITIES<br />
Cash was provided by (applied to):<br />
Proceeds from disposal of other investments — — — —<br />
Proceeds from disposal of non-current assets 1,349 124 1,349 124<br />
Acquisition of other non-current assets (3,105) (6,718) (3,105) (6,718)<br />
Foreign Exchange gains/(losses) (24) (156) (24) (156)<br />
Acquisition of shares/investments — — — —<br />
Net cash used in investing activities (1,780) (6,750) (1,780) (6,750)<br />
CASH FLOWS FROM FINANCING ACTIVITIES<br />
Cash was provided by (applied to):<br />
Dividend paid (5,247) (4,722) (5,247) (4,722)<br />
Drawdown/(repayment) of borrowings 900 (1,650) 900 (1,650)<br />
Net cash used in financing activities (4,347) (6,372) (4,347) (6,372)<br />
NET INCREASE (DECREASE) IN CASH HELD 594 (316) 598 (323)<br />
Add cash at beginning of year 380 696 341 664<br />
Total Cash at end of year 14 974 380 939 341<br />
The accompanying notes form part of these financial statements<br />
31
Notes to the Financial Statements<br />
OF SOUTH PORT NEW ZEALAND LIMITED for the year ended 30 JUNE 2012<br />
1 REPORTING ENTITY<br />
South Port New Zealand Limited (the “Company”) is a company<br />
domiciled in New Zealand, registered under the Companies Act 1993<br />
and listed on the New Zealand Stock Exchange (“<strong>NZX</strong>”). The company<br />
is an issuer in terms of the Financial <strong>Report</strong>ing Act 1993.<br />
The consolidated financial statements of South Port New Zealand<br />
Limited as at and for the period ended 30 June 2012 comprise the<br />
Company and its subsidiary Awarua Holdings Ltd (together referred<br />
to as the “Group”).<br />
South Port New Zealand Ltd is primarily involved in providing and<br />
managing port and warehousing services.<br />
2 BASIS OF PREPARATION<br />
(a) Statement of Compliance<br />
The financial statements have been prepared in accordance with<br />
New Zealand Generally Accepted Accounting Practice (GAAP).<br />
They comply with New Zealand equivalents to International<br />
Financial <strong>Report</strong>ing Standards (NZ IFRS), and other applicable<br />
Financial <strong>Report</strong>ing Standards, as appropriate for profit-oriented<br />
entities. These financial statements comply with International<br />
Financial <strong>Report</strong>ing Standards (IFRS).<br />
The financial statements were approved by the Board of Directors<br />
on 23 August 2012.<br />
(b) Basis of Measurement<br />
The financial statements have been prepared on the historical<br />
cost basis except for the following:<br />
• financial instruments are measured at fair value<br />
The methods used to measure fair values are discussed further in<br />
Note 4.<br />
(c) Functional and Presentation Currency<br />
These financial statements are presented in New Zealand dollars<br />
($), which is the Company’s functional currency. All financial<br />
information presented in New Zealand dollars has been rounded<br />
to the nearest thousand.<br />
(d) Use of Estimates and Judgements<br />
The preparation of financial statements requires management<br />
to make judgements, estimates and assumptions that affect the<br />
application of accounting policies and the reported amounts of<br />
assets, liabilities, income and expenses. Actual results may differ<br />
from these estimates.<br />
Estimates and underlying assumptions are reviewed on an<br />
ongoing basis. Revisions to accounting estimates are recognised<br />
in the period in which the estimate is revised and in any future<br />
periods affected.<br />
There were no estimates and assumptions that have a significant<br />
risk of causing a material adjustment to the carrying amounts of<br />
assets and liabilities within the next financial year.<br />
In particular, information about significant areas of estimation<br />
uncertainty and critical judgements in applying accounting<br />
policies that have the most significant effect on amounts<br />
recognised in the financial statements are as detailed below:<br />
• Provisions (Note 20)<br />
• Commitments and Contingent Liabilities (Note 25)<br />
• Financial Instruments (Note 24)<br />
• Valuation of Derivatives (Note 24)<br />
3 SIGNIFICANT ACCOUNTING POLICIES<br />
The accounting policies set out below have been applied<br />
consistently to all periods presented in these financial statements,<br />
and have been applied consistently by Group entities.<br />
(a) Basis of Preparing Group Financial Statements<br />
The Group financial statements include the parent company<br />
and its subsidiary accounted for using the purchase method.<br />
All significant inter-company items and transactions are<br />
eliminated on consolidation. In the parent company financial<br />
statements, investments in subsidiaries are stated at cost.<br />
On acquisition of a subsidiary, fair values are assigned to their<br />
assets and liabilities. Any excess of cost of acquisition of a<br />
subsidiary over the fair values assigned (being goodwill) is written<br />
off in the year of acquisition or tested annually for impairment.<br />
Where the cost of acquisition of a subsidiary is less than the fair<br />
values assigned (being a discount) this discount is applied to<br />
the reduction of the fair value of the non-monetary assets of<br />
the acquired company. Such a discount is then reflected in the<br />
Group income statement when non-monetary assets (property,<br />
plant and equipment) are realised through reduced depreciation<br />
charges.<br />
(b) Foreign Currency<br />
Transactions in foreign currencies are translated to the respective<br />
functional currencies of Group entities at exchange rates at the<br />
dates of the transactions.<br />
(c) Goods and Services Tax (GST)<br />
All financial information is expressed exclusive of GST, except<br />
for trade and other receivables, and trade and other payables,<br />
which are expressed inclusive of GST in the Statement of Financial<br />
Position.<br />
(d) Financial Instruments<br />
(i) Non-derivative financial instruments<br />
South Port New Zealand Ltd is party to financial instruments<br />
as part of its normal operations. These financial instruments<br />
include cash and cash equivalents, equity securities, trade<br />
and other receivables, loans and borrowings, and trade and<br />
other payables.<br />
Non-derivative financial instruments are recognised initially<br />
at fair value on transaction date plus, for instruments not at<br />
fair value through the profit or loss, any directly attributable<br />
transaction costs. Subsequent to initial recognition nonderivative<br />
financial instruments are measured as described<br />
below.<br />
A financial instrument is recognised if the Group becomes<br />
a party to the contractual provisions of the instrument.<br />
Financial assets are derecognised if the Group’s contractual<br />
rights to the cash flows from the financial assets expire<br />
or if the Group transfers the financial asset to another<br />
party without retaining control or substantially all risks<br />
and rewards of the asset. Purchases and sales of financial<br />
assets are accounted for at trade date. Financial liabilities<br />
are derecognised if the Group’s obligations specified in the<br />
contract expire or are discharged or cancelled.<br />
Cash and cash equivalents comprise cash balances and call<br />
deposits.<br />
Investments in equity securities<br />
Investments in equity securities held by the Group are<br />
classified as available-for-sale investments. Financial<br />
instruments are initially measured at fair value, and changes<br />
therein are recognised as Other Comprehensive Income.<br />
Trade and other receivables<br />
Trade and other receivables are stated at their cost less<br />
impairment losses.<br />
Interest-bearing borrowings<br />
Borrowings are initially recognised at fair value, net of<br />
transaction costs incurred. After initial recognition, interestbearing<br />
loans and borrowings are subsequently measured<br />
32
at amortised cost using the effective interest method.<br />
Borrowings are classified as current liabilities unless the Group<br />
has an unconditional right to defer settlement of the liability<br />
for at least 12 months after the balance sheet date.<br />
Trade and other payables<br />
Trade and other payables are stated at cost.<br />
(ii) Derivative financial instruments<br />
The Group uses derivative financial instruments to hedge its<br />
exposure to foreign exchange and interest rate risks arising<br />
from financing and investment activities. In accordance with<br />
its treasury policy, the Group does not hold or issue derivative<br />
financial instruments for trading purposes. However,<br />
derivatives that do not qualify for hedge accounting are<br />
accounted for as trading instruments.<br />
Derivative financial instruments are recognised initially at<br />
fair value and transaction costs are expensed immediately.<br />
Subsequent to initial recognition, derivative financial<br />
instruments are stated at fair value. The gain or loss on remeasurement<br />
to fair value is recognised immediately in profit<br />
or loss.<br />
A deriviative is presented as a non-current asset or a noncurrent<br />
liability if the remaining maturity of the instrument<br />
is more than 12 months and is not expected to be realised<br />
or settled within 12 months. Other deriviatives are presented<br />
as current assets or current liabilities.<br />
Interest rate swaps<br />
Derivative financial instruments also include interest rate<br />
swaps to hedge (economically but not in accounting terms)<br />
the Group’s risks associated with interest rate fluctuations.<br />
Such derivative financial instruments are initially recognised<br />
at fair value on the date on which a derivative contract is<br />
entered into and are subsequently remeasured to fair value.<br />
Derivatives are carried as assets when their fair value is<br />
positive and as liabilities when their fair value is negative.<br />
Any gains or losses arising from changes in the fair value of<br />
interest rate swaps are taken directly to profit or loss for the<br />
year.<br />
The fair values of interest rate swap contracts are determined<br />
by reference to market values for similar instruments.<br />
(e) Property, Plant & Equipment<br />
(i) Recognition and measurement<br />
Items of property, plant and equipment are measured at<br />
cost, less accumulated depreciation and impairment losses.<br />
Land is not depreciated.<br />
The initial cost includes the purchase price and any costs<br />
directly attributable to bringing the asset to the state of being<br />
ready for use in location. These costs can include installation<br />
costs, borrowing costs, cost of obtaining resource consents<br />
etc. Any feasibility costs are expensed.<br />
(ii)<br />
Subsequent expenditure<br />
Subsequent expenditure is added to the gross carrying<br />
amount of an item of property, plant or equipment, if that<br />
expenditure increases the future economic benefits of the<br />
asset beyond its existing potential, or is necessarily incurred<br />
to enable future economic benefits to be obtained and its<br />
cost can be measured reliably.<br />
(iii) Disposal of property, plant and equipment<br />
Where an item of such is disposed of, the gain or loss is<br />
recognised in the Statement of Comprehensive Income<br />
at the difference between the net sale price and the net<br />
carrying amount of the item.<br />
(iv) Depreciation<br />
Depreciation is calculated on a straight line basis to allocate<br />
the cost of an asset, less its residual value, over its useful life. The<br />
estimated useful lives of property, plant and equipment are:<br />
• Buildings 15-50 years<br />
• Plant & Equipment<br />
3-50 years<br />
Depreciation methods, useful lives and residual values are<br />
reassessed at the reporting date.<br />
(f) Impairment<br />
The carrying amounts of the Group’s assets are reviewed at each<br />
balance sheet date to determine whether there is any objective<br />
evidence of impairment.<br />
An impairment loss is recognised whenever the carrying amount<br />
of an asset exceeds its recoverable amount. Impairment losses<br />
directly reduce the carrying amount of assets and are recognised<br />
in the Statement of Comprehensive Income.<br />
(i) Impairment of receivables<br />
Accounts receivable for the Group are valued at their<br />
anticipated realisable value after writing off amounts<br />
considered to be irrecoverable and making adequate<br />
provision for doubtful debts.<br />
(g) Provisions<br />
A provision is recognised if, as a result of a past event, the Group<br />
has a present legal or constructive obligation that can be<br />
estimated reliably, and it is probable that an outflow of economic<br />
benefits will be required to settle the obligation.<br />
(h) Revenue<br />
Revenue is measured at the fair value of the consideration<br />
received or receivable, net of allowances, trade discounts and<br />
volume rebates, and recovery of the consideration is probable.<br />
(i) Services<br />
Revenue from services rendered is recognised in the Statement<br />
of Comprehensive Income in proportion to the stage of<br />
completion of the transaction at the reporting date.<br />
(ii) Rental Income<br />
Rental income from property is recognised in the Statement of<br />
Comprehensive Income on a straight-line basis over the term<br />
of the lease.<br />
(iii) Deferred Revenue<br />
Deferred revenue is revenue received in advance which is<br />
recorded as a liability and amortised to income on a straight<br />
line basis over the period to which the revenue relates.<br />
(i) Lease Payments<br />
Payments made under operating leases are recognised in the<br />
Statement of Comprehensive Income on a straight-line basis<br />
over the term of the lease.<br />
(j) Finance Income and Expenses<br />
Finance income comprises interest income on funds invested,<br />
dividend income, foreign currency gains and changes in the fair<br />
value of financial assets at fair value through profit or loss. Interest<br />
income is recognised as it accrues, using the effective interest<br />
method. Dividend income is recognised on the date that the<br />
Group’s right to receive payment is established.<br />
Finance expenses comprise interest expense on borrowings,<br />
foreign currency losses, interest rate swap losses, and impairment<br />
losses recognised on financial assets. All borrowing costs are<br />
recognised in the Statement of Comprehensive Income using<br />
the effective interest method.<br />
33
(k) Income Tax Expense<br />
(l)<br />
Income tax expense comprises current and deferred tax. Income tax<br />
expense is recognised in the Statement of Comprehensive Income<br />
except to the extent that it relates to items recognised directly in<br />
equity, in which case it is recognised in equity.<br />
Current tax is the expected tax payable on the taxable income<br />
for the year, using tax rates enacted or substantively enacted<br />
at the reporting date, and any adjustment to tax payable in<br />
respect of previous years.<br />
Deferred tax is recognised using the balance sheet method,<br />
providing for temporary differences between the carrying<br />
amounts of assets and liabilities for financial reporting purposes<br />
and the amounts used for taxation purposes. Deferred tax is<br />
not recognised for the following temporary differences: the<br />
initial recognition of assets or liabilities in a transaction that is<br />
not a business combination and that affects neither accounting<br />
nor taxable profit, and differences relating to investments in<br />
subsidiaries to the extent that they probably will not reverse in<br />
the foreseeable future.<br />
Deferred tax assets and liabilities are measured at the tax rates<br />
that are expected to be applied to the temporary differences<br />
when they reverse, based on the laws that have been enacted<br />
or substantively enacted by the reporting date.<br />
A deferred tax asset is recognised to the extent that it is probable<br />
that future taxable profits will be available against which<br />
temporary differences can be utilised. Deferred tax assets are<br />
reviewed at each reporting date and are reduced to the extent<br />
that it is no longer probable that the related tax benefit will be<br />
realised.<br />
Additional income taxes that arise from the distribution of<br />
dividends are recognised at the same time as the liability to pay<br />
the related dividend is recognised.<br />
Earnings per Share<br />
The Group presents basic earnings per share (EPS) data for its<br />
ordinary shares. Basic EPS is calculated by dividing the net surplus<br />
after income tax attributable to ordinary shareholders of the<br />
Company by the weighted average number of ordinary shares<br />
outstanding during the period. There is no value difference<br />
between basic EPS and diluted EPS.<br />
(m) Segment <strong>Report</strong>ing<br />
Operating segments are reported in a manner consistent with<br />
the internal reporting provided to the chief operating decision<br />
maker. The chief operating decision maker, who is responsible for<br />
allocating resources and assessing performance of the operating<br />
segments, has been identified as the Chief Executive.<br />
The Group operates solely in the port industry and all operations<br />
are carried out in the Southland region.<br />
(n) Amendments to NZ IFRS<br />
The following new, revised or amended accounting<br />
standards have been applied by the group for the year<br />
beginning 1 July 2011:<br />
• NZ IAS 24: Related Party Disclosures (revised)<br />
• NZ IFRS 7: Financial Instruments (amendment)<br />
• NZ IAS 1: Presentation of Financial Statements<br />
(amendment)<br />
• NZ IAS 34: Interim Financial <strong>Report</strong>ing (amendment)<br />
The application of these accounting standards has had no material<br />
effect on the financial statements.<br />
There are no other new, revised or amended accounting standards<br />
issued by the International Accounting Standards Board and the<br />
Accounting Standards Review Board in New Zealand that are<br />
mandatory for application by the Group for the financial year<br />
beginning 1 July 2011.<br />
(o) NZ IFRS issued but not yet effective<br />
New standards, amendments and interpretations issued<br />
by the International Accounting Standards Board and the<br />
Accounting Standards Review Board in New Zealand that<br />
are not yet effective and have not been early adopted by<br />
the Group are:<br />
• NZ IAS 1 (Amendment): Presentation of Financial<br />
Statements – The amended standard is expected to be<br />
adopted by the Group in the financial statements for the<br />
year ending 30 June 2013.<br />
• NZ IFRS 10: Consolidated Financial Statements – This<br />
standard will supersede NZ IAS 27: Consolidated<br />
and Separate Financial Statements and NZ SIC 12:<br />
Consolidation Special Purpose Entities and is expected<br />
to be adopted by the Group in the financial statements<br />
for the year ending 30 June 2014.<br />
• NZ IFRS 12: Disclosure of Interests in Other Entities – This<br />
standard is expected to be adopted by the Group in the<br />
financial statements for the year ending 30 June 2014.<br />
• NZ IFRS 13: Fair Value Measurement – This standard will<br />
replace the fair value measurement guidance contained<br />
in individual IFRSs with a single source of fair value<br />
measurement guidance and is expected to be adopted by<br />
the Group in the financial statements for the year ending<br />
30 June 2014.<br />
• NZ IAS 27 (Amendment): Separate Financial Statements<br />
- This standard is expected to be adopted by the Group<br />
in the financial statements for the year ending 30 June<br />
2014.<br />
• NZ IFRS 9: Financial Instruments – This standard will<br />
eventually replace NZ IAS 39: Financial Instruments –<br />
Recognition and Measurement and is expected to be<br />
adopted by the Group in the financial statements for the<br />
year ending 30 June 2016.<br />
None of the above standards are expected to materially affect<br />
the Group’s financial statements.<br />
No other standards, amendments or interpretations that have<br />
been issued but are not yet effective are expected to materially<br />
impact the Group’s financial statements.<br />
4 DETERMINATION OF FAIR VALUES<br />
A number of the Group’s accounting policies and disclosures<br />
require the determination of fair value, for both financial and nonfinancial<br />
assets and liabilities. Fair values have been determined<br />
for measurement and/or disclosure purposes based on the<br />
following methods. Where applicable, further information about<br />
the assumptions made in determining fair values is disclosed in<br />
the notes specific to that asset or liability.<br />
(a) Investments in Equity and Debt Securities<br />
The fair value of available-for-sale investments are determined<br />
by reference to their quoted bid price at the reporting date.<br />
(b) Derivative Financial Instruments<br />
The fair value of forward exchange contracts and interest rate<br />
swaps are determined using quoted rates at balance date.<br />
(c) Other Non-Derivative Financial Instruments<br />
The carrying values less impairment provisions of trade<br />
receivables and payables are assumed to approximate their fair<br />
values.<br />
The carrying values of loans and borrowings approximate their<br />
fair values.<br />
34
5 OPERATING REVENUE<br />
Group<br />
Company<br />
In Thousands of New Zealand Dollars 2012 2011 2012 2011<br />
Services 26,038 25,148 26,038 25,148<br />
Total revenues 26,038 25,148 26,038 25,148<br />
6 OTHER INCOME<br />
Group<br />
Company<br />
In Thousands of New Zealand Dollars 2012 2011 2012 2011<br />
Net gain on sale of property, plant and equipment 40 115 40 115<br />
Impairment losses reversed 376 — 376 —<br />
Total other income 416 115 416 115<br />
7 FINANCE INCOME AND EXPENSES<br />
Group<br />
Company<br />
In Thousands of New Zealand Dollars 2012 2011 2012 2011<br />
Income<br />
Interest income 10 39 10 39<br />
Dividend income 1 1 1 1<br />
Foreign exchange gains — 40 — 40<br />
Total financial income 11 80 11 80<br />
Expenses<br />
Interest expense (343) (340) (343) (340)<br />
Change in fair value of interest rate swap (19) (79) (19) (79)<br />
Foreign exchange losses (24) — (24) —<br />
Total financial expenses (386) (419) (386) (419)<br />
Net finance costs (375) (339) (375) (339)<br />
35
8 OPERATING EXPENSES<br />
The following items of expenditure are included in total operating expenses:<br />
Group<br />
Company<br />
In Thousands of New Zealand Dollars 2012 2011 2012 2011<br />
Auditors’ remuneration for audit services 34 36 34 36<br />
Auditors’ remuneration for other guidance — 11 — 11<br />
Amount paid for employment law services<br />
(to associated entity of auditors) 6 6 6 6<br />
Bad debts written off 60 27 60 27<br />
Depreciation of property, plant & equipment 2,376 2,187 2,376 2,187<br />
Directors’ fees 200 185 200 185<br />
Donations* 3 23 3 23<br />
Rental and lease expenses 98 63 98 63<br />
Increase/(decrease) in liability for long-service leave 12 (1) 6 (4)<br />
Loss on disposal of trading assets 28 168 28 168<br />
* 2011 includes provision for a $20,000 donation for a Lyttelton community earthquake rebuild project.<br />
9 EMPLOYEE BENEFITS EXPENSE<br />
Group<br />
Company<br />
In Thousands of New Zealand Dollars 2012 2011 2012 2011<br />
Salaries and wages 5,570 5,246 4,709 4,465<br />
Defined contribution plans 149 135 83 72<br />
Other employee benefits 117 123 70 78<br />
5,836 5,504 4,862 4,615<br />
10 KEY MANAGEMENT PERSONNEL COMPENSATION<br />
The compensation of the Directors, Chief Executive and other senior management, being the key management personnel of the<br />
entity, is set out below:<br />
Group<br />
Company<br />
In Thousands of New Zealand Dollars 2012 2011 2012 2011<br />
Short-term employee benefits 1,213 1,153 684 627<br />
Post-employment benefits 75 73 36 35<br />
1,288 1,226 720 662<br />
36
11 INCOME TAXES<br />
Group<br />
Company<br />
In Thousands of New Zealand Dollars 2012 2011 2012 2011<br />
(a) Income tax recognised in profit or loss<br />
Tax expense/(income) comprises:<br />
Current tax expense / (credit):<br />
Current year 2,188 3,598 2,186 3,600<br />
Adjustments for prior years (8) (2) (10) (2)<br />
2,180 3,596 2,176 3,598<br />
Deferred tax expense / (credit)<br />
Origination and reversal of temporary differences 198 (1,072) 200 (1,075)<br />
Adjustments for prior years — — — —<br />
Adjustments relating to change in tax rates — — — —<br />
Adjustments relating to tax legislation changes — (279) — (279)<br />
198 (1,351) 200 (1,354)<br />
Total tax expense / (income) 2,378 2,245 2,376 2,244<br />
The prima facie income tax expense on pre-tax<br />
accounting surplus reconciles to the income tax<br />
expense in the financial statements as follows:<br />
Surplus / (deficit) before income tax 8,367 8,503 8,367 8,503<br />
Income tax expense (credit) calculated at 28% 2,343 2,551 2,343 2,551<br />
Temporary differences 149 49 149 48<br />
Non-deductible expenses — (43) — (43)<br />
Non assessable income (106) (31) (106) (31)<br />
2,386 2,526 2,386 2,525<br />
Adjustments for prior years — — — —<br />
(Over) / under provision of income tax in previous year (8) (2) (10) (2)<br />
Adjustments relating to changes in tax rates — — — —<br />
Adjustments relating to tax legislation changes — (279) — (279)<br />
Income tax expense (credit) 2,378 2,245 2,376 2,244<br />
The tax rate used in the above reconciliation is the corporate tax rate of 28% payable on taxable profits under New Zealand tax<br />
law. There has been a change in the corporate tax rate when compared with the previous reporting period, as legislation has<br />
been passed which reduced the corporate tax rate in 2011/2012 from 30% to 28%.<br />
(b) Income tax recognised directly in equity<br />
There was no current or deferred tax charged / (credited) directly to equity during the period.<br />
Group<br />
Company<br />
In Thousands of New Zealand Dollars 2012 2011 2012 2011<br />
(c) Current tax assets and liabilities<br />
Current tax refundable:<br />
Current tax refundable — — — —<br />
Current tax payable:<br />
Current tax payable 789 1,148 787 1,150<br />
37
Note 11 continued...<br />
(d) Deferred tax balances comprise:<br />
Taxable and deductible temporary differences arising from the following:<br />
Group<br />
In Thousands of New Zealand Dollars 1 July 2011 Recognised Recognised 30 June 2012<br />
Opening in in Closing<br />
Balance profit/loss equity Balance<br />
2012<br />
Gross deferred tax liabilities:<br />
Other financial assets (10) 10 — —<br />
Property, plant and equipment (300) (185) — (485)<br />
(310) (175) — (485)<br />
Gross deferred tax assets:<br />
Other financial assets / liabilities — — — —<br />
Provisions 205 (23) — 182<br />
205 (23) — 182<br />
Net deferred tax asset / (liability) (105) (198) — (303)<br />
GROUP<br />
In Thousands of New Zealand Dollars 1 July 2010 Recognised Recognised 30 June 2011<br />
Opening in in Closing<br />
Balance profit/loss equity Balance<br />
2011<br />
Gross deferred tax liabilities: (1,096) 1,086 — (10)<br />
Other financial assets (648) 348 — (300)<br />
Property, plant and equipment<br />
(1,744) 1,434 — (310)<br />
Gross deferred tax assets:<br />
Other financial assets / liabilities 90 (90) — —<br />
Provisions 198 7 — 205<br />
288 (83) — 205<br />
Net deferred tax asset / (liability) (1,456) 1,351 — (105)<br />
COMPANY<br />
In Thousands of New Zealand Dollars 1 July 2011 Recognised Recognised 30 June 2012<br />
Opening in in Closing<br />
Balance profit/loss equity Balance<br />
2012<br />
Gross deferred tax liabilities:<br />
Other financial assets (10) 10 — —<br />
Property, plant and equipment (300) (185) — (485)<br />
(310) (175) — (485)<br />
Gross deferred tax assets:<br />
Other financial assets / liabilities — — — —<br />
Provisions 189 (25) — 164<br />
189 (25) — 164<br />
Net deferred tax asset / (liability) (121) (200) — (321)<br />
38
Note 11 continued...<br />
COMPANY<br />
In Thousands of New Zealand Dollars 1 July 2010 Recognised Recognised 30 June 2011<br />
Opening in in Closing<br />
Balance profit/loss equity Balance<br />
2011<br />
Gross deferred tax liabilities:<br />
Other financial assets (1,096) 1,086 — (10)<br />
Property, plant and equipment (648) 348 — (300)<br />
(1,744) 1,434 — (310)<br />
Gross deferred tax assets:<br />
Other financial assets / liabilities 90 (90) — —<br />
Provisions 179 10 — 189<br />
269 (80) — 189<br />
Net deferred tax asset / (liability) (1,475) 1,354 — (121)<br />
COMPANY<br />
In Thousands of New Zealand Dollars 2012 2011<br />
(e) Imputation credit account balances<br />
Balance at beginning of year 5,100 4,506<br />
Taxation paid 2,538 2,494<br />
Attached to dividends paid (2,249) (1,900)<br />
Balance at end of year 5,389 5,100<br />
12 PROPERTY, PLANT AND EQUIPMENT<br />
In Thousands of New Zealand Dollars 2012<br />
Cost Additions Disposals Other Cost Accumulated Impair- Depn Accumulated Other Accumulated Carrying<br />
1 July 30 June Depn and ment Expense Depn Depn and Amt<br />
2011 2012 Impairment Losses reversed Impairment 30 June<br />
charges Reversed on charges 2012<br />
1 July 2011 Disposal 30 June 2012<br />
Land 2,034 — — — 2,034 — — — — — — 2,034<br />
Buildings 10,818 — — (39) 10,779 4,239 — 270 — (24) 4,485 6,294<br />
Plant & machinery 49,672 2,648 (3,662) — 48,658 27,785 (376) 2,106 (2,289) — 27,226 21,432<br />
62,524 2,648 (3,662) (39) 61,471 32,024 (376) 2,376 (2,289) (24) 31,711 29,760<br />
In Thousands of New Zealand Dollars 2011<br />
Cost Additions Disposals Other Cost Accumulated Impair- Depn Accumulated Other Accumulated Carrying<br />
1 July 30 June Depn and ment Expense Depn Depn and Amt<br />
2010 2011 Impairment Losses reversed Impairment 30 June<br />
charges Reversed on charges 2011<br />
1 July 2010 Disposal 30 June 2011<br />
Land 2,043 — (9) — 2,034 — — — — — — 2,034<br />
Buildings 10,832 — — (14) 10,818 3,968 — 271 — — 4,239 6,579<br />
Plant & machinery 43,872 6,810 (1,010) — 49,672 26,711 — 1,916 (842) — 27,785 21,887<br />
56,747 6,810 (1,019) (14) 62,524 30,679 — 2,187 (842) — 32,024 30,500<br />
39
Note 12 continued...<br />
Impairment<br />
During the year ended 30 June 2012 there were no impairment losses (2011 : nil) which were recorded in the Statement of<br />
Comprehensive Income.<br />
Disposal of non-current assets<br />
During the year, a material item of plant (Liebherr LHM 320 mobile harbour crane) was advertised for sale and at interim was<br />
therefore reclassified as Available for Sale (current asset). This asset had previously been recognised as a non-current asset as an<br />
item of Property, Plant and Equipment. This plant was excess to requirements.<br />
Prior to 30 June 2012 this asset was sold to an overseas buyer. As this asset was impaired back in 2010, part of this impairment<br />
was reversed as a result of the sale of this asset. This impairment loss reversal is recorded in the Statement of Comprehensive<br />
Income as “other income”.<br />
13 OTHER INvestments<br />
Group<br />
Company<br />
In Thousands of New Zealand Dollars 2012 2011 2012 2011<br />
Non-current investments<br />
Available-for-sale investments 22 19 22 19<br />
14 CASH AND CASH EQUIVALENTS<br />
Group<br />
Company<br />
In Thousands of New Zealand Dollars 2012 2011 2012 2011<br />
Bank balances 763 346 728 307<br />
Call deposits 211 34 211 34<br />
Cash and cash equivalents 974 380 939 341<br />
Bank overdrafts used for cash management purposes — — — —<br />
Cash and cash equivalents in the statement of cash flows 974 380 939 341<br />
15 RECEIVABLES AND ADVANCES<br />
Group<br />
Company<br />
In Thousands of New Zealand Dollars 2012 2011 2012 2011<br />
Prepayments 41 35 41 35<br />
Trade receivables 4,040 2,998 4,040 2,998<br />
Provision for doubtful debts (25) (25) (25) (25)<br />
4,056 3,008 4,056 3,008<br />
40
16 CAPITAL AND RESERVES<br />
Reconciliation of movement in capital and reserves<br />
Group<br />
Company<br />
In Thousands of New Zealand Dollars<br />
Asset<br />
Revaluation<br />
Reserve<br />
Share<br />
Capital<br />
Retained<br />
Earnings<br />
Total<br />
Equity<br />
Asset<br />
Revaluation<br />
Reserve<br />
Share<br />
Capital<br />
Retained<br />
Earnings<br />
Total<br />
Equity<br />
Balance 1 July 2010 9 9,418 17,860 27,287 9 9,418 17,797 27,224<br />
Total recognised income and expense — — 6,258 6,258 — — 6,259 6,259<br />
Dividends to equity holders — — (4,722) (4,722) — — (4,722) (4,722)<br />
Change in value of available-for-sale 4 — — 4 4 — — 4<br />
financial assets<br />
Balance at 30 June 2011 13 9,418 19,396 28,827 13 9,418 19,334 28,765<br />
Balance 1 July 2011 13 9,418 19,396 28,827 13 9,418 19,334 28,765<br />
Total recognised income and expense — — 5,989 5,989 — — 5,991 5,991<br />
Dividends to equity holders — — (5,247) (5,247) — — (5,247) (5,247)<br />
Change in value of available-for-sale 3 — — 3 3 — — 3<br />
financial assets<br />
Balance at 30 June 2012 16 9,418 20,138 29,572 16 9,418 20,078 29,512<br />
Asset revaluation reserve – Available-for-sale investments are revalued annually and changes in valuation are recognised in the<br />
asset revaluation reserve to keep the changes separate from retained earnings.<br />
Share Capital<br />
Group<br />
Company<br />
In Thousands of New Zealand Dollars 2012 2011 2012 2011<br />
Balance at beginning of year 9,418 9,418 9,418 9,418<br />
Balance at end of year 9,418 9,418 9,418 9,418<br />
The holders of ordinary shares are entitled to receive dividends as declared from time to time and are entitled to one vote per<br />
share at meetings of the Company. All of the 26,234,898 ordinary shares rank equally with regard to the Company’s residual<br />
assets. All shares are fully paid and have no par value. There were no shares issued or redeemed during the year.<br />
Dividends<br />
Dividends are recognised in the period that they are authorised and declared.<br />
Group<br />
Company<br />
In Thousands of New Zealand Dollars 2012 2011 2012 2011<br />
2011 final dividend paid on all ordinary shares @<br />
14.50 cents per share (2010: 12.50 cents) 3,804 3,279 3,804 3,279<br />
2012 interim: on all ordinary shares @ 5.50 cents<br />
per share (2011: 5.50 cents) 1,443 1,443 1,443 1,443<br />
Total distributions to shareholders 5,247 4,722 5,247 4,722<br />
After 30 June 2012 the following dividends were proposed by the directors for 2012. The dividends have not been provided for<br />
and there are no income tax consequences.<br />
In Thousands of New Zealand Dollars 2012<br />
2012 final dividend payable on 9 November 2012 @ 14.5 cents per share 3,804<br />
41
17 CAPITAL MANAGEMENT<br />
The Group’s capital includes share capital, reserves and retained earnings. The Group’s policy is to maintain a strong capital base<br />
so as to maintain investor, creditor and market confidence. The Board of Directors’ objective is to ensure the entity continues as<br />
a going concern as well as to maintain optimal returns to shareholders and benefits for other stakeholders.<br />
The Group meets its objectives for managing capital through its investment decisions on the acquisition, disposal and<br />
development of assets and its distribution policy. It is Group policy that the dividend payout takes account of the Company’s<br />
free cash flows and reported profit.<br />
The Group is required to comply with certain financial covenants in respect of external borrowings set by the Group’s bankers.<br />
All covenants have been adhered to throughout the years ended 30 June 2012 and 30 June 2011.<br />
The Group’s policies in respect of capital management are reviewed regularly by the Board of Directors. There have been no<br />
changes in the Group’s management of capital during the year.<br />
18 EARNINGS PER SHARE<br />
The calculation of basic earnings per share at 30 June 2012 was based on the profit attributable to ordinary shareholders of<br />
$5,989,000 (2011: $6,258,000) and a weighted average number of ordinary shares outstanding of 26,234,898 (2011: 26,234,898).<br />
Basic and diluted EPS are the same value.<br />
19 LOANS AND BORROWINGS Group Company<br />
In Thousands of New Zealand Dollars 2012 2011 2012 2011<br />
Hong Kong and Shanghai Banking Corporation (HSBC) 1,200 300 1,200 300<br />
Total Current Borrowings 1,200 300 1,200 300<br />
South Port New Zealand Limited’s revolving credit facility of $5 million from HSBC is on a 30 day rolling basis. The facility is<br />
secured by way of a general security registered over all assets both present and future, and uncalled capital” of South Port New<br />
Zealand Limited. Interest on the first $5 million drawn at any one time is payable according to the 5 year interest rate swap<br />
agreement the Company has with HSBC and interest on the balance of funds drawn at any time is a variable rate based on the<br />
cost of funds.<br />
20 PROVISIONS Group Company<br />
In Thousands of New Zealand Dollars 2012 2011 2012 2011<br />
Provision for employee entitlements<br />
Balance at beginning of year 710 648 632 568<br />
Additional provisions made 30 79 20 73<br />
Amount utilised (16) (17) (15) (9)<br />
Balance at end of year 724 710 637 632<br />
Provision for unforeseen repairs and maintenance<br />
Balance at beginning of year 100 100 100 100<br />
Additional provisions made — — — —<br />
Amount utilised (100) — (100) —<br />
Balance at end of year — 100 — 100<br />
Current 657 755 595 696<br />
Non-current 67 55 42 36<br />
Total Provisions 724 810 637 732<br />
Employee entitlements<br />
(i) Defined contribution plans<br />
Obligations for contributions to defined contribution pension plans are recognised as an expense in the<br />
Statement of Comprehensive Income when they are due.<br />
(ii)<br />
<strong>Annual</strong> leave and retirement leave<br />
Provision is made in respect of the Group’s liability for annual leave and retirement leave calculated on an actual<br />
entitlement basis at current rates of pay.<br />
42
Note 20 continued...<br />
(iii)<br />
Long service leave<br />
The Group’s net obligation in respect of long-term employee benefits is the amount of future benefit that employees have<br />
earned in return for their service in the current and prior periods; that benefit is discounted to determine its present value, and<br />
the fair value of any related assets is deducted. Any actuarial gains or losses are recognised in the Statement of Comprehensive<br />
Income in the period in which they arise.<br />
Unforeseen repairs and maintenance<br />
The port industry requires substantial investment in infrastructural assets. As a result of this type of asset base significant repairs and<br />
maintenance costs can arise unexpectedly. The Group's unforeseen repairs and maintenance provision has previously allowed for events<br />
of this nature. This provision was utilsed during the year ended 30 June 2012.<br />
21 EMPLOYEE ENTITLEMENTS<br />
Group<br />
Company<br />
In Thousands of New Zealand Dollars 2012 2011 2012 2011<br />
Accrued salary and wages (including bonuses) 223 231 209 220<br />
<strong>Annual</strong> leave 412 398 369 357<br />
Long service leave 89 81 59 55<br />
724 710 637 632<br />
22 TRADE AND OTHER PAYABLES<br />
Group<br />
Company<br />
In Thousands of New Zealand Dollars 2012 2011 2012 2011<br />
Trade creditors and accruals 1,827 2,339 1,792 2,301<br />
Inter entity creditors — — 131 121<br />
1,827 2,339 1,923 2,422<br />
23 OTHER LIABILITIES<br />
Group<br />
Company<br />
In Thousands of New Zealand Dollars 2012 2011 2012 2011<br />
Non-current<br />
Interest rate derivatives 397 378 397 378<br />
397 378 397 378<br />
Current<br />
Forward exchange contract — — — —<br />
Income tax payable/(refund) 789 1,148 787 1,150<br />
789 1,148 787 1,150<br />
1,186 1,526 1,184 1,528<br />
24 FINANCIAL INSTRUMENTS<br />
Credit risk<br />
Financial instruments which potentially subject the Group to credit risk principally consist of bank balances and accounts<br />
receivable. The carrying amount of these financial instruments represents the maximum exposure to credit risk. Management<br />
has a credit policy in place under which each new customer is individually analysed for credit worthiness. In order to determine<br />
which customers are classified as having payment difficulties the Group applies a mix of duration and frequency of default and<br />
makes provision for estimated balances considered to be impaired. The Group does not require collateral in respect of trade<br />
and other receivables. Cash handling is only carried out with counterparties that have an investment grade credit rating.<br />
43
Note 24 continued...<br />
Liquidity risk<br />
Liquidity risk represents the Group’s ability to meet its contractual obligations. The Group evaluates its liquidity requirements on<br />
an ongoing basis. In general, the Group generates sufficient cash flows from its operating activities to meet its obligations arising<br />
from its financial liabilities and has credit lines in place to cover potential shortfalls and meet capital expenditure requirements.<br />
The only liquidity risks the Group has at balance date are trade payables totalling $1,827,000 (2011: $2,339,000) which are all<br />
due within 30 days, and short term borrowings totalling $1,200,000 (2011: $300,000) which is due within one month of balance<br />
date.<br />
Market risk<br />
The Group enters into derivative arrangements in the ordinary course of business to manage foreign currency and interest rate<br />
risks.<br />
Foreign exchange risk<br />
The Group is exposed to foreign currency risk on sales and purchases that are denominated in a currency other than the<br />
Company’s functional currency, New Zealand dollars ($), which is the presentation currency of the Group.<br />
The Group enters into forward exchange contracts from time to time when a specific plant purchase is in another currency.<br />
The purpose of these contracts is to reduce the risk from price fluctuations of foreign currency commitments associated with<br />
these one-off purchases. Any resulting differential to be paid or received as a result of the currency change is reflected in the<br />
Statement of Comprehensive Income.<br />
The Group has no forward exchange contracts at balance date.<br />
During the year no Forex contracts were entered into, however foreign currency was received for the sale of plant and net<br />
losses of $24,000 have been added to the financial income and financial expenses in profit or loss (2011: $40,000 net gain).<br />
Interest rate risk<br />
Interest payable to HSBC is charged on the following basis:<br />
(i) 5 year interest rate swap; and<br />
(ii) Variable rates based on the cost of funds.<br />
During the period the range of interest rates applying to the revolving credit facility was between 3.86% and 4.09% (2011: 4.09%<br />
and 4.811%). The Company is exposed to normal fluctuations in market interest rates.<br />
Interest rate swap – South Port NZ Ltd has an interest rate swap in place which matures in June 2015. The interest rate swap has<br />
a fixed swap rate of 6.23% with a notional contract amount of $5 million at 30 June 2012 (2011: $5 million).<br />
Credit facility<br />
At balance date the Group had a total bank facility of $5 million (2011: $2 million), of which $1,200,000 (2011: $300,000) had<br />
been drawn down.<br />
Fair values<br />
The carrying amount is considered to be the fair value for each financial instrument.<br />
The maturity profiles of the Group’s interest bearing investments and borrowings are disclosed below:<br />
MATURITY PROFILE OF FINANCIAL INSTRUMENTS<br />
The following table details the Group’s exposure to interest rate risk on financial instruments:<br />
Weighted CCAF Carrying Contractual Less than 1 - 2 2 - 3 3 - 4 4 - 5 5 + Non<br />
Average Interest Value Cashflows 1 year years years years years years Interest<br />
Effective Rate $’000 $’000 $’000 $’000 $’000 $’000 $’000 $’000 Bearing<br />
Interest<br />
2012 Rate<br />
Financial assets:<br />
Cash & cash equivalents 3.20% 3.20% 974 974 — — — — — — 763<br />
Trade & other receivables — — 4,056 4,056 — — — — — — 4,056<br />
Other financial assets<br />
– Equity investments — — 22 22 — — — — — — 22<br />
Financial liabilities:<br />
Trade & other payables — — (1,827) (1,827) — — — — — — (1,827)<br />
Borrowings 7.56% 3.86% (1,200) (1,204) (1,204) — — — — — —<br />
Interest rate derivatives 6.23% 3.70% (397) (445) (187) (148) (111) — — — —<br />
1,628 1,576 (1,390) (148) (111) — — — 3,014<br />
44
Note 24 continued...<br />
Weighted CCAF Carrying Contractual Less than 1 - 2 2 - 3 3 - 4 4 - 5 5 + Non<br />
Average Interest Value Cashflows 1 year years years years years years Interest<br />
Effective Rate $’000 $’000 $’000 $’000 $’000 $’000 $’000 $’000 Bearing<br />
Interest<br />
2011 Rate<br />
Financial assets:<br />
Cash & cash equivalents 3.20% 3.20% 380 380 — — — — — — 370<br />
Trade & other receivables — — 3,008 3,008 — — — — — — 3,008<br />
Other financial assets<br />
– Equity investments — — 19 19 — — — — — — 19<br />
Financial liabilities:<br />
Trade & other payables — — (2,339) (2,339) — — — — — — (2,339)<br />
Borrowings 7.46% 3.90% (300) (301) (301) — — — — — —<br />
Interest rate derivatives 6.23% 3.56% (378) (606) (178) (179) (142) (107) — — —<br />
390 161 (479) (179) (142) (107) — — 1,058<br />
CREDIT RISK<br />
The following table details the ageing of the Group's trade receivables at balance date:<br />
Trade receivables Gross Doubtful Gross Doubtful<br />
Receivable debts Receivable debts<br />
In Thousands of New Zealand Dollars 2012 2012 2011 2011<br />
Not past due 3,565 4 2,399 6<br />
Past due 0-30 days 431 4 444 3<br />
Past due 31-120 days 6 6 127 8<br />
Past due 121-360 days 36 9 27 7<br />
Past due more than 1 year 2 2 1 1<br />
Total 4,040 25 2,998 25<br />
There is no collateral held or other credit enhancements for security of trade receivables.<br />
SENSITIVITY ANALYSIS<br />
The following table details a sensitivity analysis for each type of market risk to which the Group is exposed:<br />
2012 Interest rate risk Foreign exchange risk Other price risk<br />
In Thousands of Carrying -100bp +100bp -10% +10% -10% +10%<br />
New Zealand Dollars Amount Profit Equity Profit Equity Profit Equity Profit Equity Profit Equity Profit Equity<br />
Financial assets<br />
Cash and cash equivalents 974 (2) – 2 – – – – – – – – –<br />
Trade and other receivables 4,056 – – – – – – – – – – – –<br />
Available-for-sale investments 22 – – – – – – – – – (2) – 2<br />
Financial liabilities<br />
Loans and borrowings 1,200 12 – (12) – – – – – – – – –<br />
Trade and other payables 1,827 – – – – – – – – – – – –<br />
Derivatives – interest 397 (120) – 120 – – – – – – – – –<br />
rate swaps<br />
Total increase/(decrease) (110) – 110 – – – – – – (2) – 2<br />
45
Note 24 continued...<br />
2011 Interest rate risk Foreign exchange risk Other price risk<br />
In Thousands of Carrying -100bp +100bp -10% +10% -10% +10%<br />
New Zealand Dollars Amount Profit Equity Profit Equity Profit Equity Profit Equity Profit Equity Profit Equity<br />
Financial assets<br />
Cash and cash equivalents 380 – – – – – – – – – – – –<br />
Trade and other receivables 3,008 – – – – – – – – – – – –<br />
Available-for-sale investments 19 – – – – – – – – – (2) – 2<br />
Financial liabilities<br />
Loans and borrowings 300 3 – (3) – – – – – – – – –<br />
Trade and other payables 2,339 – – – – – – – – – – – –<br />
Derivatives – interest 378 (170) – 170 – – – – – – – – –<br />
rate swaps<br />
Total increase/(decrease) (167) – 167 – – – – – – (2) – 2<br />
Explanation of interest rate risk sensitivity<br />
The interest rate sensitivity is based on a reasonable possible movement in interest rates, with all other variables held constant,<br />
measured as a basis points (bps) movement. For example, a decrease in 100 bps is equivalent to a decrease in interest rates of<br />
1.00%.<br />
The sensitivity for derivatives (interest rate swaps) has been calculated using a derivative valuation model based on a parallel<br />
shift in interest rates of -100bps/+100bps (2011: -100bps/+100bps).<br />
Explanation of foreign exchange risk sensitivity<br />
The foreign exchange sensitivity is based on a reasonable possible movement in foreign exchange rates, with all other variables<br />
held constant, measured as a percentage movement in the foreign exchange rate.<br />
No sensitivity for derivatives (forward foreign exchange contracts) has been calculated for 2012 or 2011 since the Company had<br />
no forward foreign exchange contracts in place.<br />
Explanation of other price risk sensitivity<br />
The sensitivity for listed shares has been calculated based on a –10%/+10% (2011: -10%/+10%) movement in the quoted bid<br />
share price at balance date for the listed shares.<br />
FAIR VALUE HIERARCHY<br />
For those instruments recognised at fair value in the statement of financial position, fair values are determined according<br />
to the following hierarchy:<br />
– Quoted market price (level 1) - Financial instruments with quoted prices for identical instruments in active markets.<br />
– Valuation technique using observable inputs (level 2) - Financial instruments with quoted prices for similar instruments<br />
in active markets or quoted prices for identical or similar instruments in inactive markets and financial instruments<br />
valued using models where all significant inputs are observable.<br />
– Valuation techniques with significant non-observable inputs (level 3) - Financial instruments valued using models where<br />
one or more significant inputs are not observable.<br />
46
Note 24 continued...<br />
The following table analyses the basis of the valuation of classes of financial instruments measured at fair value in the statement<br />
of financial position:<br />
2012 Valuation Technique<br />
In Thousands of New Zealand Dollars Total Level 1 Level 2 Level 3<br />
Financial assets<br />
Available-for-sale investments (shares) 22 22 – –<br />
Financial liabilities<br />
Derivatives – interest rate swaps 397 – 397 –<br />
2011 Valuation Technique<br />
In Thousands of New Zealand Dollars Total Level 1 Level 2 Level 3<br />
Financial assets<br />
Available-for-sale investments (shares) 18 19 – –<br />
Financial liabilities<br />
Derivatives – interest rate swaps 378 – 378 –<br />
There were no transfers between the different levels of the fair value hierarchy during the year and no financial instruments fall<br />
under the level 3 category.<br />
Changing a valuation assumption to a reasonable possible alternative assumption would not significantly change fair value.<br />
25 COMMITMENTS AND CONTINGENT LIABILITIES<br />
Capital expenditure commitments<br />
As at 30 June 2012, South Port Group has two material capital expenditure commitments (2011: nil):<br />
• Balance payable on further paving work contracted which is due to be completed by October 2012. The balance of the work<br />
to be completed is worth approximately $320,000 and will be paid upon completion of the work;<br />
• The construction of a new 5,900m2 dry warehouse at an estimated cost of $4.5m which is expected to be completed by<br />
March 2013.<br />
Operating lease commitments<br />
Gross commitments under non-cancellable operating leases for the Group:<br />
In Thousands of New Zealand Dollars 2012 2011<br />
Within one year 123 63<br />
One to five years 262 82<br />
More than five years 272 —<br />
657 145<br />
Operating lease commitments relate to two forklift leases with Forklifts NZ Limited which expire in 2013 and a ten year land<br />
lease commitment with KiwiRail Limited for the lease of a parcel of land situated on the Island Harbour, Bluff.<br />
Contingent liabilities<br />
There are no known material contingent liabilities (2011: nil).<br />
47
26 NET CASH FLOW FROM OPERATING ACTIVITIES<br />
The following is a reconciliation between the surplus after taxation shown in the statement of comprehensive income and the<br />
net cash flow from operating activities<br />
Group<br />
Company<br />
In Thousands of New Zealand Dollars 2012 2011 2012 2011<br />
Surplus after taxation 5,989 6,258 5,991 6,259<br />
Add/(less) items classified as investing/financing activities<br />
Foreign exchange (gain)/loss 24 156 24 156<br />
24 156 24 156<br />
Add/(less) non-cash items<br />
Depreciation 2,376 2,187 2,376 2,187<br />
Net (gain)/loss on disposal (388) 53 (388) 53<br />
Decrease/(increase) in value of forward<br />
exchange contracts and interest rate swaps 19 (117) 19 (117)<br />
(Decrease)/increase in deferred tax liability 198 (1,352) 200 (1,355)<br />
2,205 771 2,207 768<br />
Add/(less) movement in working capital<br />
Decrease/(increase) in trade debtors and other receivables (1,053) 3,932 (1,043) 3,928<br />
(Decrease)/increase in trade creditors and other payables (85) 706 (91) 701<br />
(Decrease)/increase in the provision for income tax (359) 983 (363) 987<br />
(1,497) 5,621 (1,497) 5,616<br />
Net cash provided by operating activities 6,721 12,806 6,725 12,799<br />
27 SEGMENTAL REPORTING<br />
The South Port Group operates in the Port Industry in Southland, New Zealand, and therefore only has one reportable segment<br />
and one geographical area based on the information as reported to the chief operating decision maker on a regular basis.<br />
South Port engages with one major customer which contributed individually greater than ten percent of its total revenue. The<br />
customer contributed $6.95 million for the year ended 30 June 2012 (2011: $7.85 million). For the twelve months ended 30 June<br />
2011, there was one other customer who also contributed individually greater than ten percent of total revenue at $2.93 million<br />
(2012: less than 10% of revenue).<br />
28 related party transactions<br />
During the year South Port New Zealand Limited provided cold storage facilities and leased warehousing, land and wharf<br />
facilities to Sanford Limited for $1.01 million (2011: $848,000). Sanford Limited debtors balance at 30 June 2012 was $99,000. Mr<br />
T.M. Foggo, a Director of South Port New Zealand Limited is the Southland Manager of Sanford Limited. All of these transactions<br />
were conducted on an arm’s length basis at market rates.<br />
All balances owing by Sanford are due by the 20th of the month following invoice and all overdue invoices are subject to<br />
interest on arrears. During the year ended 30 June 2012 no amounts invoiced to Sanford were written off as bad debts or<br />
included in the doubtful debts provision at balance date (2011: nil).<br />
Controlling entity<br />
Southland Regional Council owns 66.48% of the ordinary shares in South Port New Zealand Limited. During the year there were<br />
no material transactions with this related party.<br />
Please refer to note 29 for additional related party transactions disclosed separately in relation to the Company’s subsidiary<br />
Awarua Holdings Limited.<br />
48
29 INVESTMENT IN SUBSIDIARY COMPANY<br />
Awarua Holdings Limited is 100% owned by South Port New Zealand Ltd and has been consolidated into the South Port New<br />
Zealand Limited Group results. Awarua Holdings Limited provides management and administration services to South Port New<br />
Zealand Limited based on market rates for the services provided.<br />
All balances owed to Awarua Holdings Limited by South Port NZ Ltd are classified as inter-entity receivables and are repayable<br />
on demand. During the year ended 30 June 2012 no amounts invoiced by Awarua Holdings Limited were written off as bad<br />
debts or included in the doubtful debts provision at balance date (2011: nil).<br />
Total management fees paid to Awarua Holdings Ltd during the year were $946,000 (2011: $863,000).<br />
30 SUBSEQUENT EVENTS<br />
In late July 2012 South Port entered into an agreement to purchase the cold storage business of Southland Cool Stores Ltd located<br />
at Bluff. The transaction was dependent on the successful outcome of a due diligence process and it was subsequently confirmed<br />
that the business acquisition would proceed. A long term lease of the former Southland Cool Stores premises was executed as<br />
part of the transaction and integration of this operating site with South Port’s existing cold storage division is now underway.<br />
On 23 August 2012 the Board declared a final dividend for the year to 30 June 2012 for 14.50 cents per share amounting<br />
to approximately $3.804 million (before supplementary dividends). (2011: Final dividend declared for 14.50 cents per share<br />
amounting to approximately $3.804 million.)<br />
31 AUTHORISATION FOR ISSUE<br />
The Chief Executive, Mark O’Connor, Finance Manager, Lara Stevens, and Directors certify that these Financial Statements<br />
comply with generally accepted accounting standards and New Zealand equivalents to International Financial <strong>Report</strong>ing<br />
Standards (NZ IFRS) and International Financial <strong>Report</strong>ing Standards (IFRS), and present a true and fair view of the financial<br />
affairs of the Company. This being the case, the Directors authorised the Financial Statements for issue on 23 August 2012.<br />
49
Financial and Operational Five Year Summary<br />
In Thousands of New Zealand Dollars 2012 2011 2010 2009 2008<br />
FIVE YEAR GROUP FINANCIAL SUMMARY<br />
Revenue 26,465 25,343 22,937 20,077 15,369<br />
Net operating surplus 8,367 8,503 7,453 5,684 4,039<br />
Group surplus 5,989 6,258 3,129 4,118 2,512<br />
Operating cashflow 6,721 12,806 4,942 6,459 3,687<br />
Shareholders distributions paid 5,247 4,722 3,542 2,951 2,033<br />
Total shareholders’ equity 29,572 28,827 27,287 27,700 27,129<br />
Net interest bearing debt 1,200 300 1,950 — 150<br />
Property, plant and equipment 29,760 30,500 26,068 25,226 22,295<br />
Capital expenditure 2,648 6,810 3,598 4,876 1,459<br />
Total assets 34,812 33,907 33,715 31,539 29,234<br />
Interest cover (times) 25.4 26.0 85.7 407.0 48.0<br />
Shareholders’ equity ratio 84.9% 85.0% 80.9% 87.8% 92.8%<br />
Return on shareholders’ funds* 20.5% 22.3% 11.4% 15.0% 9.4%<br />
Return on assets* 25.3% 26.2% 23.1% 18.8% 14.0%<br />
Earnings per share 22.8c 23.9c 11.9c 15.7c 9.6c<br />
Operating cashflow per share 25.6c 48.8c 18.8c 24.6c 14.1c<br />
Dividends paid per share 20.00c 18.00c 13.50c 11.25c 7.75c<br />
Net asset backing per share $1.13 $1.10 $1.04 $1.06 $1.03<br />
* Based on average of period start and year end balances<br />
2012 2011 2010 2009 2008<br />
OPERATIONAL SUMMARY<br />
Cargo throughput (000’s tonnes) 2,691 2,636 2,169 1,863 2,249<br />
Cargo ship departures 328 336 284 252 246<br />
Gross registered tonnage (000’s tonnes) 4,926 5,057 4,243 3,880 3,455<br />
Number of full-time employees 65 63 60 60 49<br />
Total cargo ship days in port 597 749 687 635 751<br />
Turn-around time per cargo ship (days) 1.82 2.23 2.42 2.52 3.05<br />
Cargo tonnes per ship 8,204 7,845 7,637 7,392 9,142<br />
Dry warehousing capacity (m 2 ) 27,400 27,400 27,400 27,400 21,500<br />
Cold/cool storage capacity (m 3 ) 39,500 39,500 39,500 39,500 39,500<br />
50
Glossary of Port and Shipping Terms<br />
Bollard – Post on wharf, ship or tug for securing lines.<br />
Bollard Pull – Bollard pull refers to a test of a tug’s capability to pull,<br />
measuring how many tonnes of pull are being applied.<br />
Breakbulk – General cargo, as opposed to cargo in containers. Also referred<br />
to as conventional cargo. Can include cargo in packages, pallets or bulk<br />
form (dry or liquid).<br />
Bulk – Cargo moved in bulk form, such as gypsum (dry bulk) or diesel<br />
(bulk liquid).<br />
Bund – Area designed to contain any spills.<br />
Cargo Consolidation – Packing cargo (usually into containers). Unpacking<br />
is referred to as deconsolidation or devanning.<br />
Carter’s Note – A carter’s note is documentation provided when cargo is<br />
sent from the location where it is packed to the port for loading. It contains<br />
shipping instructions.<br />
Chart Datum – Depth of water at the lowest astronomical tide (spring tide).<br />
Coastal Services – Shipping service between ports within New Zealand.<br />
Container – Metal box structure of standard design, used to carry cargo in<br />
units. Containers can be 20 or 40 foot in length. The standard measure of<br />
a container is a TEU (20-foot equivalent unit). Container ships are specially<br />
designed to carry containers in slots (or cells). Containers are stacked and<br />
restrained (lashed) at all four corners by vertical posts. Some shipping lines<br />
now charter container slots on vessels operated by different companies.<br />
Container Crane – Large gantry crane specially designed to stow (load)<br />
and discharge (unload) containers from a ship.<br />
Container Terminal – Facility designed to handle containers, with specialpurpose<br />
equipment such as container cranes, straddle carriers and<br />
container stacking areas.<br />
Crane Rate – A measure of productivity based on the number of<br />
containers moved. Usually expressed as number of TEUs per gross<br />
hour per crane.<br />
Dwell Time – The length of time cargo remains in port before being<br />
loaded onto a ship or collected for domestic distribution.<br />
Hoist / Fork Hoist – Heavy forklift machine used for lifting and stacking<br />
containers and cargo.<br />
Hub Port / Service – Refers to the practice where shipping lines call<br />
at one port in a country or region, rather than at several ports.<br />
Hydrographic Survey – Scientific mapping of the sea bed for<br />
navigation.<br />
Gate/Gatehouse – Entry to wharf or terminal areas.<br />
Intermodal – Refers to the handling of containers between different<br />
forms of transport (ship-to-ship, inter-terminal, rail, truck).<br />
Internal Movement Vehicle – Heavy-haul truck used to move<br />
containers between facilities within the port.<br />
Lash – Containers stacked on the deck of a ship are secured (lashed)<br />
at all four corners by wires or rods.<br />
Line Handling – Task of securing lines to the wharf when a vessel<br />
berths.<br />
Marine Services – On-water services, such as piloting, towing and<br />
line handling for vessels as they arrive, depart or are moved between<br />
berths.<br />
Mudcrete – Soil mixed with cement used to form a quick-drying,<br />
solid reclamation in a marine environment.<br />
Piers – Floating pontoons used in marinas to provide access to<br />
recreational craft.<br />
Pilotage – Activity where a pilot guides a vessel within harbour limits<br />
to ensure navigational safety.<br />
Reach Stacker – Heavy hoist machine that stacks containers.<br />
Receiving & Delivery – Export cargo is received into the port and<br />
import cargo is delivered to truck or rail.<br />
Reefer Container – See refrigerated container.<br />
Refrigerated Container – Controlled temperature container suitable<br />
for chilled or frozen cargoes. Also referred to as reefer container.<br />
A reefer container can be a porthole (must be fitted with or to<br />
refrigerating equipment) or an integral (has built-in refrigeration<br />
equipment).<br />
Roll-On, Roll-Off Vessel – Referred to as ro-ro. A ship which has a<br />
ramp allowing cargo to be driven on and off. Cargo which is driven<br />
on and off is ro-ro cargo.<br />
Spreader – Device used to lift containers with a locking mechanism<br />
at each corner. Used on container cranes, straddle carriers or other<br />
machinery to lift containers.<br />
Stevedore – Individual or company employed to load and unload<br />
a vessel.<br />
Straddle Carrier – Large machine that straddles a container, lifts and<br />
moves it within a container yard. Capable of straddling a single row<br />
of containers three-high.<br />
Teu – 20-foot equivalent unit is the international standard measure<br />
of containers.<br />
Towage – Where a tug tows or manoeuvres a vessel into or out of<br />
a berth.<br />
Trans-Ship – Cargo landed at a terminal and shipped out again on<br />
another vessel without leaving the port area. Can be international (a<br />
container arrives from one country and is trans-shipped to another)<br />
or domestic (a container arrives from overseas and is trans-shipped<br />
to another New Zealand port by a coastal service).<br />
Turnaround Time – Time taken for a vessel to arrive in port, unload,<br />
reload and depart. Also refers to the time taken for a truck to arrive<br />
in port and deliver or receive cargo.<br />
51
South Port Management, from left: Russell Slaughter, Nigel Gear, Lara Stevens, Mark O’Connor, Geoff Finnerty, Steve Kellett.<br />
Directory<br />
DIRECTORS<br />
Rex Chapman – Chairman<br />
Rick Christie<br />
Philip Cory-Wright<br />
Thomas Foggo<br />
Graham Heenan<br />
Jeremy McClean<br />
CORPORATE EXECUTIVES<br />
Mark O’Connor – Chief Executive<br />
Russell Slaughter – Port General Manager<br />
Geoff Finnerty – Cargo Operations Manager<br />
Nigel Gear – Commercial Manager<br />
Steve Kellett – Cold Store Manager<br />
Lara Stevens – Finance Manager<br />
GROUP COMPANIES<br />
Parent Company: South Port New Zealand Limited<br />
Subsidiary: Awarua Holdings Limited<br />
AUDITOR<br />
WHK as Agent for the Controller and Auditor General<br />
173 Spey Street, Invercargill 9810<br />
SOLICITORS<br />
Preston Russell Law<br />
92 Spey Street, Invercargill 9810<br />
AWS Legal<br />
151 Spey Street, Invercargill 9810<br />
BANKERS<br />
HSBC<br />
Level 11, HSBC Tower, 62 Worcester Boulevard,<br />
Christchurch 8013<br />
ACCOUNTANTS<br />
McIntyre Dick & Partners<br />
160 Spey Street, Invercargill 9810<br />
SHARE REGISTER<br />
Link Market Services Limited<br />
138 Tancred Street, Ashburton 7700<br />
REGISTERED OFFICE<br />
Island Harbour, PO Box 1, Bluff 9842<br />
CONTACT DETAILS<br />
Telephone +64 3 212 8159<br />
Facsimile +64 3 212 8685<br />
Email reception@southport.co.nz<br />
Website www.southport.co.nz<br />
52
Southern Region<br />
Production Locations<br />
Queenstown<br />
KM from Bluff<br />
1 Ravensdown ...........................0<br />
RD1 ....................................0<br />
Sanford Bluff ............................0<br />
Southfish ..............................0<br />
Wilbur-Ellis (NZ) ........................0<br />
NZAS Tiwai Smelter ...................30<br />
Te Anau<br />
Mossburn<br />
11<br />
Lumsden<br />
Tapanui<br />
12<br />
2 Ballance Agri-Nutrients ...............15<br />
Open Country Dairy. . . . . . . . . . . . . . . . . . . 15<br />
South Pacific Meats ...................15<br />
Southwood Export .................... 15<br />
Tuatapere<br />
Winton<br />
10 62<br />
5<br />
3<br />
4<br />
Invercargill 24<br />
9<br />
Gore<br />
Mataura<br />
8<br />
7<br />
Edendale<br />
Balclutha<br />
13<br />
14<br />
3 International Specialty Aggregates .... 30<br />
Quality Foods Southland ..............30<br />
Stabicraft Marine .....................30<br />
Prime Range Meats ...................33<br />
Stewart Island<br />
Bluff<br />
1<br />
4 Niagara Sawmilling ...................38<br />
Silver Fern Farms Kennington Plant ....38<br />
Southland Veneers ....................38<br />
Blue Sky Meats ........................55<br />
5 Alliance Lorneville Plant ...............40<br />
Alliance Makarewa Plant ..............45<br />
Pyper’s Produce ....................... 45<br />
6 Craigpine Timber .....................60<br />
NZ Growing Media ....................60<br />
Winton Stock Feed ....................60<br />
7 Fonterra Edendale ....................65<br />
8 Dongwha Patinna NZ .................70<br />
Alliance Mataura Plant ................75<br />
9 Eastern Concrete. . . . . . . . . . . . . . . . . . . . . . 80<br />
Silver Fern Farms Gore Plant ...........80<br />
10 Lindsay & Dixon. . . . . . . . . . . . . . . . . . . . . . . 88<br />
11 Silver Fern Farms Mossburn Plant .....118<br />
12 Ernslaw One .........................130<br />
13 Silver Fern Farms Balclutha Plant .....145<br />
14 Fonterra Stirling .....................145<br />
Pacific Basin vessel “Tiwai Point”<br />
arriving Stirling Point, Bluff
South Port NZ<br />
Island Harbour,<br />
PO Box 1, Bluff 9842, New Zealand<br />
Telephone +64 3 212 8159<br />
Fax +64 3 212 8685<br />
Email reception@southport.co.nz<br />
Website www.southport.co.nz<br />
Craigs Design & Print, Invercargill 165144 – Photography by Chris Howell