go digital - OC&C Strategy Consultants
go digital - OC&C Strategy Consultants
go digital - OC&C Strategy Consultants

Create successful ePaper yourself
Turn your PDF publications into a flip-book with our unique Google optimized e-Paper software.
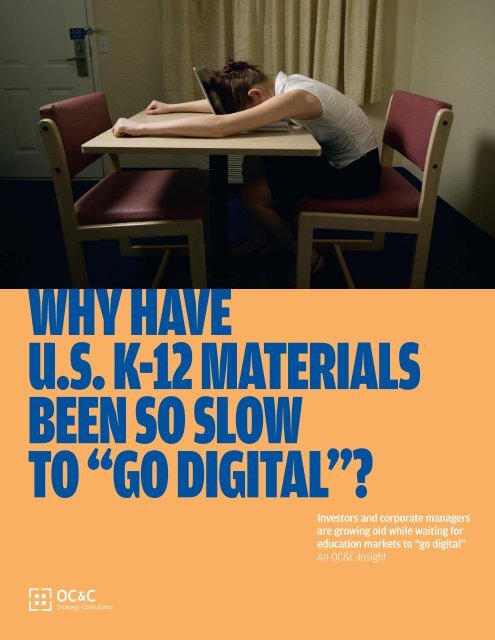
WHY HAVE<br />
U.S. K-12 MATERIALS<br />
BEEN SO SLOW<br />
TO “GO DIGITAL”?<br />
Investors and corporate managers<br />
are growing old while waiting for<br />
education markets to “<strong>go</strong> <strong>digital</strong>”<br />
An OC&C-Insight
WHY HAVE<br />
U.S. K-12 MATERIALS<br />
BEEN SO SLOW<br />
TO “GO DiGITAL”?<br />
Investors and corporate managers are growing<br />
old while waiting for education markets<br />
to “<strong>go</strong> <strong>digital</strong>”. Other information businesses<br />
have made the transition, many over a<br />
decade a<strong>go</strong>. The thesis, by analogy, is that the<br />
transition in education must be just around<br />
the corner. However, this thesis is severely<br />
flawed and some large corporates with deep<br />
experience in transitioning information businesses<br />
to <strong>digital</strong> modes have divested education<br />
assets after experiencing frustrating<br />
delays and set-backs — think Reed Elsevier<br />
(with Harcourt Education) and The Thomson<br />
Corporation (with Thomson Learning, now<br />
Cengage).<br />
The benefits of the <strong>digital</strong> transition to<br />
mission-critical information businesses are<br />
indisputable and attractive. They realize<br />
higher growth rates and profit margins as<br />
they are no longer constrained by the high<br />
fixed cost of print runs and versioning,<br />
which allows them to expand the market by<br />
developing products and services at price<br />
points along the demand curve; and, they<br />
can integrate into their customers’ workflow<br />
to deliver solutions rather than information.<br />
Figure 1<br />
Student-to-Teacher Ratio<br />
Selected Years<br />
22<br />
1969 1988 2008<br />
Source: NCES; OC&C-Analysis<br />
Figure 2<br />
17<br />
Teacher Expenditures per Student vs.<br />
Student (Grade 8) Test Scores for Public<br />
Schools %, Growth<br />
62 %<br />
Teacher Expenditures<br />
per Student<br />
(1969 – 2008)<br />
6 %<br />
NAEP Math<br />
Scores<br />
(1978 – 2008)<br />
Source: NAEP; NCES; OC&C-Analysis<br />
15<br />
4 %<br />
NAEP Reading<br />
Scores<br />
(1980 – 2008)<br />
Increase<br />
in Teacher<br />
Compensation<br />
Decline in<br />
Studentto-Teacher<br />
Ratio<br />
Below Basic<br />
(unable to<br />
keep up<br />
with gradelevel<br />
work)<br />
Basic (partial<br />
mastery<br />
of required<br />
aereas)<br />
Proficient<br />
(demonstrates<br />
competency<br />
in required<br />
areas)<br />
Advanced<br />
Real Growth in Teacher<br />
Expenditures per Student<br />
% Change<br />
36 %<br />
6 %<br />
30 %<br />
26 %<br />
12 %<br />
14 %<br />
1969 — 1988 1988 — 2008<br />
All Grade 8 Students by Achievement<br />
Level (NAEP) %, Achievement Level<br />
in Math and Reading, 2011<br />
100 % 100 %<br />
27 % 24 %<br />
39 %<br />
26 %<br />
8 %<br />
Math<br />
43 %<br />
30 %<br />
3 %<br />
Reading<br />
The fundamental driver of the higher growth<br />
rates and profits is their ability to increase<br />
the productivity of their customers’ knowledge<br />
workers. This higher worker productivity<br />
— doing more with the same number<br />
of workers or doing the same with fewer<br />
workers — generates the economic benefit<br />
that allows the customer to: 1) earn a return<br />
on the investment in the technology infrastructure<br />
that <strong>go</strong>ing <strong>digital</strong> requires; 2) pay<br />
more for the new <strong>digital</strong> services from the<br />
information provider; and, 3) pay the worker<br />
more. This is the classic substitution of an<br />
abundant and cheap resource, technology,<br />
for a scarce and expensive one, labor.<br />
The pace of the transition to <strong>digital</strong> varies<br />
proportionally with the productivity gains.<br />
This brings us back to the state of play within<br />
the education markets. “Management”<br />
(school boards, superintendents, etc.) faces<br />
severe constraints in their ability to allocate<br />
resources efficiently — including substituting<br />
technology for labor — which is limiting the<br />
pace of the transition to <strong>digital</strong>. Those constraints<br />
are related to labor, where teacher<br />
labor costs comprise c.50% of the total K-12<br />
spend. Teachers are either unionized or<br />
organized as a powerful political faction.<br />
This organized labor has been very effective,<br />
increasing employment levels relative to students<br />
and capturing real wage increases. The<br />
net result is that real teacher expenditures<br />
per student have increased by over 60% over<br />
the last 40 years (figure 1). At the same time,<br />
test scores have shown little improvement<br />
(figure 2).<br />
Absent a fundamental shift in this power<br />
structure, there will not be a rapid, productivity-driven<br />
transition to a <strong>digital</strong> education<br />
model. And without productivity gains to<br />
share, suppliers are not likely to experience<br />
accelerated growth or margin expansion.<br />
02 Why have U.S. K-12 materials been so slow to “<strong>go</strong> <strong>digital</strong>”? An OC&C-Insight<br />
Why have U.S. K-12 materials been so slow to “<strong>go</strong> <strong>digital</strong>”? An OC&C-Insight 03
Technology is a<br />
gating item as there<br />
are not sufficient<br />
devices to support<br />
intensive 1:1<br />
learning today<br />
Implications<br />
for K-12 <strong>digital</strong><br />
business models<br />
The challenges facing<br />
K-12 instructional<br />
material providers<br />
are two-fold:<br />
1.<br />
Labor costs are fixed:<br />
Suppliers are unable to offset the cost of<br />
their <strong>digital</strong> solutions with labor cost savings<br />
from the increased productivity that their<br />
offerings generate. Consequently, suppliers<br />
are largely limited to funding their offerings<br />
from existing instructional material budgets,<br />
which range between c.$100-$225 per<br />
student at the district level and c.$20-$35<br />
per student at the school level. Suppliers can<br />
also opportunistically tap into year-over-year<br />
increases in federal Title I and IDEA funds.<br />
2.<br />
One-to-one<br />
technology is not<br />
yet a reality:<br />
Technology is a gating item as there are not<br />
sufficient devices to support intensive 1:1<br />
learning today. Teachers are not demanding<br />
it: some feel it diminishes their role in the<br />
classroom while others have a general discomfort<br />
with technology and will need substantial<br />
professional development in order to<br />
use these solutions effectively. Districts and<br />
schools, to date, have also not had the financial<br />
resources to invest in <strong>digital</strong> devices for<br />
each student. At last count, this ratio was<br />
approximately c.3 students per <strong>digital</strong>lyenabled<br />
computer. (We have not seen a<br />
“device”-to-student ratio and would estimate<br />
that it brings the ratio closer to 2.5).<br />
This lack of 1:1 technology places a limit on<br />
the amount and type of instruction that can<br />
be delivered <strong>digital</strong>ly within the school:<br />
either a few students can use it intensively<br />
or most students can use it occasionally.<br />
Absent a significant investment by the<br />
districts / schools or an innovative business<br />
model bundling devices and <strong>digital</strong> solutions<br />
within existing budgets, it is currently not<br />
possible for all students to use <strong>digital</strong> solutions<br />
intensively. Keep an eye on Amplify,<br />
who is trying to resolve this issue with a<br />
low cost tablet and full curriculum offering.<br />
The successful <strong>digital</strong> business models<br />
work within these constraints. The solutions<br />
typically focus on individualizing instruction.<br />
This is the most labor-intensive element of<br />
teaching: Whole class and group instruction<br />
require much less time per student. The<br />
fundamental value proposition is using technology<br />
to augment scarce teacher time and<br />
relieve the bottleneck resource.<br />
The largest market segments are for <strong>digital</strong><br />
solutions that attempt to improve outcomes<br />
for struggling students. These students are<br />
a subset of the overall population and there<br />
is a sufficient technology infrastructure in<br />
place to allow solutions that require intensive<br />
computer use. These solutions are sold<br />
at the district level. The big picture economic<br />
proposition is preventing drop-outs, which<br />
cost the district c.$5.7K of state funding per<br />
student per year. While district funding for<br />
instructional materials for these students<br />
varies significantly, it is on the order of $225<br />
per student and often incorporates federal<br />
sources such as Title I and IDEA. There are<br />
three significant market segments where<br />
this model is working:<br />
• Comprehensive intervention programs:<br />
These programs are designed to help<br />
Tier II or III intervention students get back<br />
on track. They include more ri<strong>go</strong>rous and<br />
frequent assessments in comparison to<br />
the traditional curriculum. These students<br />
are at risk, either in the near-term or<br />
future, of dropping out and are also the<br />
core focus of the No Child Left Behind Act<br />
(NCLB).<br />
• Target student: Subset of students<br />
who have fallen behind (Tier II/III<br />
students), most often in elementary<br />
or middle schools<br />
• Price point: $200-$900, typically in<br />
the form of perpetual student licenses<br />
• Usage: Intensive<br />
• Example companies pursuing this<br />
approach: Scholastic (Read 180 /<br />
System 44), Scientific Learning<br />
• Digital credit recovery courses:<br />
These courses are taken by a subset of<br />
students, who have failed a course and<br />
are hence drop-out risks. Digital credit<br />
recovery courses provide these students<br />
with enhanced flexibility (e.g. they can<br />
take the course in off-school hours, start<br />
mid-semester, etc.) and enable them to<br />
focus on the areas where they are less<br />
proficient. They are also designed to replace<br />
time a teacher would have to otherwise<br />
spend working individually with the<br />
student).<br />
• Target student: Subset of students,<br />
who are often drop-out risks<br />
• Average price-point: Pricing models<br />
are evolving and include a range of<br />
offerings, including single course per<br />
student, full suite per student, concurrent<br />
licenses and offerings with or<br />
without a teacher. As an example,<br />
single course licenses (per student)<br />
can cost c$40-$100 (no virtual instructor)<br />
while per student access to all<br />
courses can range from c$150-$250<br />
• Usage: Intensive<br />
• Example companies pursuing this<br />
approach: Apex Learning, PLATO,<br />
Aventa Learning (owned by K12 Inc.),<br />
Pearson, Compass Learning, Edgenuity<br />
• Digital supplemental intervention<br />
solutions: These solutions deliver individualized<br />
instruction to students to supplement<br />
the core instruction. They are aimed<br />
at students who need targeted help in<br />
specific areas (e.g. phonics) but do not<br />
require a comprehensive program.<br />
• Target student: Also a subset of<br />
students who have fallen behind (Tier<br />
II/III students), typically in elementary<br />
or middle school<br />
• Price point: $10-$70<br />
• Usage: moderately intensive<br />
• Examples of companies pursuing<br />
this approach, Carnegie Learning,<br />
Cambium Learning (Sopris)<br />
There are two additional scale market<br />
segments for <strong>digital</strong> solutions. One business<br />
model is targeted at schools and the other is<br />
targeted at districts:<br />
• Digital supplemental solutions:<br />
These solutions save the teacher time by<br />
automating routine tasks teachers perform<br />
while personalizing instruction for each of<br />
their students. They are the only <strong>digital</strong><br />
solutions that have highly penetrated the<br />
general student population. These solutions<br />
get around the technology bottleneck by<br />
being designed for less frequent, less<br />
intense usage. These solutions are typically<br />
sold to schools (where teachers are the<br />
primary advocates) and are priced within<br />
their supplemental material budgets of<br />
$20-$35 per student.<br />
• Target student: All students<br />
• Average price point: $4-$15 per<br />
student<br />
• Usage: Designed to be used by most<br />
of the students some of the time to<br />
overcome the technology barrier<br />
• Example companies pursuing this<br />
approach: Edmentum, Renaissance<br />
Learning, Capstone Digital<br />
• Digital courses for subjects with low<br />
enrollment and/or shortages of<br />
qualified teachers: This is the only <strong>digital</strong><br />
solution sold to the district as a substitute<br />
for teaching labor. These courses are taken<br />
by a subset of students (typically in high<br />
school), so technology is not a bottleneck.<br />
Courses tend to be in subjects outside the<br />
schools’ traditional curriculum (e.g. AP<br />
levels and world languages). Hence, districts<br />
typically do not replace a teacher;<br />
rather, they offer a course they wouldn’t<br />
have otherwise offered.<br />
• Target student: Subset of students<br />
seeking low enrollment course<br />
• Average price-point: Similar to<br />
credit recovery, these price-points are<br />
evolving and vary widely based on the<br />
type of pricing model<br />
• Usage: Intensive<br />
• Example companies pursuing this<br />
approach: Apex Learning, Aventa<br />
Learning (K12 Inc.), Compass Learning,<br />
Pearson, Edgenuity<br />
04 Why have U.S. K-12 materials been so slow to “<strong>go</strong> <strong>digital</strong>”? An OC&C-Insight<br />
Why have U.S. K-12 materials been so slow to “<strong>go</strong> <strong>digital</strong>”? An OC&C-Insight 05
Conclusion<br />
Intensity of Solution Usage versus Percent of Student<br />
Utilizing Resource, K-12 Digital Learning Solutions.<br />
Figure 3<br />
Intensity of Usage<br />
Credit Recovery /<br />
Low Enrollment Courses<br />
Comprehensive<br />
Intervention Programs<br />
Digital Supplemental<br />
Intervention Solutions<br />
Digital Supplemental<br />
Solutions<br />
There has been a slow paced “<strong>digital</strong> transformation”<br />
in K-12 to date. The low-priced<br />
supplemental solution is the only segment<br />
that has highly penetrated the general<br />
student population. Inroads have also been<br />
made with solutions for subsets of students,<br />
where <strong>digital</strong> assessments are more critical<br />
to learning, intensive access to technology<br />
can be provided, additional funding streams<br />
are available, and the solutions improve the<br />
productivity of the learning and teaching<br />
workflow (figure 3). None of these offerings<br />
have resulted in a labor cost reduction<br />
and, as a result, no money has been freed<br />
up for purchases of technology devices or<br />
additional instructional materials/solutions.<br />
There are potential catalysts to the <strong>digital</strong><br />
transformation but their impact — both<br />
timing and magnitude — is uncertain as<br />
they require substantial changes to highly<br />
bureaucratic administrative policies across<br />
thousands of distinct organizations. There<br />
is sufficient money in the system to fund<br />
technology solutions that deliver improved<br />
productivity and better results but it will<br />
need to be redeployed. As an example,<br />
increasing the student-to-teacher ratio from<br />
c.15 to c.16-17 would result in savings that<br />
could pay for devices for c.2/3 of students,<br />
in order to achieve 1:1 technology.<br />
Given this state of the K-12 environment<br />
today, in order for the pace of the <strong>digital</strong><br />
transition to accelerate, vendors need<br />
to consider the following questions and<br />
market realities when developing their<br />
solutions:<br />
Size of bubble represents<br />
relative average price of<br />
solution<br />
1.<br />
3.<br />
Which budgets are being targeted and does the<br />
solution fit? Solutions need be priced at a level<br />
where they can fit within the relevant school or<br />
district budget. Vendors need to ensure they can<br />
earn a sufficient return at those price-points, before<br />
developing their solution.<br />
2.<br />
Does the solution work with existing technology<br />
constraints? Solutions also need to be in line within<br />
today’s technology constraints (while contemplating a<br />
migration path to an environment of 1:1 access) and the<br />
inherent constraints that result from a teacher’s lack<br />
of comfort with technology. Alternatively, vendors will<br />
need to provide the technology and support along with<br />
their solution.<br />
Where does the solution add value?<br />
Solutions need to be thoughtfully crafted to make the<br />
learning and/or teaching workflow “better, cheaper, and<br />
faster”. This requires a deep understanding of the workflow<br />
and the points where technology can deliver significant<br />
benefits. Digital K-12 markets and solutions that are<br />
successful today have each done this to varying degrees.<br />
Transitioning the current textbook model to a <strong>digital</strong>-text<br />
for example, <strong>go</strong>ing <strong>digital</strong> for <strong>digital</strong>’s sake, without harnessing<br />
technology’s capabilities to improve the workflow<br />
is a high risk, low value strategy. In other sectors such<br />
as music and newspapers, this type of transition to <strong>digital</strong><br />
has proven destructive to industry profits.<br />
____________________________________________________________________________________________________________________________________<br />
If interested in discussing further, please contact:<br />
Percent of Students Utilizing Resource<br />
Chip Greene, Partner<br />
Vanessa Webb, Associate Partner<br />
OC&C <strong>Strategy</strong> <strong>Consultants</strong> OC&C <strong>Strategy</strong> <strong>Consultants</strong><br />
chip.greene@occstrategy.com vanessa.webb@occstrategy.com<br />
+1617 896 9926 +1617 896 9966<br />
06 Why have U.S. K-12 materials been so slow to “<strong>go</strong> <strong>digital</strong>”? An OC&C-Insight<br />
Why have U.S. K-12 materials been so slow to “<strong>go</strong> <strong>digital</strong>”? An OC&C-Insight 07
Offices<br />
Belo Horizonte<br />
T +55 31 3481 0092<br />
Boston<br />
T +1 617 896 9900<br />
Düsseldorf<br />
T +49 211 86070<br />
Hamburg<br />
T +49 40 4017 560<br />
Hong Kong<br />
T +852 2201 1700<br />
London<br />
T +44 20 7010 8000<br />
Mumbai<br />
T +91 22 6619 1166<br />
New Delhi<br />
T +91 11 4051 6666<br />
Paris<br />
T +33 1 58 56 18 00<br />
Rotterdam<br />
T +31 10 217 5555<br />
São Paulo<br />
T +55 11 3053 0434<br />
Shanghai<br />
T +86 21 6115 0310<br />
Warsaw<br />
T +48 22 826 2457<br />
www.occstrategy.com<br />
© OC&C <strong>Strategy</strong> <strong>Consultants</strong> 2013.<br />
Trademarks and lo<strong>go</strong>s are registered trademarks<br />
of OC&C <strong>Strategy</strong> <strong>Consultants</strong> and its licensors.<br />
04/2013