JARC Coordination Plan - Oklahoma Department of Transportation
JARC Coordination Plan - Oklahoma Department of Transportation
JARC Coordination Plan - Oklahoma Department of Transportation

Create successful ePaper yourself
Turn your PDF publications into a flip-book with our unique Google optimized e-Paper software.
February 2012
Table <strong>of</strong> Contents<br />
TABLE OF CONTENTS<br />
Table <strong>of</strong> Contents<br />
Glossary <strong>of</strong> Acronyms<br />
Section 1: Introduction <strong>of</strong> the Coordinated <strong>Plan</strong><br />
Section 2: State Demographic Pr<strong>of</strong>ile<br />
Section 3: Summary <strong>of</strong> <strong>Transportation</strong> Services<br />
Section 4: Previously Funded Projects<br />
Section 5: <strong>Transportation</strong> Gaps and Strategies<br />
Section 6: Key Issues Impacting Service Providers<br />
Section 7: Evaluation<br />
i<br />
iii<br />
1<br />
5<br />
23<br />
31<br />
35<br />
43<br />
51<br />
APPENDICES<br />
Appendix A: Funding Sources<br />
Appendix B: County Specific Data Tables<br />
Appendix C: ODOT/UWR Providers Survey<br />
A-1<br />
B-1<br />
C-1<br />
LIST OF FIGURES<br />
Figure 2.1 Population Density by County (2010)<br />
Figure 2.2 Statewide Trends for Target Populations (2000-2010)<br />
Figure 2.3: Population Age 65 and Over (2005-2009)<br />
Figure 2.4: Persons Living Below Poverty (2005-2009)<br />
Figure 2.5: Median Household Income (2005-2009)<br />
Figure 2.6: Percent <strong>of</strong> Households with no Vehicle Available (2005-2009)<br />
Figure 2.7: Counties with the Highest Target Population Concentrations<br />
Figure 3.1: Size <strong>of</strong> Service Area for Survey Respondents<br />
Figure 3.2: Types <strong>of</strong> <strong>Transportation</strong> Services Provided<br />
Figure 3.3: Agency Restrictions<br />
Figure 3.4: Statewide Vehicle Characteristics<br />
Figure 3.5: Days and Hours <strong>of</strong> Operation<br />
Figure 3.6: Sources <strong>of</strong> Funding for <strong>Transportation</strong> Services<br />
Figure 3.7: Types <strong>of</strong> <strong>Coordination</strong> with Other Agencies<br />
<strong>Oklahoma</strong> Locally Coordinated Public Transit<br />
Human Service <strong>Transportation</strong> <strong>Plan</strong><br />
7<br />
9<br />
14<br />
15<br />
16<br />
16<br />
19<br />
24<br />
24<br />
25<br />
26<br />
27<br />
27<br />
28<br />
i
Table <strong>of</strong> Contents<br />
LIST OF TABLES<br />
Table 2.1: State Comparison <strong>of</strong> Land Area, Population and Density<br />
Table 2.2: State Comparison <strong>of</strong> Population Change<br />
Table 2.3: Data Categories<br />
Table 2.4: <strong>Oklahoma</strong> Statewide Trends for Target Populations<br />
Table 2.5: Target Population Concentrations by County<br />
Table 2.6: OTSA Disability Rate for Counties less than 20,000<br />
Table 2.7: Counties in the Top 20 for Low-Income Indicators<br />
Table 2.8: Counties Exceeding the 75 th Percentile for Three or More Target<br />
Populations<br />
Table 2.9: Comparison <strong>of</strong> Population and Density for Urbanized Areas<br />
Table 2.10: Target Populations for Lawton and Norman Urbanized Areas<br />
Table 2.11: Means <strong>of</strong> <strong>Transportation</strong> to Work for State and Urbanized Areas<br />
Table 2.12: Average Travel Time for Workers 16 and up who did not Work from<br />
Home<br />
Table 4.1 : Projects Receiving Funding, 2009-2012 Program Years<br />
Table 6.1: Summary <strong>of</strong> Some Federal Human Service <strong>Transportation</strong> Funding<br />
Sources<br />
Table 7.1: Funding Mix Rating<br />
Table 7.2: Project Scope Rating<br />
Table 7.3: Consistency with Coordinated <strong>Plan</strong><br />
Table 7.4: Other Project Details<br />
Table 7.5: Criteria for Existing Projects without a Performance <strong>Plan</strong><br />
Table 7.6: Criteria for Existing Projects with a Performance <strong>Plan</strong><br />
Table B.1 County Specific Population and Density Trends<br />
Table B.2 Change in Low-Income Identifiers<br />
Table B.3 Means <strong>of</strong> <strong>Transportation</strong> to Work<br />
6<br />
6<br />
8<br />
9<br />
10<br />
13<br />
17<br />
18<br />
20<br />
20<br />
21<br />
22<br />
32<br />
45<br />
52<br />
53<br />
53<br />
54<br />
55<br />
55<br />
B-1<br />
B-3<br />
B-5<br />
<strong>Oklahoma</strong> Locally Coordinated Public Transit<br />
Human Service <strong>Transportation</strong> <strong>Plan</strong><br />
ii
GLOSSARY OF ACRONYMS<br />
Glossary <strong>of</strong> Acronyms<br />
ACOG<br />
ACS<br />
Association <strong>of</strong> Central <strong>Oklahoma</strong> Governments<br />
American Community Survey<br />
ADA Americans with Disabilities Act <strong>of</strong> 1990<br />
CART<br />
COTPA<br />
DHS<br />
FTA<br />
GIS<br />
INCOG<br />
<strong>JARC</strong><br />
KATS<br />
M.A.G.B.<br />
MTTA<br />
ODOT<br />
OTSA<br />
SAFETEA-LU<br />
SSA<br />
The <strong>Plan</strong><br />
The Committee<br />
UWR<br />
Cleveland Area Rapid Transit<br />
Central <strong>Oklahoma</strong> <strong>Transportation</strong> and Parking Authority<br />
<strong>Department</strong> <strong>of</strong> Human Services<br />
Federal Transit Administration<br />
Geographic Information System<br />
Indian Nations Council <strong>of</strong> Governments<br />
Job Access and Reverse Commute<br />
KiBois Area Rapid Transit<br />
Major Alfalfa Grant Blaine<br />
Metropolitan Tulsa Transit Authority<br />
<strong>Oklahoma</strong> <strong>Department</strong> <strong>of</strong> <strong>Transportation</strong><br />
<strong>Oklahoma</strong> Tribal Statistical Areas<br />
Safe, Accountable, Flexible, Efficient <strong>Transportation</strong> Equity Act: A<br />
Legacy for Users<br />
Social Security Administration<br />
The <strong>Oklahoma</strong> Locally Coordinated Public Transit/Human Service<br />
<strong>Transportation</strong> <strong>Plan</strong><br />
Statewide Evaluation Committee<br />
United We Ride<br />
<strong>Oklahoma</strong> Locally Coordinated Public Transit<br />
Human Service <strong>Transportation</strong> <strong>Plan</strong><br />
iii
This page is intentionally left blank.<br />
<strong>Oklahoma</strong> Locally Coordinated Public Transit<br />
Human Service <strong>Transportation</strong> <strong>Plan</strong><br />
iv
SECTION 1: INTRODUCTION TO THE PLAN<br />
Section 1: Introduction to the <strong>Plan</strong><br />
The Safe, Accountable, Flexible, Efficient <strong>Transportation</strong> Equity Act: A Legacy for Users<br />
(SAFETEA-LU), the federal transportation reauthorization bill <strong>of</strong> 2005, required a locallydeveloped<br />
and coordinated public transit/human service planning process be developed<br />
and documented in a plan. In addition, this legislation required the plan to be<br />
implemented no later than 2007 in order to receive federal funding for transit projects<br />
intended to meet the needs <strong>of</strong> target populations (elderly individuals, persons with<br />
disabilities, and low-income persons). SAFETEA-LU allows two significant changes to<br />
the standard procedures defined by previous legislation. Now, project proponents are<br />
allowed to use dollars from other federal programs to match FTA funds, and expenses<br />
related to mobility management can be considered a capital expense. These are two<br />
significant changes that allow greater flexibility for budgeting and financing human<br />
service transportation.<br />
The Federal Coordinating Council on Access and Mobility, an interdepartmental<br />
committee <strong>of</strong> eleven federal agencies established in 2004 by Presidential Executive<br />
Order, took coordination planning further by adopting the following policy statement on<br />
October 1, 2006:<br />
“Member agencies <strong>of</strong> the Federal Coordinating Council on Access and<br />
Mobility resolve that federally-assisted grantees that have significant<br />
involvement in providing resources and engage in transportation delivery<br />
should participate in a local coordinated human services transportation<br />
planning process and develop plans to achieve the objectives to reduce<br />
duplication, increase service efficiency and expand access for the<br />
transportation-disadvantaged populations as stated in Executive Order<br />
13330.”<br />
The <strong>Oklahoma</strong> <strong>Department</strong> <strong>of</strong> <strong>Transportation</strong> (ODOT) recognizes that coordination has<br />
already occurred at different levels from region to region across the State. The primary<br />
focus <strong>of</strong> the locally coordinated plan is to fund new projects that encourage increased<br />
coordination among agencies to address transportation gaps at the regional level.<br />
Purpose and Background <strong>of</strong> the <strong>Plan</strong><br />
Locally coordinated plans are intended to be specific to the transportation needs and<br />
issues throughout the State and are created to guide the development <strong>of</strong> projects to<br />
address those issues. Funding for these projects is available under three Federal<br />
Transit Administration (FTA) funding programs: Section 5310 <strong>Transportation</strong> for Elderly<br />
Persons and Persons with Disabilities, Section 5316 Job Access and Reverse<br />
Commute (<strong>JARC</strong>), and Section 5317 New Freedom (NF). For more information<br />
regarding these funding programs, see Appendix A. ODOT is the Governor’s designee<br />
for the administration <strong>of</strong> Section 5316 and Section 5317 programs for the rural and<br />
small urban areas <strong>of</strong> the state. The <strong>Oklahoma</strong> <strong>Department</strong> <strong>of</strong> Human Services (DHS)<br />
administers the Section 5310 program for the State.<br />
<strong>Oklahoma</strong> Locally Coordinated Public Transit 1<br />
Human Service <strong>Transportation</strong> <strong>Plan</strong>
Section 1: Introduction to the <strong>Plan</strong><br />
In 2007, ODOT began an extensive effort to gather data and feedback. Information was<br />
collected from United States (U.S) Census data for the State and target populations, a<br />
survey <strong>of</strong> 52 human service transportation providers, and 37 public meetings throughout<br />
the State. ODOT finalized its first locally coordinated transportation plan in January <strong>of</strong><br />
2008. The plan’s development provided an opportunity to:<br />
Assess and document transportation needs for individuals with disabilities,<br />
elderly individuals, and low-income persons<br />
Inventory available services across the State and identify areas <strong>of</strong> redundancy<br />
and gaps in service<br />
Identify and document restrictions on eligibility for funding<br />
Identify and document short- and long-range strategies to address the identified<br />
gaps in service, including mobility management strategies<br />
Identify and document coordination actions to eliminate or reduce duplication in<br />
services and strategies for more efficient utilization <strong>of</strong> resources<br />
Establish a prioritization process for projects<br />
The plan’s focus was to guide the development <strong>of</strong> projects rather than define them. The<br />
objective was to provide potential project proponents with the information necessary to<br />
develop competitive projects addressing the most pressing needs for human service<br />
and public transportation and encouraging implementation <strong>of</strong> projects through<br />
coordination with other agencies and transportation providers.<br />
Update to the <strong>Plan</strong><br />
In order for a locally coordinated plan to continue to be an effective document, certain<br />
items need to be periodically revisited and evaluated. This document serves to update<br />
the 2008 Locally Coordinated Public Transit / Human Service <strong>Transportation</strong> <strong>Plan</strong>. This<br />
has been accomplished by soliciting public feedback, analyzing the performance <strong>of</strong> past<br />
projects, providing the most currently available demographic and transportation<br />
information, identifying gaps that have been addressed and recognizing issues that<br />
require further attention.<br />
Summary <strong>of</strong> Public Meetings<br />
A series <strong>of</strong> roundtable meetings were held at locations across the State <strong>of</strong> <strong>Oklahoma</strong> to<br />
obtain input from stakeholders (residents, transportation providers and human service<br />
agencies) to be used in developing the <strong>Oklahoma</strong> Locally Coordinated Public<br />
Transit/Human Service <strong>Transportation</strong> <strong>Plan</strong> (the <strong>Plan</strong>). A total <strong>of</strong> nine meetings were<br />
held between November 29 and December 1, 2011 at the following locations: Ponca<br />
City, Sand Springs, Okmulgee, Woodward, McAlester, Weatherford, Durant, Lawton,<br />
and Norman. ODOT staff announced these meetings in over 100 newspapers across<br />
the State and DHS contacted an additional 25 newspapers. Personal invitations were<br />
sent to approximately 700 key individuals and agencies though email or postcard.<br />
<strong>Oklahoma</strong> Locally Coordinated Public Transit 2<br />
Human Service <strong>Transportation</strong> <strong>Plan</strong>
The agenda for these meetings covered the following topics:<br />
Section 1: Introduction to the <strong>Plan</strong><br />
Background information and funding requirements for Section 5310 – Elderly<br />
Individuals and Individuals with Disabilities, Section 5316 – <strong>JARC</strong> Program, and<br />
Section 5317 – NF Program<br />
Description <strong>of</strong> recently funded projects<br />
Overview <strong>of</strong> the responses to the provider survey and demographic analysis<br />
Discussion on Gaps, Barriers, and <strong>Coordination</strong> Opportunities<br />
Next steps and application schedule<br />
The meetings started with staff presenting background information on the coordination<br />
plan and available funding sources followed by a synopsis <strong>of</strong> the projects receiving<br />
funding for Fiscal Year (FY) 2012 and the progress being made to address some <strong>of</strong> the<br />
gaps identified in the 2008 <strong>Plan</strong>. Next, staff discussed the provider inventory and<br />
demographic analysis. Finally, participants were asked to comment and make<br />
suggestions regarding other potential gaps and issues that had not yet been identified.<br />
Meetings were kept informal, giving attendees the opportunity to ask questions about<br />
the information being presented and make comments on the plan development<br />
process at any point during the session.<br />
At all nine meetings the majority <strong>of</strong> questions and comments related to the exchange <strong>of</strong><br />
information. A few providers were interested in the analysis from the demographic<br />
study or provider survey and asked for more detailed follow-up information. In Lawton,<br />
it was suggested to upload the transit provider inventory database onto the ODOT<br />
website, to make it easier for providers to find nearby services for collaboration. In<br />
Norman, it was reemphasized that the database could be used for a statewide mobility<br />
manager program. Further support for a mobility manager network came up in<br />
Weatherford, along with a request for a consolidated multi-agency service provider<br />
map. It should be noted that this type <strong>of</strong> map already exists, and the majority <strong>of</strong><br />
questions and requests were for information or programs that are already available, but<br />
not widely known. All <strong>of</strong> this emphasized the need for a more centralized and effective<br />
way <strong>of</strong> disseminating transportation information to human service / transportation<br />
providers as well as to the general public.<br />
Reauthorization<br />
The federal highway and transit program’s funding legislation, SAFETEA-LU, expired in<br />
September <strong>of</strong> 2009 and has been operating on a series <strong>of</strong> short-term extensions since<br />
that time. The eighth <strong>of</strong> these extensions occurred on September 16, 2011, when<br />
President Obama approved House Bill 2887 to extend funding through March 31,<br />
2012. At the time <strong>of</strong> this <strong>Plan</strong> update, a multi-year reauthorization <strong>of</strong> the SAFETEA-LU<br />
legislation is anticipated but has yet to occur. Such reauthorization may result in<br />
significant changes to current funding programs and levels. In that event, an update to<br />
this <strong>Plan</strong> will be necessary to address the new legislation.<br />
<strong>Oklahoma</strong> Locally Coordinated Public Transit 3<br />
Human Service <strong>Transportation</strong> <strong>Plan</strong>
Section 1: Introduction to the <strong>Plan</strong><br />
This page is intentionally left blank.<br />
<strong>Oklahoma</strong> Locally Coordinated Public Transit 4<br />
Human Service <strong>Transportation</strong> <strong>Plan</strong>
Section 2: State Demographic Pr<strong>of</strong>ile<br />
SECTION 2:<br />
STATE DEMOGRAPHIC PROFILE<br />
The purpose <strong>of</strong> the <strong>Plan</strong> is to identify the transportation needs <strong>of</strong> three target populations<br />
and develop strategies for addressing those needs. Reviewing population characteristics<br />
is helpful in transportation planning because it can provide a better understanding <strong>of</strong><br />
potential needs <strong>of</strong> different population groups and identify groups who may be<br />
underserved by the existing transportation system. For the <strong>Plan</strong>, particular focus is<br />
placed on three target populations: 1) the elderly, 2) persons with disabilities, 3) and lowincome<br />
persons.<br />
To identify potential target populations and understand population distributions<br />
throughout <strong>Oklahoma</strong>, socioeconomic and demographic data was collected and<br />
reviewed. Data sources include the decennial Census and the American Community<br />
Survey (ACS), undertaken by the U.S. Census Bureau and the U.S. Social Security<br />
Administration (SSA). It is important to note that the most currently available data has<br />
been collected. One caveat is that much <strong>of</strong> the data released by the U.S Census Bureau<br />
is based on a statistical sampling process, including most data for years beyond 2000.<br />
For purposes <strong>of</strong> the <strong>Plan</strong>, data has been collected at the small urban, county, and state<br />
level. The small urban areas with population between 50,000 and 199,999 are Lawton<br />
and Norman. Urban areas with a population <strong>of</strong> 200,000 or more (<strong>Oklahoma</strong> City and<br />
Tulsa) are considered large urban areas and are responsible for their own transportation<br />
plans. A great effort was made to obtain the most current data for all <strong>Oklahoma</strong> counties.<br />
Where current information was not available, data from previous years and/or regional<br />
data was included to provide the most complete picture <strong>of</strong> trends across the state.<br />
Over the past decade, the state has shown slow but steady growth, with an 8.7 percent<br />
increase in population. In general, population has increased more around urban counties<br />
and has stagnated or declined in rural areas. Since 2000, the percentage <strong>of</strong> people over<br />
age 65 has increased while the percent <strong>of</strong> people with a disability has declined. Although<br />
overall poverty levels have risen slightly across the state, vehicle ownership has<br />
improved. State, county, and small urban demographic information is provided in this<br />
section. Detailed county information, as well as, comparison <strong>of</strong> 2000 and 2010 U.S.<br />
Census data is provided in Appendix B.<br />
State and Countywide Population Characteristics<br />
One <strong>of</strong> the greatest determinants <strong>of</strong> transportation need is total population and<br />
population concentration or density. According to the 2010 U.S. Census, <strong>Oklahoma</strong> had<br />
a total population <strong>of</strong> 3,751,351, ranking it 28 out <strong>of</strong> 52 states (inclusive <strong>of</strong> Washington<br />
DC and Puerto Rico). <strong>Oklahoma</strong> is the 19 th largest state in land area at 68,595 square<br />
miles. This means that overall, the state has a fairly dispersed population, ranking 37 th in<br />
population density at 54.7 persons per square mile. A comparison <strong>of</strong> <strong>Oklahoma</strong> to other<br />
states in FTA Region Six is shown in Table 2.1. The table shows that in comparison to<br />
neighboring states in Region Six, <strong>Oklahoma</strong> falls in the middle for total population and<br />
land area. The State’s overall population per square mile is less than Louisiana or Texas<br />
<strong>Oklahoma</strong> Locally Coordinated Public Transit 5<br />
Human Service <strong>Transportation</strong> <strong>Plan</strong>
Section 2: State Demographic Pr<strong>of</strong>ile<br />
but greater than New Mexico.<br />
Table 2.1: State Comparison <strong>of</strong> Land Area, Population and Density in FTA Region 6, 2010<br />
Land Area State 2010 State Population per State<br />
Geography<br />
(Square Miles) Rank Population Rank Square Mile Rank<br />
Arkansas 52,035 27 2,915,918 33 56.0 36<br />
Louisiana 43,204 33 4,533,372 25 104.9 26<br />
New Mexico 121,298 5 2,059,179 37 17.0 47<br />
<strong>Oklahoma</strong> 68,595 19 3,751,351 28 54.7 37<br />
Texas 261,232 2 25,145,561 2 96.3 28<br />
United<br />
States 3,531,905 -- 308,745,538 -- 87.4 --<br />
Source: 2000 and 2010 U.S. Census<br />
Recent population trends in FTA Region Six were reviewed between 2000 and 2010<br />
(see Table 2.2). In general, <strong>Oklahoma</strong> population increased at a slower pace than its<br />
neighboring states. Only Louisiana grew more slowly during that time period. <strong>Oklahoma</strong><br />
grew at a slower rate than what was found nationally for the same decade, 8.7 percent<br />
statewide versus 9.7 percent nationally.<br />
Table 2.2: State Comparison <strong>of</strong> Population Change in FTA Region 6, 2000-2010<br />
Percent<br />
Geography 2000 2010 Total Change<br />
Change<br />
Arkansas 2,673,400 2,915,918 242,518 9.1%<br />
Louisiana 4,468,976 4,533,372 64,396 1.4%<br />
New Mexico 1,819,046 2,059,179 240,133 13.2%<br />
<strong>Oklahoma</strong> 3,450,654 3,751,351 300,697 8.7%<br />
Texas 20,851,820 25,145,561 4,293,741 20.6%<br />
United States 281,421,906 308,745,538 27,323,632 9.7%<br />
Source: 2000 and 2010 U.S. Census<br />
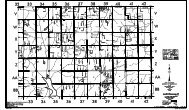
Density is an important factor for establishing public or human services transportation.<br />
Figure 2.1 on page seven exhibits the population density for each county in <strong>Oklahoma</strong>.<br />
As noted, <strong>Oklahoma</strong>’s overall population density is fairly low at 54.7 persons per square<br />
mile or 0.09 persons per acre. Only Tulsa and <strong>Oklahoma</strong> Counties have densities<br />
exceeding one person per acre, 1.65 and 1.58 persons per acre, respectively. Cleveland<br />
County has a population density <strong>of</strong> 0.74 persons per acre. The remaining counties in the<br />
state have a density <strong>of</strong> 0.2 persons per acre or less. Half <strong>of</strong> the counties (39 out <strong>of</strong> 77)<br />
have densities at or below 0.04 persons per acre. These counties represent over half<br />
(57.7 percent) <strong>of</strong> <strong>Oklahoma</strong>’s land area but only 12.9 percent <strong>of</strong> the total population.<br />
<strong>Oklahoma</strong> Locally Coordinated Public Transit 6<br />
Human Service <strong>Transportation</strong> <strong>Plan</strong>
Section 2: State Demographic Pr<strong>of</strong>ile<br />
Recent population trends between 2000 and 2010, based on U.S. Census estimates,<br />
were examined for all <strong>Oklahoma</strong> counties and the State. The counties experiencing the<br />
greatest total growth include <strong>Oklahoma</strong>, Cleveland, Tulsa, Canadian, Rogers and<br />
Wagoner counties, which each grew by more than 15,000 people over the past decade.<br />
The greatest percentage growth occurred in Canadian, Wagoner, McClain, Logan and<br />
Rogers Counties, which grew by 23 percent or more. All <strong>of</strong> the faster growing counties<br />
are located around either Tulsa or <strong>Oklahoma</strong> City. The most significant decline occurred<br />
in Jackson, Kay, Ottawa, Tillman, and McCurtain Counties. The greatest percentage<br />
decline in population occurred in Cimarron, Tillman, Grant, and Harmon Counties, each<br />
losing over ten percent <strong>of</strong> their county’s population. County-specific population gains and<br />
losses are provided in Appendix B.<br />
State and Countywide Target Population Characteristics<br />
Specific populations targeted by the <strong>Plan</strong> include the elderly, low-income, and persons<br />
with disabilities. Using U.S. Census Bureau categories, the population groups are<br />
defined by different data proxies, as shown in Table 2.3.<br />
<strong>Oklahoma</strong> Locally Coordinated Public Transit 7<br />
Human Service <strong>Transportation</strong> <strong>Plan</strong>
Table 2.3: Data Categories<br />
U.S. Census Data Proxy Population Universe Data Source<br />
Disabled Persons<br />
Civilian non-institutionalized<br />
population 5 years and over with a<br />
disability<br />
Elderly Persons*<br />
Total population <strong>of</strong> persons<br />
age 5 and over<br />
Section 2: State Demographic Pr<strong>of</strong>ile<br />
* FTA programs generally consider ages 65 and over when referring to elderly populations; however, other federal<br />
agencies have programs for which persons between the ages <strong>of</strong> 55 and 65 are eligible.<br />
Target population characteristics for <strong>Oklahoma</strong> and its counties are provided in this<br />
section. Statewide trends are discussed, followed by tabular and mapped data <strong>of</strong><br />
population concentrations for each county. Table 2.4 and Figure 2.2 on page nine show<br />
state level trends between 2000 and 2010 for the following target population indicators:<br />
Population with Disability for Persons Age Five and Over<br />
Population Age 65 and Over<br />
Persons Living Below Poverty<br />
Household Income<br />
Households with no Vehicles Available<br />
State & Urban Area: ACS, 1 year<br />
estimates<br />
Large County: 2008 ACS, 3 year<br />
estimate<br />
Small County: Not available after 2000<br />
Persons age 65 and over Total population U.S. Census, SF1 ACS 1 year estimates<br />
Low Income Persons<br />
Individuals living below poverty<br />
Median Household Income<br />
Households with no Vehicle<br />
available<br />
Total population for whom<br />
poverty status is<br />
determined<br />
Occupied Housing Units<br />
Occupied Housing Units<br />
State & Urban Area: ACS, 1 year<br />
estimates.<br />
County: 2006-2010 ACS, 5 year<br />
estimate.<br />
State & Urban Area: ACS, 1 year<br />
estimates.<br />
County: 2006-2010 ACS, 5 year<br />
estimate.<br />
State & Urban Area: ACS, 1 year<br />
estimates.<br />
County: 2006-2010 ACS, 5 year<br />
estimate.<br />
In general, the proportion <strong>of</strong> target populations within the state has remained stable. The<br />
percent <strong>of</strong> persons living below poverty and over age 65 have increased slightly, while<br />
the percent <strong>of</strong> persons with a disability and households without vehicles have decreased<br />
slightly.<br />
<strong>Oklahoma</strong> Locally Coordinated Public Transit 8<br />
Human Service <strong>Transportation</strong> <strong>Plan</strong>
Section 2: State Demographic Pr<strong>of</strong>ile<br />
Table 2.4: <strong>Oklahoma</strong> Statewide Trends for Target Populations – 2000 through 2010<br />
Census<br />
Year<br />
Percent <strong>of</strong><br />
Population<br />
with a<br />
Disability*<br />
Percent <strong>of</strong><br />
Population<br />
Age 65+<br />
Percent <strong>of</strong><br />
Population<br />
Below Poverty<br />
Status<br />
Median<br />
Household<br />
Income<br />
Percent <strong>of</strong><br />
Households<br />
with no Vehicles<br />
Available<br />
2000 21.6% 13.2% 14.7% $33,400 ** 7.0%<br />
2001 19.21% 12.9% 15.5% $33,714 6.3%<br />
2002 18.5% 12.8% 15.0% $35,568 5.8%<br />
2003 17.0% 12.6% 16.1% $35,129 5.7%<br />
2004 18.5% 12.8% 15.3% $35,357 5.4%<br />
2005 19.0% 12.9% 16.5% $37,063 5.6%<br />
2006 19.6% 13.3% 17.0% $38,770 6.0%<br />
2007 19.0% 13.2% 15.9% $41,567 5.6%<br />
2008 17.6% 13.5% 15.9% $42,822 5.9%<br />
2009 17.0% 13.4% 16.2% $41,664 5.8%<br />
2010 16.8% 13.6% 16.9% $42,072 5.7%<br />
*Percentage <strong>of</strong> non-institutionalized population over age 5 years.<br />
**Recorded in 1999 dollars, all other dollar values are for year indicated<br />
An individual may be counted in two or more categories if they meet the criteria for multiple target characteristics<br />
Source: U.S. Census 2000, 2001 ACS Supplemental Survey, 2002-2010 ACS 1-year estimates<br />
Figure 2.2: <strong>Oklahoma</strong> Statewide Trends for Target Populations: 2000-2010<br />
25.0%<br />
20.0%<br />
15.0%<br />
10.0%<br />
5.0%<br />
0.0%<br />
2000 2001 2002 2003 2004 2005 2006 2007 2008 2009 2010<br />
Percent <strong>of</strong> Population with a Disability* Percent <strong>of</strong> Population Age 65+<br />
Percent <strong>of</strong> Population Below Poverty Status<br />
Percent <strong>of</strong> Households with no Vehicles Available<br />
<strong>Oklahoma</strong> Locally Coordinated Public Transit 9<br />
Human Service <strong>Transportation</strong> <strong>Plan</strong>
Section 2: State Demographic Pr<strong>of</strong>ile<br />
Table 2.5 provides a summary <strong>of</strong> the primary indicators for each county, with more detail<br />
provided in the sections that follow. Counties equal to or exceeding the 75 th percentile for<br />
each indicator are highlighted in yellow, and the counties with the greatest concentration<br />
<strong>of</strong> persons age 65 and over, persons with disabilities, persons living below poverty,<br />
households with no vehicles available, and lowest median income are indicated with bold<br />
type. It is important to note that due to a change in the way the U.S. Census classifies<br />
the disabled population; current data is not available for every county. For further<br />
explanation <strong>of</strong> how data was used to describe the disabled population for purposes <strong>of</strong><br />
the <strong>Plan</strong>, please refer to page 12.<br />
Table 2.5: Target Population Concentrations by County<br />
County<br />
Percent Noninstitutionalized<br />
Population over<br />
Age 5 with a<br />
Disability<br />
Percent <strong>of</strong><br />
Population<br />
over Age<br />
65<br />
Percent <strong>of</strong><br />
Population<br />
with Income<br />
Below<br />
Poverty Level<br />
2010<br />
Median<br />
Household<br />
Income<br />
Percent <strong>of</strong><br />
Households<br />
with no<br />
Vehicles<br />
Available<br />
Adair 27.1% 12.9% 26.5% $29,811 5.6%<br />
Alfalfa No Data 20.2% 11.1% $42,500 2.8%<br />
Atoka No Data* 16.1% 22.5% $31,179 5.3%<br />
Beaver No Data 15.5% 12.4% $49,743 1.4%<br />
Beckham 20.6% 12.7% 16.0% $43,642 5.9%<br />
Blaine No Data 14.4% 14.8% $41,421 6.2%<br />
Bryan 21.2% 15.7% 19.1% $37,230 5.8%<br />
Caddo 19.8% 14.7% 20.9% $36,413 5.7%<br />
Canadian 12.6% 10.9% 7.9% $60,489 2.5%<br />
Carter 18.0% 14.9% 16.5% $38,385 6.8%<br />
Cherokee 21.4% 13.5% 26.3% $32,322 6.4%<br />
Choctaw No Data* 18.1% 24.6% $27,549 9.2%<br />
Cimarron No Data 21.4% 21.8% $34,096 6.1%<br />
Cleveland 12.6% 10.2% 12.1% $52,688 3.6%<br />
Coal No Data* 17.8% 21.6% $31,764 11.0%<br />
Comanche 16.4% 10.2% 17.4% $44,012 6.5%<br />
Cotton No Data 17.0% 13.1% $44,144 4.9%<br />
Craig No Data 17.4% 17.1% $39,836 4.7%<br />
Creek 19.1% 15.0% 15.4% $42,314 5.4%<br />
Custer 15.6% 13.4% 16.9% $42,108 5.7%<br />
Delaware 21.3% 20.6% 21.2% $34,383 3.9%<br />
Dewey No Data 19.9% 13.6% $39,940 2.9%<br />
Ellis No Data 19.1% 13.9% $43,032 2.4%<br />
Garfield 15.9% 15.3% 16.8% $40,636 4.7%<br />
Garvin 17.6% 17.3% 15.8% $37,785 4.2%<br />
Grady 16.0% 13.7% 14.8% $45,260 3.8%<br />
Grant No Data 21.3% 10.3% $42,043 3.5%<br />
Greer No Data 17.4% 15.6% $35,096 5.0%<br />
Harmon No Data 17.3% 26.9% $31,679 5.9%<br />
Harper No Data 18.6% 12.5% $39,946 0.5%<br />
Haskell No Data* 17.6% 12.3% $37,474 5.6%<br />
Hughes No Data* 17.2% 21.9% $32,677 6.3%<br />
Jackson 16.0% 12.9% 18.3% $41,437 7.4%<br />
Jefferson No Data 19.1% 16.7% $32,750 7.0%<br />
Johnston No Data 16.6% 19.9% $34,556 5.0%<br />
Kay 20.2% 17.0% 17.9% $39,505 5.3%<br />
<strong>Oklahoma</strong> Locally Coordinated Public Transit 10<br />
Human Service <strong>Transportation</strong> <strong>Plan</strong>
Section 2: State Demographic Pr<strong>of</strong>ile<br />
Table 2.5 Target Population Concentrations by County<br />
County<br />
Percent Noninstitutionalized<br />
Population over<br />
Age 5 with a<br />
Disability<br />
Percent <strong>of</strong><br />
Population<br />
over Age<br />
65<br />
Percent <strong>of</strong><br />
Population<br />
with Income<br />
Below<br />
Poverty Level<br />
2010<br />
Median<br />
Household<br />
Income<br />
Percent <strong>of</strong><br />
Households<br />
with no<br />
Vehicles<br />
Available<br />
Kingfisher No Data 15.0% 12.0% $49,104 2.6%<br />
Kiowa No Data 18.4% 20.2% $32,565 4.2%<br />
Latimer No Data* 17.4% 13.9% $42,639 3.9%<br />
Le Flore 22.5% 15.2% 20.7% $36,335 5.9%<br />
Lincoln 21.1% 15.3% 14.8% $42,282 4.2%<br />
Logan 14.4% 12.6% 15.0% $48,683 5.2%<br />
Love No Data 17.2% 14.2% $41,629 4.7%<br />
Major No Data 19.2% 10.3% $46,748 1.1%<br />
Marshall No Data 19.9% 14.4% $40,419 4.7%<br />
Mayes 21.5% 15.7% 16.9% $41,228 5.6%<br />
McClain 15.7% 13.2% 9.4% $53,708 1.7%<br />
McCurtain 27.2% 15.5% 27.7% $31,082 9.6%<br />
McIntosh 30.6% 21.9% 22.5% $30,620 6.0%<br />
Murray No Data 17.5% 15.5% $40,870 4.2%<br />
Muskogee 21.0% 14.7% 19.1% $37,002 8.2%<br />
Noble No Data 16.7% 13.5% $39,515 5.3%<br />
Nowata No Data 18.0% 17.6% $37,500 3.0%<br />
Okfuskee No Data 16.7% 24.6% $33,286 7.7%<br />
<strong>Oklahoma</strong> 14.9% 12.0% 16.8% $42,916 6.5%<br />
Okmulgee 24.5% 15.8% 20.3% $37,820 7.8%<br />
Osage 18.1% 15.3% 12.6% $41,125 5.1%<br />
Ottawa 23.6% 17.0% 18.2% $35,483 6.2%<br />
Pawnee No Data 16.4% 18.2% $40,059 3.8%<br />
Payne 13.2% 10.4% 23.4% $34,752 5.4%<br />
Pittsburg 25.5% 17.5% 16.7% $39,245 5.6%<br />
Pontotoc 19.7% 14.9% 20.5% $37,484 6.2%<br />
Pottawatomie 19.1% 14.3% 17.3% $40,085 6.8%<br />
Pushmataha No Data* 20.2% 27.1% $26,742 7.7%<br />
Roger Mills No Data 17.7% 11.6% $48,917 2.5%<br />
Rogers 15.1% 13.4% 9.5% $57,443 3.5%<br />
Seminole 22.8% 16.1% 23.8% $32,985 6.8%<br />
Sequoyah 22.8% 14.9% 20.9% $36,357 5.7%<br />
Stephens 18.7% 17.3% 12.2% $43,524 4.0%<br />
Texas 13.0% 10.2% 15.6% $44,623 5.2%<br />
Tillman No Data 17.7% 21.1% $29,832 6.7%<br />
Tulsa 14.7% 12.1% 15.1% $45,613 6.7%<br />
Wagoner 15.5% 12.5% 11.7% $55,487 3.0%<br />
Washington 18.8% 17.8% 13.2% $44,823 5.3%<br />
Washita No Data 17.1% 16.9% $43,039 3.9%<br />
Woods No Data 17.2% 12.1% $48,076 3.5%<br />
Woodward No Data 14.2% 12.2% $49,672 5.9%<br />
* No county data available, but was included in Choctaw OTSA with a disability rate <strong>of</strong> 24.1%<br />
Source: U.S. Census, American Community Survey<br />
75th Percentile 21.4% 17.6% 20.5% $35,096 6.3%<br />
100th Percentile 30.6% 21.9% 27.7% $26,742 11.0%<br />
<strong>Oklahoma</strong> Locally Coordinated Public Transit 11<br />
Human Service <strong>Transportation</strong> <strong>Plan</strong>
Section 2: State Demographic Pr<strong>of</strong>ile<br />
Target Population: Disabled Persons<br />
Until 2007, the U.S. Census had defined the disabled population as the civilian noninstitutionalized<br />
population age five years and over with categories <strong>of</strong> disability including<br />
sensory, self-care, mental, physical, employment and going-outside-the home<br />
disabilities. In 2008, the U.S. Census redefined disability as a long-term mental, physical<br />
or emotional condition that impacts a person’s ability to perform a certain task. In<br />
addition, disabilities are no longer reported by type, but are instead grouped by the task<br />
or function impacted. Each <strong>of</strong> the functional difficulties below is counted for the civilian,<br />
non-institutionalized population at age groups appropriate to each category:<br />
Hearing difficulty (tabulated for all ages)<br />
Vision difficulty (tabulated for all ages)<br />
Cognitive difficulty (tabulated starting at age five)<br />
Ambulatory difficulty (tabulated starting at age five)<br />
Self-care difficulty (tabulated starting at age five)<br />
Independent living difficulty (tabulated starting at age 18)<br />
This change in definition has caused the number <strong>of</strong> disabilities being reported to drop by<br />
an average <strong>of</strong> 2.8 percent across the U.S. One reason for this is the inclusion <strong>of</strong> children<br />
age zero to five, who tend to have a much lower reported rate <strong>of</strong> disability than the rest<br />
<strong>of</strong> the population. Tables 2.4 through 2.6 correct for this inconsistency by showing the<br />
disability rate calculated only for population age five and over. However, the change in<br />
categories identified still causes a noticeable decrease in the number <strong>of</strong> disabilities<br />
reported in 2008.<br />
This demographic analysis uses the ACS 2005-2009 five-year summary tables for much<br />
<strong>of</strong> the county level information as it <strong>of</strong>fers relatively current data inclusive <strong>of</strong> all 77<br />
<strong>Oklahoma</strong> Counties. However, the five-year summary tables do not include disability<br />
information because <strong>of</strong> the change in categories. Instead, 2008-2010 three-year<br />
estimates were used with the caveat that data is only reported for geographic areas with<br />
population greater than 20,000. Table 2.5 on pages 10 and 11 shows the percentage <strong>of</strong><br />
population with a disability for the 41 largest counties in <strong>Oklahoma</strong>. Data for counties<br />
grouped into <strong>Oklahoma</strong> Tribal Statistical Areas (OTSAs) was also analyzed as an<br />
approximation for the missing disability rates in all but the northern-most counties <strong>of</strong> the<br />
state. Table 2.6 lists the OTSA disability rate used for counties within an OTSA and with<br />
population less than 20,000.<br />
<strong>Oklahoma</strong> Locally Coordinated Public Transit 12<br />
Human Service <strong>Transportation</strong> <strong>Plan</strong>
Section 2: State Demographic Pr<strong>of</strong>ile<br />
Table 2.6 <strong>Oklahoma</strong> Tribal Statistical Areas Disability Rate for<br />
Counties less than 20,000 in Population<br />
County<br />
Within OTSA<br />
Disability<br />
Rate<br />
Atoka Choctaw 24.6%<br />
Blaine Cheyenne-Arapaho 17.1%<br />
Choctaw Choctaw 24.6%<br />
Coal Choctaw 24.6%<br />
Cotton Kiowa-Comanche-Apache 17.5%<br />
Craig Cherokee 19.8%<br />
Dewey Cheyenne-Arapaho 17.1%<br />
Ellis Cheyenne-Arapaho 17.1%<br />
Greer Kiowa-Comanche-Apache 17.5%<br />
Harmon Kiowa-Comanche-Apache 17.5%<br />
Haskell Choctaw 24.6%<br />
Choctaw 24.6%<br />
Hughes<br />
Creek 16.3%<br />
Jefferson Chickasaw 18.2%<br />
Johnston Chickasaw 18.2%<br />
Kiowa Kiowa-Comanche-Apache 17.5%<br />
Latimer Choctaw 24.6%<br />
Love Chickasaw 18.2%<br />
Marshall Chickasaw 18.2%<br />
Murray Chickasaw 18.2%<br />
Nowata Cherokee 19.8%<br />
Okfuskee Creek 16.3%<br />
Pushmataha Choctaw 24.6%<br />
Roger Mills Cheyenne-Arapaho 17.1%<br />
Tillman Kiowa-Comanche-Apache 17.5%<br />
Washita Cheyenne-Arapaho 17.1%<br />
In 2010, 16.8 percent <strong>of</strong> <strong>Oklahoma</strong>’s non-institutionalized, civilian population age five<br />
and over was identified with one or more disabilities. This number compares to a<br />
national average <strong>of</strong> 10.0 percent and demonstrates a drop <strong>of</strong> almost five percent since<br />
2000. Although the biggest drop occurred between 2007 and 2008 when the Census<br />
redefined its categories, there have also been small yearly decreases in disabled<br />
population every year since 2006, indicating that the trend may be downward regardless<br />
<strong>of</strong> the change in the categories. Of the Counties included in the 2010 three-year ACS<br />
data, McIntosh County had the highest percentage <strong>of</strong> population with a disability at 30.6<br />
percent while the lowest rate, 12.6 percent, occurred in both Canadian and Cleveland<br />
Counties. The only county showing a significant increase in its disabled population is<br />
Adair County, climbing from 24.4 percent in 2000 to 27.1 percent in 2010. Garvin County<br />
experienced the most noticeable decrease, with 25.6 percent reporting a disability in<br />
2000 and only to 17.6 percent reporting one in 2010.<br />
Target Population: Elderly Persons<br />
In 2010, 13.6 percent <strong>of</strong> <strong>Oklahoma</strong>’s population was age 65 and over, indicating a<br />
relatively older population than is found nationally, where only 13.0 percent <strong>of</strong> the<br />
population was age 65 and over. McIntosh County had the greatest proportion <strong>of</strong><br />
<strong>Oklahoma</strong> Locally Coordinated Public Transit 13<br />
Human Service <strong>Transportation</strong> <strong>Plan</strong>
Section 2: State Demographic Pr<strong>of</strong>ile<br />
persons age 65 and over at 21.9 percent. With a median age <strong>of</strong> 47 years, it was also the<br />
county with the oldest overall population. Cleveland, Comanche, and Texas counties are<br />
tied for lowest percentage <strong>of</strong> people over 65 (10.2 percent), but Payne County is the<br />
youngest with a median age <strong>of</strong> 27 years. <strong>Oklahoma</strong> and Tulsa counties and many <strong>of</strong> the<br />
surrounding counties have a lower than average proportion <strong>of</strong> elderly population. Figure<br />
2.3 displays the percentage <strong>of</strong> persons age 65 and over for each county.<br />
Target Population: Low-Income Persons<br />
The proportion <strong>of</strong> persons living below poverty in <strong>Oklahoma</strong> was 14.7 percent in 2000<br />
and has climbed to 16.9 percent in 2010. This compares to 14.3 percent nationally.<br />
McCurtain County had the greatest proportion <strong>of</strong> persons living below poverty at 27.7<br />
percent, while Canadian County had the least at 7.9 percent. The biggest reduction<br />
occurred in Latimer County, which has gone from 22.7 percent <strong>of</strong> its population living<br />
below poverty in 2000 to only 13.9 percent in 2010. Figure 2.4 illustrates the percentage<br />
<strong>of</strong> persons living below poverty for each county.<br />
<strong>Oklahoma</strong> Locally Coordinated Public Transit 14<br />
Human Service <strong>Transportation</strong> <strong>Plan</strong>
Section 2: State Demographic Pr<strong>of</strong>ile<br />
The median income across the state was $42,072 in 2010, compared to $50,046<br />
nationally. Pushmataha County had the lowest median income at $26,742, while<br />
Canadian County had the highest at $60,489. In 2000, the difference separating these<br />
two counties was about $23,000. Currently the gap between the richest and poorest<br />
counties is over $33,000. Many <strong>of</strong> the counties with lower household median income are<br />
located in the southeast and southwest corners <strong>of</strong> the state. Figure 2.5 on page 16<br />
illustrates the median household income by county, those counties in white or yellow are<br />
over the State average and those in orange or red are below average.<br />
The proportion <strong>of</strong> households without vehicles available in the state was 5.7 percent,<br />
which is considerably lower than the national average <strong>of</strong> 9.1 percent. Coal County had<br />
the greatest proportion <strong>of</strong> its households with no vehicles available at eleven percent,<br />
while Harper County had the lowest proportion <strong>of</strong> zero-vehicle households. In Harper<br />
County, 99.5 percent <strong>of</strong> households have access to a vehicle. Figure 2.6 exhibits the<br />
statewide characteristics <strong>of</strong> zero-vehicle households.<br />
<strong>Oklahoma</strong> Locally Coordinated Public Transit 15<br />
Human Service <strong>Transportation</strong> <strong>Plan</strong>
Section 2: State Demographic Pr<strong>of</strong>ile<br />
<strong>Oklahoma</strong> Locally Coordinated Public Transit 16<br />
Human Service <strong>Transportation</strong> <strong>Plan</strong>
Section 2: State Demographic Pr<strong>of</strong>ile<br />
Table 2.7 lists the top 20 counties with the greatest proportion <strong>of</strong> persons living below<br />
poverty, households lacking vehicles, and households with the lowest median incomes.<br />
Nine counties are in the top 20 for all three low income indicators and are shown<br />
highlighted in yellow. In Cherokee, Choctaw, Coal, Hughes, McCurtain, Okfuskee,<br />
Pushmataha, Seminole, and Tillman counties, the average household income is below<br />
$34,000, over six percent <strong>of</strong> households have no vehicle available and more than one<br />
out <strong>of</strong> every five residents lives below the poverty level.<br />
Table 2.7: Counties in the Top 20 for Low-Income Indicators<br />
Percent<br />
Below<br />
Poverty<br />
2010 Median<br />
Household<br />
Income<br />
Percent with<br />
no Vehicle<br />
County<br />
County<br />
County<br />
McCurtain 27.7% Pushmataha $26,742 Coal 11.0%<br />
Pushmataha 27.1% Choctaw $27,549 McCurtain 9.6%<br />
Harmon 26.9% Adair $29,811 Choctaw 9.2%<br />
Adair 26.5% Tillman $29,832 Muskogee 8.2%<br />
Cherokee 26.3% McIntosh $30,620 Okmulgee 7.8%<br />
Choctaw 24.6% McCurtain $31,082 Pushmataha 7.7%<br />
Okfuskee 24.6% Atoka $31,179 Okfuskee 7.7%<br />
Seminole 23.8% Harmon $31,679 Jackson 7.4%<br />
Payne 23.4% Coal $31,764 Jefferson 7.0%<br />
Atoka 22.5% Cherokee $32,322 Pottawatomie 6.8%<br />
McIntosh 22.5% Kiowa $32,565 Seminole 6.8%<br />
Hughes 21.9% Hughes $32,677 Carter 6.8%<br />
Cimarron 21.8% Jefferson $32,750 Tulsa 6.7%<br />
Coal 21.6% Seminole $32,985 Tillman 6.7%<br />
Delaware 21.2% Okfuskee $33,286 Comanche 6.5%<br />
Tillman 21.1% Cimarron $34,096 <strong>Oklahoma</strong> 6.5%<br />
Caddo 20.9% Delaware $34,383 Cherokee 6.4%<br />
Sequoyah 20.9% Johnston $34,556 Hughes 6.3%<br />
Le Flore 20.7% Payne $34,752 Pontotoc 6.2%<br />
Pontotoc 20.5% Greer $35,096 Blaine 6.2%<br />
Source: U.S. Census, American Community Survey<br />
Counties with Multiple Target Populations<br />
Table 2.8 on page 18 and Figure 2.7 on page 19 reflects the counties where the<br />
concentration <strong>of</strong> persons age 65 and over, persons with disabilities, persons living below<br />
poverty, households with no vehicles available or lowest median income exceeded the<br />
75th percentile in three or more categories. For purposes <strong>of</strong> this analysis, counties fully<br />
inside the Choctaw OTSA were assumed to have a proportion <strong>of</strong> persons with a<br />
disability exceeding the 75 th percentile due to the high percentage indicated for that<br />
region. The categories with greatest concentrations are indicated with bold type.<br />
Choctaw, Coal and Pushmataha counties have greater concentrations <strong>of</strong> the target<br />
<strong>Oklahoma</strong> Locally Coordinated Public Transit 17<br />
Human Service <strong>Transportation</strong> <strong>Plan</strong>
Section 2: State Demographic Pr<strong>of</strong>ile<br />
populations in all five categories. Cherokee, Hughes, McCurtain, McIntosh, Seminole<br />
and Tillman counties have high concentrations in four categories, and Adair, Atoka,<br />
Cimarron, Delaware, Jefferson, and Okfuskee Counties have high concentrations in<br />
three categories. Six <strong>of</strong> these counties have populations exceeding 20,000: Cherokee<br />
(46,987), Delaware (41,487), McCurtain (33,151), Seminole (24,894), Adair (22,683),<br />
and McIntosh (20,252). Geographically, nearly all <strong>of</strong> these counties are located in the<br />
eastern half <strong>of</strong> the state, east <strong>of</strong> Interstate Highway 35, with the exception <strong>of</strong> Jefferson,<br />
Tillman and Cimarron counties.<br />
Table 2.8: Counties Exceeding the 75th Percentile for 3 or more Target Populations<br />
County<br />
Percent Noninstitutionalized<br />
Population<br />
Households<br />
Percent <strong>of</strong><br />
Percent <strong>of</strong><br />
Percent <strong>of</strong><br />
2010<br />
Population<br />
Median<br />
Population over<br />
with Income<br />
with no<br />
over Age<br />
Household<br />
Age 5 with a<br />
Below<br />
Vehicles<br />
65<br />
Income<br />
Disability<br />
Poverty Level<br />
Available<br />
Adair 27.1% 12.9% 26.5% $29,811 5.6%<br />
Atoka No Data* 16.1% 22.5% $31,179 5.3%<br />
Cimarron No Data 21.4% 21.8% $34,096 6.1%<br />
Delaware 21.3% 20.6% 21.2% $34,383 3.9%<br />
Jefferson No Data 19.1% 16.7% $32,750 7.0%<br />
Okfuskee No Data 16.7% 24.6% $33,286 7.7%<br />
Cherokee 21.4% 13.5% 26.3% $32,322 6.4%<br />
Hughes No Data* 17.2% 21.9% $32,677 6.3%<br />
McCurtain 27.2% 15.5% 27.7% $31,082 9.6%<br />
McIntosh 30.6% 21.9% 22.5% $30,620 6.0%<br />
Seminole 22.8% 16.1% 23.8% $32,985 6.8%<br />
Tillman No Data 17.7% 21.1% $29,832 6.7%<br />
Choctaw No Data* 18.1% 24.6% $27,549 9.2%<br />
Coal No Data* 17.8% 21.6% $31,764 11.0%<br />
Pushmataha No Data* 20.2% 27.1% $26,742 7.7%<br />
* No county data available, but was included in Choctaw OTSA with a disability rate <strong>of</strong> 24.1%<br />
Source: U.S. Census, American Community Survey<br />
75th Percentile 21.4% 17.6% 20.5% $35,096 6.3%<br />
<strong>Oklahoma</strong> Locally Coordinated Public Transit 18<br />
Human Service <strong>Transportation</strong> <strong>Plan</strong>
Section 2: State Demographic Pr<strong>of</strong>ile<br />
Small Urbanized Area Population Characteristics<br />
Target population characteristics for the Lawton and Norman urbanized areas are<br />
included in this section. An urbanized area is one that is defined by the U.S. Census as<br />
having a geographic area with a population <strong>of</strong> 50,000 persons or more (U.S. Code, Title<br />
23, Section 101). An urbanized area does not have to follow existing political<br />
jurisdictional boundaries. Urbanized areas are subject to metropolitan transportation<br />
planning requirements as designated in U.S. Code, Title 23, Section 134 and Section 8<br />
<strong>of</strong> the Federal Transit Act and promulgated by Code <strong>of</strong> Federal Regulations, Title 23,<br />
Section 450.300. This study focuses primarily on the Lawton and Norman small urban<br />
areas, whose transportation funds are dispersed by the state. The <strong>Oklahoma</strong> City and<br />
Tulsa large urban areas receive funding through the Association <strong>of</strong> Central <strong>Oklahoma</strong><br />
Governments (ACOG) and the Indian Nations Council <strong>of</strong> Governments (INCOG),<br />
respectively. ACOG and INCOG maintain their own locally coordinated public transit /<br />
human service transportation plans and are not included in the state plan.<br />
Table 2.9 shows land area, population and density for the Lawton and Norman<br />
urbanized areas as compared to Tulsa, <strong>Oklahoma</strong> City and the State. At the time <strong>of</strong> the<br />
<strong>Plan</strong>, 2010 U.S. Census data was not available for urbanized areas, thus 2010 American<br />
Community Survey one-year population estimates were used instead. Both the Lawton<br />
and Norman urbanized areas lost population between 2000 and 2005; however,by 2010,<br />
<strong>Oklahoma</strong> Locally Coordinated Public Transit 19<br />
Human Service <strong>Transportation</strong> <strong>Plan</strong>
Section 2: State Demographic Pr<strong>of</strong>ile<br />
both areas had climbed above their initial populations. Norman appears to be growing at<br />
a faster rate than Lawton. Comparing densities across the jurisdictions, the Lawton<br />
urbanized area has the lowest population density (2.59 persons per acre) <strong>of</strong> all the<br />
urbanized areas across the State. In contrast, the Norman urbanized area has the<br />
greatest density at 5.14 persons per acre.<br />
Table 2.9: Comparison <strong>of</strong> Population and Density for Urbanized Areas<br />
Urbanized<br />
Area<br />
2000<br />
Population<br />
2010<br />
Population<br />
Total<br />
Change<br />
Percent<br />
Change<br />
Land Area<br />
(Sq. Miles)<br />
Persons per<br />
Acre (2010)<br />
Lawton 89,556 91,351 1,795 2.0% 55.2 2.59<br />
Norman 86,478 100,723 14,245 16.5% 30.6 5.14<br />
<strong>Oklahoma</strong> City 747,003 820,245 73,242 9.8% 322.2 3.98<br />
Tulsa 558,329 581,925 23,596 4.2% 261.1 3.48<br />
State Total 3,450,654 3,751,351 300,697 8.7% 68,595 0.09<br />
Source: 2000 U.S. Census, 2010 American Community Survey<br />
The population characteristics for elderly persons, low income persons and persons with<br />
disabilities within the urbanized areas <strong>of</strong> Lawton and Norman are shown in Table 2.10.<br />
As compared to statewide averages, both urbanized areas have smaller proportions <strong>of</strong><br />
persons age 65 and over and persons with a disability. Norman has the lowest<br />
percentage <strong>of</strong> these two target groups out <strong>of</strong> all the urbanized areas, while Lawton has a<br />
disability rate closer to the state average. Both Lawton and Norman have a poverty rate<br />
far exceeding the state average and even well above the rates for <strong>Oklahoma</strong> City and<br />
Tulsa. The Norman Urbanized area stands at 20.4 percent, one <strong>of</strong> the largest<br />
percentages seen in and around the urban areas. The median household income is just<br />
below the state average in Lawton and Norman and the percentage <strong>of</strong> households with<br />
no vehicle available is highest in Lawton.<br />
Table 2.10: Target Populations for Lawton and Norman Urbanized Areas<br />
Population<br />
with a<br />
Disability<br />
Population<br />
Age 65+<br />
Population<br />
Below<br />
Poverty<br />
Median<br />
Household<br />
Income<br />
No-Vehicle<br />
Households<br />
Urbanized Area<br />
Lawton 15.4% 10.3% 19.6% $41,054 7.0%<br />
Norman 11.7% 9.3% 20.4% $41,365 5.1%<br />
<strong>Oklahoma</strong> City 13.4% 11.9% 17.1% $44,186 5.7%<br />
Tulsa 14.0% 12.4% 17.5% $41,955 6.4%<br />
State Average 16.8% 13.6% 16.9% $42,072 5.7%<br />
Source: 2010 American Community Survey, 1 year estimates<br />
<strong>Oklahoma</strong> Locally Coordinated Public Transit 20<br />
Human Service <strong>Transportation</strong> <strong>Plan</strong>
Section 2: State Demographic Pr<strong>of</strong>ile<br />
Commuter Trends<br />
This section provides a snapshot <strong>of</strong> current commuting patterns across the State and for<br />
counties and key urban areas. Although the Census does not collect data for every trip<br />
type, it does provide some information regarding the employed population’s journey to<br />
work. This information can help identify areas where job access may be a concern.<br />
Means <strong>of</strong> <strong>Transportation</strong> to Work<br />
The county with the lowest percentage <strong>of</strong> drive-alone commuters was Pushmataha<br />
County, another high zero-vehicle area, with 71.2 percent. Haskell County had the<br />
highest percentage <strong>of</strong> commuters using transit at 3.4 percent. This is twice as high as<br />
the second-highest county (Payne County had a 1.7 percent transit share.) Workers<br />
were more likely to walk in Cimarron County than any other County (5.8 percent).<br />
Working from home was most frequent in Roger Mills County (9.6 percent), while the<br />
highest rate <strong>of</strong> commuters taking a taxi, motorcycle, bike or other means occurred in<br />
Jackson County (4.1 percent). For details regarding commuting patterns in each county,<br />
see Appendix B.<br />
The percentages <strong>of</strong> workers who drove alone, carpooled, used public transportation or<br />
another means for the statewide population and urban areas are shown in Table 2.11.<br />
The proportion <strong>of</strong> people that drove alone in Lawton (69.8 percent) was far lower than<br />
any other urbanized area. This echoes Lawton’s higher than usual rate <strong>of</strong> no-vehicle<br />
households. Workers in Lawton were more than three times as likely to use public<br />
transportation than those in <strong>Oklahoma</strong> City and twice as likely as those in Tulsa. The<br />
Norman urbanized area also had a fairly high rate <strong>of</strong> public transportation users,<br />
compared to the state average and had the greatest percentage <strong>of</strong> commuters that<br />
walked, biked, took a taxi or motorcycle, or telecommuted. It should be noted that public<br />
transit shares reported by the U.S. Census are <strong>of</strong>ten lower than the figures commonly<br />
accepted within the transit industry. This is due in part to the fact that urbanized areas<br />
are generally larger than transit agency service areas the totals reported by the Census<br />
include individuals not served by transit. Additionally, the Census figures count only<br />
those individuals who use transit for work on a daily basis, excluding those who use<br />
transit for non-work purposes and those who use transit in a mix with other modes.<br />
Table 2.11: Means <strong>of</strong> <strong>Transportation</strong> to Work for State and Urbanized Areas<br />
Urbanized<br />
Area<br />
Total Workers<br />
Age 16 and Up<br />
Drove<br />
Alone<br />
Carpooled<br />
Used Public<br />
<strong>Transportation</strong><br />
Walk, Bike, Taxi,<br />
Motorcycle, or<br />
Work from Home<br />
Lawton 42,899 69.8% 10.4% 1.8% 8.0%<br />
Norman 46,894 81.3% 7.8% 1.2% 9.7%<br />
<strong>Oklahoma</strong> City 383,035 82.8% 11.3% 0.5% 5.4%<br />
Tulsa 265,753 81.3% 10.8% 0.9% 7.0%<br />
State Average 1,653,574 81.0% 11.2% 0.5% 7.1%<br />
Source: 2010 American Community Survey, 1 year estimates<br />
<strong>Oklahoma</strong> Locally Coordinated Public Transit 21<br />
Human Service <strong>Transportation</strong> <strong>Plan</strong>
Section 2: State Demographic Pr<strong>of</strong>ile<br />
Average Travel Time to Work<br />
The mean travel time to work in <strong>Oklahoma</strong> in 2010 was 20.8 minutes. This compares to<br />
a national average <strong>of</strong> 25.3 minutes. Table 2.12 lists the average travel time to work for<br />
each county. Jackson County had the shortest average commute, at 12.9 minutes, while<br />
the county with the highest average commute was Lincoln at 29.3 minutes. In general,<br />
the suburban counties bordering Tulsa and <strong>Oklahoma</strong> City had higher than average<br />
commute times. For those living within the Lawton and Norman urbanized areas, the<br />
average travel time was much lower than the state average, at 14.2 minutes and 19.9<br />
minutes, respectively.<br />
Table 2.12: Average Travel Time for Workers 16 and up who did not Work from Home<br />
County<br />
Time<br />
Time<br />
Time<br />
County<br />
County<br />
(Minutes)<br />
(Minutes)<br />
(Minutes)<br />
Adair 25.2 Grant 19.8 Nowata 23.1<br />
Alfalfa 18.3 Greer 16.5 Okfuskee 24.8<br />
Atoka 22.7 Harmon 17.9 <strong>Oklahoma</strong> 20.0<br />
Beaver 17.0 Harper 15.7 Okmulgee 26.5<br />
Beckham 17.2 Haskell 26.7 Osage 22.2<br />
Blaine 21.8 Hughes 24.5 Ottawa 20.7<br />
Bryan 21.5 Jackson 12.9 Pawnee 27.1<br />
Caddo 22.3 Jefferson 23.7 Payne 17.9<br />
Canadian 22.3 Johnston 23.1 Pittsburg 20.4<br />
Carter 18.0 Kay 16.0 Pontotoc 17.5<br />
Cherokee 23.4 Kingfisher 20.1 Pottawatomie 23.9<br />
Choctaw 21.9 Kiowa 20.9 Pushmataha 24.3<br />
Cimarron 13.3 Latimer 25.0 Roger Mills 23.3<br />
Cleveland 22.2 Le Flore 20.6 Rogers 24.5<br />
Coal 24.3 Lincoln 29.3 Seminole 22.5<br />
Comanche 17.3 Logan 27.7 Sequoyah 25.3<br />
Cotton 23.2 Love 22.5 Stephens 19.4<br />
Craig 18.5 McClain 27.5 Texas 15.2<br />
Creek 23.7 McCurtain 20.7 Tillman 23.1<br />
Custer 18.1 McIntosh 25.4 Tulsa 19.1<br />
Delaware 26.8 Major 20.6 Wagoner 25.3<br />
Dewey 21.4 Marshall 20.3 Washington 18.1<br />
Ellis 18.2 Mayes 25.1 Washita 21.0<br />
Garfield 16.5 Murray 19.9 Woods 13.2<br />
Garvin 21.7 Muskogee 20.2 Woodward 18.3<br />
Grady 26.0 Noble 22.3<br />
75th Percentile 23.9 100th Percentile 29.3 State Total 20.8<br />
Source 2010 American Community Survey, 5 year Estimates<br />
Demographic Summary<br />
Overall, the population <strong>of</strong> <strong>Oklahoma</strong> is stable to slow-growing. The population density <strong>of</strong> the<br />
State is low outside <strong>of</strong> the urban areas around Lawton, Norman, <strong>Oklahoma</strong> City and Tulsa.<br />
Outside <strong>of</strong> the four urban areas, the population is older and tends to have a higher<br />
proportion <strong>of</strong> disability. The characteristics <strong>of</strong> the target populations vary in each county;<br />
however, fifteen counties tend to have higher concentrations <strong>of</strong> the target populations than<br />
the rest <strong>of</strong> the state.<br />
<strong>Oklahoma</strong> Locally Coordinated Public Transit 22<br />
Human Service <strong>Transportation</strong> <strong>Plan</strong>
Section 3: Summary <strong>of</strong> <strong>Transportation</strong> Services<br />
SECTION 3: SUMMARY OF TRANSPORTATION SERVICES<br />
The senior, low-income, and persons with disabilities populations in <strong>Oklahoma</strong> are<br />
served by a variety <strong>of</strong> transportation entities, each with its own discreet service area,<br />
target population, and operating authority. Service levels vary widely between the many<br />
transportation programs. Since the 2008 <strong>Plan</strong>, the number <strong>of</strong> transit operators serving<br />
the general public has increased. Public transit operators include two large urban public<br />
transit systems, two small urban public transit systems, and more than twenty rural<br />
transit providers. More information about these providers is available on the Transit<br />
Programs Division page <strong>of</strong> ODOT’s website, http://www.okladot.state.ok.us/transit. There<br />
are also numerous medical facilities, schools, community groups and human service<br />
agencies across the State providing transportation services to the target populations.<br />
A survey was distributed to transportation providers across the State in order to gain a<br />
better understanding <strong>of</strong> service areas, services available to the target populations, and<br />
unmet transportation needs. The survey requested information regarding each agency’s<br />
operating characteristics, types <strong>of</strong> services provided, approximate annual transportation<br />
budget, local coordination efforts, and unmet transportation needs among other items.<br />
The survey was distributed online through Survey Monkey using a database that<br />
combined contact lists from ODOT and United We Ride (UWR). In addition, regional<br />
councils <strong>of</strong> government were engaged to provide the survey to other transportation<br />
service providers in their region. Responses from a similar survey done by INCOG were<br />
incorporated where appropriate. Approximately 144 unique transportation provider<br />
agencies responded, including over 60 transportation operators, over 40 organizations<br />
that purchase transportation on behalf <strong>of</strong> clients, referral and informational service<br />
operators, local and tribal governments, and State agencies. A copy <strong>of</strong> the survey is<br />
provided in Appendix C.<br />
The graphs and information that follow summarize the survey responses collected<br />
between July and October 2011. Where available, this information has been compared<br />
to data from 2007. The 2007 data comes from a survey that was conducted as<br />
background for the 2008 version <strong>of</strong> the <strong>Plan</strong>.<br />
Service Area<br />
Survey respondents represent agencies and organizations across the State serving a<br />
wide range <strong>of</strong> geographic areas. As shown in Figure 3.1, the majority <strong>of</strong> respondents<br />
serve an area <strong>of</strong> one county or less. A few statewide and several multi-county agencies<br />
responded as well.<br />
<strong>Oklahoma</strong> Locally Coordinated Public Transit 23<br />
Human Service <strong>Transportation</strong> <strong>Plan</strong>
Section 3: Summary <strong>of</strong> <strong>Transportation</strong> Services<br />
Figure 3.1: Size <strong>of</strong> Service Area for Survey Respondents<br />
Statewide<br />
11-40 Counties<br />
6-10 Counties<br />
2-5 Counties<br />
1 County or less<br />
0 10 20 30 40 50 60<br />
Number <strong>of</strong> Agencies with a Given Service Area<br />
Types <strong>of</strong> Services<br />
Among the survey respondents that provide transportation directly or through a<br />
contractor(s), demand response transportation is the most commonly provided type <strong>of</strong><br />
transportation service. This is mostly likely due to the low-density nature <strong>of</strong> the State<br />
which makes it difficult to serve populations with fixed route services. However, as<br />
shown in Figure 3.2, more than half <strong>of</strong> agencies are providing some sort <strong>of</strong> fixed route or<br />
flexible fixed route services. Many agencies provide more than one type <strong>of</strong> service and in<br />
many regions <strong>of</strong> the State multi-county demand response systems <strong>of</strong>ten serve as<br />
feeders to city/town fixed route systems. Over 30 percent <strong>of</strong> agencies <strong>of</strong>fer subscription<br />
services and some agencies also mentioned <strong>of</strong>fering other types <strong>of</strong> services in<br />
emergencies or on an as-needed basis.<br />
Figure 3.2: Types <strong>of</strong> <strong>Transportation</strong> Services Provided<br />
On Demand Only<br />
On Demand + Fixed Route<br />
Fixed Route Only<br />
Fixed Route + Subscription Service<br />
12%<br />
9%<br />
5%<br />
32%<br />
On Demand, Fixed Route, & Subscription Services<br />
5%<br />
Subsription Service Only<br />
On Demand + Subscription Services<br />
18%<br />
19%<br />
<strong>Oklahoma</strong> Locally Coordinated Public Transit 24<br />
Human Service <strong>Transportation</strong> <strong>Plan</strong>
Section 3: Summary <strong>of</strong> <strong>Transportation</strong> Services<br />
Types <strong>of</strong> Trips<br />
Survey respondents indicated a wide variety <strong>of</strong> trip types and destinations including<br />
medical, employment-related, educational, recreational, congregational, shopping and<br />
personal business trips. Some agencies only provide trips to and from their building or<br />
other specified human service locations, some only serve clients that meet selected<br />
criteria, but many agencies provide services for the public at large. As shown in Figure<br />
3.3, approximately 44 percent <strong>of</strong> agencies do not have restrictions on the type <strong>of</strong> trip or<br />
the clients served.<br />
Figure 3.3: Agency Restrictions<br />
Trip Type /<br />
Human<br />
Service<br />
Program<br />
38%<br />
Not<br />
Restricted<br />
44%<br />
Elderly<br />
and<br />
Disabled<br />
18%<br />
Vehicle Fleets<br />
Most human service agencies that own vehicles have fewer than ten vehicles in their<br />
fleet. Many operate their services with just one or two vehicles, or vehicles provided by<br />
volunteers. Most <strong>of</strong> the tribal governments operating transit indicated a fleet size<br />
between five and twenty vehicles. The small urban systems in Lawton and Norman each<br />
had approximately 30 revenue vehicles. The large urban operators in Tulsa and<br />
<strong>Oklahoma</strong> City have fleets <strong>of</strong> approximately 100 vehicles each, while the largest transit<br />
operator, KiBois Area Rapid Transit (KATS), operates 183 vehicles across 12 counties in<br />
east-central <strong>Oklahoma</strong>. Other transit operators with more than 30 vehicles in their fleet<br />
included Grand Gateway (Pelivan), United Community Action Program (Cimarron Public<br />
Transit), Home <strong>of</strong> Hope, First Capital Trolley, <strong>Oklahoma</strong> <strong>Department</strong> <strong>of</strong> Veteran’s Affairs,<br />
INCA Community Services (JAMM Transit), Muskogee County Public Transit, and Calla-Ride<br />
Public Transit.<br />
Figure 3.4 on page 26 shows the characteristics <strong>of</strong> vehicles across the State. Agencies<br />
that responded to this survey indicated that there are at least 1,332 vehicles and 786<br />
American with Disabilities Act <strong>of</strong> 1990 (ADA) compliant vehicles available for<br />
<strong>Oklahoma</strong> Locally Coordinated Public Transit 25<br />
Human Service <strong>Transportation</strong> <strong>Plan</strong>
Section 3: Summary <strong>of</strong> <strong>Transportation</strong> Services<br />
transportation across the State. The majority <strong>of</strong> these vehicles have no restrictions on<br />
their use. Medium sized vehicles (those that seat between 16 and 29 passengers) were<br />
the most likely to be ADA compliant. Large vehicles are those that seat more than 30<br />
passengers and small vehicles are those that seat between eight and fifteen<br />
passengers. Personal automobiles and minivans were the most commonly used vehicle<br />
type, especially by human service agencies, tribal governments, and rural transit<br />
providers.<br />
Figure 3.4: Statewide Vehicle Characteristics<br />
Large vehicles<br />
Medium vehicles<br />
Small vehicles<br />
Auto / minivans<br />
0 100 200 300 400 500 600<br />
Total Vehicles Statewide<br />
ADA-Accessible Vehicles<br />
*The numbers reflected above include all survey respondents providing transportation,<br />
including schools, community groups and human service agencies as well as public<br />
transportation operators.<br />
Days and Hours <strong>of</strong> Operation<br />
Most service providers <strong>of</strong>fer service Monday through Friday until 6:00 p.m. Fewer<br />
providers <strong>of</strong>fer service on Saturday and Sunday, however Saturday and Sunday service<br />
appears to have increased since 2007. Approximately 16 agencies <strong>of</strong>fer evening hours<br />
with an additional six organizations <strong>of</strong>fering 24-hour or on-call emergency services, as<br />
illustrated in Figure 3.5.<br />
<strong>Oklahoma</strong> Locally Coordinated Public Transit 26<br />
Human Service <strong>Transportation</strong> <strong>Plan</strong>
Agencies Using Funding Source<br />
Section 3: Summary <strong>of</strong> <strong>Transportation</strong> Services<br />
Figure 3.5 Days and Hours <strong>of</strong> Operation<br />
Weekday<br />
Service<br />
Saturday<br />
Service<br />
Sunday<br />
Service<br />
Evening<br />
Service*<br />
24 hour<br />
Service<br />
0 20 40 60 80 100<br />
Number <strong>of</strong> Agencies Offering Service Category<br />
Funding<br />
As shown in Figure 3.6, community transportation in <strong>Oklahoma</strong> is funded by a wide<br />
range <strong>of</strong> programs and resources. Most agencies utilize federal and state funding<br />
programs which are <strong>of</strong>ten matched with contributions from local and county<br />
governments. For a description <strong>of</strong> select federal and state funding sources, please refer<br />
to Appendix A. The vast majority <strong>of</strong> urban, rural, and tribal public transit systems collect<br />
passenger fares while it is less common for a human service agency to collect a fare for<br />
transportation services. Many agencies accept donations in lieu <strong>of</strong> charging a fare,<br />
although a few cannot accept donations or fares due to the nature <strong>of</strong> their service. Some<br />
agencies receive funding from private grants or donors and some provide transportation<br />
as part <strong>of</strong> a larger service portfolio and can build the cost into membership or service<br />
fees.<br />
50%<br />
45%<br />
40%<br />
35%<br />
30%<br />
25%<br />
20%<br />
15%<br />
10%<br />
5%<br />
0%<br />
Figure 3.6: Sources <strong>of</strong> Funding for <strong>Transportation</strong> Services<br />
5307 5309 5310 5311 5316 5317 TANF Medicaid County City State<br />
<strong>Oklahoma</strong> Locally Coordinated Public Transit 27<br />
Human Service <strong>Transportation</strong> <strong>Plan</strong>
<strong>Coordination</strong> with Other <strong>Transportation</strong> Providers<br />
Section 3: Summary <strong>of</strong> <strong>Transportation</strong> Services<br />
Survey recipients were asked to identify areas in which they coordinate with other<br />
transportation providers. As shown in Figure 3.7, the most frequently cited areas <strong>of</strong><br />
coordination in 2011 were training and operations “Other” types <strong>of</strong> coordination<br />
mentioned included senior van services, out-<strong>of</strong>-district and special needs trips, and<br />
referrals to other programs. Overall, only 26 percent <strong>of</strong> respondents mentioned<br />
coordination <strong>of</strong> any kind, but there is still more coordination taking place in most<br />
categories than there was in 2007. The only category that has decreased in that time is<br />
for the coordination <strong>of</strong> maintenance work.<br />
16<br />
14<br />
Figure 3.7: Types <strong>of</strong> <strong>Coordination</strong> with other Agencies<br />
2007 2011<br />
12<br />
10<br />
8<br />
6<br />
4<br />
2<br />
0<br />
Maintenance<br />
Grant<br />
Administration<br />
Operations Training Marketing Other<br />
<strong>Transportation</strong> Services Summary<br />
A wide range <strong>of</strong> services are available to elderly persons, persons with disabilities, and<br />
low-income individuals across the State. Many human service transportation providers<br />
<strong>of</strong>fer a mixture <strong>of</strong> demand-response and fixed route services to their clients and both<br />
types <strong>of</strong> services are fairly common across the State. However, there are places in the<br />
state, particularly in the Panhandle, that do not have transit access. To date, there are<br />
no general public transportation providers operating service in Cimarron County, and in<br />
Texas County service is limited to the city limits <strong>of</strong> Guymon. In the 2008 <strong>Plan</strong>, eight other<br />
counties in the northwestern region <strong>of</strong> the State had been identified as having no public<br />
transportation service. Since that time, ODOT has become aware that transportation<br />
services have been expanded in these areas.<br />
Most transportation is available Monday through Friday during business hours. Evening<br />
and weekend hours are <strong>of</strong>fered by a growing number <strong>of</strong> agencies, but still not widely<br />
available. In some rural areas, service may not be available on a daily basis.<br />
<strong>Transportation</strong> providers rely on federal and state funding programs to provide<br />
<strong>Oklahoma</strong> Locally Coordinated Public Transit 28<br />
Human Service <strong>Transportation</strong> <strong>Plan</strong>
Section 3: Summary <strong>of</strong> <strong>Transportation</strong> Services<br />
transportation but also utilize local government contributions, donations, fares, and<br />
contracts among others. While few survey respondents indicated coordination with other<br />
transportation providers, there is some coordination occurring in operations,<br />
maintenance, training, marketing, and grant administration.<br />
<strong>Oklahoma</strong> Locally Coordinated Public Transit 29<br />
Human Service <strong>Transportation</strong> <strong>Plan</strong>
Section 3: Summary <strong>of</strong> <strong>Transportation</strong> Services<br />
This page is intentionally left blank.<br />
<strong>Oklahoma</strong> Locally Coordinated Public Transit 30<br />
Human Service <strong>Transportation</strong> <strong>Plan</strong>
SECTION 4: PREVIOUSLY FUNDED PROJECTS<br />
Section 4: Previously Funded Projects<br />
The 2008 <strong>Plan</strong> established a competitive process for awarding funding and guided<br />
development <strong>of</strong> projects to address identified gaps. From this framework, 15<br />
transportation projects received federal funding. The reassessment <strong>of</strong> the 2008 <strong>Plan</strong>,<br />
indicates these projects have enhanced the transportation services for the target<br />
populations across the State <strong>of</strong> <strong>Oklahoma</strong>. Projects funded through these programs<br />
have ranged from service expansion and mobility management to the purchase <strong>of</strong><br />
vehicle and sidewalk enhancements.<br />
Competitive Process<br />
The 2008 <strong>Plan</strong> implemented a process for ODOT to award Section 5316 and 5317<br />
federal funding to applicants proposing eligible transportation projects addressing<br />
targeted populations. Eligibility requirements for Sections 5316 and 5317 are described<br />
in Appendix A. Funding is awarded through a competitive process focusing on the<br />
proposed project’s ability to coordinate with local transportation and social services.<br />
Preference is given to projects that coordinate services and addressed gaps for all three<br />
targeted populations. During the evaluation <strong>of</strong> proposed project a score is given based<br />
on how effectively it addresses gaps and coordinates services. All scores are tallied and<br />
used in the selection process to determine the projects that receive funding. Additional<br />
details on this process are provided in Section 7.<br />
Funded Projects<br />
To date, 15 eligible projects have received Section 5316 and 5317 funding during the<br />
four program years. Some projects have applied for and received funding for multiple<br />
program years. Funds awarded to date have primarily focused on:<br />
Expansion <strong>of</strong> Service/Job Access<br />
Accommodations for persons with disabilities<br />
Technology improvements<br />
Increasing public awareness<br />
Table 4.1 lists the projects funded to date, along with a brief description <strong>of</strong> each<br />
project’s major objectives.<br />
<strong>Oklahoma</strong> Locally Coordinated Public Transit 31<br />
Human Service <strong>Transportation</strong> <strong>Plan</strong>
Table 4.1: Projects Receiving Funding, 2009-2012 Program Years<br />
Section 4: Previously Funded Projects<br />
Project Name Project Description Program Years<br />
Expansion <strong>of</strong> Service/Job Access<br />
Road to Work<br />
New Freedom<br />
Rides (Operating)<br />
Little Axe Link<br />
Sooner Express<br />
West Norman<br />
Link<br />
SSA/Cleveland<br />
County Shuttle<br />
Operating funds for a consortium <strong>of</strong> 17-19 transit operators<br />
in 47 rural counties to develop job routes 2009-2012<br />
Operating funds for a consortium <strong>of</strong> 15-16 transit operators in<br />
47 rural counties to develop job access routes for individuals<br />
with a disability 2010-2012<br />
Operating and capital funds for a transit route connecting<br />
low-income populations <strong>of</strong> Norman and Cleveland County to<br />
transit service in <strong>Oklahoma</strong> City via connection with Sooner<br />
Express route 2010-2011<br />
Operating and capital funds to enhance existing transit route<br />
to fill service gap - this transit route provides service to lowincome<br />
passengers commuting between Norman Transfer<br />
Center and Downtown Transit Center in <strong>Oklahoma</strong> City 2010-2012<br />
Operating and capital funds for a transit route providing<br />
access to job centers in northwest Norman and existing<br />
Norman transit routes 2011-2012<br />
Operating and capital funds for a transit route providing lowincome<br />
and rural passengers access to employment<br />
assistance at the Social Security Administration Office 2010-2012<br />
Accommodations for Persons with Disabilities<br />
New Freedom<br />
Rides (Capital)<br />
Bus Stop<br />
Accessibility<br />
Project<br />
Automated Stop<br />
Annunciation<br />
System<br />
Vehicle<br />
Replacement<br />
Technology Improvements<br />
Technology<br />
Upgrades<br />
Technology<br />
Upgrades<br />
Paratransit Mobile<br />
Data Terminals<br />
Increasing Public Awareness<br />
Transfer Station<br />
Hub Signage<br />
Capital funds for a consortium <strong>of</strong> transit operators to acquire<br />
vehicles and equipment designed to accommodate mobility<br />
aids exceeding ADA weight ratings 2009, 2012<br />
Capital funds to improve the accessibility <strong>of</strong> bus stops and<br />
connecting sidewalks beyond ADA requirements 2010<br />
Capital funds to implement automated stop announcement<br />
and rolling screen technology to assist passengers with sight<br />
or hearing impairments 2012<br />
Capital and operating funds to be used for vehicle<br />
replacement for aging transit fleet 2009, 2011, 2012<br />
Capital funds to purchase onboard GIS s<strong>of</strong>tware and<br />
hardware to enhance real-time route reporting for each<br />
transit vehicle in service – prospective patrons may access<br />
information from the internet 2009<br />
Capital funds to purchase GIS and paratransit s<strong>of</strong>tware for<br />
vehicles, which allows for on-line scheduling for paratransit<br />
service 2009<br />
Capital funds for the installation <strong>of</strong> paperless, automated real<br />
time paratransit scheduling 2012<br />
Capital funds to install dynamic signage indicating bus arrival<br />
times to foster better passenger awareness at Norman<br />
Transfer Station 2012<br />
Mobility Manager Capital Funds to support a Mobility Management Program 2009-2012<br />
<strong>Oklahoma</strong> Locally Coordinated Public Transit 32<br />
Human Service <strong>Transportation</strong> <strong>Plan</strong>
Section 4: Previously Funded Projects<br />
The number <strong>of</strong> eligible projects receiving funding has steadily grown since the <strong>Plan</strong>’s<br />
implementation in 2008. Six projects were eligible for funding in program year 2009, the<br />
majority <strong>of</strong> which received capital funds for start-up costs, vehicle improvements and<br />
installation <strong>of</strong> new technology. In program year 2010, the use <strong>of</strong> operational funds<br />
increased to support the development <strong>of</strong> new job access routes. The majority <strong>of</strong> these<br />
programs continued to seek funding program year 2011 and/or 2012. New programs<br />
emerged in program year 2012 that began using the federal funding in more creative<br />
ways, including for new signage, scheduling, and stop notification technology.<br />
<strong>Oklahoma</strong> Locally Coordinated Public Transit 33<br />
Human Service <strong>Transportation</strong> <strong>Plan</strong>
Section 4: Previously Funded Projects<br />
This page is intentionally left blank.<br />
<strong>Oklahoma</strong> Locally Coordinated Public Transit 34<br />
Human Service <strong>Transportation</strong> <strong>Plan</strong>
Section 5: <strong>Transportation</strong> Gaps and Strategies<br />
SECTION 5: TRANSPORTATION GAPS AND STRATEGIES<br />
The 2008 <strong>Plan</strong> used three primary sources <strong>of</strong> information to identify transportation gaps<br />
and issues for the target populations <strong>of</strong> the elderly, low-income, and persons with<br />
disabilities in the State <strong>of</strong> <strong>Oklahoma</strong>. First, demographic and socioeconomic data was<br />
compiled and reviewed. Second, a transportation survey was distributed statewide to<br />
transportation providers and human service agencies. The providers and agencies were<br />
asked to identify their client’s unmet transportation needs. Third, stakeholder meetings<br />
were conducted in July and September <strong>of</strong> 2007. In these meetings transportation gaps<br />
and issues were one <strong>of</strong> the primary topics discussed with the stakeholders. At the<br />
conclusion <strong>of</strong> the meetings the stakeholders’ expressed ideas were summarized to<br />
represent statewide gaps and issues. There were 17 gaps and issues that were<br />
developed. These gaps and issues were further summarized into five categories to<br />
simplify and assist in the development <strong>of</strong> key strategies. The five categories for the<br />
identified gaps and issues were as follows:<br />
Need for more service<br />
Access to jobs<br />
Marketing <strong>of</strong> services<br />
Efficiency <strong>of</strong> service<br />
Capital improvement<br />
For the 2012 update to the <strong>Plan</strong> three similar sources <strong>of</strong> information, as previously<br />
referenced, were utilized to reassess the gaps and issues. First, demographic<br />
information from the 2010 U.S. Census and ACS have been used to determine the<br />
current status <strong>of</strong> target populations in the State. Second, a statewide transportation<br />
survey was conducted from July to October 2011. Third, statewide stakeholder<br />
meetings were held jointly with the ODOT fall information sessions from November 29<br />
through December 1, 2011. It appears the majority <strong>of</strong> gaps and issues remain<br />
unchanged in the rural and small urban areas <strong>of</strong> <strong>Oklahoma</strong>; however, the reassessment<br />
revealed a more focused approach on identified gaps and issues is needed. During the<br />
reassessment it has been noted that some gaps and issues need greater focus to assist<br />
transportation and human service agencies in addressing them.<br />
Gaps and issues are discussed separately in the 2012 update to the <strong>Plan</strong> to better<br />
focus potential eligible projects. A gap is defined as specific unmet need <strong>of</strong> the targeted<br />
populations and the general public. Gaps can refer to a specific service or service<br />
characteristic that is lacking or inaccessible, but may also refer to a lack <strong>of</strong> information<br />
or hard to access informational resources. Gaps can be addressed by an agency or<br />
provider taking the lead on an action at the local level to improve service through the<br />
utilization <strong>of</strong> available federal resources (Sections 5310, 5316, and 5317, as outlined in<br />
Appendix A). The term “issue” will be reserved for more overarching challenges that<br />
act as a barrier to effective and efficient provision <strong>of</strong> services. These larger issues will<br />
be discussed separately in Section 6.<br />
Although projects developed under the 2008 <strong>Plan</strong> have addressed some <strong>of</strong> the gaps<br />
previously identified (see Section 4), there is still a need for more to be done to fully<br />
<strong>Oklahoma</strong> Locally Coordinated Public Transit 35<br />
Human Service <strong>Transportation</strong> <strong>Plan</strong>
Section 5: <strong>Transportation</strong> Gaps and Strategies<br />
meet the needs <strong>of</strong> the targeted and transit dependent population. To help provide clarity<br />
for transit and human service providers, the gaps described in the 2008 <strong>Plan</strong> have been<br />
paired with a definitive action strategy and specific project ideas that could address the<br />
described need. These should be considered when developing an eligible transportation<br />
project. The 2012 update to the <strong>Plan</strong> continues to utilize the five categories previously<br />
referenced. A description <strong>of</strong> each gap, strategies to address them and example projects<br />
are provided below.<br />
Need for More Services<br />
Enhance Intercity and Rural-to-Urban <strong>Transportation</strong><br />
Many stakeholders identified a need for human service agency clients and the public to<br />
travel outside <strong>of</strong> existing service areas to access medical services, shopping, and<br />
employment, among other destinations. There is <strong>of</strong>ten a good connection between fixed<br />
route and demand services within a region; however, there are fewer connections<br />
between regions. Many transportation providers struggle to provide transportation in<br />
rural areas due to the expense <strong>of</strong> traveling long distances to pick-up a passenger or<br />
two. Some providers <strong>of</strong>fer transportation to rural areas and destinations outside <strong>of</strong> their<br />
region, although the days and times are usually limited. For the transit dependent, this<br />
may impede access to healthcare and other services and employment.<br />
In developing eligible transportation projects agencies and providers should identify<br />
means <strong>of</strong> facilitating and enhancing connections between regional providers to improve<br />
travel options for the public. One way this can be accomplished on a smaller scale<br />
would be for a transit operator to add a route or extend a route in order to connect with<br />
another transit agency. This gap can be addressed on a larger scale by developing a<br />
collaborative <strong>of</strong> multiple transit agencies that will work together to develop new<br />
connecting job service routes.<br />
Increase Geographic Coverage <strong>of</strong> Service<br />
In the State <strong>of</strong> <strong>Oklahoma</strong>, there are gaps in geographic coverage for areas that lie<br />
outside <strong>of</strong> any existing transit service area, as well as for some areas within an existing<br />
service area. Each <strong>of</strong> these service gaps should be evaluated when developing eligible<br />
transportation projects. Within an existing transit service area, many transportation<br />
providers receive requests to serve areas that are not already served by a route. For<br />
example, new employment centers <strong>of</strong>ten develop on the periphery <strong>of</strong> a town/city or in a<br />
rural area. Due to financial constraints, transit systems <strong>of</strong>ten have difficulty extending<br />
routes or creating new routes.<br />
In some instances additional service is needed due to the geographic coverage <strong>of</strong><br />
transit being less comprehensive in parts <strong>of</strong> the State, primarily in the Panhandle.<br />
Based on an analysis <strong>of</strong> the transportation providers database as well as contact<br />
directories from ODOT and the <strong>Oklahoma</strong> DHS, only Cimarron County was identified as<br />
<strong>Oklahoma</strong> Locally Coordinated Public Transit 36<br />
Human Service <strong>Transportation</strong> <strong>Plan</strong>
Section 5: <strong>Transportation</strong> Gaps and Strategies<br />
having no known public transit operators. In Texas County, transit service exists within<br />
the city limits <strong>of</strong> Guymon, but the majority <strong>of</strong> the county remains unserved as well. In<br />
many areas, service is <strong>of</strong>fered, but only to specific clientele or for specific trip purposes.<br />
In order to increase the geographic coverage <strong>of</strong> service, a more extensive effort should<br />
be undertaken to determine if there are any locations within an agency’s existing service<br />
area that do not have access to transit. In addition, transportation providers are<br />
encouraged to expand their boundaries in order to encompass parts <strong>of</strong> the State not<br />
currently being served. Many <strong>of</strong> the projects documented in Section 4 have functioned<br />
to increase geographic coverage <strong>of</strong> transportation into an area that had previously<br />
lacked service.<br />
Provide <strong>Transportation</strong> for Those Not Eligible<br />
Most human service agency transportation programs have strict eligibility requirements<br />
for receiving transportation services; however, there is typically a population <strong>of</strong> persons<br />
that do not meet the criteria for the programs but still need transportation services. For<br />
example, some individuals do not meet the income criteria for Medicaid and are not <strong>of</strong><br />
sufficient age to qualify for aging programs, and thus have issues accessing<br />
transportation that may be available. A further issue arises for individuals who do qualify<br />
for the service but can only make the trip with a family member or caregiver who does<br />
not qualify, limiting their ability to use the service effectively.<br />
To the extent possible, transportation providers should attempt to relax eligibility<br />
requirements or develop a fare system which would allow non-program riders to access<br />
their services. In the northwestern region <strong>of</strong> the state, one provider that had previously<br />
only served elderly clientele was able to transition the nature <strong>of</strong> their service in order to<br />
provide transportation to members <strong>of</strong> the general public and use the additional fare<br />
revenue to support their service. Service providers receiving funding through federal<br />
agencies may need to be creative to find ways to accommodate ride-alongs or general<br />
purpose trips without violating current funding requirements.<br />
Increase Evening and Weekend <strong>Transportation</strong><br />
Temporal gaps in service are most evident in the rural and small urban areas <strong>of</strong> the<br />
State. In these areas service typically ends at 6 p.m. and weekend service is rare to<br />
non-existent. The lack <strong>of</strong> evening and weekend transportation services limits people<br />
from taking social, recreational, congregational and personal business trips. For those<br />
that work during the week, it can become difficult to address other types <strong>of</strong> needs when<br />
dependent on public transportation.<br />
<strong>Transportation</strong> providers are encouraged to increase their evening and weekend service<br />
coverage. This may be done by extending the hours <strong>of</strong> routes already in place, or it may<br />
take the form <strong>of</strong> <strong>of</strong>fering an alternate mode <strong>of</strong> transportation (such as taxi vouchers, a<br />
volunteer driver network, or access to an on-demand service) when regular service is<br />
not operating.<br />
<strong>Oklahoma</strong> Locally Coordinated Public Transit 37<br />
Human Service <strong>Transportation</strong> <strong>Plan</strong>
Section 5: <strong>Transportation</strong> Gaps and Strategies<br />
Access to Jobs<br />
Increase <strong>Transportation</strong> Service for Low-Income Individuals to Job Centers<br />
With the growth in State population, particularly in locations surrounding large and small<br />
urban areas, the need remains for transportation for low-income individuals to<br />
employment centers that develop on the periphery <strong>of</strong> urban areas. In order to provide<br />
continued access to jobs, the expansion <strong>of</strong> transportation services needs to keep pace<br />
with the development <strong>of</strong> new and growing employment centers.<br />
<strong>Transportation</strong> providers should develop methods for tracking new job growth and<br />
developments that occur within their existing service area. Additionally they should<br />
coordinate with other city and county governments and any other available resource to<br />
stay informed about developments that could be served by expanding the service area<br />
in order to create routes that best serve the target populations transportation needs.<br />
Provide Service Accommodations for Second and Third Shift Access to Jobs<br />
As stated in the summary <strong>of</strong> the transportation providers survey, few transportation<br />
providers operate past 6:00 p.m. Individuals working a second or third shift job may only<br />
be able to use transportation for trips to or from work, but not both. This inhibits some<br />
individuals from being able to secure and retain employment.<br />
<strong>Transportation</strong> providers will need to collect information regarding the employment<br />
characteristics in their area. Large employers that <strong>of</strong>fer late shift schedules should be<br />
targeted for extended transportation service hours. When it is not feasible to extend the<br />
hours <strong>of</strong> an existing route, providers may <strong>of</strong>fer guaranteed ride home programs,<br />
vouchers for taxi or other transportation service, or they may partner with local<br />
businesses to help guide or fund employer-provided transportation. It is important to<br />
note that FTA regulations do not permit a voucher to serve as an individual fare for a<br />
ride on public transportation, but can be used to access human service transportation<br />
programs that are already are in service.<br />
Marketing <strong>of</strong> Services<br />
Increase Awareness <strong>of</strong> Available Services<br />
A problem that exists in many regions in the State is a lack <strong>of</strong> awareness <strong>of</strong> available<br />
services among potential transportation users and agencies. The problem exists among<br />
human service agencies as well. Many agencies have clients with transportation needs<br />
that they cannot serve, but <strong>of</strong>ten are not aware <strong>of</strong> the local transit provider that can fill<br />
those needs and vice versa. Few communities have a single point <strong>of</strong> contact for<br />
information and referrals about transportation services<br />
Projects that serve to increase public awareness <strong>of</strong> services that already exist have the<br />
potential to help members <strong>of</strong> the target populations realize their transportation needs<br />
<strong>Oklahoma</strong> Locally Coordinated Public Transit 38<br />
Human Service <strong>Transportation</strong> <strong>Plan</strong>
Section 5: <strong>Transportation</strong> Gaps and Strategies<br />
without the expense <strong>of</strong> developing new service. There are many ways to increase the<br />
awareness <strong>of</strong> the community about existing service:<br />
Referral service or mobility manager (More detail provided in Section 6)<br />
Marketing and educational campaigns<br />
Use <strong>of</strong> route and stop signage or clearly marked vehicles to increase visibility <strong>of</strong><br />
the service<br />
Maps, schedules, or brochures that are plentiful and available at multiple<br />
locations including both physical and online locations<br />
In addition, transit operators should make an effort to include members <strong>of</strong> the public and<br />
target populations as much as possible (beyond federal requirements) when planning<br />
new routes or extended service. This has the benefit <strong>of</strong> ensuring new service is directed<br />
to meet needs as well as helping to increase the public visibility and support for the<br />
agency implementing the service.<br />
Make Transit More Affordable to the User<br />
For many low-income individuals, even a small transit fare can be cost-prohibitive. For<br />
others, the additional cost paying fares for accompanying family members can make a<br />
trip unaffordable. Some individuals that need medical attention forgo appointments<br />
because they cannot pay a fare. Similarly, low-income individuals may not be able to<br />
secure and retain employment due to transit affordability. For some individuals, the<br />
need to pay multiple fares for transfers between systems or recurring fares for trips<br />
made on a regular basis may cause transportation expenses to be a burden. Although<br />
there are several local and federal programs in place that will reimburse certain target<br />
populations for some <strong>of</strong> their transportation expenses, many qualified individuals lack<br />
the awareness or ability to access these programs.<br />
<strong>Transportation</strong> operators are encouraged to undertake efforts that make service more<br />
affordable to the user. Use <strong>of</strong> certain technologies that increase the efficiency <strong>of</strong><br />
providing service may allow providers to reduce costs. Other methods for reducing the<br />
consumer’s out <strong>of</strong> pocket costs may include:<br />
Fare structures that include reduced rates for target populations<br />
Availability <strong>of</strong> a pre-paid weekly or monthly transit pass that <strong>of</strong>fers regular,<br />
transit-dependent riders a lower average fare<br />
Education programs, literature or signage that increases passenger awareness<br />
about availability and eligibility requirements for transit reimbursements <strong>of</strong>fered<br />
through other programs, see Appendix A<br />
Efficiency <strong>of</strong> Service<br />
Improve Connectivity to Services<br />
Over the last four program years under the 2008 <strong>Plan</strong> additional service and routes<br />
have been added throughout the rural and small urban areas <strong>of</strong> the State. Even with<br />
<strong>Oklahoma</strong> Locally Coordinated Public Transit 39<br />
Human Service <strong>Transportation</strong> <strong>Plan</strong>
Section 5: <strong>Transportation</strong> Gaps and Strategies<br />
these additions in service, certain areas <strong>of</strong> the State do not have efficient connections to<br />
the transportation providers in the urban areas. It is imperative that with this existing<br />
service significant coordination occurs with transportation providers in both rural and<br />
urban areas to maximize the effectiveness and efficiency <strong>of</strong> services.<br />
Improve Response Time for On-Demand Services<br />
Many demand response service providers require clients to make a trip reservation a<br />
day or more in advance. This can make it difficult to obtain transportation for needs that<br />
arise at the last minute. Additionally, most on-demand return trips are done on an “oncall”<br />
basis or in some cases the return is scheduled. There are instances in both<br />
situations when trips are delayed, either due to an influx <strong>of</strong> calls or because the client<br />
has an issue making the scheduled time. In both cases, the system’s schedule can get<br />
behind resulting in long wait times for clients. For example, a dialysis client may have<br />
trouble completing their appointment because <strong>of</strong> complications. The client may be ready<br />
60 to 90 minutes after their scheduled return trip but may have to wait longer because<br />
the transportation system is unable to react in real time to some schedule changes. This<br />
problem is exacerbated when the trip is a long intercity or inter-regional trip.<br />
<strong>Transportation</strong> providers are encouraged to utilize technology and other innovative<br />
means to assist in improving response time for their clients. Under the <strong>Plan</strong>,<br />
transportation providers have used suggested guidance to develop projects utilizing<br />
technology to provide real time information and scheduling to transit patrons. One<br />
transit operator has used Geographical Information System (GIS) s<strong>of</strong>tware to provide<br />
real time route and location information for each transit vehicle. In addition, paratransit<br />
system s<strong>of</strong>tware has also been implemented and used to allow for online scheduling for<br />
paratransit service. Paratransit Mobile Data Terminals have been purchased for<br />
paratransit vehicles in order to automate the scheduling process and decrease wait<br />
times for clients through more efficient communication between <strong>of</strong>fice staff and drivers.<br />
Need for Capital Improvements<br />
Improve Passenger Waiting Areas<br />
In both rural areas and small towns, transportation passengers may find that there <strong>of</strong>ten<br />
is no place to wait for pick up by a transit vehicle. Lack <strong>of</strong> passenger shelters and<br />
designated waiting areas can make waiting for transit unsafe and inhospitable, <strong>of</strong>ten<br />
deterring potential transit customers from using transit.<br />
<strong>Transportation</strong> providers should identify opportunities for collaboration for capital<br />
expenditures with local governments in order to improve passenger waiting areas in<br />
rural and small towns. Once an opportunity is identified, coordination should be as<br />
inclusive as possible to include the general public (passenger), local government(s),<br />
and transportation provider to assist in the selection <strong>of</strong> amenities to include at a waiting<br />
area. The selection <strong>of</strong> amenities should consider the following:<br />
<strong>Oklahoma</strong> Locally Coordinated Public Transit 40<br />
Human Service <strong>Transportation</strong> <strong>Plan</strong>
Section 5: <strong>Transportation</strong> Gaps and Strategies<br />
Average daily boardings<br />
Proximity to major trip generators<br />
Passenger Activity<br />
Surrounding land uses<br />
Equity among communities<br />
Proximity <strong>of</strong> other nearby sheltered areas<br />
In rural areas, the installation <strong>of</strong> amenities by transportation providers may be difficult<br />
due to lack <strong>of</strong> suitable stop locations or resources. In these instances consideration<br />
should be given to identify existing sheltered areas (<strong>of</strong>fices, commercial buildings, or<br />
apartment complexes) that could be utilized for comfortable and safe passenger waiting<br />
areas.<br />
Enhance ADA Accessibility<br />
Where transit stops exist, there is <strong>of</strong>ten a lack <strong>of</strong> accessibility features that enable<br />
persons with disabilities to access transit services. Many bus stops, if they exist, lack<br />
sidewalks leading up to them as well as ADA-compliant curb ramps. In addition, bus<br />
stops should be designed appropriately with a level boarding area so that persons in<br />
wheelchairs can board accessible transit vehicles from the waiting area. Where<br />
sidewalks lead up to a bus stop, they may be in poor condition or have obstructions<br />
such as trees and landscaping.<br />
This is another clear opportunity for collaboration between local governments and<br />
transportation providers to incorporate accessibility features into the design <strong>of</strong> the bus<br />
stop waiting area. One such example occurred with a city and public transportation<br />
provider teaming to improve 16 bus stops. These improvements have been completed<br />
and focus on accessibility features at the stops through the installation <strong>of</strong> curb cuts,<br />
ADA ramps and sidewalks with detectable warning surfaces and connecting features.<br />
Enhancing ADA accessibility goes beyond providing accessibility features at bus stops<br />
and should extend to easier boarding and alighting from transit vehicles to the quality <strong>of</strong><br />
service provided between stops. <strong>Transportation</strong> providers should consider means <strong>of</strong><br />
providing comprehensive service that enhances accessibility for the disabled individual<br />
from origin to destination. Providers have used FTA funds to purchase ADA minivans<br />
and busses that have vertical wheelchair lifts that exceed the minimum ADA<br />
requirements. These vehicles provide sufficient room to accommodate large mobility<br />
devices, which have become more prevalent in recent years. In addition, the same<br />
funding source has been used to implement an automated stop annunciation system to<br />
assist visual and hearing impaired patrons. The system is utilized on fixed route transit<br />
vehicles and provides audible stop announcements, as well as, rolling screen<br />
announcements with stop information.<br />
<strong>Oklahoma</strong> Locally Coordinated Public Transit 41<br />
Human Service <strong>Transportation</strong> <strong>Plan</strong>
Section 5: <strong>Transportation</strong> Gaps and Strategies<br />
This page is intentionally left blank.<br />
<strong>Oklahoma</strong> Locally Coordinated Public Transit 42<br />
Human Service <strong>Transportation</strong> <strong>Plan</strong>
Section 6: Key Issues Impacting Service Providers<br />
SECTION 6: KEY ISSUES IMPACTING SERVICE PROVIDERS<br />
The previous section outlined the transportation gaps for the target populations as well<br />
as strategies and example projects to help address those gaps. Even with the progress<br />
identified during the revision <strong>of</strong> the <strong>Plan</strong>, a clear need for more to be done remains.<br />
Additional federal and state funding would be the obvious solution to addressing these<br />
gaps; however, a more prudent solution is required. An effective elimination <strong>of</strong> gaps will<br />
require an examination <strong>of</strong> obstacles that impede the general public and transportation<br />
providers from maximizing current transportation services. Typically, these obstacles<br />
exist at the federal and state level and go beyond the reach <strong>of</strong> an individual<br />
organization. Issues (obstacles and challenges) may be overcome when a<br />
comprehensive approach is utilized to take advantage <strong>of</strong> multiple resources at a<br />
regional or state level. This section briefly summarizes the issues affecting provision <strong>of</strong><br />
service and suggests strategies to be undertaken at a regional or statewide level to<br />
address those issues.<br />
Issues<br />
Six issues are defined below and have been used in the reassessment and<br />
development <strong>of</strong> key strategies for improving transportation services throughout the<br />
State.<br />
Rising Cost <strong>of</strong> Providing <strong>Transportation</strong><br />
<strong>Transportation</strong> providers are experiencing financial constraints due to the rising costs <strong>of</strong><br />
vehicle purchases, insurance, fuel, wages, benefits, and utilities among others. These<br />
financial constraints <strong>of</strong>ten prohibit agencies from expanding their services and in some<br />
areas transit providers are reducing their services<br />
Insufficient Local Contribution<br />
The lack <strong>of</strong> local contribution can present challenges for agencies in meeting the match<br />
requirements for certain grants. Without these grants it can be difficult to expand<br />
services for unmet needs. Transit agencies in the State receive varying levels <strong>of</strong><br />
financial contributions from the local governments that they serve. While some agencies<br />
do receive cash or in-kind assistance, several transit systems do not receive any local<br />
contribution.<br />
Demand for Vehicles<br />
Many transportation providers are facing capacity problems due to having an insufficient<br />
number <strong>of</strong> vehicles to meet the demand for trips. The capacity problems can force<br />
agencies to deny trips. Many agencies cite the specific need for wheelchair-accessible<br />
vehicles to transport persons with disabilities. The increasing cost <strong>of</strong> vehicles, especially<br />
wheelchair accessible vehicles, is one reason why they have not been able to increase<br />
the fleet size. As a result, many agencies are retaining vehicles that exceed their useful<br />
life, which <strong>of</strong>ten leads to increasing costs for vehicle maintenance.<br />
<strong>Oklahoma</strong> Locally Coordinated Public Transit 43<br />
Human Service <strong>Transportation</strong> <strong>Plan</strong>
Section 6: Key Issues Impacting Service Providers<br />
Lack <strong>of</strong> Effective Central Distribution <strong>of</strong> <strong>Transportation</strong> Service Information<br />
At the state level, the most notable obstacle has been in establishing more awareness<br />
<strong>of</strong> the available information and resources for the general public and transportation<br />
providers. This has become evident from responses received from the human service<br />
agencies in the 2011 Statewide <strong>Transportation</strong> Survey and the input from attendees at<br />
the statewide information sessions held in November and December <strong>of</strong> 2011.<br />
In the 2008 <strong>Plan</strong> a mobility manager was defined as one <strong>of</strong> the strategies for addressing<br />
gaps. A mobility manager has been defined as an entity that would be able to facilitate<br />
the match between services and transportation needs through centrally maintained<br />
inventory <strong>of</strong> services disseminated via call center or web-based program. Furthermore,<br />
it was envisioned for an agency to be developed to operate this service at the State<br />
level; however, to date no agency has fulfilled this statewide roll. Specific issues have<br />
been identified such as the need for a comprehensive and current database, highly<br />
trained staff knowledgeable about services and transportation programs, limited<br />
financial resources, and a successful template for implementation.<br />
Impact <strong>of</strong> Reduction in <strong>JARC</strong> Funding<br />
The Job Access and Reverse Commute Program (<strong>JARC</strong>) began in the late 1990s as a<br />
discretionary funding earmark program. <strong>Oklahoma</strong> transit systems joined forces and<br />
successfully applied for funding to implement a program known as “Road To Work.”<br />
Road to Work enabled agencies across the State to initiate new services designed to<br />
transport low-income individuals to jobs. In 2005 with the enactment <strong>of</strong> SAFETEA-LU,<br />
<strong>JARC</strong> became a formula program. The funding that <strong>Oklahoma</strong> receives under the<br />
formula arrangement has been significantly less than it received through discretionary<br />
funding. Numerous agencies are still faced with securing new and stable funding<br />
sources to replace the lost <strong>JARC</strong> dollars.<br />
Incompatibility <strong>of</strong> Funding Regulations<br />
Obstacles to coordination, perceived or real, are <strong>of</strong>ten rooted in the mere fact that local<br />
communities in <strong>Oklahoma</strong> are the recipients <strong>of</strong> federal funding under one or more <strong>of</strong> 62<br />
programs identified by the U.S. General Accountability Office. A detailed regulatory<br />
review <strong>of</strong> these programs reports that coordination obstacles arise due to inconsistency<br />
in program delivery, reporting, and eligibility requirements. Thus mere use <strong>of</strong> federal<br />
funds, and the associated program rules and regulations, may present obstacles to<br />
coordination that are not rooted at the local level.<br />
United We Ride (UWR) was created in response to Executive Order 13330 and serves<br />
as a federal interagency initiative focused on improving the availability <strong>of</strong> transportation<br />
services to the elderly, people with disabilities, and individuals with low incomes. In<br />
2006, <strong>Oklahoma</strong> Governor Brad Henry established <strong>Oklahoma</strong> UWR by Executive Order<br />
2008-31. UWR is a vital resource for providers to utilize when understanding numerous<br />
regulations associated with federal programs that are available for transportation<br />
<strong>Oklahoma</strong> Locally Coordinated Public Transit 44<br />
Human Service <strong>Transportation</strong> <strong>Plan</strong>
Section 6: Key Issues Impacting Service Providers<br />
services. Table 6.1 outlines some <strong>of</strong> the potential issues that arise when using funding<br />
from multiple federal programs. Further funding details are described in Appendix A.<br />
Table 6.1: Summary <strong>of</strong> Some Federal Human Service <strong>Transportation</strong> Funding Sources<br />
Program<br />
Designated<br />
Fed. Agency<br />
Target<br />
Populations<br />
<strong>Coordination</strong> Issues / Program<br />
Limitations<br />
Urbanized Area Formula<br />
Program (§5307)<br />
Capital Grants Program<br />
(§5309)<br />
<strong>Transportation</strong> for<br />
Elderly & Persons with<br />
Disabilities (§5310)<br />
Non-urbanized Area<br />
Formula Program<br />
(§5311)<br />
Job Access & Reverse<br />
Commute (§5316)<br />
U.S. DOT (FTA) General Public<br />
U.S. DOT (FTA) General Public<br />
U.S. DOT (FTA)<br />
Elderly and<br />
Persons with<br />
Disabilities<br />
U.S. DOT (FTA) General Public<br />
U.S. DOT (FTA) General Public<br />
Does not support integration <strong>of</strong><br />
urban and rural systems<br />
Cannot be used for planning or<br />
operational support<br />
Primarily a capital expense<br />
program, but can be used to lease<br />
vehicles, purchase transportation,<br />
or fund mobility management<br />
programs<br />
Does not support integration <strong>of</strong><br />
urban and rural systems<br />
None noted<br />
New Freedom Program<br />
(§5317)<br />
U.S. DOT (FTA)<br />
Persons with<br />
Disabilities<br />
Does not support planning related<br />
activities; Project must go above &<br />
beyond ADA requirements<br />
Over-the-Road Bus<br />
Program (§3038)<br />
Transitional Assistance<br />
for Needy Families<br />
(TANF)<br />
Vocational<br />
Rehabilitation Services<br />
Medicaid (SoonerCare)<br />
Workforce Investment<br />
Act<br />
Senior Community<br />
Service Employment<br />
Program<br />
U.S. DOT (FTA) General Public<br />
<strong>Department</strong> <strong>of</strong><br />
Health & Human<br />
Services<br />
<strong>Department</strong> <strong>of</strong><br />
Education<br />
<strong>Department</strong> <strong>of</strong><br />
Health & Human<br />
Services<br />
<strong>Department</strong> <strong>of</strong><br />
Labor<br />
<strong>Department</strong> <strong>of</strong><br />
Health & Human<br />
Services<br />
Welfare<br />
Recipients<br />
Persons with<br />
Disabilities<br />
Medicaid<br />
Eligible<br />
Individuals<br />
Unemployed /<br />
Underemployed<br />
Workers<br />
Seniors<br />
Needing<br />
Employment<br />
Cannot be used for planning or<br />
operational support<br />
Clients in rural areas; 2nd and 3rd<br />
shift needs; Need to take children to<br />
daycare, Low-income individuals<br />
that do not qualify for welfare<br />
Limited to disabilities that impede<br />
employment; limited destinations/<br />
trip purposes<br />
Medical transportation only; Need<br />
for aides or family members to ride<br />
with clients, Low-income individuals<br />
not qualifying for Medicaid<br />
Destinations limited to Job training<br />
and educational facilities; Lowincome<br />
individuals not meeting<br />
threshold for underemployment<br />
Limited to program participants;<br />
limited destinations/trip purposes<br />
In addition to federal funding restrictions, many local transportation funding sources<br />
impose restrictions <strong>of</strong> their own. For example, transportation services that derive<br />
<strong>Oklahoma</strong> Locally Coordinated Public Transit 45<br />
Human Service <strong>Transportation</strong> <strong>Plan</strong>
Section 6: Key Issues Impacting Service Providers<br />
operating costs from sales taxes are <strong>of</strong>ten limited to the city or county initiating the tax,<br />
impeding efforts to coordinate with other locales. Although a great deal <strong>of</strong> progress has<br />
been made over the last decade, much work remains to be done at the local, state and<br />
federal levels to reduce restrictions on funding, to the extent possible, to encourage<br />
more innovative and cooperative solutions that address transportation needs.<br />
Strategy: Promote the Most Efficient Uses <strong>of</strong> Limited Funds<br />
A common theme expressed during the development <strong>of</strong> the <strong>Plan</strong> has been the issue <strong>of</strong><br />
limited funding. One important strategy in the short term is to make the most <strong>of</strong> the<br />
funding that is available. The two major components <strong>of</strong> this strategy are to maximize the<br />
use <strong>of</strong> existing service capacity, to expand services using available vehicles and<br />
resources, and to target new services where the need and demand are highest.<br />
Increase the Utilization <strong>of</strong> Existing Service<br />
Encouraging greater use <strong>of</strong> existing service inherently improves system efficiency,<br />
reduces unit costs per trip and eliminates the perception <strong>of</strong> lack <strong>of</strong> use, which is a<br />
common obstacle to securing additional funding. Projects that make use <strong>of</strong> the available<br />
capacity on existing service generally operate with lower costs and require far less<br />
startup capital than new service.<br />
There are a number <strong>of</strong> projects that could be designed to increase the utilization <strong>of</strong><br />
existing services including voucher programs, purchase <strong>of</strong> transportation services from<br />
other agencies, allowing otherwise non-eligible individuals to access service,<br />
operational coordination, public awareness and education campaigns and easily<br />
accessible public transportation information and referral programs (mobility managers).<br />
Expand Services Using Available Resources<br />
Sometimes the available service is not enough to meet the needs <strong>of</strong> the target<br />
populations and must be expanded, especially when addressing the need for weekend<br />
and evening service and the need for greater geographic coverage. Through better<br />
management <strong>of</strong> driver and vehicle availability, these new services may be able to be<br />
implemented using resources already available at much lower costs. Examples <strong>of</strong> this<br />
may include:<br />
Using otherwise idle vehicles to extend an agency’s service hours<br />
Extending routes with low ridership into new geographic areas<br />
Allowing more flexibility for fixed-route services to deviate from the route in order<br />
to accommodate more passengers<br />
Coordinating with other entities to make use <strong>of</strong> available vehicles and drivers<br />
during non-operational times (this strategy can be facilitated through the creation<br />
and maintenance <strong>of</strong> a database <strong>of</strong> transit service providers)<br />
<strong>Oklahoma</strong> Locally Coordinated Public Transit 46<br />
Human Service <strong>Transportation</strong> <strong>Plan</strong>
Section 6: Key Issues Impacting Service Providers<br />
Strategy: Identify Lead Agency to Serve as a Mobility Manager<br />
Although the previously referenced strategies can be practiced by individual agencies,<br />
they can be accomplished more effectively through management at a regional or even<br />
statewide level. Developing an effective mobility manager service truly requires a region<br />
or statewide effort. Identifying one lead agency to serve as a mobility manager is<br />
preferable and has several potential benefits:<br />
Easier for the public to access transportation information and eligibility<br />
requirements, thereby increasing their likelihood <strong>of</strong> using existing services<br />
Better management <strong>of</strong> transportation resources including existing services,<br />
vehicles, and drivers to minimize duplication and maximize geographic and<br />
temporal coverage<br />
Easier for transportation providers and human service agencies to identify other<br />
transportation resources in their area, facilitating collaboration<br />
Facilitates collection <strong>of</strong> travel demand data and future service planning efforts<br />
The purpose the mobility manager is to build and maintain an inventory <strong>of</strong> services,<br />
create an access system that would provide service information to passengers via a call<br />
center or web-based statewide program, and utilize existing infrastructure. The mobility<br />
manager would serve as a transportation clearinghouse by which information and<br />
resources about transportation services can be disseminated to the general public as<br />
well as to providers. The mobility manager would be able to facilitate the match between<br />
services and transportation needs. It can provide assistance in establishing eligibility for<br />
available services and/or itinerary planning and could potentially make the reservation.<br />
Critical to this service is the maintenance <strong>of</strong> the database <strong>of</strong> services which must be<br />
current and comprehensive.<br />
Develop Template on a Smaller Scale<br />
The implementation <strong>of</strong> a mobility manager service at the state level may require<br />
significant time and resources to implement. In the interim it would be prudent to<br />
develop a template that is functional at the regional level. Once a successful model has<br />
been established a review <strong>of</strong> the service would occur to determine what aspects <strong>of</strong> the<br />
service operation would be applicable to statewide service.<br />
Currently INCOG has developed and is projected to implement a mobility manager<br />
service for the Tulsa <strong>Transportation</strong> Management Area (TMA) in 2012. This service is<br />
envisioned to provide a single point <strong>of</strong> contact to assist transit patrons in obtaining<br />
regional transportation and referral services in Tulsa’s TMA. With successful<br />
implementation <strong>of</strong> the mobility manager, mobility will be enhanced and the region<br />
should realize service efficiencies and cost reductions.<br />
Once the INCOG mobility manager is established and is efficiently operating. ODOT<br />
and <strong>Oklahoma</strong> UWR and their partners should focus on expanding the program through<br />
INCOG or by establishing new regional mobility managers using the INCOG model.<br />
One key component for establishing other regional mobility managers is transportation<br />
<strong>Oklahoma</strong> Locally Coordinated Public Transit 47<br />
Human Service <strong>Transportation</strong> <strong>Plan</strong>
Section 6: Key Issues Impacting Service Providers<br />
service database. ODOT should build upon and maintain the statewide database that<br />
has been developed from the update to the <strong>Plan</strong>. This statewide database would then<br />
be used by all mobility manager systems, which would provide consistent information<br />
utilized across the State. Furthermore, this could serve as a means to unify all regional<br />
mobility manger services and allow for easier coordination to identify needed<br />
transportation services for potential transit patrons.<br />
Strategy: Develop Methods for Existing Providers to Work Together<br />
Creating opportunities for service providers to work together is essential to overcoming<br />
barriers that impede existing service delivery. This strategy allows human service<br />
agencies to focus on their core mission rather than on transportation services. Overall,<br />
when agencies work together there will be a reduction in vehicle travel and less<br />
duplication in services. Essentially, this leads to lower trip costs to riders and economies<br />
<strong>of</strong> scale for transportation providers.<br />
Facilitate Purchase <strong>of</strong> Services<br />
Many coordination efforts involve a perceived risk on the part <strong>of</strong> one or more agencies.<br />
For instance, the simple act <strong>of</strong> contracting out for transportation service requires an<br />
agency to relinquish control <strong>of</strong> customer service to a certain extent. Projects that<br />
essentially provide seed money for the first year <strong>of</strong> a new relationship between two<br />
agencies fare well in the evaluation process especially if the agencies have identified<br />
other sources <strong>of</strong> funds to sustain the project. This type <strong>of</strong> arrangement at least removes<br />
the issue <strong>of</strong> using agency funds for what may be perceived as a risky endeavor. The<br />
project would give the contractor one year to exhibit its service capabilities and warrant<br />
use <strong>of</strong> agency funds for the arrangement in subsequent years.<br />
Use Technology to Manage Resources<br />
Whether through the mobility manager previously referenced or through some other<br />
collaborative effort, agencies can utilize real-time scheduling technology to allow for<br />
better management <strong>of</strong> drivers and vehicles to enhance resource sharing. Providers<br />
would know availability and be able to schedule accordingly. Critical to establishing<br />
these relationships is the creation <strong>of</strong> a cost allocation model. In those instances where<br />
one provider is assisting another by providing a trip, a mechanism for reimbursing that<br />
provider must be in place. Cost allocation can take many forms and are heavily<br />
dependent upon funding programs and other regulatory requirements in terms <strong>of</strong><br />
service area and the use <strong>of</strong> equipment. Some transportation and human service<br />
agencies have used Smart Cards technology to easily reimburse transit costs for<br />
qualified clients while simultaneously tracking popular destinations.<br />
Reduce Overhead by Pooling Costs<br />
Another method for providers to work together would be to expand current efforts to<br />
pool purchases and expenses. Any efforts to pool expenses among agencies will take<br />
advantage <strong>of</strong> economies <strong>of</strong> scale for items such as fuel, insurance, vehicle<br />
<strong>Oklahoma</strong> Locally Coordinated Public Transit 48<br />
Human Service <strong>Transportation</strong> <strong>Plan</strong>
Section 6: Key Issues Impacting Service Providers<br />
maintenance, driver training, drug and alcohol testing and employee benefit programs.<br />
Agencies with less funding would benefit from sharing resources that have been<br />
purchased by the larger agencies. Additionally, collaboration in driver training would<br />
ensure that all vehicle operators receive the same information and are educated about<br />
policies pertaining to driver requirements, passenger handling and vehicle usage. In<br />
general, this would increase the willingness <strong>of</strong> providers to coordinate operations<br />
because there would be less concern about another agency’s potentially sub-standard<br />
driver training. This may also address issues regarding the shortage <strong>of</strong> qualified drivers<br />
by making turn-over <strong>of</strong> the labor force less expensive.<br />
Strategy: Encourage Greater Participation <strong>of</strong> Local Governments<br />
Encouraging greater participation <strong>of</strong> local governments is intended to get the key<br />
decision makers involved in allocating additional funding for human service and public<br />
transportation. Generally, the issues associated with human service transportation do<br />
not reach locally elected <strong>of</strong>ficials, primarily because when citizens are accustomed to<br />
the unavailability <strong>of</strong> service they do not think to complain. It becomes a fact <strong>of</strong> living in<br />
their area. In addition, those individuals most affected by service deficiencies are <strong>of</strong>ten<br />
transit-dependent and may have difficulty accessing their local representatives or<br />
participating in public involvement events. The <strong>Plan</strong> is a document designed to outline<br />
the needs and supporting information for project proponents to use as they garner<br />
support from local government.<br />
If Local governments can find resources to work with the State to improve transportation<br />
services, their financial and in-kind support can be used to address a number <strong>of</strong> the<br />
needs outlined in Section 5. These range from providing long-term financial<br />
sustainability to assistance with the provision <strong>of</strong> ADA compliant bus stops and<br />
sidewalks.<br />
Strategy: Facilitate Private Sector Partnerships<br />
Human service agencies and transportation providers are encouraged to form<br />
partnerships with private sector business and foundations to help them address<br />
transportation issues. Many major employers have dedicated assistance to communitybased<br />
activities and there several ways that they can help. Private sector employers<br />
can assist low-income workers learn about existing transportation services. They can<br />
also facilitate access to or even sponsor programs such as van pools and shuttle<br />
services for workers.<br />
Another group <strong>of</strong> private sector entities to target for collaboration includes taxi-cab<br />
operators, limousine or motor coach providers and for-pr<strong>of</strong>it inter-city bus and rail line<br />
companies such as Greyhound and Amtrak. Taxis provide a reasonable alternative for<br />
last minute trips or trips occurring outside <strong>of</strong> normal service hours that could otherwise<br />
not be accommodated by the local transit or human-service provider. In cases where<br />
the client needs to travel a great distance, inter-city bus and rail lines may be more<br />
appropriate. The development <strong>of</strong> voucher or reimbursement programs between<br />
agencies and private transportation services could benefit both entities, by allowing<br />
<strong>Oklahoma</strong> Locally Coordinated Public Transit 49<br />
Human Service <strong>Transportation</strong> <strong>Plan</strong>
Section 6: Key Issues Impacting Service Providers<br />
transportation <strong>of</strong> clients with lower overhead and capital costs for the agencies, and as<br />
a steady source <strong>of</strong> reliable income for the private companies.<br />
Finally, collaboration efforts should be targeted at foundations that exist with the primary<br />
focus <strong>of</strong> improving their respective communities. These foundations have a variety <strong>of</strong><br />
goals, from community health to literacy programs, which almost always have a<br />
transportation component. They are excellent resources for identifying funds for<br />
transportation services, especially if the service can be tailored to support the<br />
foundation’s cause.<br />
Establish Regional Coordinating Committees<br />
Establishing a regional coordinating committee would provide a forum to address<br />
transportation issues, exchange information, and discuss potential solutions. Service<br />
coordination requires cooperation among agencies that do not traditionally work<br />
together. However, it is the most cost-effective strategy for addressing transportation<br />
barriers.<br />
The committee could possibly consist <strong>of</strong> State agencies, human service organizations,<br />
private sector companies, and local transportation providers. Working together they<br />
would serve as a clearinghouse to address issues across the region and close existing<br />
transportation gaps. The committee would be responsible for making decisions that<br />
would improve efficiency <strong>of</strong> services in that particular region <strong>of</strong> the State. It would be<br />
able to consolidate resources, identify/eliminate overlaps in services, and develop<br />
solutions that would address services that are lacking in certain areas. A regional<br />
committee would also be able to address transportation gaps by increasing geographic<br />
coverage on a regional level by working together.<br />
A major function <strong>of</strong> these coordinating committees would be to help address some <strong>of</strong><br />
the regulatory hurdles, and to the extent possible, work with their state and federal<br />
parent agencies to reduce any unnecessary and burdensome restrictions on<br />
transportation funding. For example, the regional arm <strong>of</strong> DHS may be better positioned<br />
to help overcome some <strong>of</strong> the coordination barriers associated with Medicaid<br />
transportation funding than an individual transportation provider or client.<br />
A Coordinating Committee such as this may also be the ideal environment for<br />
development <strong>of</strong> educational and awareness programs, as its membership would<br />
encompass the broad spectrum <strong>of</strong> available transportation services and resources<br />
available.<br />
<strong>Oklahoma</strong> Locally Coordinated Public Transit 50<br />
Human Service <strong>Transportation</strong> <strong>Plan</strong>
Section 7: Evaluation<br />
SECTION 7: EVALUATION<br />
Applications will be reviewed by the Statewide Evaluation Committee (The Committee)<br />
to ensure compliance with the minimum requirements to be considered for funding,<br />
including the submission <strong>of</strong> all mandatory forms. Applications must meet the following<br />
criteria:<br />
All agencies and/or project sponsors must show the financial, technical and<br />
organizational capacity to complete the project within a reasonable timeframe<br />
Project budgets must meet FTA guidelines for the Section 5316 and Section<br />
5317 programs<br />
Project sponsor cannot have any projects within the last five years that have<br />
been terminated for cause or due to a shortfall <strong>of</strong> matching funds<br />
Project sponsor must have attended a mandatory <strong>JARC</strong> and NF Grant Workshop<br />
The project or program cannot be located in an urban transportation<br />
management area<br />
The goal <strong>of</strong> the process is to award funds to projects that achieve the desired benefits<br />
toward the transportation <strong>of</strong> the target populations. The Committee reserves the right to<br />
ask a project sponsor for supplemental information about a proposed project. The<br />
Committee may also deny funds to any project that does not meet the criteria<br />
established. At the conclusion <strong>of</strong> the evaluation process, any unobligated funds shall be<br />
rolled into the next year’s funding cycle.<br />
ODOT will host a series <strong>of</strong> training workshops in conjunction with its call for projects.<br />
The Committee will review only those projects that are submitted by sponsoring<br />
organizations that have attended a mandatory training workshop.<br />
<strong>Coordination</strong><br />
Proposed projects will be evaluated based on their ability to coordinate with other<br />
community transportation and/or social service resources. The project sponsor may<br />
choose how it would like this aspect <strong>of</strong> the proposal to be evaluated. Only one <strong>of</strong> the<br />
options below can be selected.<br />
1. Rating Option 1 - Up to 20 points will be awarded for their project’s methods for<br />
coordinating their services and promoting public awareness <strong>of</strong> the project. The<br />
project sponsor must provide a narrative that describes their efforts to coordinate<br />
with other agencies and how their project will enhance or augment the<br />
transportation service in a defined area. The number <strong>of</strong> points will be awarded at<br />
the discretion <strong>of</strong> the Committee.<br />
2. Rating Option 2 – Two points will be awarded for every entity that is providing<br />
matching funds, regardless <strong>of</strong> source. However, any participating entity must be<br />
governed or managed independently from the project sponsor. One additional<br />
point will be awarded to the project for each agency whose clients are served by<br />
<strong>Oklahoma</strong> Locally Coordinated Public Transit 51<br />
Human Service <strong>Transportation</strong> <strong>Plan</strong>
Section 7: Evaluation<br />
the project or may purchase the service provided by the project and for<br />
facilitation <strong>of</strong> a connection to other transportation-related services.<br />
While the Rating Option 1 is capped at 20 points, if the project sponsor chooses Rating<br />
Option 2, up to 25 points are available.<br />
Funding Mix Rating<br />
Capital projects and mobility management programs may utilize FTA funds for up 80<br />
percent <strong>of</strong> the project cost, while operating expenses are capped at 50 percent <strong>of</strong> the<br />
project cost. In certain circumstances ODOT will permit FTA funds to a maximum <strong>of</strong> 83<br />
percent when a vehicle purchase satisfies requirements <strong>of</strong> ADA or Clean Air Act<br />
Amendments.<br />
Project sponsors must identify the source and amount <strong>of</strong> matching funds for their<br />
project. Table 7.1 outlines the points awarded for those projects that can provide more<br />
than their required match to the FTA funds, reducing the federal share to the amounts<br />
shown in the table. Project sponsors should identify the funding category for which<br />
their project best qualifies. Project sponsors are reminded that FTA matching<br />
requirements stipulate that the percentage match is based on net operating cost (The<br />
total operating cost less the expected fare revenue).<br />
Table 7.1: Funding Mix Rating<br />
Federal Share for<br />
Capital Projects<br />
(Capped at 80%)<br />
Federal Share for<br />
Operating Projects<br />
(Capped at 50%)<br />
Points<br />
Awarded<br />
Any Reduction Any Reduction 1<br />
60-75% 35-45% 2<br />
45-60% 25-35% 4<br />
Less than 45% Less than 25% 7<br />
If 2.5 percent or more <strong>of</strong> matching funds are derived from local sources such as private<br />
sector funds, municipal or county governments or local foundations, the project will<br />
receive an extra five points for cash contributions and two points for in-kind<br />
contributions.<br />
If the project is eligible for two or more <strong>of</strong> following FTA funding categories: urban,<br />
small urban (Section 5307), rural (Section 5311), Section 5310, Section 5316 or<br />
Section 5317, it will be awarded two bonus points. Eligible activities are described in<br />
Appendix A.<br />
Scope <strong>of</strong> the Project<br />
The point value will be increased based on the target populations served and the area<br />
the project serves. The project can gain additional points by showing that it<br />
accomplishes one or more <strong>of</strong> the following:<br />
<strong>Oklahoma</strong> Locally Coordinated Public Transit 52<br />
Human Service <strong>Transportation</strong> <strong>Plan</strong>
Section 7: Evaluation<br />
Add 1 point if the project addresses two <strong>of</strong> the targeted populations (elderly,<br />
disabled and/or low income);<br />
Add 5 points if the project addresses all three <strong>of</strong> the targeted populations;<br />
Add points if the project encompasses significant portions <strong>of</strong> the State. Table 7.2<br />
references the point values awarded to projects that encompass a given<br />
proportion <strong>of</strong> the State (based on area or population);<br />
Table 7.2: Project Scope Rating<br />
Proportion <strong>of</strong><br />
State Served<br />
1-3% 3-6% 6-10% 10-20% 20-35% 35-50% 51-75% 75%+<br />
Point Value 1 2 4 6 9 12 16 20<br />
Consistency with the Coordinated <strong>Plan</strong><br />
Each <strong>of</strong> the needs identified has been given a corresponding point value based on the<br />
emphasis placed on it during the <strong>Plan</strong> development process. Projects that reduce<br />
costs and maximize resources will receive points as well. The point values associated<br />
with each need and strategy are shown below in Table 7.3<br />
Table 7.3: Consistency with Coordinated <strong>Plan</strong><br />
Addresses an Identified Gap or Strategy<br />
Points<br />
Need for more Services<br />
Enhance Intercity <strong>Transportation</strong> 5<br />
Increase Geographic Coverage <strong>of</strong> Service 4<br />
Provide <strong>Transportation</strong> for Those not Eligible 2<br />
Increase Evening and Weekend <strong>Transportation</strong> 2<br />
Access to Jobs<br />
Increase Service for Low-income Individuals to Job Centers 5<br />
Provide Service Accommodations for 2nd and 3rd Shift Jobs 2<br />
Marketing <strong>of</strong> Services<br />
Increase Awareness <strong>of</strong> Available Service 5<br />
Make Transit More Affordable for the User 1<br />
Efficiency <strong>of</strong> Service<br />
Improve Connectivity to Services 3<br />
Improve the Response Time for On-Demand Services<br />
for reservations 1<br />
for return trips 1<br />
Need for Capital Improvements<br />
Improve Passenger Waiting Areas 2<br />
Enhance ADA Accessibility 2<br />
Strategic Collaboration<br />
Increase the Utilization <strong>of</strong> Existing Services and Resources 4<br />
Addresses the Rising Cost <strong>of</strong> Providing Service 1<br />
<strong>Oklahoma</strong> Locally Coordinated Public Transit 53<br />
Human Service <strong>Transportation</strong> <strong>Plan</strong>
Section 7: Evaluation<br />
Other Project Details<br />
The project may be awarded additional points for meeting other established criteria, as<br />
outlined in Table 7.4.<br />
Performance <strong>Plan</strong><br />
Table 7.4: Other Project Details<br />
Criteria<br />
Points<br />
Project requests only one year <strong>of</strong> funding 10<br />
Operating project requests two years <strong>of</strong> funding with a<br />
future source <strong>of</strong> funding identified<br />
Project takes advantage <strong>of</strong> new technology 3<br />
Shows reduction in federal funding over time 8<br />
Partial funding options are identified by either reducing<br />
the scale or altering the schedule <strong>of</strong> the project<br />
New Projects (Up to 25 Points)<br />
Applicants must submit three clearly-defined measurable outcome-based performance<br />
measures to track the effectiveness <strong>of</strong> the project in meeting the identified goals and<br />
impact on transportation-disadvantaged residents. A proposed plan <strong>of</strong> action should be<br />
provided for ongoing monitoring and evaluation <strong>of</strong> the service. Up to 25 points will be<br />
awarded to projects with acceptable performance measures based on the review <strong>of</strong><br />
the Committee. If the performance measures are determined to be unacceptable, then<br />
the project will forfeit the points and if selected for funding will be subject to evaluation<br />
criteria established by the Committee. More information about how to establish<br />
performance measures for a project will be available at the mandatory training<br />
workshops.<br />
Capital Projects must have a milestone-based performance plan. The sponsor should<br />
provide dates for implementation and minimum utilization thresholds. (NOTE: Vehicles<br />
purchased with Section 5310 funds must meet a minimum utilization standard set by<br />
the <strong>Oklahoma</strong> DHS.)<br />
Operating Projects must set a productivity (riders/week, riders/mile, etc) threshold<br />
based on regional and/or national statistical information and its scope <strong>of</strong> service.<br />
Phased goals will be acceptable in order to take into consideration the time it may take<br />
for operating projects to reach their intended level <strong>of</strong> productivity.<br />
Existing Projects without a Previous Performance <strong>Plan</strong> (Up to 23 Points)<br />
Existing Projects requesting funding that have not previously developed a performance<br />
plan will be evaluated based on service effectiveness, cost efficiency, and cost<br />
effectiveness as outlined in Table 7.5<br />
10<br />
3<br />
<strong>Oklahoma</strong> Locally Coordinated Public Transit 54<br />
Human Service <strong>Transportation</strong> <strong>Plan</strong>
Section 7: Evaluation<br />
Table 7.5: Criteria for Existing Projects without a Performance <strong>Plan</strong><br />
Criteria<br />
Above Range <strong>of</strong><br />
Industry Standard<br />
Within Range <strong>of</strong><br />
Industry Standard<br />
Below Industry<br />
Standard<br />
Service Effectiveness 8 points 4 points no points<br />
Service Consumed/Units Produced<br />
Cost Efficiency 8 points 4 points no points<br />
Cost/Units Produced<br />
Cost Effectiveness 7 points 4 points no points<br />
Cost/Service Consumed<br />
Existing Projects with a Performance <strong>Plan</strong> (Up to 30 points)<br />
Applicants must submit an assessment as to how their project met their program’s<br />
defined performance plan over the past year. An existing project will be awarded<br />
points based on the number <strong>of</strong> performance measures in which their project exceeded<br />
or met predicted thresholds. Note: That all performance plans must have three<br />
measures. Projects are awarded ten points for each performance criteria met to a<br />
maximum <strong>of</strong> 30 points.<br />
Projects meeting two out <strong>of</strong> three <strong>of</strong> their criteria will be awarded an additional seven<br />
points if the applicant can show that a corrective action has been implemented and<br />
that the program is meeting its third performance measure over the past quarter.<br />
Alternatively, an additional four points will be awarded if the applicant can identify a<br />
reasonable cause for the program not meeting its third performance measure and<br />
define a corrective action for subsequent years.<br />
Projects that meet only one or none <strong>of</strong> their established criteria will be awarded an<br />
additional five points if they can identify a reasonable cause for the program’s unmet<br />
performance measures and define a corrective action for subsequent years. The total<br />
allowable points for existing projects with a performance plan are outlined in Table 7.6,<br />
below:<br />
Table 7.6: Criteria for Existing Projects with a Performance <strong>Plan</strong><br />
Project Meets None <strong>of</strong> the Performance Measure Criteria<br />
Identifies Reasonable Cause and Corrective Action<br />
Maximum Points Allowable<br />
Project Meets Criteria for 1 out <strong>of</strong> 3 Performance Measures<br />
Identifies Reasonable Cause and Corrective Action<br />
Maximum Points Allowable<br />
Project Meets Criteria for 2 out <strong>of</strong> 3 Performance Measures<br />
Implemented Corrective Action and Met Criteria Over Last<br />
Quarter<br />
or Identifies Reasonable Cause and Corrective Action<br />
Maximum Points Allowable<br />
Project Meets Criteria for 3 out <strong>of</strong> 3 Performance Measures<br />
Maximum Points Allowable<br />
Zero<br />
points<br />
5 points<br />
5 points<br />
10 points<br />
5 points<br />
15 points<br />
20 points<br />
7 points<br />
4 points<br />
27 points<br />
30 points<br />
30 points<br />
<strong>Oklahoma</strong> Locally Coordinated Public Transit 55<br />
Human Service <strong>Transportation</strong> <strong>Plan</strong>
This page is intentionally left blank.<br />
<strong>Oklahoma</strong> Locally Coordinated Public Transit 56<br />
Human Service <strong>Transportation</strong> <strong>Plan</strong>
<strong>Oklahoma</strong> Locally Coordinated Public Transit 57<br />
February 2012<br />
Human Service <strong>Transportation</strong> <strong>Plan</strong>
<strong>Oklahoma</strong> Locally Coordinated Public Transit<br />
Human Service <strong>Transportation</strong> <strong>Plan</strong><br />
This page is intentionally left blank.
Appendix A: Funding Sources<br />
APPENDIX A: FUNDING SOURCES<br />
Elderly Individuals and Individuals with Disabilities (Section 5310)<br />
Program Overview: Established in 1975, Section 5310 has been primarily directed to<br />
social/human service agencies, non-pr<strong>of</strong>it organizations and other public bodies for the<br />
purchase <strong>of</strong> vehicles. The program is administered through the State and it is at the<br />
state level that specific funding decisions are made.<br />
Program Goal: The goal <strong>of</strong> the Section 5310 program is to improve mobility for elderly<br />
individuals and individuals with disabilities throughout the country.<br />
Eligible Activities: The program funds capital expenses including, but not limited to,<br />
the following list <strong>of</strong> items.<br />
Vehicles and vehicle related expenses including: Buses; Vans; Radios and<br />
communication equipment; Vehicle shelters; Wheelchair lifts and restraints;<br />
Vehicle rehabilitation; manufacture, or overhaul; Preventive maintenance, as<br />
defined in the National Transit Database (NTD); and Extended warranties which<br />
do not exceed the industry standard.<br />
Lease <strong>of</strong> equipment when lease is more cost effective than purchase.<br />
Computer hardware and s<strong>of</strong>tware.<br />
Initial component installation costs.<br />
Vehicle procurement, testing, inspection, and acceptance costs.<br />
Acquisition <strong>of</strong> transportation services under a contract, lease, or other<br />
arrangement.<br />
The introduction <strong>of</strong> new technology into public transportation.<br />
Transit related intelligent transportation systems (ITS).<br />
Supporting new mobility management and coordination programs among public<br />
transportation providers and other human service agencies providing<br />
transportation.<br />
Expenses are reimbursed at up to 80 percent federal funds with a 20 percent local<br />
match. Certain expenditures made in an effort to satisfy the Americans with Disabilities<br />
Act or the Clean Air Act Amendments can be reimbursed up to a 90 percent federal<br />
commitment with a 10 percent local match. In <strong>Oklahoma</strong>, the 5310 Program is<br />
administered by the Aging Division <strong>of</strong> the <strong>Oklahoma</strong> <strong>Department</strong> <strong>of</strong> Human Services<br />
(DHS). Applications for vehicles are accepted at any time with a formal call for<br />
applications made during the summer months. Vehicle procurement is conducted by<br />
DHS in December or January and vehicles are delivered during the second quarter <strong>of</strong><br />
the subsequent year. No substantive changes are being made to this program except<br />
that projects addressing the gaps in this plan will receive additional consideration.<br />
<strong>Oklahoma</strong> Locally Coordinated Public Transit A-1<br />
Human Service <strong>Transportation</strong> <strong>Plan</strong>
Appendix A: Funding Sources<br />
Job Access and Reverse Commute (Section 5316)<br />
Program Overview: Established in 1997 under TEA-21, Section 5316 actually evolved<br />
out <strong>of</strong> the Access to Work Program which was designed to provide transportation to<br />
TANF recipients to and from training and employment with the idea <strong>of</strong> transitioning<br />
them from the program. Since then, the program has been expanded and combined<br />
with federal efforts to create more connections to suburban employment centers for<br />
low-income individuals. The program is also administered through the State and it is at<br />
the state level that specific funding decisions are made.<br />
Program Goal: The goal <strong>of</strong> the Section 5316 program is to improve access for lowincome<br />
individuals to transportation that serves employment and employment related<br />
activities and to transport residents <strong>of</strong> urbanized areas and non-urbanized areas to<br />
suburban employment opportunities.<br />
Eligible Activities: Eligible projects may include, but are not limited to capital,<br />
planning, and operating assistance to support activities such as:<br />
Late-night and weekend service; Guaranteed ride home service; Shuttle service;<br />
Ridesharing and carpooling activities and other services designed to support<br />
employee commutes made on alternative modes<br />
Expanding fixed-route public transit routes or demand-responsive van service<br />
Transit-related aspects <strong>of</strong> bicycling (such as bike racks on vehicles and bike<br />
parking) Car loan programs to assist individuals in purchasing or maintaining<br />
vehicles for shared rides<br />
Promoting, through marketing efforts, the use <strong>of</strong> transit and the development <strong>of</strong><br />
employer-provided transportation such as shuttles, ridesharing, or transit pass<br />
programs<br />
Supporting the administration and expenses related to voucher programs.<br />
Acquiring Geographic Information System (GIS) tools<br />
Implementing Intelligent <strong>Transportation</strong> Systems (ITS)<br />
Integrating automated regional public transit and human service transportation<br />
information, scheduling and dispatch functions<br />
Deploying vehicle position-monitoring systems<br />
Subsidizing and otherwise facilitating the provision <strong>of</strong> public transportation<br />
services to suburban employment opportunities<br />
Supporting new mobility management and coordination programs among public<br />
transportation providers and other human service agencies providing<br />
transportation<br />
New Freedom Program (Section 5317)<br />
Program Overview: The New Freedom Program was newly established under<br />
SAFETEA-LU. The program is also administered through the State and it is at the state<br />
level that specific funding decisions are made.<br />
Program Goal: The New Freedom formula grant program is a new program designed<br />
<strong>Oklahoma</strong> Locally Coordinated Public Transit A-2<br />
Human Service <strong>Transportation</strong> <strong>Plan</strong>
Appendix A: Funding Sources<br />
to provide additional tools to overcome existing barriers facing Americans with<br />
disabilities seeking integration into the work force and full participation in society. The<br />
New Freedom program seeks to expand the transportation mobility options available to<br />
people with disabilities beyond the requirements <strong>of</strong> the ADA.<br />
Eligible Activities: New Freedom Program funds are available for capital and operating<br />
expenses to support activities such as:<br />
Enhancing paratransit beyond the minimum requirements <strong>of</strong> the ADA, such as:<br />
- Expanding paratransit service parameters beyond the ¾ mile required<br />
- Expanding current hours <strong>of</strong> operation for ADA paratransit services that are<br />
beyond the hours <strong>of</strong> fixed-route services<br />
- Providing same day service or making door-to-door service available to all<br />
eligible ADA paratransit riders in a system that is not otherwise curb-tocurb<br />
- Enhancing the level <strong>of</strong> service by providing escorts or assisting riders<br />
through the door <strong>of</strong> their destination<br />
- Acquiring vehicles and equipment designed to accommodate mobility aids<br />
that exceed the dimensions and weight ratings established for common<br />
wheelchairs under the ADA and labor costs <strong>of</strong> aides to help drivers assist<br />
passengers with over-sized wheelchairs<br />
- Installation <strong>of</strong> additional securement locations in public buses beyond ADA<br />
requirements<br />
Creating new “feeder” service (transit service that provides access) to commuter<br />
rail, commuter bus, intercity rail, and intercity bus stations, for which<br />
complementary paratransit service is not required under the ADA<br />
Making accessibility improvements to transit and intermodal stations not<br />
designated as key stations. This may include:<br />
- Building an accessible path to a bus stop that is currently inaccessible,<br />
including curb cuts, sidewalks, accessible pedestrian signals or other<br />
accessible features<br />
- Adding elevators, ramps, detectable warnings, or other improvements to a<br />
non-key station that are not otherwise required under the ADA<br />
- Improving signage or way-finding technology<br />
- Implementing technologies that enhance accessibility for people with<br />
disabilities including Intelligent <strong>Transportation</strong> Systems (ITS)<br />
Implementing training programs for individual users that increase awareness and<br />
knowledge <strong>of</strong> public and alternative transportation options available in their<br />
communities<br />
Purchasing vehicles to support new accessible taxi, ride sharing, or vanpooling<br />
programs<br />
Supporting the administration and expenses related to new voucher programs for<br />
transportation services <strong>of</strong>fered by human service providers<br />
Supporting new volunteer driver and aide programs<br />
Supporting new mobility management and coordination programs among public<br />
transportation providers and other human service agencies providing<br />
transportation<br />
<strong>Oklahoma</strong> Locally Coordinated Public Transit A-3<br />
Human Service <strong>Transportation</strong> <strong>Plan</strong>
Appendix A: Funding Sources<br />
Urbanized Area Formula Program (Section 5307)<br />
Program Overview: For urbanized areas with 200,000 in population and over, funds<br />
are apportioned and flow directly to a designated recipient selected locally to apply for<br />
and receive Federal funds. For urbanized areas under 200,000 in population, the funds<br />
are apportioned to the State for distribution.<br />
Program Goal: The Urbanized Area formula grant program makes resources available<br />
to urbanized areas and governors for transit capital and operating assistance in<br />
urbanized areas and for transportation related planning.<br />
Eligible Activities: Eligible planning and capital investments include:<br />
<strong>Plan</strong>ning, engineering design and evaluation <strong>of</strong> transit projects and other<br />
technical transportation-related studies<br />
Replacing, overhauling and rebuilding buses<br />
Installing crime prevention and security equipment<br />
Constructing bus maintenance and passenger facilities<br />
Creating new and maintaining existing fixed guideway systems<br />
For urbanized areas with populations less than 200,000, operating assistance is an<br />
eligible expense. In these areas, at least one percent <strong>of</strong> the funding apportioned to each<br />
area must be used for transit enhancement activities such as historic preservation,<br />
landscaping, public art, pedestrian access, bicycle access, and enhanced access for<br />
persons with disabilities.<br />
The Federal share is not to exceed 80 percent <strong>of</strong> the net project cost. The Federal<br />
share may be 90 percent for the cost <strong>of</strong> vehicle-related equipment attributable to<br />
compliance with the Americans With Disabilities Act and the Clean Air Act. The Federal<br />
share may also be 90 percent for projects or portions <strong>of</strong> projects related to bicycles. The<br />
Federal share may not exceed 50 percent <strong>of</strong> the net project cost <strong>of</strong> operating<br />
assistance.<br />
Transit Capital Investment Program (Section 5309)<br />
Program Overview: This program provides capital funding for a wide variety <strong>of</strong><br />
purchases including vehicles and facilities.<br />
Program Goal: This program allows Congressional Representatives and Senators to<br />
sponsor and direct funds towards a particular project <strong>of</strong> relevance, <strong>of</strong>ten through the<br />
“earmark” process.<br />
Eligible Activities: The Transit Capital Investment Program provides capital assistance<br />
for three primary activities:<br />
Purchase <strong>of</strong> new and replacement busses and facilities<br />
Modernization <strong>of</strong> existing rail systems<br />
New fixed guideway systems (New Starts)<br />
<strong>Oklahoma</strong> Locally Coordinated Public Transit A-4<br />
Human Service <strong>Transportation</strong> <strong>Plan</strong>
Appendix A: Funding Sources<br />
Non-Urbanized Area Formula Grant Program (Section 5311)<br />
Program Overview: Provides a wide variety <strong>of</strong> capital, planning and operational<br />
assistance to rural areas <strong>of</strong> population less than 50,000. Recipients can be public<br />
agencies, non-pr<strong>of</strong>it agencies and Native American Tribes.<br />
Program Goal: The goals <strong>of</strong> the non-urbanized formula program are:<br />
To enhance the access <strong>of</strong> people in non-urbanized areas to health care,<br />
shopping, education, employment, public services and recreation<br />
To assist in the maintenance and development improvement and use <strong>of</strong> public<br />
transportation systems in rural and small urban areas<br />
To encourage the most efficient use <strong>of</strong> federal funds used to provide passenger<br />
transportation in non-urbanized areas through the coordination <strong>of</strong> programs and<br />
services<br />
To assist in the development and support <strong>of</strong> intercity bus transportation<br />
To provide for the participation <strong>of</strong> private transportation providers in nonurbanized<br />
transportation to the maximum extent feasible.<br />
Eligible Activities: Operating assistance - The maximum Federal share is 50 percent<br />
<strong>of</strong> the net operating costs. State operating funds (STOA) may be used as federal match.<br />
Capital assistance - The maximum Federal share is 80 percent <strong>of</strong> the eligible project<br />
cost.<br />
Over-the-Road Bus Program (Section 3038)<br />
Program Overview: Provides capital assistance to private operators <strong>of</strong> over-the-road<br />
bus lines for accessibility related improvements.<br />
Program Goal: To assist intercity fixed-route, commuter, charter, and tour bus services<br />
in complying with the <strong>Transportation</strong> for Individuals with Disabilities Act.<br />
Eligible Activities: Capital projects related to improving accessibility, including retr<strong>of</strong>it<br />
<strong>of</strong> lifts and purchase <strong>of</strong> new vehicles. May also cover the expenses related to training<br />
staff in the use <strong>of</strong> ADA equipment and assistance <strong>of</strong> riders with disabilities.<br />
<strong>Oklahoma</strong> Locally Coordinated Public Transit A-5<br />
Human Service <strong>Transportation</strong> <strong>Plan</strong>
The Temporary Assistance for Needy Families (TANF) Program<br />
Appendix A: Funding Sources<br />
Program Overview: This program is funded through the <strong>Department</strong> <strong>of</strong> Health and<br />
Human Service and makes payments directly to clients.<br />
Program Goal: This program has a broad spectrum <strong>of</strong> human service goals including<br />
providing assistance to needy families and ending the dependence <strong>of</strong> needy parents on<br />
government benefits by promoting job preparation, work and marriage.<br />
Eligible Activities: To accomplish these purposes, the State TANF agency may use<br />
TANF funds to provide support services including child care and transportation. Some<br />
examples <strong>of</strong> the ways in which TANF funds can be utilized to provide necessary<br />
transportation services directly to TANF-eligible families or to fund services primarily<br />
benefiting eligible families, include, but are not limited to:<br />
Reimbursement in whole or part to TANF-eligible individuals for work-related<br />
transportation expenses<br />
Contracts for shuttles, buses, car pools, or other transportation services for TANF<br />
eligible individuals<br />
The purchase <strong>of</strong> vans/shuttles/minibuses by State or locale for the provision <strong>of</strong><br />
transportation services to TANF-eligible individuals<br />
The purchase <strong>of</strong> rider "slots," "passes," or vouchers on a public or private transit<br />
system<br />
Financial assistance in the form <strong>of</strong> loans to eligible individuals for the lease or<br />
purchase <strong>of</strong> a vehicle to travel to/from work or work-related activities<br />
Facilitating the donation and repair <strong>of</strong> previously owned or reconditioned vehicles<br />
to eligible families<br />
As an alternative to ongoing assistance, one-time, short-term "diversion"<br />
payments can be made to assist individuals with transportation needs such as<br />
automobile repair or insurance to secure or maintain employment<br />
Payment <strong>of</strong> start-up or operating costs for new or expanded transportation<br />
services benefiting eligible families provided that such costs are necessary and<br />
reasonable, as well as allocated to cover only those costs associated with TANFeligible<br />
individuals<br />
Establishment <strong>of</strong> an Individual Development Account that a TANF-eligible<br />
individual could use to cover qualified business capitalization expenses to<br />
establish a transportation service such as a van, shuttle, or door-to-door<br />
transportation service<br />
The transfer <strong>of</strong> TANF funds to Social Services Block Grants (SSBG) to address<br />
the lack <strong>of</strong> transportation infrastructure in many rural and inner city areas; SSBG<br />
may be used to serve families and children up to 200 percent <strong>of</strong> the poverty level,<br />
allowing states to address the needs <strong>of</strong> the disadvantaged population with a<br />
blend <strong>of</strong> transportation services<br />
Payment <strong>of</strong> costs incurred by State, local, or tribal TANF agency staff involved in<br />
the planning <strong>of</strong> transportation services for TANF eligible individuals<br />
<strong>Oklahoma</strong> Locally Coordinated Public Transit A-7<br />
Human Service <strong>Transportation</strong> <strong>Plan</strong>
Appendix A: Funding Sources<br />
SoonerCare (Medicaid) Program<br />
Program Overview: <strong>Oklahoma</strong>’s Medicaid Program is implemented through DHS. Nonemergency<br />
transportation has been part <strong>of</strong> the <strong>Oklahoma</strong> Medicaid program since<br />
1969, and without transportation, many <strong>of</strong> the Medicaid clients would not get to the<br />
services they need. <strong>Transportation</strong> services for the different programs are provided in<br />
several ways through the SoonerRide Program.<br />
Program Goal: SoonerCare, <strong>Oklahoma</strong>'s Medicaid program, provides health care to<br />
children under the age <strong>of</strong> 19, adults with children under the age <strong>of</strong> 18, pregnant women<br />
and people who are older than 65 or have blindness or another disability.<br />
Eligible Activities: <strong>Transportation</strong> costs for Medicaid-qualified individuals to nonemergency<br />
medical services only.<br />
Workforce Investment Act<br />
Program Overview: The Workforce Investment Act <strong>of</strong> 1998 supersedes the Job<br />
Training Partnership Act (JTPA) to reform federal job training programs and create a<br />
new comprehensive workforce investment system. These funds are administered<br />
through the U.S. <strong>Department</strong> <strong>of</strong> Labor, to the state.<br />
Program Goal: Intended to be customer-focused to help Americans access the tools<br />
they need to manage their careers through information and high quality services, and to<br />
help U.S. companies find skilled workers.<br />
Eligible Activities: In additional to funding job training programs, this program also<br />
provides compensation for transportation costs required to access job training. These<br />
can be for private automobile as well as public transit.<br />
Vocational Rehabilitation <strong>Department</strong><br />
Program Overview: This program is administered by the U.S. <strong>Department</strong> <strong>of</strong> Education<br />
to provide assistance to individuals with a physical or mental disability that impedes<br />
employment.<br />
Program Goal: To expand opportunities for employment, independent life and<br />
economic self-sufficiency by helping <strong>Oklahoma</strong>ns with disabilities bridge barriers to<br />
success in the workplace, school and at home.<br />
Eligible Activities: Reimbursement provided to eligible individuals or public<br />
transportation vendors for the direct cost <strong>of</strong> transportation <strong>of</strong> a client to access<br />
vocational rehabilitation services. Program will also reimburse the cost <strong>of</strong> transportation<br />
for a qualified attendant who accompanies the client to and from services.<br />
<strong>Oklahoma</strong> Locally Coordinated Public Transit A-7<br />
Human Service <strong>Transportation</strong> <strong>Plan</strong>
Appendix A: Funding Sources<br />
Senior Community Service Employment Program<br />
Program Overview: The Senior Community Service Employment Program (SCSEP) is<br />
a community service and work based training program for older workers. Authorized by<br />
the Older Americans Act, the program provides subsidized, service-based training for<br />
low-income persons 55 or older who are unemployed and have poor employment<br />
prospects.<br />
Program Goal: To promote economic self-sufficiency for older individuals who are<br />
working to achieve the American Dream.<br />
Eligible Activities: The program can fund a variety <strong>of</strong> participants’ transportation costs,<br />
including gasoline costs and bus fares. In addition, this program’s participants are<br />
trained and placed with non-pr<strong>of</strong>it agencies and public facilities with wages fully or<br />
partially subsidized by the program.<br />
<strong>Oklahoma</strong> Locally Coordinated Public Transit A-8<br />
Human Service <strong>Transportation</strong> <strong>Plan</strong>
Appendix B: County Specific Data Tables<br />
APPENDIX B: COUNTY SPECIFIC DATA TABLES<br />
Table B.1: County Specific Population and Density Trends<br />
County<br />
2000<br />
Population<br />
2010<br />
Population<br />
Population<br />
Change<br />
Percent<br />
Change<br />
Land area<br />
(sq. miles)<br />
Density per<br />
acre<br />
Adair 21,038 22,683 1,645 7.8% 573 0.06<br />
Alfalfa 6,105 5,642 -463 -7.6% 866 0.01<br />
Atoka 13,879 14,182 303 2.2% 976 0.02<br />
Beaver 5,857 5,636 -221 -3.8% 1815 0.00<br />
Beckham 19,799 22,119 2,320 11.7% 902 0.04<br />
Blaine 11,976 11,943 -33 -0.3% 928 0.02<br />
Bryan 36,534 42,416 5,882 16.1% 904 0.07<br />
Caddo 30,150 29,600 -550 -1.8% 1278 0.04<br />
Canadian 87,697 115,541 27,844 31.8% 897 0.20<br />
Carter 45,621 47,557 1,936 4.2% 822 0.09<br />
Cherokee 42,521 46,987 4,466 10.5% 749 0.10<br />
Choctaw 15,342 15,205 -137 -0.9% 770 0.03<br />
Cimarron 3,148 2,475 -673 -21.4% 1835 0.00<br />
Cleveland 208,016 255,755 47,739 22.9% 539 0.74<br />
Coal 6,031 5,925 -106 -1.8% 517 0.02<br />
Comanche 114,996 124,098 9,102 7.9% 1069 0.18<br />
Cotton 6,614 6,193 -421 -6.4% 633 0.02<br />
Craig 14,950 15,029 79 0.5% 761 0.03<br />
Creek 67,367 69,967 2,600 3.9% 950 0.12<br />
Custer 26,142 27,469 1,327 5.1% 989 0.04<br />
Delaware 37,077 41,487 4,410 11.9% 738 0.09<br />
Dewey 4,743 4,810 67 1.4% 999 0.01<br />
Ellis 4,075 4,151 76 1.9% 1232 0.01<br />
Garfield 57,813 60,580 2,767 4.8% 1058 0.09<br />
Garvin 27,210 27,576 366 1.3% 802 0.05<br />
Grady 45,516 52,431 6,915 15.2% 1101 0.07<br />
Grant 5,144 4,527 -617 -12.0% 1001 0.01<br />
Greer 6,061 6,239 178 2.9% 639 0.02<br />
Harmon 3,283 2,922 -361 -11.0% 537 0.01<br />
Harper 3,562 3,685 123 3.5% 1039 0.01<br />
Haskell 11,792 12,769 977 8.3% 577 0.03<br />
Hughes 14,154 14,003 -151 -1.1% 805 0.03<br />
Jackson 28,439 26,446 -1,993 -7.0% 803 0.05<br />
Jefferson 6,818 6,472 -346 -5.1% 759 0.01<br />
Johnston 10,513 10,957 444 4.2% 643 0.03<br />
Kay 48,080 46,562 -1,518 -3.2% 920 0.08<br />
Kingfisher 13,926 15,034 1,108 8.0% 898 0.03<br />
<strong>Oklahoma</strong> Locally Coordinated Public Transit B-1<br />
Human Service <strong>Transportation</strong> <strong>Plan</strong>
Table B.1: County Specific Population and Density Trends<br />
Appendix B: County Specific Data Tables<br />
County<br />
2000<br />
Population<br />
2010<br />
Population<br />
Population<br />
Change<br />
Percent<br />
Change<br />
Land area<br />
(sq. miles)<br />
Density<br />
per acre<br />
Kiowa 10,227 9,446 -781 -7.6% 1015 0.01<br />
Latimer 10,692 11,154 462 4.3% 722 0.02<br />
Le Flore 48,109 50,384 2,275 4.7% 1589 0.05<br />
Lincoln 32,080 34,273 2,193 6.8% 952 0.06<br />
Logan 33,924 41,848 7,924 23.4% 744 0.09<br />
Love 8,831 9,423 592 6.7% 514 0.03<br />
McClain 27,740 34,506 6,766 24.4% 571 0.09<br />
McCurtain 34,402 33,151 -1,251 -3.6% 1850 0.03<br />
McIntosh 19,456 20,252 796 4.1% 619 0.05<br />
Major 7,545 7,527 -18 -0.2% 955 0.01<br />
Marshall 13,184 15,840 2,656 20.1% 371 0.07<br />
Mayes 38,369 41,259 2,890 7.5% 655 0.10<br />
Murray 12,623 13,488 865 6.9% 416 0.05<br />
Muskogee 69,451 70,990 1,539 2.2% 810 0.14<br />
Noble 11,411 11,561 150 1.3% 732 0.02<br />
Nowata 10,569 10,536 -33 -0.3% 566 0.03<br />
Okfuskee 11,814 12,191 377 3.2% 619 0.03<br />
<strong>Oklahoma</strong> 660,448 718,633 58,185 8.8% 709 1.58<br />
Okmulgee 39,685 40,069 384 1.0% 697 0.09<br />
Osage 44,437 47,472 3,035 6.8% 2246 0.03<br />
Ottawa 33,194 31,848 -1,346 -4.1% 471 0.11<br />
Pawnee 16,612 16,577 -35 -0.2% 568 0.05<br />
Payne 68,190 77,350 9,160 13.4% 685 0.18<br />
Pittsburg 43,953 45,837 1,884 4.3% 1305 0.05<br />
Pontotoc 35,143 37,492 2,349 6.7% 720 0.08<br />
Pottawatomie 65,521 69,442 3,921 6.0% 788 0.14<br />
Pushmataha 11,667 11,572 -95 -0.8% 1396 0.01<br />
Roger Mills 3,436 3,647 211 6.1% 1141 0.01<br />
Rogers 70,641 86,905 16,264 23.0% 676 0.20<br />
Seminole 24,894 25,482 588 2.4% 633 0.06<br />
Sequoyah 38,972 42,391 3,419 8.8% 673 0.10<br />
Stephens 43,182 45,048 1,866 4.3% 870 0.08<br />
Texas 20,107 20,640 533 2.7% 2041 0.02<br />
Tillman 9,287 7,992 -1,295 -13.9% 871 0.01<br />
Tulsa 563,299 603,403 40,104 7.1% 570 1.65<br />
Wagoner 57,491 73,085 15,594 27.1% 562 0.20<br />
Washington 48,996 50,976 1,980 4.0% 415 0.19<br />
Washita 11,508 11,629 121 1.1% 1003 0.02<br />
Woods 9,089 8,878 -211 -2.3% 1286 0.01<br />
Woodward 18,486 20,081 1,595 8.6% 1242 0.03<br />
State Total 3,450,654 3,751,351 300,697 8.7% 68595 0.09<br />
Source: 2000 U.S. Census, 2010 U.S. Census<br />
<strong>Oklahoma</strong> Locally Coordinated Public Transit B-2<br />
Human Service <strong>Transportation</strong> <strong>Plan</strong>
Table B.2: Change in Low-Income Identifiers<br />
Appendix B: County Specific Data Tables<br />
Percent Living Below Poverty Median Household Income Zero-Vehicle Households<br />
County 2000 2010 Change 2000 2010 Change 2000 2010 Change<br />
Adair 23.2% 26.5% 3.3% $24,881 $29,811 $4,930 9.8% 5.6% -4.2%<br />
Alfalfa 13.7% 11.1% -2.6% $30,259 $42,500 $12,241 5.3% 2.8% -2.5%<br />
Atoka 19.8% 22.5% 2.7% $24,752 $31,179 $6,427 7.8% 5.3% -2.5%<br />
Beaver 11.7% 12.4% 0.7% $36,715 $49,743 $13,028 3.3% 1.4% -1.9%<br />
Beckham 18.2% 16.0% -2.2% $27,402 $43,642 $16,240 8.1% 5.9% -2.2%<br />
Blaine 16.9% 14.8% -2.1% $28,356 $41,421 $13,065 5.1% 6.2% 1.1%<br />
Bryan 18.4% 19.1% 0.7% $27,888 $37,230 $9,342 7.2% 5.8% -1.4%<br />
Caddo 21.7% 20.9% -0.8% $27,347 $36,413 $9,066 7.8% 5.7% -2.1%<br />
Canadian 7.9% 7.9% 0.0% $45,439 $60,489 $15,050 3.8% 2.5% -1.3%<br />
Carter 16.6% 16.5% -0.1% $29,405 $38,385 $8,980 8.2% 6.8% -1.4%<br />
Cherokee 22.9% 26.3% 3.4% $26,536 $32,322 $5,786 8.7% 6.4% -2.3%<br />
Choctaw 24.3% 24.6% 0.3% $22,743 $27,549 $4,806 10.0% 9.2% -0.8%<br />
Cimarron 17.6% 21.8% 4.2% $30,625 $34,096 $3,471 5.6% 6.1% 0.5%<br />
Cleveland 10.6% 12.1% 1.5% $41,846 $52,688 $10,842 4.3% 3.6% -0.7%<br />
Coal 23.1% 21.6% -1.5% $23,705 $31,764 $8,059 9.1% 11.0% 1.9%<br />
Comanche 15.6% 17.4% 1.8% $33,867 $44,012 $10,145 8.2% 6.5% -1.7%<br />
Cotton 18.2% 13.1% -5.1% $27,210 $44,144 $16,934 6.0% 4.9% -1.1%<br />
Craig 13.7% 17.1% 3.4% $30,997 $39,836 $8,839 6.5% 4.7% -1.8%<br />
Creek 13.5% 15.4% 1.9% $33,168 $42,314 $9,146 6.1% 5.4% -0.7%<br />
Custer 18.5% 16.9% -1.6% $28,524 $42,108 $13,584 5.6% 5.7% 0.1%<br />
Delaware 18.3% 21.2% 2.9% $27,996 $34,383 $6,387 4.3% 3.9% -0.4%<br />
Dewey 15.0% 13.6% -1.4% $28,172 $39,940 $11,768 5.2% 2.9% -2.3%<br />
Ellis 12.5% 13.9% 1.4% $27,951 $43,032 $15,081 5.2% 2.4% -2.8%<br />
Garfield 13.9% 16.8% 2.9% $33,006 $40,636 $7,630 6.4% 4.7% -1.7%<br />
Garvin 15.9% 15.8% -0.1% $28,070 $37,785 $9,715 6.6% 4.2% -2.4%<br />
Grady 13.9% 14.8% 0.9% $32,625 $45,260 $12,635 6.4% 3.8% -2.6%<br />
Grant 13.7% 10.3% -3.4% $28,977 $42,043 $13,066 3.7% 3.5% -0.2%<br />
Greer 19.6% 15.6% -4.0% $25,793 $35,096 $9,303 7.4% 5.0% -2.4%<br />
Harmon 29.7% 26.9% -2.8% $22,365 $31,679 $9,314 9.7% 5.9% -3.8%<br />
Harper 10.2% 12.5% 2.3% $33,705 $39,946 $6,241 4.2% 0.5% -3.7%<br />
Haskell 20.5% 12.3% -8.2% $24,553 $37,474 $12,921 10.6% 5.6% -5.0%<br />
Hughes 21.9% 21.9% 0.0% $22,621 $32,677 $10,056 8.4% 6.3% -2.1%<br />
Jackson 16.2% 18.3% 2.1% $30,737 $41,437 $10,700 6.7% 7.4% 0.7%<br />
Jefferson 19.2% 16.7% -2.5% $23,674 $32,750 $9,076 9.6% 7.0% -2.6%<br />
Johnston 22.0% 19.9% -2.1% $24,592 $34,556 $9,964 8.8% 5.0% -3.8%<br />
Kay 16.0% 17.9% 1.9% $30,762 $39,505 $8,743 6.8% 5.3% -1.5%<br />
Kingfisher 10.8% 12.0% 1.2% $36,676 $49,104 $12,428 4.3% 2.6% -1.7%<br />
Kiowa 19.3% 20.2% 0.9% $26,053 $32,565 $6,512 6.3% 4.2% -2.1%<br />
Latimer 22.7% 13.9% -8.8% $23,962 $42,639 $18,677 7.9% 3.9% -4.0%<br />
Le Flore 19.1% 20.7% 1.6% $27,278 $36,335 $9,057 8.0% 5.9% -2.1%<br />
Lincoln 14.5% 14.8% 0.3% $31,187 $42,282 $11,095 5.4% 4.2% -1.2%<br />
<strong>Oklahoma</strong> Locally Coordinated Public Transit B-3<br />
Human Service <strong>Transportation</strong> <strong>Plan</strong>
Appendix B: County Specific Data Tables<br />
Table B.2: Change in Low-Income Identifiers<br />
Percent Living Below Poverty Median Household Income Zero-Vehicle Households<br />
County 2000 2010 Change 2000 2010 Change 2000 2010 Change<br />
Logan 12.9% 15.0% 2.1% $36,784 $48,683 $11,899 5.0% 5.2% 0.2%<br />
Love 11.8% 14.2% 2.4% $32,558 $41,629 $9,071 4.8% 4.7% -0.1%<br />
McClain 10.5% 9.4% -1.1% $37,275 $53,708 $16,433 4.1% 1.7% -2.4%<br />
McCurtain 24.7% 27.7% 3.0% $24,162 $31,082 $6,920 9.7% 9.6% -0.1%<br />
McIntosh 18.2% 22.5% 4.3% $25,964 $30,620 $4,656 7.0% 6.0% -1.0%<br />
Major 12.0% 10.3% -1.7% $30,949 $46,748 $15,799 4.0% 1.1% -2.9%<br />
Marshall 17.9% 14.4% -3.5% $26,437 $40,419 $13,982 7.4% 4.7% -2.7%<br />
Mayes 14.3% 16.9% 2.6% $31,125 $41,228 $10,103 6.1% 5.6% -0.5%<br />
Murray 14.1% 15.5% 1.4% $30,294 $40,870 $10,576 6.0% 4.2% -1.8%<br />
Muskogee 17.9% 19.1% 1.2% $28,438 $37,002 $8,564 9.0% 8.2% -0.8%<br />
Noble 12.8% 13.5% 0.7% $33,968 $39,515 $5,547 4.2% 5.3% 1.1%<br />
Nowata 14.1% 17.6% 3.5% $29,470 $37,500 $8,030 6.5% 3.0% -3.5%<br />
Okfuskee 23.0% 24.6% 1.6% $24,324 $33,286 $8,962 8.9% 7.7% -1.2%<br />
<strong>Oklahoma</strong> 15.3% 16.8% 1.5% $35,063 $42,916 $7,853 7.8% 6.5% -1.3%<br />
Okmulgee 18.9% 20.3% 1.4% $27,652 $37,820 $10,168 10.5% 7.8% -2.7%<br />
Osage 13.2% 12.6% -0.6% $34,477 $41,125 $6,648 6.3% 5.1% -1.2%<br />
Ottawa 16.6% 18.2% 1.6% $27,507 $35,483 $7,976 8.0% 6.2% -1.8%<br />
Pawnee 13.0% 18.2% 5.2% $31,661 $40,059 $8,398 5.3% 3.8% -1.5%<br />
Payne 20.3% 23.4% 3.1% $28,733 $34,752 $6,019 6.4% 5.4% -1.0%<br />
Pittsburg 17.2% 16.7% -0.5% $28,679 $39,245 $10,566 9.1% 5.6% -3.5%<br />
Pontotoc 16.5% 20.5% 4.0% $26,955 $37,484 $10,529 7.1% 6.2% -0.9%<br />
Pottawatomie 14.6% 17.3% 2.7% $31,573 $40,085 $8,512 7.1% 6.8% -0.3%<br />
Pushmataha 23.2% 27.1% 3.9% $22,127 $26,742 $4,615 10.5% 7.7% -2.8%<br />
Roger Mills 16.3% 11.6% -4.7% $30,078 $48,917 $18,839 4.3% 2.5% -1.8%<br />
Rogers 8.6% 9.5% 0.9% $44,471 $57,443 $12,972 4.7% 3.5% -1.2%<br />
Seminole 20.8% 23.8% 3.0% $25,568 $32,985 $7,417 8.7% 6.8% -1.9%<br />
Sequoyah 19.8% 20.9% 1.1% $27,615 $36,357 $8,742 7.5% 5.7% -1.8%<br />
Stephens 14.6% 12.2% -2.4% $30,709 $43,524 $12,815 6.1% 4.0% -2.1%<br />
Texas 14.1% 15.6% 1.5% $35,872 $44,623 $8,751 6.2% 5.2% -1.0%<br />
Tillman 21.9% 21.1% -0.8% $24,828 $29,832 $5,004 8.4% 6.7% -1.7%<br />
Tulsa 11.6% 15.1% 3.5% $38,213 $45,613 $7,400 7.7% 6.7% -1.0%<br />
Wagoner 8.9% 11.7% 2.8% $41,744 $55,487 $13,743 5.0% 3.0% -2.0%<br />
Washington 11.9% 13.2% 1.3% $35,816 $44,823 $9,007 6.9% 5.3% -1.6%<br />
Washita 15.5% 16.9% 1.4% $29,563 $43,039 $13,476 4.4% 3.9% -0.5%<br />
Woods 15.0% 12.1% -2.9% $28,927 $48,076 $19,149 4.4% 3.5% -0.9%<br />
Woodward 12.5% 12.2% -0.3% $33,581 $49,672 $16,091 5.2% 5.9% 0.7%<br />
State Total 16.6% 16.90% 0.3% $33,400 $42,072 $8,672 7.0% 5.70% -1.3%<br />
Source: 2000 U.S. Census, 2010 U.S. Census<br />
<strong>Oklahoma</strong> Locally Coordinated Public Transit B-4<br />
Human Service <strong>Transportation</strong> <strong>Plan</strong>
Appendix B: County Specific Data Tables<br />
Table B.3: Means <strong>of</strong> <strong>Transportation</strong> to Work<br />
County<br />
Workers 16<br />
and Over<br />
Drove<br />
Alone<br />
Carpooled<br />
Public<br />
Transp.<br />
Walk, Bike, or<br />
other means<br />
Worked at<br />
Home<br />
Adair 8,146 73.6% 15.0% 1.2% 1.7% 8.5%<br />
Alfalfa 2,192 76.2% 11.5% 0.0% 6.5% 5.8%<br />
Atoka 4,612 79.1% 14.0% 0.3% 2.7% 3.9%<br />
Beaver 2,746 83.0% 7.6% 0.5% 4.8% 4.2%<br />
Beckham 9,649 85.9% 8.8% 0.2% 2.4% 2.7%<br />
Blaine 4,935 84.3% 7.9% 0.1% 4.9% 2.8%<br />
Bryan 17,131 75.4% 17.6% 0.3% 4.8% 1.9%<br />
Caddo 10,290 79.5% 14.3% 0.2% 2.3% 3.7%<br />
Canadian 53,379 85.2% 9.5% 0.1% 1.9% 3.3%<br />
Carter 20,343 79.3% 11.4% 0.4% 4.4% 4.5%<br />
Cherokee 17,439 77.2% 14.4% 0.1% 3.5% 4.8%<br />
Choctaw 5,225 76.7% 12.2% 1.2% 6.7% 3.3%<br />
Cimarron 1,155 81.1% 8.1% none 7.4% 3.4%<br />
Cleveland 122,052 83.4% 9.7% 0.4% 3.7% 2.9%<br />
Coal 2,047 85.0% 10.4% 0.0% 1.4% 3.2%<br />
Comanche 55,903 72.4% 12.4% 0.8% 6.7% 7.7%<br />
Cotton 2,776 82.5% 13.9% none 1.5% 2.1%<br />
Craig 6,442 75.4% 14.4% 0.2% 4.0% 5.9%<br />
Creek 29,855 80.7% 13.0% 0.1% 3.0% 3.2%<br />
Custer 13,108 82.0% 10.9% 0.2% 3.7% 3.2%<br />
Delaware 15,228 74.6% 14.5% none 4.3% 6.6%<br />
Dewey 1,916 86.2% 5.7% none 4.1% 4.0%<br />
Ellis 1,992 81.5% 6.4% 0.4% 6.1% 5.6%<br />
Garfield 28,449 81.5% 11.9% 0.6% 3.5% 2.4%<br />
Garvin 11,743 82.5% 9.4% none 3.4% 4.7%<br />
Grady 23,276 80.7% 11.5% 0.4% 2.6% 4.8%<br />
Grant 2,132 74.8% 15.2% 0.0% 5.5% 4.5%<br />
Greer 1,793 87.2% 5.5% none 3.3% 4.1%<br />
Harmon 1,177 77.1% 15.6% none 5.6% 1.7%<br />
Harper 1,734 80.6% 9.2% none 6.5% 3.7%<br />
Haskell 4,414 76.5% 9.1% 3.4% 2.8% 8.2%<br />
Hughes 4,606 76.3% 14.3% 0.3% 3.6% 5.4%<br />
Jackson 12,117 79.2% 10.5% none 7.5% 2.7%<br />
Jefferson 2,486 75.7% 12.9% 0.1% 3.7% 7.5%<br />
Johnston 3,584 82.3% 8.5% none 2.6% 6.6%<br />
Kay 19,909 81.4% 11.7% 0.7% 3.5% 2.7%<br />
Kingfisher 7,245 77.0% 13.8% 0.1% 5.7% 3.4%<br />
Kiowa 4,006 77.1% 8.9% none 5.8% 8.2%<br />
Latimer 4,486 78.3% 12.6% none 3.8% 5.3%<br />
Le Flore 19,197 82.2% 12.2% 0.1% 2.8% 2.7%<br />
Lincoln 14,046 79.9% 12.5% 0.0% 3.1% 4.5%<br />
<strong>Oklahoma</strong> Locally Coordinated Public Transit B-5<br />
Human Service <strong>Transportation</strong> <strong>Plan</strong>
Appendix B: County Specific Data Tables<br />
Table B.3: Means <strong>of</strong> <strong>Transportation</strong> to Work<br />
County<br />
Workers 16<br />
and Over<br />
Drove<br />
Alone<br />
Carpooled<br />
Public<br />
Transp.<br />
Walk, Bike, or<br />
other means<br />
Worked at<br />
Home<br />
Logan 18,361 79.2% 12.2% 0.7% 3.0% 4.9%<br />
Love 4,254 76.4% 13.2% 0.4% 2.6% 7.3%<br />
McClain 15,270 79.4% 12.3% none 3.4% 5.0%<br />
McCurtain 12,136 77.2% 13.8% 0.3% 4.4% 4.3%<br />
McIntosh 6,789 81.4% 13.4% 0.2% 3.0% 2.0%<br />
Major 3,665 81.9% 9.3% none 3.4% 5.5%<br />
Marshall 6,520 77.0% 15.4% 0.4% 3.7% 3.6%<br />
Mayes 16,404 81.0% 11.5% 0.2% 3.9% 3.5%<br />
Murray 5,563 86.3% 8.9% none 0.9% 4.0%<br />
Muskogee 27,916 79.2% 14.9% 0.1% 2.3% 3.4%<br />
Noble 5,167 79.9% 13.8% none 3.9% 2.4%<br />
Nowata 4,546 82.6% 9.7% none 3.7% 4.0%<br />
Okfuskee 4,237 78.3% 12.6% 0.9% 4.2% 4.1%<br />
<strong>Oklahoma</strong> 333,130 81.8% 11.4% 0.7% 2.8% 3.3%<br />
Okmulgee 16,007 81.5% 11.1% 0.1% 4.1% 3.2%<br />
Osage 20,056 81.8% 11.7% 0.5% 2.9% 3.0%<br />
Ottawa 13,132 78.3% 15.0% 0.2% 3.2% 3.4%<br />
Pawnee 6,930 77.9% 14.9% 0.2% 3.0% 4.0%<br />
Payne 36,244 75.2% 12.1% 1.6% 8.2% 3.0%<br />
Pittsburg 17,625 84.4% 10.0% 0.2% 1.8% 3.6%<br />
Pontotoc 17,257 81.5% 11.4% 0.1% 4.0% 3.0%<br />
Pottawatomie 28,957 81.8% 10.8% 0.2% 3.5% 3.7%<br />
Pushmataha 4,254 71.2% 17.8% none 3.2% 7.8%<br />
Roger Mills 1,583 81.7% 5.2% 0.5% 3.0% 9.6%<br />
Rogers 40,317 85.4% 9.9% 0.0% 1.6% 3.1%<br />
Seminole 9,278 81.4% 11.2% 0.1% 3.0% 4.3%<br />
Sequoyah 16,077 81.7% 11.9% 0.1% 1.3% 5.0%<br />
Stephens 18,808 83.6% 11.5% 0.2% 2.3% 2.4%<br />
Texas 9,630 75.2% 17.2% 0.8% 4.0% 2.9%<br />
Tillman 3,097 74.3% 16.0% none 5.7% 4.0%<br />
Tulsa 283,722 81.2% 11.1% 0.7% 3.2% 3.8%<br />
Wagoner 32,643 81.8% 11.5% 0.1% 2.2% 4.4%<br />
Washington 22,740 79.3% 14.5% 0.3% 3.7% 2.3%<br />
Washita 4,833 79.9% 11.2% none 3.5% 5.4%<br />
Woods 4,242 77.7% 12.2% none 6.5% 3.7%<br />
Woodward 9,173 82.6% 9.4% none 5.5% 2.5%<br />
State Total<br />
Source: 2010 American Community Survey, 5-year Estimates<br />
<strong>Oklahoma</strong> Locally Coordinated Public Transit B-6<br />
Human Service <strong>Transportation</strong> <strong>Plan</strong>
Appendix C: <strong>Oklahoma</strong> <strong>Department</strong> <strong>of</strong> <strong>Transportation</strong>/United We Ride Providers Survey<br />
APPENDIX C: ODOT/UWR PROVIDERS SURVEY<br />
2011<strong>Transportation</strong> Survey<br />
The <strong>Oklahoma</strong> <strong>Department</strong> <strong>of</strong> <strong>Transportation</strong> (ODOT) and <strong>Oklahoma</strong> United We Ride are conducting a<br />
public transit/human service transportation survey to develop a comprehensive database <strong>of</strong> agencies that<br />
purchase and/or provide transportation services within the State <strong>of</strong> <strong>Oklahoma</strong>.<br />
The survey will also help to identify gaps and issues related to providing health and human service<br />
transportation and develop strategies for transportation providers to work together to create a more efficient<br />
and effective transportation system.<br />
Questions about the survey should be directed to Roger Eaton at ODOT by emailing reaton@odot.org or<br />
calling (405) 521-2584.<br />
1) Agency/Organization Information<br />
Name <strong>of</strong> Person Completing Survey:<br />
Agency/Organization Name:<br />
Address One:<br />
Address Two:<br />
City/Town:<br />
County:<br />
Zip:<br />
Phone Number (for follow-up):<br />
E-mail address (for follow-up):<br />
Date Survey Completed:<br />
_________________________________<br />
_________________________________<br />
_________________________________<br />
_________________________________<br />
_________________________________<br />
_________________________________<br />
_________________________________<br />
_________________________________<br />
_________________________________<br />
_________________________________<br />
2) Please indicate the types <strong>of</strong> transportation services your organization provides (either as an<br />
operator or a purchaser)? (check all that apply)<br />
On-demand/demand responsive<br />
Fixed route, fixed schedule<br />
Deviated (flexible) fixed route<br />
Subscription services (i.e. specific clients picked up on specific days)<br />
Other: ______________________ (specify)<br />
<strong>Oklahoma</strong> Locally Coordinated Public Transit C-1<br />
Human Service <strong>Transportation</strong> <strong>Plan</strong>
Appendix C: <strong>Oklahoma</strong> <strong>Department</strong> <strong>of</strong> <strong>Transportation</strong>/United We Ride Providers Survey<br />
3) Does your organization directly operate transit services or does your organization purchase<br />
service from an external provider? (if selected purchaser please go to Question 14 – Skip Questions 4-<br />
12)<br />
Operator <strong>of</strong> transit service<br />
Purchaser <strong>of</strong> transit service<br />
4) Please indicated the number <strong>of</strong> passenger vehicles operated for service by type.<br />
Large vehicles (30 or more seats):<br />
ADA-accessible large vehicles:<br />
Medium vehicles (16-29 seats):<br />
ADA-accessible medium vehicles:<br />
Total small vehicles (8 to 15 seats):<br />
ADA-accessible small vehicles:<br />
Total automobiles/minivans:<br />
Other (please specify type):<br />
_____________________________________________<br />
_____________________________________________<br />
_________________________________________________<br />
_________________________________________________<br />
_________________________________________________<br />
_________________________________________________<br />
_________________________________________________<br />
_________________________________________________<br />
5) Of the total passenger vehicles for your agency please indicate the fuel type<br />
Type<br />
Diesel<br />
Gasoline<br />
Compressed Natural Gas (CNG)<br />
Hybrid<br />
Electric<br />
Number<br />
_______<br />
_______<br />
_______<br />
_______<br />
_______<br />
6) Which <strong>of</strong> these restrictions apply to the use <strong>of</strong> the vehicles used in your service (check one):<br />
Yes- Vehicles can only serve specific human service programs and/or have a mix <strong>of</strong> restrictions<br />
depending on the funding source <strong>of</strong> that vehicle (please specify in next question).<br />
Yes - Vehicles can only serve elderly and/or disabled.<br />
No - There are no restrictions, vehicles can be used by general public.<br />
7) If the answer was yes in Question 6, please describe the restrictions on the use <strong>of</strong> your<br />
vehicles, i.e. vehicles can only serve clients <strong>of</strong> specific human service program(s) or<br />
vehicles have a mix <strong>of</strong> restrictions depending on the funding source <strong>of</strong> the vehicle.<br />
_____________________________________________________________________________<br />
____________________________________________________________________________________<br />
____________________________________________________________________________________<br />
8) Please tell us about the driver labor force (check all that apply)<br />
Paid, full time<br />
Volunteer, full time<br />
Paid, part time<br />
Volunteer, part time<br />
<strong>Oklahoma</strong> Locally Coordinated Public Transit C-2<br />
Human Service <strong>Transportation</strong> <strong>Plan</strong>
Appendix C: <strong>Oklahoma</strong> <strong>Department</strong> <strong>of</strong> <strong>Transportation</strong>/United We Ride Providers Survey<br />
9) Please describe responsibilities the drivers in each category have besides driving.<br />
Paid full-time:<br />
Paid part-time:<br />
Volunteer, full-time:<br />
Volunteer, part-time:<br />
_______________________________________________________________<br />
_______________________________________________________________<br />
_______________________________________________________________<br />
_______________________________________________________________<br />
10) Tell us about the use <strong>of</strong> advanced technology to manage your operation. Which <strong>of</strong> these<br />
functions are supported through the use <strong>of</strong> computer and similar electronic systems (check<br />
all that apply)?<br />
Office (word processing, electronic spreadsheets)<br />
Scheduling<br />
Reservations<br />
Dispatching<br />
Mapping / <strong>Plan</strong>ning<br />
Accounting (bookkeeping, invoicing, etc.)<br />
Client eligibility determination<br />
Vehicle maintenance and inventory<br />
Internet / web based applications<br />
11) How do you communicate with your drivers while they are on the road? (check all that apply).<br />
Mobile Phones<br />
Two-way radios<br />
Combination <strong>of</strong> phones and radios<br />
Do not communicate with drivers on road<br />
12) What methods are used to collect fares from riders?<br />
No fares are collected (if selected see Question 13)<br />
Fares are placed in money bags or money box<br />
Fares are deposited in a fare box<br />
Fares are billed to the rider via invoice<br />
Other<br />
If other (please specify)<br />
______________________________________________________________________________<br />
______________________________________________________________________________<br />
13) You indicated that your organization does not collect fares. Are donations accepted? Please<br />
explain.<br />
______________________________________________________________________________<br />
______________________________________________________________________________<br />
______________________________________________________________________________<br />
<strong>Oklahoma</strong> Locally Coordinated Public Transit C-3<br />
Human Service <strong>Transportation</strong> <strong>Plan</strong>
Appendix C: <strong>Oklahoma</strong> <strong>Department</strong> <strong>of</strong> <strong>Transportation</strong>/United We Ride Providers Survey<br />
14) From what entity does your organization purchase transportation services? (only complete if<br />
you are a purchaser <strong>of</strong> transportation)<br />
______________________________________________________________________________<br />
15) Please select the counties in which your organization operates or purchases transportation<br />
services? (check all that apply)<br />
Adair County Grant County Nowata County<br />
Alfalfa County Greer County Okfuskee County<br />
Atoka County Harmon County <strong>Oklahoma</strong> County<br />
Beaver County Harper County Okmulgee County<br />
Beckham County Haskell County Osage County<br />
Blaine County Hughes County Ottawa County<br />
Bryan County Jackson County Pawnee County<br />
Caddo County Jefferson County Payne County<br />
Canadian County Johnston County Pittsburg County<br />
Carter County Kay County Pontotoc County<br />
Cherokee County Kingfisher County Pottawatomie County<br />
Choctaw County Kiowa County Pushmataha County<br />
Cimarron County Latimer County Roger Mills County<br />
Cleveland County Le Flore County Rogers County<br />
Coal County Lincoln County Seminole County<br />
Comanche County Logan County Sequoyah County<br />
Cotton County Love County Stephens County<br />
Craig County McClain County Texas County<br />
Creek County McCurtain County Tillman County<br />
Custer County McIntosh County Tulsa County<br />
Delaware County Major County Wagoner County<br />
Dewey County Marshall County Washington County<br />
Ellis County Mayes County Washita County<br />
Garfield County Murray County Woods County<br />
Garvin County Muskogee County Woodward County<br />
Grady County<br />
Noble County<br />
<strong>Oklahoma</strong> Locally Coordinated Public Transit C-4<br />
Human Service <strong>Transportation</strong> <strong>Plan</strong>
Appendix C: <strong>Oklahoma</strong> <strong>Department</strong> <strong>of</strong> <strong>Transportation</strong>/United We Ride Providers Survey<br />
16) Please select the cities in which your organization operates or purchases services. If your<br />
organization does not operate or purchase service in any <strong>of</strong> the cities listed below please<br />
select “None Listed” at the end <strong>of</strong> the list. (check all that apply)<br />
Ada Fort Gibson Okmulgee<br />
Adair Frederick Owasso<br />
Aline Garber Owaho<br />
Alma Geary Oologah<br />
Altus Glenpool Pauls Valley<br />
Alava Grandfield Pawhuska<br />
Anadarko Grove Pawnee<br />
Antlers Guthrie Perkins<br />
Arcadia Guymon Perry<br />
Ardmore Gould Picher<br />
Arkoma Haileyville Piedmont<br />
Asher Hartshorne Le Flore<br />
Atoka Healdton Ponca City<br />
Barnsdall Henryetta Pond Creek<br />
Bartlesville Holdenville Poteau<br />
Bearden Hominy Prague<br />
Beaver Hugo Pryor<br />
Beggs Hobart Purcell<br />
Bethany Idabel Ringwood<br />
Bixby Inola Red Oak<br />
Blackwell Jay Ripley<br />
Blanchard Jenks Sallisaw<br />
Boise City Kaw City Sand Springs<br />
Bowlegs Kingfisher Sapulpa<br />
Bridgeport Konawa Sasakwa<br />
Bristow Krebs Sayre<br />
Broken Arrow Kingston Seiling<br />
Broken Bow Lamont Seminole<br />
Bunch Langston Shawnee<br />
Cache Lawton Shidler<br />
Cameron Lehigh Snyder<br />
Catoosa Lexington Spencer<br />
Cedar Valley Lindsay Spiro<br />
Centrahoma Lone Grove Stigler<br />
Chandler Lone Oak Stillwater<br />
Checotah Madill Stilwell<br />
Chelsea Mangum Stroud<br />
Cherokee Marietta Sulphur<br />
Chickasha Marlow Tahlequah<br />
Choctaw Maud Tecumseh<br />
Claremore McAlester The Village<br />
Cleveland McLoud Thomas<br />
Clinton Meeker Tishomingo<br />
Coalgate Medford Tonkawa<br />
<strong>Oklahoma</strong> Locally Coordinated Public Transit C-5<br />
Human Service <strong>Transportation</strong> <strong>Plan</strong>
Appendix C: <strong>Oklahoma</strong> <strong>Department</strong> <strong>of</strong> <strong>Transportation</strong>/United We Ride Providers Survey<br />
Comanche Miami Tulsa<br />
Commerce Midwest City Tupelo<br />
Coweta Minco Tuttle<br />
Cresent Moore Vinita<br />
Cromwell Morris Wagoner<br />
Cushing Muskogee Walters<br />
Davis Mustang Warr Acres<br />
Del City New Cordell Watonga<br />
Dewey Newcastle Waurika<br />
Drumright Newkirk Waynoka<br />
Duncan Nichols Hills Weatherford<br />
Durant Nicoma Park Wetumka<br />
Edmond Noble Wewoka<br />
Elgin Norman Wilburton<br />
Elk City Nowata Wilson<br />
El Reno Nomans Woodward<br />
Enid Oakhurst Wynnewood<br />
Erick Oilton Yale<br />
Eufaula Okemah Yukon<br />
Fairview <strong>Oklahoma</strong> City None Lister<br />
17) If your organization operates/purchases transportation service in any cities or towns not<br />
listed above, please list below.<br />
City / Town 1: __________________________________________________________________________<br />
City / Town 2: __________________________________________________________________________<br />
City / Town 3: __________________________________________________________________________<br />
City / Town 4: __________________________________________________________________________<br />
City / Town 5: __________________________________________________________________________<br />
City / Town 6: __________________________________________________________________________<br />
City / Town 7: __________________________________________________________________________<br />
18) Does your organization operate / purchase service for the following? (Select all that apply)<br />
All the hospitals / medical centers in your service area (if no, below list ones NOT served)<br />
All major employment centers in your service area (if no, below list ones NOT served)<br />
All colleges, vocational / tech schools in your service area (if no, below list ones NOT served)<br />
All government installations and <strong>of</strong>fices in your service area (if no, below list ones NOT served)<br />
Hospitals / medical centers, major employment center, colleges and Vocational / tech schools, and<br />
government installations and <strong>of</strong>fices NOT served.<br />
______________________________________________________________________________________<br />
______________________________________________________________________________________<br />
______________________________________________________________________________________<br />
<strong>Oklahoma</strong> Locally Coordinated Public Transit C-6<br />
Human Service <strong>Transportation</strong> <strong>Plan</strong>
Appendix C: <strong>Oklahoma</strong> <strong>Department</strong> <strong>of</strong> <strong>Transportation</strong>/United We Ride Providers Survey<br />
19) Please list the top four destinations for passengers who use the transportation service your<br />
organization operates / purchases. Please be specific and include place and names, such as<br />
XYZ Hospital or ABC Shopping Center, and location, such as zip code and / or city / town.<br />
Destination 1 and Location: _______________________________________________________________<br />
Destination 2 and Location: _______________________________________________________________<br />
Destination 3 and Location: _______________________________________________________________<br />
Destination 4 and Location: _______________________________________________________________<br />
20) Please indicate the total amount <strong>of</strong> service your agency operates / purchases annually<br />
measured either in total service hours or miles by service type.<br />
On-demand / demand response:<br />
Fixed-route, fixed schedule:<br />
Deviated (flexible) fixed-route:<br />
Subscription services:<br />
Other type:<br />
_________________________________________________________<br />
_________________________________________________________<br />
_________________________________________________________<br />
_________________________________________________________<br />
_________________________________________________________<br />
21) What days are service operated / purchased by your organization?<br />
Monday through Friday<br />
Saturday<br />
Sunday<br />
22) What times are service operated / purchased by your organization?<br />
Monday to Friday: _______________________________________________________________________<br />
Saturday: _______________________________________________________________________<br />
Sunday: _______________________________________________________________________<br />
23) What are the peak service times for transportation service operated / purchased by your<br />
organization?<br />
Monday to Friday: _______________________________________________________________________<br />
Saturday: _______________________________________________________________________<br />
Sunday: _______________________________________________________________________<br />
24) What is your organization’s total annual ridership?<br />
______________________________________________________________________________<br />
<strong>Oklahoma</strong> Locally Coordinated Public Transit C-7<br />
Human Service <strong>Transportation</strong> <strong>Plan</strong>
Appendix C: <strong>Oklahoma</strong> <strong>Department</strong> <strong>of</strong> <strong>Transportation</strong>/United We Ride Providers Survey<br />
25) What is the total number <strong>of</strong> clients eligible to use the transportation service that your<br />
organization operates / purchases? This number may include people who do not ride <strong>of</strong>ten<br />
or regularly.<br />
______________________________________________________________________________<br />
26) What is the total number <strong>of</strong> trips that your organization denies each year? This includes the<br />
average number <strong>of</strong> trip requests that your organization cannot accommodate by operating<br />
or purchasing service.<br />
______________________________________________________________________________<br />
27) If any trips are denied why can these request not be accommodated?<br />
______________________________________________________________________________<br />
______________________________________________________________________________<br />
______________________________________________________________________________<br />
28) Please provide the number <strong>of</strong> full-time / part-time administrative and full-time / part-time<br />
operations staff your organization employs to operate / purchase transportation services?<br />
Administrative (full-time): ________________________________________________________________<br />
Administrative (part-time): ________________________________________________________________<br />
Operations (full-time): ________________________________________________________________<br />
Operations (part-time): ________________________________________________________________<br />
29) What is your organization’s annual budget (total budget inclusive <strong>of</strong> transportation<br />
services)?<br />
______________________________________________________________________________<br />
30) What is the annual transportation budget for your organization to operate / purchase<br />
transportation services<br />
______________________________________________________________________________<br />
31) Select the funding sources your organization receives to operate / purchase transportation<br />
services.<br />
5307 Sooner Ride/Medicaid<br />
5309 Tribal Governments<br />
5310 County Government<br />
5311 City Government<br />
5316 State Revolving Fund<br />
5317 Title III<br />
TANF<br />
Other (specify) _______________________<br />
<strong>Oklahoma</strong> Locally Coordinated Public Transit C-8<br />
Human Service <strong>Transportation</strong> <strong>Plan</strong>
Appendix C: <strong>Oklahoma</strong> <strong>Department</strong> <strong>of</strong> <strong>Transportation</strong>/United We Ride Providers Survey<br />
32) In 2010 did your agency use any in-kind contributions to operate / purchase transportation<br />
services? (If yes please answer Question 33)<br />
Yes<br />
No<br />
33) Please list the in-kind contributions used by your organization in 2010. Please include the<br />
approximate monetary value.<br />
In-kind 1: ______________________________________________________________________________<br />
In-kind 2: ______________________________________________________________________________<br />
In-kind 3: ______________________________________________________________________________<br />
In-kind 4: ______________________________________________________________________________<br />
In-kind 5: ______________________________________________________________________________<br />
In-kind 6: ______________________________________________________________________________<br />
34) Please describe the areas in which your organization currently coordinates transportation<br />
services with other providers in your region.<br />
Grant Administration:<br />
Maintenance:<br />
Training:<br />
Marketing / Public Information:<br />
Operations:<br />
Other:<br />
_________________________________________________________<br />
_________________________________________________________<br />
_________________________________________________________<br />
_________________________________________________________<br />
_________________________________________________________<br />
_________________________________________________________<br />
35) From your organization’s perspective, what are the major issues in providing quality public<br />
/ human service transportation (including service and time gaps)?<br />
______________________________________________________________________________<br />
______________________________________________________________________________<br />
______________________________________________________________________________<br />
______________________________________________________________________________<br />
______________________________________________________________________________<br />
<strong>Oklahoma</strong> Locally Coordinated Public Transit C-9<br />
Human Service <strong>Transportation</strong> <strong>Plan</strong>
Appendix C: <strong>Oklahoma</strong> <strong>Department</strong> <strong>of</strong> <strong>Transportation</strong>/United We Ride Providers Survey<br />
36). Are you open to exploring additional coordination opportunities with other transportation<br />
providers in the area?<br />
Yes<br />
No<br />
Why or why not? _______________________________________________________________<br />
______________________________________________________________________________<br />
What types <strong>of</strong> coordination opportunities interest your organization? __________________<br />
______________________________________________________________________________<br />
______________________________________________________________________________<br />
You have now completed the ODOT and United We Ride Public Transit /<br />
Human Service <strong>Transportation</strong> Survey. You may be contacted by a<br />
representative for additional information.<br />
THANK YOU FOR YOUR PARTICIPATION!<br />
<strong>Oklahoma</strong> Locally Coordinated Public Transit C-10<br />
Human Service <strong>Transportation</strong> <strong>Plan</strong>