Thomson Reuters Mid - BMR Advisors
Thomson Reuters Mid - BMR Advisors
Thomson Reuters Mid - BMR Advisors

You also want an ePaper? Increase the reach of your titles
YUMPU automatically turns print PDFs into web optimized ePapers that Google loves.
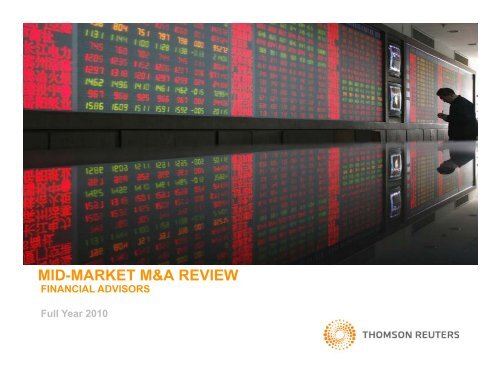
MID-MARKET M&A REVIEW<br />
FINANCIAL ADVISORS<br />
Full Year 2010
M&A Rankings For Small-Cap Deals Valued Up To US$50m Are Also Available<br />
Full Year 2010<br />
DEALS VALUED UP TO US$500 MILLION<br />
MID-MARKET M&A REVIEW<br />
<strong>Mid</strong>-Market Deals Intelligence<br />
Worldwide <strong>Mid</strong>-Market M&A up to US$500m by Rank Value Range<br />
Worldwide announced <strong>Mid</strong>-Market M&A deals valued up to $500 million totaled US$699.9 billion in<br />
2010 – a 29.5% increase over 2009.<br />
Estimated global fees generated from completed <strong>Mid</strong>-Market M&A activity reached US$16.8 billion for<br />
the year, according to <strong>Thomson</strong> <strong>Reuters</strong> and Freeman Consulting.<br />
The Americas region (by target domicile) led the market, with US$265.3 billion of announced deal<br />
activity – a 37.9% market share, representing a gain of 4.6 percentage points.<br />
Rank Value (US$b)<br />
$300<br />
$250<br />
$200<br />
$150<br />
$100<br />
$50<br />
12,000<br />
10,000<br />
8,000<br />
6,000<br />
4,000<br />
2,000<br />
# of Deals<br />
The EMEA region (by target domicile) led the market in number of deals announced, with nearly 14,700<br />
deals for the year, or 36.6% of the over 40,000 deals announced worldwide.<br />
The Financials sector comprised 15.4% of announced value, followed by Energy & Power at 13.5%,<br />
and Materials which represented just under 13% of the total market.<br />
$0<br />
1Q07<br />
2Q07<br />
3Q07<br />
4Q07<br />
1Q08<br />
2Q08<br />
3Q08<br />
4Q08<br />
US$200 - 500m US$100 - 200m US$50 - 100m US$0 - 50m # of Deals<br />
1Q09<br />
2Q09<br />
3Q09<br />
4Q09<br />
1Q10<br />
2Q10<br />
3Q10<br />
4Q10<br />
-<br />
Announced <strong>Mid</strong>-Market M M&A by Target Nation Up To US$500m<br />
Region/Nation<br />
1/1/2010 - 12/31/2010 1/1/2009 - 12/31/2009 % Change<br />
Rank Value # of Rank Value # of<br />
in Rank<br />
US$m Deals<br />
US$m Deals<br />
Value<br />
Worldwide 699,894.5 40,185 540,310.7 38,889 29.5 ▲<br />
Americas 265,292.9 11,714 179,967.9 11,539 47.4 ▲<br />
United States of America 182,800.6 7,581 119,059.3 7,660 53.5 ▲<br />
Canada 39,970.6 2,269 28,334.4 2,364 41.1 ▲<br />
Brazil<br />
18,448.2 556 15,664.0 406 17.8 ▲<br />
Chile 4,508.8 188 3,936.3 172 14.5 ▲<br />
Argentina<br />
2,807.4 168 1,303.2 137 115.4 ▲<br />
Peru 2,783.1 166 1,309.4 114 112.5 ▲<br />
Mexico 2,501.1 252 2,688.7 183 -7.0 ▼<br />
Europe 174,801.2 14,698 138,064.9 13,654 26.6 ▲<br />
United Kingdom 42,724.8 2,272 30,747.9 2,124 39.0 ▲<br />
France 18,647.4 1,342 10,989.8 1,129 69.7 ▲<br />
Spain 16,201.4 904 11,319.7 805 43.1 ▲<br />
Italy 11,821.2 632 12,205.5 707 -3.1 ▼<br />
Germany<br />
11,768.1 1,280 12,368.2 1,240 -4.9 ▼<br />
Russian Federation 8,748.2 3,266 8,178.2 3,004 7.0 ▲<br />
Sweden<br />
8,035.2 768 4,091.6 611 96.4 ▲<br />
Norway<br />
6,889.7 459 5,717.5 357 20.5 ▲<br />
Netherlands 6,144.9 495 5,410.1 510 13.6 ▲<br />
Switzerland 5,032.6 359 4,205.6 438 19.7 ▲<br />
Turkey 4,716.7 199 2,937.7 160 60.6 ▲<br />
Africa/<strong>Mid</strong>dle East/Central Asia 26,915.7 1,127 20,625.4 989 30.5 ▲<br />
South Africa 7,384.3 292 5,957.1 295 24.0 ▲<br />
Israel 2,481.9 72 3,587.2 81 -30.8 ▼<br />
Asia-Pacific (ex Central Asia)<br />
China<br />
Australia<br />
201,439.1<br />
75,812.9<br />
30,949.1<br />
10,500<br />
3,133<br />
1,807<br />
165,414.0<br />
54,491.7<br />
22,351.3<br />
10,260<br />
2,669<br />
1,761<br />
21.8 ▲<br />
39.1 ▲<br />
38.5 ▲<br />
Hong Kong<br />
21,352.6 667 21,770.8 783 -1.9 ▼<br />
South Korea<br />
18,242.5 885 19,879.2 1,138 -8.2 ▼<br />
India<br />
13,541.8 1,033 12,228.7 1,125 10.7 ▲<br />
Singapore 9,512.5 429 5,975.1 375 59.2 ▲<br />
Malaysia<br />
8,809.3 670 4,736.4 749 86.0 ▲<br />
Indonesia 6,777.0 547 6,803.1 421 -0.4 ▼<br />
Philippines 4,268.7 146 4,436.3 152 -3.8 ▼<br />
Japan<br />
31,445.6 2,146 36,238.5 2,447 -13.2 ▼<br />
Worldwide <strong>Mid</strong>-Market M&A up to US$500m by Target Industry<br />
4.8%3.0% 15.4%<br />
Financials 2.6% Energy and Power<br />
5.1%<br />
Materials<br />
Real Estate<br />
5.3%<br />
Industrials<br />
High Technology<br />
13.5%<br />
6.2%<br />
Healthcare<br />
Media and Entertainment<br />
Consumer Products and Services<br />
Consumer Staples<br />
8.6%<br />
12.9%<br />
Retail<br />
Telecommunications<br />
9.7%<br />
Government and Agencies<br />
12.9%<br />
Worldwide <strong>Mid</strong>-Market M&A up to US$500m by Target Nation Region January 1 - December 31<br />
2010<br />
2009<br />
2008<br />
2007<br />
2006<br />
$0 $100 $200 $300 $400 $500 $600 $700 $800 $900 $1,000<br />
Rank Value (US$b)<br />
Africa/<strong>Mid</strong>dle East Americas Asia-Pacific Europe Japan<br />
https://www.thomsonone.com
Full Year 2010 │ <strong>Mid</strong>-Market M&A Up To US$500m │ Financial <strong>Advisors</strong><br />
Worldwide <strong>Mid</strong>-Market Rankings (MM1)<br />
MM1 - Undisclosed Values & Values up to US$500m<br />
Jan 1 2010 - Dec 31 2010<br />
# of Deals per Advisor<br />
Rank Value per Advisor (US$m)<br />
Imputed Fees (US$m) †<br />
2010 2009 # of Change in<br />
Rank Value<br />
2010 Rank Value Advisor 2010 ** Fee<br />
Financial Advisor<br />
Rank Rank Deals # of Deals<br />
US$m<br />
Rank Change (%) Fees Rank Exp (%)<br />
KPMG<br />
1 1 285 -22 ▼<br />
13,651.1<br />
11 45.9 ▲ 41.6 45 71.4<br />
PricewaterhouseCoopers<br />
Deloitte<br />
Morgan Stanley<br />
Rothschild<br />
Lazard<br />
Goldman Sachs & Co<br />
Credit Suisse<br />
Ernst & Young LLP<br />
UBS<br />
JP Morgan<br />
Deutsche Bank AG<br />
Houlihan Lokey<br />
Nomura<br />
Bank of America Merrill Lynch<br />
Macquarie Group<br />
Citi RBC Capital Markets<br />
2<br />
3<br />
4<br />
5<br />
6<br />
7<br />
8<br />
9<br />
10<br />
11<br />
12<br />
13<br />
14<br />
15<br />
16<br />
17 18<br />
2<br />
11<br />
5<br />
3<br />
8<br />
6*<br />
6*<br />
9<br />
10<br />
4<br />
12<br />
13<br />
15*<br />
18<br />
19<br />
17 21<br />
267<br />
249<br />
217<br />
206<br />
203<br />
192<br />
184<br />
182<br />
181<br />
166<br />
152<br />
144<br />
130<br />
126<br />
116<br />
114 103<br />
9<br />
84<br />
28<br />
2<br />
17<br />
5<br />
-3<br />
5<br />
6<br />
-28<br />
-2<br />
-6<br />
-6<br />
5<br />
12<br />
-14 8<br />
▲<br />
▲<br />
▲<br />
▲<br />
▲<br />
▲<br />
▼<br />
▲<br />
▲<br />
▼<br />
▼<br />
▼<br />
▼<br />
▲<br />
▲<br />
▼<br />
▲<br />
7,675.8<br />
7,598.2<br />
28,095.7<br />
17,792.9<br />
20,080.2<br />
28,157.6<br />
24,115.0<br />
6,180.7<br />
24,891.3<br />
25,296.8<br />
24,294.5<br />
8,274.4<br />
12,119.1<br />
16,933.4<br />
12,762.9<br />
15,675.7 10,143.6143 19<br />
20<br />
2<br />
8<br />
7<br />
1<br />
6<br />
24<br />
4<br />
3<br />
5<br />
18<br />
13<br />
9<br />
12<br />
10<br />
14<br />
-13.1 ▼<br />
87.1 ▲<br />
22.3 ▲<br />
35.5 ▲<br />
83.8 ▲<br />
12.0 ▲<br />
17.6 ▲<br />
12.5 ▲<br />
28.3 ▲<br />
-6.5 ▼<br />
60.7 ▲<br />
26.4 ▲<br />
-3.4 ▼<br />
28.2 ▲<br />
37.4 ▲<br />
-8.8 ▼ 29.7<br />
▲<br />
18.1<br />
41.1<br />
421.7<br />
421.4<br />
442.7<br />
531.2<br />
335.6<br />
22.5<br />
296.8<br />
365.2<br />
269.9<br />
216.9<br />
125.2<br />
259.4<br />
129.2<br />
224.9<br />
154.3<br />
84<br />
46<br />
3<br />
4<br />
2<br />
1<br />
6<br />
75<br />
7<br />
5<br />
8<br />
11<br />
16<br />
9<br />
15<br />
10<br />
13<br />
94.3<br />
96.7<br />
29.4<br />
57.7<br />
51.4<br />
27.0<br />
32.4<br />
80.4<br />
35.0<br />
26.8<br />
33.9<br />
74.4<br />
44.8<br />
29.0<br />
65.8<br />
30.9<br />
50.9<br />
Mizuho Financial Group 19 15* 102 -34 ▼<br />
4,959.0 27 -29.6 ▼ 69.3 24 51.3<br />
Sumitomo Mitsui Finl Grp Inc 20 47* 99<br />
66 ▲<br />
4,169.5 31 237.8 ▲ 43.2 43 79.4<br />
IMAP 21* 14 97<br />
-47 ▼<br />
1,347.5 81 -7.2 ▼ 49.3 34 100.0<br />
Jefferies & Co Inc 21* 24 97 22 ▲ 9,687.0<br />
15 72.5 ▲ 198.1 12 61.0<br />
BNP Paribas SA 23* 20 94<br />
-4 ▼ 9,197.6 16 -10.0 ▼ 105.5 17 42.3<br />
M&A International 23* 22 94<br />
1 ▲<br />
1,487.7<br />
73 -12.8 ▼ 39.6 49 99.5<br />
BDO International 25 28* 86<br />
19 ▲<br />
1,002.5<br />
102 154.3 ▲ 47.5 37 100.0<br />
Lincoln International 26 33* 77<br />
26 ▲<br />
1,494.3<br />
71 47.4 ▲ 62.9 25 87.8<br />
Barclays Capital 27 41* 66<br />
19 ▲<br />
8,376.5<br />
17 17.0 ▲ 134.6 14 18.5<br />
Keefe Bruyette & Woods Inc<br />
28 78* 65<br />
47 ▲<br />
2,158.8<br />
55 75.4 ▲ 43.8 39 85.9<br />
DC Advisory Partners 29 33* 62<br />
11 ▲<br />
2,872.0<br />
44 162.4 ▲ 54.3 30 83.3<br />
Clairfield Partners 30 60 60<br />
34 ▲<br />
731.9<br />
122 703.4 ▲ 30.2 58 76.1<br />
ING<br />
31* 27 53<br />
-15 ▼<br />
1,274.2<br />
86 -57.2 ▼ 36.5 52* 71.9<br />
Daiwa Securities Group Inc 31* 23 53<br />
-36 ▼<br />
2,262.3<br />
53 -60.0 ▼ 41.7 44 51.1<br />
Grant Thornton LLP<br />
33* 30 52<br />
-10 ▼<br />
642.3<br />
141 -36.1 ▼ 2.6 296* 76.5<br />
HSBC Holdings PLC 33* 32 52<br />
-5 ▼<br />
6,534.7 23 54.5 ▲ 70.7 23 38.7<br />
Mediobanca 35* 54* 50<br />
21 ▲<br />
3,190.4<br />
40 -18.8 ▼ 39.8 47* 47.8<br />
UniCredit Group<br />
35* 43 50<br />
4 ▲ 3,407.0 36 -6.4 ▼ 53.4 31 70.8<br />
Global M&A<br />
37* 25 49<br />
-24 ▼<br />
478.3 169 -60.5 ▼ 29.2 60 100.0<br />
BMO Capital Markets 37* 33* 49<br />
-2 ▼<br />
7,108.3 21 21.6 ▲ 84.8 19 52.7<br />
CIMB Group Sdn Bhd 39* 26 48<br />
-21 ▼<br />
2,971.7<br />
43 9.7 ▲ 26.2 67* 60.8<br />
William Blair & Co 39* 47* 48<br />
15 ▲<br />
2,368.7<br />
52 99.1 ▲ 59.5 27 87.1<br />
TD Securities Inc 41 47* 46<br />
13 ▲<br />
6,786.7<br />
22 233.8 ▲ 78.5 20 57.8<br />
Greenhill & Co, LLC 42* 56* 44<br />
16 ▲<br />
5,723.8<br />
25 108.4 ▲ 73.7 21 34.5<br />
Moelis & Co 42* 41* 44<br />
-3 ▼<br />
3,185.1<br />
41 6.8 ▲ 101.0 18 53.6<br />
Raymond James Financial Inc 44 66* 43 20 ▲<br />
3,250.0<br />
39 139.4 ▲ 48.8 36 89.7<br />
Banco BTG Pactual SA 45 278* 41<br />
37 ▲<br />
4,846.1<br />
28 360.1 ▲ 36.5 52* 53.4<br />
Somerley Ltd 46* 37* 40<br />
-10 ▼<br />
2,216.7<br />
54 25.8 ▲ 15.2 91* 51.7<br />
Santander 46* 73* 40<br />
20 ▲<br />
2,731.8<br />
46 31.3 ▲ 28.4 61 29.0<br />
CIBC World Markets Inc<br />
48* 50* 39<br />
7 ▲<br />
5,317.0<br />
26 45.4 ▲ 73.5 22 39.5<br />
Credit Agricole CIB 48* 61* 39 14 ▲ 3,409.8 35 49.1 ▲ 27.6 63* 37.8<br />
RBS 50* 31 38<br />
-21 ▼ 3,394.9<br />
38 19.2 ▲ 38.5 50 25.9<br />
Mitsubishi UFJ Financial Group 50* 28* 38 -29 ▼ 371.9 214 371.9 ▲ 20.2 82 36.4<br />
GCA Savvian Group Corp 50* 37* 38 -12 ▼ 3,164.0 42 3164.0 ▲ 39.8 47* 100.0<br />
Industry Total 40,185 1296 ▲<br />
699,894.5<br />
29.5 ▲ 16,781.7<br />
57.1<br />
*tie<br />
Source: <strong>Thomson</strong> <strong>Reuters</strong>/Freeman Consulting<br />
** Fee exposure indicates each firm's mid-market fees from deals valued at up to US$500m as a percentage of its overall M&A fees<br />
† Imputed Fees shown are based on completed deal activity, whereas deal count & rank values are compiled based on announced deal activity.<br />
https://www.thomsonone.com
Full Year 2010 │ <strong>Mid</strong>-Market M&A Up To US$500m │ Financial <strong>Advisors</strong><br />
<strong>Mid</strong>-Market M&A Matrix<br />
<strong>Mid</strong>-Market Exit Multiple Heatmap<br />
Year To Date Average Rank Value/EBITDA - Up to 50x*<br />
<strong>Mid</strong>-Market Premium Heatmap<br />
Year To Date Average Premium To 4 Week Stock Price - Up to 100%*<br />
14.7<br />
13.9<br />
7.9<br />
18.9<br />
25.2<br />
17.6<br />
2010 up<br />
North South<br />
<strong>Mid</strong> East Asia<br />
2010 up<br />
North South<br />
<strong>Mid</strong> East Asia<br />
World<br />
Europe<br />
Japan<br />
World<br />
Europe<br />
2010 down<br />
2009 America America<br />
& Africa Pacific<br />
2010 down<br />
2009<br />
America America<br />
& Africa Pacific<br />
Japan<br />
Consumer Products and Services 12.9<br />
8.4<br />
11.8<br />
Consumer Products and Services 20.4<br />
-<br />
21.0 32.5 18.1<br />
11.5 14.5 13.3 22.7 11.1 12.4 11.9 20.3 13.7 11.0<br />
8.5<br />
20.7 27.0 26.7<br />
-<br />
29.4<br />
-0.7 17.8 21.4 18.4<br />
Consumer Staples 10.2 9.7<br />
11.0<br />
10.7 5.6<br />
Consumer Staples<br />
20.6<br />
23.1<br />
-<br />
39.5<br />
9.7<br />
6.4<br />
5.7 12.4<br />
12.8<br />
6.8<br />
29.2<br />
22.6<br />
Energy and Power 12.6 15.1 5.9 12.8 8.3<br />
11.8 11.5 13.5<br />
Energy and Power<br />
15.6<br />
25.0 27.9 6.3<br />
18.9 12.9 17.8 36.3 -<br />
7.4<br />
21.4<br />
0.2<br />
10.7 12.6 19.8 11.1 7.0<br />
8.2 7.4 11.5 12.0<br />
15.8 11.7 39.8 50.1 18.5 11.4<br />
4.2 13.8 19.3<br />
Healthcare 11.7 10.1<br />
-<br />
14.5 9.0<br />
7.8<br />
Financials<br />
16.4<br />
9.3 15.2 9.0<br />
6.8<br />
11.7 10.7<br />
-<br />
12.6<br />
4.6 14.6 13.5<br />
3.7<br />
13.6 30.8 13.3<br />
1.2 18.4 17.3 10.9 15.7<br />
11.1 14.5 9.5<br />
9.9<br />
8.8<br />
10.9<br />
11.3<br />
9.2<br />
19.6 22.5 27.4 11.3 -<br />
26.6<br />
7.7<br />
High Technology 12.0 14.6 10.0 12.5<br />
11.7<br />
Healthcare<br />
25.2 36.1 -<br />
19.1 28.0 19.8 9.6<br />
10.8<br />
9.4<br />
12.6<br />
7.9<br />
1.8<br />
21.2<br />
Industrials 10.3 9.1<br />
8.3 15.9 9.4<br />
10.3 13.3 6.4 11.8 6.3<br />
High Technology<br />
16.7<br />
21.2 31.0 31.6<br />
5.1 16.6<br />
17.3 25.2 38.9 11.7 18.0<br />
13.1<br />
Materials 11.2 11.0 6.9 15.8 8.8 10.9 6.8<br />
Industrials 13.3 24.9 -<br />
18.9 -7.4 8.6 15.6<br />
10.0<br />
9.8<br />
-<br />
11.5<br />
5.9<br />
16.3 21.6<br />
Media and Entertainment 11.4 11.5 1.7 12.3<br />
9.7 11.3 5.4 12.4 9.7<br />
Materials 20.7<br />
19.9 23.9 25.1 16.7 11.9<br />
23.4<br />
14.7 12.1 10.3<br />
19.2<br />
10.8 14.7 13.9 14.6<br />
8.3<br />
9.1<br />
9.4<br />
19.8 37.7<br />
5.4 23.5 25.5 12.9 22.3<br />
Real Estate 20.7 30.0 7.7 28.0<br />
18.3 17.0<br />
Media and Entertainment 17.8 41.8 17.0<br />
14.5<br />
Retail 10.6<br />
12.11<br />
17.0<br />
10.1<br />
-<br />
11.0 16.9<br />
10.7<br />
-<br />
10.0<br />
14.3<br />
8.9<br />
11.4<br />
Real Estate 14.2<br />
15.6 17.8 18.6 -12.1 17.5 19.5<br />
20.7 13.4 12.9<br />
15.0<br />
21.22<br />
6.7<br />
17 1.7<br />
14.6 14.5 12.6 22.3 42.8 12.8<br />
8.3<br />
17.6 31.6 -<br />
27.8 46.9 -<br />
10.1 16.3 13.7<br />
Telecommunications 9.5 11.4<br />
10.2<br />
Average Industry Total 11.8 12.8<br />
11.1<br />
9.4<br />
-<br />
9.0<br />
5.6 13.0 6.1<br />
9.2<br />
5.4<br />
12.7<br />
11.3 11.4 11.3 11.2 10.2 9.8 11.8<br />
12.5<br />
11.5<br />
9.3<br />
9.6<br />
Retail 14.8<br />
15.4 15.4 9.5<br />
18.8<br />
Telecommunications 18.1 43.3 -<br />
Average Industry Total 18.1 27.9 18.8 31.4<br />
23.9 12.6 10.1 18.7<br />
-5.4 27.8 -<br />
5.0<br />
25.2<br />
-<br />
4.2 17.9 19.6<br />
19.4 16.4 15.3 14.2<br />
* Using the Valuation Heatmap you can analyse the average rank value to EBITDA and average premium to 4 week bid premium for each region against twelve macro industries for the M&A mid-market. The data refers to the year-to-date for figures in colour, red indicating a decline<br />
and green an increase, compared to the figures for year-to-date last year (ytdly) which are in black.<br />
12.3<br />
9.4<br />
9.9<br />
14.4<br />
7.3<br />
21.7<br />
-<br />
10.2<br />
-0.7<br />
14.7 31.7 11.0<br />
15.9 17.0 17.8<br />
https://www.thomsonone.com
Full Year 2010 │ <strong>Mid</strong>-Market M&A Up To US$500m │ Financial <strong>Advisors</strong><br />
US Target <strong>Mid</strong>-Market Rankings (MM2)<br />
MM2 - Undisclosed Values & Values up to US$500m Jan 1 2010 - Dec 31 2010<br />
# of Deals per Advisor Rank Value per Advisor (US$m) Imputed Fees (US$m) †<br />
2010 2009 # of Change in<br />
Rank Value<br />
2010 Rank Value Advisor 2010 ** Fee<br />
Financial Advisor<br />
Rank Rank Deals # of Deals<br />
US$m<br />
Rank Change (%) Fees Rank Exp. (%)<br />
Houlihan Lokey<br />
Goldman Sachs & Co<br />
Jefferies & Co Inc<br />
1<br />
2<br />
3<br />
1<br />
3<br />
8*<br />
111<br />
88<br />
72<br />
-3<br />
19<br />
27<br />
▼<br />
▲<br />
▲<br />
6,590.9<br />
12,557.4<br />
7,419.9<br />
10<br />
1<br />
7<br />
22.4 ▲<br />
14.0 ▲<br />
120.4 ▲<br />
177.6<br />
256.9<br />
155.1<br />
3<br />
1<br />
5<br />
77.0<br />
22.5<br />
56.9<br />
Lazard<br />
4 2 70<br />
-8 ▼<br />
7,408.0<br />
8 82.6 ▲ 184.9 2 53.2<br />
Bank of America Merrill Lynch 5 7 65<br />
18 ▲<br />
9,963.5<br />
3 93.5 ▲ 145.6 7 24.5<br />
Morgan Stanley 6 6 61 12 ▲<br />
9,725.2 4 34.0 ▲ 147.2 6 21.9<br />
Keefe Bruyette & Woods Inc<br />
7 27* 60<br />
42 ▲ 1,830.1<br />
25 48.7 ▲ 38.5 24 84.2<br />
JP Morgan 8 4 55<br />
-3 ▼<br />
10,307.8 2 25.7 ▲ 164.1 4 23.1<br />
UBS 9 8* 54<br />
9 ▲<br />
8,147.9<br />
5 57.3 ▲ 96.7 10 31.5<br />
RBC Capital Markets 10 12 50<br />
10 ▲<br />
4,881.8<br />
12 94.6 ▲ 84.9 13 68.2<br />
Credit Suisse 11 5 46<br />
-8 ▼<br />
7,695.0<br />
6 11.6 ▲ 108.6 8 24.9<br />
Citi<br />
12* 11 39<br />
-3 ▼<br />
6,942.4<br />
9 33.6 ▲ 100.5 9 28.3<br />
Moelis & Co 12* 8* 39<br />
-6 ▼<br />
2,685.2<br />
19 -9.6 ▼ 81.1 14 61.8<br />
William Blair & Co 14* 19 36 7 ▲<br />
2,006.9<br />
23 138.3 ▲ 50.9 16 85.1<br />
Sandler O'Neill Partners<br />
14* 20 36<br />
9 ▲<br />
2,685.0<br />
20 140.4 ▲ 34.5 29 82.1<br />
Raymond James Financial Inc 16* 26 34<br />
15 ▲<br />
2,490.1<br />
21 91.4 ▲ 37.0 26 86.9<br />
Macquarie Group 16* 27* 34<br />
16 ▲<br />
4,717.6 13 197.3 ▲ 50.0 18 91.7<br />
PNC Financial Services Group 18* 42* 33<br />
22 ▲<br />
1,390.9 28 40.9 ▲ 35.9 27 80.7<br />
Barclays Capital 18* 17<br />
33<br />
1 ▲<br />
3,044.4<br />
4<br />
15 -40.8<br />
▼<br />
91.6<br />
11<br />
17.3<br />
Lincoln International 20 21 31<br />
7 ▲<br />
858.4<br />
38 -3.0 ▼ 24.0 33 73.4<br />
Deutsche Bank AG 21 18 30<br />
0 - 5,944.1<br />
11 29.3 ▲ 87.6 12 26.6<br />
Stifel Financial Corp<br />
22 14 29<br />
-5 ▼<br />
3,021.4<br />
16 45.9 ▲ 50.3 17 69.1<br />
Robert W Baird & Co Inc<br />
23 66* 27<br />
22 ▲<br />
1,270.2<br />
29 96.8 ▲ 42.0 22 75.7<br />
Tudor Pickering & Co LLC<br />
24 56* 26<br />
19 ▲<br />
3,743.4 14 106.2 ▲ 43.6 19 41.1<br />
Rothschild<br />
25 13 23<br />
-12 ▼ 1,666.2<br />
26 -26.1 ▼ 66.3 15 64.2<br />
Wells Fargo & Co 26* 22* 21<br />
-1 ▼ 2,790.6<br />
17 -11.3 ▼ 35.0 28 63.3<br />
Generational Equity 26* 22* 21<br />
-1 ▼<br />
118.3<br />
112 54.4 ▲ 4.0 83 100.0<br />
Cain Brothers Co. 28 49* 20<br />
12 ▲<br />
591.4<br />
51 5698.0 ▲ 11.8 42* 70.2<br />
Piper Jaffray Cos<br />
29* 29 19<br />
2 ▲<br />
616.8<br />
50 -60.9 ▼ 28.3 30* 59.2<br />
Blackstone Group LP 29* 42* 19<br />
8 ▲<br />
1,890.1<br />
24 410.8 ▲ 42.8 20 31.8<br />
Signal Hill Capital Group LLC 31 33 18<br />
3 ▲<br />
648.9<br />
47 -32.9 ▼ 19.3 35 75.7<br />
BMO Capital Markets 32 30* 17<br />
1 ▲<br />
534.7<br />
54 -34.2 ▼ 19.2 36 41.7<br />
Pagemill Partners LLC<br />
33 49* 16 8 ▲<br />
91.9<br />
128 -1.6 ▼ 9.4 46 100.0<br />
Greenhill & Co, LLC 34* 42* 15 4 ▲<br />
2,326.3<br />
22 65.1 ▲ 37.5 25 33.3<br />
Evercore Partners<br />
34* 30* 15<br />
-1 ▼<br />
2,691.0<br />
18 40.2 ▲ 41.9 23 29.5<br />
IMAP 34* 15* 15 -18 ▼ 443.9<br />
60 -49.6 ▼ 7.6 51* 100.0<br />
McGladrey Capital Markets 34* 46* 15<br />
5 ▲<br />
240.0<br />
84* 260.9 ▲ 6.0 61 100.0<br />
Jordan Edmiston Group 38* 36* 14<br />
1 ▲<br />
67.0<br />
140 -17.4 ▼ 8.8 48 100.0<br />
Deloitte 38* 56* 14<br />
7 ▲<br />
588.9<br />
52 210.1 ▲ 1.0 169* 100.0<br />
GCA Savvian Group Corp<br />
40* 59* 13<br />
7 ▲ -<br />
35 - - 18.5 37 100.0<br />
Needham & Co LLC 40* 39* 13<br />
1 ▲<br />
745.1<br />
42 54.2 ▲ 14.5 39 100.0<br />
Sagent <strong>Advisors</strong> Inc 42* 66* 12<br />
7 ▲<br />
527.0<br />
55 -4.2 ▼ 12.1 41 37.1<br />
BB&T Corp<br />
42* 59* 12<br />
6 ▲ 478.1<br />
58 570.5 ▲ 8.9 47 100.0<br />
M&A International<br />
42* 42* 12<br />
1 ▲<br />
78.8<br />
137 -62.7 ▼ 4.8 69* 100.0<br />
KPMG 45* 24* 11<br />
-10 ▼<br />
326.5<br />
73 -75.4 ▼ 2.7 96* 87.1<br />
Imperial Credit Industries Inc 45* 66* 11<br />
6 ▲<br />
642.7 48 320.6 ▲ 11.0 44 100.0<br />
Oppenheimer Holdings Inc 45* 39* 11<br />
-1 ▼<br />
1,625.1<br />
27 627.8 ▲ 25.2 32 77.8<br />
Duff and Phelps 48 15* 10 -23 ▼ 666.1 44 -62.6 ▼ 10.7 45 100.0<br />
KeyBanc Capital Markets Inc<br />
49* 34* 9<br />
-5 ▼<br />
624.4 49 154.0 ▲ 14.2 40 100.0<br />
Gleacher & Co Inc<br />
49* 102* 9 7 ▲<br />
937.9<br />
34<br />
- - 16.0 38 98.8<br />
Industry Total<br />
7,581 -79 ▼<br />
183,099.8<br />
53.8 ▲ 5,624.2<br />
49.4<br />
*tie<br />
Source: <strong>Thomson</strong> <strong>Reuters</strong>/Freeman Consulting<br />
US <strong>Mid</strong>-Market M&A up to US$500m by Rank Value Range<br />
Rank Value (US$b)<br />
$80<br />
$70<br />
$60<br />
$50<br />
$40<br />
$30<br />
$20<br />
$10<br />
$0<br />
3,000<br />
2,500<br />
2,000<br />
1,500<br />
1,000<br />
500<br />
-<br />
1Q07 2Q07 3Q07 4Q07 1Q08 2Q08 3Q08 4Q08 1Q09 2Q09 3Q09 4Q09 1Q10 2Q10 3Q10 4Q10<br />
US$200 - 500m US$100 - 200m US$50 - 100m US$0 - 50m # of Deals<br />
US <strong>Mid</strong>-Market M&A up to US$500m by Target Industry<br />
2.6% 2.4% Energy and Power<br />
17.7%<br />
5.5%<br />
High Technology<br />
Financials<br />
6.5%<br />
Healthcare<br />
Real Estate<br />
6.6%<br />
Industrials<br />
15.0%<br />
Materials<br />
Media and Entertainment<br />
7.6%<br />
Consumer Products and Services<br />
Retail<br />
Consumer Staples<br />
10.8%<br />
12.3%<br />
Telecommunications<br />
Government and Agencies<br />
10.8%<br />
# of Deals<br />
** Fee exposure indicates each firm's mid-market fees from deals valued at up to US$500m as a percentage of its overall M&A fees<br />
† Imputed Fees shown are based on completed deal activity, whereas deal count & rank values are compiled based on announced deal activity.<br />
https://www.thomsonone.com
Full Year 2010 │ <strong>Mid</strong>-Market M&A Up To US$500m │ Financial <strong>Advisors</strong><br />
Latin America Involvement <strong>Mid</strong>-Market Rankings (MM17)<br />
MM17 - Undisclosed Values & Values up to US$500m<br />
Jan 1 2010 - Dec 31 2010<br />
Latin America <strong>Mid</strong>-Market M&A up to US$500m by Rank Value Range<br />
# of Deals per Advisor<br />
Rank Value per Advisor (US$m)<br />
Imputed Fees (US$m) †<br />
Financial Advisor<br />
2010<br />
Rank<br />
2009<br />
Rank<br />
# of<br />
Deals<br />
Change in<br />
# of Deals<br />
Rank Value<br />
US$m<br />
2010<br />
Rank<br />
Rank Value<br />
Change (%)<br />
Advisor<br />
Fees<br />
2010<br />
Rank<br />
** Fee<br />
Exp. (%)<br />
Banco BTG Pactual SA<br />
1 18* 41<br />
37 ▲<br />
4,846.1<br />
1 360.1 ▲ 36.5 2 53.4<br />
Santander 2 7* 28<br />
14 ▲<br />
2,311.5<br />
4 45.7 ▲ 18.6 8 23.9<br />
Credit Suisse<br />
Itau Unibanco<br />
3<br />
4<br />
3*<br />
3*<br />
25<br />
22<br />
9<br />
6<br />
▲<br />
▲<br />
3,462.1<br />
2,020.0<br />
2<br />
5<br />
25.7 ▲<br />
1.7 ▲<br />
32.8<br />
25.2<br />
3<br />
4<br />
23.5<br />
41.4<br />
BR Partners<br />
5 -<br />
21<br />
21 ▲<br />
993.6<br />
8<br />
- - 22.2 5 89.9<br />
JP Morgan<br />
6 1<br />
17<br />
-11 ▼<br />
2,878.2<br />
3 -6.9 ▼ 40.9 1 36.2<br />
Banco Bradesco SA<br />
7 9<br />
14<br />
1 ▲ 669.5<br />
16 -78.9 ▼ 21.3 7 60.3<br />
Bank of America Merrill Lynch 8 11* 13<br />
5 ▲<br />
1,365.1<br />
7 -20.3 ▼ 13.9 12 35.7<br />
Lazard<br />
9 18* 12<br />
8 ▲ 575.4 21 485.4 ▲ 12.1 13 64.7<br />
Global M&A<br />
10* 15* 11<br />
6 ▲<br />
30.0<br />
64 -92.2 ▼ 6.7 16 100.0<br />
Goldman Sachs & Co<br />
10* 15* 11<br />
6 ▲ 1,418.5<br />
6 59.5 ▲ 15.1 11 41.6<br />
Rothschild<br />
12* 7* 10<br />
-4 ▼<br />
566.7<br />
22 -72.1 ▼ 17.1 10 26.0<br />
Morgan Stanley 12* 2<br />
10<br />
-10 ▼<br />
920.5<br />
10 -64.5 ▼ 9.1 14 22.0<br />
UBS<br />
14 10<br />
9<br />
0 - 841.1<br />
12 71.5 ▲ 18.5 9 45.9<br />
Deutsche Bank AG<br />
15* 18* 7<br />
3 ▲<br />
531.2<br />
24 15.2 ▲ 4.0 26 6.9<br />
BNP Paribas SA 15* 6<br />
7<br />
-8 ▼<br />
843.0<br />
11 -55.5 ▼ 21.6 6 64.3<br />
Patria Investimentos 17* 24* 6<br />
3 ▲<br />
592.3<br />
20 169.8 ▲ 6.3 17* 65.6<br />
Banco Standard De Investimento 17* -<br />
6<br />
6 ▲<br />
0.0<br />
77*<br />
- - 3.6 28 30.5<br />
M&A International 17* 24* 6 3 ▲<br />
363.33<br />
34<br />
871.4<br />
▲ 29 2.9<br />
33<br />
100.00<br />
KPMG<br />
20* 15* 5<br />
0 -<br />
648.7<br />
19 63.8 ▲ .5 77* 100.0<br />
BBVA 20* 43* 5<br />
4 ▲<br />
650.0<br />
18 10056.3 ▲ .1 83* 2.7<br />
Estater Gestao e Financas 20* 14<br />
5<br />
-2 ▼<br />
450.8<br />
31 -29.7 ▼ 6.3 17* 14.1<br />
IMAP<br />
20* 11* 5<br />
-3 ▼ 111.1<br />
45 17.7 ▲ 3.1 31* 100.0<br />
Deloitte 20* 27* 5<br />
3 ▲<br />
684.7<br />
15 1269.4 ▲ 1.7 44* 100.0<br />
HSBC Holdings PLC 20* 18* 5<br />
1 ▲<br />
787.0<br />
14 745.3 ▲ 5.0 21* 49.5<br />
Houlihan Lokey 26* 18* 4<br />
0 -<br />
257.1 39 -1.1 ▼ 3.2 30 100.0<br />
INFUPA SA 26* 27* 4<br />
2 ▲<br />
26.8 67 - - 1.2 54* 100.0<br />
Credit Agricole CIB<br />
26* 27* 4<br />
2 ▲<br />
259.6<br />
38 -35.7 ▼ 4.1 25 25.6<br />
Caixa Geral de Depositos 26* -<br />
4<br />
4 ▲<br />
281.3 37 - - 1.9 40* 16.0<br />
Banco Espirito Santo SA 26* 27* 4<br />
2 ▲<br />
88.5<br />
51<br />
- - 3.5 29 35.4<br />
Mediobanca 31* - 3<br />
3 ▲<br />
465.6<br />
30 - - -<br />
-<br />
-<br />
Greenhill & Co, LLC 31* - 3<br />
3 ▲<br />
370.0<br />
33<br />
- - 2.0 39 100.0<br />
Larrain Vial SA 31* - 3<br />
3 ▲ 151.0 44<br />
- - 2.6 35 100.0<br />
PricewaterhouseCoopers 31* 11* 3<br />
-5 ▼<br />
515.4<br />
25 312.3 ▲ .2 81* 100.0<br />
Citi 31* 3* 3<br />
-13 ▼<br />
296.0 36 -87.2 ▼ 8.8 15 22.6<br />
Singular Partners 31* - 3 3 ▲<br />
71.3<br />
52*<br />
- - 1.8 42* 41.9<br />
Rank Value (US$b)<br />
$16<br />
$14<br />
$12<br />
$10<br />
$8<br />
$6<br />
600<br />
500<br />
400<br />
$4<br />
100<br />
$2<br />
$0<br />
-<br />
1Q07 2Q07 3Q07 4Q07 1Q08 2Q08 3Q08 4Q08 1Q09 2Q09 3Q09 4Q09 1Q10 2Q10 3Q10 4Q10<br />
US$200 - 500m US$100 - 200m US$50 - 100m US$0 - 50m # of Deals<br />
Latin America <strong>Mid</strong>-Market M&A up to US$500m by Target Industry<br />
1.7% 1.5%<br />
2.5%<br />
3.9%<br />
Materials<br />
4.7%<br />
23.0%<br />
Energy and Power<br />
Consumer Staples<br />
4.8%<br />
Industrials<br />
300<br />
200<br />
# of Deals<br />
6.8%<br />
Financials<br />
Real Estate<br />
11.1%<br />
16.9%<br />
Consumer Products and Services<br />
High Technology<br />
Healthcare<br />
Media and Entertainment<br />
Industry Total 1,786 349 ▲ 40,010.2<br />
27.1 ▲ 892.0<br />
*tie<br />
Source: <strong>Thomson</strong> <strong>Reuters</strong>/Freeman Consulting<br />
47.5<br />
11.1%<br />
12.1%<br />
Telecommunications<br />
Retail<br />
** Fee exposure indicates each firm's mid-market fees from deals valued at up to US$500m as a percentage of its overall M&A fees<br />
† Imputed Fees shown are based on completed deal activity, whereas deal count & rank values are compiled based on announced deal activity.<br />
https://www.thomsonone.com
Full Year 2010 │ <strong>Mid</strong>-Market M&A Up To US$500m │ Financial <strong>Advisors</strong><br />
European Involvement <strong>Mid</strong>-Market Rankings (MM3)<br />
MM3 - Undisclosed Values & Values up to US$500m<br />
Jan 1 2010 - Dec 31 2010<br />
European <strong>Mid</strong>-Market M&A up to US$500m by Rank Value Range<br />
# of Deals per Advisor<br />
Rank Value per Advisor<br />
Imputed Fees (US$m) †<br />
2010 2009 # of Change in Rank Value Rank Value 2010 Rank Value Advisor 2010 ** Fee<br />
Financial Advisor<br />
Rank Rank Deals # of Deals US$m Euro mil Rank Change (%) Fees Rank Exp. (%)<br />
KPMG 1 1 181<br />
0 - 8,649.8 6,681.1 9 88.4 ▲ 24.1 35 87.0<br />
Rothschild 2 2 159<br />
15 ▲ 14,417.5 10,862.7 1 88.3 ▲ 327.5 1 58.8<br />
Deloitte<br />
3 10 137<br />
53 ▲ 3,987.2 3,028.4 16 132.7 ▲ 28.7 28 96.3<br />
Lazard 4 4 134<br />
25 ▲ 13,511.6 10,338.5 2 109.1 ▲ 268.8 2 57.3<br />
PricewaterhouseCoopers 5 3 133<br />
-5 ▼ 3,793.9 2,880.0 17 -5.8 ▼ 7.5 81 94.9<br />
Morgan Stanley 6 11 96<br />
15 ▲ 10,932.9 8,309.0 7 15.4 ▲ 175.5 4 32.1<br />
Credit Suisse<br />
7 8<br />
94<br />
-1 ▼ 11,314.1 8,647.0 6 17.3 ▲ 169.4 5 35.4<br />
UBS<br />
Ernst & Young LLP<br />
8<br />
9<br />
6<br />
5<br />
87<br />
85<br />
-12<br />
-19<br />
▼<br />
▼<br />
11,702.1<br />
2,432.6<br />
8,833.9<br />
1,813.8<br />
4<br />
26<br />
29.7 ▲<br />
-26.1 ▼<br />
130.6<br />
7.4<br />
7<br />
82<br />
36.7<br />
66.7<br />
JP Morgan 10 7<br />
84<br />
-13 ▼ 12,965.2 9,868.5 3 30.8 ▲ 154.6 6 32.2<br />
Deutsche Bank AG<br />
11* 12 75<br />
-3 ▼ 11,355.6 8,661.9 5 78.4 ▲ 129.5 8 40.2<br />
BNP Paribas SA<br />
11* 14 75<br />
1 ▲ 7,230.5 5,459.7 10 -5.4 ▼ 76.3 11 40.9<br />
BDO International<br />
11* 15 75<br />
14 ▲ 852.6 629.7 55 140.3 ▲ 42.6 20 100.0<br />
IMAP<br />
Goldman Sachs & Co<br />
14<br />
15<br />
9<br />
13<br />
68<br />
67<br />
-20<br />
-8<br />
▼<br />
▼<br />
474.2<br />
9,751.5<br />
363.9<br />
7,432.3<br />
82<br />
8<br />
34.0 ▲<br />
0.0 ▼<br />
33.8<br />
211.5<br />
24<br />
3<br />
100.0<br />
28.8<br />
DC Advisory Partners 16 20 61<br />
10 ▲ 2,871.0 2,181.7 21 162.3 ▲ 54.2 12 83.1<br />
Mediobanca 17* 32* 50<br />
21 ▲ 3,190.4 2,409.4 19 -18.8 ▼ 39.8 22 47.8<br />
UniCredit Group<br />
17* 22 50<br />
4 ▲ 3,407.0 2,602.7 18 -6.4 ▼ 53.4 13 70.8<br />
Lincoln International<br />
19* 34 49<br />
21 ▲ 583.3 447.3 70 351.5 ▲ 39.4 23 100.0<br />
M&A International 19* 18*<br />
49<br />
-4<br />
▼<br />
449.0 338.6<br />
86 -31.4<br />
▼ 26.22<br />
30<br />
100.00<br />
Grant Thornton LLP<br />
21* 18* 47<br />
-6 ▼ 396.4 293.7 108 -53.6 ▼ 2.2 195* 73.3<br />
ING 21* 16 47<br />
-11 ▼ 533.0 413.1 73 -70.3 ▼ 28.9 27 67.2<br />
Clairfield Partners<br />
23 39* 46<br />
28 ▲ 177.3 136.1 162 157.0 ▲ 23.7 38 71.6<br />
Nomura 24 32* 44<br />
15 ▲ 4,424.0 3,349.1 13 108.6 ▲ 42.1 21 62.8<br />
Citi<br />
25 24 41<br />
0 - 5,514.6 4,214.2 11 0.2 ▲ 84.3 9 33.3<br />
Global M&A<br />
26* 17 38<br />
-19 ▼ 432.3 327.7 93 -36.6 ▼ 22.8 39 100.0<br />
Macquarie Group<br />
26* 39* 38 20 ▲ 2,503.0 1,862.6 24 173.7 ▲ 25.3 33 79.3<br />
Credit Agricole CIB<br />
28 36 37<br />
13 ▲ 3,018.2 2,313.1 20 32.1 ▲ 25.9 31 36.3<br />
HSBC Holdings PLC 29 27 36<br />
1 ▲ 4,456.4 3,408.5 12 88.2 ▲ 44.3 18 43.8<br />
Bank of America Merrill Lynch 30 26 33<br />
-5 ▼ 4,045.7 3,006.3 15 -7.9 ▼ 78.5 10 32.5<br />
Baker Tilly International<br />
31 28 30<br />
-4 ▼ 57.9 43.9 233 -59.3 ▼ 14.5 49 100.0<br />
SEB Enskilda<br />
32 30* 29 -1 ▼ 1,919.4 1,488.5 30 -47.5 ▼ 53.2 14 75.6<br />
Houlihan Lokey<br />
33* 25 28<br />
-11 ▼ 2,017.8 1,531.1 29 49.2 ▲ 47.1 16* 67.9<br />
RBS<br />
33* 23 28<br />
-15 ▼ 2,737.6 2,096.1 22 41.0 ▲ 23.9 36 20.0<br />
Hawkpoint Partners<br />
33* 35 28 1 ▲ 1,472.9 1,106.4 39 -22.0 ▼ 31.8 25 72.3<br />
Translink International Group 33* - 28 28 ▲ 15.6 12.1 312*<br />
- - -<br />
-<br />
-<br />
Banco Espirito Santo SA<br />
33* 37* 28 8 ▲ 1,489.4 1,144.2 38 44.3 ▲ 19.5 41 59.5<br />
Barclays Capital<br />
38* 45* 26<br />
12 ▲ 4,276.7 3,218.4 14 235.4 ▲ 47.1 16* 22.5<br />
Jefferies & Co Inc 38* 30* 26 -4 ▼ 2,215.3 1,659.0 28 -13.0 ▼ 47.3 15 56.5<br />
MK Finance SA 40 37* 25 5 ▲ 25.0 19.3 283* 316.7 ▲ 12.6 57 100.0<br />
Intesa SanPaolo 41* 29 24<br />
-8 ▼ 2,658.8 2,020.8 23 -16.7 ▼ 43.5 19 83.3<br />
Santander 41* 49* 24<br />
11 ▲ 2,254.8 1,738.8 27 50.9 ▲ 18.9 42* 45.5<br />
Societe Generale<br />
43 41* 22 5 ▲ 1,245.3 961.1 43 -27.8 - 29.5 26 31.0<br />
Carnegie 44* 61* 20<br />
10 ▲ 1,610.9 1,266.3 36 165.9 ▲ 17.3 47 52.6<br />
Altium Capital Limited<br />
44* 61* 20<br />
10 ▲ 735.2 562.5 59 4.8 ▲ 14.7 48 61.8<br />
Globalscope 44* 61* 20 10 ▲ 21.1 16.0 293* -11.0 ▼ 12.2 59* 100.0<br />
Danske Markets<br />
47* 51* 19<br />
7 ▲ 716.2 527.2 60 11.8 ▲ 13.7 52 70.6<br />
KBC Group NV 47* 55* 19<br />
8 ▲ 990.8 740.6 51 85.8 ▲ 14.0 51 82.4<br />
Rabobank NV 49 21 18 -30 ▼ 486.8 367.4 81 109.2 ▲ 8.4 72 45.9<br />
Lexicon Partners 50* 51* 17<br />
5 ▲ 771.9 583.1 58 41.7 ▲ 12.2 59* 45.5<br />
ABG Sundal Collier 50* 55* 17 6 ▲ 461.4 366.4 84 131.9 ▲ 9.8 66* 42.2<br />
Industry Total 16,788 1184 ▲ 238,073.3 181,084.0<br />
28.0 ▲ 6,622.8<br />
57.9<br />
*tie<br />
Source: <strong>Thomson</strong> <strong>Reuters</strong>/Freeman Consulting<br />
Rank Value (US$b)<br />
$120<br />
$100<br />
$80<br />
$60<br />
$40<br />
4,600<br />
4,400<br />
4,200<br />
4,000<br />
3,800<br />
$20<br />
3,600<br />
$0<br />
3,400<br />
1Q07 2Q07 3Q07 4Q07 1Q08 2Q08 3Q08 4Q08 1Q09 2Q09 3Q09 4Q09 1Q10 2Q10 3Q10 4Q10<br />
US$200 - 500m US$100 - 200m US$50 - 100m US$0 - 50m # of Deals<br />
European <strong>Mid</strong>-Market M&A up to US$500m by Target Industry<br />
3.5% 2.1% Financials<br />
5.5%<br />
15.3%<br />
Real Estate<br />
5.6%<br />
Energy and Power<br />
Materials<br />
6.2%<br />
Industrials<br />
13.9%<br />
High Technology<br />
6.3%<br />
Consumer Products and Services<br />
Healthcare<br />
6.4%<br />
Media and Entertainment<br />
Consumer Staples<br />
13.7%<br />
Retail<br />
9.5%<br />
Telecommunications<br />
11.9%<br />
# of Deals<br />
** Fee exposure indicates each firm's mid-market fees from deals valued at up to US$500m as a percentage of its overall M&A fees<br />
† Imputed Fees shown are based on completed deal activity, whereas deal count & rank values are compiled based on announced deal activity.<br />
https://www.thomsonone.com
Full Year 2010 │ <strong>Mid</strong>-Market M&A Up To US$500m │ Financial <strong>Advisors</strong><br />
UK Involvement <strong>Mid</strong>-Market Rankings (MM4)<br />
MM4 - Undisclosed Values & Values up to US$500m<br />
Jan 1 2010 - Dec 31 2010<br />
UK <strong>Mid</strong>-Market M&A up to US$500m by Rank Value Range<br />
# of Deals per Advisor<br />
Rank Value per Advisor<br />
Imputed Fees (US$m) †<br />
2010 2009 # of Change in Rank Value Rank Value 2010 Rank Value Advisor 2010 ** Fee<br />
Financial Advisor<br />
Rank Rank Deals # of Deals US$m GBP m Rank Change (%) Fees Rank Exp. (%)<br />
Rothschild<br />
KPMG<br />
1<br />
2<br />
2<br />
4*<br />
71<br />
53<br />
26<br />
15<br />
▲<br />
▲<br />
8,330.2<br />
2,786.9<br />
5,438.7<br />
1,793.1<br />
1<br />
9<br />
213.9 ▲<br />
341.5 ▲<br />
158.0<br />
6.0<br />
1<br />
43<br />
67.0<br />
78.9<br />
Deloitte<br />
3 6<br />
47<br />
10 ▲ 1,769.2 1,159.2 16 95.7 ▲ 8.1 33* 91.0<br />
Lazard<br />
4 8* 45<br />
12 ▲ 5,097.2 3,313.4 4 198.8 ▲ 103.2 2 57.1<br />
Grant Thornton LLP<br />
BDO International<br />
5<br />
6<br />
3<br />
12<br />
44<br />
41<br />
1<br />
11<br />
▲<br />
▲<br />
295.9<br />
777.5<br />
190.4<br />
500.5<br />
73<br />
33<br />
-60.9 ▼<br />
153.0 ▲<br />
2.1<br />
25.2<br />
111*<br />
13<br />
72.4<br />
100.0<br />
PricewaterhouseCoopers<br />
JP Morgan<br />
7<br />
8<br />
1<br />
11<br />
40<br />
39<br />
-9<br />
8<br />
▼<br />
▲<br />
2,310.0<br />
5,239.6<br />
1,500.7<br />
3,397.7<br />
11<br />
3<br />
128.3 ▲<br />
74.9 ▲<br />
4.3<br />
53.8<br />
57*<br />
7<br />
91.5<br />
23.3<br />
UBS 9 4* 37<br />
-1 ▼ 5,621.0 3,655.3 2 87.7 ▲ 60.0 5 34.8<br />
Morgan Stanley 10 18* 35<br />
18 ▲ 4,789.4 3,120.6 5 134.3 ▲ 60.8 4 33.6<br />
Ernst & Young LLP<br />
11 7<br />
32<br />
-4 ▼ 1,518.1 971.7 23 49.9 ▲ 3.3 74* 84.6<br />
Goldman Sachs & Co 12 13 31<br />
5 ▲ 3,958.0 2,590.0 6 2.6 ▲ 91.7 3 37.7<br />
Baker Tilly International 13 8* 30<br />
-3 ▼ 57.9 37.4 143 -59.3 ▼ 14.5 20* 100.0<br />
Credit Suisse<br />
14 10 28<br />
-4 ▼ 3,714.2 2,415.5 7 17.5 ▲ 54.5 6 30.7<br />
HSBC Holdings PLC<br />
15 18* 26<br />
9 ▲ 2,446.1 1,605.2 10 76.9 ▲ 31.4 10 63.2<br />
Macquarie Group<br />
16 37* 25<br />
18 ▲ 1,621.0 1,042.5 19 273.4 ▲ 10.8 29 61.7<br />
DC Advisory Partners<br />
17 23 23<br />
10 ▲ 2,072.6 1,331.2 12 229.1 ▲ 27.0 12 82.6<br />
Hawkpoint Partners<br />
18 15* 22<br />
3 ▲ 1,393.3 896.1 24 10.5 ▲ 20.4 17* 62.6<br />
IMAP 19 14 19<br />
-3 ▼ 325.8 211.3 62 19.3 ▲ 9.4 30 100.0<br />
Barclays Capital 20* 43* 18<br />
12<br />
▲<br />
3,166.0 2,035.2<br />
2<br />
8<br />
298.99<br />
▲<br />
28.9<br />
11<br />
28.1<br />
Nomura 20* 24* 18<br />
6 ▲ 1,542.4 1,010.7 21 346.4 ▲ 14.5 20* 56.9<br />
BNP Paribas SA<br />
22* 43* 16<br />
10 ▲ 1,049.6 693.3 27 63.4 ▲ 12.5 23 32.7<br />
Brewin Dolphin<br />
22* 86* 16<br />
14 ▲ 459.1 305.8 47 264.7 ▲ 8.1 33* 100.0<br />
RBS<br />
24* 15* 15<br />
-4 ▼ 1,528.8 974.6 22 25.5 ▲ 16.7 19 23.3<br />
Lexicon Partners 24* 24* 15<br />
3 ▲ 771.9 497.9 35 41.7 ▲ 11.4 27 66.3<br />
Citi<br />
24* 24* 15<br />
3 ▲ 1,955.4 1,260.9 14 72.8 ▲ 24.7 14 26.2<br />
Zeus Capital Ltd 27* 53* 14<br />
10 ▲ 52.4 34.1 147 0.4 ▲ 3.3 74* 100.0<br />
Jefferies & Co Inc<br />
27* 21* 14<br />
0 - 1,236.6 812.0 25 1.3 ▲ 23.2 15 62.7<br />
Investec<br />
29* 37* 13<br />
6 ▲ 493.2 315.9 45 197.5 ▲ 5.5 45 41.7<br />
Deutsche Bank AG 29* 15* 13<br />
-6 ▼ 1,987.3 1,284.9 13 -32.6 ▼ 35.1 8 36.7<br />
M&A International 29* 20 13 -3 ▼ 262.0 170.4 79 27.7 ▲ 7.7 36 100.0<br />
Greenhill & Co, LLC 32* 70* 12 9 ▲ 1,557.6 1,015.4 20 644.2 ▲ 21.0 16 52.9<br />
Lincoln International 32* 124* 12<br />
11 ▲ 505.4 331.8 43 - - 7.2 37* 100.0<br />
Houlihan Lokey 34* 21* 11<br />
-3 ▼ 1,028.6 657.6 28 55.4 ▲ 13.3 22 48.2<br />
Altium Capital Limited 34* 47* 11<br />
6 ▲ 588.5 381.8 39 11.5 ▲ 7.2 37* 44.2<br />
Numis 34* 47* 11 6 ▲ 118.8 76.7 108 -75.2 ▼ 2.3 102* 100.0<br />
KBC Group NV 34* 32* 11 2 ▲ 869.7 569.1 30 78.7 ▲ 11.0 28 78.0<br />
Bank of America Merrill Lynch 38 28* 10 0 - 1,808.1 1,173.5 15 57.4 ▲ 34.1 9 33.4<br />
Standard Chartered PLC 39* 32* 9 0 - 606.8 396.4 37 12.0 ▲ 4.2 60* 6.9<br />
RBC Capital Markets 39* 36 9 1 ▲ 1,621.1 1,047.2 18 62.5 ▲ 6.2 41* 13.7<br />
Cenkos Securities PLC 39* 53* 9 5 ▲ 310.5 205.1 66 22.9 ▲ 6.2 41* 100.0<br />
Jones Lang LaSalle Inc 42* 28* 8 -2 ▼ 1,736.6 1,132.0 17 -3.4 ▼ 20.4 17* 73.1<br />
Daniel Stewart 42* 124* 8 7 ▲ 281.1 191.8 78 5756.3 ▲ .4 223* 100.0<br />
Secure Trust Banking Group PLC 42* 53* 8 4 ▲ 224.0 145.2 84 825.6 ▲ 4.1 63* 100.0<br />
Savills PLC 42* 86* 8 6 ▲ 527.7 349.2 41 136.4 ▲ 3.5 71* 100.0<br />
Moseley Securities Corporation 42* 70* 8 5 ▲ 1,178.7 771.3 26 73.0 ▲ 11.5 26 66.9<br />
Rank Value (US$b)<br />
$45<br />
1,600<br />
$40<br />
1,400<br />
$35<br />
1,200<br />
$30<br />
1,000<br />
$25<br />
800<br />
$20<br />
600<br />
$15<br />
400<br />
$10<br />
$5<br />
200<br />
$0<br />
-<br />
1Q07 2Q07 3Q07 4Q07 1Q08 2Q08 3Q08 4Q08 1Q09 2Q09 3Q09 4Q09 1Q10 2Q10 3Q10 4Q10<br />
US$200 - 500m US$100 - 200m US$50 - 100m US$0 - 50m # of Deals<br />
UK <strong>Mid</strong>-Market M&A up to US$500m by Target Industry<br />
3.7%<br />
3.9%<br />
16.6%<br />
Real Estate<br />
4.7%<br />
Financials<br />
Energy and Power<br />
6.6%<br />
Materials<br />
Consumer Products and Services<br />
12.7%<br />
7.0%<br />
High Technology<br />
Industrials<br />
Media and Entertainment<br />
7.1%<br />
Consumer Staples<br />
12.5%<br />
Healthcare<br />
# of Deals<br />
Industry Total<br />
3,657<br />
329 ▲<br />
86,576.9<br />
56,127.0<br />
49.6 ▲ 2,276.0<br />
57.0<br />
11.2%<br />
Retail<br />
*tie<br />
Source: <strong>Thomson</strong> <strong>Reuters</strong>/Freeman Consulting<br />
** Fee exposure indicates each firm's mid-market fees from deals valued at up to US$500m as a percentage of its overall M&A fees<br />
† Imputed Fees shown are based on completed deal activity, whereas deal count & rank values are compiled based on announced deal activity.<br />
11.9%<br />
Telecommunications<br />
https://www.thomsonone.com
Full Year 2010 │ <strong>Mid</strong>-Market M&A Up To US$500m │ Financial <strong>Advisors</strong><br />
French Involvement <strong>Mid</strong>-Market Rankings (MM5)<br />
MM5 - Undisclosed Values & Values up to US$500m<br />
Jan 1 2010 - Dec 31 2010<br />
French <strong>Mid</strong>-Market M&A up to US$500m by Rank Value Range<br />
# of Deals per Advisor Rank Value per Advisor Imputed Fees (US$m) †<br />
2010 2009 # of Change in Rank Value Rank Value 2010 Rank Value Advisor 2010 ** Fee<br />
Financial Advisor<br />
Rank Rank Deals # of Deals US$m Euro mil Rank Change (%) Fees Rank Exp. (%)<br />
BNP Paribas SA 1 2 48<br />
10 ▲ 4,871.3 3,690.3 1 29.7 ▲ 39.4 4 39.6<br />
Rothschild 2 1<br />
46<br />
1 ▲ 2,654.8 1,979.3 3 34.7 ▲ 87.2 1 49.9<br />
Lazard<br />
3 3 42 12 ▲ 3,828.0 2,837.6 2 113.1 ▲ 74.2 2 63.4<br />
PricewaterhouseCoopers 4* 15* 28<br />
17 ▲ 421.1 333.1 17 -34.7 ▼ 1.4 69* 100.0<br />
Credit Agricole CIB<br />
4* 6* 28<br />
9 ▲ 1,982.9 1,530.4 6 24.7 ▲ 25.2 7 39.9<br />
MK Finance SA 6 6* 25<br />
6 ▲ 25.0 19.3 72* 316.7 ▲ 12.6 12 100.0<br />
UBS<br />
7 5 22<br />
2 ▲ 2,229.3 1,670.6 5 6.5 ▲ 19.5 11 43.7<br />
Deutsche Bank AG<br />
8* 10* 20<br />
7 ▲ 2,343.6 1,769.1 4 88.4 ▲ 29.5 5 56.0<br />
JP Morgan<br />
8* 13* 20<br />
8 ▲ 1,827.0 1,413.5 7 17.6 ▲ 23.0 8* 25.6<br />
Societe Generale 10 10* 18<br />
5 ▲ 1,032.5 795.6 10 -26.9 ▼ 25.4 6 41.5<br />
Credit Suisse<br />
11* 15* 14<br />
3 ▲ 1,817.1 1,404.1 8 99.9 ▲ 53.1 3 52.9<br />
DC Advisory Partners<br />
11* 4<br />
14 -7 ▼ 34.1 26.0 67 -92.6 ▼ 7.5 18 82.4<br />
Ernst & Young LLP<br />
13* 15* 13<br />
2 ▲ 287.5 211.9 29 -37.5 ▼ .5 135* 29.4<br />
Lincoln International<br />
13* 18* 13<br />
4 ▲ 32.3 23.7 68 750.0 ▲ 8.5 16 100.0<br />
Clairfield Partners<br />
13* 30* 13<br />
7 ▲ 0.0 0.0 101* - - 7.2 19 100.0<br />
Macquarie Group 16 48* 12<br />
10 ▲ 125.4 87.0 45 -51.3 ▼ 4.2 25 100.0<br />
KPMG 17* 10* 11<br />
-2 ▼ 344.9 259.0 24 15.9 ▲ 1.5 64* 100.0<br />
Morgan Stanley 17* 8<br />
11<br />
-7 ▼ 1,247.5 950.7<br />
9 1.8 ▲ 23.0 8* 24.9<br />
Global M&A<br />
19* 9<br />
9<br />
-5 ▼ 0.0 0.0 101* - - 5.4 22* 100.0<br />
Financiere Cambon 19* 18*<br />
9<br />
0 - 76.2 58.9<br />
55 -20.0 0<br />
▼ 24 2.4<br />
45*<br />
100.00<br />
Hawkpoint Partners 21 34* 8<br />
3 ▲ 0.0 0.0 101* - - 7.0 20 43.2<br />
Mediobanca<br />
22* 40* 7<br />
3 ▲ 405.4 309.8 22 -56.6 ▼ 1.3 71* 54.2<br />
Gruppo Banca Leonardo 22* 43* 7<br />
4 ▲ 586.9 460.0 12 38.0 ▲ 4.1 26* 31.1<br />
Nomura 22* 34* 7<br />
2 ▲ 342.3 276.5 26 -66.4 ▼ 5.4 22* 38.8<br />
Bryan Garnier & Co 25* 26* 6<br />
-1 ▼ 29.8 23.9 70 -74.3 ▼ 1.5 64* 100.0<br />
Natixis<br />
25* 18* 6 -3 ▼ 0.3<br />
0.3 97* -99.9 ▼ 3.1 38* 100.0<br />
IMAP<br />
25* 13* 6<br />
-6 ▼ 5.4 4.0<br />
92<br />
- - 3.2 36* 100.0<br />
UniCredit Group<br />
25* 22* 6<br />
-2 ▼ 342.8 247.1 25 -53.5 ▼ 11.9 13 100.0<br />
Goldman Sachs & Co<br />
25* 30* 6<br />
0 - 790.2 612.4 11 -29.6 ▼ 21.0 10 21.9<br />
Houlihan Lokey<br />
30* 18* 5<br />
-4 ▼ 135.9 100.0 42 -53.4 ▼ 5.5 21 100.0<br />
Grant Thornton LLP 30* 30* 5 -1 ▼ 13.1 9.2<br />
87 718.8 ▲ .1 153* 100.0<br />
goetzpartners Corp Finance 30* 64* 5<br />
4 ▲ 0.0 0.0 101* - - 3.0 40 100.0<br />
Rabobank NV 30* 34* 5<br />
0 - 145.1 112.1 41 -37.6 ▼ 2.8 42* 100.0<br />
HSBC Holdings PLC 30* 26* 5<br />
-2 ▼ 442.8 346.9 16 15.8 ▲ 8.3 17 26.2<br />
M&A International 30* 30* 5<br />
-1 ▼ 13.3 10.8 86 13.7 ▲ 2.1 54 100.0<br />
RBS 36* 22* 4<br />
-4 ▼ 340.3 278.8 27 1833.5 ▲ 3.4 33 9.2<br />
ING 36* 43* 4 1 ▲ 77.8 63.8 53 92.6 ▲ 1.0 88* 100.0<br />
Arjil Groupe Altium 36* 64* 4<br />
3 ▲ 10.0 7.4<br />
88 -93.6 ▼ 4.1 26* 100.0<br />
Deloitte 36* 40* 4<br />
0 - 0.0 0.0 101*<br />
- - .8 93* 100.0<br />
Banque Degroof 36* 64* 4<br />
3 ▲ 1.1 0.9<br />
95 - - 1.2 74* 100.0<br />
Rank Value (US$b)<br />
$16<br />
$14<br />
$12<br />
$10<br />
$8<br />
$6<br />
700<br />
600<br />
500<br />
400<br />
300<br />
200<br />
$4<br />
$2<br />
100<br />
$0<br />
-<br />
1Q07 2Q07 3Q07 4Q07 1Q08 2Q08 3Q08 4Q08 1Q09 2Q09 3Q09 4Q09 1Q10 2Q10 3Q10 4Q10<br />
US$200 - 500m US$100 - 200m US$50 - 100m US$0 - 50m # of Deals<br />
French <strong>Mid</strong>-Market M&A up to US$500m by Target Industry<br />
4.1%<br />
Real Estate<br />
5.2%<br />
15.7%<br />
Financials<br />
6.8%<br />
Energy and Power<br />
Materials<br />
7.7%<br />
Media and Entertainment<br />
13.2%<br />
Healthcare<br />
# of Deals<br />
Industrials<br />
8.1%<br />
Consumer Staples<br />
High Technology<br />
10.9%<br />
Retail<br />
Industry Total 2,042 263 ▲ 32,456.3 24,545.0<br />
27.2 ▲<br />
1,018.2<br />
52.4<br />
8.2%<br />
Consumer Products and Services<br />
*tie<br />
Source: <strong>Thomson</strong> <strong>Reuters</strong>/Freeman Consulting<br />
8.6%<br />
10.5%<br />
Telecommunications<br />
** Fee exposure indicates each firm's mid-market fees from deals valued at up to US$500m as a percentage of its overall M&A fees<br />
† Imputed Fees shown are based on completed deal activity, whereas deal count & rank values are compiled based on announced deal activity.<br />
https://www.thomsonone.com
Full Year 2010 │ <strong>Mid</strong>-Market M&A Up To US$500m │ Financial <strong>Advisors</strong><br />
German Involvement <strong>Mid</strong>-Market Rankings (MM6)<br />
MM6 - Undisclosed Values & Values up to US$500m<br />
Jan 1 2010 - Dec 31 2010<br />
German <strong>Mid</strong>-Market M&A up to US$500m by Rank Value Range<br />
# of Deals per Advisor<br />
Rank Value per Advisor<br />
Imputed Fees (US$m) †<br />
2010 2009 # of Change in Rank Value Rank Value 2010 Rank Value Advisor 2010 ** Fee<br />
Financial Advisor<br />
Rank Rank Deals # of Deals Euro mil Euro mil Rank Change (%) Fees Rank Exp. (%)<br />
Lincoln International 1 9<br />
27<br />
9 ▲ 244.5 179.1 31 95.0 ▲ 25.8 5* 100.0<br />
Ernst & Young LLP 2 4 22<br />
-3 ▼ 650.4 485.6 10 -23.1 ▼ 1.7 60* 50.0<br />
KPMG 3 2<br />
21<br />
-9 ▼ 929.1 710.3<br />
6 115.8 ▲ 6.2 19 100.0<br />
PricewaterhouseCoopers 4 3 20<br />
-6 ▼ 50.2 36.7 51 -97.0 ▼ .7 82 100.0<br />
Deutsche Bank AG 5 1 19<br />
-16 ▼ 2,215.7 1,623.4 1 8.5 ▲ 52.3 1 51.5<br />
Rothschild 6 5 18 -6 ▼ 935.5 694.1<br />
5 70.0 ▲ 40.9 2 74.8<br />
Lazard 7* 8 16 -3 ▼ 662.6 497.0<br />
9 -27.8 ▼ 36.9 4 48.9<br />
Deloitte 7* 14 16 6 ▲ 164.2 121.7 36 -18.8 ▼ 2.0 51* 100.0<br />
Morgan Stanley 9 7 15 -6 ▼ 1,711.9 1,288.6 3 9.6 ▲ 37.1 3 39.9<br />
Goldman Sachs & Co 10 6 13 -9 ▼ 1,642.2 1,249.6 4 111.5 ▲ 25.8 5* 13.4<br />
UniCredit Group 11 13 12<br />
1 ▲ 602.2 459.1 11 2.2 ▲ 10.4 10* 45.2<br />
goetzpartners Corp Finance 12* 20* 11 4 ▲ 7.6 6.0<br />
69 -92.4 ▼ 4.2 28* 100.0<br />
JP Morgan<br />
12* 10* 11<br />
-5 ▼ 1,776.2 1,331.0 2 136.3 ▲ 25.5 7 33.5<br />
M&A International 12* 15* 11<br />
2 ▲ 25.5 20.0 61 -79.5 ▼ 5.0 24* 100.0<br />
Concentro Management AG 15* 37* 10 7 ▲ 0.0 0.0 76* - - 6.0 21* 100.0<br />
Metzler Corporate Finance 15* 37* 10<br />
7 ▲ 45.3 33.0 54 - - 6.3 18 100.0<br />
DC Advisory Partners 15* 10* 10<br />
-6 ▼ 21.9 16.0 62 -85.3 ▼ 7.2 15 100.0<br />
Clairfield Partners 18* 31* 9<br />
5 ▲ 0.0 0.0 76*<br />
- - 4.0 30 100.0<br />
Credit Suisse 18* 25* 9<br />
3 ▲ 292.3 219.4 27 -64.1 ▼ 14.1 8 35.1<br />
Commerzbank AG 18* 15* 9<br />
0 - 00 0.0 00 0.0<br />
76* - - 42 4.2<br />
28*<br />
24.6<br />
WestLB AG 21* 53* 8<br />
6 ▲ 42.9 31.2 55<br />
- - 3.8 31 100.0<br />
Corporate Finance Partners CFP 21* 15* 8<br />
-1 ▼ 272.6 209.5 29 273.9 ▲ 3.7 32 100.0<br />
Altium Capital Limited<br />
23* - 7<br />
7 ▲ 13.7 10.4 64* - - 2.4 44* 100.0<br />
Global M&A 23* 37* 7<br />
4 ▲ 85.1 61.0 46<br />
- - 6.1 20 100.0<br />
BDO International 23* 28* 7<br />
2 ▲ 13.5 10.8 66 20.5 ▲ 3.6 33 100.0<br />
Globalscope<br />
23* - 7<br />
7 ▲ 0.0<br />
0.0 76* - - 6.0 21* 100.0<br />
Allert & Co GmbH 23* 31* 7<br />
3 ▲ 0.0<br />
0.0 76*<br />
- - 4.8 27 100.0<br />
Nomura 28* 31* 6 2 ▲ 506.2 386.5 15 178.9 ▲ 9.3 12 63.7<br />
Citi<br />
28* 37* 6 3 ▲ 47.4 36.5 53<br />
- - 7.0 16 44.6<br />
BNP Paribas SA 30* 37* 5 2 ▲ 89.1 70.2 44 -68.6 ▼ 2.2 47* 13.2<br />
UBS 30* 12 5 -10 ▼ 245.0 188.6 30 -68.8 ▼ 10.4 10* 28.5<br />
IMAP 30* 15* 5 -4 ▼ 42.3 31.5 56<br />
- - 2.8 41 100.0<br />
Livingstone Partners 30* 70* 5<br />
4 ▲ 4.0<br />
3.0<br />
71<br />
- - 2.5 43 100.0<br />
Bank of America Merrill Lynch 30* 25* 5 -1 ▼ 757.2 534.1<br />
8 42.7 ▲ 11.4 9 18.8<br />
Sigma Corporate Finance GmbH 30* 53* 5 3 ▲ 0.0<br />
0.0 76* - - 3.0 37* 100.0<br />
IKB Deutsche Industriebank 30* 70* 5 4 ▲ 0.0 0.0 76*<br />
- - 3.0 37* 100.0<br />
Joh Berenberg Gossler & Co<br />
37* 28* 4 -1 ▼ 377.4 290.1 24 212.7 ▲ 3.1 35* 100.0<br />
Gruppo Banca Leonardo 37* 53* 4 2 ▲ 507.7 390.0 14 19.4 ▲ 1.9 55 100.0<br />
Jones Lang LaSalle Inc 37* 70* 4 3 ▲ 581.6 433.3 12 207.4 ▲ 9.0 13 62.5<br />
Mummert & Company 37* 25* 4 -2 ▼ 0.0<br />
0.0 76* - - 1.2 65* 100.0<br />
Ferber & Co GmbH 37* 37* 4 1 ▲ 9.8 7.0 68 - - .8 75* 100.0<br />
equinet AG 37* 53* 4 2 ▲ 40.7 30.5 57 37.5 ▲ 2.7 42 100.0<br />
Jefferies & Co Inc 37* 19 4 -4 ▼ 556.9 416.1 13 515.4 ▲ 8.5 14 100.0<br />
Rank Value (US$b)<br />
$18<br />
$16<br />
$14<br />
$12<br />
$10<br />
$8<br />
$6<br />
$4<br />
$2<br />
$0<br />
800<br />
700<br />
600<br />
500<br />
400<br />
300<br />
200<br />
100<br />
-<br />
1Q07 2Q07 3Q07 4Q07 1Q08 2Q08 3Q08 4Q08 1Q09 2Q09 3Q09 4Q09 1Q10 2Q10 3Q10 4Q10<br />
US$200 - 500m US$100 - 200m US$50 - 100m US$0 - 50m # of Deals<br />
German <strong>Mid</strong>-Market M&A up to US$500m by Target Industry<br />
2.7%<br />
Real Estate<br />
4.4%<br />
Industrials<br />
5.9%<br />
Healthcare<br />
34.1%<br />
Materials<br />
Energy and Power<br />
8.5%<br />
Financials<br />
High Technology<br />
# of Deals<br />
8.5%<br />
Media and Entertainment<br />
Retail<br />
Telecommunications<br />
Industry Total<br />
*tie<br />
Source: <strong>Thomson</strong> <strong>Reuters</strong>/Freeman Consulting<br />
1,944 12 ▲<br />
24,112.7 18,680.7<br />
7.3 ▲<br />
802.7<br />
54.1<br />
8.9%<br />
9.0%<br />
13.5%<br />
Consumer Products and Services<br />
Consumer Staples<br />
** Fee exposure indicates each firm's mid-market fees from deals valued at up to US$500m as a percentage of its overall M&A fees<br />
† Imputed Fees shown are based on completed deal activity, whereas deal count & rank values are compiled based on announced deal activity.<br />
https://www.thomsonone.com
Full Year 2010 │ <strong>Mid</strong>-Market M&A Up To US$500m │ Financial <strong>Advisors</strong><br />
Italian Involvement <strong>Mid</strong>-Market Rankings (MM7)<br />
MM7 - Undisclosed Values & Values up to US$500m<br />
Jan 1 2010 - Dec 31 2010<br />
Italian <strong>Mid</strong>-Market M&A up to US$500m by Rank Value Range<br />
# of Deals per Advisor<br />
Rank Value per Advisor<br />
Imputed Fees (US$m) †<br />
2010 2009 # of Change in Rank Value Rank Value 2010 Rank Value Advisor 2010 ** Fee<br />
Financial Advisor<br />
Rank Rank Deals # of Deals Euro mil Euro mil Rank Change (%) Fees Rank Exp. (%)<br />
Mediobanca 1 2<br />
43<br />
15 ▲ 2,665.1 2,009.7 1 -29.9 ▼ 39.1 2 53.4<br />
Intesa SanPaolo<br />
2 1<br />
24<br />
-8 ▼ 2,658.8 2,020.8 2 -16.7 ▼ 43.5 1 83.3<br />
UniCredit Group 3 5<br />
22 2 ▲ 1,934.2 1,506.2 3 3.3 ▲ 18.6 6 78.5<br />
Lazard 4 7<br />
21<br />
5 ▲ 1,171.1 924.4<br />
5 -34.5 ▼ 35.6 3 82.0<br />
Rothschild<br />
5 4<br />
17 -5 ▼ 1,920.2 1,444.5 4 184.4 ▲ 31.3 4 79.8<br />
KPMG 6* 3<br />
15<br />
-10 ▼ 965.5 743.3<br />
7 -2.2 ▼ 4.9 12 100.0<br />
Deloitte<br />
6* 10* 15<br />
9 ▲ 149.2 116.6 26 -52.5 ▼ 1.5 26* 88.2<br />
BNP Paribas SA 8 6<br />
12<br />
-5 ▼ 626.3 477.2 13 -71.4 ▼ 4.1 14 61.2<br />
Morgan Stanley 9 9<br />
11<br />
4 ▲ 708.9 525.8 10 -47.9 ▼ 21.1 5 50.5<br />
PricewaterhouseCoopers<br />
10 14* 10<br />
6 ▲ 101.3 72.8 32 -54.5 ▼ .6 42* 100.0<br />
Credit Suisse<br />
11 14* 7<br />
3 ▲ 1,008.9 782.2<br />
6 97.8 ▲ 6.7 9 54.0<br />
JP Morgan<br />
12 12* 6 1 ▲ 907.1 677.6<br />
8 11.1 ▲ 5.9 11 67.0<br />
Ernst & Young LLP<br />
13* 8<br />
5<br />
-3 ▼ 57.1 44.6 33 -85.1 ▼ 2.3 16 100.0<br />
Deutsche Bank AG 13* 10* 5<br />
-1 ▼ 676.9 505.9 11 72.1 ▲ 4.2 13 28.2<br />
Sin&rgetica Srl<br />
Clairfield Partners<br />
13*<br />
13*<br />
-<br />
-<br />
5<br />
5<br />
5<br />
5<br />
▲<br />
▲<br />
10.9<br />
20.7<br />
8.0<br />
15.5<br />
46<br />
42<br />
-<br />
-<br />
-<br />
-<br />
.1<br />
1.7<br />
69*<br />
23<br />
100.0<br />
100.0<br />
Citi<br />
13* 23* 5<br />
3 ▲ 635.3 466.3 12 -19.6 ▼ 9.1 8 41.7<br />
M&A International<br />
13* 23* 5<br />
3 ▲ 7.8 6.3<br />
48<br />
- - 2.0 17* 100.0<br />
Gruppo Banca Leonardo<br />
19* -<br />
4<br />
4 ▲ 428.3 325.0 17 - - 1.4 30 51.9<br />
Nomura<br />
19*<br />
23*<br />
4<br />
2 ▲<br />
223.4 176.5<br />
22 -50.0<br />
0<br />
▼ 20 2.0<br />
17*<br />
60.66<br />
Vitale & Associati SpA<br />
19* 12* 4<br />
-1 ▼ 186.8 145.3 23 4.9 ▲ 1.2 33* 100.0<br />
Santander 19* 23* 4<br />
2 ▲ 287.0 229.4 19 -23.9 ▼ 1.0 37 15.4<br />
Barclays Capital<br />
23* 37* 3<br />
2 ▲ 36.4 27.5 39 - - 2.7 15 93.1<br />
BBVA 23* 37* 3 2 ▲ 57.0 42.4 34<br />
- - .9 38* 100.0<br />
Fineurop SpA<br />
23* 17* 3<br />
0 - 0.0 0.0 54* - - 1.2 33* 100.0<br />
Lincoln International<br />
23* -<br />
3<br />
3 ▲ 0.5 0.3<br />
53<br />
- - 1.2 33* 100.0<br />
Klecha & Co 23* 37* 3<br />
2 ▲ 53.9 39.0 36<br />
- - 1.3 31* 100.0<br />
Goldman Sachs & Co 23* 23* 3 1 ▲ 709.7 534.1<br />
9 117.0 ▲ 16.6 7 38.8<br />
Banco Espirito Santo SA 23* 37* 3<br />
2 ▲ 43.2 32.0 37<br />
- - 1.5 26* 25.0<br />
Centrobanca<br />
30* -<br />
2<br />
2 ▲ 1.2<br />
1.0<br />
52<br />
- - .6 42* 100.0<br />
UBS<br />
30* 17* 2<br />
-1 ▼ 186.3 134.2 24 -45.7 ▼ .6 42* 16.7<br />
ORIX M&A Solutions Corp 30* - 2 2 ▲ 0.0 0.0 54* - - .2 67* 100.0<br />
Cofito<br />
30* -<br />
2<br />
2 ▲ 380.6 290.0 18<br />
- - .6 42* 100.0<br />
Global M&A<br />
30* 14* 2<br />
-2 ▼ 13.6 10.0 44 -85.4 ▼ .9 38* 100.0<br />
DGPA & CO 30* - 2 2 ▲ 102.1 75.1 31 - - .1 69* 100.0<br />
Macquarie Group 30* 37* 2 1 ▲ 444.9 327.6 16 722.4 ▲ 1.9 21 100.0<br />
Itau Unibanco 30* - 2 2 ▲ 148.4 120.6 27* - - 1.6 24* 100.0<br />
Banco BTG Pactual SA 30* - 2 2 ▲ 148.4 120.6 27* - - 1.6 24* 100.0<br />
Jefferies & Co Inc 30* - 2 2 ▲ 0.0 0.0 54* - - 2.0 17* 100.0<br />
HSBC Holdings PLC<br />
30* 23* 2<br />
0 - 587.5 440.0 14 1607.8 ▲ 1.3 31* 100.0<br />
Rank Value (US$b)<br />
$12<br />
$10<br />
$8<br />
$6<br />
350<br />
300<br />
250<br />
$4<br />
100<br />
$2<br />
50<br />
$0<br />
-<br />
1Q07 2Q07 3Q07 4Q07 1Q08 2Q08 3Q08 4Q08 1Q09 2Q09 3Q09 4Q09 1Q10 2Q10 3Q10 4Q10<br />
US$200 - 500m US$100 - 200m US$50 - 100m US$0 - 50m # of Deals<br />
Italian <strong>Mid</strong>-Market M&A up to US$500m by Target Industry<br />
3.5%<br />
Financials<br />
4.6%<br />
25.2%<br />
Energy and Power<br />
5.8%<br />
Industrials<br />
Healthcare<br />
6.6%<br />
High Technology<br />
200<br />
150<br />
# of Deals<br />
Real Estate<br />
7.0%<br />
Materials<br />
Media and Entertainment<br />
Industry Total<br />
834<br />
-82 ▼ 15,779.7 11,948.6<br />
-9.5 ▼<br />
503.6<br />
71.4<br />
11.1%<br />
18.7%<br />
Consumer Staples<br />
Retail<br />
Consumer Products and Services<br />
*tie<br />
Source: <strong>Thomson</strong> <strong>Reuters</strong>/Freeman Consulting<br />
** Fee exposure indicates each firm's mid-market fees from deals valued at up to US$500m as a percentage of its overall M&A fees<br />
† Imputed Fees shown are based on completed deal activity, whereas deal count & rank values are compiled based on announced deal activity.<br />
13.2%<br />
Telecommunications<br />
https://www.thomsonone.com
Full Year 2010 │ <strong>Mid</strong>-Market M&A Up To US$500m │ Financial <strong>Advisors</strong><br />
Spanish Involvement <strong>Mid</strong>-Market Rankings (MM8)<br />
MM8 - Undisclosed Values & Values up to US$500m<br />
Jan 1 2010 - Dec 31 2010<br />
Spanish <strong>Mid</strong>-Market M&A up to US$500m by Rank Value Range<br />
# of Deals per Advisor<br />
Rank Value per Advisor<br />
Imputed Fees (US$m) †<br />
2010 2009 # of Change in Rank Value Rank Value 2010 Rank Value Advisor 2010 ** Fee<br />
Financial Advisor<br />
Rank Rank Deals # of Deals Euro mil Euro mil Rank Change (%) Fees Rank Exp. (%)<br />
KPMG<br />
Deloitte<br />
1<br />
2<br />
1<br />
3<br />
28<br />
27<br />
-4<br />
15<br />
▼<br />
▲<br />
2,782.4<br />
1,567.4<br />
2,205.6<br />
1,183.7<br />
3<br />
7<br />
81.2 ▲<br />
277.3 ▲<br />
2.6<br />
16.0<br />
29*<br />
5<br />
76.5<br />
98.2<br />
Santander<br />
3 7* 19<br />
10 ▲ 1,111.9 861.0<br />
9 42.8 ▲ 14.2 7 58.9<br />
BBVA<br />
Banco Espirito Santo SA<br />
4*<br />
4*<br />
13*<br />
30*<br />
15<br />
15<br />
9<br />
13<br />
▲<br />
▲<br />
1,624.0<br />
1,122.3<br />
1,232.7<br />
864.9<br />
6<br />
8<br />
278.5 ▲<br />
139.0 ▲<br />
12.4<br />
11.9<br />
9<br />
11<br />
100.0<br />
47.2<br />
Lazard<br />
6 16* 13<br />
8 ▲ 3,234.7 2,542.1 1 410.8 ▲ 25.7 1 89.5<br />
Rothschild<br />
7* 11* 9<br />
2 ▲ 227.8 180.0 23 -68.3 ▼ 17.9 2* 67.3<br />
DC Advisory Partners<br />
7* 7* 9<br />
0 - 330.3 250.0 18 958.7 ▲ 7.0 17 57.4<br />
JP Morgan<br />
7* 11* 9<br />
2 ▲ 2,897.0 2,272.2 2 134.9 ▲ 17.3 4 46.0<br />
Deutsche Bank AG<br />
10* 16* 8<br />
3 ▲ 2,476.1 1,977.1 4 370.5 ▲ 10.6 13 35.3<br />
Morgan Stanley<br />
10* 13* 8<br />
2 ▲ 901.5 676.4 11 69.9 ▲ 17.9 2* 31.2<br />
Mediobanca<br />
12* 30* 7<br />
5 ▲ 768.0 576.0 13 620.5 ▲ 5.8 20 24.7<br />
Socios Financieros SA<br />
12* 21* 7<br />
3 ▲ 72.5 57.6 37<br />
- - 4.0 25 70.2<br />
GBS Finanzas SA<br />
Ambers & Co<br />
UBS<br />
Nomura<br />
14*<br />
14*<br />
14*<br />
14*<br />
21*<br />
7*<br />
7*<br />
30*<br />
6<br />
6<br />
6<br />
6<br />
2<br />
-3<br />
-3<br />
4<br />
▲<br />
▼<br />
▼<br />
▲<br />
130.4<br />
20.7<br />
1,724.7<br />
749.1<br />
100.0<br />
15.0<br />
1,334.9<br />
553.7<br />
33<br />
45<br />
5<br />
14<br />
226.0 ▲<br />
283.3 ▲<br />
-9.4 ▼<br />
448.4 ▲<br />
5.0<br />
3.0<br />
13.7<br />
2.4<br />
21<br />
27<br />
8<br />
32*<br />
100.0<br />
100.0<br />
29.9<br />
100.0<br />
Cushman & Wakefield Inc<br />
Citi<br />
14*<br />
14*<br />
41*<br />
13*<br />
6<br />
6<br />
5<br />
0<br />
▲<br />
-<br />
666.3<br />
942.5<br />
509.5<br />
741.9<br />
15<br />
10<br />
1206.5 ▲<br />
-39.9 ▼<br />
8.5<br />
14.7<br />
16<br />
6<br />
100.0<br />
30.8<br />
Credit Suisse<br />
14*<br />
21* 6<br />
2 ▲<br />
831.2<br />
636.0<br />
12<br />
130.4<br />
▲ 93 9.3 14*<br />
24.22<br />
Moseley Securities Corporation 21* -<br />
5<br />
5 ▲ 512.2 397.0 16 - - 6.1 19 51.7<br />
Eurohold SL<br />
21* 6 5<br />
-5 ▼ 182.1 135.0 29 843.5 ▲ 4.2 23 100.0<br />
Ernst & Young LLP<br />
23* 30* 4<br />
2 ▲ 117.4 92.0 34<br />
- - .1 73* 20.0<br />
Altium Capital Limited<br />
23* -<br />
4<br />
4 ▲ 0.0 0.0 54* - - 2.4 32* 100.0<br />
ING 23* 30* 4<br />
2 ▲ 0.0 0.0 54*<br />
- - 1.8 35* 100.0<br />
Norgestion<br />
23* 21* 4<br />
0 - 0.0<br />
0.0 54*<br />
- - 1.8 35* 100.0<br />
Arcano<br />
23* 41* 4<br />
3 ▲ 27.9 23.0 43 -79.6 ▼ 1.8 35* 100.0<br />
PricewaterhouseCoopers 28* 2<br />
3<br />
-15 ▼ 37.7 29.4 41 -74.2 ▼ .2 70* 100.0<br />
IREA Corporate Finance<br />
28* -<br />
3<br />
3 ▲ 0.0 0.0 54* - - 2.6 29* 100.0<br />
REIM Partners Ltd 28* -<br />
3<br />
3 ▲ 229.7 175.5 21<br />
- - 1.9 34 100.0<br />
Caixa Geral de Depositos<br />
28* 41* 3 2 ▲ 166.7 129.9 30 - - 2.6 29* 25.2<br />
Ahorro Corporacion Financiera 32* 21* 2<br />
-2 ▼ 0.0 0.0 54* - - 2.8 28 100.0<br />
Houlihan Lokey<br />
32* -<br />
2<br />
2 ▲ 12.9 10.0 48*<br />
- - 6.2 18 100.0<br />
Barclays Capital<br />
32* 41* 2<br />
1 ▲ 323.4 225.2 19 - - .0 75* 0.0<br />
Catella AB 32* - 2 2 ▲ 244.4 182.5 20 - - 4.1 24 100.0<br />
Metzler Corporate Finance 32* - 2 2 ▲ 0.0 0.0 54* - - .6 48* 100.0<br />
Berenson & Co LLP 32* -<br />
2<br />
2 ▲ 0.0 0.0 54*<br />
- - 1.2 42* 18.2<br />
N+1 32* 16* 2 -3 ▼ 0.0 0.0 54* - - 1.2 42* 100.0<br />
Bank of America Merrill Lynch 32* 26* 2 -1 ▼ 190.2 150.0 27* -44.7 ▼ 9.3 14* 46.3<br />
Plenium Partners 32* - 2 2 ▲ 209.6 150.0 24 - - 4.3 22 100.0<br />
Goldman Sachs & Co 32* 16* 2 -3 ▼ 92.1 70.0 36 -90.8 ▼ 11.5 12 34.7<br />
Rank Value (US$b)<br />
$10<br />
$9<br />
$8<br />
$7<br />
$6<br />
$5<br />
$4<br />
$3<br />
$2<br />
$1<br />
$0<br />
1Q07 2Q07 3Q07 4Q07 1Q08 2Q08 3Q08 4Q08 1Q09 2Q09 3Q09 4Q09 1Q10 2Q10 3Q10 4Q10<br />
US$200 - 500m US$100 - 200m US$50 - 100m US$0 - 50m # of Deals<br />
Spanish <strong>Mid</strong>-Market M&A up to US$500m by Target Industry<br />
1.7% 1.2% 3.3% 2.6%<br />
Energy and Power<br />
19.8%<br />
3.3%<br />
Real Estate<br />
4.9%<br />
Financials<br />
Industrials<br />
5.2%<br />
Media and Entertainment<br />
Materials<br />
7.8%<br />
Consumer Staples<br />
350<br />
300<br />
250<br />
200<br />
150<br />
100<br />
50<br />
-<br />
# of Deals<br />
19.6%<br />
Healthcare<br />
11.0%<br />
Consumer Products and Services<br />
Retail<br />
Industry Total<br />
1,132<br />
136<br />
▲<br />
23,390.8 17,890.4 44.0 ▲ 527.9<br />
49.8<br />
Telecommunications<br />
*tie<br />
Source: <strong>Thomson</strong> <strong>Reuters</strong>/Freeman Consulting<br />
19.6%<br />
High Technology<br />
** Fee exposure indicates each firm's mid-market fees from deals valued at up to US$500m as a percentage of its overall M&A fees<br />
† Imputed Fees shown are based on completed deal activity, whereas deal count & rank values are compiled based on announced deal activity.<br />
https://www.thomsonone.com
Full Year 2010 │ <strong>Mid</strong>-Market M&A Up To US$500m │ Financial <strong>Advisors</strong><br />
Nordic Involvement <strong>Mid</strong>-Market Rankings (MM9)<br />
MM9 - Undisclosed Values & Values up to US$500m<br />
Jan 1 2010 - Dec 31 2010<br />
Nordic <strong>Mid</strong>-Market M&A up to US$500m by Rank Value Range<br />
# of Deals per Advisor<br />
Rank Value per Advisor<br />
Imputed Fees (US$m) †<br />
2010 2009 # of Change in Rank Value Rank Value 2010 Rank Value Advisor 2010 ** Fee<br />
Financial Advisor<br />
Rank Rank Deals # of Deals Euro mil Euro mil Rank Change (%) Fees Rank Exp. (%)<br />
PricewaterhouseCoopers<br />
1 3 36<br />
16 ▲ 1,054.4 809.8<br />
6 36.8 ▲ 1.1 64* 100.0<br />
SEB Enskilda 2 1* 28<br />
1 ▲ 1,890.1 1,465.3 1 -48.0 ▼ 52.4 1 75.3<br />
KPMG<br />
3 12* 23<br />
12 ▲ 510.3 406.3 23 105.4 ▲ 2.3 51 67.6<br />
Translink International Group 4 -<br />
21 21 ▲ 9.3 7.1<br />
89 - - .0 115*<br />
-<br />
Carnegie 5* 15* 20 10 ▲ 1,610.9 1,266.3 2 165.9 ▲ 17.3 5 52.6<br />
IMAP 5* 1* 20 -7 ▼ 32.7 24.5 78 -48.3 ▼ 9.8 14* 100.0<br />
Ernst & Young LLP 7* 4 19<br />
0 - 309.4 231.4 33 112.8 ▲ .6 77* 100.0<br />
Danske Markets 7* 11 19<br />
7 ▲ 716.2 527.2 12 11.8 ▲ 13.7 6 70.6<br />
ABG Sundal Collier 9 12* 17<br />
6 ▲ 461.4 366.4 24 131.9 ▲ 9.8 14* 42.2<br />
Deloitte 10* 34* 16<br />
12 ▲ 527.8 410.8 21 2045.5 ▲ 4.6 31 100.0<br />
Handelsbanken Capital Markets 10* 22* 16<br />
9 ▲ 1,184.5 921.9<br />
4 1092.8 ▲ 13.1 8 100.0<br />
Lazard<br />
12* 22* 12<br />
5 ▲ 843.1 658.9 10 14.9 ▲ 21.3 3 53.1<br />
FIH Partners AS<br />
12* 19 12<br />
3 ▲ 1,185.2 897.9<br />
3 99.8 ▲ 13.3 7 87.5<br />
Nordea 14* 6* 11<br />
-3 ▼ 882.2 699.7<br />
7 34.7 ▲ 12.7 9 80.9<br />
Evli Bank Plc 14* 15* 11<br />
1 ▲ 84.7 69.1 56 -53.9 ▼ 5.5 27 100.0<br />
Rothschild 16 15* 10 0 - 1,081.1 799.5<br />
5 107.1 ▲ 21.8 2 51.9<br />
First Securities ASA 17* 20* 9 1 ▲ 434.4 349.4 26 202.9 ▲ 7.9 17 68.7<br />
Access Partners 17* 20* 9<br />
1 ▲ 124.2 92.0 53 -63.1 ▼ 6.2 25 100.0<br />
Morgan Stanley 19* 6*<br />
8<br />
-6 ▼ 567.9 426.6 18 -76.7 ▼ 20.9 4 29.3<br />
Catella AB<br />
19* 6* 8<br />
-6<br />
▼<br />
565.7 417.6 19<br />
640.44<br />
▲ 99 9.9<br />
13<br />
100.00<br />
Keystone Advisers 21* 24* 7<br />
1 ▲ 4.1 3.1<br />
90 -38.8 ▼ 3.3 43 100.0<br />
Hedelius & Berthelius AB<br />
21* - 7<br />
7 ▲ 0.0 0.0 99* - - 4.2 34* 100.0<br />
M&A International<br />
21* 24* 7<br />
1 ▲ 41.1 29.5 71 45.2 ▲ 4.4 33 100.0<br />
Nomura<br />
24* 47* 6<br />
4 ▲ 849.6 681.2<br />
9<br />
- - 9.5 16 100.0<br />
Pareto Securities 24* 29* 6<br />
1 ▲ 535.8 416.8 20 50.7 ▲ 7.4 19* 100.0<br />
HQ Bank AB<br />
24* 47* 6<br />
4 ▲ 291.8 231.8 34 - - 2.4 46* 100.0<br />
Arctic Securities ASA 24* 15* 6<br />
-4 ▼ 614.4 459.3 15 -23.5 ▼ 2.4 46* 100.0<br />
Deutsche Bank AG 28* 47* 5<br />
3 ▲ 204.7 153.1 43<br />
- - 12.2 10 39.7<br />
Lenner & Partners 28* 47* 5<br />
3 ▲ 569.7 455.7 17 121.2 ▲ 7.0 21 100.0<br />
Leimdorfer AB 28* 47* 5<br />
3 ▲ 382.2 280.8 28 127.0 ▲ 5.7 26 100.0<br />
Global M&A 28* 9* 5<br />
-8 ▼ 146.2 109.0 51 -18.0 ▼ 3.5 39* 100.0<br />
Swedbank 28* 12* 5<br />
-6 ▼ 204.1 156.3 44 11.6 ▲ 5.4 28* 100.0<br />
Citi 28* 47* 5<br />
3 ▲ 518.7 377.0 22 1200.0 ▲ 4.5 32 23.8<br />
Jefferies & Co Inc 28* 34* 5<br />
1 ▲ 631.9 471.7 14 193.4 ▲ 6.9 22 100.0<br />
RBS 35* 29* 4 -1 ▼ 67.3 49.1 61 -72.9 ▼ 3.8 38 100.0<br />
UBS<br />
35* 9* 4<br />
-9 ▼ 396.5 311.1 27 -57.7 ▼ 10.1 12 32.0<br />
KBC Group NV<br />
35* -<br />
4<br />
4 ▲ 81.7 59.7 57 - - 1.6 57* 100.0<br />
Credit Agricole CIB<br />
35* 70* 4 3 ▲ 869.6 648.6<br />
8 1027.9 ▲ .7 76 100.0<br />
Pangea Property Partners AB 35* - 4 4 ▲ 0.0 0.0 99* - - .6 77* 100.0<br />
BDO International 35* - 4 4 ▲ 1.5 1.1<br />
96 - - 1.8 56 100.0<br />
HSBC Holdings PLC 35* - 4 4 ▲ 676.0 518.3 13 - - 6.5 23 100.0<br />
Rank Value (US$b)<br />
$16<br />
$14<br />
$12<br />
$10<br />
$8<br />
$6<br />
800<br />
700<br />
600<br />
Energy and Power<br />
$4<br />
200<br />
$2<br />
100<br />
$0<br />
-<br />
1Q07 2Q07 3Q07 4Q07 1Q08 2Q08 3Q08 4Q08 1Q09 2Q09 3Q09 4Q09 1Q10 2Q10 3Q10 4Q10<br />
US$200 - 500m US$100 - 200m US$50 - 100m US$0 - 50m # of Deals<br />
Nordic <strong>Mid</strong>-Market M&A up to US$500m by Target Industry<br />
3.7%<br />
17.4%<br />
3.0% 2.9%<br />
5.7%<br />
Real Estate<br />
Industrials<br />
6.7%<br />
Financials<br />
Materials<br />
12.6%<br />
Consumer Staples<br />
6.9%<br />
Consumer Products and Services<br />
500<br />
400<br />
300<br />
# of Deals<br />
8.1%<br />
High Technology<br />
Healthcare<br />
12.4%<br />
Media and Entertainment<br />
Industry Total<br />
*tie<br />
Source: <strong>Thomson</strong> <strong>Reuters</strong>/Freeman Consulting<br />
2,325<br />
368 ▲ 30,295.2 23,115.2<br />
42.4 ▲<br />
849.0<br />
67.5<br />
8.8%<br />
11.7%<br />
Telecommunications<br />
Retail<br />
** Fee exposure indicates each firm's mid-market fees from deals valued at up to US$500m as a percentage of its overall M&A fees<br />
† Imputed Fees shown are based on completed deal activity, whereas deal count & rank values are compiled based on announced deal activity.<br />
https://www.thomsonone.com
Full Year 2010 │ <strong>Mid</strong>-Market M&A Up To US$500m │ Financial <strong>Advisors</strong><br />
Benelux Involvement <strong>Mid</strong>-Market Rankings (MM10)<br />
MM10 - Undisclosed Values & Values up to US$500m Jan 1 2010 - Dec 31 2010<br />
# of Deals per Advisor<br />
Rank Value per Advisor<br />
Imputed Fees (US$m) †<br />
2010 2009 # of Change in Rank Value Rank Value 2010 Rank Value Advisor 2010 ** Fee<br />
Financial Advisor<br />
Rank Rank Deals # of Deals Euro mil Euro mil Rank Change (%) Fees Rank Exp. (%)<br />
KPMG<br />
ING<br />
1<br />
2<br />
1<br />
3<br />
55<br />
39<br />
1<br />
-2<br />
▲<br />
▼<br />
2,530.6<br />
380.9<br />
1,930.7<br />
299.7<br />
2<br />
27<br />
171.8 ▲<br />
-51.1 ▼<br />
5.7<br />
19.0<br />
29<br />
10<br />
81.4<br />
65.1<br />
Deloitte 3 5<br />
36<br />
15 ▲ 588.4 453.7 16 2.3 ▲ 6.9 24 100.0<br />
PricewaterhouseCoopers<br />
4 4 31<br />
5 ▲ 898.4 706.1 14 191.9 ▲ .8 78* 100.0<br />
UBS<br />
5 31* 26<br />
21 ▲ 2,326.4 1,756.0 3 254.0 ▲ 24.4 7 36.1<br />
Morgan Stanley<br />
6* 16* 19<br />
8 ▲ 2,552.8 1,971.2 1 51.4 ▲ 44.7 1 42.9<br />
BDO International<br />
6* 15 19<br />
7 ▲ 75.1 55.0 76<br />
- - 10.8 14* 100.0<br />
Lazard<br />
8* 12* 18<br />
4 ▲ 1,115.9 840.2 12 -8.6 ▼ 25.7 4* 56.4<br />
Clairfield Partners 8* 36* 18<br />
14 ▲ 81.1 63.0 73<br />
- - 8.8 18 48.4<br />
Credit Suisse<br />
10 14 17<br />
4 ▲ 1,942.1 1,499.2 6 -3.3 ▼ 23.1 9 36.3<br />
BNP Paribas SA<br />
11* 7<br />
16<br />
-1 ▼ 1,288.5 971.9<br />
8 -26.4 ▼ 10.8 14* 36.7<br />
Rabobank NV<br />
11* 2<br />
16<br />
-26 ▼ 419.5 319.1 22<br />
- - 7.3 22* 42.4<br />
JP Morgan 11* 12* 16<br />
2 ▲ 2,009.5 1,564.5 5 37.0 ▲ 32.5 2 31.4<br />
Rothschild<br />
14* 6<br />
15<br />
-3 ▼ 1,015.0 760.7 13 -32.8 ▼ 25.2 6 35.1<br />
BlueMind Corporate Finance<br />
14* 8* 15<br />
-1 ▼ 54.3 40.5 78 524.1 ▲ 7.7 21 100.0<br />
Deutsche Bank AG 16* 22* 13 6 ▲ 2,204.8 1,656.9 4 374.5 ▲ 25.7 4* 32.1<br />
Citi<br />
16* 31* 13<br />
8 ▲ 1,148.3 891.7 11 118.0 ▲ 23.4 8 36.7<br />
Banque Degroof<br />
18* 26* 11<br />
5 ▲ 68.4 53.3 77 -79.9 ▼ 3.7 38* 100.0<br />
M&A International<br />
18* 19* 11<br />
3 ▲ 86.6 63.6 71<br />
- - 5.8 28 100.0<br />
RBS<br />
20* 8* 9<br />
-7<br />
▼ 1,167.8167 911.11<br />
10<br />
289.4<br />
▲ 28 2.8<br />
50* 97 9.7<br />
NIBC NV<br />
20* 26* 9<br />
3 ▲ 127.1 100.5 61 -48.5 ▼ 9.0 17 100.0<br />
Goldman Sachs & Co 20* 11<br />
9<br />
-6 ▼ 1,218.7 924.5<br />
9 -38.9 ▼ 30.3 3 29.8<br />
DC Advisory Partners<br />
23 39* 8<br />
5 ▲ 322.8 243.3 33<br />
- - 5.0 31* 100.0<br />
Ernst & Young LLP 24* 16* 7<br />
-4 ▼ 13.8 10.9 91 -97.0 ▼ .1 116* 4.0<br />
KBC Group NV<br />
24* 46* 7<br />
5 ▲ 482.4 354.4 20 930.8 ▲ 7.8 20 100.0<br />
Globalscope<br />
24* 31* 7<br />
2 ▲ 0.0 0.0 99*<br />
- - 4.2 34* 100.0<br />
PhiDelphi Corporate Finance BV 27* 19* 6<br />
-2 ▼ 0.0<br />
0.0 99*<br />
- - 3.8 37 100.0<br />
IMAP<br />
27* 22* 6<br />
-1 ▼ 0.0<br />
0.0 99*<br />
- - 2.4 56* 100.0<br />
Lincoln International<br />
27* 36* 6<br />
2 ▲ 347.1 258.7 29<br />
- - 14.3 13 100.0<br />
Nomura<br />
27* 39* 6<br />
3 ▲ 354.2 267.5 28 490.3 ▲ 1.7 64* 24.3<br />
Gruppo Banca Leonardo<br />
31* 46* 5<br />
3 ▲ 581.0 447.0 17 6816.7 ▲ 6.7 25 46.2<br />
Barclays Capital<br />
31* 26* 5<br />
-1 ▼ 1,338.8 1,013.6 7 178.2 ▲ 15.5 11 28.6<br />
Bank of America Merrill Lynch<br />
31* 65* 5 4 ▲ 174.1 127.0 50 17.6 ▲ 14.6 12 42.6<br />
Mediobanca<br />
34* 31* 4<br />
-1 ▼ 155.3 117.8 53 -84.7 ▼ 8.5 19 100.0<br />
Translink International Group<br />
34* - 4<br />
4 ▲ 0.0 0.0 99*<br />
- - .0 123*<br />
-<br />
RBC Capital Markets<br />
34* -<br />
4<br />
4 ▲ 776.8 578.2 15 - - .8 78* 4.3<br />
First Dutch Capital BV<br />
34* 39* 4<br />
1 ▲ 0.0 0.0 99*<br />
- - 2.4 56* 100.0<br />
Global M&A 34* 31* 4<br />
-1 ▼ 110.7 83.5 65* - - 3.2 42* 100.0<br />
Nielen Schuman BV 34* 39* 4<br />
1 ▲ 0.0 0.0 99*<br />
- - 2.4 56* 100.0<br />
Macquarie Group 34* 26* 4 -2 ▼ 183.7 138.3 48 14.8 ▲ 7.3 22* 100.0<br />
Quore Capital<br />
34* 46* 4<br />
2 ▲ 0.0 0.0 99*<br />
- - 3.0 47* 100.0<br />
Jefferies & Co Inc<br />
34* 36* 4 0 - 199.2 146.6 46 -67.2 ▼ 3.2 42* 100.0<br />
Benelux <strong>Mid</strong>-Market M&A up to US$500m by Rank Value Range<br />
Rank Value (US$b)<br />
$16<br />
$14<br />
$12<br />
$10<br />
$8<br />
600<br />
500<br />
400<br />
300<br />
$6<br />
200<br />
$4<br />
100<br />
$2<br />
$0<br />
-<br />
1Q07 2Q07 3Q07 4Q07 1Q08 2Q08 3Q08 4Q08 1Q09 2Q09 3Q09 4Q09 1Q10 2Q10 3Q10 4Q10<br />
US$200 - 500m US$100 - 200m US$50 - 100m US$0 - 50m # of Deals<br />
Benelux <strong>Mid</strong>-Market M&A up to US$500m by Target Industry<br />
3.2% 2.4% Financials<br />
3.5%<br />
20.4%<br />
Real Estate<br />
3.9%<br />
Materials<br />
6.0%<br />
Energy and Power<br />
Industrials<br />
6.5%<br />
High Technology<br />
Consumer Products and Services<br />
14.3%<br />
7.9%<br />
Healthcare<br />
Retail<br />
# of Deals<br />
Media and Entertainment<br />
Industry Total 1,583 78 ▲ 29,715.5 22,587.4<br />
32.7 ▲ 849.7<br />
52.1<br />
*tie<br />
Source: <strong>Thomson</strong> <strong>Reuters</strong>/Freeman Consulting<br />
9.4%<br />
9.6%<br />
12.9%<br />
Consumer Staples<br />
Telecommunications<br />
** Fee exposure indicates each firm's mid-market fees from deals valued at up to US$500m as a percentage of its overall M&A fees<br />
† Imputed Fees shown are based on completed deal activity, whereas deal count & rank values are compiled based on announced deal activity.<br />
https://www.thomsonone.com
Full Year 2010 │ <strong>Mid</strong>-Market M&A Up To US$500m │ Financial <strong>Advisors</strong><br />
Eastern Europe Involvement <strong>Mid</strong>-Market Rankings (MM16)<br />
MM16 - Undisclosed Values & Values up to US$500m<br />
Jan 1 2010 - Dec 31 2010<br />
Eastern European <strong>Mid</strong>-Market M&A up to US$500m by Rank Value Range<br />
# of Deals per Advisor<br />
Rank Value per Advisor<br />
Imputed Fees (US$m) †<br />
2010 2009 # of Change in Rank Value Rank Value 2010 Rank Value Advisor 2010 ** Fee<br />
Financial Advisor<br />
Rank Rank Deals # of Deals Euro mil Euro mil Rank Change (%) Fees Rank Exp. (%)<br />
UniCredit Group 1 1<br />
20<br />
1 ▲ 1,307.0 965.2<br />
3 -23.1 ▼ 27.0 3 100.0<br />
Morgan Stanley 2 5* 15<br />
2 ▲ 1,690.3 1,268.5 1 262.9 ▲ 18.4 6 62.8<br />
KPMG 3* 13 13<br />
5 ▲ 247.8 188.5 21 -2.1 ▼ .6 60* 100.0<br />
JP Morgan 3* 5* 13<br />
0 - 1,628.8 1,260.4 2 27.5 ▲ 13.3 8 36.1<br />
IMAP<br />
5* 4<br />
12<br />
-2 ▼ 52.7 39.3 43 201.1 ▲ 6.4 17 100.0<br />
Goldman Sachs & Co<br />
5* 10* 12<br />
3 ▲ 1,054.0 816.4<br />
5 -25.2 ▼ 31.6 1 77.1<br />
Rothschild<br />
5* 2* 12<br />
-4 ▼ 524.8 382.1 13 -62.7 ▼ 26.7 4 70.3<br />
Raiffeisen Zentralbank<br />
Credit Suisse<br />
5*<br />
9<br />
9<br />
2*<br />
12<br />
10<br />
2<br />
-6<br />
▲<br />
▼<br />
1,029.2<br />
919.1<br />
767.1<br />
674.2<br />
6<br />
7<br />
-19.0 ▼<br />
62.8 ▲<br />
24.2<br />
10.0<br />
5<br />
11<br />
86.1<br />
37.7<br />
Deutsche Bank AG<br />
10* 8<br />
9<br />
-2 ▼ 1,110.6 842.3<br />
4 295.7 ▲ 12.9 9 100.0<br />
BNP Paribas SA<br />
10* 26* 9<br />
6 ▲ 647.2 502.6 10 984.1 ▲ 6.9 15 37.7<br />
Patria Finance<br />
12* 26* 8<br />
5 ▲ 0.0 0.0 63*<br />
- - 4.8 22* 100.0<br />
PricewaterhouseCoopers<br />
12* 10* 8<br />
-1 ▼ 0.0 0.0 63*<br />
- - 1.2 48* 100.0<br />
Standard Unlu 12* 26* 8<br />
5 ▲ 247.3 197.4 22 1.8 ▲ 11.0 10 100.0<br />
ING<br />
15* 7<br />
7<br />
-5 ▼ 125.0 97.9 32 -85.4 ▼ 5.1 19 63.8<br />
Global M&A 15* 26* 7<br />
4 ▲ 139.1 107.9 29 1831.9 ▲ 3.6 28 100.0<br />
VTB Capital<br />
15* 55* 7<br />
6 ▲ 406.3 323.5 16<br />
- - 27.8 2 100.0<br />
HSBC Holdings PLC<br />
15* 14* 7 0 - 84.9 61.8 36* -85.1 ▼ 1.5 44* 100.0<br />
Bank of America Merrill Lynch 19* 41* 6<br />
4 ▲ 385.4 293.6 18 304.0 ▲ 3.2 30 100.0<br />
M&A International 19*<br />
24*<br />
6<br />
2<br />
▲<br />
28.9<br />
23.1<br />
45 -88.1<br />
▼ 23 2.3<br />
35*<br />
100.00<br />
Houlihan Lokey 21* 18* 5<br />
-1 ▼ 673.9 537.0<br />
9 2628.3 ▲ 8.9 13 100.0<br />
Lexicon Partners 21* -<br />
5<br />
5 ▲ 0.0<br />
0.0 63* - - -<br />
-<br />
-<br />
Holon Sp zoo<br />
21* 55* 5<br />
4 ▲ 17.7 13.4 50 36.2 ▲ .4 76 100.0<br />
Clairfield Partners<br />
21* 55* 5<br />
4 ▲ 0.0<br />
0.0 63*<br />
- - 2.4 33* 100.0<br />
Evli Bank Plc<br />
21* 26* 5<br />
2 ▲ 0.0 0.0 63* - - 1.8 40* 100.0<br />
Deloitte<br />
21* 26* 5<br />
2 ▲ 5.5<br />
4.4<br />
56 -75.0 ▼ .3 77 100.0<br />
Gazprombank 27* 14* 4<br />
-3 ▼ 275.5 210.8 19 -38.8 ▼ 4.9 20* 23.9<br />
Nomura 27* 26* 4<br />
1 ▲ 566.8 417.7 12 13.3 ▲ 9.2 12 100.0<br />
Lazard 27* 18* 4<br />
-2 ▼ 689.5 531.4<br />
8 116.1 ▲ 17.8 7 59.5<br />
VCP Capital Partners 27* 18* 4<br />
-2 ▼ 139.0 104.1 30 -1.9 ▼ 4.9 20* 100.0<br />
Xenon Capital Partners<br />
27* - 4<br />
4 ▲ 0.0 0.0 63*<br />
- - 1.0 52* 100.0<br />
Turkiye Is Bankasi AS 32* 10* 3 -6 ▼ 213.0 160.0 23 -22.5 ▼ 6.7 16 100.0<br />
Ernst & Young LLP 32* 14* 3 -4 ▼ 0.0<br />
0.0 63* - - .1 81* 100.0<br />
UBS 32* 41* 3 1 ▲ 4.8<br />
3.6 57* -99.0 ▼ 4.0 25* 36.7<br />
PDF Corporate Finance 32* 41* 3<br />
1 ▲ 0.0<br />
0.0 63*<br />
- - 1.8 40* 100.0<br />
Lincoln International 32* 41* 3<br />
1 ▲ 0.0<br />
0.0 63*<br />
- - 1.2 48* 100.0<br />
Renaissance Capital Group<br />
32* 26* 3 0 - 103.0 75.7 35 -82.9 ▼ 4.0 25* 37.0<br />
Macquarie Group 32* - 3<br />
3 ▲ 60.0 45.4 41<br />
- - -<br />
-<br />
-<br />
Saski Partners Sp zoo 32* 26* 3<br />
0 - 160.0 124.2 25 - - 1.2 48* 100.0<br />
DC Advisory Partners 32* 41* 3 1 ▲ 434.1 340.0 15 902.5 ▲ 3.9 27 100.0<br />
Rank Value (US$b)<br />
$16<br />
$14<br />
$12<br />
$10<br />
$8<br />
$6<br />
1,600<br />
1,400<br />
1,200<br />
1,000<br />
$4<br />
400<br />
$2<br />
200<br />
$0<br />
-<br />
1Q07 2Q07 3Q07 4Q07 1Q08 2Q08 3Q08 4Q08 1Q09 2Q09 3Q09 4Q09 1Q10 2Q10 3Q10 4Q10<br />
US$200 - 500m US$100 - 200m US$50 - 100m US$0 - 50m # of Deals<br />
Eastern European <strong>Mid</strong>-Market M&A up to US$500m by Target Industry<br />
3.4%<br />
17.6%<br />
3.0% 2.9% Energy and Power<br />
3.7%<br />
Financials<br />
5.1%<br />
Materials<br />
Industrials<br />
6.4%<br />
Real Estate<br />
Consumer Staples<br />
15.5%<br />
Media and Entertainment<br />
7.2%<br />
Telecommunications<br />
800<br />
600<br />
# of Deals<br />
Healthcare<br />
9.3%<br />
Consumer Products and Services<br />
Industry Total 4,945 462 ▲ 27,300.8 20,703.7<br />
0.8 ▲ 815.0<br />
76.1<br />
15.5%<br />
Retail<br />
*tie<br />
Source: <strong>Thomson</strong> <strong>Reuters</strong>/Freeman Consulting<br />
10.4%<br />
High Technology<br />
** Fee exposure indicates each firm's mid-market fees from deals valued at up to US$500m as a percentage of its overall M&A fees<br />
† Imputed Fees shown are based on completed deal activity, whereas deal count & rank values are compiled based on announced deal activity.<br />
https://www.thomsonone.com
Full Year 2010 │ <strong>Mid</strong>-Market M&A Up To US$500m │ Financial <strong>Advisors</strong><br />
Hochinma Involvement <strong>Mid</strong>-Market Rankings (MM13)<br />
MM13 - Undisclosed Values & Values up to US$500m<br />
Jan 1 2010 - Dec 31 2010<br />
Hochima <strong>Mid</strong>-Market M&A up to US$500m by Rank Value Range<br />
# of Deals per Advisor<br />
Rank Value per Advisor (US$m)<br />
Imputed Fees (US$m) †<br />
Financial Advisor<br />
2010<br />
Rank<br />
2009<br />
Rank<br />
# of<br />
Deals<br />
Change in<br />
# of Deals<br />
Rank Value<br />
US$m<br />
2010<br />
Rank<br />
Rank Value<br />
Change (%)<br />
Advisor<br />
Fees<br />
2010<br />
Rank<br />
** Fee<br />
Exp. (%)<br />
CIMB Group Sdn Bhd<br />
1 1<br />
42<br />
-15 ▼<br />
2,402.4<br />
8 4.4 ▲ 21.6 10 56.4<br />
Somerley Ltd 2 3* 39<br />
-10 ▼<br />
2,213.1<br />
10 25.6 ▲ 14.6 13 50.9<br />
Ernst & Young LLP<br />
3 6<br />
36<br />
6 ▲ 1,436.8<br />
17 221.9 ▲ 2.5 71* 89.3<br />
AMMB Holdings Bhd<br />
4 22* 34<br />
19 ▲<br />
1,189.3<br />
23 9.0 ▲ 10.2 19 100.0<br />
Credit Suisse<br />
5 15* 32<br />
15 ▲<br />
3,516.5 3 140.8 ▲ 32.7 5 70.6<br />
UBS 6 7<br />
28<br />
-1 ▼<br />
3,892.3 2 -0.9 ▼ 40.4 4 43.6<br />
Guangdong Securities 7* 2<br />
27<br />
-23 ▼<br />
1,127.2<br />
26 -47.2 ▼ 9.0 20 100.0<br />
Morgan Stanley 7* 5 27<br />
-7 ▼<br />
3,355.0<br />
4 -22.0 ▼ 48.8 2 41.1<br />
Access Capital Ltd 9 10 25<br />
3 ▲<br />
680.0<br />
45 -42.3 ▼ 5.8 36* 100.0<br />
Deutsche Bank AG 10 11 24<br />
3 ▲<br />
3,195.9<br />
5 6.2 ▲ 26.1 9 29.7<br />
Goldman Sachs & Co 11 22* 23<br />
8 ▲ 6,360.7<br />
1 148.7 ▲ 65.7 1 68.9<br />
Rothschild<br />
12* 13* 22<br />
4 ▲<br />
2,500.1<br />
7 120.2 ▲ 29.0 6 62.0<br />
M&A International 12* 15* 22<br />
5 ▲ 437.7<br />
69 26.1 ▲ 6.6 31 97.1<br />
KPMG 14* 9<br />
21 -3 ▼<br />
1,302.6<br />
21 139.1 ▲ 1.7 89* 73.9<br />
China International Capital Co<br />
14* 92* 21<br />
18 ▲<br />
1,377.4<br />
18 67.3 ▲ 2.5 71* 10.0<br />
PricewaterhouseCoopers 14* 12 21<br />
2 ▲<br />
1,075.7<br />
27 -10.7 ▼ 2.3 77* 100.0<br />
Deloitte 17 15* 20<br />
3 ▲ 928.9<br />
32 53.0 ▲ 2.9 67* 100.0<br />
Kotak Mahindra Bank Ltd 18 29* 19<br />
5 ▲<br />
1,315.6<br />
20 -3.1 ▼ 5.3 41 100.0<br />
OSK Holdings Bhd 19* 18* 18<br />
2 ▲<br />
375.4<br />
78 21.4 ▲ 3.8 56* 100.0<br />
BNP Paribas SA 19* 18*<br />
18<br />
2 ▲ 2,048.0 0 12 23.7<br />
▲<br />
28.1<br />
7<br />
38.4<br />
Citi 19* 22* 18<br />
3 ▲<br />
1,539.0 16 -39.1 ▼ 27.0 8 50.8<br />
<strong>BMR</strong> <strong>Advisors</strong> 22* 18* 17<br />
1 ▲<br />
50.8 163 -94.3 ▼ 2.4 76 100.0<br />
RHB 22* 29* 17 3 ▲<br />
947.1<br />
29 39.2 ▲ 8.6 22* 46.2<br />
Malayan Banking Bhd<br />
22* 57* 17<br />
10 ▲<br />
702.3<br />
41 157.8 ▲ 2.6 69* 100.0<br />
Huatai Securities<br />
25* 68* 15<br />
9 ▲ 1,231.2<br />
22 100.8 ▲ .3 159* 100.0<br />
Optima Capital Ltd<br />
25* 3* 15<br />
-34 ▼<br />
647.3 50 -78.5 ▼ 13.8 14* 100.0<br />
JP Morgan 27 42* 14<br />
4 ▲ 2,781.2 6 11.6 ▲ 40.9 3 58.3<br />
Ample Capital Limited<br />
28 32* 13 0 - 487.9<br />
61 -6.4 ▼ 2.3 77* 100.0<br />
Piper Jaffray Cos 29* 68* 12 6 ▲<br />
758.0 38 137.8 ▲ 6.9 29 100.0<br />
Wallbanck Brothers Sec (HK) 29* 38* 12<br />
1 ▲<br />
417.6 73 81.1 ▲ 1.1 106* 100.0<br />
ICICI Bank Ltd<br />
29* 49* 12<br />
4 ▲<br />
372.5 79 -31.5 ▼ 4.6 48 100.0<br />
Enam Securities<br />
29* 34* 12<br />
0 -<br />
459.5 66 16.2 ▲ 5.6 38 68.3<br />
Macquarie Group<br />
29* 42* 12<br />
2 ▲<br />
1,735.6<br />
14 60.5 ▲ 13.8 14* 44.4<br />
Standard Chartered PLC<br />
34* 34* 11<br />
-1 ▼<br />
2,157.3 11 83.8 ▲ 13.2 16 44.9<br />
Religare Enterprises Ltd<br />
34* 92* 11<br />
8 ▲ 897.0 33 315.3 ▲ 3.6 59* 17.6<br />
HSBC Holdings PLC<br />
34* 38* 11<br />
0 - 2,319.9 9 234.8 ▲ 15.8 12 39.3<br />
Houlihan Lokey 37* 92* 10<br />
7 ▲<br />
840.2<br />
34 1102.0 ▲ 10.7 18 100.0<br />
Nomura<br />
37* 57* 10<br />
3 ▲<br />
1,644.7 15 241.6 ▲ 12.6 17 27.3<br />
CITIC<br />
37* 22* 10<br />
-5 ▼ 1,740.3 13 72.7 ▲ 4.7 46* 30.1<br />
Ambit Corporate Finance 37* 92* 10<br />
7 ▲<br />
552.5 57 49.4 ▲ 4.4 50* 100.0<br />
Taifook Securities Group Ltd 41* 22* 9 -6 ▼ 690.0<br />
43 8.3 ▲ 5.4 40 100.0<br />
GF Securities 41* 18* 9 -7 ▼ 1,164.8 24 235.3 ▲ .5 138* 55.6<br />
DBS Group Holdings<br />
41* 22* 9 -6 ▼ 360.9<br />
81 -59.1 ▼ 7.7 26 53.5<br />
Lazard<br />
41* 80* 9 5 ▲<br />
1,134.4<br />
25 162.7 ▲ 6.7 30 36.6<br />
Mitsubishi UFJ Financial Group 41* 115* 9<br />
7 ▲ 102.0 140 787.0 ▲ 3.2 63* 100.0<br />
Bank of America Merrill Lynch 41* 22* 9 -6 ▼ 714.8 40 -43.4 ▼ 16.8 11 38.4<br />
Rank Value (US$b)<br />
$45<br />
$40<br />
$35<br />
$30<br />
$25<br />
$20<br />
$15<br />
$10<br />
$5<br />
$0<br />
2,000<br />
1,800<br />
1,600<br />
1,400<br />
1,200<br />
1,000<br />
800<br />
600<br />
400<br />
200<br />
-<br />
1Q07 2Q07 3Q07 4Q07 1Q08 2Q08 3Q08 4Q08 1Q09 2Q09 3Q09 4Q09 1Q10 2Q10 3Q10 4Q10<br />
US$200 - 500m US$100 - 200m US$50 - 100m US$0 - 50m # of Deals<br />
Hochima <strong>Mid</strong>-Market M&A up to US$500m by Target Industry<br />
3.3% 2.3%2.1% Financials<br />
3.5%<br />
21.0%<br />
Materials<br />
3.8%<br />
Industrials<br />
5.1%<br />
Real Estate<br />
Energy and Power<br />
5.2%<br />
Consumer Staples<br />
High Technology<br />
7.9%<br />
Media and Entertainment<br />
20.1%<br />
Healthcare<br />
# of Deals<br />
Consumer Products and Services<br />
Industry Total 6,476 381<br />
▲<br />
145,466.0<br />
31.6 ▲<br />
1,717.0 66.2<br />
12.8%<br />
Retail<br />
*tie<br />
Source: <strong>Thomson</strong> <strong>Reuters</strong>/Freeman Consulting<br />
12.8%<br />
Telecommunications<br />
** Fee exposure indicates each firm's mid-market fees from deals valued at up to US$500m as a percentage of its overall M&A fees<br />
† Imputed Fees shown are based on completed deal activity, whereas deal count & rank values are compiled based on announced deal activity.<br />
https://www.thomsonone.com
Full Year 2010 │ <strong>Mid</strong>-Market M&A Up To US$500m │ Financial <strong>Advisors</strong><br />
Hong Kong Involvement <strong>Mid</strong>-Market Rankings (MM12)<br />
MM12 - Undisclosed Values & Values up to US$500m<br />
Jan 1 2010 - Dec 31 2010<br />
Hong Kong <strong>Mid</strong>-Market M&A up to US$500m by Rank Value Range<br />
# of Deals per Advisor<br />
Rank Value per Advisor (US$m)<br />
Imputed Fees (US$m) †<br />
2010 2009 # of Change in<br />
Rank Value<br />
2010 Rank Value Advisor 2010 ** Fee<br />
Financial Advisor<br />
Rank Rank Deals # of Deals<br />
US$m<br />
Rank Change (%) Fees Rank Exp. (%)<br />
Somerley Ltd<br />
1 3<br />
35<br />
-3 ▼<br />
1,994.4<br />
3 15.1 ▲ 14.0 6 61.4<br />
Guangdong Securities 2 2<br />
27<br />
-18 ▼<br />
1,127.2 8 -45.9 ▼ 9.0 12 100.0<br />
Access Capital Ltd<br />
3 6<br />
23<br />
2 ▲<br />
639.2<br />
18 -30.0 ▼ 5.6 18 100.0<br />
M&A International 4 7* 16<br />
3 ▲<br />
258.3 41 7.6 ▲ 4.0 27 97.6<br />
CIMB Group Sdn Bhd 5* 4<br />
15<br />
-22 ▼<br />
403.1<br />
29 -73.4 ▼ 5.2 21 96.3<br />
Morgan Stanley 5* 7* 15<br />
2 ▲<br />
2,591.9 1 57.1 ▲ 27.9 1 61.5<br />
Ample Capital Limited 7* 10* 13<br />
3 ▲<br />
487.9<br />
24 -5.6 ▼ 2.3 41 100.0<br />
Optima Capital Ltd<br />
7* 1 13<br />
-35 ▼<br />
589.7<br />
21 -80.4 ▼ 13.8 7 100.0<br />
UBS<br />
Wallbanck Brothers Sec (HK)<br />
9*<br />
9*<br />
9<br />
14*<br />
12<br />
12<br />
1<br />
3<br />
▲<br />
▲<br />
1,968.8<br />
417.6<br />
4<br />
26<br />
-5.1 ▼<br />
120.3 ▲<br />
19.0<br />
1.1<br />
5<br />
51*<br />
65.7<br />
100.0<br />
Deutsche Bank AG<br />
11 26* 11<br />
5 ▲<br />
1,718.0<br />
5 61.3 ▲ 9.3 11 44.5<br />
Taifook Securities Group Ltd 12* 10* 9<br />
-1 ▼<br />
690.0<br />
14 8.3 ▲ 5.4 19* 100.0<br />
Rothschild 12* 38* 9<br />
5 ▲<br />
1,327.9<br />
6 283.7 ▲ 20.6 4 100.0<br />
Piper Jaffray Cos 12* 38* 9<br />
5 ▲<br />
579.6<br />
22 94.8 ▲ 3.7 28* 100.0<br />
Goldman Sachs & Co 12* 17* 9 1 ▲<br />
2,378.9<br />
2 36.4 ▲ 27.8 2 87.4<br />
BNP Paribas SA 16* 10* 8<br />
-2 ▼<br />
905.3<br />
10 8.6 ▲ 12.6 8 30.2<br />
Mitsubishi UFJ Financial Group 16* -<br />
8<br />
8 ▲<br />
93.2<br />
63<br />
- - 2.9 36 100.0<br />
Veda Capital Ltd 16* 5<br />
8<br />
-16 ▼<br />
154.0<br />
52 -69.9 ▼ 3.4 32* 100.0<br />
Citi 16* 46* 8<br />
5 ▲<br />
590.7<br />
20 100.4 ▲ 9.4 10 100.0<br />
Credit Suisse 16* 38*<br />
8<br />
4 ▲<br />
381.7<br />
31 52 5.2<br />
▲ 69 6.9<br />
15<br />
100.00<br />
PricewaterhouseCoopers 21* 46* 6<br />
3 ▲<br />
414.4<br />
27 1.2 ▲ 1.1 51* 100.0<br />
Kingston Corporate Finance Ltd 21* 14* 6<br />
-3 ▼<br />
216.7<br />
45 -42.7 ▼ 1.3 49* 100.0<br />
Macquarie Group<br />
21* 38* 6<br />
2 ▲<br />
562.5 23 5.2 ▲ 10.6 9 100.0<br />
JP Morgan 21* 33* 6<br />
1 ▲<br />
1,293.5 7 -22.8 ▼ 23.7 3 80.3<br />
First Shanghai Capital Ltd<br />
25* 38* 5<br />
1 ▲<br />
240.3<br />
42 803.4 ▲ 2.1 46 100.0<br />
Yu Ming Investment Management 25* 33* 5<br />
0 -<br />
457.3<br />
25 181.6 ▲ 5.0 22* 100.0<br />
Nomura<br />
25* 53* 5<br />
3 ▲<br />
817.7<br />
12 914.5 ▲ 5.4 19* 44.6<br />
Asian Capital (Corp Fin) Ltd<br />
25* 17* 5<br />
-3 ▼ 633.1<br />
19 48.1 ▲ 2.2 42* 100.0<br />
Platinum Securities Co Ltd<br />
29* 46* 4<br />
1 ▲<br />
211.3<br />
47 -24.3 ▼ .4 69* 100.0<br />
China Merchants Securities Co 29* 14* 4<br />
-5 ▼<br />
296.8<br />
38 63.8 ▲ -<br />
-<br />
-<br />
Standard Chartered PLC 29* 33* 4<br />
-1 ▼ 1,041.9 9 19.6 ▲ 6.4 16 61.0<br />
INCU Corporate Finance Ltd<br />
29* 17* 4<br />
-4 ▼<br />
20.1 87 -81.3 ▼ 1.5 47* 100.0<br />
KBC Group NV 29* 26* 4<br />
-2 ▼<br />
356.3<br />
32 -35.4 ▼ -<br />
-<br />
-<br />
Cinda Intl Capital Ltd<br />
29* 22* 4<br />
-3 ▼<br />
301.6<br />
37 209.7 ▲ 3.0 35 100.0<br />
Goldin Financial Holdings Ltd<br />
29* -<br />
4<br />
4 ▲<br />
65.8 72<br />
- - .1 86* 100.0<br />
HSBC Holdings PLC<br />
29* 26* 4<br />
-2 ▼<br />
876.0<br />
11 62.5 ▲ 7.0 14 35.4<br />
Oriental Patron Asia Ltd 37* 46* 3<br />
0 -<br />
143.6 53 -58.1 ▼ 5.0 22* 100.0<br />
KPMG<br />
37* 26* 3<br />
-3 ▼<br />
124.8<br />
59 -54.4 ▼ .0 95*<br />
-<br />
China Construction Bank 37* -<br />
3<br />
3 ▲<br />
6.0<br />
99<br />
- - .3 73* 100.0<br />
Lexicon Partners 37* - 3 3 ▲ 404.6 28 - - 3.6 30* 100.0<br />
Partners Capital International 37* 10* 3<br />
-7 ▼<br />
128.4<br />
57 126.1 ▲ .3 73* 100.0<br />
Grand Vinco Capital Ltd 37* 17* 3<br />
-5 ▼<br />
266.2 40 139.8 ▲ 2.5 37* 100.0<br />
Hercules Capital Ltd 37* 65* 3 2 ▲ 0.0 104* - - - - -<br />
Bridge Partners Capital Ltd 37* 46* 3 0 - 8.3 95 -90.8 ▼ .1 86* 100.0<br />
Daiwa Securities Group Inc 37* - 3 3 ▲ 331.0 35 - - 4.1 26 100.0<br />
Anglo Chinese Corp Finance 37* 22* 3 -4 ▼ 111.3 62 -76.2 ▼ 3.4 32* 50.0<br />
Industry Total<br />
*tie<br />
Source: <strong>Thomson</strong> <strong>Reuters</strong>/Freeman Consulting<br />
1,372<br />
-32<br />
▼<br />
44,233.3<br />
16.3 ▲<br />
713.5<br />
78.2<br />
Rank Value (US$b)<br />
$18<br />
$16<br />
$14<br />
$12<br />
$10<br />
$8<br />
500<br />
450<br />
400<br />
350<br />
300<br />
250<br />
200<br />
$6<br />
150<br />
$4<br />
100<br />
$2<br />
50<br />
$0<br />
-<br />
1Q07 2Q07 3Q07 4Q07 1Q08 2Q08 3Q08 4Q08 1Q09 2Q09 3Q09 4Q09 1Q10 2Q10 3Q10 4Q10<br />
US$200 - 500m US$100 - 200m US$50 - 100m US$0 - 50m # of Deals<br />
Hong Kong <strong>Mid</strong>-Market M&A up to US$500m by Target Industry<br />
2.7% 2.7% Financials<br />
3.1%<br />
Real Estate<br />
4.4%<br />
Materials<br />
5.1%<br />
35.2%<br />
Industrials<br />
Energy and Power<br />
Consumer Staples<br />
7.5%<br />
High Technology<br />
Healthcare<br />
Retail<br />
10.0%<br />
Consumer Products and Services<br />
Telecommunications<br />
14.0%<br />
12.3%<br />
Media and Entertainment<br />
# of Deals<br />
** Fee exposure indicates each firm's mid-market fees from deals valued at up to US$500m as a percentage of its overall M&A fees<br />
† Imputed Fees shown are based on completed deal activity, whereas deal count & rank values are compiled based on announced deal activity.<br />
https://www.thomsonone.com
Full Year 2010 │ <strong>Mid</strong>-Market M&A Up To US$500m │ Financial <strong>Advisors</strong><br />
Australia/New Zealand Involvement <strong>Mid</strong>-Market Rankings (MM11)<br />
MM11 - Undisclosed Values & Values up to US$500m<br />
Jan 1 2010 - Dec 31 2010<br />
Australia/New Zealand <strong>Mid</strong>-Market M&A up to US$500m by Rank Value Range<br />
# of Deals per Advisor<br />
Rank Value per Advisor (US$m)<br />
Imputed Fees (US$m) †<br />
2010 2009 # of Change in<br />
Rank Value<br />
2010 Rank Value Advisor 2010 ** Fee<br />
Financial Advisor<br />
Rank Rank Deals # of Deals<br />
US$m<br />
Rank Change (%) Fees Rank Exp. (%)<br />
PricewaterhouseCoopers 1 3* 36<br />
2 ▲ 1,029.3<br />
12 163.0 ▲ 1.3 56* 100.0<br />
Macquarie Group 2 1<br />
32<br />
-13 ▼<br />
2,905.3<br />
3 -25.3 ▼ 35.3 3 43.2<br />
Goldman Sachs & Co 3 3* 30<br />
-4 ▼<br />
3,608.8<br />
1 31.2 ▲ 52.2 1 36.7<br />
Deloitte 4 5 26<br />
-3 ▼<br />
171.1<br />
42 -35.6 ▼ 1.7 45* 100.0<br />
UBS<br />
5 7<br />
25<br />
6 ▲<br />
3,557.1<br />
2 195.4 ▲ 42.5 2 35.1<br />
KPMG 6 2<br />
24<br />
-14 ▼ 824.5 18 101.6 ▲ 1.7 45* 100.0<br />
Ernst & Young LLP 7 8* 20<br />
2 ▲<br />
899.5 14 274.8 ▲ 2.1 41 87.5<br />
Credit Suisse 8 11* 14<br />
3 ▲ 1,958.9<br />
4 186.3 ▲ 28.7 4 43.2<br />
Rothschild<br />
9 13* 13<br />
3 ▲<br />
1,515.3<br />
7 256.0 ▲ 19.9 5* 50.1<br />
Greenhill & Co, LLC 10 11* 12<br />
1 ▲ 1,186.5<br />
11 14.6 ▲ 12.0 12 32.6<br />
Gresham Partners 11* 8* 11<br />
-7 ▼<br />
919.0<br />
13 -34.1 ▼ 8.3 14 34.6<br />
Deutsche Bank AG 11* 6<br />
11 -12 ▼ 1,647.0<br />
5 -32.0 ▼ 16.9 9 42.6<br />
JP Morgan 13 15* 10<br />
2 ▲<br />
1,231.9 10 -32.0 ▼ 18.1 7 45.1<br />
RBC Capital Markets 14* 21* 9 4 ▲<br />
1,395.4 8 1618.5 ▲ 6.7 16 100.0<br />
Morgan Stanley 14* 15* 9<br />
1 ▲<br />
1,639.6<br />
6 62.8 ▲ 12.9 10 22.4<br />
Lazard 16* 20<br />
7 1 ▲<br />
893.9 15 103.9 ▲ 5.5 19 15.0<br />
Azure Capital<br />
16* 15* 7<br />
-1 ▼ 403.7<br />
28 -59.9 ▼ 8.2 15 100.0<br />
First NZ Capital<br />
18* 34* 6 4 ▲<br />
302.6<br />
32 156.9 ▲ 4.0 27* 100.0<br />
Bank of America Merrill Lynch 18* 34* 6<br />
4 ▲<br />
839.8<br />
17 27.8 ▲ 17.0 8 40.9<br />
Clairfield Partners 20* 57*<br />
5<br />
4<br />
▲<br />
00 0.0<br />
103*<br />
-<br />
- 16 1.6 49*<br />
100.00<br />
Grant Samuel 20* 10<br />
5<br />
-8 ▼<br />
465.8<br />
23 -67.5 ▼ 5.2 20* 94.5<br />
Citi<br />
20* 15* 5<br />
-3 ▼<br />
1,308.8<br />
9 13.1 ▲ 19.9 5* 42.2<br />
Investec<br />
23* 57* 4<br />
3 ▲<br />
571.7<br />
20 1242.0 ▲ .2 90* 100.0<br />
Wilson HTM<br />
23* 27* 4<br />
1 ▲<br />
218.8<br />
38 547.3 ▲ 3.3 31* 100.0<br />
Euroz Securities Ltd 23* -<br />
4<br />
4 ▲<br />
84.1<br />
59<br />
- - 1.2 58* 100.0<br />
Nomura 23* -<br />
4 4 ▲<br />
878.1 16<br />
- - 6.5 17 100.0<br />
Greenstone Partners 23* 24* 4<br />
0 -<br />
97.6<br />
53 95.2 ▲ 2.3 38* 100.0<br />
Miles Pty Ltd<br />
23* 57* 4<br />
3 ▲<br />
45.7<br />
71<br />
- - 1.5 51* 100.0<br />
BDO International<br />
23* 57* 4<br />
3 ▲<br />
77.3<br />
61<br />
- - 1.5 51* 100.0<br />
Fort Street Advisers 23* -<br />
4 4 ▲<br />
414.9 26<br />
- - 4.1 26 47.1<br />
ANZ Banking Group<br />
31* -<br />
3<br />
3 ▲<br />
415.8 25 - - 3.3 31* 26.6<br />
RBS 31* 13* 3<br />
-7 ▼<br />
147.7<br />
46 -33.1 ▼ 3.6 29* 43.9<br />
EC Hambro Rabben<br />
31* -<br />
3<br />
3 ▲<br />
13.5<br />
89<br />
- - .3 87* 100.0<br />
Grant Thornton LLP 31* 24* 3<br />
-1 ▼<br />
21.4<br />
81 -76.0 ▼ .1 102* 100.0<br />
Hartleys Ltd 31* 34* 3<br />
1 ▲<br />
185.0<br />
41 243.9 ▲ 2.3 38* 100.0<br />
Gryphon Partners 31* 19<br />
3<br />
-4 ▼<br />
350.9<br />
29 -57.1 ▼ 4.0 27* 37.7<br />
Cameron Partners Ltd 31* 21* 3<br />
-2 ▼ 152.4<br />
45 1273.0 ▲ 1.9 42* 59.4<br />
Argonaut Ltd 31* 27* 3<br />
0 -<br />
113.5 48 2.8 ▲ 1.5 51* 100.0<br />
Rabobank NV 31* - 3<br />
3 ▲<br />
488.5<br />
22 - - .5 79* 100.0<br />
Industry Total<br />
*tie<br />
Source: <strong>Thomson</strong> <strong>Reuters</strong>/Freeman Consulting<br />
2,466<br />
65<br />
▲<br />
45,071.4 40.0 ▲ 940.1<br />
60.6<br />
Rank Value (US$b)<br />
$25<br />
1,000<br />
900<br />
$20<br />
800<br />
700<br />
$15<br />
$10<br />
5.4%<br />
6.0%<br />
6.2%<br />
6.8%<br />
33.8%<br />
12.5%<br />
6.9%<br />
8.8%<br />
600<br />
500<br />
400<br />
300<br />
$5<br />
200<br />
100<br />
$0<br />
-<br />
1Q07 2Q07 3Q07 4Q07 1Q08 2Q08 3Q08 4Q08 1Q09 2Q09 3Q09 4Q09 1Q10 2Q10 3Q10 4Q10<br />
US$200 - 500m US$100 - 200m US$50 - 100m US$0 - 50m # of Deals<br />
Australian/New Zealand <strong>Mid</strong>-Market M&A up to US$500m by Target Industry<br />
3.2%<br />
Materials<br />
4.4%<br />
Real Estate<br />
4.4%<br />
Energy and Power<br />
# of Deals<br />
Consumer Products and Services<br />
Industrials<br />
Financials<br />
Media and Entertainment<br />
Consumer Staples<br />
Healthcare<br />
High Technology<br />
Retail<br />
Telecommunications<br />
Government and Agencies<br />
** Fee exposure indicates each firm's mid-market fees from deals valued at up to US$500m as a percentage of its overall M&A fees<br />
† Imputed Fees shown are based on completed deal activity, whereas deal count & rank values are compiled based on announced deal activity.<br />
https://www.thomsonone.com
Full Year 2010 │ <strong>Mid</strong>-Market M&A Up To US$500m │ Financial <strong>Advisors</strong><br />
Singapore Involvement <strong>Mid</strong>-Market Rankings (MM14)<br />
MM14 - Undisclosed Values & Values up to US$500m<br />
Jan 1 2010 - Dec 31 2010<br />
Singapore <strong>Mid</strong>-Market M&A up to US$500m by Rank Value Range<br />
# of Deals per Advisor<br />
Rank Value per Advisor (US$m)<br />
Imputed Fees (US$m) †<br />
2010 2009 # of Change in<br />
Rank Value<br />
2010 Rank Value Advisor 2010 ** Fee<br />
Financial Advisor<br />
Rank Rank Deals # of Deals<br />
US$m<br />
Rank Change (%) Fees Rank Exp. (%)<br />
CIMB Group Sdn Bhd<br />
1 1<br />
17<br />
0 -<br />
1,317.2 2 286.2 ▲ 9.9 5 60.7<br />
Credit Suisse<br />
2 5* 16 11 ▲<br />
1,274.1<br />
3 76.4 ▲ 23.4 1 83.6<br />
KPMG<br />
3* 3*<br />
9 3 ▲<br />
265.1<br />
22 -5.4 ▼ .2 46* 100.0<br />
M&A International<br />
3* 5*<br />
9 4 ▲<br />
245.4<br />
26 826.0 ▲ 3.0 16 100.0<br />
Ernst & Young LLP<br />
5* 10* 8<br />
5 ▲<br />
449.7<br />
12 2820.1 ▲ 1.8 22 100.0<br />
DMG & Partners Securities Pte 5* 10* 8<br />
5 ▲<br />
264.8<br />
23 1.7 ▲ 4.6 11 100.0<br />
Kim Eng Holdings Ltd 7* 27* 7<br />
6 ▲<br />
220.8 29 746.0 ▲ .6 36* 100.0<br />
Goldman Sachs & Co 7* 10* 7 4 ▲<br />
1,111.2<br />
4 401.4 ▲ 14.8 3 41.5<br />
AMMB Holdings Bhd 9* 27* 6 5 ▲<br />
104.0 41 -1.4 ▼ 1.3 29 100.0<br />
DBS Group Holdings 9* 2<br />
6<br />
-9 ▼<br />
817.6<br />
5 -44.8 ▼ 8.1 6 54.4<br />
PricewaterhouseCoopers<br />
Morgan Stanley<br />
9*<br />
9*<br />
3*<br />
5*<br />
6<br />
6<br />
0<br />
1<br />
-<br />
▲<br />
437.8<br />
1,434.5<br />
13<br />
1<br />
21.1 ▲<br />
285.7 ▲<br />
.2<br />
17.1<br />
46*<br />
2<br />
100.0<br />
57.6<br />
Deloitte<br />
9* 10* 6<br />
3 ▲ 513.6<br />
11 95.1 ▲ 1.5 25* 100.0<br />
Macquarie Group<br />
14* 5*<br />
5 0 -<br />
793.4<br />
6 206.5 ▲ 2.6 18 47.3<br />
Malayan Banking Bhd 14* - 5<br />
5 ▲<br />
66.7 46<br />
- - -<br />
-<br />
-<br />
HSBC Holdings PLC 14* 27* 5<br />
4 ▲ 741.9 7 36995.0 ▲ 7.3 7 100.0<br />
Nomura<br />
17* - 4<br />
4 ▲<br />
340.9<br />
18 - - 3.9 13* 100.0<br />
Collins Stewart Tullett 17* 10* 4 1 ▲<br />
179.8<br />
34 1753.6 ▲ .1 51* 100.0<br />
Asian Corporate <strong>Advisors</strong> Pte 17* 27* 4<br />
3 ▲ 621.5<br />
8<br />
- - .3 42* 100.0<br />
JP Morgan 17* 5* 4<br />
-1<br />
▼<br />
305.4 20 -28.5 ▼ 10.6<br />
4<br />
49.5<br />
Lazard 21* -<br />
3<br />
3 ▲<br />
308.2<br />
19<br />
- - 1.1 31 24.4<br />
Mizuho Financial Group<br />
21* -<br />
3<br />
3 ▲<br />
115.0 39<br />
- - 1.7 23* 100.0<br />
UBS 21* 10* 3<br />
0 -<br />
239.9<br />
27 178.6 ▲ 4.1 12 27.3<br />
Citi 21* 27* 3<br />
2 ▲<br />
538.9<br />
9<br />
- - 3.9 13* 100.0<br />
Daiwa Securities Group Inc 21* - 3<br />
3 ▲<br />
12.5<br />
56* - - .6 36* 100.0<br />
ANZ Banking Group<br />
26* 19* 2<br />
0 - 433.9<br />
14 57.5 ▲ 5.3 9 37.1<br />
RBS<br />
26* 27* 2<br />
1 ▲<br />
44.6<br />
48 -47.3 ▼ .8 33 20.0<br />
Rothschild<br />
26* 27* 2<br />
1 ▲<br />
189.8<br />
32 556.7 ▲ 1.5 25* 100.0<br />
Standard Chartered PLC 26* 10* 2<br />
-1 ▼<br />
519.1<br />
10 217.1 ▲ 5.0 10 50.0<br />
BNP Paribas SA<br />
26* 19* 2<br />
0 -<br />
283.9<br />
21 -32.3 ▼ 2.0 20 100.0<br />
Bohai Securities Co Ltd 26* - 2 2 ▲ 112.7 40 - - - - -<br />
Janney Montgomery Scott LLC 26* -<br />
2<br />
2 ▲<br />
420.0<br />
15 - - 3.1 15 100.0<br />
SAC Capital Private Ltd 26* - 2<br />
2 ▲<br />
219.5<br />
30<br />
- - -<br />
-<br />
-<br />
Westcomb Financial Group Ltd 26* 27* 2 1 ▲ 174.6 35 309.9 ▲ .9 32 100.0<br />
NRA Capital Pte Ltd 26* 27* 2 1 ▲ 64.1 47 1543.6 ▲ 1.2 30 100.0<br />
GCA Savvian Group Corp 26* 27* 2 1 ▲ 12.5 56* - - .4 40* 100.0<br />
Sumitomo Mitsui Finl Grp Inc 26* - 2 2 ▲ 22.3 52 - - .3 42* 100.0<br />
Religare Enterprises Ltd 26* - 2 2 ▲ 184.6 33 - - .6 36* 3.4<br />
Bank of America Merrill Lynch 26* 19* 2 0 - 368.2 16<br />
- - 5.7 8 46.3<br />
Hong Leong Financial Group Bhd 26* - 2 2 ▲<br />
351.1<br />
17<br />
- - 1.7 23* 100.0<br />
Anglo Chinese Corp Finance 26* - 2<br />
2 ▲ 121.6<br />
38 - - 1.4 27* 100.0<br />
Rank Value (US$b)<br />
$10<br />
$9<br />
$8<br />
$7<br />
$6<br />
$5<br />
$4<br />
300<br />
250<br />
200<br />
100<br />
$3<br />
$2<br />
50<br />
$1<br />
$0<br />
-<br />
1Q07 2Q07 3Q07 4Q07 1Q08 2Q08 3Q08 4Q08 1Q09 2Q09 3Q09 4Q09 1Q10 2Q10 3Q10 4Q10<br />
US$200 - 500m US$100 - 200m US$50 - 100m US$0 - 50m # of Deals<br />
Singapore <strong>Mid</strong>-Market M&A up to US$500m by Target Industry<br />
3.9% 2.8% Real Estate<br />
4.1%<br />
19.7%<br />
Financials<br />
5.5%<br />
Energy and Power<br />
Industrials<br />
5.5%<br />
Consumer Staples<br />
Materials<br />
7.8%<br />
Healthcare<br />
18.4%<br />
Media and Entertainment<br />
150<br />
# of Deals<br />
9.0%<br />
Retail<br />
High Technology<br />
Industry Total 944 173 ▲ 21,912.2<br />
92.2 ▲ 367.9<br />
*tie<br />
Source: <strong>Thomson</strong> <strong>Reuters</strong>/Freeman Consulting<br />
72.4<br />
10.8%<br />
12.0%<br />
Consumer Products and Services<br />
Telecommunications<br />
** Fee exposure indicates each firm's mid-market fees from deals valued at up to US$500m as a percentage of its overall M&A fees<br />
† Imputed Fees shown are based on completed deal activity, whereas deal count & rank values are compiled based on announced deal activity.<br />
https://www.thomsonone.com
Full Year 2010 │ <strong>Mid</strong>-Market M&A Up To US$500m │ Financial <strong>Advisors</strong><br />
Japanese Involvement <strong>Mid</strong>-Market Rankings (MM15)<br />
MM15 - Undisclosed Values & Values up to US$500m<br />
Jan 1 2010 - Dec 31 2010<br />
Japanese <strong>Mid</strong>-Market M&A up to US$500m by Rank Value Range<br />
# of Deals per Advisor<br />
Rank Value per Advisor (US$m)<br />
Imputed Fees (US$m) †<br />
2010 2009 # of Change in<br />
Rank Value<br />
2010 Rank Value Advisor 2010 ** Fee<br />
Financial Advisor<br />
Rank Rank Deals # of Deals<br />
US$m<br />
Rank Change (%) Fees Rank Exp. (%)<br />
Mizuho Financial Group 1 1 100 -32 ▼ 4,642.5<br />
3 -29.5 ▼ 67.0 2 50.5<br />
Sumitomo Mitsui Finl Grp Inc<br />
Nomura<br />
2<br />
3<br />
6*<br />
2<br />
99<br />
98<br />
66<br />
-12<br />
▲<br />
▼<br />
4,169.5<br />
7,870.3<br />
4<br />
1<br />
237.8 ▲<br />
-21.9 ▼<br />
43.2<br />
89.1<br />
4<br />
1<br />
79.4<br />
50.2<br />
Daiwa Securities Group Inc<br />
Deloitte<br />
4<br />
5<br />
3<br />
10<br />
50<br />
43<br />
-38<br />
18<br />
▼<br />
▲<br />
1,875.5<br />
1,767.2<br />
7<br />
8<br />
-65.2 ▼<br />
96.5 ▲<br />
37.5<br />
3.2<br />
5<br />
43*<br />
48.4<br />
91.4<br />
Mitsubishi UFJ Morgan Stanley<br />
6 - 41<br />
- -<br />
5,919.5<br />
2<br />
- - 59.4 3<br />
-<br />
Frontier Management Inc 7 8<br />
33<br />
3 ▲<br />
749.2 19 352.7 ▲ 14.5 14 100.0<br />
KPMG<br />
8 6* 31 -2 ▼<br />
1,591.7<br />
10 -0.8 ▼ 16.8 13 59.4<br />
Mitsubishi UFJ Financial Group 9 4 29<br />
-35 ▼<br />
269.9 42 -91.9 ▼ 17.2 12 32.8<br />
GCA Savvian Group Corp 10 5<br />
28<br />
-18 ▼<br />
2,621.7 5 60.3 ▲ 25.6 7* 100.0<br />
PricewaterhouseCoopers 11 9 21<br />
-7 ▼ 1,144.1 13 -57.5 ▼ 3.7 37* 88.1<br />
Deutsche Bank AG 12 16* 18<br />
6 ▲<br />
1,551.8<br />
11 49.8 ▲ 25.6 7* 52.0<br />
Plutus Consulting Co Ltd 13 20* 17<br />
7 ▲<br />
421.5<br />
33 928.0 ▲ 3.4 39* 100.0<br />
Development Bank of Japan Inc 14 32* 16 10 ▲ 299.8 37 1348.3 ▲ .2 126* 100.0<br />
Ernst & Young LLP 15* 13 15<br />
-1 ▼<br />
689.9<br />
21 -43.3 ▼ 5.1 25* 100.0<br />
Bank of America Merrill Lynch<br />
15* 11 15<br />
-8 ▼ 2,526.9<br />
6 162.9 ▲ 18.5 10 33.0<br />
Citi 17 12 13<br />
-9 ▼<br />
1,311.5 12 -49.2 ▼ 19.0 9 34.8<br />
es Networks Co Ltd<br />
18* 25* 12<br />
4 ▲ 436.9 29 55.8 ▲ 4.8 27* 100.0<br />
ORIX M&A Solutions Corp<br />
18* 19 12<br />
1 ▲ 101.9<br />
61 -66.7 ▼ 4.5 29* 100.0<br />
Goldman Sachs & Co<br />
20 25* 11<br />
3<br />
▲<br />
1,625.7 9 99 9.9<br />
▲<br />
31.0<br />
6<br />
39.4<br />
JP Morgan 21 20* 10<br />
0 -<br />
835.4<br />
16 -46.2 ▼ 18.0 11 20.0<br />
AGS Consulting Co Ltd 22 20* 9<br />
-1 ▼<br />
129.0 56 -76.8 ▼ 4.5 29* 100.0<br />
AER Corp 23* 16* 8<br />
-4 ▼<br />
51.1 72 149.3 ▲ 2.3 55* 100.0<br />
TFP Consulting Group Co Ltd 23* 42* 8<br />
4 ▲<br />
429.4<br />
31 1659.8 ▲ 1.1 72* 100.0<br />
Barclays Capital 25* 45* 7<br />
4 ▲ 727.0<br />
20 -20.6 ▼ 11.4 17 100.0<br />
Ichiyoshi Securities Co Ltd 25* 78* 7 6 ▲ 9.2 112 253.8 ▲ .1 146* 100.0<br />
ABeam M&A Consulting Ltd 25* 14<br />
7<br />
-7 ▼<br />
818.9 17 21.3 ▲ 10.6 18 43.6<br />
Growin Partners Inc 25* 45* 7 4 ▲<br />
49.8<br />
73 29.0 ▲ 1.1 72* 100.0<br />
Mirai Consulting Inc 25* 25* 7<br />
-1 ▼ 58.1 69 -45.3 ▼ 1.1 72* 100.0<br />
Houlihan Lokey 30* 32* 6<br />
0 - 299.7 38 116.9 ▲ 2.4 53* 100.0<br />
Rothschild 30* 42* 6<br />
2 ▲<br />
1,092.2 14 807.9 ▲ 3.8 35* 26.8<br />
RBC Capital Markets 30* -<br />
6<br />
6 ▲<br />
771.6 18 - - 8.8 21 100.0<br />
Credit Suisse 30* 16* 6 -6 ▼<br />
1,085.9<br />
15 73.9 ▲ 11.6 16 62.4<br />
SN Corporate Advisory 30* 36* 6<br />
1 ▲<br />
225.7 46 1691.3 ▲ 2.8 50 100.0<br />
IMAP 30* 30* 6<br />
-1 ▼<br />
51.2<br />
71 -57.5 ▼ 2.4 53* 100.0<br />
Greenhill & Co, LLC 36* 53* 5<br />
3 ▲ 596.2 22 480.5 ▲ 5.1 25* 63.8<br />
BNP Paribas SA<br />
36* 53* 5<br />
3 ▲<br />
500.2 25 71.4 ▲ 8.0 22 76.9<br />
Lazard<br />
36* 20* 5<br />
-5 ▼<br />
349.5 35 -27.5 ▼ 12.8 15 50.6<br />
UBS 36* 15<br />
5<br />
-8 ▼<br />
475.5<br />
28 -68.2 ▼ 5.5 24 15.2<br />
Global M&A 36* 45* 5<br />
2 ▲<br />
16.0 103 -83.3 ▼ 4.1 33* 100.0<br />
Capital Strategy Consulting 36* 53* 5<br />
3 ▲<br />
76.8<br />
64 241.3 ▲ .4 107* 100.0<br />
Sakurabashi Professional 36* -<br />
5<br />
5 ▲ 20.9 91 - - .4 107* 100.0<br />
Sharaku Corp Inc 36* 36*<br />
5<br />
0 -<br />
571.9<br />
24 -1.2 ▼ 4.5 29* 100.0<br />
ReEx Accounting Firm 44* -<br />
4 4 ▲<br />
10.3<br />
108 - - .1 146* 100.0<br />
HSBC Holdings PLC 44* 45* 4<br />
1 ▲<br />
483.9 27 9.4 ▲ 3.7 37* 100.0<br />
Industry Total 2,756 -117 ▼<br />
46,989.4 3.4 ▲<br />
*tie<br />
Source: <strong>Thomson</strong> <strong>Reuters</strong>/Freeman Consulting<br />
1,182.9<br />
63.7<br />
Rank Value (US$b)<br />
$20<br />
$18<br />
$16<br />
$14<br />
$12<br />
$10<br />
$8<br />
900<br />
800<br />
700<br />
600<br />
300<br />
$6<br />
200<br />
$4<br />
$2<br />
100<br />
$0<br />
-<br />
1Q07 2Q07 3Q07 4Q07 1Q08 2Q08 3Q08 4Q08 1Q09 2Q09 3Q09 4Q09 1Q10 2Q10 3Q10 4Q10<br />
US$200 - 500m US$100 - 200m US$50 - 100m US$0 - 50m # of Deals<br />
Japanese <strong>Mid</strong>-Market M&A up to US$500m by Target Industry<br />
3.7% 3.2% Real Estate<br />
4.3%<br />
18.2%<br />
Financials<br />
5.1%<br />
High Technology<br />
Energy and Power<br />
5.6%<br />
Industrials<br />
Materials<br />
6.4%<br />
Consumer Products and Services<br />
15.5%<br />
Consumer Staples<br />
Retail<br />
7.7%<br />
Healthcare<br />
Media and Entertainment<br />
Telecommunications<br />
8.5%<br />
11.7%<br />
Government and Agencies<br />
10.0%<br />
500<br />
400<br />
# of Deals<br />
** Fee exposure indicates each firm's mid-market fees from deals valued at up to US$500m as a percentage of its overall M&A fees<br />
† Imputed Fees shown are based on completed deal activity, whereas deal count & rank values are compiled based on announced deal activity.<br />
https://www.thomsonone.com
Full Year 2010 │ <strong>Mid</strong>-Market M&A Up To US$500m │ Financial <strong>Advisors</strong><br />
Chinese Involvement <strong>Mid</strong>-Market Rankings (MM20)<br />
MM20 - Undisclosed Values & Values up to US$500m Jan 1 2010 - Dec 31 2010 Chinese <strong>Mid</strong>-Market M&A up to US$500m by Rank Value Range<br />
# of Deals per Advisor Rank Value per Advisor (US$m) Imputed Fees (US$m) †<br />
2010 2009 # of Change in Rank Value 2010 Rank Value Advisor 2010 ** Fee<br />
Financial Advisor Rank Rank Deals # of Deals US$m Rank Change (%) Fees Rank Exp. (%)<br />
China International Capital Co 1* 52* 19 16 ▲ 974.7 10 19.5 ▲ .1 87* 0.4<br />
Credit Suisse 1* 10* 19 7 ▲ 3,011.8 1 2022.5 ▲ 17.6 3 56.2<br />
Deutsche Bank AG 3 7* 16 2 ▲ 1,671.2 11 191.9 ▲ 16.1 5 50.0<br />
Huatai Securities 4 26* 15 9 ▲ 1,231.2 81 1236.8 ▲ .3 68* 100.0<br />
Somerley Ltd 5* 1 13 -17 ▼ 582.6 57 -69.5 ▼ 7.9 10 55.2<br />
PricewaterhouseCoopers 5* 19* 13 5 ▲ 714.7 126 17.3 ▲ .7 44* 100.0<br />
KPMG 7 13* 12 3 ▲ 973.3 72* 176.7 ▲ .7 44* 100.0<br />
Citi 8 23* 11 4 ▲ 859.5 2 38.6 ▲ 11.7 6 48.0<br />
BNP Paribas SA 9* 38* 10<br />
6 ▲ 465.0 72* 1622.2 ▲ 10.5 7 37.4<br />
CITIC 9* 6 10 -5 ▼ 1,740.3 83 363.7 ▲ 4.7 17 30.1<br />
CIMB Group Sdn Bhd 9* 3 10 -13 ▼ 658.0 18 -12.9 ▼ 1.3 36 100.0<br />
GF Securities 12* 13* 9 0 - 1,164.8 13 360.9 ▲ .4 59* 50.0<br />
Goldman Sachs & Co 12* 19* 9 1 ▲ 2,463.0 - 10516.4 ▲ 26.4 1 68.6<br />
China Merchants Securities Co 14* 5 8 -8 ▼ 794.3 21 - - .1 87* 100.0<br />
Access Capital Ltd 14* 26* 8 2 ▲ 420.9 - - - .5 54* 100.0<br />
Guotai Junan Securities 14* 10* 8 -4 ▼ 0.0 - - - .1 87* 25.0<br />
Optima Capital Ltd 14* 19* 8 0 - 267.6 5 -34.2 ▼ 3.0 25 100.0<br />
Anglo Chinese Corp Finance 14* 13* 8 -1 ▼ 468.3 125 313.3 ▲ 8.0 9 70.2<br />
Morgan Stanley 19* 2 7 -17 ▼ 847.7 - 134.8 ▲ 19.1 2 38.4<br />
China Securities Co Ltd 19* 26* 7 1 ▲ 461.9 9 - - .1 87* 100.00<br />
Qilu Securities Co Ltd 19* 91* 7 6 ▲ 725.8 138* 54.4 ▲ - - -<br />
Houlihan Lokey 22* 91* 6 5 ▲ 562.6 68 - - 6.7 12 100.0<br />
Haitong Securities 22* 9 6 -7 ▼ 530.0 8 -49.4 ▼ .5 54* 62.5<br />
Everbright Securities Co 22* 52* 6 3 ▲ 613.6 12 -30.8 ▼ - - -<br />
UBS 22* 13* 6 -3 ▼ 1,085.8 74* 158.7 ▲ 8.9 8 78.1<br />
Santander 22* - 6 6 ▲ 0.0 138* - - 3.6 22* 40.4<br />
Bank of America Merrill Lynch 22* 52* 6 3 ▲ 608.9 44* 83.8 ▲ 6.6 13 61.1<br />
Banco Standard De Investimento 22* - 6 6 ▲ 0.0 30* - - 3.6 22* 40.4<br />
Guangdong Securities 29* 4 5 -12 ▼ 247.1 70 -66.8 ▼ - - -<br />
Orient Securities Co Ltd 29* 13* 5 -4 ▼ 401.9 29 43.3 ▲ .7 44* 50.0<br />
Nomura 29* 33* 5 0 - 1,325.0 - -15.6 ▼ 7.7 11 62.6<br />
Liberum Capital 29* 91* 5 4 ▲ 18.3 - -96.4 ▼ .1 87* 100.0<br />
M&A International 29* 38* 5 1 ▲ 90.5 53 1292.3 ▲ .4 59* 80.0<br />
Pingan Securities Co Ltd 34* 23* 4 -3 ▼ 206.9 0 279.6 ▲ .2 74* 100.0<br />
Rothschild 34* 13* 4 -5 ▼ 464.0 - -0.1 ▼ 4.0 19 21.9<br />
Mizuho Financial Group 34* 33* 4 -1 ▼ 115.1 - -63.2 ▼ .9 38* 100.0<br />
China Galaxy Securities Co 34* 52* 4 1 ▲ 0.0 - - - .3 68* 100.0<br />
Minsheng Securities 34* 33* 4 -1 ▼ 458.1 - 2610.7 ▲ .4 59* 100.0<br />
Ample Capital Limited 34* 23* 4 -3 ▼ 16.2 24 - - .1 87* 100.0<br />
Bank of China Ltd 34* 52* 4 1 ▲ 434.2 - - - .9 38* 100.0<br />
Southwest Securities Co Ltd 34* 7* 4 -10 ▼ 620.0 28 - - - - -<br />
Industry Total 3,502 514 ▲ 89,866.5 35.2 ▲ 605.0 63.8<br />
*tie<br />
Source: <strong>Thomson</strong> <strong>Reuters</strong>/Freeman Consulting<br />
Rank Value (US$b)<br />
$30<br />
$25<br />
$20<br />
$15<br />
1,200<br />
1,000<br />
800<br />
$10<br />
400<br />
$5<br />
200<br />
$0<br />
-<br />
1Q07 2Q07 3Q07 4Q07 1Q08 2Q08 3Q08 4Q08 1Q09 2Q09 3Q09 4Q09 1Q10 2Q10 3Q10 4Q10<br />
US$200 - 500m US$100 - 200m US$50 - 100m US$0 - 50m # of Deals<br />
Chinese <strong>Mid</strong>-Market M&A up to US$500m by Target Industry<br />
0.6%<br />
3.3% 2.1% Materials<br />
3.6%<br />
21.6%<br />
Financials<br />
3.9%<br />
Real Estate<br />
5.0%<br />
Industrials<br />
Energy and Power<br />
5.2%<br />
High Technology<br />
Consumer Staples<br />
Media and Entertainment<br />
7.7%<br />
16.7%<br />
Consumer Products and Services<br />
Healthcare<br />
Retail<br />
14.8%<br />
Telecommunications<br />
Government and Agencies<br />
15.0%<br />
600<br />
# of Deals<br />
** Fee exposure indicates each firm's mid-market fees from deals valued at up to US$500m as a percentage of its overall M&A fees<br />
† Imputed Fees shown are based on completed deal activity, whereas deal count & rank values are compiled based on announced deal activity.<br />
https://www.thomsonone.com
Full Year 2010 │ <strong>Mid</strong>-Market M&A Up To US$500m │ Financial <strong>Advisors</strong><br />
Indian Involvement <strong>Mid</strong>-Market Rankings (MM21)<br />
MM21 - Undisclosed Values & Values up to US$500m Jan 1 2010 - Dec 31 2010 Indian <strong>Mid</strong>-Market M&A up to US$500m by Rank Value Range<br />
# of Deals per Advisor Rank Value per Advisor (US$m) Imputed Fees (US$m) †<br />
2010 2009 # of Change in Rank Value 2010 Rank Value Advisor 2010 ** Fee<br />
Financial Advisor Rank Rank Deals # of Deals US$m Rank Change (%) Fees Rank Exp. (%)<br />
Ernst & Young LLP 1 1 33 6 ▲ 1,208.7 5 297.5 ▲ 1.8 36* 85.7<br />
Kotak Mahindra Bank Ltd 2 3 19 5 ▲ 1,315.6 2 29.9 ▲ 5.3 13 100.0<br />
Deloitte 3 6* 18 8 ▲ 471.1 22 -43.9 ▼ 1.9 34* 100.0<br />
<strong>BMR</strong> <strong>Advisors</strong> 4 2 17 1 ▲ 50.8 58 -83.1 ▼ 2.4 30 100.0<br />
Enam Securities 5* 4 12 0 - 459.5 24 24.3 ▲ 5.6 12 68.3<br />
ICICI Bank Ltd 5* 10* 12 4 ▲ 372.5 27 209.1 ▲ 4.6 15 100.0<br />
Rothschild 7* 25* 11 8 ▲ 1,214.8 4 358.8 ▲ 6.0 11 63.2<br />
Religare Enterprises Ltd 7* 25* 11 8 ▲ 897.0 9 332.7 ▲ 3.6 22 56.3<br />
Ambit Corporate Finance 9 25* 10 7 ▲ 552.5 18* 246.6 ▲ 4.4 18* 100.0<br />
Morgan Stanley 10 20* 8 4 ▲ 552.5 18* 794.0 ▲ 9.1 5 25.4<br />
KPMG 11* 6* 7 -3 ▼ 793.3 13 2860.1 ▲ 1.0 49* 100.0<br />
UBS 11* 8* 7 -2 ▼ 1,189.0 6 - - 12.1 2 24.2<br />
PricewaterhouseCoopers 13* 13 6 -1 ▼ 120.6 42 - - .2 75* 100.0<br />
Edelweiss Capital 13* 20* 6 2 ▲ 621.0 16 -21.4 ▼ 8.8 6* 100.0<br />
Singhi <strong>Advisors</strong> Ltd 13* 20* 6 2 ▲ 142.3 40 -75.9 ▼ 2.5 29 17.9<br />
JM Financial Group 16* 10* 5 -3 ▼ 351.0 29 116900.0 ▲ 4.7 14 100.0<br />
Standard Chartered PLC 16* 14* 5 -1 ▼ 803.3 12 309.0 ▲ 6.7 9 41.4<br />
Lazard 16* 31* 5 3 ▲ 817.4 11 6336.2 ▲ 4.5 16* 28.0<br />
Clairfield Partners 16* 14* 5 -1 ▼ 193.8 37 1227.4 ▲ 1.0 49* 100.0<br />
Macquarie Group 16* 25* 5 2 ▲ 1,136.0136 7 2402.22 ▲ 32 3.2 26 52.55<br />
Jefferies & Co Inc 16* 36* 5 4 ▲ 1,218.4 3 703.2 ▲ 6.4 10 100.0<br />
Goldman Sachs & Co 16* 20* 5 1 ▲ 1,418.0 1 - - 16.7 1 74.6<br />
JP Morgan 16* 36* 5 4 ▲ 917.7 8 1212.9 ▲ 8.8 6* 100.0<br />
Houlihan Lokey 24* 31* 4 2 ▲ 277.5 33 68.4 ▲ 4.0 20 100.0<br />
Barclays Capital 24* 31* 4 2 ▲ 828.3 10 162.4 ▲ 8.6 8 35.8<br />
Challenge Consultancy Services 24* 36* 4 3 ▲ 8.9 74 641.7 ▲ .4 68* 100.0<br />
HSBC Holdings PLC 24* 36* 4 3 ▲ 619.2 17 -22.7 ▼ 4.4 18* 35.5<br />
State Bank of India 28* 18* 3 -2 ▼ 182.1 38 378.0 ▲ 2.6 28 100.0<br />
Grant Thornton LLP 28* 36* 3 2 ▲ 197.2 36 - - .5 65* 100.0<br />
VC Corporate <strong>Advisors</strong> Pvt Ltd 28* 36* 3 2 ▲ 0.1 84* - - .0 88* -<br />
Citi 28* 14* 3 -3 ▼ 519.8 20 - - 9.5 3 41.3<br />
BDO International 28* - 3 3 ▲ 0.0 86* - - 1.8 36* 100.0<br />
Daiwa Securities Group Inc 28* - 3 3 ▲ 129.2 41 - - 1.5 41 100.0<br />
Credit Suisse 28* 25* 3 0 - 343.5 30 656.6 ▲ 9.3 4 100.0<br />
M&A International 28* 36* 3 2 ▲ 65.1 52 - - 2.1 33 100.0<br />
Industry Total 1,314 11 ▲ 22,178.6 57.4 ▲ 438.6 61.7<br />
*tie<br />
Source: <strong>Thomson</strong> <strong>Reuters</strong>/Freeman Consulting<br />
Rank Value (US$b)<br />
$8<br />
$7<br />
$6<br />
$5<br />
$4<br />
450<br />
400<br />
350<br />
300<br />
$3<br />
150<br />
$2<br />
100<br />
$1<br />
50<br />
$0<br />
-<br />
1Q07 2Q07 3Q07 4Q07 1Q08 2Q08 3Q08 4Q08 1Q09 2Q09 3Q09 4Q09 1Q10 2Q10 3Q10 4Q10<br />
US$200 - 500m US$100 - 200m US$50 - 100m US$0 - 50m # of Deals<br />
Indian <strong>Mid</strong>-Market M&A up to US$500m by Target Industry<br />
1.0%<br />
3.2%<br />
4.1%<br />
Materials<br />
4.1%<br />
20.2%<br />
Financials<br />
Energy and Power<br />
4.8%<br />
Industrials<br />
Telecommunications<br />
6.9%<br />
Healthcare<br />
Consumer Staples<br />
6.9%<br />
14.3%<br />
Real Estate<br />
Media and Entertainment<br />
High Technology<br />
7.9%<br />
Consumer Products and Services<br />
Retail<br />
14.0%<br />
Government and Agencies<br />
12.7%<br />
250<br />
200<br />
# of Deals<br />
** Fee exposure indicates each firm's mid-market fees from deals valued at up to US$500m as a percentage of its overall M&A fees<br />
† Imputed Fees shown are based on completed deal activity, whereas deal count & rank values are compiled based on announced deal activity.<br />
https://www.thomsonone.com
Full Year 2010 │ <strong>Mid</strong>-Market M&A Up To US$500m │ Financial <strong>Advisors</strong><br />
Ranking Criteria Summary<br />
If you would like to participate in the submission<br />
process, receive quarterly press releases, or have<br />
questions about league table criteria please<br />
contact:<br />
Americas<br />
Audrey Brown<br />
Tel: +1 646 223 8414<br />
E-mail: audrey.brown@thomsonreuters.com<br />
Europe, <strong>Mid</strong>dle East & Africa<br />
Benedikt Schueller<br />
Tel: +44 (0) 207 542 9059<br />
E-mail: benedikt.schueller@thomsonreuters.com<br />
Asia-Pacific<br />
Jason Pacannuayan<br />
Tel: +632 858 7262<br />
E-mail: jason.pacannuayan@thomsonreuters.com<br />
- Announced league tables include all deals that were announced between January 1, 2009 and December 31, 2010 and of which <strong>Thomson</strong> <strong>Reuters</strong> was made aware. All current data and<br />
previous year's data is as of 12:00pm EST on January 10, 2011.<br />
- League tables include rank eligible mergers, acquisitions, repurchases, spin-offs, self-tenders, minority stake purchases and debt restructurings.<br />
- A tender/merger transaction is considered to be effective at the time of consummation of the merger or the date on which it is declared wholly unconditional.<br />
- Deals with undisclosed dollar values are rank eligible but with no corresponding Rank Value. Non-US dollar denominated transactions are converted to the US dollar equivalent at the time of<br />
announcement of terms.<br />
-<br />
Financial and legal advisors receive full credit for each deal on which they provide financial or legal advisory services, unless they represent minority sellers or advise on only a portion of the<br />
transaction or <strong>Thomson</strong> <strong>Reuters</strong> has not been made aware of their participation in that transaction. For pending transactions, advisors to targets of multiple bids receive credit for the transaction<br />
agreed to or, in the absence of an agreement, the value of the highest offer.<br />
Japan - Any Involvement league tables include deals where the target, acquiror, or either ultimate parent are domiciled (nation of headquarters) in the specified region or nation.<br />
Catherina Guinto-Roldan<br />
Tel: +813 5218 6591<br />
E-mail: catherina.guinto@thomsonreuters.com<br />
- League tables, commentary, and charts citing announced activity are based on Rank Date and include intended, pending, partially complete, completed, pending regulatory, and unconditional<br />
transactions. Rank Date is defined as the earliest public announcement of when a value can be applied to a transaction.<br />
While <strong>Thomson</strong> <strong>Reuters</strong> has used reasonable endeavors to ensure that the information provided in this document is accurate and up to date as at the time of issue, neither <strong>Thomson</strong> <strong>Reuters</strong><br />
nor its third party content providers shall be liable for any errors, inaccuracies or delays in the information, nor for any actions taken in reliance thereon, nor does it endorse any views or opinions<br />
of any third party content provider. <strong>Thomson</strong> <strong>Reuters</strong> disclaims all warranties, express or implied, as to the accuracy or completeness of any of the content provided, or as to the fitness of the<br />
content for any purpose to the extent permitted by law. The content herein is not appropriate for the purposes of making a decision to carry out a transaction or trade and does not provide any<br />
form of advice (investment, tax, legal) amounting to investment advice, nor make any recommendations or solicitations regarding particular financial instruments, investments or products,<br />
including the buying or selling of securities. <strong>Thomson</strong> <strong>Reuters</strong> has not undertaken any liability or obligation relating to the purchase or sale of securities for or by any person in connection with<br />
this document.<br />
© 2011 <strong>Thomson</strong> <strong>Reuters</strong>. All rights reserved.<br />
<strong>Thomson</strong> <strong>Reuters</strong> and the <strong>Thomson</strong> <strong>Reuters</strong> logo are registered trademarks and trademarks of <strong>Thomson</strong> <strong>Reuters</strong> and its affiliated companies. Any third party name or mark herein belongs to the relevant third party.<br />
https://www.thomsonone.com
Full Year 2010 │ <strong>Mid</strong>-Market M&A Up To US$500m │ Financial <strong>Advisors</strong><br />
<strong>Thomson</strong> ONE Investment Banking<br />
One Solution. One Framework<br />
<strong>Thomson</strong> ONE is a revolutionary desktop solution that combines real-time market data and news with authoritative content from industry leading sources. Critical information that<br />
previously needed to be co-ordinated and collected from internal and external sources is now at your finger tips in a remarkably easy-to-use format.<br />
Comprehensive Content<br />
<strong>Thomson</strong> ONE Investment Banking offers you quick and easy access to quotes, earnings estimates, financial fundamentals, market moving news, transaction data, corporate filings,<br />
ownership profiles and research from industry leading sources:<br />
About <strong>Thomson</strong> <strong>Reuters</strong><br />
<strong>Thomson</strong> <strong>Reuters</strong> is the world’s leading source of<br />
intelligent information for businesses and professionals.<br />
We combine industry expertise with innovative<br />
technology to deliver critical information to leading<br />
decision makers in the financial, legal, tax and<br />
accounting, scientific, healthcare and media markets,<br />
powered by the world’s most trusted news organization.<br />
<strong>Thomson</strong> I/B/E/S<br />
<strong>Thomson</strong> Worldscope<br />
<strong>Thomson</strong> Investext<br />
<strong>Thomson</strong> First Call Earnings Data<br />
<strong>Thomson</strong> SDC<br />
<strong>Thomson</strong> Extel<br />
With headquarters in New York and major operations in<br />
London and Eagan, Minnesota, <strong>Thomson</strong> <strong>Reuters</strong><br />
employs more than 50,000 people in 93 countries.<br />
<strong>Thomson</strong> <strong>Reuters</strong> shares are listed on the New York<br />
Stock Exchange (NYSE: TRI); and the Toronto Stock<br />
Exchange (TSX: TRI).<br />
Global real-time and/or delayed market data<br />
And many more…<br />
For more information, go to www.thomsonreuters.com.<br />
Open Framework<br />
<strong>Thomson</strong> ONE's open framework puts youin control of your workflow. View content sets from disparate databases side by side for over 60,000000 domestic and global companies. You<br />
have the flexibility to integrate your own proprietary or other third party information. Simply select the content you’d like to view and designate how and where you want it to be<br />
displayed on your pages.<br />
Unsurpassed Functionality<br />
Customize the type of content you want to receive by<br />
choosing only data that is relevant to your workflow.<br />
Design your own layout for a personalized view of content<br />
and functional components.<br />
Unmatched Benefits<br />
Receive only relevant information through tailored pages for<br />
user workflow.<br />
Desktop Delivery—the first fully integrated product for the<br />
investment banking community.<br />
<strong>Thomson</strong> <strong>Reuters</strong> Deals Content is the most extensive<br />
and flexible resource available for timely M&A and capital<br />
markets transactions. Our leading edge products for the<br />
deal-making community enable you to analyze the<br />
current trends in the market and assess the changing<br />
competitive landscape by building your own custom<br />
leagues tables and reports. Please send an email to<br />
salesinquiry@thomson.com for more information.<br />
Search across multiple databases simultaneously to receive<br />
the most in-depth and up-to-date information available.<br />
Low cost integration - reducing overall market data costs by<br />
minimizing infrastructure overhead and leveraging existing<br />
contracts.<br />
View streaming market data allowing you to stay on top of<br />
market conditions.<br />
Copyright 2010 <strong>Thomson</strong> <strong>Reuters</strong>. All rights reserved.