Full Report - The Organic Center
Full Report - The Organic Center
Full Report - The Organic Center

You also want an ePaper? Increase the reach of your titles
YUMPU automatically turns print PDFs into web optimized ePapers that Google loves.
<strong>The</strong> <strong>Organic</strong> <strong>Center</strong> www.organic-center.org<br />
<strong>The</strong> <strong>Organic</strong> <strong>Center</strong> Critical Issue <strong>Report</strong> Page<br />
Critical Issue <strong>Report</strong>: A Deeper Shade of Green<br />
August 2012 A Deeper Shade of Green 27<br />
A Deeper Shade of Green:<br />
Lessons from Grass-based <strong>Organic</strong><br />
Dairy Farms<br />
Charles Benbrook Ph.D.<br />
August 2012<br />
Page 27
<strong>The</strong> <strong>Organic</strong> <strong>Center</strong> A Deeper Shade of Green A Critical Issue <strong>Report</strong><br />
Table of Contents<br />
Preface 1<br />
Acknowledgements 2<br />
1. Summary 3<br />
Key Findings......................................................................................................................................6<br />
2. Introduction and the Four Scenarios 8<br />
Need to Focus on Energy Corrected Milk .........................................................................................8<br />
<strong>The</strong> Four Scenarios ..........................................................................................................................9<br />
New Features in the SOG Calculator Version 1.2 ..........................................................................12<br />
3. Impacts of Alternative Systems on Waste Generation and Methane Emissions 14<br />
Waste Generation on Dairy Farms ................................................................................................15<br />
4. Key Findings and Conclusions 18<br />
Methane Emissions per Unit of MIlk Production..............................................................................18<br />
Options to Reduce Methane Emissions..........................................................................................21<br />
References and Resources 23<br />
Appendix A. Basis for and Sources of Key SOG Version 1.2<br />
Variables and Equations 26
<strong>The</strong> <strong>Organic</strong> <strong>Center</strong> Critical Issue <strong>Report</strong> Page<br />
August 2012 A Deeper Shade of Green 1<br />
Preface<br />
All published life-cycle assessments of dairy farms conclude that methane accounts for the largest share of total<br />
greenhouse gas (GHG) emissions associated with milk production. This is particularly true on large-scale dairy operations<br />
using freestall barns in combination with a liquid-based manure management system. Across the dairy industry, the<br />
search is on for options to reduce methane emissions via changes in a variety of on-farm management practices.<br />
<strong>The</strong> conventional dairy industry is focusing on changes in diets and animal nutrition, rumen function, genetics, and herd<br />
structure through, among other things, the “Cow of the Future” project, with the goal of reducing methane emissions by<br />
25% by 2020 (Knapp et al., 2011).<br />
Three factors most reliably distinguish organic from conventional dairy farms – degree of reliance on pasture, cow<br />
longevity, and average daily milk production levels. <strong>The</strong> fi rst two are generally greater on organic farms, and the third<br />
is greater on most conventional farms. Enhancing cow health and longevity and expanding reliance on pasture are not<br />
among the priority options under review by scientists working to reduce methane emissions on conventional dairy farms.<br />
In this report, we quantify the degree to which milk production and cow longevity, reliance on pasture, and manure<br />
management systems infl uence the methane emissions associated with a gallon of conventional versus organic milk.<br />
In November 2010, we released our fi rst report on the environmental footprint of dairy farm management systems, based<br />
on results from the “Shades of Green” (SOG) calculator. A Dairy Farm’s Footprint: Evaluating the Impacts of Conventional<br />
and <strong>Organic</strong> Farming Systems compared and contrasted the performance of four hypothetical farms – two conventional<br />
and two organic. <strong>The</strong> 2010 report, the SOG calculator, and a 92-page Shades of Green Users Manual: Guide and<br />
Documentation for a Dairy Farm Management System Calculator are accessible on the <strong>Center</strong>’s website at www.organiccenter.org/SOG,<br />
as is this report and application of SOG.<br />
In 2011 we completed several refi nements in the SOG calculator and used it to evaluate the performance of two wellmanaged<br />
grass-based organic dairy farms compared to a typical, high-production conventional farm and a dairy farm set<br />
up and managed to minimize methane emissions per unit of milk produced. Our goal was to explore how organic dairy<br />
farms that place heavy emphasis on grazing and cow health might contribute in the quest to reduce net dairy industry<br />
GHG emissions. <strong>The</strong> results are compelling and will hopefully broaden the list of management options considered in the<br />
ongoing effort to lighten the environmental footprint of milk production.<br />
Charles Benbrook<br />
Chief Scientist<br />
<strong>The</strong> <strong>Organic</strong> <strong>Center</strong>
<strong>The</strong> <strong>Organic</strong> <strong>Center</strong> Critical Issue <strong>Report</strong> Page<br />
August 2012 A Deeper Shade of Green 2<br />
Acknowledgements<br />
<strong>The</strong> <strong>Center</strong> wishes to acknowledge the team of dairy scientists, industry specialists, and researchers that have<br />
worked with the <strong>Center</strong> in developing, refining, and applying the “Shades of Green” calculator:<br />
Cory Carman, Carman Ranch, Wallowa, Oregon<br />
E. Ann Clark, farmer, formerly Associate Professor, Plant Agriculture, University of Guelph<br />
Cindy Daley, Professor, College of Agriculture, Chico State University, Chico, California<br />
Wendy Fulwider, Animal Welfare Specialist, <strong>Organic</strong> Valley, LaFarge, Wisconsin<br />
Michael Hansen, Consumer Policy Institute, Consumers Union, Yonkers, New York<br />
Carlo Leiffert, Director, Food, Quality, and Heath Network, University of Newcastle, Newcastle, U.K.<br />
Klaas Martens, Klaas and Mary Howell Martens Farm and Lakeview <strong>Organic</strong> Grain, Penn Yan, New York<br />
Laura Paine, Wisconsin Department of Agriculture, Trade, and Consumer Protection, Madison, Wisconsin<br />
Lisa Petkewitz, Landsingburgh Veterinarian Hospital, Albany, New York<br />
Guy Jodarski, Veterinarian, <strong>Organic</strong> Valley, Neillsville, Wisconsin<br />
Francis Thicke, Radiance Dairy, Fairfield, Iowa<br />
Juan Velez, VP Farm Operations, Aurora <strong>Organic</strong> Dairy, Boulder, Colorado<br />
Gary Wegner, CIRCUL8 Systems, Reardan, Washington<br />
Creation of the SOG calculator was made possible by a generous grant from the Packard Foundation. In addition,<br />
special thanks to Stonyfield Farm, Horizon <strong>Organic</strong> and WhiteWave Foods, Aurora <strong>Organic</strong> Dairy, and<br />
<strong>Organic</strong> Valley for both financial support and technical assistance as this project has unfolded.<br />
We also wish to thank Jon Bansen, Double J Jerseys Farm, and Ward and Rosy Burroughs, California Clover Leaf<br />
Farms, for providing the detailed production and farm management records needed to run their farm operations<br />
through the “Shades of Green” calculator.
<strong>The</strong> <strong>Organic</strong> <strong>Center</strong> Critical Issue <strong>Report</strong> Page<br />
August 2012 A Deeper Shade of Green 3<br />
1. Summary<br />
Tremendous progress has been made in our understanding<br />
of the physiological processes, management practices, and<br />
biological interactions that determine the nutritional quality<br />
and safety of milk and dairy products. Incrementally more<br />
sophisticated life-cycle assessments are being conducted,<br />
helping to sharpen understanding of those aspects of dairy<br />
farm management that contribute most signifi cantly, or<br />
only marginally, to farm production, animal well being, and<br />
greenhouse gas emissions.<br />
<strong>Organic</strong> and conventional dairy farms differ in many ways,<br />
from detailed aspects of animal care and input use, to the<br />
preferred breed of cow and how animals are fed. But at<br />
40,000 feet, three factors most reliably distinguish an organic<br />
dairy operation from a conventionally managed one – the<br />
degree of reliance on pasture, cow health and longevity, and<br />
average daily milk production levels.<br />
udder health and keeping somatic cell counts down, while<br />
minimizing waste generation, the risk of water pollution, and<br />
greenhouse gas emissions. Across the industry, the search<br />
is on for dairy farm management system changes that can<br />
improve the triple bottom line – increasing or sustaining<br />
production, assuring adequate profi ts, and protecting the<br />
environment.<br />
One way to gauge what might be possible in the future is to<br />
compare the performance of contemporary, well-managed<br />
farms utilizing different systems and strategies. Herein lays<br />
the idea behind this report. <strong>The</strong> two grazing-based organic<br />
farms included in this study are not intended to represent all<br />
organic farms, or even the average west-coast grass-based<br />
organic dairy. <strong>The</strong>y simply are two long-established, wellmanaged<br />
farms whose performance helps quantify what is<br />
possible on such farms in terms of production, cow health,<br />
inputs, wastes, and environmental impacts.<br />
Likewise, the conventional farm included in the study is<br />
not intended to represent any specifi c farm, but instead<br />
is included in this study to establish a baseline for key<br />
performance parameters. <strong>The</strong> characteristics of the farm<br />
modeled in Scenario 4 are, in fact, in close alignment to<br />
those typically found on today’s well-managed, large-scale<br />
dairies with freestall barns.<br />
A Dairy Cow’s Unique Ability<br />
<strong>Organic</strong> farms rely heavily on pasture for several months<br />
every year, while most conventional dairies do so hardly at<br />
all. Cows tend to live longer and milk through more lactations<br />
on organic farms. But cows on conventional farms produce<br />
much more milk per day, albeit milk of lower quality in terms<br />
of protein and fat content.<br />
Whether organic or conventional, all dairy farmers face<br />
common challenges and threats, like keeping feed costs<br />
down, improving cow reproductive performance, promoting<br />
Dairy cows have a special talent – the ability to convert<br />
grasses, legumes and other plant-based feeds into milk,<br />
one of our most satisfying, nutritious foods. Millions of<br />
microorganisms do the heavy lifting in the rumen of cattle as<br />
feedstuffs like pasture grasses, alfalfa hay, grains, and silage<br />
are broken down and converted into forms that cows can<br />
utilize to drive their metabolism, grow a calf while pregnant,<br />
and make milk.<br />
Microorganisms in a cow’s four stomach compartments<br />
both live off the feed passing through the animal’s digestive<br />
system and help break it down so that the nutrients and<br />
energy contained in the plant matter become available to<br />
support the cow’s own functions.
<strong>The</strong> <strong>Organic</strong> <strong>Center</strong> Critical Issue <strong>Report</strong> Page<br />
August 2012 A Deeper Shade of Green 4<br />
Methane gas is an unavoidable byproduct of the microbedriven<br />
mayhem underway in a cow’s digestive system. To<br />
prevent bloating, the cow must rid herself of GI tract gases<br />
via belching and, to a much lesser extent, farting. <strong>The</strong>se<br />
natural processes lead to what scientists call “enteric<br />
methane emissions.”<br />
Additional methane can be emitted to the atmosphere from<br />
cow manure, when it is managed in anaerobic (without<br />
oxygen) conditions. This so-called “manure methane” is<br />
not emitted by the cow, but can be produced by a littleknown<br />
life form, archaea microorganisms. <strong>The</strong>se microbes<br />
produce methane when and as they break down carbon in<br />
cow manure, but they thrive only in the absence of oxygen.<br />
For example, archaea do well in the lagoons on dairy farms<br />
containing the wash water used to fl ush animal wastes from<br />
freestall barns and milking parlors. Stagnant conditions in<br />
dairy farm lagoons are, in fact, ideal for methane production.<br />
This is why manure methane emissions on dairy farms<br />
are driven largely by the portion of manure managed in<br />
anaerobic lagoon systems. Manure deposited by cows, or<br />
spread by farmers, on fi elds and pastures, or manure that is<br />
stockpiled and composted, does not contribute signifi cantly<br />
to manure methane emissions, especially compared to<br />
anaerobic lagoons.<br />
Lagoons that are circulated can reduce manure methane<br />
losses. Some circulation and aeration systems keep lagoons<br />
essentially free of archaea, thereby preventing manure<br />
methane formation and release. <strong>The</strong> key is to expose water<br />
in lagoons to oxygen, creating an environment that favors<br />
phototrophic bacteria over microbes that produce methane,<br />
ammonia and hydrogen sulfi de.<br />
Once enteric methane is emitted, it becomes a part of the<br />
dairy farm’s contribution to greenhouse gases, and there<br />
is relatively little farmers can do to alter enteric methane<br />
emissions per unit of milk produced. But farmers do exercise<br />
considerable control over the production and loss of manure<br />
methane. Hence, grazing and manure management<br />
practices are one of the major factors driving net GHG<br />
emissions from dairy farms.<br />
Competing Paths to Reduce Methane Emissions<br />
<strong>The</strong> dairy industry is focused on reducing methane emissions<br />
for good reason -- methane is 25-times more potent than CO 2<br />
in terms of global warming potential (GWP). This is why the<br />
dairy industry has adopted the goal of reducing enteric and total<br />
methane emissions 25% by 2020 (Knapp et al., 2011). Most<br />
life cycle assessments of dairy farms conclude that methane<br />
emissions account for the single largest portion of GWP, with<br />
nitrous oxide emissions associated with corn production being<br />
the next largest contributor to GWP on most dairy farms feeding<br />
a corn-based ration (i.e., most dairy farms).<br />
<strong>The</strong>re is a diversity of views regarding the best way to reduce<br />
dairy-farm methane emissions. One set of changes under study<br />
strives to fine-tune current, conventional management systems,<br />
without making significant changes in animal genetics, feed
<strong>The</strong> <strong>Organic</strong> <strong>Center</strong> Critical Issue <strong>Report</strong> Page<br />
August 2012 A Deeper Shade of Green 5<br />
rations, or barn and manure management systems. Another<br />
set of options entail capturing and recycling methane and other<br />
GHGs in manure and urine via digesters that convert the carbon<br />
and nutrients in animal wastes into electricity or liquid fuels.<br />
A third set of strategies are being pursued by organic dairy<br />
farmers and milk processing companies:<br />
• Improving a cow’s ability to effi ciently utilize foragebased<br />
feeds,<br />
• Promoting cow health and longevity and enhancing<br />
the nutritional quality of milk, and<br />
• Capturing and sequestering more methane and CO 2<br />
in the soil through advances in manure, pasture, crop,<br />
and range management.<br />
In this report, we use the “Shades of Green” (SOG) dairy<br />
farm calculator to quantify total methane emissions per unit<br />
of milk production on four well-managed, but very different<br />
dairy farms. Each farm is modeled as one of four scenarios<br />
within the SOG calculator. <strong>The</strong> fi rst scenario refl ects the<br />
2010 production year on the Double J Jerseys Farm in<br />
Monmouth, Oregon managed by the Bansen family. <strong>The</strong><br />
herd is composed of Jersey cows producing, on average,<br />
40.5 pounds of unadjusted milk per day. This organic farm<br />
makes heavy use of high-quality, home-grown pasture and<br />
forages year round, and cows are managed to minimize<br />
stress and disease and maximize health and longevity.<br />
In the race of the tortoise and hare, the animals on the<br />
Double J Jerseys Farm are akin to the tortoise, whereas<br />
high-production Holstein cows (Scenario 4) are more like<br />
hares.<br />
Scenario 2 covers cows on the California Cloverleaf Farm<br />
(CCF), another organic, grazing-based operation that milks<br />
crossbred and Jersey cattle. Unadjusted milk production is<br />
41.5 pounds per day, and the animals are milked seasonally<br />
(i.e., all cows are dried up in early winter, so no milk is<br />
produced in the middle of winter). A premium is placed on<br />
cow hardiness and health through heavy reliance on pasture<br />
and high-quality forage-based feeds.<br />
Scenario 3 represents a hypothetical organic farm designed<br />
and managed to minimize methane emissions per unit of<br />
milk production. Crossbred cattle are moderately reliant on<br />
high-quality forages, grain, and protein supplements, such<br />
that milk production levels are about 50% higher than on<br />
the two, grass-based organic farms. Manure is managed to<br />
minimize manure-methane emissions.<br />
Scenario 4 refl ects the average performance of a large,<br />
conventional dairy farm with Holstein cows administered<br />
rbST (bovine growth hormone) to boost milk production, a<br />
freestall barn, and a nutrition program based year-round<br />
on a “Total Mixed Ration” (TMR). <strong>The</strong> paramters in this<br />
scenario are taken, to the full extent possible, from the<br />
results of a national survey of the dairy industry carried out<br />
by the USDA’s National Animal Health Monitoring Service<br />
(NAHMS, 2007). Unadjusted average daily milk production<br />
is 73.4 pounds per cow. Cows spend their time mostly on<br />
concrete or on bedding packs in freestall barns, with little or<br />
no access to pasture. Manure and urine are fl ushed out of<br />
the barn daily with water, which is collected and stored in an<br />
anaerobic lagoon system.<br />
ABOUT SHADES OF GREEN (SOG)<br />
<strong>The</strong> SOG calculator projects the impacts<br />
of dairy farm management practices<br />
on several indicators of dairy farm<br />
performance: milk and meat production,<br />
feedstuffs required, crop production<br />
inputs, cow health and longevity,<br />
several measures of milk production,<br />
environmental performance, and gross<br />
revenues. It is designed to compare the<br />
environmental footprint of dairy operations<br />
under four scenarios that can differ in one,<br />
a few, or many parameters.<br />
Unlike other models and studies, SOG<br />
takes into account the many impacts of<br />
dairy farm management on animal health,<br />
reproductive performance, and cow<br />
longevity, as well as fi nancial performance.<br />
<strong>The</strong> structure and equations in the<br />
SOG calculator are fully explained and<br />
referenced in a user-manual document<br />
(Benbrook et al., 2010; accessible free at<br />
www.organic-center.org/SOG). Results<br />
are reported in several different ways to<br />
facilitate comparisons with other models<br />
and studies.
<strong>The</strong> <strong>Organic</strong> <strong>Center</strong> Critical Issue <strong>Report</strong> Page<br />
August 2012 A Deeper Shade of Green 6<br />
KEY FINDINGS<br />
<strong>The</strong> “Cow of the Future” project strives to reduce enteric<br />
methane emissions by 25% by 2020, while other projects<br />
are focused on achieving comparable reductions in manure<br />
methane emissions. <strong>The</strong> dairy scientists carrying out the<br />
“Cow of the Future” project anticipate that existing, proven<br />
technologies, coupled with genetic improvement, will reduce<br />
emissions by 10% to 12%. Hence, new technology will be<br />
needed to reduce emissions the additional 13% to 15% in<br />
order to reach the 25% goal.<br />
Using standard organic dairy farm management practices,<br />
the grass-based farms in Scenarios 1 and 2 cut methane<br />
emissions per unit milk by 20% and 40% compared to the<br />
level of emissions on a conventional dairy farm like the<br />
one modeled in Scenario 4. Hence, grass-based organic<br />
dairy farms clearly have something to offer the whole dairy<br />
industry as it strives to reduce GHG emissions per unit of<br />
milk produced.<br />
Virtually all studies comparing dairy farm performance<br />
across cattle breeds and farm types focus on differences<br />
in “Energy Corrected Milk” (ECM), a measure of production<br />
that takes into account differences in milk nutritional quality<br />
(and specifi cally, differences in fat and protein content).<br />
Signifi cant bias in results can arise from failure to take<br />
milk nutritional differences into account when comparing<br />
farms that are milking Jerseys or crossbreed cattle, versus<br />
Holsteins.<br />
<strong>The</strong> SOG model reports production both on the basis of<br />
unadjusted and energy corrected milk. While the Jersey<br />
cows on the Double J Jerseys Farm produce about one-half<br />
the volume of unadjusted milk compared to the Holsteins<br />
in Scenario 4, the Jersey milk is much richer. <strong>The</strong> higher<br />
fat and protein content results in ECM production of 49.8<br />
pounds per day (22.6 kg/day), compared to unadjusted milk<br />
production of 40.2 pounds/day (18.4 kg/day).<br />
This milk-quality-driven 23% increase in milk production<br />
reduces total methane emissions per pound or kilogram of<br />
milk by 23%.<br />
In addition, the seasonal grass-based California Clover<br />
Leaf Farm (CCLF) performs very well compared to the<br />
hypothetical, methane-reducing farm in Scenario 3. <strong>The</strong><br />
hypothetical farm in Scenario 3 reduces total methane per<br />
unit of ECM milk by 49% compared to the Scenario 4 farm,<br />
while the CCLF achieves a 40% reduction.<br />
Cow longevity is the other factor that improves the<br />
performance of the grass-based organic dairies compared<br />
to the conventionally managed cows in Scenario 4. In<br />
general, as cows are pushed to produce more milk per day,<br />
they are placed under incrementally more stress, even on<br />
well-managed farms. Reproductive performance and the<br />
number of breeding attempts needed for a cow to give<br />
birth to a calf can suffer, especially when climatic or other<br />
factors add to stress levels. This is why the lactating cows<br />
in Scenario 4 require, on average, 2.5 breeding attempts per<br />
calf carried to term, compared to 1.5 to 1.8 attempts on the<br />
two grass-based organic dairies.<br />
Problems getting cows to rebreed on high-production farms<br />
lead to longer lactations, extended calving intervals (the time<br />
period between the end of one lactation and the beginning<br />
of the next), fewer lactations in a productive life, and shorter<br />
lifespans. Cows milk through 6.3 lactations on average on<br />
the Bansen farm modeled in Scenario 1 and live to be 8.5<br />
years old. In Scenario 4, cows milk through just 2.3 lactations<br />
on average and live to be just 4.3 years old.<br />
This signifi cant difference in longevity has a big impact on<br />
methane and GHG emissions per unit of milk produced<br />
over an animal’s life because of the signifi cant feed inputs,<br />
wastes generated, and GHG emissions generated in the fi rst<br />
two years of a cow’s life, prior to the birth of her fi rst calf.<br />
On Scenario 4 farms, this upfront, two-year investment in
<strong>The</strong> <strong>Organic</strong> <strong>Center</strong> Critical Issue <strong>Report</strong> Page<br />
August 2012 A Deeper Shade of Green 7<br />
feed and the wastes generated are, in effect, amortized over<br />
just 2.3 lactations, while on a grass-based organic dairy like<br />
the one in Scenario 1, the feed and wastes generated are<br />
amortized over 6.3 lactations.<br />
If unadjusted milk production per day, or total methane per<br />
unit of milk produced in a single year determined the winner<br />
in the race between the tortoise and the hare, the largebodied,<br />
productive Holsteins modeled in Scenario 4 would<br />
win most of the time by a comfortable, 10% to 20% margin.<br />
But if minimizing methane emissions and GHG emissions<br />
per unit of energy corrected milk produced over a cow’s<br />
lifetime determined the winner, the tortoise-like Jersey and<br />
crossbred cows on farms like those modeled in Scenarios<br />
1 and 2 would win most of the time, and by an even more<br />
comfortable margin.<br />
Economic Performance and Land Use<br />
In terms of total milk and meat income per cow per year of<br />
life, the two grazing-based organic farms equal or exceed<br />
the performance of the Scenario 4 farm. <strong>The</strong> organic milk<br />
price premium is obviously the major factor accounting for<br />
this fi nding.<br />
This version of SOG does not calculate the costs of feed<br />
and other management inputs. It is worth noting that<br />
organic dairy farms have to pay substantially more for feed,<br />
compared to conventional dairy operations. But grazingbased<br />
farms minimize the need for either home-grown or<br />
purchased grain and protein supplement feeds, and hence<br />
are insulated to a large degree from the sometimes dramatic<br />
spikes in the price of organic feed.<br />
<strong>The</strong> smaller, thriftier cattle on the two organic, grazingbased<br />
farms require 3.08 and 3.5 acres to produce the feed<br />
needed to sustain a milking cow, while on the Scenario 3 and<br />
4 farms, about 1.0 acre more cropland is needed to sustain<br />
the larger animals and higher levels of production.<br />
Not only do grazing-based farms require less land to sustain<br />
a cow, they also need fewer acres of highly productive,<br />
relatively fl at prime cropland. SOG projects that 58% of the<br />
3.08 acres needed to sustain a Jersey cow on the Scenario<br />
1 farm would likely be, on average, high-quality prime land,<br />
while 42% could be rolling, less productive grazing land<br />
most suitable for grass production usually because of the<br />
risk of soil erosion.<br />
On the Scenario 4 farm however, 77% of the land required<br />
to produce the feed for a lactating cow would likely be prime<br />
cropland in light of the heavy reliance on corn, soybeans,<br />
and alfalfa hay in the overall ration on that farm.<br />
Three key environmental benefi ts are inherently linked<br />
to grazing. <strong>The</strong> solid mat of grasses and legumes in a<br />
pasture protect the land’s surface from the erosive potential<br />
of rainfall, reducing erosion in most cases to below 1.0 ton<br />
per acre from 10-50 tons in the case of cultivated, sloping<br />
lands.<br />
Grazing contributes to water quality by reducing the volume<br />
of runoff from cropland and pastures used to produce<br />
feed for dairy aniimals, as well as the levels of sediment,<br />
fertilizers, and agricultural chemicals in runoff. Wellmanaged<br />
pastures on dairy farms essentially eliminate<br />
the fl ow of fertilizers, chemicals, and sediment into nearby<br />
water bodies.<br />
Pasture also contributes dramatically to reducing the<br />
net greenhouse gas emissions from a dairy farm. It<br />
does this directly, by reducing the loss of manure<br />
methane, and indirectly by reducing reliance on corn<br />
in cow rations. <strong>The</strong> production of corn is generally<br />
regarded as the second most significant source of<br />
net GHG emissions associated with milk production,<br />
because of the relatively high losses of nitrous oxide<br />
from cornfields.<br />
But grazing has an additional, highly significant<br />
benefit – it builds soil organic matter levels, thereby<br />
sequestering tons of carbon from the atmosphere. A<br />
recent study by USDA scientists concluded that wellmanaged<br />
pasture can sequester 3,400 pounds of carbon<br />
per acre per year, compared to using the same land for<br />
row crop production (Perry, 2011). If sustained over<br />
several years, soil carbon sequestration can increase<br />
the organic matter content of pasture soils from 1% to<br />
3% to 4% to 6%, increases with enormously positive<br />
consequences for land productivity, water quality, and<br />
agriculture’s contribution to global warming.
<strong>The</strong> <strong>Organic</strong> <strong>Center</strong> Critical Issue <strong>Report</strong> Page<br />
August 2012 A Deeper Shade of Green 8<br />
2. Introduction and <strong>The</strong> Four Scenarios<br />
Many studies have either directly measured or projected the<br />
environmental footprint of dairy farms. A widely debated<br />
2008 study concluded that high-production, input-intensive<br />
dairy farm management systems have a lighter footprint<br />
than organic dairy farms (Capper et al., 2008), while other<br />
studies have reached the opposite conclusion (Benbrook et<br />
al., 2010; Haas et al., 2001; Arsenault et al., 2009).<br />
<strong>The</strong> different results reached by past efforts to model dairy<br />
farm environmental performance result from how researchers<br />
draw boundaries around the factors or variables included<br />
and excluded in the analysis, how results are measured<br />
and reported, the time period studied, and decisions<br />
regarding the best equations and input values to use in<br />
model simulations. In addition, several core scientifi c issues<br />
are unsettled, like the impact of cow health, grazing and<br />
forage quality on methane emissions. A major greenhouse<br />
gas study released in 2006 by the Food and Agriculture<br />
Organization (FAO) of the U.N. concluded that livestock<br />
accounted for as much as 18% of global greenhouse gas<br />
emissions (Steinfeld et al., 2006). Recent work argues that<br />
the true fi gure is closer to 3% (Pitesky et al., 2009).<br />
NEED TO FOCUS ON ENERGY CORRECTED<br />
MILK<br />
Dairy industry advertising repeatedly asserts that “milk is<br />
milk,” a claim that is actually not supported by well-known<br />
facts. <strong>The</strong> nutritional quality of milk varies signifi cantly<br />
as a result of differences in the levels of fat, protein,<br />
antioxidants, and heart-healthy fats including conjugated<br />
linoleic acid (CLA) and omega 3 fatty acids (Butler et al.,<br />
2008; Ellis et al., 2006; O’Donnell et al., 2010). Many dairy<br />
farmers receive premiums for milk that is richer in fat and<br />
protein.<br />
Certain breeds of cattle, like Jerseys, produce less milk<br />
per day, but richer milk that has much higher levels of<br />
fat, protein, CLAs, and omega 3s. Dairy cows on pasture<br />
produce more nutrient-dense milk with elevated hearthealthy<br />
fats (Butler et al., 2009). Nutrient levels (i.e.,<br />
concentrations) in milk generally decline as cows are<br />
managed intensively to produce at levels near their<br />
genetic potential.
<strong>The</strong> <strong>Organic</strong> <strong>Center</strong> Critical Issue <strong>Report</strong> Page<br />
August 2012 A Deeper Shade of Green 9<br />
To account for fat- and protein-related differences in milk<br />
nutritional quality, dairy scientists typically calculate what<br />
is known as “Energy Corrected Milk” (ECM). <strong>The</strong> standard<br />
formula for estimating ECM uses three variables: unadjusted<br />
milk production per day, fat content, and protein content.<br />
Energy corrected milk is used by dairy scientists as the<br />
basic measure of milk production when comparing cow or<br />
dairy farm performance. It is also the appropriate and most<br />
unbiased metric of production when comparing a cow’s or<br />
farm’s environmental footprint per unit of milk produced. It<br />
is especially important to use ECM instead of unadjusted<br />
milk when comparing performance on high-production farms<br />
milking Holsteins, in contrast to low- or moderate-production<br />
farms milking Jerseys or crossbreed cattle.<br />
Table 2.1 drives this point home. Unadjusted milk and ECM<br />
production levels across the four scenarios are shown.<br />
<strong>The</strong> Holstein dairy cows on conventional farms like those<br />
modeled in Scenario 4 produce 86% more unadjusted milk<br />
on a daily basis than the Jerseys in Scenario 1, but only 48%<br />
more in terms of Energy Corrected Milk.<br />
Scenario 1 refl ects the 2010 production year on the Double J<br />
Jerseys Farm in Monmouth, Oregon managed by the Bansen<br />
family. <strong>The</strong> herd is composed of Jersey cows producing,<br />
on average, 40.5 pounds of unadjusted milk per day over<br />
lactations spanning 333 days. <strong>The</strong> farm makes heavy use of<br />
high-quality pasture and forages year round. <strong>The</strong> cows are<br />
fed limited grain in the summer months (6% of “Dry Matter<br />
Intake,” or DMI), rising to 10% of DMI in the winter. <strong>The</strong> farm<br />
places a premium on cow health and longevity and manages<br />
the animals to minimize stress and disease pressure.<br />
Scenario 2 models the 2010 performance of the California<br />
Cloverleaf Farm (CCF), another grazing-based operation<br />
that milks mostly crossbred and Jersey cattle seasonally.<br />
Unadjusted milk production is 41.5 pounds per day over<br />
lactations lasting 321.5 days. Grain accounts for 16% to<br />
22% of DMI with forages accounting for most of the rest of<br />
the animal’s rations.<br />
<strong>The</strong> seasonal milking schedule has several impacts on<br />
the performance of the farm and age structure of the herd,<br />
since cows that do not breed in the desired window are<br />
Table 2.1 Unadjusted and Energy Corrected Milk (ECM) Production per Day and<br />
Milk Fat and Protein Levels<br />
Scenario 1<br />
Double J Jerseys<br />
Scenario 2<br />
CA Cloverleaf<br />
Farms<br />
Scenario 3<br />
Reduce Methane<br />
Emissions<br />
Scenario 4<br />
Typical<br />
High-Production<br />
Conventional<br />
Unadjusted Milk<br />
Production Pounds per Day<br />
40.5 41.5 65 73.4<br />
Milk Fat 5.02% 4.34% 4.0% 3.6%<br />
Milk Protein 3.7% 3.65% 3.4% 3.1%<br />
ECM Pounds per Day 49.8 47.3 70.1 73.8<br />
THE FOUR SCENARIOS<br />
<strong>The</strong> current application of the SOG calculator includes two<br />
grass-based organic dairy farms, a hypothetical organic dairy<br />
farm designed and managed to minimize methane emissions<br />
per unit of milk produced, and a typical high-production, largescale<br />
conventional dairy operation. <strong>The</strong> key characteristics of<br />
each farm are described below and captured in Table 2.2. <strong>Full</strong><br />
details on the four scenarios are accessible in the “Bansen-<br />
Burroughs SOG Application” accessible via the <strong>Center</strong>’s<br />
website www.organic-center.org/SOG.<br />
often culled. Most of the manure produced annually is<br />
deposited on pastures, since over the winter months, the<br />
herd is dried up and managed outside on pasture. Much<br />
like the Double J Jerseys Farm, CCF places an emphasis<br />
on cow hardiness and health through heavy reliance on<br />
pasture and high-quality forage-based feeds.<br />
Scenario 3 represents a hypothetical farm designed and<br />
managed to minimize methane emissions per unit of milk
<strong>The</strong> <strong>Organic</strong> <strong>Center</strong> Critical Issue <strong>Report</strong> Page<br />
August 2012 A Deeper Shade of Green 10<br />
production. Crossbred cattle are milked year-round and<br />
are heavily reliant on high quality forages, but not to the<br />
degree present on the Scenario 1 pasture-based farm.<br />
Grain accounts for 14% to 19% of DMI, and concentrates<br />
add another 3% to 4%. <strong>The</strong> greater reliance on energydense<br />
feedstuffs supports a higher level of unadjusted milk<br />
production – 65 pounds per day over lactations averaging<br />
340.5 days. Solid manure is collected and composted prior<br />
to fi eld application, a management method that minimizes<br />
manure-methane emissions.<br />
Scenario 4 captures the performance of a typical, highproduction,<br />
conventional dairy farm with Holstein cows, a<br />
freestall barn, and a nutrition program based on a “Total<br />
Mixed Ration” (TMR). To the extent possible, the parameters<br />
in Scenario 4 are derived from the latest USDA survey of<br />
the dairy industry carried out by the National Animal Health<br />
Monitoring Service (NAHMS, 2007), and refl ect data<br />
reported for large farms with 500 or more cows. Unadjusted<br />
average daily milk production is 73.4 pounds per cow over<br />
lactations lasting, on average, 345 days. <strong>The</strong> productionenhancing<br />
hormone rbST is administered to sustain the<br />
relatively high levels of milk production over extended<br />
lactations.<br />
<strong>The</strong> longer than average lactations are brought about by<br />
greater difficulty in rebreeding cows on high production farms,<br />
many of which use hormone injections to help synchronize<br />
heat cycles and increase the success rate of each breeding<br />
attempt. Extended periods of negative energy balance<br />
also increases the frequency of embryonic losses and<br />
spontaneous abortions, leading to the need to rebreed cows,<br />
as well as much higher involuntary cull and death rates than<br />
on the lower-production, pasture-based farms.
<strong>The</strong> <strong>Organic</strong> <strong>Center</strong> Critical Issue <strong>Report</strong> Page<br />
August 2012 A Deeper Shade of Green 11<br />
Table 2.2 Key Parameters in the Reducing Methane and Nitrogen Losses Application of<br />
the “Shades of Green” Calculator [see notes]<br />
Herd Profile<br />
Scenario 1<br />
Double J Jerseys<br />
Scenario 2<br />
CA Cloverleaf<br />
Farms<br />
Scenario 3<br />
Reduce Methane<br />
Emissions<br />
Scenario 4<br />
Typical<br />
High-Production<br />
Conventional<br />
Breed Jersey Crossbreed Crossbreed Holstein<br />
Longevity<br />
Involuntary Cull Rate 9% 10% 15.5% 21.2%<br />
Voluntary Cull Rate 17% 15% 14% 11.7%<br />
Death + Downer Rate 2.7% 3% 2.5% 6.1%<br />
Replacement Rate 28.7% 28% 32% 39%<br />
Among Cows Spending <strong>Full</strong> Productive<br />
Life on the Farm --<br />
Number of Lactations 6.3 3.7 4.8 2.3<br />
Average Lifespan (years) 8.5 5.6 7 4.3<br />
Lactation Profile<br />
Unadjusted Milk Production 40.5 41.5 65 73.4<br />
Energy Corrected Milk (ECM)* 49.8 47.3 70.1 73.8<br />
Length of Lactation 330 321 340.5 345<br />
Reproductive Performance<br />
Number of Breedings per Calf 1.8 1.5 2 2.5<br />
Days Between Breeding Attempts 37.5 36.5 37.5 42.3<br />
Calving Interval 383 371 391 403<br />
Lactating Cow Ration<br />
Percent of Dry Matter Intake from --<br />
Pasture 65% 66% 37% 1%<br />
All Forages (includes corn silage) 92% 78% 80% 60%<br />
Grain 8% 19% 17% 26%<br />
Protein Supplements 0% 3% 3% 14%<br />
NOTE: * “Energy corrected milk” takes into account differences in milk nutritional quality when comparing levels of production across farms or<br />
as a function of farming systems. <strong>The</strong> standard equation used to calculate ECM is based on unadjusted milk production, and the fat and protein<br />
content of the milk.
<strong>The</strong> <strong>Organic</strong> <strong>Center</strong> Critical Issue <strong>Report</strong> Page<br />
August 2012 A Deeper Shade of Green 12<br />
NEW FEATURES IN THE SOG CALCULATOR VERSION 1.2<br />
SOG Version 1.1 was used in the original application of the<br />
calculator to four hypothetical dairy farms. <strong>The</strong> results are<br />
reported in the November 2010 report A Dairy Farm’s Footprint:<br />
Evaluating the Impacts of Conventional and <strong>Organic</strong> Farming<br />
Systems (Benbrook et al., 2010). <strong>The</strong> current application has<br />
been made in SOG Version 1.2.<br />
Several steps in the calculator were either slightly modified or<br />
explained more clearly in Version 1.2. <strong>The</strong> order of several<br />
steps and worksheets has been changed. During the course<br />
of adding data on the Bansen and Burroughs farms into SOG,<br />
it became clear that one aspect of the calculator was producing<br />
results that did not accurately reflect cow longevity.<br />
In Version 1.1 there were two options to record the average age<br />
of cows at the end of their productive life. <strong>The</strong> user could report<br />
this data, if known from farm records, or SOG would calculate<br />
the age based on other parameters already entered in the<br />
model including:<br />
• Age of cow at fi rst breeding;<br />
• Breeding success rates and the days between breeding<br />
attempts;<br />
• <strong>The</strong> length of the gestation period;<br />
• Average length of lactations and dry-off periods;<br />
• Calving intervals; and<br />
• Average number of lactations.<br />
From one dairy farm to the next, the key variables driving a<br />
cow’s age at the end of its life are the calving interval and<br />
number of calves born, and hence the number of lactations.<br />
<strong>The</strong> calving interval is simply the average length of lactation<br />
plus the dry-off period.<br />
Double J Jerseys Farm records on the lactating cows<br />
currently on the farm were used to calculate the herd’s<br />
average number of lactations. <strong>The</strong> result was 3.2 lactations.<br />
As a measure of cow longevity, this number is biased<br />
downward because of the criteria and process used on the<br />
farm for voluntarily culling lactating cows.<br />
Each year a signifi cant surplus of heifer calves are born<br />
on the Double J Jerseys Farm. Since the farm is at steady<br />
state in terms of cow numbers, the surplus of heifer calves must<br />
either be sold off the farm or added to the herd of lactating cows.<br />
In any given year, the Bansens select the number of high-quality<br />
replacement heifers that have been raised to weaning age.<br />
<strong>The</strong>y next determine the number of freshening heifers needed<br />
to replace cows that died or became downers, or were culled<br />
involuntarily because of production or health issues. <strong>The</strong>y<br />
subtract the latter number from the former, and this produces an<br />
estimate of the number of high-quality, but still surplus heifers in<br />
the herd.<br />
<strong>The</strong>se surplus animals can either be sold as calves to other dairy<br />
farmers, or moved into the milking herd, resulting in the need to<br />
voluntarily cull and sell a healthy milking cow, which are typically<br />
purchased by other farmers and kept in production. When<br />
faced with the need to sell a mature, lactating cow, the Bansen’s<br />
maximize the sale value of the animal by picking from those in<br />
their third or fourth lactation. And so, in most years a half-dozen<br />
to a dozen healthy lactating cows are sold to other dairy farms to<br />
make room for genetically promising first-calf heifers. When the<br />
average number of lactations per cow on the farm at any given<br />
time is calculated, there are several dozen additional younger<br />
animals in the milking herd in their first, second, or third lactation<br />
than would be the case if the Bansens decided to sell all surplus<br />
heifers at weaning.<br />
In order to remove this bias, SOG Version 1.2 includes<br />
Worksheet C for Step 4.4.2. It calculates the average age of<br />
cows at the end of their productive life among only those cows<br />
that spent their entire lives on the farm. <strong>The</strong>se cows include<br />
those in two groups for any given year:<br />
• Cows that were involuntarily culled and shipped to<br />
slaughter because of declining production or health<br />
problems; or<br />
• Cows that died or became downers.<br />
Worksheet C appears on the following page. In each of the four<br />
scenarios, the number of cows falling into each of the above two<br />
groups is recorded, along with their average age at the time of<br />
shipping, or death or becoming a downer. A simple weightedaverage<br />
formula is then used to calculate the average age<br />
of all cows falling in these two groups. This number refl ects<br />
the average age at the end of their productive life of lactating<br />
cows that spent their whole life on the farm.
<strong>The</strong> <strong>Organic</strong> <strong>Center</strong> Critical Issue <strong>Report</strong> Page<br />
August 2012 A Deeper Shade of Green 13<br />
Worksheet C for Step 4.4.2 Calculating the Average Age of Cows that Spent<br />
<strong>The</strong>ir Entire Life on the Farm (i.e., Cows that are Involuntarily Culled or Die on<br />
the Farm) (see notes)<br />
Cows Involuntarily<br />
Culled<br />
Number of<br />
Cows<br />
Average Age of<br />
Cows (months)<br />
Cows that Die or are<br />
Downers<br />
Number of<br />
Cows<br />
Average Age of<br />
Cows (months)<br />
Weighted Average<br />
Age of Cows Sold to<br />
Slaughter or that<br />
Die/Downer (months)<br />
Calculated<br />
Average Age of<br />
Cows or Enter<br />
User <strong>Report</strong>ed<br />
Value Here<br />
Scenario 1 13 114 41 63 102.00 102.00<br />
Scenario 2 45 67 9 71 67.67 67.67<br />
Scenario 3 10 110 3 90 105.38 105.38<br />
Scenario 4 10 60 6 38 51.75 51.75<br />
Notes:<br />
1) This calculation of the average age of cows that die, become downers, or are involuntarily culled and sent to slaughter should be made using data<br />
covering a representative, recent time period. (e.g., the last one to three years). Cows involuntarily culled but likely to remain in milk production shoud<br />
be excluded from this calculation. Cows killed or which go down because of an unusual weather or other events (e.g., barn fi re, serious fl ood, herdscale<br />
poisonous event, building collapse) should also be excluded.<br />
2) <strong>The</strong> values in the “Weighted Average Age of Cows Sold to Slaughter or that Die/Downer” column are calculated based on the previous 4 columns.<br />
<strong>The</strong>se values are automatically transferred to the “Calculated Average Age of Cows or Enter User <strong>Report</strong>ed Value” column. <strong>The</strong> value in this column is<br />
automatically inserted in the “User <strong>Report</strong>ed” box in Step 4.4.2 for the variable “Age of Cow at End of Productive Life, for Cow’s the spend their entire<br />
life on the Farm”. If a user does not have the data required to calculate the average age of cows at the end of their lifes using this worksheet, replace<br />
this parameter with the best estimate or a default value in the “Calculated Average Age of Cows or Enter User <strong>Report</strong>ed Value” column.<br />
It is typically not possible for a given dairy farm operator to<br />
track down information on how long a cow sold off the farm<br />
remains in production on another farm. In addition, once<br />
sold to another farm, the cow’s health and longevity might<br />
be altered relative to what it would have been on the farm<br />
it was born on. For these reasons, the approach adopted<br />
in Worksheet C is the most accurate, data-driven way to<br />
calculate the impact of a specifi c farm or farming system on<br />
cow longevity.<br />
<strong>The</strong> data in the last column of Worksheet C is then used in<br />
Step 4.4.2 to calculate the average number of lactations in<br />
a cow’s full life. This is done by fi rst calculating the duration<br />
of the cow’s “productive life,” which is simply the age at<br />
death, less the animal’s age upon birth of its fi rst calf (usually<br />
around 24 months).<br />
In the case of the Bansen farm among cows spending their<br />
whole life on the farm, the average cow’s full life spanned<br />
102 months, or 8.5 years, and its productive life covered<br />
6.46 years. This later period of time is then converted to<br />
days and divided by the calving interval, to equal the number<br />
of lactations.<br />
<strong>The</strong> average cow on typical, high-production conventional<br />
farms represented in Scenario 4 lives for 4.3 years, and<br />
there is little difference between the average age of cows<br />
on the farm at a given point in time and the age of cows<br />
that spend their entire productive life on the farm. This is<br />
because barely enough heifer calves are produced on such<br />
farms to assure an ample supply of replacements, and<br />
hence very little difference between the age of cows on the<br />
farm at a given time and the age of cows that spend their<br />
whole life on a farm.<br />
<strong>The</strong> lactating cows on the Bansen farm in 2010 produced<br />
through 3.2 lactations, on average, but among the cows<br />
that spent their full life on the farm, the number of lactations<br />
rises markedly to 6.3, nearly double the former average.<br />
This major difference in number of lactations and lifespan<br />
highlights the importance of properly measuring cow<br />
longevity when assessing the performance of dairy farm<br />
management systems.
<strong>The</strong> <strong>Organic</strong> <strong>Center</strong> Critical Issue <strong>Report</strong> Page<br />
August 2012 A Deeper Shade of Green 14<br />
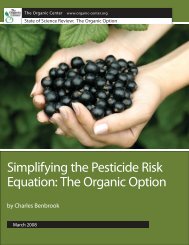
3. Impacts of Alternative Systems on Waste Generation and<br />
Methane Emissions<br />
Liquid manure storage tanks and lagoons are responsible for substantially higher manure methane losses from<br />
large-scale conventional farms. Photo courtesy of Gary and Anne Wegner<br />
Dairy cows excrete wastes through urine and manure, and<br />
via the release of enteric methane from belching and farting.<br />
<strong>The</strong> method farmers use to manage and fi eld apply manure<br />
also contributes to methane emissions, although not to<br />
the same extent as enteric emissions. Most studies show<br />
that enteric emissions account for between two-thirds and<br />
three-quarters of total methane emissions associated with a<br />
lactating dairy animal.<br />
<strong>The</strong> quantities of wastes generated in each scenario within<br />
the SOG calculator are a function of:<br />
• Animal breed and size;<br />
• Levels of milk production, and hence overall need for<br />
Dry Matter Intake (DMI);<br />
• <strong>The</strong> mix of feedstuffs in an animal’s ration;<br />
• Degree of reliance on pasture;<br />
• Cow longevity and health; and<br />
• How manure is managed and fi eld applied.<br />
In general, the bigger the animal, the more it needs to eat,<br />
and hence the greater the volume of wastes generated.<br />
Animals pushed to produce at maximum levels require<br />
more feed, and hence generate more wastes. Pushed to<br />
extremes, animals under physiological stress from high<br />
levels of production tend to suffer a range of health problems<br />
and have diffi culty conceiving and carrying a calf to term.<br />
<strong>The</strong>y tend to produce through only one, or at most two,<br />
relatively long lactations.<br />
<strong>The</strong> shorter lifespan of lactating cows means that the two<br />
years of feed inputs invested in them prior to the birth of<br />
a fi rst calf, and the wastes generated in this time period,<br />
are amortized over fewer lactations and less overall milk<br />
production than from longer-lived cows.<br />
<strong>The</strong> mix and quality of feedstuffs can impact methane<br />
emissions and production levels in many complex ways and<br />
is a focus of intense research. In general, higher quality feed,<br />
especially when delivered in a balanced ration, maximizes<br />
the effi ciency of the cow’s digestive system and minimizes<br />
waste generation per unit of milk production.
<strong>The</strong> <strong>Organic</strong> <strong>Center</strong> Critical Issue <strong>Report</strong> Page<br />
August 2012 A Deeper Shade of Green 15<br />
Manure management systems impact what is called the<br />
“Methane Conversion Factor” (MCF) – a key variable used<br />
to estimate the volume of manure methane emitted per<br />
unit of manure managed in different systems. <strong>The</strong> U.S.<br />
Environmental Protection Agency (EPA) has published<br />
MCFs for many different manure management systems in<br />
different regions. <strong>The</strong>se parameter values are built into<br />
SOG for seven manure management options.<br />
WASTE GENERATION ON DAIRY FARMS<br />
<strong>The</strong> smaller Jersey and crossbreed lactating cows on the<br />
Double J Jerseys and California Cover Leaf Farms produce<br />
less manure per day than the larger Holsteins modeled<br />
in Scenario 4, but more manure per kilogram of energy<br />
corrected milk (ECM), as shown in Table 3.1.<br />
Why Focus on Methane?<br />
Methane is 25-times more potent than CO 2<br />
in terms of global<br />
warming potential. Enteric methane emissions from dairy<br />
cattle can be projected in SOG using four formulas based on<br />
milk production, Dry Matter Intake, percent forage in the diet,<br />
and measures of energy intake. In the current application,<br />
we rely on the energy intake method recommended in the<br />
EPA’s most recent national inventory of GHG emissions from<br />
agriculture (U.S. EPA, 2007). EPA’s formula is driven by<br />
Gross Energy (GE) intake, which is in turn calculated from<br />
diet digestibility and total net energy intake (see Appendix<br />
A for details). In most applications, the EPA method<br />
produces enteric methane emission estimates in between<br />
the maximum and minimum levels projected using the other<br />
three formulas in SOG.<br />
Manure methane is also calculated using the method<br />
adopted by EPA in its 2007 GHG inventory. “Volatile Solids<br />
Produced” (VSP) is multiplied by a “Methane Conversion<br />
Factor” (MCF) that is determined by manure management<br />
system, and then by two constants that do not vary across<br />
the scenarios (see Appendix A for details). <strong>The</strong> EPA reported<br />
methane conversion factors used in SOG vary by region,<br />
climate, and manure management system. In general, the<br />
hotter and drier the region, the higher the MCF will be.<br />
Step 14 in SOG includes two wet manure management<br />
systems and fi ve dry manure systems. Each is assigned<br />
a unique region and climate-specifi c MCF by the EPA. For<br />
each of the four scenarios, the annual manure excreted by<br />
a lactating cow is apportioned across the seven manure<br />
management systems. <strong>The</strong> percentages managed under<br />
each of the seven methods is multiplied by the method’s<br />
Table 3.1 Average Annual Manure, Nitrogen, and Methane Excretions from One Lactating Cow<br />
Scenario 1<br />
Double J Jerseys<br />
Scenario 2<br />
CA Cloverleaf Farms<br />
Scenario 3<br />
Reduce Methane<br />
Emissions<br />
Scenario 4<br />
Typical High-Production<br />
Conventional<br />
Manure (kg)<br />
Kg per Day 59.5 59.5 61.9 63.1<br />
Per kg Energy Corrected Milk 2.63 2.77 1.95 1.88<br />
Per Year of Productive Life 25,945 26,107 27,295 33,467<br />
Nitrogen (kg)<br />
Kg per Day 0.33 0.34 0.37 0.4<br />
Per kg Energy Corrected Milk 0.015 0.016 0.012 0.012<br />
Per Year of Productive Life 154 161 172 239<br />
Enteric Methane<br />
Kg per Day 0.34 0.27 0.44 0.46<br />
Manure Methane<br />
Kg per Day 0.21 0.13 0.05 0.57<br />
Total Methane<br />
Kg per Day 0.55 0.39 0.50 1.03
<strong>The</strong> <strong>Organic</strong> <strong>Center</strong> Critical Issue <strong>Report</strong> Page<br />
August 2012 A Deeper Shade of Green 16<br />
lagoon system with a MCF of 0.74. Only 20% of the manure<br />
generated in a year on the CCLF is managed in a lagoonbased<br />
system, most of it from cleaning the milking parlor and<br />
the alleyways.<br />
On the Double J Jerseys Farm, the manure management<br />
system weighted average MCF is 0.217, or about 30%<br />
higher than the level on the CCLF. In Scenario 4, where<br />
cows are kept in a freestall barn 24/7 and 69% of manure<br />
is managed via an anaerobic lagoon system, the weighted<br />
average methane conversion factor is 0.44, 2.75-times<br />
higher than on the California Clover Leaf Farm.<br />
applicable EPA MCF, and then added together to produce<br />
a weighted average MCF refl ecting management of the<br />
manure generated by a cow over a year. <strong>The</strong>se values<br />
are then used in Step 15 to calculate enteric, manure, and<br />
total methane emissions associated with one lactating cow,<br />
measured in pounds and kilograms per day.<br />
<strong>The</strong> heavier reliance on grain and protein supplements on<br />
California Clover Leaf Farms, compared to the Double J<br />
Jerseys Farm, accounts for most of the difference in enteric<br />
methane emissions per day (see Table 3.1). Relatively<br />
higher emission rates in the two higher-production scenarios<br />
refl ect the sizable increase in daily DMI needed to support<br />
the much higher levels of daily milk production. In general,<br />
the more feed going through a lactating cow’s rumen in a<br />
given day, the more enteric methane emitted.<br />
Manure methane, on the other hand, is driven both by<br />
levels of production, feed intake, and manure management<br />
systems. <strong>The</strong> lowest MCFs apply to manure deposited in<br />
the fi eld on growing grass by grazing cows or via the daily<br />
spread of manure or compost; the highest MCF applies to<br />
that portion of annual manure production that is managed in<br />
a liquid, anaerobic lagoon-based system.<br />
As evident in Table 3.1, methane from manure is lower per<br />
day on the California Clover Leaf Farm compared to Double J<br />
Jerseys Farm. This is because in Step 14, an estimated 33%<br />
of annual manure on the Scenario 1 farm is deposited in the<br />
loafi ng shed and milking parlor areas and alleyways leading<br />
to these facilities. This manure winds up in a liquid-based<br />
<strong>The</strong> methane-reducing farm modeled in Scenario 3 utilizes<br />
a liquid/slurry system to manage the 10% of manure that<br />
is deposited in and around the milking parlor and loafi ng<br />
sheds. This design feature, coupled with heavy reliance on<br />
pasture, minimizes the share of manure managed using a<br />
wet system, while also utilizing a wet system with a much<br />
lower MCF (0.21 instead of 0.63 for an anaerobic lagoon<br />
system). Nearly all other manure is deposited directly on<br />
pasture (50%) or composted (35%), manure management<br />
options with MCFs at or below 0.015. <strong>The</strong> weighted<br />
average methane conversion factor for the farm in Scenario<br />
3 is 0.041, about 11-times lower than the case in Scenario 4.<br />
<strong>The</strong> last rows of data in Table 3.1 report total methane<br />
generated by a lactating dairy cow in an average day and<br />
is simply the sum of enteric and manure methane. <strong>The</strong><br />
seasonal grazing system on the California Clover Leaf Farm,<br />
coupled with mostly dry manure management, results in the<br />
lowest daily emissions of total methane, 0.39 kg, about 38%<br />
of the level on the high-production farm in Scenario 4.<br />
Nitrogen Excretions and Emissions<br />
Nitrogen is essential to dairy farm operations in fueling crop<br />
growth and supporting animal growth, metabolism, and<br />
productivity. Nitrogen in animal feed is the building block<br />
for the protein in cow’s milk, as well as the protein in meat<br />
from mature cows and calves. Cattle breed, milk production<br />
levels, feed rations, feed quality, manure management, and<br />
crop production systems impact the effi ciency of nitrogen<br />
use and uptake as this essential nutrient passes through<br />
a dairy farm operation, including on the farms growing the<br />
feed supporting dairy animals.
<strong>The</strong> <strong>Organic</strong> <strong>Center</strong> Critical Issue <strong>Report</strong> Page<br />
August 2012 A Deeper Shade of Green 17<br />
Most life-cycle analyses of dairy farm operations highlight<br />
nitrous oxide emissions from conventional corn fertilizers<br />
as a signifi cant source of the greenhouse gas emissions<br />
associated with milk production, second only to total methane<br />
emissions. Together, nitrous oxide plus methane emissions<br />
account for three-quarters or more of total global warming<br />
gas emissions emanating from dairy farm operations.<br />
As shown in Table 3.1, the smaller Jersey cattle on the<br />
Scenario 1 farm excrete 0.3 kilograms of nitrogen per day,<br />
while the high-production Holsteins excrete 0.4 kilograms–<br />
21% more than on the Scenario 1 farm. But per unit of<br />
energy corrected milk produced in a day, nitrogen excretions<br />
are just marginally lower on the Scenario 4 Holstein farm<br />
(0.015 versus 0.012). However, nitrogen excretions for<br />
lactating cows per year of productive life are 36% lower on<br />
the Double J Jerseys Farm compared to the high-production<br />
Holstein farm. This difference takes into account the impact<br />
of cow health and longevity on the number of replacement<br />
animals needed.<br />
<strong>The</strong> shorter lifespan of the Holstein cows in Scenario 4<br />
require about twice the number of replacement cattle to be<br />
raised in any given year. <strong>The</strong> nitrogen wastes generated by<br />
these added replacement cattle increases the total nitrogen<br />
excretions for a single Holstein cow and her supporting<br />
population on Scenario 4 farms to 0.72 kilograms per day<br />
(1.58 pounds/day), compared to 0.5 kilograms per day on<br />
the Scenario 1 farm (1.1 pound/day).<br />
This 36% increase in nitrogen excretions per lactating cow<br />
and her supporting population on Scenario 4 farms compared<br />
to Scenario 1 refl ects one of the important tradeoffs between<br />
grass-based organic systems that emphasis cow health and<br />
longevity, compared to farms that intensively manage cows<br />
for maximum unadjusted daily milk production.
<strong>The</strong> <strong>Organic</strong> <strong>Center</strong> Critical Issue <strong>Report</strong> Page<br />
August 2012 A Deeper Shade of Green 18<br />
4. Key Findings and Conclusions<br />
Virtually all studies comparing dairy farm performance<br />
across breeds and farms focus on differences in “Energy<br />
Corrected Milk” (ECM), a measure of milk production that<br />
takes into account differences in milk nutritional quality (and<br />
specifi cally, differences in fat and protein content). Failure to<br />
take milk nutritional differences into account when comparing<br />
farms milking Jerseys or crossbreed cattle versus Holsteins<br />
introduces serious bias into results.<br />
<strong>The</strong> SOG model reports performance both on the basis of<br />
unadjusted and energy corrected milk. While the Jersey<br />
cows on the Double J Jerseys Farm produce just over onehalf<br />
the volume of unadjusted milk per day compared to the<br />
Holsteins in Scenario 4, the milk from Jersey and crossbreed<br />
cows is much richer. In the all-Jersey herd in Scenario 1,<br />
the higher fat and protein content results in ECM of 49.8<br />
pounds per day (22.6 kg/day), compared to unadjusted milk<br />
production of 40.5 pounds/day (18.4 kg/day).<br />
This 23% increase in milk production, corrected for nutritional<br />
quality, reduces all waste emissions per pound or kilogram<br />
of milk produced by 23%. This is why it is so important to<br />
assure that studies quantifying environmental performance<br />
across dairy farms, breeds of cattle, or management systems<br />
are based on energy corrected milk production levels.<br />
METHANE EMISSIONS PER UNIT OF MILK<br />
PRODUCTION<br />
as well as per kilogram of ECM. Enteric methane per unit<br />
of energy corrected milk varies by ~20% across the four<br />
scenarios, and is nearly identical in Scenarios 3 and 4.<br />
Differences are greater in the case of manure methane<br />
and refl ect, in large part, the big differences in reliance on<br />
grazing and manure management systems and associated<br />
methane conversion factors. Cows on the California Clover<br />
Leaf Farm emit 0.006 kilograms of manure methane per<br />
kilogram on energy corrected milk, compared to 0.017 from<br />
cows in Scenario 4, or 2.8-fold more.<br />
<strong>The</strong> farm designed and managed to reduce methane<br />
emissions performs even better as a result of its very low<br />
average manure system methane conversion factor, coupled<br />
with its relatively high level of production. Compared to<br />
cows in Scenario 3, the average animal in Scenario 4 emits<br />
almost 11-times more manure methane per kg of ECM.<br />
Differences are not as dramatic in the case of total methane<br />
emissions. <strong>The</strong> two pasture-based organic farms in<br />
Scenarios 1 and 2 emit about one-third less total methane<br />
per kilogram of ECM, compared to Scenario 4 cows. <strong>The</strong><br />
26% increase in total methane per kg of ECM between<br />
the Jerseys in Scenario 1 and the Holsteins in Scenario 4<br />
nearly disappears when the comparison is made based on<br />
unadjusted milk production.<br />
<strong>The</strong> most objective way to compare methane emissions<br />
across dairy farm management systems is per unit of<br />
energy corrected milk (ECM) over a cow’s lifetime. Studies<br />
that focus on unadjusted milk in a given lactation or year<br />
ignore both milk quality differences and the impact of cow<br />
longevity on key, lifetime performance parameters. In<br />
general, the longer a cow remains productive, the lower<br />
the impact of the enteric and manure methane generated<br />
in her fi rst two years of life, prior to the birth of her fi rst calf.<br />
Plus, replacement rates are lower on farms with long-lived<br />
cows, and hence less methane is generated in the course<br />
of sustaining herd numbers.<br />
Table 4.1 reports methane per kilogram of unadjusted milk,
<strong>The</strong> <strong>Organic</strong> <strong>Center</strong> Critical Issue <strong>Report</strong> Page<br />
August 2012 A Deeper Shade of Green 19<br />
Table 4.1 Methane Emissions from One Lactating Cow per Unit of Milk and Year of<br />
Productive Life<br />
Scenario 3<br />
Scenario 4<br />
Scenario 1<br />
Scenario 2<br />
Reduce Methane Typical High-Production<br />
Double J Jerseys CA Cloverleaf Farms<br />
Emissions<br />
Conventional<br />
Enteric<br />
Methane<br />
Kg per kg of Unadjusted Milk 0.0187 0.0141 0.0151 0.0139<br />
Kg per kg Energy Corrected Milk 0.0152 0.0124 0.0140 0.0138<br />
Kg per Year of Productive Life 172 129 214 266<br />
Manure Methane<br />
Kg per kg of Unadjusted Milk 0.0114 0.0068 0.0017 0.0171<br />
Kg per kg Energy Corrected Milk 0.0093 0.006 0.0016 0.0170<br />
Kg per Year of Productive Life 105 61 25 327<br />
Total Methane<br />
Kg per kg of Unadjusted Milk 0.0301 0.021 0.0168 0.031<br />
Kg per kg Energy Corrected Milk 0.0245 0.0184 0.0156 0.0308<br />
Kg per Year of Productive Life 277 189 239 593<br />
<strong>The</strong>re are also large differences in Table 4.1 in methane<br />
emissions per year of productive life. <strong>The</strong>se differences<br />
reflect the much greater amounts of feed required to<br />
sustain the relatively high milk production levels in<br />
Scenarios 3 and 4, as well as differences in manure<br />
management systems across the scenarios.<br />
Cow Health Benefits<br />
Longevity on organic farms reduces the annual need for<br />
replacement cattle. It is common for conventional dairies<br />
like those modeled in Scenario 4 to require 40% to 60%<br />
replacements annually, compared to about 20% to 30% on<br />
farms with long-lived cows. Accordingly, there is a substantial<br />
quantity of feed, nutrient excretions, and methane<br />
emissions tied up in raising the additional replacement<br />
cows needed to sustain herd size on Scenario 4.<br />
Differences in methane emissions per unit<br />
of milk production across the four scenarios<br />
in this analysis understate one other<br />
advantage of grass-based organic dairies.<br />
<strong>The</strong> physical exercise associated with<br />
walking to and from pastures, and grazing<br />
for several hours per day, promote animal<br />
health. <strong>The</strong> much lower level of daily milk<br />
production reduces physiological stress on the animals.<br />
As a result, lactating cows on well-run, grass-based<br />
dairy farms live three to four years longer on average<br />
than cows on high-production conventional farms. <strong>The</strong>y<br />
produce through three or four more lactations, and hence<br />
produce more calves. Lifelong milk and meat earnings<br />
are also much higher as a result of their longer lives,<br />
coupled with the higher prices received for organic milk<br />
and meat.<br />
Economic Performance<br />
<strong>The</strong> SOG calculator models the gross income<br />
from milk and meat sales. Users can enter the<br />
actual prices received for milk, calves, and meat sold,<br />
or rely on default values. In the current application, the<br />
average milk price per hundredweight was set at $30.00 for<br />
Scenarios 1-3, and $20.00 in Scenario 4. Price differentials<br />
of this magnitude have been common over the last decade.<br />
Calf and meat price differentials were also set to reflect typical<br />
market conditions.<br />
Despite producing 33 pounds more milk per day, the Scenario<br />
4 farm’s annual milk income per cow is less than the Scenario<br />
1 farm by a wide margin -- $2,575 in Scenario 4 versus $2,931<br />
in Scenario 1. <strong>The</strong> higher producing farm in Scenario 3 earns<br />
by far the most from milk sales per cow per year -- $4,411.
<strong>The</strong> <strong>Organic</strong> <strong>Center</strong> Critical Issue <strong>Report</strong> Page<br />
August 2012 A Deeper Shade of Green 20<br />
In terms of total milk and meat income per cow per year of<br />
life, the two grazing-based organic farms equal or exceed<br />
the performance of the Scenario 4 farm. <strong>The</strong> organic milk<br />
price premium is obviously the major factor accounting for<br />
this fi nding.<br />
This version of SOG does not calculate the costs of feed and<br />
other management inputs, although hopefully it will in the<br />
future. It is worth noting that organic dairy farms have to pay<br />
substantially more for feed, compared to conventional dairy<br />
operations. <strong>The</strong> differential in the cost of purchased organic<br />
versus conventional feed typically is much greater than the<br />
differences in on-farm costs of production between nearby<br />
conventional and organic dairies that grow their own feed.<br />
Moreover, grazing-based farms minimize the need for either<br />
home-grown or purchased grain and protein supplement<br />
feeds, and hence are insulated to a large degree from the<br />
differences in the costs of organic versus conventional feed,<br />
or the sometimes dramatic spikes in the price of organic feed.<br />
Land Use<br />
<strong>The</strong> smaller, thriftier cattle on the two organic, grazingbased<br />
farms require 3.08 and 3.5 acres to produce the feed<br />
needed to sustain a milking cow, while on the Scenario 3 and<br />
4 farms, more land is needed to sustain the larger animals<br />
and higher levels of production – 4.5 acres in Scenario 3 and<br />
4.1 acres in Scenario 4. <strong>The</strong> ration feed to milking cows in<br />
Scenario 4 includes heavy reliance on two high-yield crops<br />
-- alfalfa hay and corn silage, whereas cows on the Scenario<br />
3 farm utilize much more pasture, hay silage/baleage, and<br />
much less corn silage.<br />
Grazing also is associated with three key environmental<br />
benefi ts. <strong>The</strong> solid mat of grasses and legumes in a pasture<br />
protect the surface of the soil from the erosive potential of<br />
rainfall. <strong>The</strong> standard equation used by the USDA to predict<br />
annual soil erosion losses projects losses of less than 1.0<br />
ton per acre in the case of most well managed pastures,<br />
even on slopping ground. If the same land were used for<br />
crop farming, erosion losses would likely exceed 10 tons per<br />
acre annually, and if the land were heavily tilled, losses could<br />
exceed 50 tons per acre.<br />
Grazing contributes to water quality by reducing the volume<br />
of runoff from pastures, as well as the levels of sediment,<br />
fertilizers, and agricultural chemicals in runoff. Numerous<br />
USDA-sponsored research projects have shown that grass<br />
buffer strips along creeks, streams, and rivers that are at<br />
least 30 feet wide can fi lter out 80% or more of the sediment<br />
and chemicals in runoff from cultivated cropland. A pasture<br />
on a dairy farm performs the same valuable function, but<br />
even more effectively because most pastures are so much<br />
wider than a typical buffer strip.<br />
Grazing also contributes dramatically to reducing the net<br />
greenhouse gas emissions from a dairy farm. It does<br />
this directly, by reducing the loss of manure methane, as<br />
discussed previously. It does so indirectly by reducing<br />
reliance on corn in cow rations. <strong>The</strong> production of corn is<br />
generally regarded as the second most signifi cant source<br />
of net GHG emissions associated with milk production,<br />
Not only do grazing-based farms require less land to sustain<br />
a cow, they also need fewer acres of highly productive,<br />
relatively fl at prime cropland that could be used to grow<br />
small grain, row crops, or even vegetable crops like<br />
potatoes and sugar beets. SOG projects that 58% of the<br />
3.08 acres needed to sustain a Jersey cow on a farm like<br />
the one modeled in Scenario 1 would likely be, on average,<br />
high-quality prime land, while 42% could be rolling, less<br />
productive grazing land suitable mostly for grass production<br />
and only accessional crop production because of the risk of<br />
soil erosion.On the Scenario 4 farm, however, 77% of the<br />
land required to produce the feed for a lactating cow would<br />
likely be prime cropland in light of the heavy reliance on<br />
corn, soybeans, and alfalfa hay in the overall ration.
<strong>The</strong> <strong>Organic</strong> <strong>Center</strong> Critical Issue <strong>Report</strong> Page<br />
August 2012 A Deeper Shade of Green 21<br />
because of the relatively high losses of nitrous oxide from<br />
cornfi elds.<br />
But grazing has an additional, signifi cant benefi cial impact<br />
– by enhancing soil organic matter levels, it helps sequester<br />
carbon from the atmosphere and holds it in the soil, where it<br />
enhances future agricultural productivity at no risk or harm to<br />
the atmosphere. A recent study by USDA scientists concluded<br />
that well-managed pasture can sequester as much as 3,400<br />
pounds of carbon per acre per year, compared to using the<br />
same land for row crop production (Perry, 2011). If sustained<br />
over several years, soil carbon sequestration can increase<br />
the organic matter content of pasture soils from 1% to 3% to<br />
4% to 6%, increases with enormous consequences for land<br />
productivity, water quality, and agriculture’s contribution to<br />
global warming.<br />
OPTIONS TO REDUCE METHANE EMISSIONS<br />
<strong>The</strong> “Cow of the Future” project strives to reduce methane<br />
emissions by 25% by 2020. <strong>The</strong> team of dairy scientists<br />
carrying out the project anticipates that adoption of existing,<br />
proven technologies and practices, coupled with genetic<br />
improvement, will reduce emissions by 10% to 12%. New<br />
technology and systems will be needed to reduce emissions<br />
the additional 13% to 15% needed to reach the 25% goal.<br />
Using standard, widely accepted organic dairy farm<br />
management practices, the grass-based farms in Scenarios<br />
1 and 2 cut methane emissions by 20% and 32% below<br />
the level typical on today’s conventional, high-production<br />
dairy farms, as modeled in Scenario 4. <strong>The</strong>se reductions<br />
are two- to three-fold greater than those considered feasible<br />
on conventional dairy farms based on existing technology<br />
and systems, according to the “Cow of the Future” project.<br />
This fi nding suggests that the conventional dairy industry<br />
could benefi t from taking a closer look at how grassbased<br />
organic dairy farms are already reducing methane<br />
emissions.<br />
In addition, the performance of the California Clover Leaf<br />
Farm relative to the hypothetical farm in Scenario 3 is<br />
remarkable and encouraging in terms of the farm’s ability<br />
to reduce methane emissions per unit of milk produced.<br />
<strong>The</strong> methane-reducing farm in Scenario 3 produces<br />
0.0156 kg of methane per kg of energy corrected milk,<br />
compared to 0.0184 on the California Clover Leaf Farm.<br />
Our fi ndings point to several options to reduce methane<br />
emissions per unit of milk production, in addition to those<br />
pursued by the “Cow of the Future” team. Increased<br />
reliance on pasture and grazing will help promote cow health<br />
and longevity, and will reduce the portion of manure that<br />
winds up in anaerobic lagoons notorious for their ability to<br />
emit methane. It will also increase the quantity of carbon<br />
sequestered in the soil, enhance soil organic matter levels,<br />
and reduce the risk of soil erosion compared to growing<br />
crops.<br />
Switching from Holstein cattle to crossbreeds or Jerseys<br />
will dramatically improve milk nutritional quality, and hence<br />
increase energy corrected milk, compared to farms milking<br />
Holsteins. While average per cow production will be lower,<br />
so too will feed inputs and the wastes generated per cow. It<br />
is widely recognized that Jersey and crossbreed cattle are<br />
more efficient than Holsteins in utilizing pastures and foragebased<br />
feeds for milk and meat production.<br />
Getting cows out of freestall barns and off of concrete,<br />
where liquid manure systems are common, offers great<br />
potential to reduce manure-methane and total methane<br />
production. While manure methane accounts for one-third<br />
to one-half of total methane on most farms, practical options<br />
exist to dramatically reduce losses through grazing and<br />
the composting of dry manure. Manure methane can be<br />
cut as much as 10-fold, reducing its share of total methane<br />
emissions from over 50% (Scenario 4) to about 10%<br />
(Scenario 3).<br />
Accordingly, farms that rely heavily on grazing and utilize dry<br />
manure management systems for most of the rest of a year’s<br />
manure can cut total methane per unit of milk production by<br />
one-half or more. Currently, the National <strong>Organic</strong> Program<br />
rule requires dairy cattle to consume at least 30% of daily<br />
Dry Matter Intake from pasture during the typical grazing<br />
season, and in no event for fewer than 120 days.<br />
Most organic dairy farms in regions with relatively mild<br />
winters meet this 30% of DMI requirement for 200 or more<br />
days. As a result, cows spend substantial time on pasture<br />
and walking to and from pastures, time during which<br />
manure is deposited in or near fi elds, leading to very low
<strong>The</strong> <strong>Organic</strong> <strong>Center</strong> Critical Issue <strong>Report</strong> Page<br />
August 2012 A Deeper Shade of Green 22<br />
manure-methane losses. While some pasture-based<br />
organic dairies cut manure methane emissions by 90%<br />
compared to emissions with an anaerobic lagoon system,<br />
the average organic dairy likely reduces manure-methane<br />
emissions by around 50%.<br />
Promoting animal health and longevity has the potential to<br />
cut the number of replacement cows needed by about onehalf,<br />
from 40% to 60% to 20% to 30%. In a milking herd of<br />
100 cows, this means that around 25 fewer animals would<br />
be needed as replacements annually, each of which must<br />
be fed and will emit methane for two years prior to the birth<br />
of a fi rst calf. <strong>The</strong> methane generated by these 25 extra<br />
animals must be added to the total methane produced<br />
by lactating cows, thereby driving upward total methane<br />
emissions per unit of milk produced.<br />
Recent research highlights options to reduce enteric<br />
methane emissions through changes in the diet of<br />
lactating cows. In particular, forage quality, the balance<br />
of nutrients and fi ber, and the addition of omega 3 fatty<br />
acids in rations impact rumen performance and enteric<br />
methane emissions.<br />
An <strong>Organic</strong> Research and Extension Initiative research<br />
grant was awarded in 2011 to a team based at the University<br />
of New Hampshire to explore forage management<br />
and feeding options to improve the nutritional profi le of<br />
milk. Supplemental feeding with fl ax will be among the<br />
innovations studied. It is likely that progress made in<br />
improving the nutritional profi le of milk will also reduce<br />
enteric methane emissions. Optimizing progress toward<br />
both goals is clearly an important and timely focus for organic<br />
dairy farms, processors, and the research community.
<strong>The</strong> <strong>Organic</strong> <strong>Center</strong> Critical Issue <strong>Report</strong> Page<br />
August 2012 A Deeper Shade of Green 23<br />
References and Resources<br />
Arsenault, N., Tyedmers, P., Fredeen, A., 2009. “Comparing the environmental impacts of pasture-based and<br />
confi nement-based dairy systems in Nova Scotia (Canada) using life cycle assessment,” International Journal of<br />
Agricultural Sustainability, 7:1, 19-41.<br />
Benbrook, C., Carman, C., Clark, E.A., Daley, C., Fulwider, W., Petkewitz, L., Leifert, C., Martens, K., Paine, L., Hansen,<br />
M., Jodarski, G., Thicke, F., Velez, J., and Wegner, G., 2010. A Dairy Farm’s Footprint: Evaluating the Impacts of<br />
Conventional and <strong>Organic</strong> Farming Systems, Critical Issue <strong>Report</strong>, <strong>The</strong> <strong>Organic</strong> <strong>Center</strong>, Boulder, CO., www.organiccenter.org/SOG_Home.<br />
Benbrook, C., 2010. Shades of Green Users Manual – Guide and Documentation for a Dairy Farm Management System<br />
Calculator, <strong>The</strong> <strong>Organic</strong> <strong>Center</strong>, Boulder, CO., www.organic-center.org/SOG_Home<br />
Butler, G., Nielsen, J.H., Slots, T., Seal, C., Eyre, M.D., Sanderson, R, and Leifert, C., 2008. “Fatty acid and fat-soluble<br />
antioxidant concentrations in milk from high- and low-input conventional and organic dairy systems: seasonal variation,”<br />
Journal of the Science of Food and Agriculture, 88, 1431-1441.<br />
Butler, G., Collomb, M., Rehberger, B., Sanderson, R., Eyre, M., and Leifert, C., 2009. “CLA isomer concentrations in milk<br />
from high and low input management dairy systems,” Journal of the Science of Food and Agriculture, 89, 697-705.<br />
Caraviello, D.Z. et al., 2006. “Survey of management practices on reproductive performance of dairy cattle on large US<br />
commercial farms,” Journal of Dairy Science, 89, 4723-4735.<br />
Capper, J.L., Castaneda-Gutierrez, E., Cady, R.A., and Bauman, D.E., 2008. “<strong>The</strong> environmental impact of recombinant<br />
bovine somatotin (rbST) use in dairy production,” Proceedings of the National Academy of Sciences, 105:28, 9688-9673.<br />
Chagas, L.M., et al., 2007. “Invited Review: New Perspectives on the Roles of Nutrition and Metabolic Priorities in the<br />
Subfertility of High-Producing Dairy Cows,” Journal of Dairy Science, Vol. 90: 4022-4032.<br />
Committee on 21st Century Systems Agriculture, 2010. Toward Sustainable Agricultural Systems in the 21st Century,<br />
National Research Council, National Academy Press, Washington, D.C.<br />
Economic Research Service, 2010a. “Dairy Forecasts,” World Agricultural Supply and Demand Estimates, ERS-USDA,<br />
accessed 10/10/10, http://www.ers.usda.gov/publications/ldp<br />
Economic Research Service, USDA, 2006. “2005 Dairy Agricultural Resource Management Survey,” tables generated for<br />
<strong>The</strong> <strong>Organic</strong> <strong>Center</strong> by Purdue University.<br />
Ellis, K.A., Innocent, G., Grove-White, D., Cripps, P., McLean, W.G., Howard, C.V., and Mihm, M., 2006. “Comparing the<br />
fatty acid composition of organic and conventional milk,” Journal of Diary Science, 89, 1938-1950.<br />
El-Zarkouny, S.Z. et al., 2004. “Pregnancy in dairy cows after synchronized ovulation regimens with or without<br />
presynchronization and progesterone,” Journal of Dairy Science, 87, 1024-1037.
<strong>The</strong> <strong>Organic</strong> <strong>Center</strong> Critical Issue <strong>Report</strong> Page<br />
August 2012 A Deeper Shade of Green 24<br />
Fricke, P.M. “Ovsynch, Pre-synch, the Kitchen-Synch: What’s Up with Synchronization Protocols,” Department of Dairy<br />
Science, University of Wisconsin-Madison, http://www.wisc.edu/dysci/uwex/brochures/brochures/fricke.pdf<br />
Haas, G., Wetterich, F., and Kopke, U., 2001. “Comparing intensive, extensifi ed and organic grassland farming in<br />
southern Germany by process life cycle assessment,” Agriculture Ecosystems and Environment, 83, 43P-53.<br />
Hadley, G.L, Wolf, C.A., and Harsh, S.B., 2006. “Dairy cattle culling patterns, explanations, and implications,” Journal of<br />
Diary Science, 89, 2286-2296.<br />
Hoard’s Dairyman staff, 2010. “How Deep a Financial Hole Did Milk Producers Dig in 2009?,” Hoard’s West, September<br />
25, 2010.<br />
Kellogg, D.W. et al., 2001. “Survey of management practices used for the highest producing DHI herds in the United<br />
States,” Journal of Dairy Science, 84 (E. Suppl.), 120-127.<br />
Knapp, et al., 2011. “Cow of the Future Research Priorities for Mitigating Enteric Methane Emissions from Dairy,”<br />
Innovation <strong>Center</strong> for U.S. Dairy.<br />
Knaus, W., 2009. “Dairy cows trapped between performance demands and adaptability,” Journal of Science of Food and<br />
Agriculture, 89, 1107-1114.<br />
Lucy, M.C., 2001. “ADSA foundation scholar award -- reproductive loss in high producing dairy cattle: where will it end?”,<br />
Journal of Dairy Science, 84,1277-1293.<br />
McConnel, C.S., Lombard, J.E., Wagner, B.A., and Garry, F.B., 2008. “Evaluation of factors associated with increased<br />
dairy cow mortality on United States dairy operations,” Journal of Dairy Science, 91, 1423-1432.<br />
Moore, D. and Kirk, J., “Embryonic Loss in Dairy Cattle,” School of Veterinary Medicine, U.C.-Davis, Tulare, California,<br />
(Undated).<br />
NAHMS, 2007a. Dairy 2007 Part II: Changes in the U.S. Dairy Cattle Industry, 1991-2007, National Animal Health<br />
Monitoring Systems, USDA-APHIS, Washington, D.C.<br />
NAHMS, 2007b. Dairy 2007 Part III: Reference of Dairy Cattle Health and Management Practices in the United States,<br />
2007, National Animal Health Monitoring Systems, USDA-APHIS, Washington, D.C.<br />
Nennich, T. D., Harrison, J. H. et al., 2005. “Prediction of manure and nutrient excretion from dairy cattle,” Journal of Dairy<br />
Science, 88, 3721-3733.<br />
Olynk, N.J. and Wolf, C.A., 2008. “Economic analysis of reproductive management strategies on US commercial dairy<br />
farms,” Journal of Dairy Science, 91, 4082-4091.<br />
O’Donnell, Spatny, K.P., Vicini, J.L., and Bauman, D.E., 2010. “Survey of the fatty acid composition of retail milk differing<br />
in label claims based on production management practices,” Journal of Dairy Science, 93, 1918-1925.
<strong>The</strong> <strong>Organic</strong> <strong>Center</strong> Critical Issue <strong>Report</strong> Page<br />
August 2012 A Deeper Shade of Green 25<br />
Perry, A., 2011, “Putting Dairy Cows Out to Pasture: An Environmental Plus,” USDA, ARS, News and Events, May 11,<br />
2011. http://www.ars.usda.gov/is/AR/2011/may11/cows0511.htm.<br />
Pitesky, M., Stackhouse, K., and Mitloehner, F., 2009. “Clearing the air: livestock’s contributions to climate change,”<br />
Advances in Agronomy, 103,<br />
Santos, J.E.P. et al., 2004. “Effect of bST and reproductive management on reproductive performance of Holstein dairy<br />
cows,” Journal of Dairy Science, 87, 868-881.<br />
Smith, J.W., Ely, L.O., and Chapa, A.M., 2000. “Effect of region, herd size, and milk production on reasons cows leave the<br />
herd,” Journal of Dairy Science, 88, 2980-2987.<br />
Steinfeld, H., Gerber, P., Wassenaar, T., Castel, V., Rosales, M., and de Haan, C., 2006. Livestock’s Long Shadow:<br />
Environmental Issues and Options, Food and Agriculture Organization of the United Nations, Rome, Italy. Access<br />
summary at ftp://ftp.fao.org/docrep/fao/010/a0701e/a0701e00.pdf<br />
Subcommittee on Dairy Cattle Nutrition, 2001. Nutrient Requirements of Dairy Cattle, Seventh Revised Edition, 2001,<br />
National Research Council, Washington, D.C.<br />
Thomsen, P.T., et al., 2006. “Herd-level risk factors for the mortality of cows in Danish dairy herds,” <strong>The</strong> Veterinary<br />
Record, 158, 622-625.<br />
Tsuruta, S. Misztai, I., and Lawlor, J., 2005. “Changing defi nition of productive life in US Holsteins: effect on genetic<br />
correlations,” Journal of Dairy Science, 88, 1156-1165.<br />
U.S. Environmental Protection Agency (EPA), 2007. Inventory of U.S. Greenhouse Gas Emissions and Sinks: 1990-2007.<br />
Chapter 3.10. Methodology for Estimating CH 4<br />
and N 2<br />
O Emissions from Manure Management, Washington, D.C.<br />
Washington State University Extension, 2008. “FAQ #27579 -- What is Dry Matter Intake Effi ciency, and How is This<br />
Important in Nutrient Management?,” access at http://www.extension.org/faq/27579.<br />
Windig, J.J. et al., 2005. “Infl uence of herd environment on health and fertility and their relationship with milk production,”<br />
Journal of Dairy Science, 88, 335-347.
<strong>The</strong> <strong>Organic</strong> <strong>Center</strong> Critical Issue <strong>Report</strong> Page<br />
August 2012 A Deeper Shade of Green 26<br />
Appendix A. Basis for and Sources of Key Variables and<br />
Equations<br />
1. Formula for ECM<br />
<strong>The</strong> equation to calculate “Energy Corrected Milk,” or ECM is –<br />
ECM (kgs or pounds/day) = (UMPD x 0.323) + (7.13 x Protein Content) + (12.82 x Fat Content)<br />
Where:<br />
UMPD is unadjusted milk production per day<br />
Protein content is kgs/pounds of protein<br />
Fat content is total kgs/pounds of fat.<br />
Source: Washington State University Extension, 2008; http://www.extension.org/faq/27579.<br />
2. EPA Method for Calculating Enteric Methane Emissions per Cow<br />
<strong>The</strong> EPA-recommended formula for estimating enteric methane emissions from a cow is –<br />
Enteric Methane (kg/day) = (GE x Ym)/55.65<br />
Where:<br />
GE is Gross Energy intake,<br />
Ym is a constant, and refl ects the portion of GE converted to methane<br />
55.65 converts millijoules to kilograms<br />
3. EPA Method for Manure Methane Emissions<br />
<strong>The</strong> method used by EPA to project manure methane emissions is –<br />
Manure Methane (kg/day) = VSP x Bo x MCF x 0.662<br />
Where:<br />
VSP is Volatile Solids Produced<br />
Bo is the methane producing potential of waste<br />
MCF is the Waste Management System Methane Conversion Factor (MCF), composed of a weighted average of the<br />
MCFs associated with the different methods used on a farm to manage manure.<br />
For full discussion of these and all other equations and data sources used in the SOG Version 1.2, see the SOG User<br />
Manual. http://www.organic-center.org/SOG/Home