Final Report - Pima Association of Governments
Final Report - Pima Association of Governments
Final Report - Pima Association of Governments

Create successful ePaper yourself
Turn your PDF publications into a flip-book with our unique Google optimized e-Paper software.
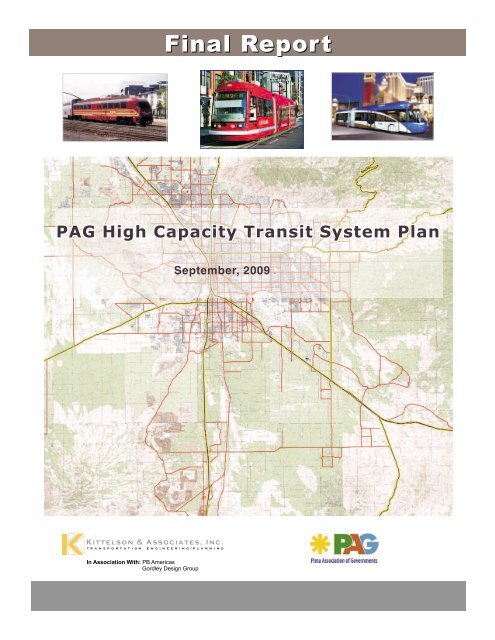
<strong>Final</strong> <strong>Report</strong><br />
PAG High Capacity Transit System Plan<br />
September, 2009<br />
In <strong>Association</strong> With: PB Americas<br />
Gordley Design Group
<strong>Final</strong> <strong>Report</strong><br />
PAG High Capacity Transit System Plan<br />
Tucson, Arizona<br />
Prepared For:<br />
<strong>Pima</strong> <strong>Association</strong> <strong>of</strong> <strong>Governments</strong><br />
177 North Church Street, Suite 405<br />
Tucson, AZ 85701<br />
(520) 419-2500<br />
Prepared By:<br />
Kittelson & Associates, Inc.<br />
33 North Stone Avenue, Suite 800<br />
Tucson, AZ 85701<br />
(520) 544-4067<br />
Project Principal: James Schoen, P.E., P.T.O.E.<br />
Project Manager: Kelly Blume, P.E.<br />
Project No. 9171.00<br />
September 2009
High Capacity Transit System Plan - <strong>Final</strong> <strong>Report</strong> September 2009<br />
Table <strong>of</strong> Contents<br />
TABLE OF CONTENTS<br />
1.0 Introduction ......................................................................................................................................1<br />
1.1 Background and Context............................................................................................................1<br />
1.2 Purpose <strong>of</strong> this <strong>Report</strong>.................................................................................................................1<br />
1.3 Organization <strong>of</strong> This <strong>Report</strong>.......................................................................................................2<br />
2.0 Existing Conditions..........................................................................................................................3<br />
2.1 Introduction..................................................................................................................................3<br />
2.2 Demographics and Land Use.....................................................................................................3<br />
2.3 Transportation System ..............................................................................................................16<br />
3.0 Future Conditions ..........................................................................................................................30<br />
3.1 Introduction................................................................................................................................30<br />
3.2 Demographics and Land Use...................................................................................................30<br />
3.3 Transportation System ..............................................................................................................37<br />
4.0 Transit Technologies Analysis .....................................................................................................41<br />
4.1 Introduction................................................................................................................................41<br />
4.2 Transit Technologies Assessed ................................................................................................41<br />
4.3 Additional transit technology comparison ............................................................................62<br />
4.4 Summary <strong>of</strong> Premium Transit Technology Review..............................................................67<br />
4.5 Trip/Development Density Related to Premium Transit Modes........................................67<br />
4.6 Premium Transit Corridors and Modes for Further Evaluation.........................................71<br />
5.0 Refined Corridor Assessment ......................................................................................................81<br />
5.1 Introduction................................................................................................................................81<br />
5.2 Description <strong>of</strong> Corridors and Alternatives.............................................................................81<br />
5.3 Screening Evaluation.................................................................................................................83<br />
5.4 Alternative Assessment ............................................................................................................96<br />
5.5 Conclusions and Recommendations for Task 5 ..................................................................117<br />
6.0 Development <strong>of</strong> Updated HCT System Plan ...........................................................................120<br />
6.1 Introduction..............................................................................................................................120<br />
6.2 Corridors Analyzed in Task 6 ................................................................................................120<br />
6.3 Description <strong>of</strong> System Alternatives.......................................................................................124<br />
6.4 Evaluation <strong>of</strong> System Alternatives ........................................................................................138<br />
6.5 Conclusions and Recommendations for Task 6 ..................................................................147<br />
7.0 HCT Funding................................................................................................................................150<br />
7.1 Introduction..............................................................................................................................150<br />
7.2 Existing Revenue Sources.......................................................................................................150<br />
7.3 Potential Revenue Sources .....................................................................................................152<br />
7.4 Summary <strong>of</strong> Existing and Potential Revenue Sources Applicable to HCT .....................160<br />
7.5 Conclusions and Recommendations for Funding...............................................................161<br />
8.0 Corridor Implementation Plans .................................................................................................162<br />
i
High Capacity Transit System Plan - <strong>Final</strong> <strong>Report</strong> September 2009<br />
Table <strong>of</strong> Contents<br />
8.1 Introduction..............................................................................................................................162<br />
8.2 Monitoring for HCT Implementation ...................................................................................163<br />
8.3 Corridor Implementation Plans.............................................................................................163<br />
8.4 Regional HCT Implementation Plan Summary ..................................................................177<br />
8.5 Conclusions and Recommendations for Implementation .................................................177<br />
9.0 Land Use Planning for HCT .......................................................................................................179<br />
9.1 Introduction..............................................................................................................................179<br />
9.2 Transit‐Oriented Corridor and Station Models...................................................................183<br />
9.3 Review <strong>of</strong> Plans and Codes in the Region............................................................................194<br />
9.4 HCT Development Financial Incentives...............................................................................196<br />
9.5 Conclusions and Recommendations for Land Use Planning............................................198<br />
10.0 Next Steps......................................................................................................................................200<br />
Appendix A: Steps in HCT Implementation Monitoring Process<br />
Appendix B: Review <strong>of</strong> General Plans and Codes<br />
Appendix C: Public and Agency Involvement<br />
Appendix D: HCT Infrastructure Planning<br />
ii
High Capacity Transit System Plan - <strong>Final</strong> <strong>Report</strong> September 2009<br />
Table <strong>of</strong> Contents<br />
LIST OF FIGURES<br />
Figure 1 Existing Population Density ..................................................................................................5<br />
Figure 2 Existing Employment Density...............................................................................................6<br />
Figure 3 Existing Low‐Income Population Density ...........................................................................7<br />
Figure 4 Existing Zero‐Car Households ..............................................................................................9<br />
Figure 5 Existing Elderly/Youth Population .....................................................................................10<br />
Figure 6 Existing Land Use..................................................................................................................11<br />
Figure 7 Existing Major Trip Generators ........................................................................................... 12<br />
Figure 8 Existing Trip O‐D Patterns − Work Person‐Trips .............................................................14<br />
Figure 9 Existing Trip O‐D Patterns − Total Person‐Trips ..............................................................15<br />
Figure 10 Existing Traffic Level <strong>of</strong> Service ..........................................................................................17<br />
Figure 11 Fixed‐Route Transit Service Coverage in the PAG Region .............................................18<br />
Figure 12 SunTran Route Network ......................................................................................................20<br />
Figure 13 CatTran Route Network .......................................................................................................25<br />
Figure 14 Downtown Loop Route Network .......................................................................................27<br />
Figure 15 Year 2040 Population Density..............................................................................................32<br />
Figure 16 Year 2040 Employment Density ..........................................................................................33<br />
Figure 17 Year 2040 Land Use...............................................................................................................34<br />
Figure 18 Year 2040 Trip O‐D Patterns – Work Person‐Trips ..........................................................35<br />
Figure 19 Year 2040 Trip O‐D Patterns – Total Person‐Trips ...........................................................36<br />
Figure 20 Year 2040 Traffic Level <strong>of</strong> Service .......................................................................................38<br />
Figure 21 Figure 21 RTA Plan Transit Improvements.......................................................................38<br />
Figure 21 Figure 21 RTA Plan Transit Improvements.......................................................................39<br />
Figure 22 Premium Transit Mode Applicability ................................................................................40<br />
Figure 23 Example <strong>of</strong> Express Service Bus (Los Angeles).................................................................43<br />
Figure 24 Off‐Board BRT Fare Collection in Las Vegas.....................................................................46<br />
Figure 25 Using Bus Color to Convey Transit Information ..............................................................47<br />
Figure 26 BRT System Map in Los Angeles ........................................................................................48<br />
Figure 27 Example <strong>of</strong> Customized BRT Vehicle and Level‐Boarding Station (Eugene, OR).......49<br />
Figure 28 Example <strong>of</strong> LRT Vehicle (Portland, OR) ............................................................................52<br />
Figure 29 Example <strong>of</strong> LRT Vehicle with Wheelchair Ramp (San Diego)........................................53<br />
Figure 30 Example <strong>of</strong> On‐Board Passenger Information (Portland, OR)........................................54<br />
Figure 31 Example <strong>of</strong> Streetcar Vehicle (Portland, OR).....................................................................56<br />
Figure 32 Example <strong>of</strong> Streetcar in Mixed Traffic (Toronto ALRV) ..................................................57<br />
Figure 33 Examples <strong>of</strong> Commuter Rail (Salt Lake City and South Florida)...................................59<br />
Figure 34 Example <strong>of</strong> Commuter Rail Station with Modern Design Features (Dallas)................60<br />
Figure 35 High‐Capacity Transit Mode Operated vs. Urban Area Population .............................65<br />
Figure 36 High‐Capacity Transit Mode Operated vs. Operating Cost per Passenger Mile......... 65<br />
Figure 37 High‐Capacity Transit Mode Operated vs. Operating Cost per Revenue Hour.......... 66<br />
Figure 38 High‐Capacity Transit Mode Operated vs. Capital Cost per Mile................................. 66<br />
Figure 39 Person Capacity Ranges <strong>of</strong> U.S. and Canadian Transit Modes ......................................68<br />
Figure 40 TAZs Supportive <strong>of</strong> Express Bus Based on Existing Densities .......................................72<br />
iii
High Capacity Transit System Plan - <strong>Final</strong> <strong>Report</strong> September 2009<br />
Table <strong>of</strong> Contents<br />
Figure 41 TAZs Supportive <strong>of</strong> Express Bus Based on 2040 Densities .............................................73<br />
Figure 42 TAZs Supportive <strong>of</strong> BRT Based on Existing Densities.....................................................74<br />
Figure 43 TAZs Supportive <strong>of</strong> BRT Based on 2040 Densities ...........................................................75<br />
Figure 44 TAZs Supportive <strong>of</strong> LRT Based on Existing Densities.....................................................76<br />
Figure 45 TAZs Supportive <strong>of</strong> LRT Based on 2040 Densities ...........................................................77<br />
Figure 46 TAZs Supportive <strong>of</strong> Commuter Rail Based on Existing Densities .................................78<br />
Figure 47 TAZs Supportive <strong>of</strong> Commuter Rail Based on 2040 Densities .......................................79<br />
Figure 48 Corridors Evaluated in the Refined Corridor Assessment.............................................82<br />
Figure 49 Representative HCT Stations...............................................................................................90<br />
Figure 50 Major Trip Generators within Walking Distance <strong>of</strong> BRT and Streetcar ......................106<br />
Figure 51 Major Trip Generators within Walking Distance <strong>of</strong> LRT and CRT..............................107<br />
Figure 52 Existing Minority Population ............................................................................................111<br />
Figure 53 Ronstadt Transit Center in Downtown Tucson ..............................................................121<br />
Figure 54 Eastbound Broadway Boulevard at Tucson Boulevard .................................................121<br />
Figure 55 Eastbound Broadway Boulevard at Dodge Boulevard (El Con Mall) .........................122<br />
Figure 56 Eastbound Broadway Boulevard at Columbus Boulevard ...........................................122<br />
Figure 57 Eastbound Broadway Boulevard West <strong>of</strong> Columbus Boulevard (with Bus Lane) ....122<br />
Figure 58 Northbound 6th Avenue at Pennsylvania Drive ............................................................123<br />
Figure 59 Northbound 6th Avenue at 29th Street ............................................................................123<br />
Figure 60 Northbound 6th Avenue at Stone Avenue and 18th Street...........................................123<br />
Figure 61 Conventional Sun Tran Bus ...............................................................................................126<br />
Figure 62 System Alternative A ‐ Broadway Boulevard Corridor.................................................127<br />
Figure 63 System Alternative A ‐ 6th Avenue/Nogales Highway Corridor ................................128<br />
Figure 64 System Alternative B ‐ Campbell Avenue North Corridor ...........................................135<br />
Figure 65 HCT Implementation Monitoring Process.......................................................................164<br />
Figure 66 3rd Street Promenade (Santa Monica, CA) ......................................................................179<br />
Figure 67 Del Mar Station TOD (Pasadena, CA)..............................................................................180<br />
Figure 68 The Round at Beaverton Central TOD (outside Portland, OR) ....................................180<br />
Figure 69 Portland Streetcar Station at Portland State University.................................................181<br />
Figure 70 LRT Station TOD (Charlotte) .............................................................................................181<br />
Figure 71 Streetcar Station TOD (Dallas)...........................................................................................182<br />
Figure 72 Fan Pier TOD Before and After along Silver Line BRT (Boston) ..................................182<br />
Figure 73 Transit Village Concept ......................................................................................................187<br />
Figure 74 Building with Upper Floors “Stepped Back” from the Street (Tucson).......................196<br />
Figure 75 Massachusetts Bay Transportation Authority TOD Financing Programs (Boston)...198<br />
iv
High Capacity Transit System Plan - <strong>Final</strong> <strong>Report</strong> September 2009<br />
Table <strong>of</strong> Contents<br />
LIST OF TABLES<br />
Table 1 Existing SunTran Service Summary........................................................................................21<br />
Table 2 Existing Park‐and‐Ride Facilities in PAG Region .................................................................23<br />
Table 3 SunTran Operating Statistics (FY 2006‐2007).........................................................................24<br />
Table 4 CatTran Service Summary........................................................................................................26<br />
Table 5 Express Bus Peer Review Summary........................................................................................44<br />
Table 6 FTA BRT Characterization........................................................................................................47<br />
Table 7 BRT Peer Review Summary .....................................................................................................50<br />
Table 8 LRT Peer Review Summary .....................................................................................................55<br />
Table 9 Streetcar Peer Review Summary .............................................................................................58<br />
Table 10 Commuter Rail Peer Review Summary .............................................................................61<br />
Table 11 Additional LRT Cost Data....................................................................................................62<br />
Table 12 Additional Streetcar Cost Data............................................................................................63<br />
Table 13 Additional BRT Cost Data (Exclusive Right <strong>of</strong> Way Operations) ..................................63<br />
Table 14 Additional Commuter Rail Cost Data ................................................................................64<br />
Table 15 Summary <strong>of</strong> Premium Transit Technologies (Peer Review Systems)............................67<br />
Table 16 Development Density Thresholds for a Range <strong>of</strong> Transit Services................................69<br />
Table 17 Preliminary HCT Scenario in <strong>Pima</strong> County ......................................................................80<br />
Table 18 Task 5 Corridors and HCT Technology Alternatives.......................................................83<br />
Table 19 Features That Augment Transit Ridership ........................................................................86<br />
Table 20 Preliminary Ridership Estimates.........................................................................................96<br />
Table 21 ROW Availability Assessment ............................................................................................98<br />
Table 22 Preliminary Capital Cost Estimates....................................................................................99<br />
Table 23 Preliminary Operating Cost Estimates.............................................................................101<br />
Table 24 Existing Major Trip Generators with Walking Distance <strong>of</strong> HCT Corridors ...............105<br />
Table 25 Roadway Segment Operations Assessment ....................................................................109<br />
Table 26 Corridor Assessment Summary ........................................................................................114<br />
Table 27 Ridership Benefit vs. Investment in Capital ....................................................................117<br />
Table 28 Existing Major Trip Generators with Walking Distance <strong>of</strong> HCT Corridors ...............141<br />
Table 29 2040 Roadway Segment Operations .................................................................................142<br />
Table 30 Preliminary Capital Cost Estimates..................................................................................145<br />
Table 31 Preliminary Operating Cost Estimates.............................................................................147<br />
Table 32 RTA Funding for Transit Element ....................................................................................150<br />
Table 33 Sample Timeline for Implementation <strong>of</strong> BRT under Very Small Starts.......................168<br />
Table 34 HCT Implementation Plan .................................................................................................177<br />
v
High Capacity Transit System Plan - <strong>Final</strong> <strong>Report</strong> Septeber 2009<br />
Executive Summary<br />
PAG High Capacity Transit System Study<br />
PURPOSE<br />
As the population <strong>of</strong> eastern <strong>Pima</strong> County continues to grow from the current 1 million to some 1.8 million<br />
residents by 2040, expansion <strong>of</strong> the transportation system will be critical to maintain the high level <strong>of</strong> mobility<br />
that supports the quality <strong>of</strong> life and economic vitality <strong>of</strong> the region. With ever increasing fuel costs,<br />
skyrocketing costs to construct and maintain roads, and deepening concerns over climate change and other<br />
environmental issues, transit will serve an increasing role in achieving this goal.<br />
The <strong>Pima</strong> <strong>Association</strong> <strong>of</strong> <strong>Governments</strong> (PAG) has conducted this study to develop a High Capacity Transit<br />
(HCT) system plan for the region. HCT systems are intended to carry high volumes <strong>of</strong> passengers with fast<br />
and convenient service. The planning process for this study made use <strong>of</strong> the latest information related to<br />
existing and future population, employment, and transportation conditions in the region, assessed the<br />
applicability <strong>of</strong> different HCT transit modes and technologies, and gathered input from jurisdictions and<br />
agencies in the region, as well as the general public, on desirable HCT improvements. The resulting HCT<br />
System Plan defines incremental, sustainable, and cost‐effective steps for the implementation <strong>of</strong> HCT<br />
technologies to serve existing and future travel demand in the region. The HCT System Plan will be integrated<br />
into the transit element <strong>of</strong> the 2040 Regional Transportation System Plan now under development.<br />
RECENT TRANSIT SYSTEM IMPROVEMENTS<br />
Long‐range planning for the implementation <strong>of</strong> HCT was a component <strong>of</strong> the 2030 Regional Transportation<br />
Plan adopted in 2006. HCT elements included in this plan included express bus service, bus rapid transit<br />
(BRT), and streetcar. The Regional Transportation Authority’s (RTA) 20‐year transportation improvement<br />
program, funded by a voter‐approved ½ cent sales tax, includes the Tucson Modern Streetcar that is currently<br />
under design and scheduled to begin operation in 2011, as well as expansion <strong>of</strong> express bus service. The<br />
streetcar will run along a 4‐mile corridor providing circulation between the University <strong>of</strong> Arizona and<br />
downtown Tucson and will encourage transit‐supportive development/redevelopment along the route,<br />
illustrating the transportation and land‐use benefits <strong>of</strong> fixed‐rail HCT in the region.<br />
In response to increasing transit demand, SunTran recently expanded fixed route and express bus service. New<br />
routes have been added including circulator routes in Oro Valley, Green Valley, Marana and Sahuarita, bus<br />
frequency has increased, and hours <strong>of</strong> operation have been extended at night and on the weekends. To support<br />
the expanded transit system, SunTran has introduced new stylized express buses, has constructed new parkand‐ride<br />
lots as part <strong>of</strong> the increased express bus service, and is constructing a new maintenance facility to<br />
accommodate the expanded fleet.<br />
HCT MODES<br />
After completing an initial assessment <strong>of</strong> transit technologies, the HCT modes shown below were identified as<br />
the most likely to meet the study’s goals and objectives:<br />
vi
High Capacity Transit System Plan - <strong>Final</strong> <strong>Report</strong> June 2009<br />
Executive Summary<br />
Express Bus:<br />
• Faster than local bus service<br />
• Fewer stops than local bus service<br />
• Frequent service during peak periods<br />
• Point‐to‐point service<br />
Modern Streetcar:<br />
• Shorter trips served with more frequent<br />
stops<br />
• Encourages Transit Oriented Development<br />
Bus Rapid Transit (BRT):<br />
• Fewer stops, more frequent service, and<br />
longer trips served compared to local bus<br />
service<br />
• Encourages Transit Oriented Development<br />
• Significantly lower implementation and<br />
operations cost compared to LRT<br />
Light Rail Transit (LRT):<br />
• Higher speed and capacity than Modern<br />
Streetcar<br />
• Versatility allows operation in central<br />
business district or suburban areas<br />
• Encourages Transit Oriented Development<br />
Commuter Rail Transit (CRT):<br />
• High capacity service between city centers<br />
and suburban areas<br />
• High operating speeds over long<br />
distances with few stops<br />
CORRIDOR SCREENING EVALUATION<br />
Based on input from local stakeholders, sixteen corridors were identified as possible locations for HCT<br />
implementation, as shown in the Regional HCT Routes map. Discussion with the project’s Technical Advisory<br />
Committee (TAC), which was composed <strong>of</strong> representatives <strong>of</strong> local governments and agencies, narrowed the<br />
list to eight corridors for further analysis. The primary screening criteria used to assess and rank the eight<br />
HCT corridors included potential ridership, right‐<strong>of</strong>‐way availability, capital and operating costs.<br />
vii
High Capacity Transit System Plan - <strong>Final</strong> <strong>Report</strong> June 2009<br />
Executive Summary<br />
SYSTEM ALTERNATIVES<br />
The screening evaluation and TAC input led the project team to select two “priority” HCT corridors: Broadway<br />
Boulevard and 6th Avenue /Nogales Highway. No fatal flaws were identified for the other six HCT corridors,<br />
so these were addressed as part <strong>of</strong> a long‐term implementation plan.<br />
The project team developed three system alternatives for near‐term implementation based on the two priority<br />
HCT corridors. The system alternatives include multiple corridors and HCT technologies and address specific<br />
needs identified through the screening evaluation process. The recommended system alternatives are based on<br />
a plan that considers the fundamental factors <strong>of</strong> cost‐effective implementation and operation, consistency with<br />
land use, and service to major activity and employment centers.<br />
HCT IMPLEMENTATION STRATEGY<br />
Funding the Implementation <strong>of</strong> HCT<br />
The project team identified existing revenue sources available to the region for development and operation <strong>of</strong><br />
HCT and new revenue sources that can be investigated. Particular attention was paid to eligibility for federal<br />
funding since it is likely to be a very significant part <strong>of</strong> any HCT project and will influence the timeline <strong>of</strong><br />
project development. Various federal funding sources are available to fund capital costs, however they are very<br />
competitive and require local matching funds. As such, local and innovative revenue sources will need to be<br />
considered.<br />
Federal Funding<br />
• New Starts<br />
• Small Starts<br />
• Very Small Starts<br />
• Large Urban Cities Grants<br />
• Bus and Bus Facilities Grants<br />
Coordinating HCT with Land Use Planning<br />
Local Funding Opportunities<br />
• Special Assessment Districts<br />
• Impact Fees<br />
• Sales Tax; including RTA extension<br />
• Rental Car Surcharge<br />
• Vehicle Registration Fees<br />
• Advertising Rights<br />
• Increased/Special Fares<br />
• Parking Fees and Fines<br />
Land use planning is a critical component <strong>of</strong> successful HCT systems and transit‐oriented planning is tied to<br />
livability, economic development, and community pride. The general plans, land use codes, and development<br />
standards <strong>of</strong> the cities and towns affected by HCT include HCT and TOD‐supportive components, but<br />
opportunities exist to refine these plans and target TOD focusing on the following principles:<br />
• Recognition <strong>of</strong> a variety <strong>of</strong> station types/environments<br />
• Pedestrian focus<br />
• Mix <strong>of</strong> uses<br />
• Densities and intensities that encourage transit ridership<br />
• Management <strong>of</strong> parking and access to promote alternative mode use<br />
viii
High Capacity Transit System Plan - <strong>Final</strong> <strong>Report</strong> June 2009<br />
Executive Summary<br />
Corridor Implementation Plans<br />
An implementation scenario was developed with near‐term and long‐term staging <strong>of</strong> HCT for each potential<br />
corridor based on an assessment that identified opportunities and constraints for each case. As HCT is not an<br />
all‐or nothing investment, a monitoring methodology was described that can be used to guide the region in<br />
determining if, when, and how HCT can be implemented in a given corridor. The following map summarizes<br />
the development <strong>of</strong> individual corridor implementation plans including staging <strong>of</strong> HCT projects for near and<br />
long‐term.<br />
ix
High Capacity Transit System Plan - <strong>Final</strong> <strong>Report</strong> June 2009<br />
Executive Summary<br />
x
High Capacity Transit System Plan - <strong>Final</strong> <strong>Report</strong> June 2009<br />
Introduction<br />
1.0 INTRODUCTION<br />
1.1 BACKGROUND AND CONTEXT<br />
The <strong>Pima</strong> <strong>Association</strong> <strong>of</strong> <strong>Governments</strong> (PAG) has conducted an updated High Capacity Transit<br />
(HCT) System Plan study with the intent <strong>of</strong> developing an updated HCT system plan for the<br />
Tucson region. The planning process built in the latest information related to existing and future<br />
conditions in the study area, the applicability <strong>of</strong> different transit modes and technologies, and<br />
input from agencies and the general public on desired premium transit improvements. The study<br />
builds on the work conducted in 2003 that assessed HCT system needs and options in preparing<br />
the Transit Element <strong>of</strong> PAG’s 2030 Regional Transportation System Plan. The new HCT System<br />
Plan will be integrated into an updated 2040 Regional Transportation System Plan.<br />
1.2 PURPOSE OF THIS REPORT<br />
This report summarizes the work completed in developing the updated HCT System Plan. The<br />
work was organized in eight tasks:<br />
• Task 1: Project Management, Administration, and Coordination<br />
• Attend Technical Advisory Committee meetings.<br />
• Conduct interviews with key stakeholders as defined by PAG staff.<br />
• Task 2: Public Involvement<br />
• Participate in public meetings to obtain general public input on key issues applicable<br />
to HCT modes and corridors.<br />
• Task 3: Develop Building Quality for Arizona (BQAZ) Project Needs List<br />
• Develop a list <strong>of</strong> transportation improvement needs in the study area for inclusion in<br />
the BQAZ program.<br />
• Task 4: Initial Transit Technology/Conditions Assessment<br />
• Identify attributes <strong>of</strong> potential HCT modes, focusing on commuter rail, light rail,<br />
modern streetcar, bus rapid transit, and express bus service.<br />
• Identify land development, demographic, and trip pattern conditions that are<br />
conducive to HCT.<br />
• Identify existing and future (2040) conditions in the Tucson area related to land use,<br />
demographics, and trip patterns.<br />
• Identify corridors and subareas meeting transit mode warrants.<br />
• Task 5: Refined Corridor Assessment<br />
• Identify evaluation criteria to assess and compare HCT alternatives in designated<br />
corridors and subareas.<br />
1
High Capacity Transit System Plan - <strong>Final</strong> <strong>Report</strong> June 2009<br />
Introduction<br />
• Conduct a corridor assessment by applying the criteria developed to each potential<br />
corridor.<br />
• Task 6: Develop Updated HCT System Plan<br />
• Conduct a system integration assessment by packaging one or more HCT system<br />
alternatives to assess the impact on an overall regional level.<br />
• Develop a refined HCT system plan.<br />
• Task 7: Develop HCT Implementation Strategy<br />
• Identify potential funding sources including federal, state, local, and innovative<br />
sources.<br />
• Develop an implementation program based on estimated capital and operating costs<br />
and available funding sources, with short‐term, mid‐term, and long‐term paths.<br />
• Develop recommendations for land use policies and practices that the jurisdictions<br />
in the area can use to support and promote HCT.<br />
• Task 8: Develop <strong>Final</strong> <strong>Report</strong><br />
• Summarize the overall results <strong>of</strong> the PAG HCT System Plan process and include any<br />
additional TAC input.<br />
1.3 ORGANIZATION OF THIS REPORT<br />
This report is organized around the project tasks as follows:<br />
• Sections 2.0, 3.0, and 4.0 describe work accomplished under Task 4.<br />
• Section 5.0 describes work accomplished under Task 5.<br />
• Section 6.0 describes work accomplished under Task 6.<br />
• Sections 7.0, 8.0, and 9.0 describe work accomplished under Task 7.<br />
• Section 10.0 contains conclusions and recommendations for the entire project.<br />
2
High Capacity Transit System Plan - <strong>Final</strong> <strong>Report</strong> June 2009<br />
Existing Conditions<br />
2.0 EXISTING CONDITIONS<br />
2.1 INTRODUCTION<br />
Section 2.0 summarizes the existing conditions analysis that was conducted as part <strong>of</strong> Task 4 and<br />
consists <strong>of</strong> an assessment <strong>of</strong> existing demographic and transportation conditions. This analysis was<br />
conducted in June 2008, and the information presented is current as <strong>of</strong> that date. Some <strong>of</strong> the existing<br />
transit information has now changed as some <strong>of</strong> the transit improvements that were in the planning stages<br />
in June 2008 have now been implemented.<br />
2.2 DEMOGRAPHICS AND LAND USE<br />
Several demographic characteristics <strong>of</strong> the area can be potential indicators <strong>of</strong> propensity to use<br />
transit. Among these are population and employment density, income, car ownership, and age.<br />
Population Density<br />
The total population in <strong>Pima</strong> County has increased since 1980 with an average annual growth rate<br />
<strong>of</strong> approximately 2.4%. 1 All incorporated areas within <strong>Pima</strong> County have experienced population<br />
growth over the past decade, led by Sahuarita at 752% and Marana at 366%. Oro Valley had<br />
growth <strong>of</strong> 86%, and Tucson had growth <strong>of</strong> 18%. Growth in South Tucson at 6% is substantially<br />
lower than in other incorporated areas. 2<br />
Figure 1 presents existing population density by traffic analysis zone (TAZ) in the study area,<br />
expressed as persons per gross acre. Population density was categorized into five groups, with<br />
less than two households per gross acre representing the lowest density and greater than 15<br />
households per acre representing the highest density.<br />
Population density is lower on the west side <strong>of</strong> I‐10 and I‐19 than on the east side. Low<br />
population density is found in Marana, Oro Valley, Sahuarita, and the Santa Catalina Mountains<br />
foothills area. The highest population density is between 12th Avenue and 6th Avenue from<br />
1 University <strong>of</strong> Arizona Department <strong>of</strong> Urban Planning and Design<br />
2 <strong>Pima</strong> <strong>Association</strong> <strong>of</strong> <strong>Governments</strong><br />
3
High Capacity Transit System Plan - <strong>Final</strong> <strong>Report</strong> June 2009<br />
Existing Conditions<br />
south <strong>of</strong> I‐10 to the Tucson city limits. High population density is also found in the vicinity <strong>of</strong><br />
Stone Avenue from downtown Tucson to River Road. This high density is focused along Oracle<br />
Road, Stone Avenue, and 1 st Avenue. Along 22 nd Avenue and Golf Links Road‐36th Street, from<br />
Kolb Road to downtown Tucson, is an area <strong>of</strong> high population density. There are other TAZs<br />
with high population density; however, these are isolated and do not occur in large areas or<br />
corridors.<br />
Employment Density<br />
Figure 2 shows existing employment density by TAZ in the study area. Employment density was<br />
categorized into five groups, with 0 to 5 employees per gross acre representing the lowest density<br />
and greater than 50 employees per gross acre representing the highest density.<br />
Most areas <strong>of</strong> the county show a density <strong>of</strong> less than 5 employees per gross acre. Only a few<br />
isolated areas contain a density <strong>of</strong> greater than 50 employees per gross acre, and there are no<br />
large areas or corridors <strong>of</strong> high employment density. Although UA is one <strong>of</strong> the largest employers<br />
in the study area, it does not have high employment density. Small areas <strong>of</strong> high employment<br />
density can be found in downtown Tucson and in the areas around the Tucson International<br />
Airport (TIA). There is also high employment density in the Tanque Verde Triangle retail and<br />
<strong>of</strong>fice development area.<br />
Transit-Dependent Population<br />
Three demographic characteristics that have been identified as attributes <strong>of</strong> transit dependency<br />
are low‐income households, zero‐car households, and persons in the age groups <strong>of</strong> 5‐19 years and<br />
65+ years.<br />
Low-Income Population<br />
Figure 3 presents the existing density <strong>of</strong> low‐income households based on an income <strong>of</strong> $40,000<br />
per year or less. A large area in the southeast part <strong>of</strong> the study area between I‐19 and I‐10 is<br />
composed <strong>of</strong> TAZs with greater than 85% <strong>of</strong> households earning a median income <strong>of</strong> $40,000 or<br />
less. East <strong>of</strong> 6th Avenue between 29th Street and Ajo Highway is an area with a high density <strong>of</strong><br />
low‐income households. Along Broadway Boulevard and Speedway Boulevard south and west <strong>of</strong><br />
the University <strong>of</strong> Arizona (UA) is an area with a high density <strong>of</strong> low‐income households. Between<br />
Oracle Road and Stone Avenue from Speedway Boulevard to Prince Road is a corridor with a<br />
high density <strong>of</strong> low‐income households. Other areas with a high density <strong>of</strong> low‐income<br />
households are Alvernon Way between 5th Street and Prince Road and the north side <strong>of</strong> Drexel<br />
Road. Along Tangerine Road are TAZs with a high density <strong>of</strong> low income households.<br />
4
High Capacity Transit System Plan - <strong>Final</strong> <strong>Report</strong> June 2009<br />
Existing Conditions<br />
Figure 1<br />
Existing Population Density<br />
5
High Capacity Transit System Plan - <strong>Final</strong> <strong>Report</strong> June 2009<br />
Existing Conditions<br />
Figure 2<br />
Existing Employment Density<br />
6
High Capacity Transit System Plan - <strong>Final</strong> <strong>Report</strong> June 2009<br />
Existing Conditions<br />
Figure 3<br />
Existing Low-Income Population Density<br />
7
High Capacity Transit System Plan - <strong>Final</strong> <strong>Report</strong> June 2009<br />
Existing Conditions<br />
Zero-Car Households<br />
Figure 4 presents the percentage <strong>of</strong> households in each TAZ with zero cars available. More than<br />
50% <strong>of</strong> the households in most <strong>of</strong> the TAZs have at least one car available. The highest<br />
percentages <strong>of</strong> households with no cars available are in downtown Tucson and north <strong>of</strong><br />
downtown Tucson on the west side <strong>of</strong> Oracle Road. On the east side <strong>of</strong> 6th Avenue is another<br />
area where a relatively large percentage <strong>of</strong> households have no car available. Also, along 6th<br />
Avenue from downtown Tucson to Irvington Road are areas with a relatively high percentage <strong>of</strong><br />
zero‐car households. Along Grant Road and Country Club Road, between Swan Road and<br />
Craycr<strong>of</strong>t Road, is an area with a moderately high percentage <strong>of</strong> zero‐car households. Other TAZs<br />
with a moderately high percentage <strong>of</strong> zero‐car households are generally isolated.<br />
Age<br />
Figure 5 presents persons in the age groups <strong>of</strong> 5 years to 19 years or 65 years and above by<br />
Census tract. The percentage <strong>of</strong> individuals in either <strong>of</strong> those age groups is displayed. For most <strong>of</strong><br />
the study area, fewer than 35% <strong>of</strong> individuals fall into those age groups. Few areas have more<br />
than 50% <strong>of</strong> individuals falling into those age groups. Along La Cañada Drive north <strong>of</strong> River<br />
Road are two such areas, and southwest <strong>of</strong> Sahuarita is a large area with these age group<br />
characteristics. There is also an area with more than 50% <strong>of</strong> individuals falling into those age<br />
groups in the vicinity <strong>of</strong> UA.<br />
Land Use<br />
Transit service is influenced by land use and the location <strong>of</strong> major trip generators including large<br />
employers, regional shopping malls, community shopping centers, government facilities,<br />
colleges, and health care facilities. Figure 6 presents the land uses in the study area, and Figure 7<br />
identifies major trip generators.<br />
Most <strong>of</strong> the residential land use is located north and east <strong>of</strong> downtown Tucson. Between I‐10 and<br />
the Santa Catalina Mountains, the land use is primarily residential, although there are other uses<br />
in the area. Commercial areas are spread throughout the study area, mostly located among<br />
residential land use between I‐10 and the Santa Catalina Mountains. Major commercial<br />
developments are also located around TIA and north <strong>of</strong> I‐10 between Kino Parkway and Davis‐<br />
Monthan Air Force Base. Institutional land use, which includes educational, medical, and other<br />
facilities, is located throughout the study area, as is <strong>of</strong>fice land use. There is a large Native<br />
American community generally located in the area between Ajo Highway and I‐19. A significant<br />
portion <strong>of</strong> the land use in the study area is parks and includes the Coronado National Forest in<br />
the northeast, Saguaro National park in the east, and Santa Rita Experimental Range in the<br />
southeast. Two large areas <strong>of</strong> mining land use are located in the southern part <strong>of</strong> the study area,<br />
west <strong>of</strong> I‐19. A large portion <strong>of</strong> the southeastern part <strong>of</strong> the study area between I‐10 and I‐19 is<br />
agricultural and vacant land, as is the southwest portion <strong>of</strong> the study area. In the northern part <strong>of</strong><br />
the study area between I‐10 and the Santa Catalina Mountains are vacant and agricultural areas.<br />
8
High Capacity Transit System Plan - <strong>Final</strong> <strong>Report</strong> June 2009<br />
Existing Conditions<br />
Figure 4<br />
Existing Zero-Car Households<br />
9
High Capacity Transit System Plan - <strong>Final</strong> <strong>Report</strong> June 2009<br />
Existing Conditions<br />
Figure 5<br />
Existing Elderly/Youth Population<br />
10
High Capacity Transit System Plan - <strong>Final</strong> <strong>Report</strong> June 2009<br />
Existing Conditions<br />
Figure 6<br />
Existing Land Use<br />
11
High Capacity Transit System Plan - <strong>Final</strong> <strong>Report</strong> June 2009<br />
Existing Conditions<br />
Figure 7<br />
Existing Major Trip Generators<br />
12
High Capacity Transit System Plan - <strong>Final</strong> <strong>Report</strong> June 2009<br />
Existing Conditions<br />
The Rio Nuevo development is a major mixed‐use development and redevelopment effort in<br />
downtown Tucson. Over $800 million in investment in this area is planned over the next 20 years,<br />
including 600,000 square feet <strong>of</strong> new or improved cultural facilities, 1.5 million square feet <strong>of</strong><br />
retail, and 1,000 new residential units. The complete development will total 4.6 million square feet<br />
Major Trip Generators<br />
The area southeast <strong>of</strong> downtown Tucson contains several <strong>of</strong> the largest employers in <strong>Pima</strong><br />
County. Along Nogales Highway between Valencia Road and Hughes Access Road are two <strong>of</strong> the<br />
principal employers in the study area. Raytheon Missile Systems is the largest in the region with<br />
over 11,000 employees. TIA has a workforce <strong>of</strong> over 5,000 people, and the industrial and<br />
commercial developments around the airport employ thousands <strong>of</strong> additional workers. Davis‐<br />
Monthan Air Force Base is also one <strong>of</strong> the region’s main employers, with over 9,000 personnel.<br />
Also located in the general vicinity is the UA Technology Park, which employs over 7,500 people.<br />
UA, located east <strong>of</strong> downtown Tucson, is one <strong>of</strong> the core employers, with a staff <strong>of</strong> over 10,000.<br />
Among the leading commercial employers is Tucson Mall, located in northern Tucson and<br />
employing more than 4,500 people. Two regional shopping centers are located along Broadway<br />
Boulevard east <strong>of</strong> downtown. Also located on Broadway Boulevard east <strong>of</strong> downtown is Williams<br />
Center, a retail area with 3,000 employees. The TAZs in the downtown area <strong>of</strong> Tucson reflect<br />
thousands <strong>of</strong> workers, although no single organization dominates the percentage <strong>of</strong> employees.<br />
Other major employers include <strong>Pima</strong> Community College with several campuses, the Veterans<br />
Administration Medical Center, and two major casinos located in Native American communities.<br />
Trip Patterns<br />
Travel assessment was conducted based on aggregating TAZs into larger super zones consistent<br />
with the Transit Element <strong>of</strong> the 2030 Regional Transportation Plan (RTP). The super zones that<br />
were used were the same as those in the previous study as identified by PAG. The super zones<br />
represent major travel destinations such as UA or the Town <strong>of</strong> Marana. Volumes used are from<br />
PAG’s regional travel forecasting model and are presented as origin‐to‐destination (O‐D) pairs in<br />
Figure 8 and Figure 9.<br />
Existing work person‐trips are most concentrated in the central areas <strong>of</strong> Tucson. The heaviest<br />
volume <strong>of</strong> trips occurs between outlying areas and central Tucson, with fewer work trips between<br />
outlying areas. There are a large number <strong>of</strong> work trips between the west Tucson area to the<br />
central area <strong>of</strong> Tucson (including downtown Tucson and UA). There are also a large number <strong>of</strong><br />
trips between the east Tucson area and the central Tucson as well as eastern portions <strong>of</strong> the study<br />
area. Trips between the central Tucson area and northern portions <strong>of</strong> the study area (such as the<br />
Oro Valley area and the Cañada del Oro area) are high. Work trips between the central Tucson<br />
area and the Sahuarita/Green Valley area are low. Also low are trips between central Tucson and<br />
the Tucson Southeast area and between central Tucson and the Marana area.<br />
13
High Capacity Transit System Plan - <strong>Final</strong> <strong>Report</strong> June 2009<br />
Existing Conditions<br />
Figure 8<br />
Existing Trip O-D Patterns − Work Person-Trips<br />
14
High Capacity Transit System Plan - <strong>Final</strong> <strong>Report</strong> June 2009<br />
Existing Conditions<br />
Figure 9<br />
Existing Trip O-D Patterns − Total Person-Trips<br />
15
High Capacity Transit System Plan - <strong>Final</strong> <strong>Report</strong> June 2009<br />
Existing Conditions<br />
Total person‐trip patterns are generally similar to work person‐trip patterns. The heaviest<br />
volumes <strong>of</strong> total trips occur between the central Tucson area and western and eastern portions <strong>of</strong><br />
the study area. Particularly heavy are trips between the Flowing Wells area and other areas<br />
including Cañada del Oro TAZ, west Tucson, central/north Tucson, and central/east Tucson. Total<br />
trips are low between the central Tucson areas and outlying areas such as Marana, southeast<br />
Tucson, and Sahuarita/Green Valley.<br />
2.3 TRANSPORTATION SYSTEM<br />
Traffic Volumes and Level <strong>of</strong> Service<br />
As shown in Figure 10, the most heavily congested corridor in the study area is the I‐10 corridor.<br />
Most areas experience some congestion, with heavy congestion along many parts <strong>of</strong> I‐10 heading<br />
northwest <strong>of</strong> downtown Tucson. The segment <strong>of</strong> I‐10 heading southeast <strong>of</strong> downtown Tucson is<br />
also congested, although not as severely. Nogales Highway in the area <strong>of</strong> TIA has congestion and<br />
areas that are over capacity from Valencia to Old Vail Connection Road. Oracle Road from<br />
downtown Tucson to the northern part <strong>of</strong> the study area is congested, with areas <strong>of</strong> moderate and<br />
heavy congestion. Valencia Road west <strong>of</strong> I‐19 has areas <strong>of</strong> heavy congestion and over‐capacity<br />
conditions. East <strong>of</strong> downtown Tucson, Grant Road has many areas <strong>of</strong> congestion, as do River<br />
Road and Ft. Lowell Road. Congestion occurs on Stone Avenue from downtown Tucson to Ft.<br />
Lowell Road, and Euclid Avenue‐1 st Avenue has areas <strong>of</strong> congestion from Broadway Boulevard to<br />
River Road. Congestion is light throughout the Broadway Boulevard corridor west <strong>of</strong> I‐10, but is<br />
heavy near downtown. Speedway Boulevard is lightly congested; some areas <strong>of</strong> moderate<br />
congestion exist.<br />
Public Transit System<br />
The PAG region is served by four fixed‐route systems: SunTran, CatTran, Downtown Loop, and<br />
<strong>Pima</strong> County Rural Services. Figure 11 shows the overall service coverage <strong>of</strong> these systems. Each<br />
system is described in more detail in the following sections. The information below regarding routes<br />
and facilities is current as <strong>of</strong> June 2008. Some modifications in service and route numbers have occurred<br />
since that time.<br />
SunTran<br />
SunTran is the City <strong>of</strong> Tucson−administered public transit provider and is the largest such<br />
provider in the study area. Routes are primarily in the City <strong>of</strong> Tucson but do extend into other<br />
incorporated and unincorporated areas in the region.<br />
16
High Capacity Transit System Plan - <strong>Final</strong> <strong>Report</strong> June 2009<br />
Existing Conditions<br />
Figure 10<br />
Existing Traffic Level <strong>of</strong> Service<br />
17
High Capacity Transit System Plan - <strong>Final</strong> <strong>Report</strong> June 2009<br />
Existing Conditions<br />
Figure 11<br />
Fixed-Route Transit Service Coverage in the PAG Region<br />
18
High Capacity Transit System Plan - <strong>Final</strong> <strong>Report</strong> June 2009<br />
Existing Conditions<br />
Routes<br />
The SunTran service comprises 40 fixed routes, 27 <strong>of</strong> which operate seven days a week and 13 <strong>of</strong><br />
which operate on weekdays only. Thirteen <strong>of</strong> the routes operate as express service during<br />
weekdays. Figure 12 identifies the overall SunTran route system. Table 1 identifies the service<br />
frequency, span <strong>of</strong> service, and 2006‐2007 average daily ridership for each route. Hours <strong>of</strong><br />
operation vary, beginning as early as 4:45 a.m. and extending past midnight for some routes.<br />
Headways also vary by route, with some as short as ten minutes during peak periods and some<br />
as long as one hour during non‐peak periods. Highlights <strong>of</strong> SunTran’s busiest routes are as<br />
follows:<br />
• Route #8 has the highest weekday and weekend ridership by a substantial margin over all<br />
other routes. The route has several thousand riders per weekday more than any other<br />
route, for a total <strong>of</strong> over 10,000 riders per day during the weekday. The route originates<br />
and terminates at Laos Transit Center, running along 6th Avenue through downtown<br />
Tucson and Ronstadt Transit Center, then along Broadway Boulevard. The route then<br />
travels north along Wilmot Road to Grant Road and returns to Broadway Boulevard,<br />
where it continues to Harrison Street. The route provides access to the Veteran’s<br />
Administration Hospital, the El Con Mall, and Park Place Mall.<br />
• Route #16 has the second highest weekday and weekend ridership, with an average<br />
weekday ridership <strong>of</strong> over 6,000. The route begins at Laos Transit Center and travels north<br />
along 10th Avenue to downtown Tucson and Ronstadt Transit Center. The route<br />
continues north along Stone Avenue to Drachman Street, where it then proceeds along<br />
Oracle Road to Tohono Transit Center. The route progresses further north to Ina Road and<br />
east to Regency Plaza Street. Notable points <strong>of</strong> service include Pueblo High School, Amphi<br />
High School, the Tucson Mall, and Casas Adobes Plaza.<br />
• Route# 4 has the third highest weekday and weekend ridership, exceeding 5,000 riders per<br />
day during weekdays. The route begins and terminates at Ronstadt Transit Center and<br />
travels through downtown Tucson and along 6th Avenue to Speedway Boulevard. The<br />
route travels east on Speedway Boulevard to Kolb Road and south along Kolb Road to<br />
Golf Links Road. Returning on Kolb Road to Speedway Boulevard, the route continues<br />
further east to Harrison Street. This route provides service to UA.<br />
• Routes #6 and 11 have the fourth and fifth highest weekday and weekend ridership, with<br />
an average <strong>of</strong> over 4,000 riders per weekday. Both routes are operated from Laos Transit<br />
Center and provide service to TIA. Both routes run primarily along Alvernon Way,<br />
including service to Randolph Recreation Center, Palo Verde Industrial Park, and<br />
University Physicians Hospital.<br />
19
High Capacity Transit System Plan - <strong>Final</strong> <strong>Report</strong> June 2009<br />
Existing Conditions<br />
Figure 12<br />
SunTran Route Network<br />
20
High Capacity Transit System Plan - <strong>Final</strong> <strong>Report</strong> June 2009<br />
Existing Conditions<br />
Route<br />
Table 1<br />
Existing SunTran Service Summary<br />
Service Frequency<br />
(minutes)<br />
Service Period (a.m./p.m.)<br />
Average Daily Ridership<br />
M-F SAT SUN M-F SAT SUN M-F SAT SUN<br />
1-Glenn Swan 30-60 60 60 6:00/11:00 6:30/9:30 7:30/8:30 1,836 826 467<br />
2-Cherrybell/Country Club 30-60 60 60 5:15/11:30 7:00/7:00 8:18/7:00 1,373 618 349<br />
3-6th St./Wilmot 30-60 60 60 5:00/11:45 5:00/10:00 6:30/8:30 3,060 1,376 778<br />
4-Speedway 20-60 20-60 20-60 5:03/12:15 6:10/9:50 7:15/8:45 5,139 2,312 1,306<br />
5-<strong>Pima</strong> St./W. Speedway 30-60 60 60 5:45/7:30 6:30/7:30 7:45/7:30 1,374 618 349<br />
6-S. Park Ave/N 1 st Ave 15-60 30-60 60 4:45/12:00 6:30/9:30 6:15/8:30 4,279 1,925 1,088<br />
7-22 nd Street 30-60 60 60 6:00/11:30 6:00/9:00 7:00/8:00 2,532 1,139 644<br />
8-Broadway/6th Ave 10-30 15-30 20 4:45/12:00 5:30/9:30 6:10/8:50 10,617 4,776 2,699<br />
9-Grant Road 30-60 60 60 4:30/11:30 6:15/9:00 7:15/8:45 2,272 1,022 577<br />
10-Flowing Wells 30-40 60 60 6:00/11:30 7:00/9:20 7:00/8:30 1,646 740 418<br />
11-Alvernon Way 30-60 60 60 5:50/11:00 6:35/9:20 6:30/8:25 4,095 1,842 1,041<br />
15-Campbell Ave 15-60 60 60 5:30/11:40 6:30/9:15 7:40/8:15 1,802 811 458<br />
16-Oracle/12th Ave 15-60 30-60 30-60 5:00/11:50 5:40/9:30 5:40/9:00 6,062 2,727 1,541<br />
17-Country Club/29th St 25-60 60 60 5:40/11:10 6:15/9:45 7:15/8:45 2,448 1,101 622<br />
19-Stone 30-60 30-60 60 5:45/11:00 7:15/9:30 6:45/8:45 1,639 737 417<br />
20-W Grant/Ironwood Hills 30-60 - - 6:00/6:30 - - 505 - -<br />
21-W Congress/Silverbell 30-60 30 60 6:00/11:15 6:20/7:30 7:20/4:30 694 312 176<br />
22-Grande 30-60 60 60 5:45/11:10 6:00/9:15 7:00/8:30 669 301 170<br />
23-Mission Rd 25-60 60 60 5:00/11:00 7:00/7:15 8:00/6:40 1,482 667 377<br />
24-South 12th Ave 60 60 60 4:45/9:30 5:00/9:00 7:45/8:45 905 407 230<br />
26-Benson Highway 30-60 60 60 5:40/11:10 6:30/7:30 8:30/6:30 1,222 550 311<br />
27-Midvale Park Rd 30-40 60 60 5:45/10:40 7:15/7:10 8:15/6:15 725 326 184<br />
29-Valencia 25-40 60 60 5:45/11:15 6:15/9:15 8:18/6:15 1,539 692 391<br />
34-Craycr<strong>of</strong>t/Ft Lowell 20-60 60 60 6:00/11:30 6:30/9:20 7:30/8:20 1,981 891 504<br />
37-Pantano 30 - - 5:40/7:40 - - 699 - -<br />
50-Ajo Way 30-60 60 60 6:00/9:30 6:30/8:00 8:40/6:00 661 297 168<br />
61-La Cholla 30 60 60 5:50/8:10 6:00/6:50 6:00/5:50 533 240 136<br />
81-Tanque Verde(Express) 15-30 - - 6:40/6:00 - - 76 - -<br />
82-Broadway(Express) 10-20 - - 6:40/5:50 - - 160 - -<br />
83-Golf Links(Express) N/A - - 6:50/5:50 - - 73 - -<br />
102-Ina Rd(Express) 15-20 - - 6:30/6:00 - - 152 - -<br />
103-Oldfather(Express) 30 - - 6:30/6:00 - - 49 - -<br />
105-Sunrise(Express) N/A - - 6:20/6:30 - - 12 - -<br />
106-Swan(Express) N/A - - 7:00/6:00 - - 24 - -<br />
162-Oro Valley(Express) 30-60 - - 5:30/7:00 - - 53 - -<br />
180-Aero Park Speedway<br />
*<br />
(Express)<br />
15-60 - - 5:30/5:45 - - 66 - -<br />
186-Aero Park Ina (Express) 10-60 - - 5:30/6:45 - - 127 - -<br />
391-Marana (Express) 20-60 - - 6:40/6:10 - - 9 - -<br />
21
High Capacity Transit System Plan - <strong>Final</strong> <strong>Report</strong> June 2009<br />
Existing Conditions<br />
Facilities<br />
The SunTran fleet currently has 203 vehicles and serves three transit centers. Ronstadt Transit<br />
Center is located in downtown Tucson, Roy Laos Transit Center is on the south side <strong>of</strong> Tucson on<br />
Irvington Road west <strong>of</strong> 6th Avenue, and Tohono Tadai Transit Center is on the north side <strong>of</strong><br />
Tucson on Stone Avenue. All vehicles in the fleet are wheelchair‐accessible and use biodiesel fuel<br />
or compressed natural gas. A network <strong>of</strong> 22 small park‐and‐ride lots is served by the system,<br />
some <strong>of</strong> which are owned by the City <strong>of</strong> Tucson and some <strong>of</strong> which are used through agreements<br />
with other organizations. Table 2 describes the SunTran park‐and‐ride facilities.<br />
Operating Performance<br />
Pertinent operating performance statistics for the different SunTran routes are presented in Table<br />
3. The table reveals that seven <strong>of</strong> the 13 current express routes (the #81, 103, 105, 106, 142, 180, and<br />
301) are considered substandard based on the three performance indicators in the table<br />
(passengers per mile, passengers per hour, and cost per passenger). The #83 express route is the<br />
only express route considered to have a superior performance based on all three indicators. Of the<br />
27 local routes, 14 have been rated superior. The #19 local route is the top performer in terms <strong>of</strong><br />
passengers per mile and cost per passenger, and the #8 local route is the top performer in terms <strong>of</strong><br />
passengers per hour.<br />
CatTran<br />
CatTran is the UA shuttle program. It operates Monday to Friday from 6:30 a.m. to 6:30 p.m.,<br />
with a night service operating from 6:00 p.m. to 12:30 a.m. During university holidays and<br />
semester breaks, service is limited. Service is free on the UA campus; however, access from lots is<br />
restricted to permit‐holders and university‐affiliated area residents. Five park‐and‐ride lots (9005,<br />
9006, 9007, 9008, and 9009) are served by CatTran.<br />
Routes<br />
The CatTran service comprises six routes, as shown in Figure 13. Table 4 provides a service<br />
summary for the system, including service frequency, span <strong>of</strong> service, and average daily<br />
ridership. The CatTran routes are described as follows:<br />
• The USA Route serves Park‐and‐Ride Lot 9006 on Main Avenue and Fifth Street and stops<br />
at University Services Building, Maingate Garage, McClelland Hall, CCIT, Civil<br />
Engineering, University Boulevard/Euclid Avenue, 4th Avenue at 6th Street, and<br />
downtown Tucson.<br />
• The Purple Route provides service along 4th Street between Park Avenue and Cherry<br />
Avenue and along Cherry Avenue to the Arizona Health Sciences Center and 6th Street<br />
Garage.<br />
22
High Capacity Transit System Plan - <strong>Final</strong> <strong>Report</strong> June 2009<br />
Existing Conditions<br />
Table 2<br />
Location<br />
Existing Park-and-Ride Facilities in PAG Region<br />
Number <strong>of</strong><br />
Spaces<br />
Route Service<br />
Owner<br />
Himmel Park- 1000 N Tucson Blvd; 1 st St/Forgeus 22 4 Private<br />
Reid Park- 22 nd Street & Randolph Way 37 7 Private<br />
Coronado Baptist Church- 2609 N Park at Copper n/a 1 Private<br />
South <strong>of</strong> Tohono Tadai Transit Center; Stone/Wetmore 18/20<br />
Laos Transit Center- 6th Ave & Irvington 39<br />
6, 10, 15, 16, 19,<br />
34, 61, 105, 162<br />
2, 6, 8, 11, 16, 23,<br />
24, 26, 27, 29, 50<br />
City <strong>of</strong> Tucson<br />
City <strong>of</strong> Tucson<br />
PCC Desert Vista Campus- Drexel & Calle Santa Cruz 105 27 PCC<br />
Irvington & Santa Cruz River 34 23 City <strong>of</strong> Tucson<br />
Safeway Center- 8740 E Broadway at Camino Saco n/a 8, 82 Private<br />
Golf Links & Kolb 75 4, 17, 83 City <strong>of</strong> Tucson<br />
PCC East Campus- Fred Enke Dr & Irvington n/a 3, 37 PCC<br />
Speedway & Harrison 50 4, 8, 180 City <strong>of</strong> Tucson<br />
Ft Lowell Park- 2900 N Craycr<strong>of</strong>t at Glenn 60 34 Private<br />
Bear Canyon Plaza- Catalina Hwy/Tanque Verde 25+ 81 Private<br />
I-10 & Ruthrauff; Frontage Road 30 17 Private<br />
North <strong>Pima</strong> Center- Ina & Thornydale 16 16, 102, 103, 186 Private<br />
Ina & Via Ponte 16 16, 103 Private<br />
Oracle Plaza- Oracle & Orange Grove 20 16, 103 Private<br />
Victory Assembly <strong>of</strong> God Church- 2561 W Ruthrauff at Plane<br />
Ave<br />
22 17 Private<br />
PCC Northwest Campus- Shannon & Campus Park Way n/a 61 PCC<br />
Marana- SW Corner <strong>of</strong> Cortaro & AZ Pavilions Dr 50 391 Private<br />
PCC West Campus- Greasewood & Anklam 70 5, 3 PCC<br />
Archer Neighb. Center- 1665 S LaCholla Blvd at San Marcos 18 23 Private<br />
NOTE: CatTran park-and-ride lots are not included.<br />
• The Mauve Route serves the 9008 Park/Ride Lot and goes to the McKale area, Main<br />
Library, Arizona Health Sciences Center, and the Recreation Center. Service is also along<br />
6th Street between Campbell Avenue and Highland Avenue, and along Cherry Avenue to<br />
the Arizona Health Sciences Center and 6th Street Garage.<br />
• The Teal Route provides service to the Arizona Health Sciences Center, Maingate Garage,<br />
and Civil Engineering.<br />
• The Orange Route provides service to Park‐and‐Ride Lots 9005, 9007, and 9009. Service<br />
runs along Mountain Avenue to Ft. Lowell Road.<br />
• The NightCat route is the night service, which operates from 6:00 p.m. to 12:30 a.m. with<br />
no service between 8:00 p.m. and 8:30 p.m. Service is along 6th Street from Euclid Avenue<br />
to Highland Avenue and along Cherry Avenue to Arizona Health Sciences Center. Service<br />
is provided to the Highland Garage and along Mountain Avenue, Park Avenue, and<br />
University Boulevard to Euclid Avenue.<br />
23
High Capacity Transit System Plan - <strong>Final</strong> <strong>Report</strong> June 2009<br />
Existing Conditions<br />
Table 3 SunTran Operating Statistics (FY 2006-2007)<br />
24
High Capacity Transit System Plan - <strong>Final</strong> <strong>Report</strong> June 2009<br />
Existing Conditions<br />
Figure 13<br />
CatTran Route Network<br />
25
High Capacity Transit System Plan - <strong>Final</strong> <strong>Report</strong> June 2009<br />
Existing Conditions<br />
Route<br />
Table 4<br />
Service Frequency<br />
(minutes)<br />
CatTran Service Summary<br />
Hours <strong>of</strong> Service<br />
Average Weekday Daily<br />
Ridership<br />
USA Route Approx. 15 to 30 6:39 a.m. to 6:28 p.m. 195<br />
Purple Route 13 6:30 a.m. to 6:23 p.m. 374<br />
Mauve Route 14 6:30 a.m. to 6:30 p.m. 378<br />
Teal Route 13 6:30 a.m. to 6:30 p.m. 664<br />
Orange Route 16 6:40 a.m. to 6:26 p.m. 464<br />
NightCat Route 30<br />
6:30 p.m. to 12:30 a.m.<br />
(no service 8:00 p.m. to 8:30 p.m.)<br />
23<br />
Facilities<br />
The CatTran fleet comprises 18 buses. These include clean biodiesel engine vehicles and gasoperated<br />
vehicles. The CatTran service contains a network <strong>of</strong> six park‐and‐ride lots located near<br />
the main campus at the following locations:<br />
• 9005 is located on Mountain Avenue between Adelaide Drive and Glenn Street<br />
• 9006 is located at the intersection <strong>of</strong> Main Avenue and Fifth Street<br />
• 9007 is located on Mountain Avenue between Ft Lowell Road and Hedrick Drive<br />
• 9008 is located on the northeast quadrant <strong>of</strong> 13th Street and Plummer Avenue<br />
• 9009 is located at the St. Demetrious Greek Orthodox Church on the northwest quadrant<br />
<strong>of</strong> Mountain Avenue and Ft. Lowell Road<br />
Downtown Loop<br />
Downtown Loop is a service operated by ParkWise, the City <strong>of</strong> Tucson Department <strong>of</strong><br />
Transportation parking division. The service operates Monday to Friday from 6:30 a.m. to 5:30<br />
p.m. at 30 minute intervals and includes 12 stops. The Downtown Loop consists <strong>of</strong> one route<br />
which begins on Toole Avenue and travels to Congress Street where it heads west and onto<br />
Bonita Avenue. The route then continues on Bonita Avenue and deviates onto Commerce Park<br />
Loop then turns onto St. Mary’s Road. The route travels along Granada Avenue and returns to<br />
Toole Avenue by going through downtown. The route is shown in Figure 14.<br />
26
High Capacity Transit System Plan - <strong>Final</strong> <strong>Report</strong> June 2009<br />
Existing Conditions<br />
Figure 14<br />
Downtown Loop Route Network<br />
27
High Capacity Transit System Plan - <strong>Final</strong> <strong>Report</strong> June 2009<br />
Existing Conditions<br />
<strong>Pima</strong> County Rural Transit<br />
<strong>Pima</strong> County Rural Transit is composed <strong>of</strong> wheelchair‐accessible vans with a capacity <strong>of</strong> 15<br />
passengers serving areas outside <strong>of</strong> the Tucson city limits. The service area is covered by six<br />
routes with varying fares and transfers to Sun Tran routes:<br />
• Ajo Dial‐A‐Ride Route provides service in the Ajo area. The service operates Monday to<br />
Friday, beginning at 8:00 a.m. and ending at 5:00 p.m.<br />
• Marana Service Area Route is a fixed‐route community service operator within the Town<br />
<strong>of</strong> Marana and unincorporated <strong>Pima</strong> County, providing access to commercial and<br />
business centers along Ina Road and Thornydale Road east <strong>of</strong> I‐10.<br />
• San Xavier Access Route is a service that provides residents <strong>of</strong> the San Xavier area with<br />
access to Tucson. The service makes ten round trips during the weekday and nine round<br />
trips on Saturday, with no service on Sunday.<br />
• Tucson Estates Service Area Route operates on Monday to Friday and makes eight trips<br />
per day between the Laos Transit Center and the Tucson Estates area along Irvington<br />
Road.<br />
• The Green Valley & Sahuarita Circulator Route operates on Monday, Tuesday, Thursday,<br />
and Saturday only. The service area includes the Madera Market and the Green Valley<br />
Mall. Service is also provided south to the Desert Hills Social Center.<br />
• Green Valley & Sahuarita Regional Connector Route operates on Monday to Friday<br />
between 5:30 a.m. and 8:30 a.m. as well as 3:30 p.m. and 6:30 p.m. Service begins at the<br />
Laos Transit Center and travels to Sahuarita and Green Valley along I‐19, returning via<br />
Old Nogales Highway.<br />
Other Public Transit Providers<br />
Coyote Run<br />
Coyote Run is a transit service operated by the Town <strong>of</strong> Oro Valley that includes a door‐to‐door<br />
service requiring advance reservations. The service is restricted to transit‐dependent residents<br />
who are 62 years <strong>of</strong> age and older or residents who are eligible under the ADA. The service area<br />
includes Oro Valley as well as destinations such as St. Mary’s Hospital, University Medical<br />
Center, Tucson Medical Center, and the Tohono Tadai Transit Center. Hours <strong>of</strong> operation are<br />
Monday to Friday between 8:00 a.m. and 5:00 p.m.<br />
28
High Capacity Transit System Plan - <strong>Final</strong> <strong>Report</strong> June 2009<br />
Existing Conditions<br />
Sun Van<br />
Sun Van is a paratransit service operated by the City <strong>of</strong> Tucson for eligible individuals under the<br />
ADA who are unable to use SunTran fixed‐route services. The service area is along SunTran<br />
routes and extends to an area ¾ <strong>of</strong> a mile on either side <strong>of</strong> a road served by the SunTran route.<br />
Trips must be scheduled in advance within the hours <strong>of</strong> operation, which are 4:30 a.m. to 11:50<br />
p.m. Monday through Friday, 5:00 a.m. to 9:45 p.m. on Saturday, and 5:30 a.m. to 9:45 p.m. on<br />
Sunday. Sun Van evening service hours do not extend past 6:00 p.m. if the SunTran fixed‐route<br />
service does not.<br />
<strong>Pima</strong> County Special Needs<br />
<strong>Pima</strong> Transit is a deviate fixed route paratransit service provided by <strong>Pima</strong> County to persons with<br />
disabilities living outside the Tucson city limits, but within the Tucson metro area. Americans<br />
with Disabilities (ADA) compliant paratransit service is provided through a private provider:<br />
<strong>Pima</strong> Transit, also known as HandiCar. In fiscal year 2005‐06, HandiCar provided over 72,400<br />
passenger trips throughout the Tucson region.<br />
29
High Capacity Transit System Plan - <strong>Final</strong> <strong>Report</strong> June 2009<br />
Future Conditions<br />
3.0 FUTURE CONDITIONS<br />
3.1 INTRODUCTION<br />
Section 3.0 summarizes the assessment <strong>of</strong> future demographic and transportation conditions<br />
based on a forecast horizon <strong>of</strong> 2040. This analysis was conducted in June 2008 and the information<br />
presented is current as <strong>of</strong> that date. Some <strong>of</strong> the existing transit information has now changed, as some <strong>of</strong><br />
the transit improvements that were in the planning stages in June 2008 have now been implemented.<br />
3.2 DEMOGRAPHICS AND LAND USE<br />
Population Density<br />
Figure 15 illustrates population density projections for the year 2040. These projections indicate<br />
there will be increases in overall population, and much <strong>of</strong> the increase will occur in the outlying<br />
portions <strong>of</strong> the study area. Major increases in population density in the central areas <strong>of</strong> Tucson<br />
are not expected to occur. It is not anticipated that there will be a significant increase in the<br />
number <strong>of</strong> TAZs with a population density <strong>of</strong> greater than 15 households per gross acre.<br />
Projections indicate that density is expected to increase along the I‐10 corridor both northwest<br />
and southeast <strong>of</strong> the city. Marana is projected to have an increase in population density, and this<br />
increase is expected to occur around the I‐10 corridor. Sahuarita and areas south <strong>of</strong> Sahuarita are<br />
estimated to have an increase in population density around the I‐19 corridor. Population density<br />
is forecast to increase in the southeastern part <strong>of</strong> the study area between I‐10 and I‐19. Along 6th<br />
Avenue south <strong>of</strong> Tucson the density is currently high, and this is expected to continue, with the<br />
high density becoming more prevalent along this corridor as well as south <strong>of</strong> Tucson overall.<br />
Houghton Road is projected to have increases in density; however, these increases will only be<br />
moderate, and density around the corridor is not expected to be high.<br />
Employment Density<br />
Figure 16 illustrates employment density projections for the year 2040. Employment density is<br />
expected to increase along the I‐10 corridor, both northwest and southeast <strong>of</strong> Tucson. The<br />
Speedway Boulevard and Broadway Boulevard corridors are estimated to have an increase in<br />
employment density east <strong>of</strong> Campbell Avenue. The area along Alvernon Way and Tucson<br />
Boulevard between 36th Street and Valencia Road is estimated to experience considerable<br />
increases in employment density. Some <strong>of</strong> the most significant increases in employment density<br />
are projected along Stone Avenue and Euclid Avenue in the area between downtown Tucson and<br />
River Road.<br />
30
High Capacity Transit System Plan - <strong>Final</strong> <strong>Report</strong> June 2009<br />
Future Conditions<br />
Land Use/Economic Development<br />
Figure 17 identifies projected land use in the PAG region by year 2040 reflective <strong>of</strong> current land<br />
use designations. Based on existing conditions and identified areas <strong>of</strong> potential economic growth<br />
or reduction, there are no imminent major changes anticipated in land use in the region, as a<br />
comparison <strong>of</strong> Figure 6 and Figure 17 shows.<br />
Recent UA economic projections indicate that the Tucson region is expected to experience an<br />
increase in jobs in the foreseeable future. Pr<strong>of</strong>essional services, health care services, transportation<br />
and warehousing services, and tourism services are expected to lead economic growth in the<br />
region. Sectors that are also expected to grow—although not as rapidly—include mining,<br />
manufacturing, information services, and financial services. Aerospace and defense sectors will<br />
continue to be important to the regional economy. Two emerging sectors that have the potential<br />
to play a role in the future <strong>of</strong> the region’s economic development are the biosciences sector and<br />
the environmental technology sector.<br />
Economic development initiatives identify the need for a highly educated and highly skilled<br />
workforce in the region. Raising educational attainment rates at all levels <strong>of</strong> formal education are<br />
considered a priority for the region. Strategies are being developed to involve UA to a greater<br />
extent in reaching the educational and overall economic development goals.<br />
Trip Patterns<br />
Year 2040 person‐trip patterns are based on PAG’s regional travel forecasting model and are<br />
shown in Figure 18 and Figure 19 for both work and total person‐trips for the 22 aggregated<br />
TAZs.<br />
The southeast Tucson area is projected to experience the largest overall increase in work trips<br />
between it and all other areas. Also expected to increase significantly are work trips between<br />
Sahuarita/Green Valley and all other areas. The Marana area is also estimated to have a<br />
significant increase in trips between it and all other areas. Work trips between the eastern and<br />
central portions <strong>of</strong> the study area are expected to remain high.<br />
Total trip projections show that total trips will continue to be heavy between the central and<br />
eastern portions <strong>of</strong> the study area. The same applies to trips between the central and northern<br />
portions <strong>of</strong> the study area. It is estimated that the largest overall increase in total trips will be<br />
between the Tucson Southeast area and all other areas, which is what is expected for work trips.<br />
Also similar to the work trip pattern expectations, it is anticipated that the Sahuarita/Green Valley<br />
area will be a leader in increased trips between it and all other areas. The Marana area is also<br />
expected to have large increases in trips between it and all other areas. The southeast Tucson area<br />
is expected to experience a major increase in trips towards the Central Tucson area. Total trips<br />
between central zones and western as well as eastern zones are expected to continue to be high in<br />
the year 2040.<br />
31
High Capacity Transit System Plan - <strong>Final</strong> <strong>Report</strong> June 2009<br />
Future Conditions<br />
Figure 15<br />
Year 2040 Population Density<br />
32
High Capacity Transit System Plan - <strong>Final</strong> <strong>Report</strong> June 2009<br />
Future Conditions<br />
Figure 16<br />
Year 2040 Employment Density<br />
33
High Capacity Transit System Plan - <strong>Final</strong> <strong>Report</strong> June 2009<br />
Future Conditions<br />
Figure 17<br />
Year 2040 Land Use<br />
34
High Capacity Transit System Plan - <strong>Final</strong> <strong>Report</strong> June 2009<br />
Future Conditions<br />
Figure 18<br />
Year 2040 Trip O-D Patterns – Work Person-Trips<br />
35
High Capacity Transit System Plan - <strong>Final</strong> <strong>Report</strong> June 2009<br />
Future Conditions<br />
Figure 19<br />
Year 2040 Trip O-D Patterns – Total Person-Trips<br />
36
High Capacity Transit System Plan - <strong>Final</strong> <strong>Report</strong> June 2009<br />
Future Conditions<br />
3.3 TRANSPORTATION SYSTEM<br />
Traffic Volumes and Level <strong>of</strong> Service<br />
Figure 20 illustrates the roadway network volume‐to‐capacity ratios in 2040. The most heavily<br />
congested corridor in the study area is expected to continue to be the I‐10 corridor. Most<br />
segments <strong>of</strong> I‐10 are expected to exceed capacity by 2040. A large portion <strong>of</strong> I‐19 is also expected<br />
to exceed capacity by 2040.<br />
Major congestion is expected in the vicinity <strong>of</strong> TIA (especially on Old Vail Connection Road),<br />
Broadway Boulevard, Speedway Boulevard, and Grand Road, which are expected to have more<br />
segments exceeding capacity. River Road and Oracle Road are expected to see an increase in the<br />
number <strong>of</strong> segments that exceed capacity. Road segments throughout downtown Tucson are<br />
expected to see an increase in over‐capacity conditions. Valencia Road is projected to have a<br />
reduction in congestion west <strong>of</strong> I‐19, as this segment will no longer exceed capacity likely due to<br />
planned improvements. However, heavy congestion is projected to occur on Valencia Road east<br />
<strong>of</strong> I‐19 in 2040.<br />
Planned and Programmed Improvements<br />
Figure 21 and Figure 22 show the transit and roadway improvements identified in the 20‐year<br />
plan prepared by the Tucson Regional Transportation Authority (RTA) and approved by voters<br />
in 2006.<br />
Identified transit improvements include:<br />
• New express bus routes serving Sahuarita/Green Valley, Ajo, Marana, and Oro Valley,<br />
and enhancements to existing express bus routes.<br />
• Development <strong>of</strong> modern streetcar line connecting Rio Nuevo with U <strong>of</strong> A.<br />
• New park‐n‐rides serving Rita Ranch, West Valencia Road, East Broadway Boulevard,<br />
Marana, Oro Valley, and Green Valley.<br />
• New transit circulators in Marana, Oro Valley/Catalina, and Sahuarita/Green Valley.<br />
Roadway capacity improvements are planned along several arterial roadways including<br />
Houghton Road, Tangerine Road, Valencia Road, Grant Road, Silverbell Road, North Oracle<br />
Road, and La Cholla Boulevard, which are targeted for widening.<br />
37
High Capacity Transit System Plan - <strong>Final</strong> <strong>Report</strong> June 2009<br />
Future Conditions<br />
Figure 20<br />
Year 2040 Traffic Level <strong>of</strong> Service<br />
Figure 21<br />
38
High Capacity Transit System Plan - <strong>Final</strong> <strong>Report</strong> June 2009<br />
Future Conditions<br />
Figure 21<br />
RTA Plan Transit Improvements<br />
39
High Capacity Transit System Plan - <strong>Final</strong> <strong>Report</strong> June 2009<br />
Future Conditions<br />
Figure 22<br />
Premium Transit Mode Applicability<br />
40
High Capacity Transit System Plan - <strong>Final</strong> <strong>Report</strong> June 2009<br />
Transit Technologies Analysis<br />
4.0 TRANSIT TECHNOLOGIES<br />
ANALYSIS<br />
4.1 INTRODUCTION<br />
Section 4.0 summarizes the transit technology assessment that was conducted as part <strong>of</strong> Task 4<br />
and illustrates the pros and cons <strong>of</strong> various transit technologies applicable to the PAG region.<br />
Information from several “peer” urban areas is included in the assessment, as is information<br />
about transit‐supportive densities associated with each transit technology.<br />
4.2 TRANSIT TECHNOLOGIES ASSESSED<br />
After completing an initial assessment <strong>of</strong> a wide range <strong>of</strong> transit technologies, the following<br />
technologies were identified as the most likely to meet the study’s goals and objectives:<br />
• Express bus service<br />
• Bus rapid transit (BRT)<br />
• Light rail transit (LRT)<br />
• Streetcar<br />
• Commuter rail transit (CRT)<br />
Each <strong>of</strong> these technologies is described in greater detail in the following sections. The following<br />
characteristics were identified for each technology:<br />
• Basic description <strong>of</strong> operation<br />
• Number <strong>of</strong> corridors<br />
• Total corridor length<br />
• Average station spacing<br />
• Service frequency<br />
• Daily ridership<br />
• Type <strong>of</strong> vehicle<br />
• Typical capital cost per mile<br />
• Typical annual operating cost<br />
• Impact on land development<br />
41
High Capacity Transit System Plan - <strong>Final</strong> <strong>Report</strong> June 2009<br />
Transit Technologies Analysis<br />
4.2.1 Express Bus<br />
Basic Description <strong>of</strong> Operation<br />
Express buses typically provide service to and from the outer suburban areas to the central<br />
business districts and other employment centers in a city. Express service is faster than local bus<br />
service because the express buses serve fewer stops. Express buses can be operated on a variety <strong>of</strong><br />
types <strong>of</strong> roadway, ranging from streets with mixed traffic to exclusive busways and highoccupancy<br />
vehicle (HOV) lane service. Generally, service is more frequent during the morning<br />
and evening peak commute periods, and express routes are almost always connected to parkand‐ride<br />
facilities. The type <strong>of</strong> vehicles used for express service ranges from standard buses to<br />
more customized, “modern” buses.<br />
For the peer review <strong>of</strong> express bus systems, the systems in Phoenix, Seattle, and Miami were<br />
considered.<br />
Number <strong>of</strong> Corridors<br />
The number <strong>of</strong> express bus routes can greatly vary from city to city depending on urban area size<br />
and the distribution <strong>of</strong> population density through the metropolitan area. The peer review<br />
conducted covered a range <strong>of</strong> two corridors (Miami, FL) to 20 corridors (King County, WA) for<br />
the selected urban areas.<br />
Corridor Length<br />
The total length <strong>of</strong> the express bus corridors in the peer review ranged from 64 miles in Miami to<br />
more than 800 planned miles in Phoenix. Average corridor length for express bus ranges from<br />
11.6 to 32 miles. Corridor length can vary greatly pending the distance <strong>of</strong> suburban residential<br />
areas to the central city downtown. The availability <strong>of</strong> HOV lanes and right‐<strong>of</strong>‐way also promote<br />
the applicability <strong>of</strong> express bus service.<br />
Average Station Spacing<br />
Express bus service is typically intended to carry passengers from outer suburban areas to the<br />
central business district or other employment centers. Therefore, the average stop/station spacing<br />
varies greatly depending on what part <strong>of</strong> the route the bus services. In downtown areas, express<br />
buses can serve every one or two blocks, while they may not serve any stops as long as 30 miles<br />
in the mid sections <strong>of</strong> the route. At the residential end <strong>of</strong> the route, key transfer locations or parkand‐ride<br />
facilities can be served within shorter distances.<br />
Service Frequency<br />
The peer review indicated a range <strong>of</strong> one to 15 express buses during the morning and afternoon<br />
peak hours and up to one bus every hour during <strong>of</strong>f‐peak hours.<br />
42
High Capacity Transit System Plan - <strong>Final</strong> <strong>Report</strong> June 2009<br />
Transit Technologies Analysis<br />
Corridor Ridership<br />
Corridor ridership depends largely on urban area characteristics as well as the characteristics <strong>of</strong><br />
the express bus service. The peer review showed a range in average corridor ridership from 205<br />
to 1,380 riders per day for express bus service.<br />
Type <strong>of</strong> Vehicles<br />
The peer review indicated that transit agencies use a number <strong>of</strong> different vehicle types for their<br />
express bus service. The vehicles ranged from standard buses to more customized 45’ to 60’<br />
articulated, low‐floor, clean diesel or compressed natural gas (CNG) buses. An example <strong>of</strong> an<br />
express service bus is shown in Figure 23.<br />
Photo courtesy <strong>of</strong> www.mta.net<br />
Figure 23<br />
Example <strong>of</strong> Express Service Bus (Los Angeles)<br />
Capital Cost Per Mile<br />
Transit agencies do not typically separate the capital cost for express buses from local service<br />
buses. There are instances where specific improvements need to be made to allow the bus<br />
operations on a freeway or a high occupancy vehicle (HOV) lane. However, no specific<br />
information was available for express bus service as it varies significantly from application to<br />
application.<br />
Operating Costs<br />
Operating costs in the peer review range from $5.90 to $6.40 per passenger. In King County, WA,<br />
operating costs per passenger mile range from $0.28 (a 32.2‐mile route) to $8.93 (an 8.0‐mile<br />
route).<br />
Summary <strong>of</strong> Express Bus Characteristics<br />
Table 5 summarizes the different characteristics <strong>of</strong> express bus service for the selected peer urban<br />
areas.<br />
43
High Capacity Transit System Plan - <strong>Final</strong> <strong>Report</strong> June 2009<br />
Transit Technologies Analysis<br />
Table 5<br />
Express Bus Peer Review Summary<br />
Measure Phoenix Seattle (KCM) Miami<br />
Population <strong>of</strong> Urban Area<br />
Number/Location <strong>of</strong> Corridors<br />
1.55M city<br />
4.2M metro<br />
21 existing<br />
24 planned<br />
582,000 city<br />
3.3M metro<br />
404,000 city<br />
5.5M metro<br />
20 lines 2 lines<br />
Total / Avg. Corridor Length (Mi) Planned: 809 / 17.9 233 / 11.6 64 / 32<br />
Average Station Spacing 2 blocks to 30 miles N/A 1.3 miles average<br />
Service Frequency Every 10 min – 1 hr peak Every 4 to 10 min peak Every 5-12 min<br />
Total / Avg. Daily Corridor Ridership 4,300 / 205 18,800 / 940 2,700 / 1,350<br />
Type <strong>of</strong> Vehicle<br />
60’ articulated NABI & New<br />
Flyers, 45’ NABI Compo<br />
buses, standard 40’ buses<br />
40’ standard/articulated<br />
MCI Over the Road<br />
Coach/Standard 40’<br />
buses<br />
Capital Cost Per Mile N/A N/A N/A<br />
Operating Cost Per Passenger $6.4 $0.67 per passenger mile $5.9<br />
Impact on Land Development<br />
Express bus systems typically do not have much impact on stimulating major urban development<br />
around their stations because the service tends to be peak period−oriented with limited or no<br />
midday and evening service and a limited number <strong>of</strong> stops. At most express bus stops in outlying<br />
areas, park‐and‐ride facilities are provided to accommodate a predominance <strong>of</strong> transit riders<br />
driving to these stops and transferring to express bus. Some systems have attracted convenience<br />
uses oriented to peak period riders within or adjacent to express bus stops, such as espresso and<br />
dry cleaning shops.<br />
4.2.2 Bus Rapid Transit (BRT)<br />
Basic Description <strong>of</strong> Operation<br />
There are several key concepts involved in translating ordinary bus service into BRT. Each<br />
concept can be realized by taking advantage <strong>of</strong> one or more BRT features. These features can be<br />
summarized in the following way:<br />
• Increased speed through one or more <strong>of</strong> the following:<br />
• Signal priority treatments/queue jump<br />
• Bus lanes<br />
• Off‐board fare collection and/or use <strong>of</strong> smart cards or other advanced fare payment<br />
media<br />
44
High Capacity Transit System Plan - <strong>Final</strong> <strong>Report</strong> June 2009<br />
Transit Technologies Analysis<br />
• Greater stop spacing<br />
• Improved information at stations and/or on board<br />
• Vehicles with enhanced design and capacity<br />
• An enhanced image (reflected in vehicles, stations, and other components <strong>of</strong> the service)<br />
Reducing Travel Time<br />
One <strong>of</strong> the main goals <strong>of</strong> BRT is to improve service by reducing travel times. The components <strong>of</strong><br />
travel time include time getting to and from the transit stop, time waiting for the transit vehicle,<br />
and time in the vehicle. If a transfer is needed, there is also additional walking and waiting time.<br />
A central concept in BRT planning is to give priority to transit vehicles in order to make them an<br />
attractive choice <strong>of</strong> transportation. Such techniques can greatly reduce in‐vehicle travel times and<br />
improve service reliability.<br />
One form <strong>of</strong> priority is to run service on exclusive rights‐<strong>of</strong>‐way such as busways and exclusive<br />
lanes on expressways. Another form <strong>of</strong> priority is to designate bus lanes on arterial streets.<br />
Providing transit signal priority (TSP) to transit vehicles can also speed operation on streets.<br />
Reducing the number <strong>of</strong> stops, providing limited‐stop service, or relocating stops to areas where<br />
there is less congestion can also increase service speeds, although potentially with the<br />
disadvantage <strong>of</strong> increasing walk time.<br />
These techniques not only reduce the overall travel time, but, by improving the reliability <strong>of</strong><br />
service, they can increase the quality <strong>of</strong> service and help develop BRT as a distinct mode <strong>of</strong><br />
transportation. Furthermore, automatic vehicle location (AVL) systems can be used to manage the<br />
BRT service to provide more regular intervals between buses, thereby minimizing passenger<br />
waiting time and improving reliability.<br />
Changing fare collection policies to reduce or eliminate on‐vehicle fare purchase can also reduce<br />
boarding times. An example <strong>of</strong> an <strong>of</strong>f‐board fare collection application is shown in Figure 24.<br />
Using vehicle designs that feature fewer steps and more or wider doors can also reduce dwell<br />
times.<br />
45
High Capacity Transit System Plan - <strong>Final</strong> <strong>Report</strong> June 2009<br />
Transit Technologies Analysis<br />
Photo courtesy <strong>of</strong> Paul Ryus<br />
Figure 24<br />
Off-Board BRT Fare Collection in Las Vegas<br />
User-Friendly Service<br />
Although faster travel is a key element to improving service and attracting more transit trips,<br />
transit will not be attractive to many potential riders unless it is user‐friendly. Better passenger<br />
information can make transit service easier to use. Providing real‐time bus status information (a<br />
by‐product <strong>of</strong> AVL) can reduce customer anxiety while waiting. A unified system design, with<br />
colors and images coordinated between stops, vehicles, and print materials, can simplify the<br />
experience <strong>of</strong> using public transit; an example <strong>of</strong> color‐coded buses is shown in Figure 25. Using<br />
marketing techniques can make the public aware <strong>of</strong> service improvements and also help to<br />
improve the public image <strong>of</strong> buses.<br />
Modifying land use policy to further develop and maintain pedestrian‐friendly areas will<br />
improve the attractiveness <strong>of</strong> transit. In the long‐run, land use policy coordinated with transit<br />
investments will help to make transit trips convenient by locating land development adjacent to<br />
transit corridors and stations.<br />
46
High Capacity Transit System Plan - <strong>Final</strong> <strong>Report</strong> June 2009<br />
Transit Technologies Analysis<br />
Los Angeles uses a color-coded system <strong>of</strong> buses throughout the service area. The BRT vehicles and stops are coded in<br />
red, and the local bus is coded in orange. This is a practical and effective way <strong>of</strong> distinguishing the different services.<br />
Photo Courtesy <strong>of</strong> Paul Ryus<br />
Figure 25<br />
Using Bus Color to Convey Transit Information<br />
Types <strong>of</strong> BRT Service<br />
Several levels <strong>of</strong> BRT service have been characterized by the Federal Transit Administration<br />
(FTA). Table 6 summarizes the FTA classification, which is based on various levels <strong>of</strong> structural,<br />
technological, and operational attributes.<br />
Table 6 FTA BRT Characterization<br />
BRT<br />
Basic<br />
Intermediate<br />
Attribute<br />
Implementation<br />
Implementation<br />
Right-Of-Way Mixed Traffic Designated/HOV/Barrier-<br />
Separated Lanes<br />
Stations<br />
Improved Passenger Enhanced Passenger<br />
Amenities<br />
Information & Fare<br />
Service<br />
Route Structure<br />
Intelligent Transportation<br />
System<br />
Improved Service<br />
Frequency<br />
Single Route with<br />
Transfers, Color Coding<br />
Signal Priority<br />
Collection<br />
Skip Stop & Express<br />
Service Options<br />
High Frequency &<br />
Reliability<br />
Multiple Route Operations<br />
with Transfer Facilities<br />
Integration with Regional<br />
Transit<br />
Automated Passenger<br />
Information<br />
Full-Featured<br />
Implementation<br />
Exclusive/Grade<br />
Separation<br />
Enhanced Loading<br />
Convenient Transfers<br />
One Seat Rides<br />
Transfer Reduction<br />
Vehicle Location and<br />
System Surveillance<br />
For the peer review <strong>of</strong> BRT systems, the systems in Eugene, Kansas City, Las Vegas, Los Angeles,<br />
and Vancouver were considered.<br />
Number <strong>of</strong> Corridors<br />
The number <strong>of</strong> express bus routes greatly varies from city to city depending on the urban area<br />
size and the distribution <strong>of</strong> population density through the metropolitan areas. The peer review<br />
study showed a range <strong>of</strong> 28 existing BRT corridors (Los Angeles) to a single corridor (multiple<br />
47
High Capacity Transit System Plan - <strong>Final</strong> <strong>Report</strong> June 2009<br />
Transit Technologies Analysis<br />
urban areas). Figure 26 shows the LOS Angeles BRT system. The successful applications <strong>of</strong> BRT<br />
have led the transit agencies throughout the nation develop more BRT corridors. Therefore, there<br />
are numerous on‐going planning studies for BRT.<br />
Figure 26<br />
BRT System Map in Los Angeles<br />
Corridor Length<br />
The total length <strong>of</strong> the BRT corridors in the peer review ranged from 4 miles to 450 miles<br />
depending on the size <strong>of</strong> the urban area as well as the location and proximity <strong>of</strong> the employment<br />
centers to residential areas. Average corridor length ranges from 4 to 16 miles. The availability <strong>of</strong><br />
HOV lanes and right‐<strong>of</strong>‐way also promote the applicability <strong>of</strong> BRT service.<br />
Average Station Spacing<br />
BRT service provides less frequent stops than local bus service and, in the peer urban areas, has a<br />
range <strong>of</strong> 0.40 mile/station to 1.2 miles/station. Spacing may be closer in dense downtown<br />
environments (e.g., every three to five blocks). BRT stations may include features such as <strong>of</strong>fboard<br />
fare collection to speed up the boarding process.<br />
48
High Capacity Transit System Plan - <strong>Final</strong> <strong>Report</strong> June 2009<br />
Transit Technologies Analysis<br />
Service Frequency<br />
The peer review study indicated a service frequency range <strong>of</strong> every 2.5 minutes to 12 minutes<br />
during the morning and afternoon peak hours, and up to one bus every half hour during the <strong>of</strong>fpeak<br />
hours.<br />
Corridor Ridership<br />
The ridership is also depended largely on the urban area characteristics as well as the service<br />
characteristics. The peer review study showed a range in average corridor <strong>of</strong> ridership <strong>of</strong> 4,400 to<br />
20,000 riders per day for BRT service.<br />
Type <strong>of</strong> Vehicles<br />
The peer review study indicated that transit agencies use a number <strong>of</strong> different vehicle types for<br />
their BRT service. The vehicles ranged from standard 40’ low‐floor buses to more customized 60’<br />
articulated low floor buses with advanced on‐board technological features. An example BRT<br />
vehicle is shown in Figure 27.<br />
Photo courtesy <strong>of</strong> Paul Ryus<br />
Figure 27<br />
Example <strong>of</strong> Customized BRT Vehicle and Level-Boarding Station (Eugene, OR)<br />
Capital Cost Per Mile<br />
The cost per mile to implement BRT service includes the cost <strong>of</strong> purchasing buses, developing<br />
bus‐lane facilities and developing land‐side amenities including fare collection systems and<br />
boarding platforms, information systems and an enhanced marketing system. These costs can<br />
vary widely, but range for the peer review systems between $200,000 per mile to $6.25 million per<br />
mile.<br />
49
High Capacity Transit System Plan - <strong>Final</strong> <strong>Report</strong> June 2009<br />
Transit Technologies Analysis<br />
Operating Costs<br />
Operating costs for the peer review systems ranged from $160,000 to $810,000 per mile annually,<br />
covering driver salaries, vehicle maintenance and operations costs, and land‐side facility<br />
operating costs such as ticket machines and Intelligent Transportation Systems (ITS)<br />
communication needs.<br />
Summary <strong>of</strong> BRT Characteristics<br />
Table 7 summarizes the different characteristics <strong>of</strong> BRT service for the selected peer urban areas.<br />
Table 7<br />
BRT Peer Review Summary<br />
Measure Eugene, OR Kansas City Las Vegas Los Angeles Vancouver<br />
Size <strong>of</strong> Urban<br />
Area<br />
Number/<br />
Location <strong>of</strong><br />
Corridors<br />
Total / Avg.<br />
Corridor Length<br />
(Mi)<br />
Average Station<br />
Spacing (Mi)<br />
Service<br />
Frequency<br />
Total / Avg.<br />
Daily Corridor<br />
Ridership<br />
Type <strong>of</strong> Vehicle<br />
Capital Cost Per<br />
Mile<br />
Operating Cost<br />
Per Mile<br />
154,000 city<br />
340,000 metro<br />
1 operational, 2<br />
more planned<br />
447,000 city<br />
1.9M metro<br />
1 operational, 4<br />
more planned<br />
522,000 city<br />
1.78M metro<br />
1 operational, 4<br />
more planned<br />
3.8M city<br />
12.3M metro<br />
28 operational<br />
612,000 city<br />
2.2 M metro<br />
3 operational, 3<br />
more planned<br />
4 9 7.8 450 / 16 32.7 / 10.9<br />
0.45 0.43 0.78 0.48 0.78<br />
Every 10-20<br />
minutes<br />
Every 9-30 minutes<br />
Every 12-15<br />
minutes<br />
Every 5-10 minutes<br />
Every 2.5 to 15<br />
minutes<br />
4,700 4,450 4,400 163,000 / 5,820 60,000 / 20,000<br />
63’ articulated low<br />
floor – New Flyer<br />
41’ standard low<br />
floor - Gillig<br />
61’ articulated low<br />
emission dieselelectric<br />
Iris Civis<br />
60’ articulated low<br />
floor<br />
60’ articulated low<br />
floor<br />
$6.25M $2.33M $2.8M $200,000 $5.04M (98-B Line)<br />
$160,000 annual N/A $400,000 annual $500,000 annual $810,000 annual<br />
50
High Capacity Transit System Plan - <strong>Final</strong> <strong>Report</strong> June 2009<br />
Transit Technologies Analysis<br />
Impact on Land Development<br />
There have been some examples where BRT service with rail‐like attributes has attracted land<br />
development around certain stations. This has particularly been the case where separate busways<br />
or exclusive bus lanes on arterials have been developed. In Brisbane, Australia, and Ottawa,<br />
Cañada, millions <strong>of</strong> dollars <strong>of</strong> new investments in residential, <strong>of</strong>fice, and retail projects have<br />
occurred along their busway systems. In Boston, over $600 million in new development along the<br />
Washington Street corridor has been realized, much <strong>of</strong> it attracted by the new Silver Line BRT<br />
service that operates in exclusive bus lanes. Investments in facilities associated with BRT are<br />
almost always greater than investments in facilities associated with local and express bus service,<br />
and this greater investment conveys a sense <strong>of</strong> permanence that is more attractive to developers.<br />
4.2.3 Light Rail Transit (LRT)<br />
Basic Description <strong>of</strong> Operation<br />
LRT began as a development <strong>of</strong> the streetcar to allow higher speeds and increased capacity. LRT<br />
is characterized by its versatility <strong>of</strong> operation, as it can operate separated from other traffic below<br />
grade, at‐grade, or on an elevated structure, or it can operate together with motor vehicles on the<br />
surface. Service can be operated with single cars or multiple‐car trains. An example LRT train is<br />
shown in Figure 28.<br />
Electric traction power is obtained from an overhead wire, thus eliminating the restrictions<br />
imposed by having a live third rail at ground level. This flexibility helps to keep construction<br />
costs relatively low and explains the popularity this mode has experienced since 1978, when the<br />
first <strong>of</strong> 14 new North American LRT systems was opened in Edmonton. These newer LRT<br />
systems have adopted a much higher level <strong>of</strong> segregation from other traffic than earlier systems<br />
enjoyed.<br />
NOTE: Portland LRT operates with one- to two-car trains due to short downtown block lengths.<br />
Photo courtesy <strong>of</strong> Paul Ryus<br />
51
High Capacity Transit System Plan - <strong>Final</strong> <strong>Report</strong> June 2009<br />
Transit Technologies Analysis<br />
Figure 28<br />
Example <strong>of</strong> LRT Vehicle (Portland, OR)<br />
52
High Capacity Transit System Plan - <strong>Final</strong> <strong>Report</strong> June 2009<br />
Transit Technologies Analysis<br />
Operator cabs are generally provided at both ends <strong>of</strong> the vehicle to allow bi‐directional operation.<br />
Trains can operate as a single or multi‐car train. The LRT stations may have high‐ or low‐level<br />
platforms. Depending on the train characteristics, ramps may be required for ADA compliance, as<br />
shown in Figure 29.<br />
For the peer review <strong>of</strong> LRT systems, the current systems in Portland, San Diego, Dallas,<br />
Baltimore, and San Jose were considered.<br />
Figure 29<br />
Example <strong>of</strong> LRT Vehicle with Wheelchair Ramp (San Diego)<br />
Average revenue speed for the peer review systems is 5‐10 mph in central business district<br />
operation and 30‐40 mph in express operation on dedicated right‐<strong>of</strong>‐way. Maximum operating<br />
speed is 55 to 65 mph.<br />
Number <strong>of</strong> Corridors<br />
The number <strong>of</strong> LRT routes greatly varies from city to city depending on the urban area size and<br />
the distribution <strong>of</strong> population density through the metropolitan areas. The peer review study<br />
showed a range <strong>of</strong> one to three LRT routes for the selected urban areas.<br />
Corridor Length<br />
The total length <strong>of</strong> the LRT corridors in the systems reviewed ranged from 30 miles to 66 miles<br />
depending on the size <strong>of</strong> the urban area as well as the location and proximity <strong>of</strong> the employment<br />
centers to residential areas. Average corridor length ranges from 16 to 22.6 miles.<br />
Average Station Spacing<br />
LRT service provides less frequent stops than the bus service and the peer review systems have a<br />
range <strong>of</strong> a stop every 0.70 mile to 1.3 miles. LRT stations typically require advanced facilities to<br />
make the boarding process faster and easier. Station spacing may range from three to five blocks<br />
in dense downtown environments.<br />
Service Frequency<br />
53
High Capacity Transit System Plan - <strong>Final</strong> <strong>Report</strong> June 2009<br />
Transit Technologies Analysis<br />
The peer review indicated a service frequency range for LRT <strong>of</strong> every 6 minutes to 15 minutes<br />
during the morning and afternoon peak hours, and up to one train every half hour during the <strong>of</strong>fpeak<br />
hours.<br />
Corridor Ridership<br />
The ridership is also largely dependant on the urban area characteristics as well as the service<br />
characteristics. The peer review showed a range in average corridor ridership <strong>of</strong> 10,150 to 36,700<br />
riders per day for LRT service.<br />
Type <strong>of</strong> Vehicles<br />
The peer review study indicated that transit agencies use a number <strong>of</strong> different trains including<br />
Siemens, Bombardier, Kinki‐Sharyo and ABB Traction. Typically, each agency develops their own<br />
vehicle specifications to fit local constraints. Agencies use both low and high floor trains. Vehicles<br />
may or may not include ITS features such as the on‐board passenger information display shown<br />
in Figure 30.<br />
.<br />
Figure 30<br />
Example <strong>of</strong> On-Board Passenger Information (Portland, OR)<br />
Capital Cost Per Mile<br />
Capital costs for LRT for the peer review systems ranged from $17 million to $62 million per mile,<br />
depending on local conditions. The need for substantial structures to cross water, other<br />
transportation corridors or to negotiate terrain would clearly add significant cost to a project. The<br />
type <strong>of</strong> terminals provided would also have a large impact on cost.<br />
Operating Costs<br />
Operating costs for LRT vehicles for the peer review systems were higher than bus‐based systems<br />
and ranged from $0.24 to $1.29 per passenger mile.<br />
54
High Capacity Transit System Plan - <strong>Final</strong> <strong>Report</strong> June 2009<br />
Transit Technologies Analysis<br />
Summary <strong>of</strong> LRT Characteristics<br />
Table 8 summarizes the different characteristics <strong>of</strong> LRT service for the selected peer urban areas.<br />
Table 8<br />
LRT Peer Review Summary<br />
Measure Portland San Diego Dallas Baltimore San Jose<br />
Size <strong>of</strong> Urban<br />
Area<br />
Number/<br />
Location <strong>of</strong><br />
Corridors<br />
Total / Avg.<br />
Corridor Length<br />
(Mi)<br />
Average Station<br />
Spacing<br />
Service<br />
Frequency<br />
Total / Avg.<br />
Daily Corridor<br />
Ridership<br />
Type <strong>of</strong> Vehicle<br />
Capital Cost Per<br />
Mile<br />
Operating Cost<br />
Per Passenger<br />
Mile<br />
568,000 city<br />
2M metro<br />
3 operational, 1<br />
under<br />
construction<br />
1.2M city<br />
2.8M metro<br />
1.2M city<br />
6M metro<br />
640,000 city<br />
2.6M metro<br />
1M city<br />
7M metro<br />
3 operational 2 operational 1 operational 3 lines<br />
66 / 22 51 / 17 45 / 22.5 30 42 / 16<br />
0.7 miles 1 mile 1.3 miles 1 mile 0.7 miles<br />
Every 10-15<br />
minutes<br />
Every 6 – 15<br />
minutes<br />
Every 10 – 20<br />
minutes<br />
Every 20-30<br />
minutes<br />
Every 15 minutes<br />
110,300 / 36,700 108,900 / 36,300 60,600 / 30,300 24,500 30,400 / 10,150<br />
Bombardier/ Siemens<br />
Siemens two-car<br />
low floor trains<br />
$37.5 million $33.2 million –<br />
blue line<br />
$24.9 million -<br />
orange line<br />
Kinki – Sharyo<br />
articulated trains<br />
$33.2 million –<br />
DART S Oak<br />
Cliff<br />
$62.2 – DART<br />
North to Park Ln<br />
ABB Traction<br />
articulated trains<br />
Low floor Kinki<br />
Sharyo<br />
$16.9 million $27.8 million<br />
$0.39 $0.24 $0.59 $1.06 $1.29<br />
Impact on Land Development<br />
With the permanence associated with rail facilities, the greater number <strong>of</strong> stops, and all‐day<br />
service, LRT has been able to attract major new development and redevelopment along corridors<br />
throughout North America. This has included attracting higher density residential in outlying<br />
areas, as well as <strong>of</strong>fice and retail development. All five peer review systems have achieved<br />
success in attracting urban development around stations.<br />
4.2.4 Streetcar<br />
Basic Description <strong>of</strong> Operation<br />
Streetcar is a variation <strong>of</strong> LRT. It operates along mostly shared or segregated rights‐<strong>of</strong>‐way, with<br />
one‐car (or rarely, two‐car) trains. Streetcar vehicle types and ages can vary greatly. Modern<br />
streetcar is typically designed to fit the scale and traffic patterns <strong>of</strong> the neighborhoods it travels<br />
through. An example <strong>of</strong> a modern streetcar is shown in Figure 31.<br />
55
High Capacity Transit System Plan - <strong>Final</strong> <strong>Report</strong> June 2009<br />
Transit Technologies Analysis<br />
With slightly smaller (shorter) vehicles than LRT, streetcars can achieve capacities <strong>of</strong> up to 1,920<br />
people per hour per direction (pphpd) depending on the configuration <strong>of</strong> the vehicle. Streetcars in<br />
the USA are typically configured for either tourist travel (with higher level <strong>of</strong> service and lower<br />
capacities) or for regular transit operation. The streetcar stops may employ advanced passenger<br />
information systems that show the next car arrival times.<br />
For the peer review <strong>of</strong> streetcar systems, the current systems in Portland, San Francisco, and<br />
Toronto were considered.<br />
Number <strong>of</strong> Corridors<br />
The peer review study showed a range <strong>of</strong> one to 11 streetcar routes for the selected urban areas.<br />
Corridor Length<br />
The total length <strong>of</strong> the streetcar corridors ranged from 5 miles to 95 miles in the peer review<br />
comparison. Average corridor length ranges from 5.1 to 9.1 miles.<br />
NOTE: This streetcar line provides a convenient transfer to an aerial tram.<br />
Photo courtesy <strong>of</strong> Paul Ryus<br />
Figure 31<br />
Example <strong>of</strong> Streetcar Vehicle (Portland, OR)<br />
Average Station Spacing<br />
Streetcar service provides more frequent stops that for the peer review systems are spaced every<br />
0.15 to 0.18 miles, similar to the local bus service.<br />
56
High Capacity Transit System Plan - <strong>Final</strong> <strong>Report</strong> June 2009<br />
Transit Technologies Analysis<br />
Service Frequency<br />
The peer review study indicated a streetcar service frequency range <strong>of</strong> every 5 minutes to 12<br />
minutes during the morning and afternoon peak hours.<br />
Corridor Ridership<br />
Corridor ridership is also depended largely on the urban area characteristics as well as the service<br />
characteristics. The peer review study showed average corridor ridership ranging from 3,300 to<br />
11,900 riders per day for streetcar service.<br />
Type <strong>of</strong> Vehicles<br />
The peer review study indicated that transit agencies use a number <strong>of</strong> different vehicles including<br />
Skoda‐Inekon vehicles, vintage Presidents Conference Committee (PCC) vehicles, Canadian Light<br />
Rail Vehicles (CLRVs), and Articulated Light Rail Vehicles (ALRVs). Typically, each agency<br />
develops their own vehicle specifications to fit local constraints. An example streetcar vehicle is<br />
shown in Figure 32.<br />
Photo courtesy <strong>of</strong> Paul Ryus<br />
Figure 32<br />
Example <strong>of</strong> Streetcar in Mixed Traffic (Toronto ALRV)<br />
Capital Cost Per Mile<br />
Capital costs for streetcar for the peer review systems ranged from $23 million to $30 million per<br />
mile, depending on local conditions, and the technology needs <strong>of</strong> the service.<br />
Operating Costs<br />
Operating costs for streetcar service in the peer review systems range from $63,000 to $1.12<br />
million per mile annually.<br />
57
High Capacity Transit System Plan - <strong>Final</strong> <strong>Report</strong> June 2009<br />
Transit Technologies Analysis<br />
Summary <strong>of</strong> Streetcar Characteristics<br />
Table 9 summarizes the different characteristics <strong>of</strong> streetcar service for the selected peer urban<br />
areas.<br />
Table 9<br />
Streetcar Peer Review Summary<br />
Measure Portland San Francisco Toronto<br />
Size <strong>of</strong> Urban Area<br />
Number/<br />
Location <strong>of</strong> Corridors<br />
Total / Avg. Corridor Length<br />
(Mi)<br />
Average Station Spacing<br />
(Mi)<br />
568,000 city<br />
2M metro<br />
765,000 city<br />
4.1M metro<br />
2.5M city<br />
5M metro<br />
1 operational 1 operational 11 operational<br />
8-mile loop 5.1 95 / 9.1<br />
0.18 0.15<br />
Every 1-2 blocks in<br />
downtown<br />
Service Frequency Every 12 min Every 8 min Every 5-10 min<br />
Total / Avg. Daily Corridor<br />
Ridership<br />
Type <strong>of</strong> Vehicle<br />
11,900 20,500 330,000 / 30,000<br />
Double 66’ cars<br />
Skoda-Inekon<br />
Vintage PCC Cars<br />
CLRV/ALRV<br />
Capital Cost Per Mile $23 million $30 million N/A<br />
Operating Cost Per Mile<br />
$630,000 annual<br />
$5.34 per<br />
passenger/$4.73<br />
per passenger mile<br />
$1.12 million annual<br />
Impact on Land Development<br />
The streetcar mode is typically applied as a “city builder” tool, which can attract new urban<br />
development and redevelopment due to its permanence, numerous stops, and all‐day service.<br />
Streetcars are typically applied in central city areas in this role. The best example <strong>of</strong> where a new<br />
streetcar line has had an impact on development in the U.S. is in Portland, OR, where over $2.2<br />
billion in development investment, including 7,200 new residential units and 4.6 million square<br />
feet <strong>of</strong> new <strong>of</strong>fice and retail development, has occurred within two blocks <strong>of</strong> the street car line just<br />
prior to and after opening <strong>of</strong> the line.<br />
4.2.5 Commuter Rail Transit (CRT)<br />
Basic Description <strong>of</strong> Operation<br />
CRT provides high capacity rail service between city centers and outer suburban areas or<br />
commuter towns. The service is generally accompanied with park and ride facilities at stations.<br />
Most commuter trains are built to heavy rail standards, and can operate over relatively long<br />
distances with high operating speeds (over 60 mph), and less frequent stops. The power source is<br />
frequently diesel‐electric or electric with overhead catenary. A new propulsion innovation is the<br />
modern Diesel Multiple Unit (DMU). DMUs are rail cars that are individually self‐propelled; they<br />
58
High Capacity Transit System Plan - <strong>Final</strong> <strong>Report</strong> June 2009<br />
Transit Technologies Analysis<br />
can be used in single‐car or multiple‐car trains. Two existing commuter rail trains are shown in<br />
Figure 33; the photo on the right shows a DMU.<br />
For the peer review <strong>of</strong> CRT systems, the current systems in Seattle, San Diego, Dallas, Salt Lake<br />
City, and Albuquerque were considered.<br />
Number <strong>of</strong> Corridors<br />
The peer review study showed one or two CRT lines for the selected urban areas.<br />
Corridor Length<br />
The average length <strong>of</strong> the CRT corridors ranges from 30 miles to 98 miles in the peer review<br />
comparison.<br />
NOTE: Salt Lake City’s commuter rail service (depicted on the left), includes two corridors, is 89 miles long, and has<br />
850-foot platforms that accommodate 10-car trains. South Florida’s Tri-Rail (depicted on the right) recently introduced<br />
DMUs such as this one.<br />
Salt Lake City photo courtesy <strong>of</strong> www.ksl.com; Tri-Rail courtesy <strong>of</strong> www.coloradorailcar.com<br />
Figure 33<br />
Examples <strong>of</strong> Commuter Rail (Salt Lake City and South Florida)<br />
Average Station Spacing<br />
An example CRT station is shown in Figure 34. CRT service provides the least frequent stops for<br />
premium rail modes: approximately every 3.3 to 10.0 miles for the peer review systems. This long<br />
spacing helps keep transit travel times competitive with automobile travel times.<br />
Service Frequency<br />
CRT service is typically intended for home‐to‐work and work‐to‐home trips, and, therefore, is<br />
mostly provided during the morning and evening peak hours. The peer review indicated a CRT<br />
service frequency range <strong>of</strong> every 15 minutes to an hour during the morning and afternoon peak<br />
hours.<br />
59
High Capacity Transit System Plan - <strong>Final</strong> <strong>Report</strong> June 2009<br />
Transit Technologies Analysis<br />
Corridor Ridership<br />
Corridor ridership on CRT is also depended largely on the urban area characteristics as well as<br />
the service characteristics. The peer review study showed a range <strong>of</strong> about 2,500 to 8,700 riders<br />
per day.<br />
Photo courtesy <strong>of</strong> www.trinityrailwayexpress.org<br />
Figure 34<br />
Example <strong>of</strong> Commuter Rail Station with Modern Design Features (Dallas)<br />
Type <strong>of</strong> Vehicles<br />
The peer review indicated that transit agencies use a number <strong>of</strong> different vehicle types for their<br />
CRT service. The vehicles ranged from standard locomotives and single/bi‐level coaches to<br />
DMU’s, which have their own power.<br />
Capital Cost Per Mile<br />
The cost per mile to implement CRT service includes the cost <strong>of</strong> trackwork, station and signal<br />
improvements, and vehicles. For the peer review systems, these costs range between $5 million<br />
and $10 million per mile.<br />
Operating Costs<br />
Operating costs for CRT service for the peer review systems range from $0.54 to $1.24 per<br />
passenger mile; covering driver salaries, vehicle maintenance and operations costs, and land‐side<br />
facility operating costs such as ticket machines and ITS communication needs.<br />
60
High Capacity Transit System Plan - <strong>Final</strong> <strong>Report</strong> June 2009<br />
Transit Technologies Analysis<br />
Summary <strong>of</strong> Commuter Rail Characteristics<br />
Table 10 summarizes the different characteristics <strong>of</strong> CRT service for the selected peer urban areas.<br />
Measure<br />
Size <strong>of</strong> Urban Area<br />
Number/<br />
Location <strong>of</strong><br />
Corridors<br />
Total / Avg.<br />
Corridor Length<br />
(Mi)<br />
Average Station<br />
Spacing (Mi)<br />
Service Frequency<br />
Total / Avg. Daily<br />
Corridor Ridership<br />
Type <strong>of</strong> Vehicle<br />
Capital Cost Per<br />
Mile<br />
Operating Cost<br />
Table 10<br />
Seattle<br />
(Sounder)<br />
3.2 million metro<br />
area<br />
Commuter Rail Peer Review Summary<br />
San Diego<br />
(Coaster)<br />
2.8 million metro<br />
area<br />
2 routes 1 route 1 route<br />
Dallas<br />
(Trinity Railway<br />
Express)<br />
1.2 million<br />
central city/6<br />
million metro<br />
area<br />
Salt Lake City<br />
(FrontRunner)<br />
180,000 city/1<br />
million metro<br />
1 under<br />
construction, 1<br />
planned<br />
62 / 31 82 30 89 / 44.5 98<br />
7.8 10.3 3.3 6 7<br />
Total <strong>of</strong> 8 trips<br />
morning/evening<br />
N/A<br />
8,300 / 4,150 N/A 8,700<br />
EMD F59PH<br />
locomotives/<br />
Bombardier bilevel<br />
coaches<br />
N/A<br />
Every 40 min<br />
peak hours<br />
EMD F59PH<br />
locomotives/<br />
Bombardier bilevel<br />
coaches<br />
15-30 min<br />
35,000 (2030<br />
estimate)<br />
Diesel/electric,<br />
Bombardier bilevel<br />
cars<br />
Albuquerque<br />
(Rail Runner)<br />
523,000<br />
city/841,000<br />
metro<br />
1 operational<br />
Every hour<br />
during peak<br />
2,500<br />
MPI<br />
diesel/electric,<br />
Bombardier bilevel<br />
coach<br />
N/A N/A N/A $10 million $5 million<br />
$0.54 per<br />
passenger mile<br />
$0.38 per<br />
passenger mile<br />
$1.24 per<br />
passenger mile<br />
N/A<br />
$350,000/mile<br />
annual<br />
Impact on Land Development<br />
CRT typically has less impact on land development than rail modes such as LRT and streetcar<br />
because the latter are characterized by more‐frequent stops and all‐day service. Like express bus<br />
service stops, most CRT stations have park‐and‐ride facilities adjacent to the station, with urban<br />
development beyond. Many CRT stations serve the downtown areas <strong>of</strong> suburban cities, with few<br />
stations in inner city areas; these inner‐city stations are typically supported by local bus, innercity<br />
streetcar, or LRT service.<br />
61
High Capacity Transit System Plan - <strong>Final</strong> <strong>Report</strong> June 2009<br />
Transit Technologies Analysis<br />
4.3 ADDITIONAL TRANSIT TECHNOLOGY<br />
COMPARISON<br />
Table 11 through Table 14 and Figure 35 through Figure 38 were prepared for a recent study in<br />
Ottawa, Ontario. These tables and figures provide representative urban area population<br />
information as well as additional cost information for potential transit technologies. The<br />
information in the tables and figures comes primarily from the National Transit Database.<br />
Table 11<br />
Additional LRT Cost Data<br />
Urban Area<br />
2006 Urban Area<br />
Population<br />
Operating Expense<br />
per Passenger Mile<br />
Operating Expense<br />
per Revenue Mile<br />
Capital Cost per<br />
Mile<br />
St. Louis 1,006,570 $0.34 $240.98 $35,650,000<br />
Sacramento 1,087,671 $0.65 $244.76 $24,610,000<br />
Buffalo 1,182,165 $1.51 $297.40 N/A<br />
Cleveland 1,412,140 $0.59 $213.83 N/A<br />
Pittsburgh 1,415,244 $1.24 $281.77 $59,640,000<br />
Minneapolis-St. Paul 1,707,328 $0.36 $154.39 $69,145,667<br />
Salt Lake City 1,744,417 $0.27 $91.45 $52,430,000<br />
San Jose 1,759,585 $1.29 $316.02 N/A<br />
Baltimore 2,077,667 $1.06 $324.67 N/A<br />
Dallas 2,297,000 $0.59 $337.78 $73,000,000<br />
Denver 2,619,000 $0.59 $139.11 $47,452,892<br />
Tacoma, WA 2,670,000 $2.95 $291.02 $56,695,000<br />
Houston 2,796,994 $0.50 $218.68 N/A<br />
Los Angeles 8,493,281 $0.44 $383.41 N/A<br />
San Diego 2,102,396 $0.26 $117.34 N/A<br />
62
High Capacity Transit System Plan - <strong>Final</strong> <strong>Report</strong> June 2009<br />
Transit Technologies Analysis<br />
Table 12<br />
Additional Streetcar Cost Data<br />
Urban Area<br />
2006 Urban Area<br />
Population<br />
Operating Expense<br />
per Passenger Mile<br />
Operating Expense<br />
per Revenue Mile<br />
Capital Cost per<br />
Mile<br />
Galveston, TX 33,491 $8.97 $82.32 $3,580,000<br />
Charlotte 681,310 $6.92 $366.07 $19,047,619<br />
Kenosha, WI 91,500 $5.06 $99.81 $3,676,470<br />
Little Rock 166,974 $2.22 $68.13 $10,710,000<br />
New Orleans 484,674 $0.82 $117.44 N/A<br />
Tampa 578,252 $2.05 $95.28 $16,297,826<br />
Memphis 888,627 $3.99 $73.75 $19,110,000<br />
Urban Area<br />
Table 13<br />
Additional BRT Cost Data (Exclusive Right <strong>of</strong> Way Operations)<br />
2006 Urban Area<br />
Population<br />
Operating Expense<br />
per Passenger Mile<br />
Operating Expense<br />
per Revenue Mile<br />
Capital Cost per<br />
Mile<br />
Brisbane, Australia 1,670,961 N/A N/A $33,980,583<br />
Adelaide, Australia 1,146,208 N/A N/A $24,891,892<br />
Vancouver, BC 2,249,725 N/A N/A $5,387,200<br />
Eugene, OR 272,272 N/A N/A $6,000,000<br />
Cleveland 1,412,140 N/A N/A $30,618,182<br />
Orlando 1,536,900 N/A $9.28 $7,000,000<br />
Kansas City 781,159 N/A N/A $2,333,333<br />
Los Angeles 8,493,281 $0.56 $238.96 $21,931,034<br />
York Region, ON 973,000 N/A $75.71 $2,681,667<br />
Boston 4,510,400 N/A N/A $11,865,217<br />
Miami 2,379,818 N/A $96.21 $2,918,000<br />
Albany, NY 794,293 N/A N/A $1,562,500<br />
San Francisco 798,680 N/A N/A $25,000,000<br />
Pittsburgh 1,415,244 $0.75 $95.00 $26,304,348<br />
63
High Capacity Transit System Plan - <strong>Final</strong> <strong>Report</strong> June 2009<br />
Transit Technologies Analysis<br />
Urban Area<br />
Table 14<br />
2006 Urban Area<br />
Population<br />
Additional Commuter Rail Cost Data<br />
Operating Expense<br />
per Passenger Mile<br />
Operating Expense<br />
per Revenue Mile<br />
Capital Cost per<br />
Mile<br />
Northern Indiana 958,644 $0.28 $354.64 N/A<br />
Chicago 7,261,176 $0.29 $355.85 N/A<br />
Boston 4,510,400 $0.30 $314.53 $28,444,444<br />
San Francisco 3,690,367 $0.30 $393.23 N/A<br />
Los Angeles 8,341,002 $0.30 $507.58 N/A<br />
Baltimore 2,077,667 $0.33 $576.51 N/A<br />
Philadelphia 3,315,543 $0.37 $306.75 N/A<br />
Washington, D.C. 680,400 $0.37 $719.89 N/A<br />
San Diego 842,000 $0.38 $526.13 N/A<br />
South Florida 5,448,962 $0.40 $558.68 N/A<br />
Salt Lake City 1,744,417 N/A N/A $19,000,000<br />
Sacramento 4,094,704 $0.41 $655.30 N/A<br />
NYC 6,503,894 $0.42 $479.35 N/A<br />
Portland, ME 1,431,087 $0.44 $199.09 N/A<br />
New York City 11,720,000 $0.44 $477.91 N/A<br />
Fort Worth 628,650 $0.53 $375.09 N/A<br />
Seattle and Tacoma 2,670,000 $0.54 $1,403.80 $14,698,795<br />
Harrisburg, PA 3,100,000 $0.54 $657.10 N/A<br />
New Haven, CT 375,000 $1.11 $823.82 $14,610,000<br />
Dallas 2,297,000 $1.24 $825.61 $22,900,000<br />
64
High Capacity Transit System Plan - <strong>Final</strong> <strong>Report</strong> June 2009<br />
Transit Technologies Analysis<br />
14,000,000<br />
12,000,000<br />
URBAN AREA POPULATION<br />
10,000,000<br />
8,000,000<br />
6,000,000<br />
4,000,000<br />
Range<br />
Average<br />
2,000,000<br />
0<br />
LRT Streetcar Commuter Rail BRT<br />
MODE<br />
NOTE: BRT operates in exclusive right <strong>of</strong> way.<br />
Figure 35<br />
High-Capacity Transit Mode Operated vs. Urban Area Population<br />
$10.0<br />
$9.0<br />
OPERATING COST PER PASSENGER MILE<br />
$8.0<br />
$7.0<br />
$6.0<br />
$5.0<br />
$4.0<br />
$3.0<br />
$2.0<br />
$1.0<br />
Range<br />
Average<br />
$0.0<br />
LRT Streetcar Commuter Rail BRT<br />
MODE<br />
NOTE: BRT operates in exclusive right <strong>of</strong> way.<br />
Figure 36<br />
High-Capacity Transit Mode Operated vs. Operating Cost per Passenger Mile<br />
65
High Capacity Transit System Plan - <strong>Final</strong> <strong>Report</strong> June 2009<br />
Transit Technologies Analysis<br />
$1,600.0<br />
$1,400.0<br />
OPERATING COST PER REVENUE HOUR<br />
$1,200.0<br />
$1,000.0<br />
$800.0<br />
$600.0<br />
$400.0<br />
$200.0<br />
Range<br />
Average<br />
$0.0<br />
LRT Streetcar Commuter Rail BRT<br />
MODE<br />
NOTE: BRT operates in exclusive right <strong>of</strong> way.<br />
Figure 37<br />
High-Capacity Transit Mode Operated vs. Operating Cost per Revenue Hour<br />
$80.0<br />
CAPITAL COST PER MILE ($MILLION)<br />
$70.0<br />
$60.0<br />
$50.0<br />
$40.0<br />
$30.0<br />
$20.0<br />
$10.0<br />
Range<br />
Average<br />
$0.0<br />
LRT Streetcar Commuter Rail BRT<br />
MODE<br />
NOTE: BRT operates in exclusive right <strong>of</strong> way.<br />
Figure 38<br />
High-Capacity Transit Mode Operated vs. Capital Cost per Mile<br />
66
High Capacity Transit System Plan - <strong>Final</strong> <strong>Report</strong> June 2009<br />
Transit Technologies Analysis<br />
4.4 SUMMARY OF PREMIUM TRANSIT<br />
TECHNOLOGY REVIEW<br />
The initial assessment <strong>of</strong> premium transit technologies consisted <strong>of</strong> express bus, BRT, LRT,<br />
streetcar, and commuter rail. The peer review study included several urban areas in order to<br />
assess a broad range <strong>of</strong> systems and service characteristics. Table 15 provides a summary <strong>of</strong> the<br />
range <strong>of</strong> service characteristics for each <strong>of</strong> the premium transit technologies. The data in the table<br />
come from the peer review and other sources.<br />
Table 15<br />
Summary <strong>of</strong> Premium Transit Technologies (Peer Review Systems)<br />
Measure Express Bus BRT LRT Streetcar Commuter Rail<br />
Average Corridor<br />
Length<br />
Station Spacing<br />
Service Frequency<br />
Average Daily<br />
Corridor Ridership<br />
Capital Cost Per Mile<br />
Operating Cost<br />
18 to 34 miles 4 to 16 miles 14 to 30 miles 5 to 9 miles 30 to 98 miles<br />
2 blocks to 30<br />
miles<br />
Every 4-60 min<br />
(mostly peak)<br />
0.37-1.19 miles 0.7-1.3 miles<br />
1-2 blocks to<br />
0.15 mile<br />
Every 2.5-30 min Every 6-30 min Every 5-12 min<br />
3.3-10.3 miles<br />
Every 15-60 min<br />
during peak<br />
205 to 1,350 4,450-20,000 10,150-36,750 11,900-30,000 2,500-8,700<br />
N/A<br />
$5.90-$6.40 per<br />
passenger<br />
$200,000 to<br />
$6.25M<br />
$160,000 to<br />
$810,000 per<br />
mile annual<br />
$16.9M to<br />
$62.2M<br />
$0.24 to $1.29<br />
per passenger<br />
mile<br />
$23M to $30M $5M to $10M<br />
$630,000 to<br />
$1.12M per mile<br />
annual<br />
$190,000 to<br />
$350,000 per<br />
mile annual<br />
4.5 TRIP/DEVELOPMENT DENSITY RELATED TO<br />
PREMIUM TRANSIT MODES<br />
Trip Thresholds<br />
Typical capacity (and, thus, potential ridership) ranges for various transit modes are summarized<br />
in Figure 39. The thresholds in this figure should be compared to 2040 O‐D trip volumes, existing<br />
corridor ridership, and corridor ridership forecasts. The potential to generate ridership levels that<br />
result in well‐used and cost‐effective HCT services is a criterion that will be used to evaluate and<br />
prioritize specific corridors.<br />
67
High Capacity Transit System Plan - <strong>Final</strong> <strong>Report</strong> June 2009<br />
Transit Technologies Analysis<br />
Heavy Rail: Moving Block Signals<br />
Heavy Rail: Fixed Block Signals<br />
Light Rail: Exclusive ROW, MB Signals<br />
Light Rail: Exclusive ROW, FB Signals<br />
Light Rail: On-Street Section<br />
Commuter Rail: Owned ROW<br />
Commuter Rail: Leased ROW<br />
Streetcar<br />
Bus: Shared HOV Lane, No Stops<br />
Busway: Local/Express<br />
Busway: All Stops<br />
Bus: Dual Bus Lane, CBD<br />
Bus: Bus Lane, CBD<br />
Bus: Mixed Traffic, non-CBD<br />
Typical capacity range<br />
Highest observed in North America<br />
Bus: Mixed Traffic, CBD<br />
0 10,000 20,000 30,000 40,000 50,000 60,000<br />
Person Capacity (peak direction passengers/hour)<br />
NOTES: MB = moving block train signaling, FB = fixed-block train signaling, ROW = right <strong>of</strong> way, and CBD = central<br />
business district. Ranges reflect differing assumptions for dwell time and number <strong>of</strong> cars per train. Peak hour factor<br />
and passenger loading assumptions reflect TCQSM recommendations. “Highest observed” values beyond the ranges<br />
shown reflect non-typical conditions. BRT person capacity depends on the features provided (e.g., exclusive ROW and<br />
station spacing).<br />
SOURCE: Transit Capacity and Quality <strong>of</strong> Service Manual (TCQSM)<br />
Figure 39<br />
Person Capacity Ranges <strong>of</strong> U.S. and Canadian Transit Modes<br />
Development Density Thresholds<br />
Table 16 summarizes population and employment densities used to identify areas where new<br />
transit service may be warranted, from past studies. Separate density thresholds are provided for<br />
various types <strong>of</strong> transit service ranging from extended local bus service to LRT to CRT. If a TAZ’s<br />
population or employment density exceeds the thresholds shown in the table, that TAZ is<br />
considered to be transit‐supportive for the particular mode.<br />
Note that Table 16 does not consider the demographics <strong>of</strong> a particular TAZ. Demographic<br />
characteristics associated with captive transit markets typically indicate a greater propensity for<br />
transit use. The evaluation and prioritization <strong>of</strong> specific corridors will consider such<br />
characteristics.<br />
68
High Capacity Transit System Plan - <strong>Final</strong> <strong>Report</strong> June 2009<br />
Transit Technologies Analysis<br />
Table 16<br />
Development Density Thresholds for a Range <strong>of</strong> Transit Services<br />
Service<br />
Minimum<br />
Residential<br />
Density<br />
(units/gross<br />
acre)<br />
Minimum<br />
Employment<br />
Density<br />
(jobs/gross<br />
acre)<br />
Comments<br />
Minimum Bus (60-minute headways) 3.0 4.0 1/2-mi route spacing<br />
Intermediate Bus (30-minute headways) 4.5 13.5 1/2-mi route spacing<br />
Frequent Bus (10-minute headways) 10.0 33.5 1/2-mi route spacing<br />
HCT<br />
Express Bus 10.0 50.5 for 2 sq mi tributary area<br />
Light Rail Transit 6.0 84.0 for corridor <strong>of</strong> 25-100 sq. mi.<br />
Heavy Rail 8.0 112.0 for corridor <strong>of</strong> 100-150 sq. mi.<br />
Commuter Rail 1.3 N/A for 20 sq. mi. tributary area<br />
SOURCE 1: Pushkarev and Zupan, 1987<br />
SOURCE 2: Urban Land Institute, Developing Around Transit, 2004<br />
Relationship to PAG Region<br />
Premium Transit Corridors from 2030 Transit Element<br />
In the Transit Element <strong>of</strong> the 2030 PAG Transportation System Plan, nine premium transit<br />
corridors were identified. The corridors include:<br />
• UA/Rio Nuevo via 4th Avenue and University Boulevard<br />
• Broadway/Speedway/6th Street (Houghton Road to Downtown)<br />
• Campbell Avenue (Tucson Mall to UA)<br />
• Oracle/Stone (Oro Valley to Downtown Tucson)<br />
• 6th Avenue (Downtown Tucson to Irvington)<br />
• I‐19 (Sahuarita to Downtown Tucson)<br />
• I‐10 (Marana to Houghton Road)<br />
• Houghton Road (Irvington to Broadway/Speedway Corridor)<br />
• Anklam/6th Street (Speedway to UA)<br />
The plan identified top priority premium transit investments focused on the Oracle/Stone/6th<br />
Avenue and Broadway/Speedway corridors, with either LRT or BRT service. These investments<br />
would be supplemented by express bus service and enhanced local bus service in other corridors.<br />
This is the starting point for consideration <strong>of</strong> premium transit corridors and modes in the current<br />
PAG HCT System Plan Study.<br />
Added Potential Premium Transit Corridors from Stakeholder Interviews<br />
At the outset <strong>of</strong> the current PAG HCT Study, a series <strong>of</strong> interviews were conducted with key<br />
stakeholders in the PAG region to identify what corridors and modes they thought could be<br />
applicable for premium transit. The stakeholders interviewed were the following:<br />
69
High Capacity Transit System Plan - <strong>Final</strong> <strong>Report</strong> June 2009<br />
Transit Technologies Analysis<br />
• City <strong>of</strong> Tucson<br />
• City <strong>of</strong> South Tucson<br />
• Town <strong>of</strong> Marana<br />
• Town <strong>of</strong> Oro Valley<br />
• Town <strong>of</strong> Sahuarita<br />
• <strong>Pima</strong> County<br />
• PAG<br />
• UA<br />
• Tucson Regional Economic Opportunities (TREO)<br />
• SunTran<br />
• Pasqua Yaqui Tribe<br />
• State Representative Steve Farley<br />
The stakeholders all confirmed that the corridors identified for premium transit in the 2030 PAG<br />
Plan could still be applicable. In addition, the stakeholders identified some added potential<br />
corridors which should be considered:<br />
• Campbell Avenue/Kino Parkway to TIA<br />
• Valencia Road<br />
• Kolb Road<br />
• Grant Road<br />
• Ajo Way<br />
• Tangerine Road<br />
Development Density Assessment in Premium Transit Corridors<br />
To initially look at the potential applicability <strong>of</strong> certain corridors and modes for premium transit<br />
investment, the minimum population and employment density thresholds that would support<br />
certain premium transit modes now vs. in Year 2040 were assessed. The minimum thresholds for<br />
express bus, LRT, and CRT as identified in Table 16 were used and mapped against the premium<br />
transit corridors from the 2030 PAG Transportation Plan as well as added corridors identified<br />
from the stakeholder interviews. Based on the relative span <strong>of</strong> service and service frequency,<br />
degree <strong>of</strong> exclusive running way, and other passenger amenities applied, the midpoints <strong>of</strong> the<br />
population and employment densities between express bus and LRT were used for the BRT<br />
thresholds (4 residential units per gross acre, and 67 employees per gross acre). It was also<br />
assumed that the development density thresholds associated with LRT would also be applicable<br />
for streetcar (which is a configuration within the LRT mode).<br />
70
High Capacity Transit System Plan - <strong>Final</strong> <strong>Report</strong> June 2009<br />
Transit Technologies Analysis<br />
Express Bus<br />
Figure 40 and Figure 41 show the TAZs where sufficient population and employment density<br />
exist to warrant consideration <strong>of</strong> express bus service or basic BRT service today and in Year 2040.<br />
Today, there is sufficient population density to justify express bus service in the 6th Avenue,<br />
Broadway/Speedway Boulevard, Grant Road, and Campbell Road corridors. There are also small<br />
pockets <strong>of</strong> density in Marana and Sahuarita/Green Valley to justify some express service on I‐10<br />
to the northwest and I‐19. By Year 2040, Oracle Road and Houghton Road show sufficient density<br />
to warrant express bus service, including more concentrated development along I‐10 which could<br />
warrant a broader application <strong>of</strong> express bus service on I‐10.<br />
Bus Rapid Transit<br />
Figure 42 and Figure 43 show the TAZs where sufficient population and employment density<br />
exist to warrant consideration <strong>of</strong> BRT today and in Year 2040. The areas which could warrant BRT<br />
service are similar to the areas which could warrant express bus both today and in Year 2040; a<br />
longer section along Oracle Road could warrant BRT in 2040.<br />
Light Rail Transit<br />
Figure 44 and Figure 45 show the TAZs where sufficient population and employment density<br />
exist to warrant consideration <strong>of</strong> LRT today and in Year 2040. Other than in the downtown<br />
Tucson to the UA area, where a streetcar line is planned, there is no continuous corridor today or<br />
in Year 2040 that is likely to have sufficient development density to support LRT.<br />
Commuter Rail<br />
Figure 46 and Figure 47 show the TAZs where population and employment density would be<br />
sufficient to warrant consideration <strong>of</strong> CRT. Today, there is not sufficient development density to<br />
support CRT in the Union Pacific Railroad corridors along either I‐10 or I‐19. However, by Year<br />
2040, a sufficient string <strong>of</strong> density could emerge along the I‐10 corridor to warrant consideration<br />
<strong>of</strong> CRT in that corridor.<br />
4.6 PREMIUM TRANSIT CORRIDORS AND MODES<br />
FOR FURTHER EVALUATION<br />
Based on the assessment <strong>of</strong> existing and 2040 population and employment densities, traffic<br />
densities (i.e., volume‐to‐capacity ratios), and other demographic factors, implementation <strong>of</strong> HCT<br />
within the original nine corridors can be considered. Given the development densities within<br />
each <strong>of</strong> these corridors, express bus service or BRT, as well as a possible extension <strong>of</strong> the modern<br />
streetcar and CRT on I‐10, are the most feasible premium transit alternatives to be considered<br />
through year 2040. Given these results, Table 17 presents a potential HCT scenario for each <strong>of</strong> the<br />
sixteen identified corridors.<br />
71
High Capacity Transit System Plan - <strong>Final</strong> <strong>Report</strong> June 2009<br />
Transit Technologies Analysis<br />
Figure 40<br />
TAZs Supportive <strong>of</strong> Express Bus Based on Existing Densities<br />
72
High Capacity Transit System Plan - <strong>Final</strong> <strong>Report</strong> June 2009<br />
Transit Technologies Analysis<br />
Figure 41<br />
TAZs Supportive <strong>of</strong> Express Bus Based on 2040 Densities<br />
73
High Capacity Transit System Plan - <strong>Final</strong> <strong>Report</strong> June 2009<br />
Transit Technologies Analysis<br />
Figure 42<br />
TAZs Supportive <strong>of</strong> BRT Based on Existing Densities<br />
74
High Capacity Transit System Plan - <strong>Final</strong> <strong>Report</strong> June 2009<br />
Transit Technologies Analysis<br />
Figure 43<br />
TAZs Supportive <strong>of</strong> BRT Based on 2040 Densities<br />
75
High Capacity Transit System Plan - <strong>Final</strong> <strong>Report</strong> June 2009<br />
Transit Technologies Analysis<br />
Figure 44<br />
TAZs Supportive <strong>of</strong> LRT Based on Existing Densities<br />
76
High Capacity Transit System Plan - <strong>Final</strong> <strong>Report</strong> June 2009<br />
Transit Technologies Analysis<br />
Figure 45<br />
TAZs Supportive <strong>of</strong> LRT Based on 2040 Densities<br />
77
High Capacity Transit System Plan - <strong>Final</strong> <strong>Report</strong> June 2009<br />
Transit Technologies Analysis<br />
Figure 46<br />
TAZs Supportive <strong>of</strong> Commuter Rail Based on Existing Densities<br />
78
High Capacity Transit System Plan - <strong>Final</strong> <strong>Report</strong> June 2009<br />
Transit Technologies Analysis<br />
Figure 47<br />
TAZs Supportive <strong>of</strong> Commuter Rail Based on 2040 Densities<br />
79
High Capacity Transit System Plan - <strong>Final</strong> <strong>Report</strong> June 2009<br />
Transit Technologies Analysis<br />
Table 17<br />
Preliminary HCT Scenario in <strong>Pima</strong> County<br />
Corridor<br />
Possible Implementation Period<br />
Near (2030) Future (2040) Reserve (>2040)<br />
1. U <strong>of</strong> A/Rio Nuevo SC SC SC<br />
2. Broadway/Speedway BRT/LRT BRT, LRT LRT<br />
3. Campbell Ave. EB SC SC<br />
4. Oracle Rd/Stone Ave. BRT/LRT BRT, LRT LRT<br />
5. 6th Ave. BRT BRT SC<br />
6. I-19 EB EB CR<br />
7. I-10 EB, CR CR CR<br />
8. Houghton Rd. EB EB BRT<br />
9. Anklam Rd./6th St. EB BRT BRT<br />
10. Tangerine Rd. FR EB EB<br />
11. Grant Rd. BRT/LRT BRT, LRT BRT, LRT<br />
12. S. Campbell/Kino Pkwy BRT/LRT BRT/LRT SC<br />
13. S. 6th to Airport BRT BRT SC<br />
14. Valencia Rd. EB EB BRT<br />
15. Ajo Way FR EB EB<br />
16. Kolb Rd. EB EB BRT<br />
NOTE: FR = fixed route transit, EB = express bus, BRT = bus rapid transit, SC = street car, LRT =<br />
light rail transit, and CR = commuter rail<br />
Section 5.0 contains a more detailed analysis <strong>of</strong> potential alignments for one or more premium<br />
transit modes in certain corridors, where reasonable alignment and mode options appear to exist.<br />
Further assessment <strong>of</strong> existing and prospective land use along corridors is included, along with<br />
identification <strong>of</strong> potential station locations and mode operating characteristics. Also identified are<br />
major right‐<strong>of</strong>‐way and traffic operating constraints on development <strong>of</strong> dedicated lanes. Given<br />
the limited study budget, the following corridors were initially proposed to be assessed in the<br />
work summarized in Section 5.0 (i.e., Task 5):<br />
• Extension <strong>of</strong> streetcar to South Tucson and north <strong>of</strong> UA<br />
• CRT in the I‐10 corridor<br />
• BRT and/or LRT along Oracle Road/Stone Avenue<br />
• BRT along 6th Avenue<br />
• BRT and/or LRT along Broadway Boulevard vs. Speedway Boulevard vs. Grant Road<br />
• BRT and/or LRT along Campbell Avenue/Kino Parkway to TIA<br />
80
High Capacity Transit System Plan - <strong>Final</strong> <strong>Report</strong> June 2009<br />
Refined Corridor Assessment<br />
5.0 REFINED CORRIDOR<br />
ASSESSMENT<br />
5.1 INTRODUCTION<br />
Section 5.0 provides a summary <strong>of</strong> work completed under Task 5 <strong>of</strong> the PAG HCT Study, which<br />
involved data collection and analysis to determine if one or more premium transit modes in each<br />
HCT corridor are best suited for inclusion into the updated HCT System Plan. Section 5.0<br />
includes the development <strong>of</strong> several evaluation criteria for comparing modal alternatives in the<br />
HCT corridors and an objective, high‐level summary that helped PAG, the TAC, and the project<br />
team screen out any fatally flawed alternatives or alternatives that are not likely to have a<br />
measurable benefit. Section 5.0 concludes by identifying top‐ranked alternatives for more‐refined<br />
analysis in terms <strong>of</strong> preferred transit technology, routing, station locations, general service<br />
characteristics, detailed costs, and benefits.<br />
5.2 DESCRIPTION OF CORRIDORS AND<br />
ALTERNATIVES<br />
Figure 48 depicts the corridors and HCT technology alternatives that were identified in Section<br />
4.0 for analysis. Table 18 describes the corridors and alternatives in more detail. These corridors<br />
and alternatives were selected from 16 preliminary corridors in an initial screening <strong>of</strong> near and<br />
long‐term population and employment densities, low‐income population density, density <strong>of</strong><br />
households with zero cars, land uses, location <strong>of</strong> major trip generators, trip patterns, local transit<br />
service use, and roadway operations.<br />
The HCT modes considered in Task 5 are BRT, LRT, streetcar, and CRT. Express bus may be<br />
implemented in any corridor where ridership and other factors do not justify an HCT mode or as<br />
an interim step in the implementation <strong>of</strong> an HCT mode.<br />
81
High Capacity Transit System Plan - <strong>Final</strong> <strong>Report</strong> June 2009<br />
Refined Corridor Assessment<br />
Figure 48<br />
Corridors Evaluated in the Refined Corridor Assessment<br />
82
High Capacity Transit System Plan - <strong>Final</strong> <strong>Report</strong> June 2009<br />
Refined Corridor Assessment<br />
Table 18<br />
Task 5 Corridors and HCT Technology Alternatives<br />
Corridor<br />
Number<br />
2A<br />
2B<br />
Corridor Name<br />
Speedway Boulevard<br />
Broadway Boulevard<br />
HCT<br />
Alternative<br />
North/West Endpoint<br />
South/East Endpoint<br />
BRT Campbell Avenue (UA) Houghton Road<br />
LRT Campbell Avenue (UA) Houghton Road<br />
BRT Ronstadt Transit Center Houghton Road<br />
LRT Ronstadt Transit Center Houghton Road<br />
3 Campbell Avenue North SC River Road Speedway Boulevard (UA)<br />
4 Oracle Road<br />
7 I-10/I-19 CRT<br />
11 Grant Road<br />
BRT Tangerine Road Ronstadt Transit Center<br />
LRT Tangerine Road Ronstadt Transit Center<br />
Town <strong>of</strong> Marana<br />
Downtown Tucson<br />
Downtown Tucson<br />
Town <strong>of</strong> Sahuarita<br />
BRT Oracle Road Tanque Verde Road<br />
LRT Oracle Road Tanque Verde Road<br />
12<br />
Campbell Avenue<br />
BRT Speedway Blvd (UA) TIA*<br />
South/Kino Parkway LRT Speedway Blvd (UA) TIA<br />
13<br />
6th Avenue South/<br />
SC Ronstadt Transit Center TIA<br />
Nogales Highway BRT Ronstadt Transit Center TIA<br />
*TIA = Tucson International Airport<br />
5.3 SCREENING EVALUATION<br />
The project team identified screening evaluation criteria for assessing the HCT alternatives listed<br />
in Table 18 from a high‐level planning perspective so that alternatives with little measurable<br />
benefit and/or fatal flaws could be eliminated from additional analysis. Four <strong>of</strong> the criteria were<br />
determined to be the most important and were designated as “primary” evaluation criteria. The<br />
primary evaluation criteria are:<br />
• Potential ridership (per mile)<br />
• Right‐<strong>of</strong>‐way (ROW) availability<br />
• Capital costs (per mile)<br />
• Operating costs (per mile)<br />
The remaining, secondary evaluation criteria are:<br />
• Consistency with regional plans and programs<br />
• Impacts on other transit services (the local bus system and planned Tucson Modern<br />
Streetcar)<br />
• Land use compatibility/Transit‐Oriented Development (TOD) potential<br />
• Access to major attractors and generators<br />
• Impacts on roadway mobility and congestion<br />
• Possible environmental impacts<br />
• Rail owner/operator cooperation (willingness to coordinate if a rail corridor is involved)<br />
83
High Capacity Transit System Plan - <strong>Final</strong> <strong>Report</strong> June 2009<br />
Refined Corridor Assessment<br />
• Impacts on Title VI communities and transit‐dependent populations<br />
• Impact on pedestrians and bicyclists<br />
• Infrastructure needs (e.g., garages and park‐and‐ride lots)<br />
• Image<br />
The remainder <strong>of</strong> Section 5.3 defines the criteria and describes the assumptions and data sources<br />
used by the project team in evaluating the criteria. The results <strong>of</strong> the evaluation are detailed in<br />
Section 5.4.3.<br />
5.3.1 Primary Evaluation Criteria<br />
Potential Ridership<br />
Ridership forecasts were developed from the PAG regional travel demand model and ridership<br />
increases associated with the provision <strong>of</strong> specific service characteristics.<br />
Detailed Methodology<br />
To study the effectiveness <strong>of</strong> these HCT corridors, the PAG regional travel demand model was<br />
used to forecast 2040 route‐level ridership for each alternative. Each HCT route was coded in the<br />
PAG model as if it were local bus, as the PAG model does not distinguish between bus, BRT, or<br />
fixed‐guideway transit (i.e., LRT, streetcar, and CRT). To account for ridership differences<br />
between local bus and HCT modes, an incremental logit model was then applied to the PAG<br />
model−forecasted ridership, which accounts for travel time and other qualitative differences<br />
between local bus and HCT.<br />
For each alternative, duplicate transit service was removed from the baseline 2040 transit<br />
network. The PAG regional travel demand model was then run for the alternative, and transit<br />
trips were assigned to the transit network to determine route‐level ridership. These forecasts were<br />
generated based on two key assumptions:<br />
1. The in‐vehicle travel time for each <strong>of</strong> the HCT alternatives is based on local bus travel<br />
times (equal to auto travel time plus some delay due to stops and acceleration and<br />
deceleration <strong>of</strong> transit vehicles).<br />
2. None <strong>of</strong> the HCT alternatives is complemented with features that attract the commuters to<br />
choose HCT service (e.g., real‐time passenger information at bus stops and service<br />
branding).<br />
To account for these assumptions, the initial forecasts were post‐processed to take into account<br />
differences in travel time and other HCT‐specific features that would increase ridership over local<br />
bus patronage. The post‐processing analysis was carried out using an incremental logit model.<br />
Incremental logit generates the future (HCT) share <strong>of</strong> an alternative given the base (local bus)<br />
share and the change in utility <strong>of</strong> that alternative, as shown in the following equation:<br />
84
High Capacity Transit System Plan - <strong>Final</strong> <strong>Report</strong> June 2009<br />
Refined Corridor Assessment<br />
P ' =<br />
ot<br />
1+<br />
e<br />
−Δut<br />
1<br />
⎛ 1<br />
⎜<br />
⎝ Pot<br />
⎞<br />
−1<br />
⎟<br />
⎠<br />
where P0t = initial transit mode share<br />
P0t’ = future transit mode share<br />
Δut = change in transit utility<br />
Once the future HCT shares are obtained from the incremental logit model, they are multiplied<br />
by the preliminary HCT ridership forecasts to obtain the final HCT ridership forecasts.<br />
The initial share for each HCT alternative is based on a geographic analysis <strong>of</strong> the trip tables for<br />
each alternative. The base share is calculated as the ratio <strong>of</strong> transit trips to total trips for all zone<br />
pairs that fall within 2/3 mile <strong>of</strong> the HCT route. The base transit shares range from between 4%<br />
and 6%.<br />
There are two components to utility. First, the utility takes into account the difference between<br />
the travel time <strong>of</strong> the route operating as a local bus versus if the route were to operate as HCT.<br />
The change in utility associated with travel time is estimated as the product <strong>of</strong> a coefficient on invehicle<br />
travel time (‐0.025) and travel time savings expressed as a negative number.<br />
The second part <strong>of</strong> the utility difference is due to the qualitative features <strong>of</strong> HCT that differentiate<br />
it from local bus service. The list <strong>of</strong> features that augment ridership, along with their value are<br />
shown below in Table 19. This table was derived from the Bus Rapid Transit Practitioner’s Guide<br />
(TCRP <strong>Report</strong> 118). The total maximum equivalent minutes <strong>of</strong> in‐vehicle time that these features<br />
are worth was set to 10 minutes, as per the recommendations in TCRP <strong>Report</strong> 118. The<br />
contribution <strong>of</strong> the qualitative HCT features was then equal to the in‐vehicle time coefficient (‐<br />
0.025), multiplied by the sum <strong>of</strong> the applicable features for each alternative, times ‐10 minutes.<br />
The HCT ridership for each route is then equal to the baseline ridership times the ratio <strong>of</strong> the<br />
future share to the base share.<br />
85
High Capacity Transit System Plan - <strong>Final</strong> <strong>Report</strong> June 2009<br />
Refined Corridor Assessment<br />
Table 19<br />
Features That Augment Transit Ridership<br />
Feature<br />
Running Way (choose applicable features)<br />
Value<br />
Grade separated (Choose if LRT) 20%<br />
At grade busway 15%<br />
Arterial median 10%<br />
All-day bus lane 5%<br />
Shared lane 0%<br />
Stations (choose applicable features)<br />
Unique shelter 2%<br />
Lighting 2%<br />
Phone or security phone 3%<br />
Climate control 3%<br />
Passenger amenities 3%<br />
Passenger services 2%<br />
Vehicles (choose applicable features)<br />
Unique vehicle 5%<br />
Wide, multiple doors 5%<br />
Level boarding 5%<br />
Service Patterns (choose applicable features)<br />
All-day service 4%<br />
Headways 10 min. or less 4%<br />
Simple, clear routing 4%<br />
Off-vehicle fare collection 3%<br />
ITS Applications (choose applicable features)<br />
Passenger information at stops 7%<br />
Passenger information in vehicles 3%<br />
Branding<br />
Vehicles and stations 7%<br />
Brochures and schedules 3%<br />
Synergism (e.g., the sum <strong>of</strong> the above percentages is greater than 60%) 15%<br />
SOURCE: Bus Rapid Transit Practitioner’s Guide (TCRP <strong>Report</strong> 118) and PB<br />
CRT Ridership<br />
Ridership for Alternative 7 (CRT) conservatively reflects ridership on the New Mexico Rail<br />
Runner CRT service.<br />
Other Assumptions<br />
The following preliminary station locations were assumed for each HCT corridor:<br />
86
High Capacity Transit System Plan - <strong>Final</strong> <strong>Report</strong> June 2009<br />
Refined Corridor Assessment<br />
• Corridor 2A (Speedway Boulevard). Campbell Avenue (UA), Country Club Road, Alvernon<br />
Way, Swan Road, Craycr<strong>of</strong>t Road, Wilmot Road, Finance Center Drive, Huntington Park,<br />
Harrison Road, Houghton Road<br />
• Corridor 2B (Broadway Boulevard). Ronstadt Transit Center, Euclid Avenue, Campbell<br />
Avenue, Randolph Way, Alvernon Way, Swan Road, Williams Center Boulevard, Park<br />
Mall (0.45 mile W <strong>of</strong> Wilmot), Pantano Road, Camino Seco, Houghton Road<br />
• Corridor 3 (Campbell Avenue (North)). River Road, Allen Street, Fort Lowell Road, Grant<br />
Road , Elm Street (Arizona Health Sciences Center), Speedway Boulevard<br />
• Corridor 4 (Oracle Road). Tangerine Road, First Avenue, Calle Concordia, Magee Road, Ina<br />
Road, Orange Grove Road, River Road, Auto Mall Drive (Tucson Mall), Prince Road,<br />
Miracle Mile, Grant Road, Drachman Street, 6th Street/St. Maryʹs Road, Congress Street,<br />
Ronstadt Transit Center<br />
• Corridor 7 (I‐10/I‐19). Town <strong>of</strong> Marana, Downtown Tucson Depot, TIA, Town <strong>of</strong> Sahuarita,<br />
• Corridor 11 (Grant Road). Oracle Road, First Avenue, Campbell Avenue, Alvernon Way,<br />
Swan Road, Craycr<strong>of</strong>t Road, Tanque Verde Road<br />
• Corridor 12 (Campbell Avenue/Kino Parkway (South). Speedway Boulevard (UA), Fred Enke<br />
Drive (UA), Broadway Boulevard, Aviation Parkway, 36th Street, I‐10, Irvington Road,<br />
Drexel Road, TIA<br />
• Corridor 13 (6th Avenue /Nogales Highway). Ronstadt Transit Center, 14th Street, 18th Street,<br />
22nd Street, 29th Street, 36th Street, Veterans Boulevard (Veterans Administration (VA)<br />
Hospital), Pennsylvania Street, Irvington Road, Olive Street, Bilby Road, Valencia Road,<br />
TIA<br />
All stations are one‐way stations except the endpoint stations, which are two‐way stations. That<br />
is, there may be a separate platform and shelter for each direction <strong>of</strong> travel at a two‐way station.<br />
Preliminary station locations were identified based on connections to other HCT corridors,<br />
proximity to major trip generators, station‐area demographics (e.g., a high density <strong>of</strong> transitdependent<br />
populations), and desired station spacing. Station amenities were assumed to include<br />
unique shelters, benches, trash receptacles, and real‐time passenger information for consistency<br />
with the amenities identified for the planned Tucson Modern Streetcar.<br />
In developing the ridership forecasts, the following changes were assumed for existing local bus<br />
service in each corridor:<br />
• 2A – Speedway Boulevard<br />
• Split Route 180 into two parts and remove the section on Speedway Boulevard. The<br />
first part will start at Hughes Access Road and end at Alvernon Way/Speedway<br />
Boulevard. The second part will start at Harrison Road/Speedway Boulevard and<br />
end at Golf Links Road/Harrison Road.<br />
• Truncate Route 4 so that it runs between Speedway Boulevard/Kolb Road and Golf<br />
Links Road/Kolb Road.<br />
87
High Capacity Transit System Plan - <strong>Final</strong> <strong>Report</strong> June 2009<br />
Refined Corridor Assessment<br />
• Add a feeder service between Ronstadt Transit Center and Campbell Avenue. For<br />
ridership forecasting purposes, a 7.5‐minute peak headway and a 15‐minute <strong>of</strong>fpeak<br />
headway were modeled.<br />
• 2B – Broadway Boulevard<br />
• Eliminate Route 82.<br />
• Split Route 8 into two parts and remove the section on Broadway Boulevard. The<br />
first part will start at Irvington Road and end at Ronstadt Transit Center. The second<br />
part will start at Broadway Boulevard/Wilmot Road and end at Bear Canyon<br />
Road/Tanque Verde Road.<br />
• Truncate Route 8 so that it runs between Irvington Road and Ronstadt Transit<br />
Center.<br />
• 3 – Campbell Avenue North<br />
• Truncate Route 15 so that service is provided between Campbell Avenue/Speedway<br />
Boulevard and Stone Avenue.<br />
• 4 – Oracle Road<br />
• Eliminate Route 162.<br />
• Truncate Route 16 so that it runs between Oracle Road/Ina Road and Ina Road.<br />
• 7 – I‐10/I‐19<br />
• No changes.<br />
• 11 – Grant Road<br />
• Truncate Route 9 so that it runs between Ronstadt Transit Center and Grant<br />
Road/Campbell Avenue.<br />
• 12 – Campbell Avenue South/Kino Parkway<br />
• See the changes to Route 15 described above.<br />
• 13 – 6th Avenue South/Nogales Highway<br />
• No changes.<br />
Right-<strong>of</strong>-Way Availability<br />
Existing ROW in each corridor was assessed to determine whether dedicated HCT lanes could be<br />
implemented within the available ROW. ROW information was gathered from the <strong>Pima</strong> County<br />
Map Guide. It was assumed that 10‐foot wide curbside HCT lanes would need to be added in<br />
each direction <strong>of</strong> travel to provide a dedicated lane for LRT and BRT, and that existing medians<br />
and/or center turn lanes would remain. It was also assumed that 4‐foot bike lanes and 8‐foot<br />
pedestrian parkways (i.e., sidewalks plus landscaping/buffer strip) would be provided in each<br />
direction if they currently exist or are proposed as part <strong>of</strong> a planned transportation improvement<br />
project. Converting a general‐purpose lane to a dedicated HCT lane is assumed to be infeasible on<br />
four‐ and five‐lane major arterials since only two through lanes would remain for a relatively<br />
high volume <strong>of</strong> automobile traffic.<br />
88
High Capacity Transit System Plan - <strong>Final</strong> <strong>Report</strong> June 2009<br />
Refined Corridor Assessment<br />
Capital Costs<br />
The capital cost estimates are planning‐level estimates based on typical unit costs obtained from<br />
existing HCT services, planned HCT projects in other cities, and reports such as the Bus Rapid<br />
Transit Practitioner’s Guide (TCRP <strong>Report</strong> 118). The capital cost estimates include the following<br />
components:<br />
• Running Way. Running way costs include track, new pavement, power delivery system<br />
infrastructure, signing and striping, and TSP installations.<br />
• Stations. Station costs assume a unique shelter, benches, trash receptacles, bicycle racks,<br />
real‐time passenger information, and branding.<br />
• Vehicles. Vehicles are either streetcar cars, LRT cars, or standard‐length (40‐foot) stylized<br />
buses. Stylized buses typically look more streamlined and “rail car−like” than<br />
conventional buses, and they typically have advanced features such as Automated<br />
Passenger Counters (APC), TSP emitters, and on‐board real‐time passenger information<br />
displays.<br />
• Garage/Storage Facility. This cost is assumed for rail alternatives only. SunTran is currently<br />
constructing a bus garage/storage facility capable <strong>of</strong> accommodating articulated (60‐foot)<br />
buses used for BRT.<br />
• S<strong>of</strong>t Costs. S<strong>of</strong>t costs include design, engineering, and administration costs and<br />
contingencies.<br />
Figure 49 illustrates the scale <strong>of</strong> station that has been assumed in the capital costs assessment.<br />
These representative stations are designed for low‐floor boarding and include a unique shelter<br />
(designed with input from the community), lighting, a real‐time passenger information display,<br />
static information displays, a bicycle rack, benches, trash receptacles, and a unique route marker.<br />
The representative stations are built within existing ROW by converting existing on‐street<br />
parking to curb extensions (also called bus bulbs). The shelters are modular, so modules can be<br />
added or removed to reflect the volume <strong>of</strong> station users. One or more ticket vending machines<br />
may also be part <strong>of</strong> the station, along with features such as security cameras and emergency callboxes.<br />
Public art and landscaping opportunities would allow local neighborhood and business<br />
associations to customize the station to reflect the surrounding community. Similar stations have<br />
been constructed in Kansas City, MO, and the York Region <strong>of</strong> Ontario (near Toronto).<br />
89
High Capacity Transit System Plan - <strong>Final</strong> <strong>Report</strong> June 2009<br />
Refined Corridor Assessment<br />
SOURCE: Developed by Otak, Inc., for the proposed Central Avenue BRT service in St. Petersburg, FL, in 2007<br />
Figure 49<br />
Representative HCT Stations<br />
Operating Costs<br />
The operating costs estimates are planning‐level estimates based on Sun Tran’s operating cost per<br />
revenue hour (which represents driver wages, fuel, and administrative costs) as reported in the<br />
2006 National Transit Database (NTD). Operating costs for LRT were estimated based on a ratio<br />
obtained through a comparison <strong>of</strong> NTD data for transit agencies in areas similar to Tucson and<br />
currently operating both fixed‐bus service and LRT service. Operating costs for the HCT<br />
alternatives were estimated for each alternative as follows:<br />
• The service span duration for the peak period was assumed to be 6 hours, and the service<br />
span duration for the <strong>of</strong>f‐peak period was assumed to be 12 hours. CRT is assumed to<br />
operate only during the peak period and only on weekdays.<br />
• The headways for weekdays, Saturdays, Sundays, and holidays were assumed to be 10<br />
minutes during peak hours and 15 minutes during <strong>of</strong>f‐peak hours.<br />
• The two‐way length <strong>of</strong> the alternative was determined based on Figure 48.<br />
• An average travel speed was assumed for the alternative by adjusting the existing average<br />
local bus speed from the NTD to reflect increased station spacing, implementation <strong>of</strong> TSP,<br />
and/or operation in a dedicated lane as appropriate. The basis for the adjustments is the<br />
Transit Capacity and Quality <strong>of</strong> Service Manual (TCQSM). The TCQSM procedures also<br />
require assumptions about the number <strong>of</strong> stations per mile, dwell time at each stop, the<br />
environment in which the transit service operates (e.g., central business district), and the<br />
general operation <strong>of</strong> the traffic signal system. The project team assumed two stations per<br />
mile, a dwell time <strong>of</strong> 30 seconds per station, non‐central business district operation, and<br />
use <strong>of</strong> TSP.<br />
• The two‐way length <strong>of</strong> the alternative was divided by the corresponding average travel<br />
speed to calculate the average round‐trip travel time for each alternative. To this average<br />
round‐trip travel time, the project team added a five‐minute layover.<br />
• Given the average round‐trip travel time and the planned weekday headways, the<br />
number <strong>of</strong> vehicles needed to provide peak period service on a typical weekday was<br />
90
High Capacity Transit System Plan - <strong>Final</strong> <strong>Report</strong> June 2009<br />
Refined Corridor Assessment<br />
calculated. The number <strong>of</strong> daily vehicle‐hours needed to maintain planned headways<br />
throughout a typical weekday was also calculated.<br />
• For all modes but CRT, the weekday daily vehicle‐hours were annualized to reflect a full<br />
year <strong>of</strong> vehicle‐hours using an annualization factor <strong>of</strong> 310. An annualization factor <strong>of</strong> 310<br />
was used instead <strong>of</strong> a factor <strong>of</strong> 365 days per year because less transit service is typically<br />
provided on weekends and holidays than on weekdays. The transit service provided on<br />
Saturdays was assumed to be 65% <strong>of</strong> that provided on weekdays, and the transit service<br />
provided on Sundays and holidays was assumed to be 20% <strong>of</strong> that provided on weekdays.<br />
(The annual vehicle‐hours estimate calculated in this manner reflects only the vehiclehours<br />
needed to provide service at the planned headways.)<br />
• For CRT, the annualization factor is 255.<br />
• The number <strong>of</strong> annual revenue hours was multiplied by the assumed operating cost per<br />
revenue hour to estimate annual operating costs for the alternative.<br />
• For all modes but CRT, Sun Tran’s 2006 operating cost per revenue hour was increased by<br />
5% per year for two years to account for increased costs and thus calculate the 2008<br />
operating cost per revenue hour. The CRT operating cost per revenue hour is the average<br />
cost for several CRT systems in North America as obtained from the 2006 NTD.<br />
5.3.2 Secondary Evaluation Criteria<br />
Consistency with Regional Plans and Programs<br />
RTA plans were reviewed to identify planned roadway improvements that may impact the HCT<br />
alternatives. These improvements were accounted for in the ROW availability assessment. The<br />
planned Tucson Modern Streetcar project connecting downtown Tucson with UA and relevant<br />
planned transit improvements included in the RTA plan were also reviewed so that the HCT<br />
system can be implemented in concert.<br />
Impacts on Other Transit Services<br />
The project team identified the existing and planned transit services that run in or intersect the<br />
HCT corridors. These services include multiple local bus routes and one planned streetcar route.<br />
The project team also identified the transit centers, park‐and‐ride lots, and transfer points that are<br />
in the HCT corridors.<br />
The HCT alternatives impact existing and other planned transit services in multiple ways. One<br />
type <strong>of</strong> impact is the result <strong>of</strong> the decision about what to do with underlying local bus service in<br />
the HCT corridor. (Section 5.3.1 identified changes to local bus routes that were assumed for<br />
ridership forecasting purposes.) If underlying local bus service is maintained at existing or<br />
planned levels, it benefits riders because they will be able to choose local bus or HCT depending<br />
on their destination. If underlying local bus service is reduced or eliminated, however, origins<br />
and destinations located between HCT stations may not be as accessible by transit as they once<br />
were, so riders may have to walk farther to access transit after HCT is implemented. At the same<br />
time, reduced or eliminated local bus service in an HCT corridor can allow Sun Tran to increase<br />
91
High Capacity Transit System Plan - <strong>Final</strong> <strong>Report</strong> June 2009<br />
Refined Corridor Assessment<br />
service elsewhere, possibly providing transit service in areas where it was not provided before.<br />
This type <strong>of</strong> impact is assessed in this section.<br />
Another type <strong>of</strong> impact involves the coordination <strong>of</strong> one HCT corridor with other HCT corridors<br />
and with the planned Tucson Modern Streetcar. If Corridor 3 (Campbell North) is selected for<br />
implementation, it makes sense to implement streetcar in the corridor because the corridor is a<br />
natural extension <strong>of</strong> the planned Tucson Urban Corridor Streetcar route. Implementing BRT or<br />
LRT instead <strong>of</strong> streetcar may force riders traveling between downtown Tucson and points north<br />
<strong>of</strong> Speedway Boulevard to transfer at the northern end <strong>of</strong> the Tucson Urban Corridor Streetcar<br />
route, and this transfer could dissuade potential riders from using either service. This type <strong>of</strong><br />
impact will be assessed in Section 6.0.<br />
A third type <strong>of</strong> impact is the interaction <strong>of</strong> local bus and HCT in a dedicated transit lane. If local<br />
buses are allowed to use the dedicated lane, their more‐frequent stops are likely to hold up HCT<br />
vehicles. Ensuring that HCT provides delay‐free service may mean eliminating the local bus<br />
service, changing the local bus service pattern to skip‐stop or another limited‐stop arrangement,<br />
relocating local bus service to a parallel street in the corridor, and/or constructing bus pullouts so<br />
that HCT vehicles can bypass stopped local buses. Another potential solution is implementing<br />
HCT on a parallel street‐‐in two‐way operation or as part <strong>of</strong> a one‐way couplet. This type <strong>of</strong><br />
impact is assessed in this section to a limited extent; Section 6.0 will address it further.<br />
Land Use Compatibility/Transit-Oriented Development Potential<br />
In addition to reviewing the transit‐supportive densities analysis conducted in Section 3.0, the<br />
project team assessed the areas that could support the densities necessary to generate significant<br />
transit ridership in terms <strong>of</strong> several recent plans for growth in the region:<br />
• Oracle Area Revitalization Plan<br />
• Miramonte Neighborhood Plan<br />
• Jefferson Park Neighborhood Plan<br />
• 12th Avenue‐Valencia Road Area Plan<br />
• Alvernon‐Broadway Area Plan<br />
• El Encanto‐Colonia Solana Neighborhood Plan<br />
• Grant‐Alvernon Area Plan<br />
• The Bridges Plan<br />
• Tucson Medical Center Plan<br />
• University Medical Center North Plan<br />
• Williams Addition Plan<br />
Access to Major Attractors and Generators<br />
The project team determined which <strong>of</strong> the major trip attractors and generators shown in Figure 7<br />
<strong>of</strong> Section 2.0 are within walking distance <strong>of</strong> the HCT alternatives. Typical walk access distance<br />
92
High Capacity Transit System Plan - <strong>Final</strong> <strong>Report</strong> June 2009<br />
Refined Corridor Assessment<br />
for a rail stop (i.e., LRT and CRT) is 0.50 mile. Typical walk access distance for a bus stop is 0.25<br />
mile. (Walk access distance for a full‐featured BRT service may approach 0.50 mile.) The project<br />
team assumed that a walk access distance <strong>of</strong> 0.25 mile is also appropriate for streetcar because<br />
streetcar typically serves a circulator function in which access to the service is more critical than<br />
mobility over long distances and stops are more closely spaced.<br />
Impacts on Roadway Mobility and Congestion<br />
The project team obtained 2040 volume and capacity data from the PAG travel demand model for<br />
each corridor and calculated volume‐to‐capacity (v/c) ratios to determine if adequate unused<br />
capacity exists to assess (1) whether or not addition <strong>of</strong> an HCT mode to the corridor would have a<br />
significant impact on automobile traffic in terms <strong>of</strong> delays to automobile traffic and queues, (2)<br />
whether or not a general‐purpose lane could be dedicated to HCT service, and (3) whether or not<br />
transit preferential treatments such as TSP could be effective. The thresholds that the project team<br />
used for this assessment are as follows:<br />
• 0.00 ≤ v/c ≤ 0.70: The segment operates at Level <strong>of</strong> Service (LOS) C or better. HCT is not<br />
likely to have a significant impact on automobile traffic. A general‐purpose lane likely<br />
could be dedicated to HCT. Transit preferential treatments are not likely to be effective<br />
(unless there is a policy that transit should be favored over automobile traffic).<br />
• 0.70 < v/c ≤ 0.90: The segment operates at LOS D. HCT may have a significant impact on<br />
automobile traffic. A general‐purpose lane could perhaps be dedicated to HCT, but<br />
detailed study is required. Transit preferential treatments may be effective.<br />
• 0.90 < v/c ≤ 1.00: The segment operates at LOS E (at capacity). HCT is likely to have a<br />
significant impact on automobile traffic. A general‐purpose lane likely could not be<br />
dedicated to HCT, but detailed study is required. Transit preferential treatments may be<br />
effective.<br />
• v/c > 1.00: The segment operates at LOS F (over capacity). HCT is likely to have a<br />
significant impact on automobile traffic. A general‐purpose lane likely could not be<br />
dedicated to HCT. Transit preferential treatments may not be effective (unless there is a<br />
policy that transit should be favored over automobile traffic).<br />
The project team notes two other factors that may influence the decision to convert a generalpurpose<br />
lane to a dedicated HCT lane: public perception and the competitive value <strong>of</strong> transit.<br />
The public (i.e., the driving public) may resist conversion <strong>of</strong> a general‐purpose lane to a dedicated<br />
transit lane because <strong>of</strong> real or perceived impacts on automobile level <strong>of</strong> service. On the other<br />
hand, if HCT operates in mixed traffic flow or the dedicated lane provides no travel time savings<br />
because the corridor is not congested to begin with, HCT is less likely to be competitive with<br />
driving in terms <strong>of</strong> travel time and less likely to generate ridership. Thus, there are policy<br />
implications associated with converting general‐purpose lanes to dedicated HCT lanes.<br />
If policy support is not adequate in the near term, it may grow in the long term as a result <strong>of</strong><br />
increasing congestion in the region. For example, several urban areas in Florida are beginning to<br />
implement tools such as Multimodal Transportation Districts (MMTDs) as a means <strong>of</strong> promoting<br />
93
High Capacity Transit System Plan - <strong>Final</strong> <strong>Report</strong> June 2009<br />
Refined Corridor Assessment<br />
infill and redevelopment while managing congestion; these MMTDs place secondary priority on<br />
automobiles and primary priority on alternative modes such as transit. Other potential means <strong>of</strong><br />
building support for converting general‐purpose lanes to dedicated HCT lanes are incremental<br />
implementation <strong>of</strong> the conversion and pilot studies.<br />
The project team also notes that transit preferential treatments may improve transit reliability<br />
even if they do not reduce the potential for delay. Additionally, transit preferential treatments<br />
that are not effective during the peak hour may be effective during less‐congested hours. More<br />
detailed assessment <strong>of</strong> transit preferential treatments is therefore necessary as project<br />
development moves forward.<br />
Possible Environmental Impacts<br />
Environmental impacts (including impacts on endangered species habitats, water quality, and<br />
floodplains) may occur if new roadways are constructed or if sizeable new HCT‐related facilities<br />
such as a maintenance garage or park‐and‐ride lots are constructed. The project team identified<br />
where such impacts might be likely in the corridors. Environmental impacts are not likely where<br />
HCT will operate on existing streets or where facilities such as park‐and‐ride lots are integrated<br />
into existing developments. HCT may positively affect the environment in terms <strong>of</strong> air quality<br />
and energy use.<br />
Rail Owner/Operator Cooperation<br />
This criterion is applicable to CRT only. Detailed study by the Arizona Department <strong>of</strong><br />
Transportation (ADOT) is underway related to a potential high‐speed passenger rail corridor that<br />
connects Tucson and Phoenix. The project team assessed relevant findings from this effort, as<br />
high‐speed rail and CRT are likely to use the same tracks and stations in the Tucson region. The<br />
high‐speed rail study does not analyze any passenger rail services south or east <strong>of</strong> downtown<br />
Tucson.<br />
Impacts on Title VI Communities and Transit-Dependent Populations<br />
This criterion addresses the impact <strong>of</strong> HCT on specific demographic groups. These are groups<br />
with the highest propensity to use transit (“transit‐dependent populations”) and the groups that<br />
are the focus <strong>of</strong> Title VI <strong>of</strong> the Civil Rights Act. Input data for this assessment is Census tract data<br />
from the PAG model.<br />
Title VI <strong>of</strong> the Civil Rights Act requires that “no person shall on the grounds <strong>of</strong> race, color, sex,<br />
age, disability, or national origin, as provided by Title VI <strong>of</strong> the Civil Rights Act <strong>of</strong> 1964, and the<br />
Civil Rights Restoration Act <strong>of</strong> 1987 (P.L. 100.259), be excluded from participation in, be denied<br />
the benefits <strong>of</strong>, or be otherwise subjected to discrimination under any program or activity.” The<br />
United States Department <strong>of</strong> Transportation (DOT) requires involving the public at all stages <strong>of</strong><br />
the project in an effort to ensure that every transportation project nationwide considers the<br />
human and physical environment. There are three fundamental justice principles:<br />
94
High Capacity Transit System Plan - <strong>Final</strong> <strong>Report</strong> June 2009<br />
Refined Corridor Assessment<br />
• To avoid, minimize, or mitigate disproportionately high and adverse human health and<br />
environmental effects, including social and economic effects, on minority populations and<br />
low‐income populations.<br />
• To ensure the full and fair participation by all potentially affected communities in the<br />
transportation decision making process.<br />
• To prevent the denial <strong>of</strong>, reduction in, or significant delay in the receipts <strong>of</strong> benefits by<br />
minority and low‐income populations.<br />
Impacts on Pedestrians and Bicyclists<br />
For the purposes <strong>of</strong> this study, assessment <strong>of</strong> impacts on pedestrians and bicycles focused on<br />
maintaining and/or providing bicycle lanes and sidewalks in conjunction with potential HCT<br />
route development. As stated previously in the ROW availability discussion, the project team<br />
assumed that all alignments that currently have or are proposed to have bicycles lanes and<br />
pedestrian parkways will have 4‐foot bike lanes and 8‐foot pedestrian parkways for sidewalk and<br />
landscaping if HCT is implemented. Bicycle accommodation is an important consideration<br />
because bicycles are a means <strong>of</strong> access to HCT service, particularly in the long run if mode usage<br />
shifts away from vehicles, and because <strong>of</strong> the strong regional commitment to bicycle safety and<br />
creation <strong>of</strong> a bicycle‐friendly community.<br />
Future planning and implementation <strong>of</strong> HCT should consider accommodation <strong>of</strong> bicycles at<br />
stations and on board vehicles. Bicycle accommodation, for example, should be a criterion in the<br />
purchase <strong>of</strong> HCT vehicles.<br />
Infrastructure Needs<br />
The project team included most <strong>of</strong> the infrastructure needed to support the HCT alternatives in<br />
the capital costs assessment. Such infrastructure includes required items that are common to all <strong>of</strong><br />
the HCT alternatives (e.g., running way, stations, vehicles, and passenger amenities) and required<br />
items that are unique to specific HCT modes or alternatives (e.g., garage facilities). The other<br />
infrastructure items include park‐and‐ride lots, new transit centers, and new or reconstructed<br />
overpasses and underpasses.<br />
Image<br />
This criterion considers that LRT and streetcar are generally perceived more favorably than bus<br />
services, and it was added to reflect the public’s views <strong>of</strong> potential HCT modes. The project team<br />
notes that studies indicate that the land development impacts and ridership <strong>of</strong> BRT can achieve<br />
LRT levels if the investment in the BRT service is similar (e.g., unique stations, dedicated running<br />
way, and high‐frequency service).<br />
95
High Capacity Transit System Plan - <strong>Final</strong> <strong>Report</strong> June 2009<br />
Refined Corridor Assessment<br />
5.4 ALTERNATIVE ASSESSMENT<br />
5.4.1 Primary Evaluation Criteria<br />
Potential Ridership<br />
Table 20 summarizes the preliminary ridership forecasts for the HCT alternatives. The alternative<br />
that generates the most daily ridership is Alternative 2B with LRT. The alternative that generates<br />
the most daily ridership per mile is Alternative 13 with streetcar. The alternative that generates the<br />
least daily ridership is Alternative 3 with streetcar. The alternative that generates the least daily<br />
ridership per mile is Alternative 7 (CRT).<br />
The project team notes that the existing Sun Tran bus routes with the most ridership in August<br />
2008 were, in descending order, Route 8 (Broadway Boulevard‐South 6th Avenue), Route 16 (Ina<br />
Road‐Oracle Road‐South 12th Avenue), Route 4 (Speedway Boulevard‐Kolb Road), Route 11<br />
(Alvernon Way‐Palo Verde Road), and Route 3 (East 6th Street‐East 5th Street‐Wilmot Road‐Stella<br />
Road). Corridors 2A, 2B, 4, and 13 include portions <strong>of</strong> these existing bus routes.<br />
Corridor<br />
2A - Speedway<br />
Boulevard<br />
2B - Broadway Boulevard<br />
3 - Campbell Avenue<br />
North<br />
Table 20<br />
Route<br />
Length<br />
10 miles<br />
11.5 miles<br />
4 - Oracle Road 16 miles<br />
Preliminary Ridership Estimates<br />
HCT Scenario<br />
Daily<br />
Ridership<br />
Annual<br />
Ridership<br />
Daily<br />
Riders/Mile<br />
BRT - Mixed Traffic 3,279 1,016,490 328<br />
BRT - Exclusive Lane 3,615 1,120,650 362<br />
LRT - Exclusive Lane 3,855 1,195,050 386<br />
BRT - Exclusive Lane 3,887 1,204,970 338<br />
LRT - Exclusive Lane 4,148 1,285,880 361<br />
3.5 miles SC - Mixed Traffic 721 223,510 206<br />
BRT - Mixed Traffic 3,140 973,400 196<br />
BRT - Exclusive Lane 3,544 1,098,640 222<br />
LRT - Exclusive Lane 3,782 1,172,420 236<br />
7 - I-10/I-19 40 miles CRT 2,500 637,500 63<br />
11 - Grant Road 7.5 miles<br />
12 - Campbell Avenue<br />
South/Kino Parkway<br />
13 - 6th Avenue/ Nogales<br />
Highway<br />
8.5 miles<br />
9 miles<br />
NOTE: Park-and-ride lot costs are not included.<br />
BRT - Mixed Traffic 1,300 403,000 173<br />
BRT - Exclusive Lane 1,404 435,240 187<br />
LRT - Exclusive Lane 1,500 465,000 200<br />
BRT - Mixed Traffic 1,300 403,000 153<br />
BRT - Exclusive Lane 1,404 435,240 165<br />
LRT - Exclusive Lane 1,500 465,000 176<br />
BRT - Mixed Traffic 3,146 975,260 350<br />
BRT - Exclusive Lane 3,398 1,053,380 378<br />
SC - Mixed Traffic 3,626 1,124,060 403<br />
96
High Capacity Transit System Plan - <strong>Final</strong> <strong>Report</strong> June 2009<br />
Refined Corridor Assessment<br />
Right-<strong>of</strong>-Way Availability<br />
The results <strong>of</strong> the ROW assessment are summarized in Table 21. The ROW required to add<br />
dedicated HCT lanes includes additional lanes/medians that will be constructed with planned<br />
roadway improvements included in the 2030 RTP. While available ROW varies, a combination <strong>of</strong><br />
existing ROW and new ROW is needed to develop dedicated HCT lanes in all corridors.<br />
Assessments <strong>of</strong> each corridor are as follows:<br />
• Corridor 2A (Speedway Boulevard). Significant ROW will be needed from Campbell Avenue<br />
to Wilmot Road, the cost <strong>of</strong> which will be high as nearly all property is commercial and<br />
could require total property takes.<br />
• Corridor 2B (Broadway Boulevard). Dedicated transit lanes exist between Columbus<br />
Boulevard and Camino Seco. Transit lanes will be added between Euclid Avenue and<br />
Country Club Road as part <strong>of</strong> an RTA roadway project. Adding lanes between Country<br />
Club Road and Columbus Boulevard will require property acquisition, particularly<br />
between Alvernon Way and Columbus Boulevard.<br />
• Corridor 3 (Campbell Avenue (North). ROW will be required along the entire length <strong>of</strong> this<br />
route, including total property takes between Grant Road and Prince Road.<br />
• Corridor 4 (Oracle). North <strong>of</strong> Ina Road, sufficient ROW is available to add HCT lanes.<br />
Significant ROW acquisition, possibly including total takes, will be required between<br />
Limberlost Drive and Drachman Street and on Main Street/Granada Avenue. A gradeseparated<br />
crossing <strong>of</strong> the UP railroad mainline between Speedway Boulevard and St.<br />
Mary’s Road will likely be required for an LRT alternative.<br />
• Corridor 11 (Grant Road). Significant ROW, which could be acquired as part <strong>of</strong> the RTA<br />
Grant Road widening project, will be needed between Oracle Road and Swan Road and<br />
between Swan Road and Tanque Verde Road.<br />
• Corridor 12 (Campbell Avenue South/Kino Parkway). ROW, including residences and UA<br />
property, will be needed between Speedway Boulevard and Broadway Boulevard. The<br />
existing bridges over the Aviation Parkway and I‐10 have limiting widths.<br />
• Corridor 13 (6th Avenue/Nogales Highway). Significant ROW takes between Congress Street<br />
and Irvington Road, including total takes <strong>of</strong> residential and commercial properties, will be<br />
required.<br />
97
High Capacity Transit System Plan - <strong>Final</strong> <strong>Report</strong> June 2009<br />
Refined Corridor Assessment<br />
Corridor<br />
Corridor Segment<br />
Roadway From To<br />
Table 21<br />
ROW Availability Assessment<br />
Existing<br />
Lanes<br />
Future<br />
Lanes<br />
Median<br />
(ft)<br />
Existing<br />
ROW (ft)<br />
ROW<br />
Required to<br />
Add HCT<br />
Lanes (ft)<br />
Additional<br />
ROW<br />
Required?<br />
Comments<br />
Campbell Ave Wilmot Rd 6 6 22 90-120 134 Yes<br />
2A Speedway Blvd Wilmot Rd Bedford Dr 6 6 22 130-170 134 Yes*<br />
Bedford Dr Houghton Rd 3 4 20 100-150 108 Yes*<br />
Euclid Ave Country Club Rd 5 8 20 70-80 158 Yes Add as part <strong>of</strong> Broadway project<br />
Country Club Rd Columbus Blvd 6 6 20 100-130 156 Yes<br />
2B Broadway Blvd Columbus Blvd Prudence Rd 8 8 20 140 156 No Bus lanes in place<br />
Prudence Rd Camino Seco 8 8 20 160 156 No Bus lanes in place<br />
Camino Seco Houghton Rd 5 4 20 100-160 108 Yes*<br />
3 Campbell Ave<br />
River Rd Grant Rd 5 5 0 70-95 100 Yes<br />
Grant Rd Speedway Blvd 6 6 22 120 134 Yes<br />
Tangerine Rd Calle Concordia 4 6 20 180-240 132 No<br />
Oracle Rd<br />
Calle Concordia Ina Rd 6 6 20 190-230 132 No<br />
Ina Rd Limberlost Dr 6 6 18-60 130-200 130-182 No<br />
4<br />
Limberlost Dr Ventura St 6 6 18-28 110-140 130-140 Yes*<br />
Main St<br />
Ventura St University Blvd 5 5 0 70-130 100 Yes*<br />
University Blvd Alameda St 4 4 0 60 88 Yes UP railroad mainline crossing<br />
Granada Ave Alameda St Congress St 5 5 12 130 112 Yes<br />
7 N/A N/A N/A N/A N/A N/A N/A N/A N/A UP railroad<br />
11 Grant Rd<br />
Oracle Rd Belvedere Rd 5 6 20 65-120 132 Yes Add as part <strong>of</strong> Grant project<br />
Belvedere Rd Tanque Verde Rd 6 6 22 100-130 134 Yes<br />
Campbell Ave Speedway Blvd 10th St 6 6 22 110 134 Yes<br />
12 Kino Pkwy<br />
10th St Ajo Way 6 6 22 145-160 134-142 Yes Bridge over Aviation Pkwy, 100’<br />
Ajo Way Benson Hwy 4 4 24 155 112 No Bridge over I-10, 84’<br />
Campbell Ave Benson Hwy Valencia Rd 5 5 0 110-145 100 No<br />
6th Ave<br />
Congress St 21st St 3 3 0 75 76 Yes On-street parking 8’ both sides<br />
21st St Irvington Rd 5 4 12 75 100 Yes Bridge over I-10, 84’ wide<br />
13 Nogales Hwy Irvington Rd Valencia Rd 5 4 12 150-200 100 No<br />
Valencia Rd Nogales Hwy Tucson Blvd 6 6 22 110-120 134 Yes<br />
Tucson Blvd Valencia Rd TIA 6 6 22 115 134 Yes<br />
*Only need additional ROW for portions <strong>of</strong> this segment<br />
98
High Capacity Transit System Plan - <strong>Final</strong> <strong>Report</strong> June 2009<br />
Refined Corridor Assessment<br />
5.4.2 Capital Costs<br />
Table 22 summarizes the capital cost estimates for the HCT alternatives. It is evident from the<br />
table that the mixed‐traffic BRT alternatives are the least costly. BRT in dedicated lanes on<br />
Broadway Boulevard is also among the least costly alternatives because dedicated lanes already<br />
exist in most <strong>of</strong> the corridor or will be constructed as part <strong>of</strong> a programmed widening project.<br />
LRT and streetcar alternatives have the highest cost because <strong>of</strong> the trackwork, power delivery<br />
infrastructure, vehicles that cost significantly more than buses, and the need for special<br />
garage/storage facilities.<br />
Table 22<br />
Corridor Route Length HCT Scenario<br />
2A - Speedway<br />
Boulevard<br />
2B - Broadway<br />
Boulevard<br />
3 - Campbell Avenue<br />
North<br />
10 miles<br />
11.5 miles<br />
4 - Oracle Road 16 miles<br />
Preliminary Capital Cost Estimates<br />
Total Capital Cost<br />
(2008 dollars)<br />
Capital Cost per Mile<br />
BRT - Mixed Traffic $14,200,000 $1,420,000<br />
BRT - Exclusive Lane $54,500,000 $5,450,000<br />
LRT - Exclusive Lane $589,600,000 $58,960,000<br />
BRT - Exclusive Lane $12,765,000 $1,110,000<br />
LRT - Exclusive Lane $607,085,000 $52,790,000<br />
3.5 miles SC - Mixed Traffic $218,540,000 $62,440,000<br />
BRT - Mixed Traffic $23,040,000 $1,440,000<br />
BRT - Exclusive Lane $87,680,000 $5,480,000<br />
LRT - Exclusive Lane $972,160,000 $60,760,000<br />
7 - I-10/I-19 40 miles CRT $607,300,000 $15,180,000<br />
11 - Grant Road 7.5 miles<br />
12 - Campbell Avenue<br />
South/Kino Parkway<br />
13 - 6th Avenue/<br />
Nogales Highway<br />
8.5 miles<br />
9 miles<br />
NOTE: Park-and-ride lot costs are not included.<br />
BRT - Mixed Traffic $11,985,000 $1,410,000<br />
BRT - Exclusive Lane $40,350,000 $5,380,000<br />
LRT - Exclusive Lane $445,950,000 $59,460,000<br />
BRT - Mixed Traffic $9,540,000 $1,060,000<br />
BRT - Exclusive Lane $46,240,000 $5,440,000<br />
LRT - Exclusive Lane $497,080,000 $58,480,000<br />
BRT - Mixed Traffic $14,200,000 $1,420,000<br />
BRT - Exclusive Lane $45,810,000 $5,090,000<br />
SC - Mixed Traffic $518,490,000 $57,610,000<br />
Operating Costs<br />
Table 23 provides a summary <strong>of</strong> the preliminary operating costs assessment. The Campbell<br />
Avenue South streetcar alternative has the highest annual operating cost and is significantly<br />
higher than the other alternatives. BRT in mixed traffic on the Oracle Road Corridor has the next<br />
highest annual operating cost, followed closely by Grant Road BRT in mixed traffic. The lowest in<br />
annual operating cost is LRT in the Oracle Road Corridor, and the next lowest is LRT on the<br />
99
High Capacity Transit System Plan - <strong>Final</strong> <strong>Report</strong> June 2009<br />
Refined Corridor Assessment<br />
Broadway Boulevard Corridor. BRT in an exclusive lane in the Broadway Boulevard corridor has<br />
a slightly higher annual operating cost than LRT in the Broadway Boulevard corridor.<br />
In general, operation in mixed‐traffic has the highest annual operating cost. This is because transit<br />
vehicles achieve the slowest speed in mixed traffic due to interaction with automobiles. Slower<br />
speed means that more vehicles are needed to provide service at the desired headway, so more<br />
fuel is used, more vehicle maintenance is necessary, and more operators must be paid.<br />
5.4.3 Secondary Evaluation Criteria<br />
Consistency with Regional Plans and Programs<br />
The planned roadway improvements that may impact streets in the HCT corridors according to<br />
RTA plans and as <strong>of</strong> October 2008 are as follows:<br />
• Grant Road. Oracle Road to Swan Road will be widened from a five‐lane to a six‐lane<br />
divided roadway. Construction is expected to begin in 2011/2012, and the widening is<br />
projected to be completed by 2025. This project positively impacts mixed‐traffic operations<br />
in the HCT corridor because it should reduce congestion. However, less public ROW may<br />
be available for constructing new dedicated transit lanes.<br />
• Speedway Boulevard. Camino Seco to Houghton Road will be widened from a two‐ and<br />
three‐lane road to a four‐lane divided roadway. Construction is expected to be completed<br />
by 2010. This project positively impacts mixed‐traffic operations in the HCT corridor<br />
because it should reduce congestion. However, less public ROW may be available for<br />
constructing new dedicated transit lanes.<br />
• Broadway Boulevard. Euclid Avenue to Columbus Boulevard will be widened from five and<br />
six lanes to eight lanes (including transit lanes) with a raised median. The roadway<br />
widening is expected to be completed by 2015. This project positively impacts traffic<br />
operations in the HCT corridor because it should reduce congestion and it extends the<br />
existing dedicated transit lanes.<br />
100
High Capacity Transit System Plan - <strong>Final</strong> <strong>Report</strong> June 2009<br />
Refined Corridor Assessment<br />
Table 23<br />
Corridor Route Length HCT Scenario Speed<br />
Preliminary Operating Cost Estimates<br />
Operating Cost<br />
Per Hour<br />
Weekday Daily<br />
Operating Cost<br />
Annual<br />
Operating Cost<br />
Annual<br />
Operating Cost<br />
Per Mile (Two-<br />
Way)<br />
BRT - Mixed Traffic 16 mph $83.20 $10,000 $3,095,040 $309,504<br />
2A - Speedway<br />
Boulevard<br />
10 miles BRT - Exclusive Lane 20 mph $83.20 $8,500 $2,630,784 $263,078<br />
LRT - Exclusive Lane 20 mph $78.04 $8,000 $2,467,625 $246,762<br />
2B - Broadway<br />
BRT - Exclusive Lane 20 mph $83.20 $9,000 $2,785,536 $242,221<br />
11.5 miles<br />
Boulevard<br />
LRT - Exclusive Lane 20 mph $78.04 $8,400 $2,612,779 $227,198<br />
3 - Campbell Avenue<br />
North<br />
3.5 miles SC - Mixed Traffic 12 mph $78.04 $4,700 $1,741,853 $497,672<br />
BRT - Mixed Traffic 12 mph $83.20 $19,500 $4,797,312 $299,832<br />
4 - Oracle Road 16 miles BRT - Exclusive Lane 20 mph $83.20 $12,500 $3,868,800 $241,800<br />
LRT - Exclusive Lane 20 mph $78.04 $11,700 $3,628,860 $226,804<br />
7 - I-10/I-19 40 miles CRT 50 mph $500.00 $24,000 $3,060,000 $76,500<br />
BRT - Mixed Traffic 16 mph $83.20 $8,500 $2,630,784 $350,771<br />
11 - Grant Road 7.5 miles BRT - Exclusive Lane 20 mph $83.20 $6,500 $2,011,776 $268,237<br />
LRT - Exclusive Lane 20 mph $78.04 $6,100 $1,887,007 $251,601<br />
BRT - Mixed Traffic 16 mph $83.20 $8,500 $2,630,784 $309,504<br />
12 - Campbell Avenue<br />
South/Kino Parkway<br />
8.5 miles BRT - Exclusive Lane 20 mph $83.20 $7,000 $2,166,528 $254,886<br />
LRT - Exclusive Lane 20 mph $78.04 $6,600 $2,032,162 $239,078<br />
BRT - Mixed Traffic 16 mph $83.20 $9,000<br />
$2,785,536 $309,504<br />
13 - 6th Avenue/<br />
Nogales Highway<br />
9 miles<br />
BRT - Exclusive Lane 20 mph $83.20 $7,000<br />
$2,166,528 $240,725<br />
SC - Mixed Traffic 12 mph $78.04 $11,200<br />
$2,612,779 $290,309<br />
101
High Capacity Transit System Plan - <strong>Final</strong> <strong>Report</strong> June 2009<br />
Refined Corridor Assessment<br />
• Broadway Boulevard. Camino Seco to Houghton Road will be widened from three and five<br />
lanes to a four‐lane divided roadway. The widening is expected to be complete by 2020.<br />
This project positively impacts mixed‐traffic operations in the HCT corridor because it<br />
should reduce congestion. However, less public ROW may be available for constructing<br />
new dedicated transit lanes.<br />
The planned transit improvements that may impact the HCT alternatives are as follows:<br />
• New Tucson Modern Streetcar service running from the University Medical Center to downtown<br />
Tucson. The Tucson Modern Streetcar is scheduled for completion by 2011/2012. This<br />
project is effectively the first component <strong>of</strong> a future HCT network. Several <strong>of</strong> the potential<br />
HCT alternatives can connect to or extend the Tucson Modern Streetcar.<br />
• New express bus service on Oracle Road from Tangerine Road to River Road. This service is<br />
expected to start by 2011/2012. Express service in this corridor may build a market for<br />
future HCT service.<br />
• New express bus service on 6th Avenue/Nogales Highway from downtown Tucson to Valencia<br />
Road. This service is expected to start by 2011/2012. Express service in this corridor may<br />
build a market for future HCT service.<br />
Impacts on Other Transit Services<br />
Section 5.3.1 identifies changes to local bus routes that were assumed for ridership forecasting<br />
purposes.<br />
For the purposes <strong>of</strong> this screening analysis, HCT alternatives that operate in a dedicated lane<br />
were assumed to displace or eliminate local bus services as described in Section 5.3.2. These<br />
alternatives are:<br />
• 2A (Speedway Boulevard) BRT in dedicated lanes<br />
• 2A (Speedway Boulevard) LRT<br />
• 2B (Broadway Boulevard) BRT in dedicated lanes<br />
• 2B (Broadway Boulevard) LRT<br />
• 4 (Oracle Road) BRT in dedicated lanes<br />
• 4 (Oracle Road) LRT<br />
• 11 (Grant Road) BRT in dedicated lanes<br />
• 11 (Grant Road) LRT<br />
• 13 (6th Avenue South/Nogales Highway) BRT in dedicated lanes<br />
Land Use Compatibility/Transit-Oriented Development Potential<br />
Corridors that have high‐density residential development or provide opportunities for<br />
redevelopment <strong>of</strong> properties that promote use <strong>of</strong> transit, biking, and walking are corridors that<br />
support HCT systems. The land use and development potential within each <strong>of</strong> the candidate<br />
routes was evaluated, and the results are summarized below.<br />
102
High Capacity Transit System Plan - <strong>Final</strong> <strong>Report</strong> June 2009<br />
Refined Corridor Assessment<br />
2A – Speedway Boulevard<br />
Land use within the Speedway Boulevard corridor, particularly between Oracle Road and Wilmot<br />
Road includes primarily high‐density residential neighborhoods buffered by strip retail and <strong>of</strong>fice<br />
developments along the arterial and larger shopping center development at major intersections.<br />
This section <strong>of</strong> Speedway Boulevard is fully developed. The section between Wilmot Road and<br />
Houghton Road is also fully developed and includes medium‐and high‐density residential<br />
development; however, commercial land uses are primarily located at major intersections. Some<br />
additional development can occur at the Houghton Road intersection. While opportunities to<br />
implement TOD that combines high‐density residential with supporting commercial land uses<br />
exist, no specific areas where this type <strong>of</strong> development might occur have been identified in<br />
planning efforts. The Miramonte Neighborhood Plan, which includes the section <strong>of</strong> Speedway<br />
Boulevard from Alvernon Way to Country Club Road, generally supports this type <strong>of</strong><br />
development.<br />
UA/UA Health Sciences Center is the only major employer/activity center served by Speedway<br />
Boulevard. However, this corridor is also used by downtown commuters.<br />
2B – Broadway Boulevard<br />
The Broadway Boulevard corridor is fully developed with a combination <strong>of</strong> medium‐ and highdensity<br />
residential neighborhoods, strip retail and <strong>of</strong>fice development, and high‐density<br />
shopping and employment destinations. These destinations include Park Mall, El Con Mall,<br />
Williams Center, and downtown Tucson. Broadway Boulevard also serves as a primary route for<br />
UA traffic. Opportunities for TOD include the Williams Center/Park Mall area and the section <strong>of</strong><br />
Broadway Boulevard from Country Club Road to Columbus Boulevard, which is consistent with<br />
the goals <strong>of</strong> the Alvernon/Broadway Area and El Encanto‐Colonia Solana Neighborhood Plans.<br />
Multimodal‐oriented redevelopment is also a primary component <strong>of</strong> the soon‐to‐start roadway<br />
widening project for Broadway Boulevard from Country Club Road to Euclid Avenue.<br />
3 – Campbell Avenue North<br />
Campbell Avenue from Speedway Boulevard to River Road is essentially fully developed with<br />
medium‐ and high‐density residential buffered by strip retail and <strong>of</strong>fice developments. Key<br />
employment/activity centers include UA/UA Health Sciences Center. Campbell Avenue is a<br />
primary route for commuters to UA. Potential TOD/redevelopment opportunities include the<br />
area between Prince Road and River Road and the area between Grant Road and Ft. Lowell Road.<br />
103
High Capacity Transit System Plan - <strong>Final</strong> <strong>Report</strong> June 2009<br />
Refined Corridor Assessment<br />
4 – Oracle Road<br />
Land use and development within the Oracle Road corridor is essentially divided into three<br />
distinct sections. From downtown to River Road, land use can be characterized as predominantly<br />
a mix <strong>of</strong> retail, <strong>of</strong>fice, and industrial land use, with medium‐ and high‐density residential further<br />
away from the roadway. North <strong>of</strong> River Road to Ina Road, low‐ to medium‐ density residential<br />
development is predominant, with retail and <strong>of</strong>fice development providing a buffer. North <strong>of</strong> Ina<br />
Road to Tangerine Road, development is primarily low‐ to medium‐density residential with some<br />
commercial development, although there are large parcels <strong>of</strong> undeveloped property. Oracle Road<br />
is a primary route for commuters heading to downtown Tucson and UA. Tucson Mall and<br />
downtown Tucson are major activity/employment centers. Potential TOD opportunities include<br />
undeveloped properties north <strong>of</strong> Ina Road and the area between Speedway Boulevard and<br />
Miracle Mile Road, as noted in the Oracle Area Revitalization Plan.<br />
11 – Grant Road<br />
The Grant Road corridor is fully developed and consists primarily <strong>of</strong> high‐density residential<br />
neighborhoods with strip retail and <strong>of</strong>fice developments. The Tucson Medical Center is a primary<br />
employment destination within the corridor. Opportunities for redevelopment or TOD include<br />
much <strong>of</strong> the corridor from Oracle Road to Swan Road in conjunction with the Grant Road<br />
improvement project. The Grant‐Alvernon Area Plan has high‐density residential and<br />
commercial redevelopment as a primary objective from Country Club Road to Swan Road.<br />
12 – Campbell Avenue South/Kino Parkway<br />
Land use along Campbell Avenue consists <strong>of</strong> medium‐ to high‐density residential and light<br />
industrial from Speedway Boulevard to 22nd Street and high‐density residential from 22nd Street<br />
to Valencia Road. Large undeveloped parcels, zoned for both commercial and residential, are<br />
located between 36th Street and Benson Highway and in the vicinity <strong>of</strong> Valencia Road. The Kino<br />
Area Plan supports large residential, commercial, and industrial development along Kino<br />
Parkway, including the Bridges Development between 36th Street and I‐10, which will include a<br />
UA Biotechnology Park, residential neighborhoods, and a large commercial center at I‐10.<br />
13 – 6th Avenue South/Nogales Highway<br />
Land use along 6th Avenue is primarily high‐density residential with some strip retail,<br />
transitioning to medium density with some light industrial development approaching Valencia<br />
Road and the TIA. Primary activity/employment centers along this route include downtown, the<br />
VA Hospital, the TIA, and Raytheon’s main plant. No specific plans have identified transitoriented<br />
redevelopment opportunities; however, the El Pueblo neighborhood area would be a<br />
good candidate.<br />
Summary<br />
The existing land use and development along each corridor, generally supports transit, however<br />
there are no areas that can be characterized as TOD. While creation <strong>of</strong> TOD is certainly possible<br />
104
High Capacity Transit System Plan - <strong>Final</strong> <strong>Report</strong> June 2009<br />
Refined Corridor Assessment<br />
within each <strong>of</strong> the seven corridors, the best candidates for this type <strong>of</strong> development include<br />
Broadway Boulevard, Oracle Road, and Grant Road. On these routes, TOD is supported by<br />
neighborhood or area plans, and programmed roadway improvement projects on Broadway<br />
Boulevard and Grant Road provide an opportunity to redevelop adjacent properties to more fully<br />
integrate transit and other modes <strong>of</strong> transportation.<br />
Access to Major Attractors and Generators<br />
Figure 50 and Figure 51 show the existing major attractors and generators located within walking<br />
distance <strong>of</strong> the HCT corridors. Table 24 provides additional detail.<br />
Table 24<br />
Existing Major Trip Generators with Walking Distance <strong>of</strong> HCT Corridors<br />
Route<br />
2A - Speedway Boulevard<br />
By BRT and SC<br />
University <strong>of</strong> Arizona<br />
Trip Generators Reached<br />
By LRT and CRT<br />
University <strong>of</strong> Arizona<br />
University Medical Center<br />
2B - Broadway Boulevard<br />
3 - Campbell Avenue North<br />
4 - Oracle Road<br />
El Con Mall<br />
Park Mall<br />
University <strong>of</strong> Arizona<br />
Williams Center<br />
Downtown Tucson - Government Center<br />
University <strong>of</strong> Arizona<br />
University Medical Center<br />
Arizona Cancer Center<br />
Tucson Mall<br />
<strong>Pima</strong> College Downtown<br />
Ventana Medical Systems<br />
Honeywell<br />
Downtown Tucson - Government Center<br />
El Con Mall<br />
Park Mall<br />
University <strong>of</strong> Arizona<br />
St. Joseph’s Hospital<br />
Williams Center<br />
Downtown Tucson - Government Center<br />
University <strong>of</strong> Arizona<br />
University Medical Center<br />
Arizona Cancer Center<br />
Tucson Mall<br />
<strong>Pima</strong> College Downtown<br />
Ventana Medical Systems<br />
Honeywell<br />
Downtown Tucson - Government Center<br />
7 - I-10/I-19 Downtown Tucson - Government Center<br />
11 - Grant Road Tucson Medical Center Tucson Medical Center<br />
12 - Campbell Ave<br />
Tucson International Airport<br />
Tucson International Airport<br />
South/Kino Parkway<br />
VA Medical Center<br />
VA Medical Center<br />
13 - 6th Avenue/Nogales Tucson International Airport<br />
Tucson International Airport<br />
Highway<br />
Downtown Tucson - Government Center Downtown Tucson - Government Center<br />
105
High Capacity Transit System Plan - <strong>Final</strong> <strong>Report</strong> June 2009<br />
Refined Corridor Assessment<br />
Figure 50<br />
Major Trip Generators within Walking Distance <strong>of</strong> BRT and Streetcar<br />
106
High Capacity Transit System Plan - <strong>Final</strong> <strong>Report</strong> June 2009<br />
Refined Corridor Assessment<br />
Figure 51<br />
Major Trip Generators within Walking Distance <strong>of</strong> LRT and CRT<br />
107
High Capacity Transit System Plan - <strong>Final</strong> <strong>Report</strong> June 2009<br />
Refined Corridor Assessment<br />
The Broadway Boulevard corridor reaches a substantial number <strong>of</strong> the major trip generators that<br />
are also some <strong>of</strong> the largest employers in Tucson. Downtown Tucson has the highest employment<br />
density in the region and UA is a primary activity center. The corridor also serves three major<br />
retail employers and destinations: El Con Mall, Park Mall, and Williams Center.<br />
The Oracle Road Corridor also serves a substantial number <strong>of</strong> major trip generators, including<br />
Downtown Tucson. <strong>Pima</strong> Community College and the Tucson Mall are also major trip generators<br />
reached by this corridor. Honeywell and Ventana Medical Systems are also served by this<br />
corridor, although they are not as large as other generators.<br />
The 6th Avenue South/Nogales Highway Corridor serves downtown Tucson and TIA and<br />
surrounding areas. Including the employment located around the TIA, the area has one <strong>of</strong> the<br />
highest employment densities in the region.<br />
The Grant Road corridor serves the Tucson Medical Center. It is the corridor reaching the fewest<br />
major trip generators.<br />
Impacts on Roadway Mobility and Congestion<br />
Table 25 summarizes the planning‐level assessment <strong>of</strong> future roadway operations. As discussed<br />
in Section 5.3.2, a general‐purpose lane cannot likely be converted to a dedicated transit lane if the<br />
corridor is projected to operate near capacity or under congested conditions, and transit<br />
preferential treatments are not likely to be effective if there is either too much congestion or too<br />
little congestion. Figure 20 depicts 2040 LOS by segment graphically.<br />
Possible Environmental Impacts<br />
There will likely be no significant environmental impacts due to implementing HCT in the<br />
proposed corridors because the proposed corridors are all existing, developed corridors. A more<br />
detailed environmental study will need to be conducted to further assess the costs <strong>of</strong> HCT on<br />
specific corridors. Such a study will be applicable where new lanes or running ways are<br />
constructed or where stations, park‐and‐ride lots, and/or vehicle maintenance facilities are<br />
constructed.<br />
108
High Capacity Transit System Plan - <strong>Final</strong> <strong>Report</strong> June 2009<br />
Refined Corridor Assessment<br />
Table 25<br />
Roadway Segment Operations Assessment<br />
Corridor Segment Future (2040)<br />
Can General- Will Transit<br />
Corridor<br />
Purpose Lane Preferential<br />
Roadway From To LOS<br />
Be Dedicated Treatments be<br />
to HCT?* Effective?<br />
Campbell Ave Swan Rd E Not Likely Maybe<br />
Swan Rd Rosemont Blvd F Not Likely Not Likely<br />
2A Speedway Blvd Rosemont Blvd Kolb Rd D-E Not Likely Maybe<br />
Kolb Rd Pantano Rd F Not Likely Not Likely<br />
Pantano Rd Houghton Rd D-E Maybe Maybe<br />
4th Ave Norris Ave E Not Likely Maybe<br />
Norris Ave Camino Espanol F Not Likely Not Likely<br />
2B Broadway Blvd<br />
Camino Espanol Swan Rd E Not Likely Maybe<br />
Swan Rd Pantano Rd E-F Not Likely Not Likely<br />
Pantano Rd Sarn<strong>of</strong>f Dr D Maybe Maybe<br />
Sarn<strong>of</strong>f Dr Houghton Rd C Likely Not Likely<br />
River Rd Roger Rd F Not Likely Not Likely<br />
Roger Rd Glenn St E Not Likely Maybe<br />
3 Campbell Ave Glenn St Grant Rd F Not Likely Not Likely<br />
Grant Rd Elm St C Likely Not Likely<br />
4<br />
Oracle Rd/<br />
Min St/<br />
Granada Ave<br />
11 Grant Rd<br />
12<br />
13<br />
Campbell Ave/<br />
Kino Pkwy/<br />
Campbell Ave<br />
6th Ave/<br />
Nogales Hwy/<br />
Valencia Rd/<br />
Tucson Blvd<br />
*Based on roadway LOS only<br />
Elm St Speedway Blvd D Maybe Maybe<br />
Tangerine Rd Auto Mall Dr E-F Not Likely Maybe<br />
AutoMall Dr Jacinto St F Not Likely Not Likely<br />
Jacinto St Mabel St E Not Likely Maybe<br />
Mabel St University Blvd F Not Likely Not Likely<br />
University Blvd Alameda St D Maybe Maybe<br />
Alameda St Congress St F Not Likely Not Likely<br />
Oracle Rd Wilson Ave C-D Maybe Maybe<br />
Wilson Ave Arcadia Ave D-E Not Likely Maybe<br />
Arcadia Ave Tanque Verde Rd F Not Likely Not Likely<br />
Speedway Blvd 5th St E Not Likely Maybe<br />
5th St 10th St D Maybe Maybe<br />
10th St Silverlake Rd F Not Likely Not Likely<br />
Silverlake Rd Benson Hwy D Maybe Maybe<br />
Benson Hwy Valencia Rd C Likely Not Likely<br />
Congress St 16th St C Likely Not Likely<br />
16th St Benson Hwy D Maybe Maybe<br />
Benson Hwy District St E Not Likely Maybe<br />
District St Valencia Rd D-E Maybe Maybe<br />
Valencia Rd TIA F Not Likely Not Likely<br />
Rail Owner/Operator Cooperation<br />
Studies conducted for ADOT to date suggest that Union Pacific is not in favor <strong>of</strong> introducing<br />
passenger rail in its corridor. This reluctance may make it challenging to implement CRT in the I‐<br />
10/I‐19 corridor (Corridor 7).<br />
109
High Capacity Transit System Plan - <strong>Final</strong> <strong>Report</strong> June 2009<br />
Refined Corridor Assessment<br />
Impacts on Title VI Communities and Transit-Dependent Populations<br />
Transit‐dependent populations are typically characterized by age (i.e., youth and the elderly), low<br />
household income, and low household car ownership. Such data are available from the PAG<br />
model for existing conditions at the Census tract level, and the corresponding densities for the<br />
first data items are shown in Figure 5 and Figure 3. The thresholds used to stratify density <strong>of</strong><br />
younger and older residents and density <strong>of</strong> households earning less than $40,000 annually are<br />
stated in Figure 5 and Figure 3.<br />
The project team assessed Title VI impacts by looking at minority and low‐income household<br />
population density. The former is also available at the Census tract level from the PAG model.<br />
Figure 52 shows the minority population densities as well as the thresholds used to stratify this<br />
group.<br />
As shown in Figure 52, the 6th Avenue South and South Campbell/Kino corridors serve an area<br />
with a high percentage <strong>of</strong> minority populations (60% to 80% minorities). Similarly, the western<br />
section <strong>of</strong> the Grant Road corridor and the southern section <strong>of</strong> the Oracle Road corridor serve<br />
high minority populations. All the other corridors, for the majority, serve areas that have 20% to<br />
40% minorities.<br />
Similar to the minority population distribution, and as seen in Figure 3, the 6th Avenue South and<br />
Campbell South/Kino Parkway corridors serve areas where 60% or more <strong>of</strong> households earn less<br />
than $40,000 a year. The southern half <strong>of</strong> the Oracle Road corridor, the Grant Road corridor, and<br />
the Speedway corridor also serve significant low‐income populations. The middle section <strong>of</strong> the<br />
Broadway Boulevard corridor and northern half <strong>of</strong> the Oracle Road corridor serve relatively<br />
higher‐income populations.<br />
The distribution <strong>of</strong> populations with age between 5 and 19 or 65 and over increases as the<br />
distance from the city core/downtown increases, with the exception <strong>of</strong> the UA area. The 6th<br />
Avenue South and Campbell Avenue South/Kino Parkway corridors serve a significant<br />
concentration <strong>of</strong> these age groups. The outer sections <strong>of</strong> the Oracle Road, Broadway Boulevard,<br />
and Speedway Boulevard corridors also serve significant youth and elderly populations.<br />
Campbell Avenue and Speedway Boulevard provide service to the UA area, which has a<br />
significant youth population.<br />
The assessment <strong>of</strong> the impacts <strong>of</strong> Title VI communities showed all <strong>of</strong> the potential HCT corridors<br />
serve significant populations <strong>of</strong> the relevant communities. The 6th Avenue South, Campbell<br />
Avenue South/Kino Parkway, and Oracle Road corridors serve the highest concentration <strong>of</strong> these<br />
communities.<br />
110
High Capacity Transit System Plan - <strong>Final</strong> <strong>Report</strong> June 2009<br />
Refined Corridor Assessment<br />
Figure 52<br />
Existing Minority Population<br />
111
High Capacity Transit System Plan - <strong>Final</strong> <strong>Report</strong> June 2009<br />
Refined Corridor Assessment<br />
Impact on Pedestrians and Bicyclists<br />
There are existing bicycle lanes and sidewalks on all routes, with the exception <strong>of</strong> a portion <strong>of</strong> 6th<br />
Avenue South (Corridor 13). There will be costs associated with preserving these bicycle and<br />
pedestrian facilities with HCT implementation, as well as potential operational impacts on bicycle<br />
lanes due to placement <strong>of</strong> streetcar and LRT tracks. These are issues to be resolved during design.<br />
Infrastructure Needs<br />
As noted previously, the costs <strong>of</strong> much <strong>of</strong> the infrastructure needed to support the HCT modes<br />
was included in the capital cost estimates. Additional infrastructure includes the cost <strong>of</strong><br />
implementing park‐and‐ride lots (which may be part <strong>of</strong> existing developments or brand‐new<br />
facilities) and potential new or reconstructed overpasses and underpasses. Potential new and<br />
reconstructed overpasses are associated with the Corridors 4 and 12, as Section 5.4.1 details.<br />
At this time, it appears that Alternative 7 (CRT in the I‐10 and I‐19 corridors) is likely to have<br />
significant infrastructure costs outside <strong>of</strong> running way, stations, and vehicles. This is because CRT<br />
trains are long (which affects rail car storage facilities and platform lengths), CRT park‐and‐ride<br />
lots are typically large, a more direct connection between the I‐10 and I‐19 corridors may be<br />
needed, and there may be a need for grade separations or new tracks to make CRT more<br />
accessible at some proposed station locations (e.g., a direct connection to the TIA).<br />
Park‐and‐ride lots are necessary to support the other alternatives. Some corridors serve existing<br />
park‐and‐ride lots and transit centers. New park‐and‐ride lots may be provided as part <strong>of</strong> existing<br />
or new developments (such as malls and churches) or may be constructed on newly acquired<br />
ROW.<br />
The project team notes that the existing park‐and‐ride lot near Speedway Boulevard/Tucson<br />
Boulevard is not likely to be used by HCT riders unless the Tucson Modern Streetcar is connected<br />
to this location. This park‐and‐ride lot is simply too close to the western terminus <strong>of</strong> Corridor 2A<br />
to be attractive to potential HCT riders. If alternatives for Corridor 2A are carried forward, this<br />
issue will be evaluated in more detail.<br />
Image<br />
For the purposes <strong>of</strong> this criterion, LRT and streetcar modes were considered to have the best<br />
image <strong>of</strong> the HCT modes under consideration. BRT operating in a dedicated lane was considered<br />
to have a better image than buses operating in mixed‐traffic; this is borne out in studies showing<br />
that BRT can have ridership and land development impacts comparable to those <strong>of</strong> LRT when the<br />
infrastructure and service characteristics are similar.<br />
5.4.4 Corridor Assessment Summary<br />
Table 26 summarizes the screening evaluation. As noted in the table, weights <strong>of</strong> 1 to 10 are<br />
assigned to the evaluation criteria for the purpose <strong>of</strong> giving more importance to the primary and<br />
112
High Capacity Transit System Plan - <strong>Final</strong> <strong>Report</strong> June 2009<br />
Refined Corridor Assessment<br />
most critical criteria. Ridership was given the highest weight <strong>of</strong> all because it is the only measure<br />
<strong>of</strong> project benefits among the primary criteria.<br />
A score <strong>of</strong> 1 to 3 has also been given to each alternative for each evaluation criterion. A score <strong>of</strong> 3<br />
means a given alternative scores high with respect to the criterion in comparison to other<br />
alternatives, so the alternative is more favorable for HCT. A score <strong>of</strong> 1 means a given alternative<br />
scores low with respect to the criterion in comparison to other alternatives, so the alternative is<br />
less favorable for HCT. These scores are intended to represent average conditions along the entire<br />
route. The total weighted score is calculated by multiplying the score by the weight for each<br />
criterion and summing the products. Rankings indicate the highest‐scoring alternatives.<br />
The scores were determined as follows:<br />
• Daily Ridership per Mile. A plot <strong>of</strong> daily ridership per mile data showed three very distinct<br />
groupings <strong>of</strong> alternatives. The highest grouping received a score <strong>of</strong> 3, the middle grouping<br />
received a score <strong>of</strong> 2, and the lowest grouping received a score <strong>of</strong> 1.<br />
• ROW Availability. Mixed traffic alternatives were scored a 3 since no additional right‐<strong>of</strong>way<br />
is needed. Dedicated lane alternatives were scored a 2 if minimal right‐<strong>of</strong>‐way is<br />
required (Broadway Boulevard only) and a 1 if significant additional right‐<strong>of</strong>‐way is<br />
needed.<br />
• Capital Cost per Mile. A plot <strong>of</strong> capital cost per mile data showed three very distinct<br />
groupings <strong>of</strong> alternatives. LRT and streetcar alternatives are associated with a very high<br />
capital cost per mile and thus received a score <strong>of</strong> 1. BRT alternatives in which dedicated<br />
lanes must be constructed received a score <strong>of</strong> 2. Alternatives with BRT operating in mixedtraffic<br />
or on existing dedicated lanes received a score <strong>of</strong> 3.<br />
• Operating Cost per Mile. A plot <strong>of</strong> operating cost per mile data showed three distinct<br />
groupings <strong>of</strong> alternatives. The highest grouping received a score <strong>of</strong> 1, the middle grouping<br />
received a score <strong>of</strong> 2, and the lowest grouping received a score <strong>of</strong> 3.<br />
• Consistency with Regional Plans & Programs. All <strong>of</strong> the alternatives are consistent with<br />
regional plans and programs, so all were given a score <strong>of</strong> 3.<br />
• Impacts on Other Transit Services. HCT alternatives that will operate in a dedicated lane<br />
were given a score <strong>of</strong> 2 because existing local bus services may be displaced or eliminated<br />
in order to maximize the travel speed <strong>of</strong> the HCT mode. Alternatives operating in mixed<br />
traffic were given a score <strong>of</strong> 3 because local buses can continue to use the same<br />
lanes/routes that they currently do.<br />
113
High Capacity Transit System Plan - <strong>Final</strong> <strong>Report</strong> June 2009<br />
Refined Corridor Assessment<br />
Evaluation Criterion<br />
Weight<br />
Alt<br />
2A<br />
BRT<br />
D<br />
Alt<br />
2A<br />
BRT<br />
M<br />
Alt<br />
2A<br />
LRT<br />
Table 26<br />
Alt<br />
2B<br />
BRT<br />
D<br />
Alt<br />
2B<br />
LRT<br />
Corridor Assessment Summary<br />
Score by Alternative*<br />
Alt Alt<br />
Alt 4 Alt 4<br />
Alt 3<br />
Alt 4 Alt 7 11 11<br />
BRT BRT<br />
SC<br />
LRT CRT BRT BRT<br />
D M<br />
D M<br />
Daily Ridership/Mile 10 3 3 3 3 3 2 2 2 2 1 2 2 2 2 2 2 3 3 3<br />
ROW Availability 5 1 3 1 2 2 3 1 3 1 3 1 3 1 1 3 1 3 1 3<br />
Capital Cost/Mile 5 2 3 1 3 1 1 2 3 1 2 2 3 1 2 3 1 1 2 3<br />
Operating Cost/Mile 5 3 2 3 3 3 1 3 2 3 3 3 2 3 3 2 3 2 3 2<br />
Consistency with<br />
Regional Plans &<br />
1 3 3 3 3 3 3 3 3 3 3 3 3 3 3 3 3 3 3 3<br />
Programs<br />
Impacts on Other Transit<br />
Services<br />
1 2 3 2 2 2 3 2 3 2 3 2 3 2 2 3 2 3 2 3<br />
Land Use<br />
Compatibility/TOD<br />
1 3 1 3 3 3 3 3 2 3 3 3 2 3 3 1 3 3 3 1<br />
Potential<br />
Access to Major<br />
Attractors/Generators<br />
1 2 2 2 3 3 2 3 3 3 1 1 1 1 1 1 1 2 2 2<br />
Roadway Mobility/<br />
Congestion Impact<br />
1 2 2 2 3 3 2 2 2 2 3 2 2 2 3 3 3 3 3 3<br />
Environmental Impact 1 2 3 2 3 3 3 2 3 2 3 2 3 2 2 3 2 3 2 3<br />
Rail Owner/Operator<br />
Cooperation<br />
1 3 3 3 3 3 3 3 3 3 1 3 3 3 3 3 3 3 3 3<br />
Impact on Title VI &<br />
Transit-Dependent<br />
1 2 2 2 2 2 2 3 3 3 2 2 2 2 3 3 3 3 3 3<br />
Populations<br />
Pedestrian & Bicyclist<br />
Impact<br />
1 2 3 2 3 3 3 2 3 2 3 2 3 2 2 3 2 3 2 3<br />
Infrastructure Needs 1 3 3 2 3 2 2 3 3 2 1 3 3 2 3 3 2 2 3 3<br />
Image 1 2 1 3 2 3 3 2 1 3 3 2 1 3 2 1 3 3 2 1<br />
Total Score 86 96 81 100 90 74 78 89 73 76 75 86 70 77 87 72 91 88 98<br />
Rank 9 3 11 1 5 16 12 6 17 14 15 9 19 13 8 18 4 7 2<br />
* 3 = High Rating, 2 = Medium Rating, and 1 = Low Rating in comparison to other alternatives. BRT = bus rapid transit, LRT = light rail transit, SC =<br />
streetcar, CRT = commuter rail transit, D = dedicated lane operation, and M = mixed-traffic operation.<br />
Alt<br />
11<br />
LRT<br />
Alt<br />
12<br />
BRT<br />
D<br />
Alt<br />
12<br />
BRT<br />
M<br />
Alt<br />
12<br />
LRT<br />
Alt<br />
13<br />
SC<br />
Alt<br />
13<br />
BRT<br />
D<br />
Alt<br />
13<br />
BRT<br />
M<br />
114
High Capacity Transit System Plan - <strong>Final</strong> <strong>Report</strong> June 2009<br />
Refined Corridor Assessment<br />
• Land Use Compatibility/TOD Potential. Corridors 2B, 4, and 11 were determined to have the<br />
most TOD potential. Rail modes and BRT operating in a dedicated lane in these corridors<br />
were given a score <strong>of</strong> 3. Alternatives with BRT operating in mixed traffic in these corridors<br />
were given a score <strong>of</strong> 2. In other corridors, rail modes and BRT operating in a dedicated<br />
lane were given a score <strong>of</strong> 3 while BRT in mixed‐traffic was given a score <strong>of</strong> 1. CRT was<br />
given a score <strong>of</strong> 3.<br />
• Access to Major Attractors/Generators. The alternatives that served the most major attractors<br />
and generators and/or larger major attractors and generators received a score <strong>of</strong> 3.<br />
Alternatives serving only one or two major attractors and generators received a score <strong>of</strong> 1.<br />
• Roadway Mobility/Congestion Impact. Scores were assigned based on 2040 LOS in each<br />
corridor. If most segments operate at LOS C or better, a score <strong>of</strong> 3 was given to indicate<br />
that HCT would not significantly impact roadway mobility and congestion. A score <strong>of</strong> 2<br />
was given if most segments operate at LOS D. A score <strong>of</strong> 1 was given if most segments<br />
operate at LOS E or F.<br />
• Environmental Impact. Any alternative that adds dedicated transit lanes to a corridor was<br />
assigned a score <strong>of</strong> 2 because <strong>of</strong> the new construction needed. Alternatives that operate on<br />
existing pavement or existing tracks were assigned a score <strong>of</strong> 3. (The project team notes<br />
that new transit centers, new park‐and‐ride lots, and/or specific station sites may have<br />
environmental impacts that cannot be determined at this level <strong>of</strong> analysis.)<br />
• Rail Owner/Operator Cooperation. This is not an issue for any alternative but Alternative 7,<br />
but the issue is very critical for Alternative 7. Therefore, all alternatives but Alternative 7<br />
received a score <strong>of</strong> 3 and Alternative 7 received a score <strong>of</strong> 1.<br />
• Impact on Title VI & Transit‐Dependent Populations. All <strong>of</strong> the potential HCT corridors serve<br />
significant populations <strong>of</strong> these communities, so no corridor was given a score <strong>of</strong> less than<br />
2. The 6th Avenue South, Campbell Avenue South/Kino Parkway, and Oracle Road<br />
corridors serve the highest concentrations <strong>of</strong> these communities, so these corridors were<br />
given a score <strong>of</strong> 3.<br />
• Pedestrian & Bicyclist Impact. Any alternative that adds dedicated transit lanes to a corridor<br />
was assigned a score <strong>of</strong> 2 because pedestrian crossing distances will be increased as a<br />
result. Other alternatives are not anticipated to negatively impact pedestrians or bicyclists<br />
and were thus given a score <strong>of</strong> 3. (The project team notes that tracks can present a hazard<br />
to bicyclists, and this must be addressed in the design <strong>of</strong> the service.)<br />
• Infrastructure Needs. Streetcar and LRT alternatives were assigned a score <strong>of</strong> 1 because <strong>of</strong><br />
the need for a rail garage, rail maintenance facilities, and electric power delivery<br />
infrastructure. Bus alternatives received a score <strong>of</strong> 3 because this analysis assumes<br />
standard‐length BRT vehicles; 60‐foot BRT vehicles may require special storage and<br />
maintenance facilities. CRT was assigned a score <strong>of</strong> 1 because CRT may require special<br />
storage and maintenance facilities, larger park‐and‐ride lots, and a more direct connection<br />
between the I‐10 and I‐19 corridors.<br />
• Image. LRT, streetcar, and CRT were given a score <strong>of</strong> 3 to reflect the perception that rail is<br />
better than bus. BRT alternatives running in dedicated ROW were given a score <strong>of</strong> 2<br />
because such a service can be operate similar to LRT and can have similar ridership and<br />
115
High Capacity Transit System Plan - <strong>Final</strong> <strong>Report</strong> June 2009<br />
Refined Corridor Assessment<br />
land development impacts. BRT alternatives operating in mixed‐traffic were given a score<br />
<strong>of</strong> 1.<br />
Table 26 shows that the top‐ranked alternative is Alternative 2B with BRT operating in a<br />
dedicated lane on Broadway Boulevard. It is reasonable that this alternative would score high<br />
because a dedicated lane already exists on Broadway Boulevard.<br />
The other alternatives in the top four (i.e., those scoring higher than 90) are as follows:<br />
• Alternative 13 with BRT operating in mixed traffic on 6th Avenue South and Nogales<br />
Highway<br />
• Alternative 2A with BRT operating in mixed traffic on Speedway Boulevard<br />
• Alternative 13 with streetcar operating on 6th Avenue South and Nogales Highway<br />
The top four alternatives are the most favorable HCT alternatives because they have high scores<br />
for nearly every evaluation criterion. Alternative 2A with BRT operating in mixed traffic and<br />
Alternative 13 with BRT operating in mixed traffic have a score <strong>of</strong> 1 only for land use<br />
compatibility/TOD potential and image. Alternative 2B with BRT operating in a dedicated lane<br />
has no scores <strong>of</strong> 1. Alternative 13 with streetcar has a score <strong>of</strong> 1 only for capital cost per mile. All<br />
four alternatives have scores <strong>of</strong> 3 for ridership potential.<br />
The three lowest‐scoring alternatives are:<br />
• Alternative 11 with LRT operating on Grant Road<br />
• Alternative 12 with LRT operating on Campbell Avenue South/Kino Parkway<br />
• Alternative 4 with LRT operating on Oracle Road<br />
The three lowest‐scoring alternatives are the least favorable HCT alternatives primarily because<br />
<strong>of</strong> a combination <strong>of</strong> high capital costs and medium ridership.<br />
The project team notes that many <strong>of</strong> the alternatives in Table 26 have scores that differ by less<br />
than three points. This means that a small change in score for a given alternative or a change in<br />
weights could impact the rankings. Because <strong>of</strong> this sensitivity, the project team added another<br />
analysis to the screening evaluation: a comparison <strong>of</strong> capital costs per annual rider. The project<br />
team divided estimated total capital cost for each alternative by the projected annual ridership<br />
and ranked the alternatives. The results <strong>of</strong> this comparison are summarized in Table 27. Table 27<br />
shows that the alternatives <strong>of</strong>fering the most ridership benefit for the investment in capital are the<br />
BRT alternatives. The top four alternatives according to this measure (i.e., those with the lowest<br />
capital cost per annual rider) are as follows:<br />
• Alternative 2B with BRT operating in a dedicated lane on Broadway Boulevard<br />
• Alternative 2A with BRT operating in mixed traffic on Speedway Boulevard<br />
• Alternative 13 with BRT operating in mixed traffic on 6th Avenue and Nogales Highway<br />
• Alternative 4 with BRT operating in mixed traffic on Oracle Road<br />
116
High Capacity Transit System Plan - <strong>Final</strong> <strong>Report</strong> June 2009<br />
Refined Corridor Assessment<br />
Of these top four alternatives, three are also part <strong>of</strong> the top four based on Table 26, which is<br />
further evidence that these three should be considered for further study. The fourth alternative,<br />
Alternative 13 with streetcar operating on 6th Avenue and Nogales Highway, has been replaced<br />
by Alternative 4 with BRT operating in mixed traffic on Oracle Road. This replacement occurs<br />
because the capital costs for streetcar are significantly higher than the capital costs for the BRT<br />
alternatives, even though Alternative 13 with streetcar has the lowest capital cost per rider <strong>of</strong> the<br />
rail alternatives.<br />
Table 27<br />
Ridership Benefit vs. Investment in Capital<br />
Corridor<br />
2A - Speedway<br />
Boulevard<br />
HCT Scenario<br />
Total Capital Cost<br />
(2008 dollars)<br />
Forecast Annual<br />
Ridership<br />
Capital Cost per<br />
Annual Rider<br />
BRT - Mixed Traffic $14,200,000 1,016,490 $14 2<br />
BRT - Exclusive Lane $54,500,000 1,120,650 $49 8<br />
LRT - Exclusive Lane $589,600,000 1,195,050 $493 14<br />
2B - Broadway BRT - Exclusive Lane $12,765,000 1,204,970 $11 1<br />
Boulevard LRT - Exclusive Lane $607,085,000 1,285,880 $472 13<br />
3 - Campbell Avenue<br />
North<br />
4 - Oracle Road<br />
SC - Mixed Traffic $218,540,000 223,510 $978 18<br />
BRT - Mixed Traffic $23,040,000 973,400 $24 4<br />
BRT - Exclusive Lane $87,680,000 1,098,640 $80 9<br />
LRT - Exclusive Lane $972,160,000 1,172,420 $829 15<br />
7 - I-10/I-19 CRT $607,300,000 637,500 $953 16<br />
11 - Grant Road<br />
12 - Campbell Avenue<br />
South/Kino Parkway<br />
13 - 6th Avenue/<br />
Nogales Highway<br />
NOTE: Park-and-ride lot costs not included.<br />
BRT - Mixed Traffic $11,985,000 403,000 $30 6<br />
BRT - Exclusive Lane $40,350,000 435,240 $93 10<br />
LRT - Exclusive Lane $445,950,000 465,000 $959 17<br />
BRT - Mixed Traffic $9,540,000 403,000 $24 5<br />
BRT - Exclusive Lane $46,240,000 435,240 $106 11<br />
LRT - Exclusive Lane $497,080,000 465,000 $1,069 19<br />
BRT - Mixed Traffic $14,200,000 975,260 $15 3<br />
BRT - Exclusive Lane $45,810,000 1,053,380 $43 7<br />
SC - Mixed Traffic $518,490,000 1,124,060 $461 12<br />
Rank<br />
5.5 CONCLUSIONS AND RECOMMENDATIONS FOR<br />
TASK 5<br />
5.5.1 Conclusions for Task 5<br />
Of the eight HCT corridors and 19 modal alternatives evaluated in Section 5.0 technical<br />
memorandum, none were identified as fatally flawed through the screening evaluation. Several,<br />
however, are more promising than others in terms <strong>of</strong> potential ridership and the other evaluation<br />
criteria. The project team observed the following:<br />
117
High Capacity Transit System Plan - <strong>Final</strong> <strong>Report</strong> June 2009<br />
Refined Corridor Assessment<br />
• Table 26 shows that BRT alternatives rank higher than the LRT alternative in any given<br />
corridor.<br />
• Table 26 shows that BRT operating in mixed traffic ranks higher than BRT operating in a<br />
dedicated lane in any corridor but Corridor 2B (Broadway Boulevard). The key difference<br />
between Corridor 2B and the other corridors where BRT is an alternative is the existing<br />
dedicated transit lanes on Broadway Boulevard. The other corridors do not have existing<br />
ROW for dedicated lanes, and this explains the difference in rankings in every case.<br />
• The rankings in Table 27 emphasize the higher capital costs <strong>of</strong> the HCT rail alternatives.<br />
As implementation <strong>of</strong> HCT moves forward, it is critical to take advantage <strong>of</strong> the strengths<br />
<strong>of</strong> rail technology so that the higher capital costs can be <strong>of</strong>fset.<br />
• Corridor 11 is the least favorable corridor for development <strong>of</strong> any HCT mode. The<br />
corridor is not fatally flawed, but the analysis suggests that development <strong>of</strong> HCT in this<br />
corridor should not be prioritized.<br />
• Corridors 2A, 2B, and 13 have strong scores (greater than 80) regardless <strong>of</strong> which HCT<br />
technology will eventually operate in them. This means that these corridors have multiple<br />
characteristics that are likely to contribute to the success <strong>of</strong> HCT.<br />
• There is a great deal <strong>of</strong> uncertainty about development <strong>of</strong> CRT in the I‐10 and I‐19<br />
corridors (Corridor 7) due to ongoing efforts to implement high‐speed passenger rail in<br />
the I‐10 corridor and the willingness <strong>of</strong> Union Pacific to support high‐speed passenger rail<br />
or CRT on its tracks. The Rail Owner/Operator Cooperation evaluation criterion perhaps<br />
underestimates the challenge that this uncertainty presents.<br />
5.5.2 Recommendations for Task 5<br />
At the conclusion <strong>of</strong> Task 5, the project team recommended carrying forward the following<br />
alternatives to Task 6:<br />
• Alternative 2B ‐ Broadway Boulevard ‐ BRT in dedicated lanes<br />
• Alternative 13 ‐ 6th Avenue South/Nogales Parkway ‐ streetcar<br />
Alternative 2B takes advantage <strong>of</strong> existing dedicated transit lanes on Broadway Boulevard to<br />
provide a high quality <strong>of</strong> transit service for a relatively low cost. The development pattern in the<br />
corridor is conducive to TOD, with medium‐ to high‐density development, a mix <strong>of</strong> uses, several<br />
major trip generators/attractors, and an existing park‐and‐ride lot. The corridor also serves<br />
reasonable densities <strong>of</strong> transit‐dependent populations and Title VI communities.<br />
The analysis summarized in Sections 5.4.3 shows that Corridor 13 is clearly a strong corridor for<br />
any HCT mode. Corridor 13 serves major trip generators (e.g., TIA), on‐street parking in the<br />
Stone Avenue and 6th Avenue couplet presents opportunities for station development and transit<br />
preferential treatments, the corridor serves relatively dense concentrations <strong>of</strong> lower‐income<br />
households and minority populations, and the corridor serves an existing transit center and parkand‐ride<br />
lot south <strong>of</strong> Irvington Road. The project team’s Task 5 recommendation for streetcar in<br />
Corridor 13 considers that some <strong>of</strong> the investments associated with the Tucson Modern Streetcar<br />
118
High Capacity Transit System Plan - <strong>Final</strong> <strong>Report</strong> June 2009<br />
Refined Corridor Assessment<br />
(e.g., streetcar maintenance facility) can <strong>of</strong>fset the costs <strong>of</strong> developing a streetcar service in<br />
Corridor 13. Additionally, Corridor 13 intersects the Tucson Modern Streetcar route, and the<br />
refined routing <strong>of</strong> Corridor 13 carried out in Task 6 addresses in more detail how the two<br />
streetcar lines could function in tandem.<br />
The other corridors do not appear to be fatally flawed, although several <strong>of</strong> them will be very<br />
expensive to construct given the necessary investment in infrastructure and/or the amount <strong>of</strong><br />
ROW that must be acquired. The project team addressed the other corridors as part <strong>of</strong> the<br />
implementation plan in Section 8.0. Section 8.0 also addresses HCT project phasing, which may<br />
include implementing express bus or other “interim” modes and/or implementing corridors in<br />
sections.<br />
119
Highway Capacity Transit System Plan - <strong>Final</strong> <strong>Report</strong> June 2009<br />
Development <strong>of</strong> Updated HCT System Plan<br />
6.0 DEVELOPMENT OF UPDATED HCT<br />
SYSTEM PLAN<br />
6.1 INTRODUCTION<br />
Section 6.0 <strong>of</strong> the HCT System Plan <strong>Final</strong> <strong>Report</strong> summarizes the following activities conducted<br />
under Task 6:<br />
• Defining a baseline system alternative<br />
• Defining a system alternative that includes and refines the two corridors that were<br />
recommended in Section 5.0 for more detailed study<br />
• Defining a second system alternative to explore hybrid corridors or other options<br />
• Assessing potential changes in regional transit ridership, redevelopment opportunities,<br />
accessibility to transit‐dependent populations and Title VI communities, the extent to<br />
which existing and future population and employment is served, roadway level <strong>of</strong> service,<br />
roadway vehicle‐miles traveled (VMT), roadway travel time, and redevelopment potential<br />
6.2 CORRIDORS ANALYZED IN TASK 6<br />
The alternatives that were recommended in Task 5 (Section 5.0) for more detailed analysis in Task<br />
6 are the following:<br />
• Alternative 2B, which features BRT operating in a dedicated lane on Broadway Boulevard<br />
between the Ronstadt Transit Center (shown in Figure 53) in downtown Tucson and a<br />
proposed new park‐and‐ride lot on Houghton Road<br />
• Alternative 13, which features streetcar service operating on 6th Avenue in mixed traffic<br />
between the Ronstadt Transit Center in downtown Tucson and TIA<br />
Figure 54 though Figure 57 illustrate the cross section and typical land uses <strong>of</strong> Alternative 2B.<br />
Figure 58 though Figure 60 illustrate the cross section and typical land uses <strong>of</strong> Alternative 13.<br />
Refinements to the alternatives that were recommended in Section 5.0 include determining more<br />
detailed alignments (e.g., including route deviations to serve specific major trip generators),<br />
identifying transit center and park‐and‐ride alternatives, locating HCT stations at the intersection<br />
level, and identifying changes to the local bus network and coordination with the planned<br />
Modern Streetcar (with input from Sun Tran).<br />
120
Highway Capacity Transit System Plan - <strong>Final</strong> <strong>Report</strong> June 2009<br />
Development <strong>of</strong> Updated HCT System Plan<br />
Figure 53<br />
Ronstadt Transit Center in Downtown Tucson<br />
Figure 54<br />
Eastbound Broadway Boulevard at Tucson Boulevard<br />
121
Highway Capacity Transit System Plan - <strong>Final</strong> <strong>Report</strong> June 2009<br />
Development <strong>of</strong> Updated HCT System Plan<br />
Figure 55<br />
Eastbound Broadway Boulevard at Dodge Boulevard (El Con Mall)<br />
Figure 56<br />
Eastbound Broadway Boulevard at Columbus Boulevard<br />
Figure 57<br />
Eastbound Broadway Boulevard West <strong>of</strong> Columbus Boulevard (with Bus Lane)<br />
122
Highway Capacity Transit System Plan - <strong>Final</strong> <strong>Report</strong> June 2009<br />
Development <strong>of</strong> Updated HCT System Plan<br />
Figure 58<br />
Northbound 6th Avenue at Pennsylvania Drive<br />
Figure 59<br />
Northbound 6th Avenue at 29th Street<br />
Figure 60<br />
Northbound 6th Avenue at Stone Avenue and 18th Street<br />
123
Highway Capacity Transit System Plan - <strong>Final</strong> <strong>Report</strong> June 2009<br />
Development <strong>of</strong> Updated HCT System Plan<br />
6.3 DESCRIPTION OF SYSTEM ALTERNATIVES<br />
Section 6.3 defines a baseline alternative and analyzes two system alternatives. The two system<br />
alternatives are based on the HCT alternatives that were recommended in Task 5 (Section 5.0) for<br />
more detailed analysis.<br />
The project team notes that the alignments, station locations, ridership forecasts, vehicles, and<br />
other characteristics <strong>of</strong> the system alternatives described in this section are anticipated to be<br />
finalized during the preparation <strong>of</strong> an FTA Alternatives Analysis and/or during project<br />
development (preliminary engineering and final design). The Alternatives Analysis and project<br />
development processes will address specific issues such as whether or not streetcar tracks will be<br />
placed in curbside lanes, medians, or other locations; how HCT vehicles will turn around at<br />
endpoints; and how new BRT and streetcar services will interface with the Tucson Modern<br />
Streetcar. More information about the FTA Alternatives Analysis and project development can be<br />
found in Section 7.0.<br />
6.3.1 Baseline System Alternative<br />
The baseline system alternative includes transit improvements and transit‐related roadway<br />
improvements that are already planned or programmed in the region. A baseline alternative<br />
evaluation will be required should the project apply for FTA funding. At the time that the system<br />
alternatives analysis was conducted in January <strong>of</strong> 2009, planned and programmed improvements<br />
for the baseline alternative were identified. Since that time, all <strong>of</strong> these improvements have been<br />
implemented with the exception <strong>of</strong> the High Capacity Modern Streetcar System.<br />
The planned and programmed improvements in the baseline alternative as <strong>of</strong> January 2009 are the<br />
following:<br />
• Broadway Boulevard. Euclid Avenue to Country Club Road will be widened from five lanes<br />
to six lanes plus two dedicated transit lanes with a raised median. The roadway widening<br />
is expected to be completed by 2015.<br />
• Broadway Boulevard. Camino Seco to Houghton Road will be widened from three and five<br />
lanes to a four‐lane divided roadway. The widening is expected to be complete by 2020.<br />
• Weekday evening bus service expansion. Sun Tran service will be extended to 11 p.m. on<br />
Routes 1‐3, 6, 7, 9, 11, 15, 17, 19, 21‐23, 26, 27, 29, and 34 to midnight on Routes 4, 8, and<br />
16.<br />
• Weekend bus service expansion. Buses will operate from approximately 6 a.m. to 9 p.m. on<br />
Saturday and from 7 a.m. to 8 p.m. on Sunday on Routes 1‐4, 6‐11, 15‐17, 19‐23, 26, 27, 29,<br />
34, and 37.<br />
• Bus service frequency and service area expansion. Frequencies will be improved from 15<br />
minutes to 10 minutes on Routes 4, 6 (Park Avenue/1st Avenue leg), 11, 15, and 16 (Oracle<br />
Road/12th Avenue leg). Frequencies will be improved from 30 minutes to 15 minutes on<br />
Routes 6 (Park Avenue/Bilby Road leg), 7, 9, 10, and 16 (Ina Road leg). Routes 4, 8, 9, 11,<br />
124
Highway Capacity Transit System Plan - <strong>Final</strong> <strong>Report</strong> June 2009<br />
Development <strong>of</strong> Updated HCT System Plan<br />
16, and 27 will be extended. A new route will be introduced on Houghton Road. A new<br />
northwest‐area bus maintenance facility will be constructed to accommodate the<br />
expanded fleet.<br />
• Enhancement <strong>of</strong> existing express bus service. Existing Sun Tran express bus routes (Routes 81<br />
(Tanque Verde), 83 (Golf Links), 103 (Old Father), 105 (Sunrise), 106 (Swan), and 180 (Aero<br />
Park) will be upgraded to a minimum <strong>of</strong> six trips.<br />
• New express bus service. From 2009‐2010, six new express routes will be added during<br />
weekday peak hours. Stylized buses (which look more futuristic than the current Sun Tran<br />
bus shown in Figure 61 and may incorporate additional advanced technology features)<br />
will be used for all routes. New express routes will include:<br />
• On Oracle Road, from Tangerine Road in Oro Valley to Downtown Tucson/UA.<br />
Express service in this corridor may build a market for future HCT service.<br />
• From Tangerine Road in Oro Valley to the Raytheon plant at Nogales Highway and<br />
Valencia Road.<br />
• On I‐10, from Cortaro Road in Marana to Downtown Tucson.<br />
• On I‐19/Nogales Highway/6th Avenue, from Green Valley/Sahuarita to Raytheon<br />
and Downtown Tucson.<br />
• On I‐10, from Rita Ranch (UA Science and Technology Park) to Downtown Tucson.<br />
• On 6th Avenue, from Laos Transit Center to Downtown Tucson/Ronstadt Transit<br />
Center. Express service in this corridor may build a market for future HCT service.<br />
• New park‐and‐rides. Local and express bus service will be supported by new park‐and‐ride<br />
centers located in Oro Valley (Tangerine Road near Oracle Road), in Marana (Cortaro<br />
Road near I‐10), in Green Valley (Continental Road near I‐10), in the Valencia<br />
Road/Casino del Sol area, in the Rita Ranch area, in the Houghton Road/Broadway<br />
Boulevard area, and at Sahuarita Town Hall.<br />
• New community circulator service. New transit circulator services will be provided in Oro<br />
Valley, Marana, Green Valley, and Ajo.<br />
• Expansion <strong>of</strong> special needs transit service. Tucson’s Sun Van and <strong>Pima</strong> County’s <strong>Pima</strong> Transit<br />
paratransit services will be expanded.<br />
• High‐Capacity Modern Streetcar System. A new fixed‐guideway transit system will link<br />
densely populated activity centers along a 4‐mile corridor in central Tucson between UA<br />
and downtown Tucson. The system is intended to serve an existing weekday population<br />
<strong>of</strong> 100,000 within the corridor as well as encourage future transit‐supportive development<br />
and economic investment for future urban residents and workers. Over 1.4 million trips<br />
are estimated annually. The modern streetcar will make use <strong>of</strong> a new 4th Avenue<br />
underpass at the Union Pacific Railroad (UPRR). The streetcar will generally operate onstreet<br />
and will be double‐tracked. This project is currently under design.<br />
125
Highway Capacity Transit System Plan - <strong>Final</strong> <strong>Report</strong> June 2009<br />
Development <strong>of</strong> Updated HCT System Plan<br />
Figure 61<br />
Conventional Sun Tran Bus<br />
6.3.2 System Alternative A<br />
System Alternative A is shown in Figure 62 and Figure 63. System Alternative A is a phased<br />
implementation <strong>of</strong> HCT that includes the following features:<br />
• BRT service on Broadway Boulevard from downtown Tucson to Houghton Road, with<br />
service to UA (Phase 1)<br />
• BRT or express bus service on 6th Avenue and Nogales Highway from downtown Tucson<br />
to TIA (Phase 1)<br />
• Streetcar on Broadway Boulevard from downtown Tucson to El Con Mall (Phase 2)<br />
• Streetcar on 6th Avenue South from downtown Tucson to Laos Transit Center (Phase 2)<br />
The motivation for System Alternative A is identifying a combination <strong>of</strong> HCT alternatives that<br />
takes advantage <strong>of</strong> the economic development potential and accessibility <strong>of</strong> streetcar—as well as<br />
committed investments in the Tucson Modern Streetcar—and the mobility and relatively low<br />
implementation cost <strong>of</strong>fered by BRT.<br />
126
Highway Capacity Transit System Plan - <strong>Final</strong> <strong>Report</strong> June 2009<br />
Development <strong>of</strong> Updated HCT System Plan<br />
Figure 62<br />
System Alternative A - Broadway Boulevard Corridor<br />
127
Highway Capacity Transit System Plan - <strong>Final</strong> <strong>Report</strong> June 2009<br />
Development <strong>of</strong> Updated HCT System Plan<br />
Figure 63<br />
System Alternative A - 6th Avenue/Nogales Highway Corridor<br />
128
Highway Capacity Transit System Plan - <strong>Final</strong> <strong>Report</strong> June 2009<br />
Development <strong>of</strong> Updated HCT System Plan<br />
Refined Alignments<br />
Broadway Boulevard Corridor<br />
There are two significant changes to the Broadway Boulevard alternative that the project team<br />
recommended for further study at the end <strong>of</strong> Task 5 (Section 5.0). The first significant change is<br />
the extension <strong>of</strong> the modern streetcar between downtown Tucson and El Con Mall in a second<br />
phase; BRT running from downtown Tucson to Houghton Road (the alternative recommended in<br />
Task 5) would be the first HCT phase. This two‐phased HCT project for Broadway Boulevard has<br />
several advantages:<br />
• BRT can be implemented relatively quickly in curbside lanes for the length <strong>of</strong> Broadway<br />
Boulevard and can be operated independently <strong>of</strong> streetcar. Design and implementation <strong>of</strong><br />
the BRT service is not likely to limit development <strong>of</strong> streetcar.<br />
• BRT can provide travel times that are competitive with automobile travel, thus addressing<br />
mobility needs in the corridor and operating as a “line‐haul” service. BRT travel time<br />
benefits result from dedicated transit lanes, wide station spacing, and transit preferential<br />
treatments (e.g., TSP).<br />
• Streetcar can tie in with and extend the Tucson Modern Streetcar project.<br />
• Streetcar can provide circulation in the densest part <strong>of</strong> the corridor (i.e., downtown<br />
Tucson to El Con Mall) and support promising TOD opportunities at sites such as El Con<br />
Mall. Streetcar is well‐suited to address accessibility needs because streetcar services<br />
typically have short station spacing.<br />
• The combination <strong>of</strong> BRT and streetcar provides mobility where it is most needed (the<br />
length <strong>of</strong> the corridor) and accessibility/circulation where it is most needed (central<br />
Tucson).<br />
• Both BRT and streetcar can positively impact redevelopment along the Broadway<br />
corridor.<br />
A potential limitation associated with this two‐phased implementation is the interaction between<br />
BRT vehicles and streetcar vehicles, as the latter are likely to serve more stops and travel slower<br />
than the former. This is not unlike the issue <strong>of</strong> BRT and local bus service operating in the same<br />
corridor, which is an issue that was discussed in Section 5.0. Where local buses or streetcar would<br />
impede BRT, more detailed operational analysis may identify solutions such as providing pullouts,<br />
providing bypass lanes, or re‐routing the slower service. Such detailed operational analysis<br />
may consider factors such as segment level <strong>of</strong> service, intersection turning volumes, driveway<br />
locations, and availability <strong>of</strong> right‐<strong>of</strong>‐way (including medians) at specific sites.<br />
The second change to the Broadway Boulevard system alternative is diversion <strong>of</strong> HCT service<br />
from Broadway Boulevard to serve UA. UA is a major regional trip generator and attractor, with<br />
relatively high population and employment densities; it is also a special events destination. The<br />
cost <strong>of</strong> serving UA with HCT is increased travel times for riders who originate in or are destined<br />
for downtown Tucson, but these increased travel times may be minimized by implementation <strong>of</strong><br />
transit preferential treatments (e.g., queue jump lanes) along the diverted portion <strong>of</strong> the<br />
129
Highway Capacity Transit System Plan - <strong>Final</strong> <strong>Report</strong> June 2009<br />
Development <strong>of</strong> Updated HCT System Plan<br />
alignment. Another option for minimizing this increase in travel time is keeping BRT on<br />
Broadway Boulevard and diverting only streetcar <strong>of</strong>f Broadway Boulevard to UA.<br />
6th Avenue/Nogales Highway Corridor<br />
The project team also proposes a two‐phased BRT and streetcar HCT service (operating in mixed<br />
traffic with transit preferential treatments) for the 6th Avenue/Nogales Highway corridor. No<br />
alignment changes are proposed.<br />
BRT would serve mobility needs between downtown Tucson and TIA, while streetcar would<br />
serve accessibility needs between downtown Tucson and Laos Transit Center (the densest section<br />
<strong>of</strong> the corridor). The two‐phased HCT project for 6th Avenue/Nogales Highway <strong>of</strong>fers the same<br />
advantages as the two‐phased HCT project for Broadway Boulevard. In addition, the BRT<br />
connection to TIA is likely to have less impact on airport ground operations than a streetcar<br />
connection would.<br />
Refined Station Locations<br />
Figure 62 and Figure 63 show the proposed station locations for System Alternative A. These<br />
station locations are intended to identify major intersections or major attractions/destinations that<br />
should be served by HCT. Specific station sites (e.g., near‐side or far‐side location) will reflect<br />
available right‐<strong>of</strong>‐way, utility and driveway conflicts, traffic volumes, coordination with other<br />
transit services, and transit preferential treatment opportunities and will be finalized when<br />
conceptual station plans are developed through an alternatives analysis.<br />
The figures show that BRT does not serve all the streetcar stations. This is in keeping with the<br />
mobility focus <strong>of</strong> BRT and the accessibility focus <strong>of</strong> streetcar. Compared to the alternatives<br />
defined in Section 5.0, System Alternative A has an increased number <strong>of</strong> stations and modified<br />
station locations.<br />
The proposed stations for the Broadway Boulevard corridor in System Alternative A are as<br />
follows:<br />
• Ronstadt Transit Center (BRT and streetcar)<br />
• Broadway Boulevard and Euclid Avenue (streetcar)<br />
• 6th Street and Park Avenue (BRT and streetcar)<br />
• 6th Street and Cherry Avenue (streetcar)<br />
• Broadway Boulevard and Campbell Avenue (BRT and streetcar)<br />
• Broadway Boulevard and Tucson Boulevard(streetcar)<br />
• Broadway Boulevard and Country Club Road (streetcar)<br />
• Broadway Boulevard and El Con Mall (BRT and streetcar)<br />
• Broadway Boulevard and Swan Road (BRT)<br />
• Broadway Boulevard and Craycr<strong>of</strong>t Road (BRT)<br />
130
Highway Capacity Transit System Plan - <strong>Final</strong> <strong>Report</strong> June 2009<br />
Development <strong>of</strong> Updated HCT System Plan<br />
• Broadway Boulevard and Wilmot Road (BRT)<br />
• Broadway Boulevard and Kolb Road (BRT)<br />
• Broadway Boulevard and Pantano Road (BRT)<br />
• Broadway Boulevard and Camino Seco (BRT)<br />
• Broadway Boulevard and Harrison Road (BRT)<br />
• Broadway Boulevard and Houghton Road (BRT)<br />
The proposed stations for the 6th Avenue/Nogales Highway corridor in System Alternative A are<br />
as follows:<br />
• Ronstadt Transit Center (BRT and streetcar)<br />
• Stone Avenue and 14th Street (one‐way, streetcar)<br />
• 6th Avenue and 14th Street (one‐way, streetcar)<br />
• 6th Avenue and 18th Street (streetcar)<br />
• 6th Avenue and 22nd Street (BRT and streetcar)<br />
• 6th Avenue and 26th Street (streetcar)<br />
• 6th Avenue and 29th Street (BRT and streetcar)<br />
• 6th Avenue and 34th Street (streetcar)<br />
• 6th Avenue and I‐10 (BRT and streetcar)<br />
• 6th Avenue and Veterans Boulevard (streetcar)<br />
• 6th Avenue and Ajo Way (BRT and streetcar)<br />
• 6th Avenue and Illinois Street (streetcar)<br />
• Laos Transit Center (BRT and streetcar)<br />
• Nogales Highway and Valencia Road (BRT)<br />
• Valencia Road and Campbell Avenue (BRT)<br />
• TIA (BRT)<br />
Transit Center and Park-and-Ride Lot Locations<br />
Existing park‐and‐ride lots and transit centers in the Broadway Boulevard and 6th<br />
Avenue/Nogales Highway corridors are Ronstadt Transit Center (in downtown Tucson), Laos<br />
Transit Center (at 6th Avenue and Irvington Road), and on Broadway Boulevard at Camino Seco<br />
(Safeway Shopping Center). Figure 62 and Figure 63 show potential new park‐and‐ride lot<br />
locations for System Alternative A. These sites were selected based on the availability <strong>of</strong> land or<br />
an existing parking lot with excess capacity. Certainly, other park‐and‐ride locations within close<br />
vicinity <strong>of</strong> a BRT station can be considered. Ultimately, it would be desirable to locate a park‐andride<br />
lot at each BRT station that is 5 to 6 miles away from Downtown. On Broadway, this would<br />
include stations east <strong>of</strong> Craycr<strong>of</strong>t Road, while on 6th Avenue; this would include stations south <strong>of</strong><br />
Irvington Road. Potential sites are as follows:<br />
131
Highway Capacity Transit System Plan - <strong>Final</strong> <strong>Report</strong> June 2009<br />
Development <strong>of</strong> Updated HCT System Plan<br />
• Broadway Boulevard at Park Mall (northeast corner <strong>of</strong> parking lot)<br />
• Broadway Boulevard at Wilmot Road (northeast corner <strong>of</strong> intersection)<br />
• Broadway Boulevard at Kolb Road (northwest corner <strong>of</strong> intersection)<br />
• Broadway Boulevard at Pantano Road (southeast corner <strong>of</strong> intersection)<br />
• Broadway Boulevard at Harrison Road (southwest corner <strong>of</strong> intersection)<br />
• Broadway Boulevard at Houghton Road (northwest corner <strong>of</strong> intersection)<br />
• Nogales Highway at Drexel Road (northwest corner <strong>of</strong> intersection)<br />
• Nogales Highway at Valencia Road (northwest corner <strong>of</strong> intersection)<br />
The project team notes that, as <strong>of</strong> January 2009, the City <strong>of</strong> Tucson was in the process <strong>of</strong> acquiring<br />
the land for the Broadway Boulevard/Houghton Road park‐and‐ride lot. The potential for the<br />
other sites to become park‐and‐ride lots depends on the willingness <strong>of</strong> the current property<br />
owners to sell or lease land.<br />
Changes to Local Bus Network<br />
Possible changes to local bus service in the Broadway Boulevard corridor are as follows:<br />
• Route 8 currently provides local bus service on Broadway Boulevard between downtown<br />
and Harrison Road. The route jogs north on Harrison Road to serve a park‐and‐ride lot at<br />
Speedway Boulevard. Route 8 is likely to continue providing local service along Broadway<br />
Boulevard in Phase 1 to maintain accessibility to the origins and destinations along the<br />
corridor given that BRT service overlaid on Route 8 will have substantially wider station<br />
spacing and the BRT service will divert to 6th Street to serve UA. In Phase 2, local bus<br />
service need not serve every stop where Route 8 overlaps with streetcar, so Route 8 could<br />
be cut back (e.g., truncated or operated as skip‐stop) when and where streetcar is<br />
implemented. With a new park‐and‐ride lot at Broadway Boulevard/Houghton Road,<br />
Route 8 is planned to be realigned to serve the new lot rather than the existing park‐andride<br />
lot at Speedway Boulevard/Harrison Road. The existing park‐and‐ride lot could<br />
continue to be served by Route 4 and Route 201X on Speedway.<br />
• Route 108X currently provides express bus service on Broadway between downtown and<br />
Harrison Road and terminates at the park‐and‐ride lot at Speedway Boulevard/Harrison<br />
Road. This route could be discontinued if BRT is implemented in the corridor.<br />
Possible changes to local bus service in the 6th Avenue/Nogales Highway corridor are as follows:<br />
• Route 8 currently provides local bus service on 6th Avenue between downtown and Laos<br />
Transit Center. This route could be discontinued if streetcar is implemented in the<br />
corridor in Phase 2.<br />
• Route 50 and Route 11 currently operate along a short segment <strong>of</strong> 6th Avenue between<br />
Ajo Way and Irvington Road in order to provide service to Laos Transit Center. These<br />
routes could continue with no changes.<br />
132
Highway Capacity Transit System Plan - <strong>Final</strong> <strong>Report</strong> June 2009<br />
Development <strong>of</strong> Updated HCT System Plan<br />
• Route 202X currently provides express service along Nogales Highway between Laos<br />
Transit Center, and Raytheon. BRT would provide express service between downtown<br />
and TIA via Laos Transit Center, but would not serve the Raytheon area. To maintain<br />
service to the Raytheon area, Route 202X could be continued. Likewise, Route 201X (which<br />
currently provides express service along Valencia Road to serve Raytheon and the Palo<br />
Verde corridor) could be continued.<br />
Coordination with Tucson Modern Streetcar<br />
There are several options for connecting to or extending the Tucson Modern Streetcar route with<br />
respect to the corridors in System Alternative A, and none <strong>of</strong> the options appear at this time to be<br />
fatally flawed. The issues to be addressed in project development include the following:<br />
• What alignment options exist for the new streetcar services?<br />
• Should the new streetcar lines serve Ronstadt Transit Center?<br />
• Where will the new streetcar lines cross the UPRR into downtown? Are there any grade<br />
issues?<br />
• Will turning radius requirements limit where and how the connections may be made?<br />
• How will streetcar service be operated? Will the modern streetcar and the extended<br />
streetcar lines be operated as one service or as separate services?<br />
At this level <strong>of</strong> planning, it appears that connecting a new streetcar service on 6th Avenue to the<br />
Tucson Modern Streetcar may present the most substantial challenge in System Alternative A.<br />
This is because the 6th Avenue line is likely to overlap the modern streetcar downtown, with the<br />
overlap occurring in the mid‐route portion <strong>of</strong> the downtown streetcar line. Operating the new<br />
streetcar service as an extension <strong>of</strong> the modern streetcar (e.g., <strong>of</strong>fering a transfer‐free service<br />
between points north and south <strong>of</strong> downtown Tucson) may not be desirable given that the<br />
overlap will limit the amount <strong>of</strong> service that can be provided on the western half <strong>of</strong> the modern<br />
streetcar alignment and the entirety <strong>of</strong> the 6th Avenue streetcar alignment.<br />
Streetcar service on Broadway Boulevard is not likely to be operated in conjunction with the<br />
modern streetcar because the lines do not overlap and because both run roughly east‐west and<br />
provide parallel service just east <strong>of</strong> downtown Tucson and at UA. They will intersect at or near<br />
Ronstadt Transit Center.<br />
6.3.3 System Alternative B<br />
System Alternative B is shown in Figure 62 and Figure 64. System Alternative B is a phased<br />
implementation <strong>of</strong> HCT that includes the following features:<br />
• BRT service on Broadway Boulevard from downtown Tucson to Houghton Road, with<br />
service to UA (Phase 1)<br />
• Streetcar on Broadway Boulevard from downtown Tucson to El Con Mall (Phase 2)<br />
133
Highway Capacity Transit System Plan - <strong>Final</strong> <strong>Report</strong> June 2009<br />
Development <strong>of</strong> Updated HCT System Plan<br />
• Streetcar on Campbell Avenue from the UA Health Sciences Center to Tucson Mall (Phase<br />
2)<br />
As with System Alternative A, the phased approach blends the economic development potential<br />
and accessibility <strong>of</strong> streetcar with the mobility and relatively low implementation cost <strong>of</strong>fered by<br />
BRT. However, instead <strong>of</strong> serving TIA via 6th Avenue and Nogales Highway, System Alternative<br />
B includes extension <strong>of</strong> streetcar service in mixed‐traffic operations from the UA Health Sciences<br />
Center north to Tucson Mall via Campbell Avenue, Limberlost Drive, and Stone Avenue.<br />
Streetcar service on Campbell Avenue North was analyzed in the screening evaluation conducted<br />
in Section 5.0. The alternative did not score well as presented in Section 5.0, primarily because the<br />
alternative was too short for its benefits to <strong>of</strong>fset its costs. Based on the support for this alternative<br />
voiced by the Technical Advisory Committee (TAC), the potential for streetcar on Campbell<br />
Avenue North to serve as a natural extension <strong>of</strong> the modern streetcar, and the opportunity to<br />
ultimately connect Tucson Mall to UA and downtown Tucson via streetcar, the project team<br />
elected to consider an expanded streetcar alternative on Campbell Avenue North as part <strong>of</strong><br />
System Alternative B.<br />
Refined Alignments<br />
Broadway Boulevard Corridor<br />
The proposed HCT service in the Broadway Boulevard corridor is the same in System<br />
Alternatives A and B.<br />
Campbell Avenue North Corridor<br />
The proposed HCT service in the Campbell Avenue North corridor is a streetcar service. The<br />
service would function as a natural extension <strong>of</strong> the modern streetcar and is appropriate for the<br />
population and employment densities in the corridor. The purposes <strong>of</strong> streetcar service on<br />
Campbell Avenue, connecting to Tucson Mall, are circulation and economic development.<br />
Properties on the proposed route alignment, particularly at the UA Agricultural Farms, may <strong>of</strong>fer<br />
promise for TOD.<br />
The refined alignment for the Campbell Avenue North corridor is significantly longer than that<br />
analyzed in Section 5.0. As shown in Figure 64, the refined alignment analyzed in Section 6.0<br />
begins west <strong>of</strong> Campbell Avenue on Helen Street, where the modern streetcar terminates.<br />
Streetcars would travel through the Health Sciences Center to Elm Street and then north on<br />
Campbell Avenue, west on Limberlost Drive, and north on Stone Avenue to the east side <strong>of</strong><br />
Tucson Mall (near Tohono Transit Center). Alternatively, streetcar service could terminate at<br />
Tohono Transit Center; this is an issue to be resolved during a detailed route analysis or project<br />
development. The line could eventually be extended west through the Mall to Oracle Road.<br />
134
Highway Capacity Transit System Plan - <strong>Final</strong> <strong>Report</strong> June 2009<br />
Development <strong>of</strong> Updated HCT System Plan<br />
Figure 64<br />
System Alternative B - Campbell Avenue North Corridor<br />
135
Highway Capacity Transit System Plan - <strong>Final</strong> <strong>Report</strong> June 2009<br />
Development <strong>of</strong> Updated HCT System Plan<br />
Refined Station Locations<br />
As discussed in Section 6.3.2, the station locations shown in this section are intended to identify<br />
major intersections or major attractions/destinations that should be served by HCT. Specific<br />
station sites will be finalized when conceptual station plans are developed through an<br />
Alternatives Analysis.<br />
The proposed HCT stations in the Broadway Boulevard corridor are the same in System<br />
Alternatives A and B.<br />
Figure 64 shows the proposed stations in the Campbell Avenue North corridor. These proposed<br />
stations are as follows:<br />
• Campbell Avenue and Helen Street (streetcar)<br />
• Campbell Avenue and Elm Street (streetcar)<br />
• Campbell Avenue and Grant Road (streetcar)<br />
• Campbell Avenue and Copper Street (streetcar)<br />
• Campbell Avenue and Glenn Street (streetcar)<br />
• Campbell Avenue and Blacklidge Drive (streetcar)<br />
• Campbell Avenue and Ft. Lowell Road (streetcar)<br />
• Campbell Avenue and Kleindale Road (streetcar)<br />
• Campbell Avenue and Prince Road (streetcar)<br />
• Campbell Avenue and Allen Road (streetcar)<br />
• Campbell Avenue and Limberlost Drive (streetcar)<br />
• Limberlost Drive and Mountain Avenue (streetcar)<br />
• Limberlost Drive and west <strong>of</strong> Fremont Avenue (streetcar)<br />
• Limberlost Drive and 1st Avenue (streetcar)<br />
• Limberlost Drive and west <strong>of</strong> 4th Avenue (streetcar)<br />
• Stone Avenue and south <strong>of</strong> Mills Drive(streetcar)<br />
• West <strong>of</strong> Tohono Transit Center (streetcar)<br />
Transit Center and Park-and-Ride Lot Locations<br />
The existing and proposed park‐and‐ride lots and transit centers in the Broadway Boulevard<br />
corridor are the same in System Alternatives A and B.<br />
The only existing park‐and‐ride lot or transit center in the Campbell Avenue North corridor is<br />
south <strong>of</strong> the Tohono Transit Center at Tucson Mall. No potential new park‐and‐ride lot locations<br />
for the Campbell Avenue North corridor are proposed at this time because the densities along the<br />
corridor are anticipated to generate significant walk‐up ridership and this streetcar route is<br />
considered a circulator as opposed to a line haul route.<br />
136
Highway Capacity Transit System Plan - <strong>Final</strong> <strong>Report</strong> June 2009<br />
Development <strong>of</strong> Updated HCT System Plan<br />
Changes to Local Bus Network<br />
Possible changes to local bus service in the Broadway Boulevard corridor are the same in System<br />
Alternatives A and B.<br />
Possible changes to local bus service in the Campbell Avenue corridor are as follows:<br />
• Route 15 currently provides local bus service along Campbell Avenue between UA and<br />
Roger Road. The route travels east‐west on Roger Road to Stone Avenue and Tohono<br />
Transit Center at Tucson Mall. This route could be discontinued if streetcar is<br />
implemented in the corridor. Accordingly, Route 7 could be extended north to UA along<br />
Campbell Avenue to replace the southern part <strong>of</strong> Route 15.<br />
• Route 103X currently provides express service between Ina Road and downtown Tucson<br />
via Campbell Avenue and Speedway Boulevard. This route could continue with no<br />
changes because it should provide higher‐speed service than streetcar.<br />
• Route 9 and Route 20 currently provide local bus service along Campbell Avenue between<br />
UA and Grant Road in order to provide service to UA. These routes could continue with<br />
no changes (assuming that Route 9 is truncated as part <strong>of</strong> the Modern Streetcar project).<br />
• Tohono Transit Center may need to be reconfigured to accommodate streetcar unless the<br />
streetcar line is terminated on or adjacent to Tucson Mall property. The Tohono Transit<br />
Center park‐and‐ride lot may also need to be expanded if the streetcar line attracts<br />
commuter traffic destined to/from UA and downtown Tucson.<br />
Coordination with Tucson Modern Streetcar<br />
As with System Alternative A, there are several options for connecting to or extending the<br />
modern streetcar route with respect to the corridors in System Alternative B. None <strong>of</strong> these<br />
options appear at this time to be fatally flawed. The issues to be addressed in project<br />
development are those presented in the Coordination with Tucson Modern Streetcar discussion<br />
<strong>of</strong> Section 6.3.2.<br />
New streetcar service on Campbell Avenue North is a natural extension <strong>of</strong> the modern streetcar.<br />
The modern streetcar terminus at the UA Health Sciences Center is, in fact, planned to be<br />
“stubbed out” to allow for such an extension. As a result, questions about alignment <strong>of</strong> a<br />
Campbell Avenue North streetcar simply address the future extension <strong>of</strong> the modern streetcar.<br />
Success <strong>of</strong> the initial modern streetcar line is undoubtedly a prerequisite for the Campbell Avenue<br />
North extension.<br />
137
Highway Capacity Transit System Plan - <strong>Final</strong> <strong>Report</strong> June 2009<br />
Development <strong>of</strong> Updated HCT System Plan<br />
6.4 EVALUATION OF SYSTEM ALTERNATIVES<br />
6.4.1 Impact on Regional Ridership<br />
The PAG model is not calibrated to a level that allows screen line comparison <strong>of</strong> ridership before<br />
and after implementation <strong>of</strong> the HCT system alternatives. However, reviewing the ridership<br />
forecasts presented in Section 5.0 shows the following:<br />
• Transit ridership in the Broadway Boulevard would increase by approximately 34% with<br />
implementation <strong>of</strong> HCT.<br />
• Transit ridership in the 6th Avenue/Nogales Highway corridor would increase by<br />
approximately 52% with implementation <strong>of</strong> HCT.<br />
The percentages above reflect the changes to local bus service that were assumed for the purpose<br />
<strong>of</strong> estimating ridership for Section 5.0. The estimates do not reflect the route adjustments reflected<br />
in the system alternatives or a more optimized local service plan (i.e., one that would maximize<br />
ridership in concert with HCT).<br />
6.4.2 Redevelopment Potential<br />
This section describes specific sites with promising TOD potential. Such sites are typically underdeveloped<br />
or are characterized by aging development. Such sites are also sizable enough to<br />
generate significant levels <strong>of</strong> transit ridership and investment.<br />
System Alternative A<br />
Broadway Boulevard<br />
As described in Section 5.0, the Broadway Boulevard corridor is developed with medium‐ and<br />
high‐density residential neighborhoods, strip retail and <strong>of</strong>fice development, and high‐density<br />
shopping and employment destinations (including Park Mall, El Con Mall, Williams Center, and<br />
downtown Tucson). The alignment shown in Figure 62 also includes UA.<br />
There are two potential TOD opportunities along Broadway Boulevard. One <strong>of</strong> these<br />
opportunities is El Con Mall. El Con Mall is a major potential TOD site because it is an aging<br />
retail center that is already undergoing redevelopment. While redevelopment to date has<br />
included a multiplex theater complex, Home Depot and Target Stores, and several fast food<br />
shops, nearly the entire mall is empty. Considering the proximity <strong>of</strong> this property to downtown<br />
Tucson, UA, and the recreation facilities at Reid Park, inclusion <strong>of</strong> mixed‐use<br />
residential/<strong>of</strong>fice/retail would have a high probability <strong>of</strong> success with the addition <strong>of</strong> HCT along<br />
Broadway Boulevard.<br />
Another excellent opportunity for TOD exists along the section <strong>of</strong> Broadway Boulevard from<br />
Euclid Avenue to Country Club Road, which will be widened within the next five years. The<br />
widening will require a significant amount <strong>of</strong> right‐<strong>of</strong>‐way and will likely result in total takes <strong>of</strong><br />
138
Highway Capacity Transit System Plan - <strong>Final</strong> <strong>Report</strong> June 2009<br />
Development <strong>of</strong> Updated HCT System Plan<br />
several commercial properties. The residual properties can be combined to provide parcels <strong>of</strong><br />
suitable size for TOD. Surrounding neighborhoods have already voiced their support <strong>of</strong> mixeduse<br />
redevelopment that provides a much stronger multimodal component.<br />
6th Avenue/Nogales Highway<br />
Major activity centers in the 6th Avenue/Nogales Highway corridor are downtown Tucson, the<br />
VA Hospital, the TIA, and Raytheon’s main plant. North <strong>of</strong> Irvington Road, the 6th<br />
Avenue/Nogales Highway corridor is primarily high‐density residential with some strip retail.<br />
South <strong>of</strong> Irvington Road, the corridor transitions to medium‐density residential and light<br />
industrial development.<br />
Unlike Broadway Boulevard, there are no major TOD development opportunities along 6th<br />
Avenue. However, smaller parcels could be combined to create mixed‐use residential/commercial<br />
redevelopment opportunities that would benefit from a BRT or streetcar line. Several large<br />
undeveloped parcels on Nogales Highway near Drexel Road are zoned industrial or are reserved<br />
for a future school by the Sunnyside School District.<br />
System Alternative B<br />
Broadway Boulevard<br />
Redevelopment potential in the Broadway Boulevard corridor is the same in System Alternatives<br />
A and B.<br />
Campbell Avenue North<br />
Campbell Avenue from Speedway Boulevard to River Road is developed with medium‐ and<br />
high‐density residential as well as strip retail and <strong>of</strong>fice developments. Limberlost Drive from<br />
Campbell Avenue to Stone Avenue is developed with residential and runs adjacent to the U <strong>of</strong> A<br />
Agricultural Farm. Stone Avenue from Limberlost Drive to Tucson Mall is developed with<br />
residential. Major activity centers in the corridor are UA, the UA Health Sciences Center, and<br />
Tucson Mall.<br />
A major potential TOD site in this corridor is the UA Agricultural Farm, which <strong>of</strong>fers a range <strong>of</strong><br />
development opportunities that would be significantly enhanced with direct access to a streetcar<br />
line. These opportunities could include UA‐related <strong>of</strong>fice and educational facilities in conjunction<br />
with high‐density residential and supporting commercial development.<br />
6.4.3 Impact on Transit-Dependent Population & Title VI<br />
Communities<br />
In Section 5.0, the project team assessed Title VI impacts by looking at minority and low‐income<br />
household population density. The project team assessed transit‐dependent populations by<br />
looking at density <strong>of</strong> age groups most likely to be transit‐dependent (i.e., youth and the elderly),<br />
low household income, and low household car ownership.<br />
139
Highway Capacity Transit System Plan - <strong>Final</strong> <strong>Report</strong> June 2009<br />
Development <strong>of</strong> Updated HCT System Plan<br />
The highlights <strong>of</strong> the evaluation presented in Section 5.0 are as follows:<br />
• The 6th Avenue/Nogales Highway corridor serves an area with a high percentage <strong>of</strong><br />
minority residents (60% to 80% minorities). All the other corridors considered in Section<br />
5.0 typically serve areas that have 20% to 40% minorities.<br />
• The 6th Avenue/Nogales Highway corridor serves areas where 60% or more <strong>of</strong><br />
households earn less than $40,000 a year. The middle section <strong>of</strong> the Broadway Boulevard<br />
corridor serves relatively higher‐income populations (i.e., 0% to 35% <strong>of</strong> households<br />
earning less than $40,000 a year).<br />
• In general, 36% to 50% <strong>of</strong> the population in the 6th Avenue/Nogales Highway corridor is<br />
between 5 and 19 years old or 65 years and older. The outer segment <strong>of</strong> the Broadway<br />
Boulevard corridor also serves comparable youth and elderly populations (i.e., 36% to 50%<br />
<strong>of</strong> population with age between 5 and 19 or 65 and over).<br />
• All <strong>of</strong> the potential HCT corridors considered in Section 5.0 serve significant populations<br />
<strong>of</strong> the relevant communities. The 6th Avenue/Nogales Highway corridor is one <strong>of</strong> three<br />
corridors serving the highest concentration <strong>of</strong> the relevant communities.<br />
The southern portion <strong>of</strong> the Campbell Avenue North alignment was also assessed in Section 5.0.<br />
The northern portion (shown in Figure 64) was not. The northern portion <strong>of</strong> the Campbell<br />
Avenue North alignment is characterized by 20% to 40% minorities, 60% to 80% <strong>of</strong> households<br />
earning less than $40,000 a year, and 21% to 30% <strong>of</strong> population with age between 5 and 19 or 65<br />
and over. Overall, the Campbell Avenue North corridor does not serve transit‐dependent<br />
populations and Title VI communities to the level that the 6th Avenue/Nogales Highway corridor<br />
does. Campbell Avenue North is generally more favorable than the Broadway Boulevard corridor<br />
with respect to household income but less favorable with respect to youth and elderly<br />
populations (excepting UA).<br />
6.4.4 Extent to Which Future Population & Employment are<br />
Served<br />
Table 28 lists the major trip generators within walking distance (1/4 mile) <strong>of</strong> the proposed<br />
corridors. These major trip generators are major employers and major destinations.<br />
140
Highway Capacity Transit System Plan - <strong>Final</strong> <strong>Report</strong> June 2009<br />
Development <strong>of</strong> Updated HCT System Plan<br />
Table 28<br />
Existing Major Trip Generators with Walking Distance <strong>of</strong> HCT Corridors<br />
Corridor<br />
Trip Generators Reached<br />
El Con Mall<br />
Park Mall<br />
Broadway Boulevard<br />
Campbell Avenue North<br />
6th Avenue/Nogales Highway<br />
University <strong>of</strong> Arizona<br />
Williams Center<br />
Downtown Tucson - Government Center, Convention<br />
Center<br />
University <strong>of</strong> Arizona<br />
University Medical Center<br />
Arizona Cancer Center<br />
Tucson Mall<br />
Downtown Tucson - Government Center<br />
VA Medical Center<br />
TIA<br />
In addition to serving several major retail employment centers/destinations, the Broadway<br />
Boulevard corridor serves two areas with the highest employment densities in the region: UA<br />
and downtown Tucson.<br />
The 6th Avenue/Nogales Highway Corridor serves downtown Tucson, TIA, and surrounding<br />
areas. Including surrounding employment, TIA has one <strong>of</strong> the highest employment densities in<br />
the region.<br />
Like the Broadway Boulevard corridor, the Campbell Avenue North corridor serves the high<br />
employment densities associated with the U <strong>of</strong> A. The Campbell Avenue North corridor also<br />
serves Tucson Mall—a major retail employment center/destination.<br />
6.4.5 Impact on Roadway Level <strong>of</strong> Service<br />
Table 29 shows forecast level <strong>of</strong> service (LOS) on the roadway segments that the HCT system<br />
alternative routes traverse. LOS is based on volume‐to‐capacity ratios from the PAG model. The<br />
table provides a preliminary assessment <strong>of</strong> the potential to convert general‐purpose lanes to<br />
dedicated transit lanes and the potential effectiveness <strong>of</strong> transit preferential treatments. The<br />
following sections discuss these issues with respect to each corridor in the HCT system<br />
alternatives.<br />
Broadway Boulevard<br />
Most <strong>of</strong> the Broadway Boulevard route will have dedicated transit lanes by 2040, but three<br />
sections will not. The first section is the portion <strong>of</strong> the route that runs on Euclid Avenue, 6th<br />
Street, and Campbell Avenue to provide service directly to UA. The second section extends from<br />
141
Highway Capacity Transit System Plan - <strong>Final</strong> <strong>Report</strong> June 2009<br />
Development <strong>of</strong> Updated HCT System Plan<br />
Country Club Road to Columbus Boulevard. The third section extends from Camino Seco to<br />
Houghton Road. There currently are no plans to add transit lanes to the third section.<br />
Corridor<br />
Broadway<br />
Blvd<br />
Route<br />
6th Ave/<br />
Nogales<br />
Hwy Route<br />
Campbell<br />
Ave North<br />
Route<br />
Table 29<br />
2040 Roadway Segment Operations<br />
Corridor Segment Future (2040)<br />
Can General- Will Transit<br />
Roadway From To LOS<br />
Purpose Lane Preferential<br />
Be Dedicated Treatments be<br />
to HCT?* Effective?**<br />
Broadway Blvd 4th Ave Euclid Ave E N/A Maybe<br />
Euclid Ave Broadway Blvd 6th St F Not Likely Not Likely<br />
6th St<br />
Euclid Ave Highland Ave D Not Likely Maybe<br />
Highland Ave Campbell Ave C Not Likely Not Likely<br />
Campbell Ave 6th St Broadway Blvd D Maybe Maybe<br />
Campbell Ave Country Club Dr. E NA Maybe<br />
Country Club Dr. Swan Rd E-F Not Likely Not Likely<br />
Broadway Blvd Swan Rd Pantano Rd E-F N/A Not Likely<br />
Pantano Rd Camino Seco D N/A Maybe<br />
6th Ave/<br />
Nogales Hwy<br />
Camino Seco Houghton Rd C Not Likely Maybe<br />
Congress St 16th St C Likely Not Likely<br />
16th St Benson Hwy D Not Likely Maybe<br />
Benson Hwy Valencia Road D-E Not Likely Maybe<br />
Valencia Rd Nogales Hwy TIA E-F Not Likely Not Likely<br />
Stone Ave<br />
Tucson Mall Wetmore Rd D Not Likely Maybe<br />
Wetmore Rd Limberlost Rd D Not Likely Maybe<br />
Limberlost Rd<br />
Stone Ave 1st Ave C Not Likely Not Likely<br />
1st Ave Campbell Ave N/A Not Likely N/A<br />
Limberlost Rd Roger Rd F Not Likely Not Likely<br />
Roger Rd Glenn St E Not Likely Maybe<br />
Campbell Ave<br />
Glenn St Grant Rd F Not Likely Not Likely<br />
North<br />
Grant Rd Elm St C Not Likely Not Likely<br />
Elm St Speedway Blvd D Not Likely Maybe<br />
*This assessment is based on roadway segment LOS and cross section. If there are not at least four general-purpose<br />
lanes, the answer is Not Likely. If the roadway segment operates near, at, or over capacity, the answer is Not Likely.<br />
**This assessment is based on roadway segment LOS. If the roadway segment operates at or over capacity, there may<br />
not be enough surplus capacity for transit vehicles, so the answer is Not Likely. If the roadway operates well below<br />
capacity, transit preferential treatments are Not Likely to result in a significant improvement. A detailed analysis <strong>of</strong><br />
intersection operations is needed to more definitively assess the impact <strong>of</strong> transit preferential treatments.<br />
Running BRT on the proposed Broadway Boulevard route should have minimal impact on LOS<br />
since the BRT vehicles essentially operate as express buses. The presence <strong>of</strong> bus lanes along much<br />
<strong>of</strong> this route reduces the impact <strong>of</strong> BRT on traffic conditions, although some additional overall<br />
delay may occur with the implementation <strong>of</strong> TSP.<br />
The forecast LOS on Euclid Avenue, however, suggests that BRT will be delayed by generalpurpose<br />
traffic on Euclid Avenue. Conversely, BRT may have an adverse impact on generalpurpose<br />
traffic. Since it is highly unlikely that an existing general‐purpose lane can be dedicated<br />
to BRT on Euclid Avenue or 6th Street and transit preferential treatments may not be effective,<br />
future evaluation <strong>of</strong> this route should consider using Park Avenue or and perhaps 7th Street as<br />
alternative to Euclid Avenue and 6th Street. (The only potential north‐south alternative to Euclid<br />
142
Highway Capacity Transit System Plan - <strong>Final</strong> <strong>Report</strong> June 2009<br />
Development <strong>of</strong> Updated HCT System Plan<br />
Avenue in the PAG model and for which operational forecasts are available is Highland Avenue,<br />
which is forecasted to operate at LOS C.)<br />
The easternmost part <strong>of</strong> the route is forecasted to operate at LOS C or better, which is good<br />
enough that, east <strong>of</strong> Camino Seco, HCT should be able to operate in mixed traffic with minimal<br />
adverse impact on general‐purpose traffic and with minimal delay due to general‐purpose traffic.<br />
Widening <strong>of</strong> the bridge over the Pantano Wash is not proposed as it is not likely to be a congested<br />
section <strong>of</strong> Broadway Boulevard.<br />
Similar to BRT, extension <strong>of</strong> the streetcar line should not have a significant impact on LOS since<br />
dedicated transit lanes will be available on Broadway Boulevard between downtown and<br />
Country Club Road. Implementation <strong>of</strong> transit priority signal timing could impact overall traffic<br />
delay. The primary impact will be on 6th Street and on Broadway Boulevard between Country<br />
Club Road and El Con Mall where the streetcar will need to run in general‐purpose travel lanes.<br />
Dedication <strong>of</strong> a general‐purpose travel lane for transit use is highly unlikely on these roadway<br />
sections and there is insufficient right‐<strong>of</strong>‐way to add lanes. The proposed route for the streetcar<br />
from downtown to the U <strong>of</strong> A could utilize 7th Street to eliminate traffic impacts on 6th Street.<br />
6th Avenue/Nogales Highway<br />
The forecasted LOS on 6th Avenue/Nogales Highway is good enough that HCT (BRT or streetcar)<br />
should be able to operate in mixed traffic with minimal adverse impact on general‐purpose traffic<br />
and with minimal delay due to general‐purpose traffic. Implementation <strong>of</strong> transit priority signal<br />
timing would benefit BRT and streetcar operation.<br />
Heavy traffic demand and projected congestion on Valencia Road will impact BRT travel times,<br />
and conversely, BRT operation will likely impact overall traffic conditions. Neither generalpurpose<br />
lane conversion nor transit preferential treatments appear to be feasible on the Valencia<br />
Road portion <strong>of</strong> the route. Future evaluation <strong>of</strong> this route should consider using Bilby Road or<br />
another east‐west route as an alternative to Valencia Road. Use <strong>of</strong> Campbell Avenue South/Kino<br />
Parkway instead <strong>of</strong> 6th Avenue/Nogales Highway could be reconsidered if detailed operational<br />
analysis indicates a need, although conversations with City <strong>of</strong> Tucson staff affirm that 6th<br />
Avenue/Nogales Highway is preferred considering the high transit ridership. Right‐<strong>of</strong>‐way may<br />
need to be acquired to construct dedicated HCT lanes otherwise.<br />
Campbell Avenue North<br />
The forecasted LOS on Campbell Avenue between Limberlost Road and Grant Road suggests that<br />
streetcar will be delayed by general‐purpose traffic, may have an adverse impact on generalpurpose<br />
traffic, and may not benefit from transit preferential treatments. With the exception <strong>of</strong><br />
widening Campbell Avenue to provide a dedicated street‐car right‐<strong>of</strong>‐way, implementation <strong>of</strong><br />
streetcar on this route will be difficult. Using Roger Road or Prince Road instead <strong>of</strong> Limberlost<br />
Road as a means <strong>of</strong> avoiding the segments <strong>of</strong> Campbell Avenue that are more likely to operate at<br />
capacity (i.e., those segments north <strong>of</strong> Prince Road) can also be considered.<br />
143
Highway Capacity Transit System Plan - <strong>Final</strong> <strong>Report</strong> June 2009<br />
Development <strong>of</strong> Updated HCT System Plan<br />
The forecasted LOS on Stone Avenue suggests that the streetcar should be able to operate in<br />
mixed traffic with minimal adverse impact on general‐purpose traffic and with minimal delay<br />
due to general‐purpose traffic. The cross section <strong>of</strong> Limberlost Drive is not planned to be wide<br />
enough to dedicate a lane to streetcar, but LOS in the segment is anticipated to be good enough to<br />
allow mixed‐traffic operation.<br />
6.4.6 Impact on Roadway Vehicle-Miles Traveled and<br />
Roadway Travel Time<br />
The PAG model is not calibrated to a level that allows screen line comparison <strong>of</strong> vehicle‐miles<br />
traveled (VMT) and travel time before and after implementation <strong>of</strong> the system alternatives.<br />
However, the project team anticipates that a single HCT service will not result in a substantial<br />
reduction in VMT and travel time given that transit services in Tucson and comparable areas<br />
typically do not have a substantial modal share. If HCT is implemented as a regional network and<br />
is supported by programs or structures that strongly encourage the use <strong>of</strong> alternative modes (e.g.,<br />
employer‐based travel demand management programs or higher downtown parking prices), a<br />
significant reduction in VMT and travel time is more likely to result.<br />
6.4.7 Refined Capital & Operating Costs<br />
Refined Capital Costs<br />
The capital costs previously estimated for Section 5.0 were planning‐level estimates based on<br />
typical unit costs obtained from existing HCT services, planned HCT projects in other cities, and<br />
reports such as the Bus Rapid Transit Practitioner’s Guide (TCRP <strong>Report</strong> 118). The capital cost<br />
estimates for the system alternatives in Section 6.0 reflect refined route alignments, fleet sizes,<br />
number and location <strong>of</strong> stations, and number and location <strong>of</strong> park‐and‐ride facilities. The<br />
elements included in the refined capital costs elements are the following:<br />
• Running Way. Running way costs include track, new pavement, power delivery system<br />
infrastructure, signing and striping, and TSP installations.<br />
• Stations. Station costs assume a unique shelter, benches, trash receptacles, bicycle racks,<br />
real‐time passenger information, and branding. Station features are the same as those<br />
assumed in Section 5.0, but some station locations have been changed.<br />
• Vehicles. For cost estimation purposes, vehicles are assumed to be either streetcar cars or<br />
standard‐length (40‐foot) stylized buses. (Longer articulated buses could be used for BRT<br />
if ridership forecasts or community preference dictates the need.) Stylized buses typically<br />
look more streamlined and “rail car−like” than conventional buses, and they typically<br />
have advanced features such as APCs, TSP emitters, and on‐board real‐time passenger<br />
information displays. Streetcars may have these features, too. Sun Tran has recently<br />
acquired stylized Gillig buses for use in express service. Other cities have used the stylized<br />
Gillig buses in regular service and BRT service.<br />
144
Highway Capacity Transit System Plan - <strong>Final</strong> <strong>Report</strong> June 2009<br />
Development <strong>of</strong> Updated HCT System Plan<br />
• Garage/Storage Facilities. No costs were included for construction or expansion <strong>of</strong> the<br />
streetcar garage and storage facilities because it was assumed that the planned modern<br />
streetcar facilities will be adequate to store and maintain the added streetcar vehicle fleet<br />
for both system alternatives. Similarly, it was assumed that the new BRT fleet will be<br />
accommodated at Sun Tran’s existing and new bus facilities. (The new Sun Tran bus<br />
maintenance facility, which is currently under construction, will include bays for 60‐foot<br />
buses, should articulated BRT vehicles be procured.)<br />
• S<strong>of</strong>t Costs. S<strong>of</strong>t costs include design, engineering, and administration costs and<br />
contingencies.<br />
• Park‐and‐Ride Facilities: The only cost associated with the park‐and‐ride facilities is<br />
assumed to be right‐<strong>of</strong>‐way. It is difficult to determine exact locations <strong>of</strong> these facilities for<br />
this planning‐level study. Therefore, reasonable future locations were determined along<br />
the HCT routes in the system alternatives based on where the future stations will be and<br />
field observations. The cost <strong>of</strong> right‐<strong>of</strong>‐way was assumed to be $20 per square foot based<br />
on property appraiser records; this is a rough, planning‐level estimate. Several potential<br />
park‐and‐ride locations are existing parking lots that are serving some other, compatible<br />
use. As noted previously, the potential for a given site to become a park‐and‐ride lot<br />
depends on the willingness <strong>of</strong> the current property owner to sell or lease the land. Parkand‐ride<br />
lot construction costs are not included.<br />
Table 30 summarizes the refined capital costs.<br />
Table 30<br />
Corridor Phase Route Miles<br />
Preliminary Capital Cost Estimates<br />
Total Capital Cost<br />
(2008 dollars)<br />
Capital Cost per Route<br />
Mile<br />
Broadway Boulevard<br />
Phase 1 (BRT) 12.5 miles $29,000,000 $2,300,000<br />
Phase 2 (Streetcar) 3.9 miles $138,000,000 $35,400,000<br />
6th Avenue/Nogales Phase 1 (BRT) 8.5 miles $17,500,000 $2,100,000<br />
Highway Phase 2 (Streetcar) 4.2 miles $155,000,000 $36,900,000<br />
Campbell Avenue Phase 1 (No HCT*) N/A N/A N/A<br />
North Phase 2 (Streetcar) 5.3 miles $198,500,000 $37,500,000<br />
System Alternative A<br />
System Alternative B<br />
Phase 1 21 miles $46,500,000 $2,200,000<br />
Phase 2 8.1 miles $293,000,000 $36,200,000<br />
Phases 1 & 2 29.1 miles $339,500,000 $11,700,000<br />
Phase 1 12.5 miles $29,000,000 $2,300,000<br />
Phase 2 9.2 miles $336,500,000 $36,600,000<br />
Phases 1 & 2 21.7 miles $365,500,000 $16,800,000<br />
*Development <strong>of</strong> the Tucson Modern Streetcar should be completed first.<br />
The park‐and‐ride lot right‐<strong>of</strong>‐way costs included in Table 30 are as follows:<br />
• Five BRT park‐and‐ride lots on Broadway Boulevard: $7,030,000<br />
• Two BRT park‐and‐ride lots on 6th Avenue: $1,810,000<br />
145
Highway Capacity Transit System Plan - <strong>Final</strong> <strong>Report</strong> June 2009<br />
Development <strong>of</strong> Updated HCT System Plan<br />
• One streetcar park‐and‐ride lot on Broadway Boulevard: $300,000<br />
• No streetcar park‐and‐ride lots on 6th Avenue and Campbell Avenue North<br />
Refined Operating Costs<br />
The operating costs estimation methodology from Section 5.0 was also used for Section 6.0. The<br />
BRT operating cost estimates for are based on Sun Tran’s bus operating cost per revenue hour<br />
(which represents driver wages, fuel, and administrative costs) as reported in the 2006 National<br />
Transit Database (NTD). Operating costs for streetcar were estimated based on a ratio obtained<br />
through a comparison <strong>of</strong> NTD data for transit agencies in areas similar to Tucson and currently<br />
operating both fixed‐route bus service and LRT/streetcar service. Other relevant assumptions for<br />
the operating cost estimates are as follows:<br />
• The service span duration for the peak period was assumed to be 6 hours, and the service<br />
span duration for the <strong>of</strong>f‐peak period was assumed to be 12 hours.<br />
• The headways for weekdays, Saturdays, Sundays, and holidays were assumed to be 10<br />
minutes during peak hours and 15 minutes during <strong>of</strong>f‐peak hours.<br />
• An average travel speed was assumed for each alternative by adjusting the existing<br />
average local bus speed from the NTD to reflect BRT or streetcar station spacing,<br />
implementation <strong>of</strong> TSP, and/or operation in a dedicated lane as appropriate. The basis for<br />
the adjustments is the Transit Capacity and Quality <strong>of</strong> Service Manual (TCQSM).<br />
• For the routes that partially have exclusive transit lanes, a weighted average speed (with<br />
and without exclusive lanes) was calculated to estimate the running times.<br />
• The two‐way length <strong>of</strong> the alternative (i.e., “track miles”) was divided by the<br />
corresponding average travel speed to calculate the average round‐trip travel time for<br />
each alternative. To this average round‐trip travel time, the project team added a fiveminute<br />
layover.<br />
• Given the average round‐trip travel time and the planned weekday headways, the<br />
number <strong>of</strong> vehicles needed to provide peak period service on a typical weekday was<br />
calculated. The number <strong>of</strong> daily vehicle‐hours needed to maintain planned headways<br />
throughout a typical weekday was also calculated.<br />
• Weekday daily vehicle‐hours were annualized to reflect a full year <strong>of</strong> vehicle‐hours using<br />
an annualization factor <strong>of</strong> 310, which reflects less transit service on weekends and<br />
holidays than on weekdays. The transit service provided on Saturdays was assumed to be<br />
65% <strong>of</strong> that provided on weekdays, and the transit service provided on Sundays and<br />
holidays was assumed to be 20% <strong>of</strong> that provided on weekdays. (The annual vehiclehours<br />
estimate calculated in this manner reflects only the vehicle‐hours needed to provide<br />
service at the planned headways.)<br />
• The number <strong>of</strong> annual revenue hours was multiplied by the assumed operating cost per<br />
revenue hour to estimate annual operating costs for the alternative.<br />
146
Highway Capacity Transit System Plan - <strong>Final</strong> <strong>Report</strong> June 2009<br />
Development <strong>of</strong> Updated HCT System Plan<br />
• Sun Tran’s 2006 operating cost per revenue hour was increased by 5% per year for two<br />
years to account for increased costs and thus calculate the 2008 operating cost per revenue<br />
hour.<br />
Table 31 summarizes the refined operating costs.<br />
Table 31<br />
Corridor Phase Route Miles<br />
Broadway Boulevard<br />
Preliminary Operating Cost Estimates<br />
Annual Operating Cost<br />
(2008 dollars)<br />
Annual Operating Cost<br />
per Route Mile<br />
Phase 1 (BRT) 12.5 miles $3,710,000 $300,000<br />
Phase 2 (Streetcar) 3.9 miles $1,890,000 $480,000<br />
6th Avenue/Nogales Phase 1 (BRT) 8.5 miles $3,250,000 $380,000<br />
Highway Phase 2 (Streetcar) 4.2 miles $1,450,000 $340,000<br />
Campbell Avenue Phase 1 (No HCT*) N/A N/A N/A<br />
North Phase 2 (Streetcar) 5.3 miles $2,030,000 $380,000<br />
System Alternative A<br />
System Alternative B<br />
Phase 1 21 $6,960,000 $330,000<br />
Phase 2 8.1 $3,340,000 $400,000<br />
Phases 1 & 2 29.1 $10,300,000 $350,000<br />
Phase 1 12.5 $3,710,000 $300,000<br />
Phase 2 9.2 $3,920,000 $400,000<br />
Phases 1 & 2 21.7 $7,630,000 $350,000<br />
*Development <strong>of</strong> the Tucson Modern Streetcar should be completed first.<br />
6.5 CONCLUSIONS AND RECOMMENDATIONS FOR<br />
TASK 6<br />
6.5.1 Conclusions for Task 6<br />
The project team concluded the following for Task 6:<br />
• There do not appear to be any constraints to implementing BRT service on Broadway<br />
Boulevard in the near term. In fact, the existing transit facilities within this corridor,<br />
including dedicated transit lanes and the upcoming transit priority signal timing upgrade,<br />
make implementation <strong>of</strong> BRT relatively straightforward. Clear TOD opportunities are also<br />
present along Broadway Boulevard. Except for the potential need for additional right‐<strong>of</strong>way<br />
for stations and park‐and‐ride facilities, BRT on Broadway Boulevard is a very costeffective<br />
HCT option.<br />
• The main constraint to implementing streetcar service on Broadway Boulevard is the<br />
timing <strong>of</strong> the Tucson Modern Streetcar development. Streetcar garage facilities must be in<br />
place and adequate to serve both streetcar lines. Regional stakeholders will likely wish to<br />
assess the success <strong>of</strong> the Tucson Modern Streetcar before committing to a second streetcar<br />
line.<br />
147
Highway Capacity Transit System Plan - <strong>Final</strong> <strong>Report</strong> June 2009<br />
Development <strong>of</strong> Updated HCT System Plan<br />
• BRT service in mixed traffic on 6th Avenue/Nogales Highway can be implemented in the<br />
near term, but consideration must be given to how BRT stations will be located and<br />
designed given the potential for streetcar north <strong>of</strong> Laos Transit Center.<br />
• Streetcar on South 6th Avenue does not appear to be an ideal extension <strong>of</strong> the Tucson<br />
Modern Streetcar because a mid‐route overlap <strong>of</strong> the two streetcar lines will limit the<br />
amount <strong>of</strong> service that can be provided on both lines. This is not a fatal flaw but an issue<br />
that must be considered in planning and designing both services. Additionally, there<br />
appears to be limited potential for TOD in the corridor.<br />
• Interactions between BRT, streetcar, and/or local bus in a corridor should be addressed<br />
through detailed operational analysis.<br />
• Similar to both Broadway Boulevard and 6th Avenue, support for the Campbell Avenue<br />
streetcar extension is likely to depend on the success <strong>of</strong> the Tucson Modern Streetcar. This<br />
suggests that implementation <strong>of</strong> streetcar on Campbell Avenue North is not a near‐term<br />
project. The UA Agricultural Farm provides an excellent TOD opportunity.<br />
• Corridor ridership is likely to increase significantly with any <strong>of</strong> the HCT system<br />
alternatives.<br />
• Significant populations <strong>of</strong> Title VI and/or transit‐dependent communities will be served<br />
by the HCT system alternatives.<br />
• Park‐and‐ride lot right‐<strong>of</strong>‐way cost is likely to be a significant part <strong>of</strong> the capital cost <strong>of</strong><br />
implementing BRT in the Broadway Boulevard and 6th Avenue/Nogales Highway<br />
corridors.<br />
• Several options exist in each HCT system alternative corridor for maximizing HCT travel<br />
speed. These options include dedicated HCT lanes, transit preferential treatments, and<br />
additional realignments. These options should be addressed further using detailed<br />
operational analysis if the HCT system alternatives move forward.<br />
6.5.2 Recommendations for Task 6<br />
Given the constraints associated with streetcar on 6th Avenue South and Campbell Avenue<br />
North, the project team recommended at the close <strong>of</strong> Task 6 the following combination <strong>of</strong> System<br />
Alternatives A and B for near‐ and long‐term action and detailed focus in Task 7:<br />
• Move forward with near‐term Broadway Boulevard BRT development. If federal funding is<br />
desired for the project, coordination with FTA and preparation <strong>of</strong> an alternatives analysis<br />
will be a necessary next step. Inclusion <strong>of</strong> the project in the regional plan is also necessary,<br />
as is coordination with the Broadway Boulevard widening project.<br />
• Move forward with near‐term 6th Avenue/Nogales Highway BRT development. A mobilityfocused<br />
BRT service can be implemented in this corridor relatively quickly if it<br />
commences with mixed‐traffic operation. Stations can be designed to allow future<br />
streetcar service or a future rubber‐tired circulator service (which may operate more<br />
cooperatively with the Tucson Modern Streetcar because <strong>of</strong> greater operating flexibility).<br />
As with the BRT project on Broadway Boulevard, inclusion <strong>of</strong> the project in the regional<br />
148
Highway Capacity Transit System Plan - <strong>Final</strong> <strong>Report</strong> June 2009<br />
Development <strong>of</strong> Updated HCT System Plan<br />
plan is necessary, and coordination with FTA and preparation <strong>of</strong> an alternatives analysis<br />
are necessary if federal funding is sought.<br />
• Move forward with long‐term Broadway Boulevard streetcar development. The timing <strong>of</strong> this<br />
implementation may depend on the timing <strong>of</strong> the Tucson Modern Streetcar project, but<br />
PAG and other local governments can begin addressing specific planning and design<br />
issues (as well as funding) soon. Section 7.0 will provide more insights.<br />
• Defer consideration <strong>of</strong> streetcar on Campbell Avenue North and 6th Avenue/Nogales<br />
Highway until the success <strong>of</strong> the Tucson Modern Streetcar project can be evaluated.<br />
149
High Capacity Transit System Plan - <strong>Final</strong> <strong>Report</strong> June 2009<br />
HCT Implementation Strategy<br />
7.0 HCT FUNDING<br />
7.1 INTRODUCTION<br />
Section 7.0 summarizes the identification <strong>of</strong> potential funding sources that was conducted as part<br />
<strong>of</strong> Task 7. The assessment includes existing revenue sources that may be applied to HCT,<br />
potential revenue sources that are typically used for HCT, and non‐traditional revenue sources.<br />
The discussion <strong>of</strong> each revenue source includes information on the feasibility <strong>of</strong> accessing the<br />
source and ensuring that the region preserves its eligibility to do so.<br />
7.2 EXISTING REVENUE SOURCES<br />
This section describes existing revenue sources available to the region for development and<br />
operation <strong>of</strong> HCT and new revenue sources that can be investigated. The section provides<br />
particular focus on eligibility for federal funding because federal funding is likely to be a very<br />
significant part <strong>of</strong> any HCT project and will influence the timeline <strong>of</strong> project development.<br />
Financial incentives for TOD are discussed in Section 9.4.<br />
7.2.1 Capital Improvements Funding<br />
Regional Transportation Authority<br />
The RTA 20‐year plan includes funding for transit capital improvement projects as well as<br />
operations and maintenance. The RTA plan is administered by PAG and is funded by a ½‐cent<br />
sales tax along with other regional and local dollars, such as development impact fees and the<br />
Highway User Revenue Fund (HURF). The RTA program includes dedicated funding for the<br />
Tucson Modern Streetcar, park‐and‐ride lots and transit centers, bus pull‐outs on major arterials,<br />
and signal system improvements that could include TSP. The transit‐associated RTA funding is<br />
summarized in Table 32.<br />
Table 32 RTA Funding for Transit Element<br />
Project<br />
Total Allocated Funding<br />
Tucson Modern Streetcar<br />
$75 million<br />
Park-and-Ride Lots/Transit Centers<br />
$14.7 million<br />
Transit Corridor Bus Pull-outs<br />
$30 million<br />
Signal Technology Upgrades<br />
$15 million<br />
Federal Funding<br />
Grants from the FTA accounted for $4 million dollars <strong>of</strong> capital improvements for 2008, with an<br />
additional $5 million dollars received through Congressional earmarks. At this time, it is<br />
150
High Capacity Transit System Plan - <strong>Final</strong> <strong>Report</strong> June 2009<br />
HCT Implementation Strategy<br />
anticipated that this funding will continue at current levels during 2009. Reauthorization <strong>of</strong> the<br />
federal transportation funding bill (SAFETEA‐LU), due to expire at the end <strong>of</strong> FY 2009, may result in<br />
changes to transit funding levels and/or the application process for such grants, but FTA staff were not<br />
aware <strong>of</strong> any specific changes as <strong>of</strong> April 2009.<br />
7.2.2 Operations and Maintenance Funding<br />
Sun Tran operations and maintenance funding in 2008 was $45.5 million, and projected 2009<br />
funding is $49 million. This operations and maintenance budget is funded from the following<br />
revenue sources.<br />
Federal Funding<br />
Federal funding accounted for approximately 7% <strong>of</strong> the existing Sun Tran system’s total<br />
operating expenses in 2008. This included federal operating grants, federal capitalized<br />
maintenance grants, and Compressed Natural Gas (CNG) rebates. It is projected that, for 2009,<br />
the level <strong>of</strong> federal funding will increase slightly over 2008 due to an increase in total federal<br />
operating grants.<br />
State Funding<br />
Funding from state sources contributed to 7% <strong>of</strong> Sun Tran’s operating expenses for 2008, and this<br />
level is expected to continue for 2009. This funding includes Local Transportation Assistance<br />
Funds (LTAF), which are derived from Vehicle License Taxes (VLT), as well as State Lottery<br />
Taxes and can only be used for the purposes <strong>of</strong> public transportation. Additionally, LTAF II funds<br />
are included, which also can only be used for public transportation and are derived from the State<br />
General Fund and State Lottery Taxes. A third contributor <strong>of</strong> existing state funding is the Arizona<br />
Department <strong>of</strong> Transportation (ADOT).<br />
Local Funding<br />
In 2008, the majority <strong>of</strong> Sun Tran’s operating expenses (58%) were paid from Local Agency<br />
General Funds. The largest contributor was the City <strong>of</strong> Tucson; other contributors included <strong>Pima</strong><br />
County, Oro Valley, and South Tucson. The percentage <strong>of</strong> funding to be paid from Local Public<br />
Agency General funds is expected to decline to 54% as a result <strong>of</strong> a decrease in the level <strong>of</strong><br />
funding from the City <strong>of</strong> Tucson due to budget cuts.<br />
Regional Transportation Authority<br />
The RTA provided approximately 9% <strong>of</strong> Sun Tran’s operating expenses in 2008, and this level <strong>of</strong><br />
funding is expected to increase to 12% in 2009.<br />
151
High Capacity Transit System Plan - <strong>Final</strong> <strong>Report</strong> June 2009<br />
HCT Implementation Strategy<br />
Passenger Revenue<br />
Passenger revenue accounted for 19% <strong>of</strong> Sun Tran’s total operating costs in 2008, and this level is<br />
expected to remain relatively consistent for 2009. However, the City is considering increasing<br />
fares based on recommendations from a City Council–appointed task force.<br />
7.3 POTENTIAL REVENUE SOURCES<br />
7.3.1 Capital Improvements Funding<br />
New Starts<br />
New Starts is the federal government’s primary financial resource for supporting locally planned,<br />
implemented, and operated transit guideway capital investments. The program is discretionary<br />
and is administered by the FTA. Reauthorization <strong>of</strong> the federal transportation funding bill (SAFETEA‐<br />
LU), due to expire at the end <strong>of</strong> 2009, may result in changes to transit funding levels and/or the application<br />
process for New Starts; but FTA staff were not aware <strong>of</strong> any specific changes as <strong>of</strong> April 2009.<br />
Eligibility Requirements<br />
Any fixed‐guideway system that utilizes and occupies a separate right‐<strong>of</strong>‐way or rail line for the<br />
exclusive use <strong>of</strong> mass transportation and other high‐occupancy vehicles, or uses a fixed catenary<br />
system and a right‐<strong>of</strong>‐way usable by other forms <strong>of</strong> transportation is eligible for New Starts<br />
funding. This includes, but is not limited to, rapid rail, light rail, commuter rail, automated<br />
guideway transit, people movers, and exclusive facilities for buses (such as BRT) and other highoccupancy<br />
vehicles.<br />
Three key phases in the planning and project development process must be adhered to in order<br />
for a project to be eligible for New Starts funding:<br />
• Phase I ‐ Alternatives Analysis is performed to evaluate mode and alignment options for a<br />
particular corridor. Benefits, costs, and impacts <strong>of</strong> transportation options along this<br />
corridor are analyzed; and local and regional decision‐makers identify a locally preferred<br />
alternative.<br />
• Phase II ‐ Preliminary Engineering is conducted to consider design options, refine the locally<br />
preferred alternative, and complete the National Environmental Policy Act (NEPA)<br />
process. Project costs, benefits, and impacts are further developed, and local sponsors<br />
finalize management plans, demonstrate technical capabilities, and commit local funding<br />
sources.<br />
• Phase III ‐ <strong>Final</strong> Design is completed to produce construction plans, detailed specifications,<br />
estimates, and bid documents.<br />
152
High Capacity Transit System Plan - <strong>Final</strong> <strong>Report</strong> June 2009<br />
HCT Implementation Strategy<br />
Evaluation Criteria<br />
Evaluation <strong>of</strong> New Starts candidate projects is an ongoing process and occurs annually. Ratings<br />
for projects requesting funding to enter into preliminary engineering or final design are updated<br />
as the project progresses through the process. Ratings are assigned as “High,” “Medium‐High,”<br />
“Medium,” “Medium‐Low,” or “Low.”<br />
A project is evaluated using the following criteria:<br />
Project Justification<br />
• Mobility improvements measured by travel time benefits per project passenger mile, lowincome<br />
households served, and employment near stations.<br />
• Environmental benefits measured by change in regional air pollutant emissions, change in<br />
any regional energy consumption, and EPA air quality designation.<br />
• Cost‐effectiveness measured as the cost per hour <strong>of</strong> travel time saved.<br />
• Operating efficiencies measured by system operating cost per passenger mile.<br />
• Transit‐supportive land use and future patterns measured by existing land use; transitsupportive<br />
plans, policies, and performance; and the impacts <strong>of</strong> those policies.<br />
• Other factors such as projected economic impact.<br />
Local Financial Commitment<br />
• Proposed share <strong>of</strong> total project costs from sources other than New Starts and including<br />
local match.<br />
• Stability and reliability <strong>of</strong> the proposed capital financing plan.<br />
• Ability <strong>of</strong> the sponsoring agency to fund operations and maintenance <strong>of</strong> the entire transit<br />
system (including existing service) as planned, once the project is built.<br />
Project Development Process<br />
• Complete Systems Planning.<br />
• Complete Alternatives Analysis.<br />
• Select Locally Preferred Alternative.<br />
• Include Locally Preferred Alternative in Long Range Plan.<br />
• Perform Preliminary Engineering and complete NEPA process.<br />
• Update Project Management Plans and commit local funding sources.<br />
• Complete <strong>Final</strong> Design including construction plans, right‐<strong>of</strong>‐way acquisition, and utility<br />
relocation.<br />
• Complete Financial Plan.<br />
• Complete plan to conduct Before‐and‐After Study.<br />
153
High Capacity Transit System Plan - <strong>Final</strong> <strong>Report</strong> June 2009<br />
HCT Implementation Strategy<br />
Recommendation for Funding<br />
A proposed project can only be considered eligible for funding if it has been rated as “High”,<br />
“Medium‐High”, or “Medium” and has demonstrated significant potential benefits. Project<br />
ratings do not translate directly into a funding recommendation or commitment, and the amount<br />
<strong>of</strong> New Starts funding available is considered annually relative to the phase <strong>of</strong> project<br />
development <strong>of</strong> the candidate project. Projects may receive up to 80% <strong>of</strong> capital costs through<br />
New Starts; however, typically only 50% <strong>of</strong> the capital cost is requested as it is otherwise difficult<br />
to achieve a high rating. The Tucson Modern Streetcar is currently estimated to receive federal<br />
funding from New Starts in the amount <strong>of</strong> $25 million dollars.<br />
Small Starts<br />
Small Starts is part <strong>of</strong> the FTA’s Section 5309 Capital Investment Grant Program designed to<br />
provide capital funds for low‐cost transit investment projects through a highly simplified project<br />
evaluation and rating process (compared to the New Starts process). The Small Starts program<br />
may award funding for up to 80% <strong>of</strong> total capital costs and the amount is negotiated during<br />
Project Development. Reauthorization <strong>of</strong> the federal transportation funding bill (SAFETEA‐LU), due to<br />
expire at the end <strong>of</strong> 2009, may result in changes to transit funding levels and/or the application process for<br />
Small Starts; but FTA staff were not aware <strong>of</strong> any specific changes as <strong>of</strong> April 2009.<br />
Eligibility Requirements<br />
To be eligible for funding under the Small Starts program, the total project cost must be less than<br />
$250 million, and no more than $75 million may be requested from this grant. Additionally, the<br />
guideway must be a fixed guideway for at least 50% <strong>of</strong> the project length in the peak period<br />
and/or be a corridor‐based bus project with the following minimum elements:<br />
• Substantial transit stations<br />
• Signal priority/preemption (for bus/LRT)<br />
• Low‐floor/level‐boarding vehicles<br />
• Special branding <strong>of</strong> service<br />
• Frequent service (10‐minute peak service and 15‐minute <strong>of</strong>f‐peak service)<br />
• Service <strong>of</strong>fered at least 14 hours per day<br />
Evaluation Criteria<br />
The project will be evaluated based on the following criteria:<br />
• Cost‐effectiveness<br />
• Showing incremental cost per hour <strong>of</strong> transportation system user benefits compared<br />
to the baseline alternative (using opening year forecasts)<br />
• Land Use<br />
• Existing land use patterns<br />
154
High Capacity Transit System Plan - <strong>Final</strong> <strong>Report</strong> June 2009<br />
HCT Implementation Strategy<br />
• Transit‐supportive plans and policies<br />
• Performance and impact <strong>of</strong> transit‐supportive policies<br />
• Other Factors<br />
• Economic development benefits<br />
The local financial commitment to the project is also considered, including:<br />
• Availability <strong>of</strong> sufficient funds for local share or a reasonable plan to secure funding for<br />
the local share<br />
• Additional operating and maintenance costs <strong>of</strong> the project should be no more than 5% <strong>of</strong><br />
the agency’s operating budget.<br />
• Agency is in reasonably good financial condition.<br />
Project Development Process<br />
• Complete Alternatives Analysis.<br />
• Adopt Locally Preferred Alternative.<br />
• Include Locally Preferred Alternative in Long Range Plan.<br />
• Complete NEPA process.<br />
• Receive a “Medium” rating or better from FTA.<br />
• Develop a Project Management Plan with a fair and reasonable project budget and<br />
schedule.<br />
Recommendation for Funding<br />
In order to receive a recommendation for funding, the project must have been approved to enter<br />
into Project Development and must be ready to be implemented within the fiscal year the project<br />
is proposed for funding. A project that is recommended for funding is not guaranteed to actually<br />
receive funding. The Tucson Modern Streetcar is currently estimated to receive federal funding<br />
from Small Starts in the amount <strong>of</strong> $50 million dollars.<br />
Very Small Starts<br />
Very Small Starts is a category <strong>of</strong> the Section 5309 Capital Investment Grants program<br />
administered by the FTA. This category provides funding for transit investment projects that are<br />
simple, low‐risk projects through a highly simplified and streamlined project evaluation and<br />
rating process. The Very Small Starts program may award funding for up to 80% <strong>of</strong> total capital<br />
costs, and the amount is negotiated during project development. Typical amounts <strong>of</strong> funding<br />
recently awarded for BRT projects range from 56% to 80%, with total project costs ranging<br />
between $25 million and $37 million. Reauthorization <strong>of</strong> the federal transportation funding bill<br />
(SAFETEA‐LU), due to expire at the end <strong>of</strong> 2009, may result in changes to transit funding levels and/or<br />
the application process for Very Small Starts; but FTA staff were not aware <strong>of</strong> any specific changes as <strong>of</strong><br />
April 2009.<br />
155
High Capacity Transit System Plan - <strong>Final</strong> <strong>Report</strong> June 2009<br />
HCT Implementation Strategy<br />
Eligibility Requirements<br />
To be eligible for funding under the Very Small Starts program, the capital cost must be no more<br />
than $3 million per mile, exclusive <strong>of</strong> rolling stock, and the total capital cost must be less than $50<br />
million. Additionally, the project must be a bus, rail, or ferry project and contain the following<br />
features:<br />
• Substantial transit stations<br />
• Signal priority/preemption (for bus/LRT)<br />
• Low‐floor/level boarding vehicles<br />
• Special branding <strong>of</strong> service<br />
• Frequent service (10‐minute peak and 15‐minute <strong>of</strong>f‐peak)<br />
• Service <strong>of</strong>fered at least 14 hours per day<br />
• Existing corridor ridership exceeding 3,000 riders per day<br />
Evaluation Criteria<br />
Project justification criteria including cost‐effectiveness and economic development are<br />
automatically assigned a “Medium” rating because these Very Small Starts projects are, by their<br />
nature, cost‐effective and small in scale.<br />
The project will receive a “Medium” rating for local financial commitment if it can demonstrate<br />
the following:<br />
• Funds are available for local share.<br />
• Additional operating and maintenance costs <strong>of</strong> the project are no more than 5% <strong>of</strong> the<br />
agency’s operating budget.<br />
• Agency is in reasonably good financial condition.<br />
Project Development Process<br />
• Complete simplified Alternatives Analysis process.<br />
• Adopt Locally Preferred Alternative.<br />
• Include Locally Preferred Alternative in Long Range Plan.<br />
• Complete NEPA process.<br />
• Receive a “Medium” rating or better from FTA.<br />
• Develop a Project Management Plan with a fair and reasonable project budget and<br />
schedule.<br />
Recommendation for Funding<br />
In order to receive a recommendation for funding, the project must have been approved to enter<br />
into Project Development and must be ready to be implemented. The project must be rated at<br />
least “Medium” to be recommended for funding. However, a project that is recommended for<br />
funding is not guaranteed to actually receive funding.<br />
156
High Capacity Transit System Plan - <strong>Final</strong> <strong>Report</strong> June 2009<br />
HCT Implementation Strategy<br />
Large Urban Cities Program<br />
This program provides funding for transit capital costs for urbanized areas with a population<br />
exceeding 50,000. Funding from this program is secured through Congressional earmarks by state<br />
governments, local governments, or transit agencies and typically requires a 20% local match.<br />
This program also allows funds to be used for planning expenses such as system planning,<br />
engineering, and design.<br />
Bus and Bus Facilities Program<br />
This program provides a large number <strong>of</strong> small grants for bus‐related capital projects, which BRT<br />
projects can use for bus procurement, bus maintenance facilities, passenger amenities including<br />
shelters and signage, transportation centers, intermodal terminals, and park‐and‐ride facilities.<br />
This program requires a 20% local match and is secured by transit and other public entities<br />
through Congressional earmarks. Grants typically range from approximately $50,000 to $15<br />
million.<br />
7.3.2 Operations and Maintenance Funding<br />
Two common sources <strong>of</strong> operations and maintenance funding for many agencies are Congestion<br />
Mitigation and Air Quality Improvement Program (CMAQ) grants and Large Urban Cities<br />
(Section 5307) grants. CMAQ grants are only available to regions that have been designated as<br />
non‐attainment areas and as <strong>Pima</strong> County does not fall within a non‐attainment area, it does not<br />
receive CMAQ funds. Tucson does not qualify for the Large Urban Cities program because only<br />
urbanized areas with a population <strong>of</strong> less than 200,000 are eligible under this program. Because<br />
two <strong>of</strong> the most common operations and maintenance funding sources are not available, it is<br />
important to consider non‐traditional funding sources such as those noted in Section 7.3.3.<br />
157
High Capacity Transit System Plan - <strong>Final</strong> <strong>Report</strong> June 2009<br />
HCT Implementation Strategy<br />
7.3.3 Other Funding Sources<br />
The following funding sources are non‐traditional methods <strong>of</strong> generating revenue for capital<br />
and/or operating costs <strong>of</strong> HCT. These sources are considered to be plausible as they have been<br />
used by one or more jurisdictions throughout the nation. Other sources that have been used by<br />
certain jurisdictions were investigated but excluded because it was determined that they were not<br />
applicable due to existing regulations that would require major state‐level action to remove.<br />
Although some <strong>of</strong> the sources discussed would require state‐level initiatives, they are not in<br />
direct conflict with any existing state laws. Additional information is available from a recent<br />
ADOT study on innovative funding sources. 3<br />
Special Assessment Districts/Tax Incremental Finance Districts<br />
Districts with special tax rates can be developed to capture the additional property taxes<br />
generated by private development projects in the vicinity <strong>of</strong> HCT corridors. HCT infrastructure<br />
can <strong>of</strong>ten increase the value <strong>of</strong> nearby property and result in additional development. The<br />
additional property tax revenue that would result can be directed towards HCT investments such<br />
as operating costs through the use <strong>of</strong> such districts.<br />
Impact Fees<br />
Transportation impact fees on new development could be used to generate funding for HCT.<br />
Existing impact fees could be increased from current levels with the additional revenue being<br />
specifically directed towards HCT costs. Alternatively, impact fees could be assessed on new<br />
development within a specific HCT corridor, with the revenues being used for HCT costs.<br />
Rental Car Surcharge<br />
Arizona does not currently dedicate any portion <strong>of</strong> rental car surcharges and fees to public<br />
transportation. Some states have used such a surcharge to fund transit services. This includes<br />
Florida which applies an eight cent per day charge, and Arkansas which applies a three and<br />
three‐fourths percent charge per day. With Arizona growing in popularity as a tourist<br />
destination, such a fee could generate significant revenue.<br />
3<br />
K. Ernzen and J. Ernzen. Developing a Stabilized Public Transportation Revenue Source. <strong>Final</strong> <strong>Report</strong> 620.<br />
Arizona Department <strong>of</strong> Transportation, Phoenix, AZ, January 2007.<br />
158
High Capacity Transit System Plan - <strong>Final</strong> <strong>Report</strong> June 2009<br />
HCT Implementation Strategy<br />
Sales Tax<br />
The current sales tax <strong>of</strong> one‐half percent in the City <strong>of</strong> Tucson could be extended beyond 2026 or a<br />
new sales tax could be implemented upon expiration <strong>of</strong> the current sales tax. A portion <strong>of</strong> the<br />
extended sales tax, or the entirety <strong>of</strong> a new sales tax could be dedicated to transit. The City <strong>of</strong> Fort<br />
Worth, Texas, serves as an example where a specific sales tax dedicated to transit is in effect. A<br />
sales tax <strong>of</strong> one‐fourth percent was approved in 1983 through a referendum and generates<br />
approximately $25 million per year dedicated to transit. Additional examples include the City <strong>of</strong><br />
Tempe which implemented a one‐half percent sales tax in 1996 to fund transit, and the City <strong>of</strong><br />
Phoenix which currently has a two‐fifths percent sales tax that began in 2000 to fund transit for 20<br />
years.<br />
An increase in the sales tax on fuel specifically could be considered to generate revenue for<br />
transit. Several states apply a portion <strong>of</strong> the sales tax on fuel towards public transportation. An<br />
increase could be specifically dedicated towards funding transit projects, however; it should be<br />
noted that an increase in fuel tax could only occur on a state‐wide basis. On a local level, a tax<br />
could be applied to other specific items such as certain construction materials, with the revenue<br />
being dedicated to transit. (This would be similar to the Town <strong>of</strong> Sahuarita 3% construction sales<br />
tax).<br />
Vehicle Registration Fee<br />
Arizona currently has a relatively low vehicle registration fee compared to the national average.<br />
This could allow for an increase which could be dedicated to funding transit services while<br />
remaining well below the national average. A vehicle registration fee dedicated to funding public<br />
transportation is used by North Dakota in the amount <strong>of</strong> three dollars per vehicle. Other states<br />
are increasingly considering the use <strong>of</strong> higher vehicle registration fees to fund transportation<br />
projects. It should be noted that the ability to increase vehicle registration fees for the purpose <strong>of</strong><br />
transportation/transit projects would require state‐wide legislative action.<br />
Advertising<br />
Public‐private partnerships in the form <strong>of</strong> leasing naming or sponsorship rights <strong>of</strong> HCT facilities<br />
could be used to generate funding. Private companies may pay a fee as a sponsor <strong>of</strong> a particular<br />
station and receive advertising exposure in exchange. It is also possible to lease the naming rights<br />
<strong>of</strong> a particular HCT system or corridor within a system to a private company, similar to what is<br />
done with public stadiums.<br />
Increased Fare<br />
The general fare for use <strong>of</strong> HCT services could be structured to be greater than that for use <strong>of</strong> the<br />
existing fixed‐route service. The additional revenue generated could be used to fund future<br />
expansion or addition <strong>of</strong> HCT routes.<br />
159
High Capacity Transit System Plan - <strong>Final</strong> <strong>Report</strong> June 2009<br />
HCT Implementation Strategy<br />
Parking Fees and Parking Violation Fines<br />
A portion <strong>of</strong> parking fees and parking violation fines could be used to fund HCT. Despite a recent<br />
increase in parking fees and violation fines in the downtown area, it is possible that an additional<br />
increase could also be implemented at some time in the future. This could also have the effect <strong>of</strong><br />
deterring commuters from driving personal vehicles to avoid paying for parking, which could in<br />
turn encourage increased transit ridership and thus greater fare recovery.<br />
7.4 SUMMARY OF EXISTING AND POTENTIAL<br />
REVENUE SOURCES APPLICABLE TO HCT<br />
7.4.1 Capital Improvements<br />
Existing capital improvement revenue sources that can be applied to HCT are limited. LTAF II<br />
dollars could be used, and RTA categorical funding designated for construction <strong>of</strong> bus pull‐outs<br />
and ITS/signal timing could potentially be used (particularly for BRT implementation).<br />
There are several comparatively new potential sources <strong>of</strong> funding that could be sought for capital<br />
improvements for streetcar and BRT, one <strong>of</strong> which is New Starts. New Starts can only be used for<br />
BRT service operating in exclusive right‐<strong>of</strong>‐way and a significant local match is required. Small<br />
Starts and Very Small starts could also be used to fund capital improvements and are not limited<br />
to transit services operating within exclusive right‐<strong>of</strong>‐way. These funding sources would also<br />
require significant local match but could be more suitable for some projects depending on the cost<br />
range. Some supplementary funding could potentially be obtained through Large Urban Cities<br />
Program. Bus and Bus Facilities Programs funding is applicable for BRT projects.<br />
In addition to traditional grant programs to cover capital costs, other less conventional forms <strong>of</strong><br />
securing funding for HCT may be considered. These include bonds, tax increment financing (TIF)<br />
districts, and public‐private partnerships. The concept <strong>of</strong> transit “value capture” has been<br />
explored in some areas as a means <strong>of</strong> funding transit improvements by capitalizing on the<br />
increases in property values and rents that might be associated with transit investments.<br />
7.4.2 Operations and Maintenance<br />
Sources <strong>of</strong> funding that can be applied to operations and maintenance costs are more limited than<br />
those available for capital improvement costs. Passenger revenue would be the primary<br />
component <strong>of</strong> funding operating and maintenance expenses, as it is currently. Other funding<br />
sources currently being used that could be continued for HCT are LTAF II funds. New sources <strong>of</strong><br />
funding include value capture.<br />
160
High Capacity Transit System Plan - <strong>Final</strong> <strong>Report</strong> June 2009<br />
HCT Implementation Strategy<br />
7.5 CONCLUSIONS AND RECOMMENDATIONS FOR<br />
FUNDING<br />
7.5.1 Conclusions<br />
The project team concludes the following:<br />
• Broadway Boulevard BRT and 6th Avenue/Nogales Highway BRT projects appear to<br />
qualify for Very Small Starts federal funding.<br />
7.5.2 Recommendations<br />
The project team recommends the following actions for HCT implementation:<br />
• Move forward with near‐term Broadway Boulevard BRT development as previously<br />
recommended.<br />
• Identify an agency or local government to take the lead in implementation.<br />
• Establish coordination with FTA Region IX staff.<br />
• Begin the process <strong>of</strong> conducting an Alternatives Analysis.<br />
• Begin the process <strong>of</strong> including the projects in the RTP.<br />
• Begin lining up the local match for Very Small Starts.<br />
• If trolley bus—a technology lately introduced by TAC members—is considered for<br />
implementation as an alternative to streetcar, the region should communicate with FTA<br />
Region IX staff in advance to determine the funding programs for which trolley buses are<br />
eligible. Provision <strong>of</strong> the overhead catenary suggests that trolley bus service might be<br />
eligible for New Starts funding, but this must be verified as early as possible.<br />
161
High Capacity Transit System Plan - <strong>Final</strong> <strong>Report</strong> June 2009<br />
HCT Implementation Strategy<br />
8.0 CORRIDOR IMPLEMENTATION<br />
PLANS<br />
8.1 INTRODUCTION<br />
Section 8.0 summarizes the development <strong>of</strong> individual corridor implementation plans including<br />
staging <strong>of</strong> HCT projects for the near term and long term. The following questions are answered:<br />
• How and when do we phase in HCT in the study corridors?<br />
• What steps can be taken to implement HCT in the near term?<br />
• Is incremental implementation possible?<br />
With respect to the individual corridor implementation plans, Section 8.0 summarizes the<br />
assessments conducted to date for each HCT corridor, identifies the opportunities and constraints<br />
for each corridor, and lays out the likely implementation scenario for each corridor. The<br />
implementation plan laid out for the system alternative recommended in Section 6.0 is the most<br />
detailed because its components are the most suitable for near‐term implementation.<br />
Section 8.0 also describes a monitoring methodology that can be used to guide the region in<br />
determining if, when, and how HCT can be implemented in a given corridor. This methodology<br />
does not look at HCT implementation as an all‐or‐nothing investment but as a series <strong>of</strong> steps that<br />
phase in HCT components over time and as needed. The advantages <strong>of</strong> the monitoring<br />
methodology are as follows:<br />
• It is quantitative, so it can be used to provide support for funding recommendations.<br />
• It is based on research and guidance in the second edition <strong>of</strong> the Transit Capacity and<br />
Quality <strong>of</strong> Service Manual, a manual published by the Transit Cooperative Research<br />
Program (TCRP) as TCRP <strong>Report</strong> 100 in 2004.<br />
• It uses data that is relatively easy to collect.<br />
• It identifies incremental investments in HCT components. These incremental investments<br />
could be corridor‐wide investments such as TSP or spot improvements such as queue<br />
jump lanes at key signalized intersections.<br />
162
High Capacity Transit System Plan - <strong>Final</strong> <strong>Report</strong> June 2009<br />
HCT Implementation Strategy<br />
8.2 MONITORING FOR HCT IMPLEMENTATION<br />
8.2.1 Overview <strong>of</strong> HCT Implementation Monitoring Process<br />
The flowchart in Figure 65 illustrates the proposed HCT implementation monitoring process. The<br />
flowchart identifies quality <strong>of</strong> service (QOS) measures, data sources, and potential improvements.<br />
Appendix A describes the steps in the flowchart and provides the supporting information that is<br />
referenced in the flowchart.<br />
The above monitoring process is generalized so that it can apply to all <strong>of</strong> the potential HCT<br />
corridors. The project team notes that corridor‐specific goals (e.g., revitalization <strong>of</strong> a specific<br />
corridor) may influence HCT decision‐making as well.<br />
8.3 CORRIDOR IMPLEMENTATION PLANS<br />
Each <strong>of</strong> the following sections focuses on a specific HCT corridor.<br />
8.3.1 Broadway Boulevard<br />
Proposed HCT Service<br />
The proposed HCT service within the Broadway corridor includes both BRT and streetcar. It is<br />
envisioned that implementation <strong>of</strong> these HCT modes will be phased, beginning with BRT.<br />
BRT Service<br />
The proposed BRT system would extend from downtown Tucson out to Houghton Road,<br />
approximately 11.5 miles, and would connect major employment and activity centers, including<br />
the downtown area, UA, El Con Mall, Williams Center, and Park Mall. This service is intended to<br />
serve longer trips and provide comparable travel times with auto travel. As such, the spacing <strong>of</strong><br />
stops would be no closer than one mile and TSP is required. An initial proposed route, as shown<br />
in Section 6.0, would operate along Broadway Boulevard, deviating to 6th Street and UA via<br />
Campbell Avenue and Euclid Avenue. Alternative routes to serve UA include Cherry Avenue,<br />
Highland Avenue, or Park Avenue.<br />
163
High Capacity Transit System Plan - <strong>Final</strong> <strong>Report</strong> June 2009<br />
HCT Implementation Strategy<br />
Figure 65<br />
HCT Implementation Monitoring Process<br />
Figure 65 HCT Implementation Monitoring Process<br />
164
High Capacity Transit System Plan - <strong>Final</strong> <strong>Report</strong> June 2009<br />
HCT Implementation Strategy<br />
Park‐and‐ride lots would be provided along the corridor, particularly east <strong>of</strong> Craycr<strong>of</strong>t Road, to<br />
serve commuters. A park‐and‐ride lot at Campbell Avenue might also be considered to serve<br />
potential future BRT service on Campbell Avenue/Kino Parkway between UA and TIA. It is<br />
anticipated that BRT stops would be able to accommodate both 40‐foot buses and 60‐foot<br />
articulated vehicles and would include real‐time traveler information displays.<br />
Streetcar Service<br />
The proposed streetcar service could extend from downtown Tucson to El Con Mall, with a<br />
diversion to the south side <strong>of</strong> UA (approximately 4 miles). The streetcar could be a separate line<br />
or a spur <strong>of</strong>f <strong>of</strong> the initial Modern Streetcar line. An alternatives analysis will be required to<br />
determine the best route for the streetcar extension. This service is intended to serve short trips<br />
and support higher‐density TOD opportunities, including El Con Mall, the area south 6th Street<br />
and University, and the section <strong>of</strong> Broadway Boulevard between Euclid Avenue and Country<br />
Club Road (which will be widened). As such, stops would be 1/4‐ to 1/2‐mile apart. The extension<br />
<strong>of</strong> streetcar service along Broadway Boulevard will be heavily dependent upon the success <strong>of</strong> the<br />
initial Modern Streetcar line.<br />
Existing and Programmed/Planned Transit Service<br />
Fixed‐route bus and express bus service are currently provided along Broadway Boulevard. The<br />
Route 8 fixed‐route service, which runs from the Laos Transit Center along 6th Avenue to the<br />
Ronstadt Transit Center and then out Broadway Boulevard to Wilmot Road, has a weekday<br />
ridership <strong>of</strong> over 10,000 passengers. Route 8 service during both weekdays and weekends was<br />
recently extended. Existing express bus service includes the Broadway/Downtown Express<br />
(108X), which runs three buses during the morning and evening commute periods. The route<br />
begins at the park‐and‐ride lot at Speedway Boulevard/Harrison Road and includes three stops<br />
on Broadway Boulevard at Pantano Road, Wilmot Road, and Alvernon Way. Downtown stops<br />
include the Ronstadt Transit Center and a stop on the west side <strong>of</strong> the downtown area. Park‐andride<br />
lots include an existing lot at Camino Seco and a new lot at Houghton Road that is under<br />
development. No additional transit service within the corridor is currently planned or<br />
programmed.<br />
HCT Implementation Constraints<br />
Implementation <strong>of</strong> BRT service on Broadway Boulevard is essentially unconstrained; however,<br />
implementation <strong>of</strong> effective transit preferential treatments may be difficult considering the heavy<br />
traffic volumes that this roadway carries, particularly during peak commute periods. BRT<br />
vehicles could operate in the dedicated transit lanes for much <strong>of</strong> the route but will need to operate<br />
in mixed traffic from Country Club Road to Columbus Boulevard (1.5 miles) and Camino Seco to<br />
Houghton Road (2 miles). The operational impacts <strong>of</strong> running BRT in the dedicated transit lanes<br />
will need to be carefully assessed since these lanes also function as deceleration lanes for rightturns<br />
accessing the frequent driveways along this route and as bicycle lanes. It may be faster to<br />
run BRT within the general purpose lanes, pulling into the transit lanes only at stations.<br />
Acquiring additional right‐<strong>of</strong>‐way for stations and park‐and‐ride lots should not be problematic.<br />
165
High Capacity Transit System Plan - <strong>Final</strong> <strong>Report</strong> June 2009<br />
HCT Implementation Strategy<br />
Implementation <strong>of</strong> a streetcar line on Broadway Boulevard could be constrained by the lack <strong>of</strong> a<br />
dedicated transit lane between Country Club Road and El Con Mall. Within this section, the<br />
streetcar line could be placed within the existing median. Dedicated transit lanes currently exist<br />
from downtown Tucson, under the Union Pacific Railroad (UPRR), to Euclid Avenue and are<br />
planned to be included in the widening between Euclid Avenue and Country Club Road.<br />
Streetcar and BRT service are not anticipated to conflict because BRT will have few stops where<br />
the services overlap.<br />
Implementation Plan<br />
BRT Service<br />
The estimated capital cost <strong>of</strong> $29 million for BRT service on Broadway Boulevard indicates that<br />
the project is eligible to qualify for Very Small Starts funding. As such, it is recommended that the<br />
implementation plan follow the Project Development process associated with Very Small Starts.<br />
FTA strongly recommends that the sponsoring agency closely coordinate with FTA early in the<br />
project process and throughout development. FTA Region IX staff are already familiar with the<br />
Tucson region as a result <strong>of</strong> the Tucson Modern Streetcar project.<br />
The first step in the Very Small Starts process is to notify FTA <strong>of</strong> intent to initiate an Alternatives<br />
Analysis for Broadway Boulevard BRT. The sponsoring agency (or agencies) should then proceed<br />
with an Alternatives Analysis, using the simplified process appropriate for Very Small Starts<br />
projects. The Alternatives Analysis would draw on the results <strong>of</strong> this study and should<br />
accomplish the following:<br />
• Define the purpose and need <strong>of</strong> Broadway Boulevard BRT. Describe the problem that must be<br />
addressed and develop project goals, objectives, and evaluation measures for the various<br />
alternatives.<br />
• Identify alternatives that consist <strong>of</strong> high‐ and low‐cost capital improvements, including a<br />
“baseline” alternative. The alternatives to be considered are BRT, LRT, and a baseline<br />
alternative that includes only transit improvements already planned and programmed.<br />
The alternatives should address the range <strong>of</strong> costs and ridership and assess financial<br />
feasibility. BRT and LRT options were addressed in Section 5.0.<br />
• Identify measures for evaluating the alternatives and methodologies for generating data<br />
to perform evaluations (e.g., the ridership forecasting methodology). Common measures<br />
include:<br />
• Effectiveness ‐ The extent to which the stated transportation problem is solved in the<br />
corridor.<br />
• Impacts ‐ The extent <strong>of</strong> positive and negative impacts.<br />
• Cost‐effectiveness ‐ The extent to which costs are commensurate with benefits.<br />
• Financial feasibility ‐ The likely availability <strong>of</strong> funds.<br />
• Equity ‐ The fair distribution <strong>of</strong> costs and benefits.<br />
To the extent possible, methodologies should be reviewed with FTA Region IX staff in advance.<br />
166
High Capacity Transit System Plan - <strong>Final</strong> <strong>Report</strong> June 2009<br />
HCT Implementation Strategy<br />
• Conduct evaluation and screening <strong>of</strong> the alternatives to narrow the range <strong>of</strong> viable<br />
alternatives and carry those forward into detailed analysis to develop a more thorough<br />
definition <strong>of</strong> alternatives. The evaluation measures previously identified should be used to<br />
analyze each alternative. (Previously completed HCT technical memoranda will provide<br />
information for this task.) The alternatives carried forward will be BRT and the baseline<br />
alternative. As part <strong>of</strong> the BRT evaluation, ridership forecasts should be documented per<br />
FTA requirements and specific BRT service features should be identified. Identification <strong>of</strong><br />
specific BRT features (e.g., alignment, station architecture concept, type <strong>of</strong> vehicle, and<br />
provision <strong>of</strong> amenities such as real‐time passenger information) will require more detailed<br />
analysis as well as stakeholder and public input. Cost estimates should be updated to<br />
reflect these refinements.<br />
• Develop funding strategies. Various financial documents will be needed to provide<br />
supporting information. FTA worksheets and forms will need to be filled out.<br />
• Select a proposed mode and general alignment as the Locally Preferred Alternative (LPA). The<br />
LPA should be adopted in the long‐range plan. Other evidence <strong>of</strong> regional support (e.g.,<br />
board resolutions) is desired.<br />
• Send documentation to FTA and request approval to begin Project Development. Project<br />
development includes final design and preliminary engineering.<br />
Prior to advancing into Project Development, the project should:<br />
1. Demonstrate cost‐effectiveness by demonstrating benefit to 3,000 existing transit riders<br />
using FTA procedures for documenting the benefit.<br />
2. Demonstrate local financial commitment by showing availability <strong>of</strong> funds for local share,<br />
demonstrating that the additional operations and maintenance costs will not exceed 5% <strong>of</strong><br />
the agency’s operating budget, and demonstrating that the agency is in reasonably good<br />
financial condition.<br />
3. Demonstrate land use and economic development benefit.<br />
Upon approval <strong>of</strong> the Alternatives Analysis by FTA, the next step in the process is Project<br />
Development, which, in the case <strong>of</strong> Very Small Starts projects, incorporates Preliminary<br />
Engineering and <strong>Final</strong> Design. The goal <strong>of</strong> Project Development is to produce a specific project<br />
with definitive scope elements, alignment, and design features such as project cost and<br />
implementation schedule. It should also demonstrate to FTA that the project will continue to<br />
meet Very Small Starts criteria and that the amount <strong>of</strong> funding needed will not change. Following<br />
are tasks to be completed as part <strong>of</strong> Preliminary Engineering:<br />
• Refine definition <strong>of</strong> the LPA’s scope, schedule, and budget to produce a final scope, a<br />
highly accurate cost estimate, and a detailed implementation schedule.<br />
• Produce a thorough Project Management Plan which establishes the engineering<br />
approach, procedures, and roles and responsibilities for undertaking the project. The<br />
Project Management Plan is a tool used by FTA to assess technical capacity and capability<br />
<strong>of</strong> the project sponsor to undertake further project development (i.e., capacity and<br />
capability to undertake the remaining tasks in this list).<br />
167
High Capacity Transit System Plan - <strong>Final</strong> <strong>Report</strong> June 2009<br />
HCT Implementation Strategy<br />
• Review on‐board technology and determine necessary integration for transit ITS elements<br />
such as real‐time passenger information and TSP. This will also include a review <strong>of</strong> City<br />
ITS plans to determine the need for modification to accommodate traffic signal system<br />
upgrades that will enable TSP.<br />
• Produce a financial plan including proposed local funding committed to the project.<br />
• Produce a real estate acquisition plan.<br />
• Produce quality control and assurance plans for construction.<br />
• Produce project safety and security plans.<br />
• Produce bus/rail fleet management plans.<br />
• Prepare any documentation needed for NEPA compliance, including environmental,<br />
transportation, cultural, and social impact identification and mitigation strategies.<br />
Broadway Boulevard BRT is not likely to require substantial NEPA documentation.<br />
The <strong>Final</strong> Design component <strong>of</strong> Project Development involves the strategic execution <strong>of</strong> the plans<br />
and project elements that are a part <strong>of</strong> Preliminary Engineering, in accordance with the defined<br />
methods. Following are the components <strong>of</strong> <strong>Final</strong> Design:<br />
• Utility relocation<br />
• Right‐<strong>of</strong>‐way acquisition<br />
• Development <strong>of</strong> detailed specifications<br />
• Preparation <strong>of</strong> final construction plans<br />
• Development <strong>of</strong> construction cost estimates<br />
• Development <strong>of</strong> bid documents<br />
• Addressing <strong>of</strong> any remaining minor uncertainties<br />
• Reallocation <strong>of</strong> project contingencies within the total budget<br />
• Preparation <strong>of</strong> a before‐and‐after study plan for the collection and analysis <strong>of</strong> information<br />
related to the performance <strong>of</strong> the project as well as the reliability <strong>of</strong> the methods used to<br />
estimate the project’s costs, benefits, and other impacts.<br />
Negotiation <strong>of</strong> specific terms and conditions for the award <strong>of</strong> a funding grant agreement is only<br />
done once acceptable progress is made and demonstrated towards execution <strong>of</strong> the strategies in<br />
Project Development and only if the project continues to rate “Medium” or higher.<br />
Table 33 is a sample timeline showing the expected duration <strong>of</strong> each <strong>of</strong> the components <strong>of</strong> the<br />
implementation plan. The timeline can be shortened if BRT is implemented in phases, but<br />
phasing the implementation by, say, using existing buses instead <strong>of</strong> procuring stylized BRT<br />
vehicles may dilute the BRT “brand” and reduce BRT ridership.<br />
Table 33<br />
Sample Timeline for Implementation <strong>of</strong> BRT under Very Small Starts<br />
Task<br />
Estimated Duration<br />
FTA Alternatives Analysis*<br />
12 months<br />
168
High Capacity Transit System Plan - <strong>Final</strong> <strong>Report</strong> June 2009<br />
HCT Implementation Strategy<br />
Development and release <strong>of</strong> Request for Proposals (RFP) for Project Development<br />
Project Development (<strong>Final</strong> Design and Preliminary Engineering)<br />
FTA Funding Agreement<br />
Development and release <strong>of</strong> an RFP for construction <strong>of</strong> stations, systems, and transit<br />
preferential treatments**<br />
Permitting and Construction<br />
3 months<br />
15 to 30 months<br />
3 months<br />
3 months<br />
12 months<br />
*Requires adoption <strong>of</strong> a Locally Preferred Alternative<br />
**Vehicle procurement should begin early, as procurement may take 18 months or more depending on the type <strong>of</strong><br />
vehicle selected.<br />
Streetcar Service<br />
• Monitor land use activity and demand in the streetcar portion <strong>of</strong> the corridor.<br />
• The success <strong>of</strong> the initial phase <strong>of</strong> the Tucson Modern Streetcar, measured by ridership<br />
and resulting redevelopment, will influence the viability <strong>of</strong> streetcar on Broadway<br />
Boulevard.<br />
• Preserve right‐<strong>of</strong>‐way for future streetcar stations. Ensure that new development and<br />
redevelopment in the interim is “transit‐ready.” (See Section 9.0.)<br />
8.3.2 6th Avenue/Nogales Highway<br />
Proposed HCT Service<br />
The proposed HCT service within the 6th Avenue/Nogales Highway Corridor includes both BRT<br />
and streetcar. It is envisioned that implementation <strong>of</strong> these HCT modes will be phased, with both<br />
modes operating in mixed traffic.<br />
BRT Service<br />
The proposed BRT system would extend from Downtown out to TIA, approximately 8.5 miles,<br />
and would connect major employment and activity centers, including the downtown area, the<br />
Veterans Administration (VA) Medical Center, and the TIA. Since the service is intended to<br />
provide travel times comparable with auto travel, the spacing <strong>of</strong> stops would typically be<br />
approximately one mile and TSP will be required. An initial proposed route is shown in Section<br />
6.0.<br />
Park‐and‐ride lots would be provided along the corridor to serve commuters, including the<br />
existing park‐and‐ride lot at the Laos Transit Center. It is anticipated that BRT stops would be<br />
able to accommodate both 40‐foot buses and 60‐foot long articulated vehicles, and would include<br />
real‐time traveler information displays.<br />
Streetcar Service<br />
The proposed streetcar service would extend from downtown Tucson to the Laos Transit Center,<br />
approximately 4 miles. This service is intended to serve short trips in an area with both high<br />
population density and high transit usage. Stops would be ¼ to ½‐mile apart. The streetcar could<br />
be a separate line or a spur <strong>of</strong>f <strong>of</strong> the initial Tucson Modern Streetcar line. Connecting a new<br />
169
High Capacity Transit System Plan - <strong>Final</strong> <strong>Report</strong> June 2009<br />
HCT Implementation Strategy<br />
streetcar service on 6th Avenue to the initial streetcar line may be a challenge because there is<br />
likely to be some overlap in the downtown area.<br />
Existing and Programmed/Planned Transit Service<br />
Fixed‐route bus service is currently provided along 6th Avenue. Route 8, which runs from the<br />
Laos Transit Center along 6th Avenue to the Ronstadt Transit Center and then out Broadway<br />
Boulevard to Wilmot Road, has a weekday ridership <strong>of</strong> over 10,000 passengers. Route 8 service<br />
during both weekdays and weekends was recently extended. Existing express bus service for the<br />
Northwest/Aero Park Express (202X) and the Oro Valley/Aero Park Express (203X) both stop at<br />
the Laos Transit Center and then continue on Nogales Highway to the Raytheon plant. Each <strong>of</strong><br />
these routes runs three buses during the morning and evening commute periods. An additional<br />
express route will be added, which will travel on 6th Avenue from the Laos Transit Center to<br />
downtown Tucson, stopping at the Ronstadt Transit Center.<br />
HCT Implementation Constraints<br />
For the portion <strong>of</strong> the corridor operating along 6th Avenue/Nogales Highway, forecasted level <strong>of</strong><br />
service is good enough that HCT (BRT or streetcar) should be able to operate in mixed traffic with<br />
minimal adverse impact on general‐purpose traffic and with minimal delay due to general<br />
purpose traffic. General‐purpose lane conversion is not feasible along this route. TSP can be<br />
implemented and would benefit BRT and streetcar operation along this corridor. Implementation<br />
<strong>of</strong> HCT stations, particularly on the 6th Avenue segment could be difficult considering the lack <strong>of</strong><br />
right‐<strong>of</strong>‐way and potential resistance <strong>of</strong> neighborhoods to adding HCT along this route.<br />
The primarily constraint for streetcar on 6th Avenue/Nogales Highway is that it does not appear<br />
to be an ideal extension <strong>of</strong> the initial downtown route <strong>of</strong> the modern streetcar. A mid‐route<br />
overlap <strong>of</strong> the two streetcar lines will limit the amount <strong>of</strong> service that can be provided on both<br />
lines.<br />
A mobility‐focused BRT service can be implemented in this corridor relatively quickly if it<br />
commences with mixed‐traffic operation. Stations should be designed to allow for future streetcar<br />
service or a future rubber‐tired circulator service.<br />
Implementation Plan<br />
BRT Service<br />
The estimated capital cost <strong>of</strong> $17.5 million for BRT service in the 6th Avenue/Nogales Highway<br />
corridor indicates that the project is eligible to qualify for Very Small Starts funding. As such, it is<br />
recommended that the implementation plan follow the Project Development process associated<br />
with Very Small Starts. The specifics <strong>of</strong> the implementation are, accordingly, analogous to the<br />
plan described above for Broadway Boulevard BRT, but the 6th Avenue/Nogales Highway BRT<br />
implementation plan differs from the Broadway Boulevard BRT implementation plan in one key<br />
respect: The alternatives are streetcar, BRT operating in mixed traffic, BRT operating in a<br />
dedicated lane, and the baseline alternative.<br />
170
High Capacity Transit System Plan - <strong>Final</strong> <strong>Report</strong> June 2009<br />
HCT Implementation Strategy<br />
Separate Very Small Starts applications should be submitted for Broadway Boulevard BRT and<br />
6th Avenue South BRT.<br />
Streetcar Service<br />
• Monitor land use activity and demand in the streetcar portion <strong>of</strong> the corridor.<br />
• The success <strong>of</strong> the initial phase <strong>of</strong> the Tucson Modern Streetcar, measured by ridership<br />
and resulting redevelopment, will influence the viability <strong>of</strong> streetcar on 6th<br />
Avenue/Nogales Highway.<br />
• Preserve right‐<strong>of</strong>‐way for future streetcar stations. Ensure that new development and<br />
redevelopment in the interim is “transit‐ready.” (See Section 9.0.)<br />
8.3.3 Oracle Road<br />
Proposed HCT Service<br />
The proposed long‐term HCT service within the Oracle Corridor is envisioned to be BRT<br />
operating primarily in general purpose lanes.<br />
The BRT service would extend from downtown Tucson to Rancho Vistoso Boulevard in Oro<br />
Valley, approximately 17 miles, and would connect major employment and activity centers,<br />
including the downtown Tucson area, Tucson Mall, <strong>Pima</strong> College Downtown, Ventana Medical<br />
Systems, and Honeywell. This service is intended to serve longer trips and provide comparable<br />
travel times with auto travel. The spacing <strong>of</strong> stops would be no closer than one mile, and TSP will<br />
be required. Park‐and‐ride lots would be provided at key locations along the corridor to serve<br />
potential BRT users. It is anticipated that BRT stops would be able to accommodate both 40‐foot<br />
buses and 60‐foot articulated vehicles and would include real‐time traveler information displays.<br />
Existing and Programmed/Planned Transit Service<br />
Fixed‐route and express transit service is currently provided along Oracle Road. Route 16, which<br />
runs along Oracle Road from Ina Road to downtown Tucson, has a weekday ridership <strong>of</strong> over<br />
6,000 passengers. Route 16 service during both weekdays and weekends was recently extended.<br />
Existing express bus service includes the Oro Valley/Downtown Express (107X) and the Oro<br />
Valley/Tohono Express (312X). Both routes run three buses during the morning and evening<br />
commute periods. Route 107X begins in Oro Valley at the park‐and‐ride lot on Rancho Vistoso<br />
Boulevard and runs along Oracle Road from Magee Road to downtown Tucson. Route 312X runs<br />
from the Honeywell plant in Oro Valley to the Tohono Tadai Transit Center at the Tucson Mall.<br />
An existing park‐and‐ride lot is located in the Oracle Plaza shopping center at Orange Grove<br />
Road. No additional transit service within the corridor is currently planned or programmed.<br />
HCT Implementation Constraints<br />
BRT service within a general use lane is envisioned along this corridor. Acquiring additional<br />
right‐<strong>of</strong>‐way for dedicated lanes south <strong>of</strong> Ina Road will be prohibitively expensive. North <strong>of</strong> Ina<br />
171
High Capacity Transit System Plan - <strong>Final</strong> <strong>Report</strong> June 2009<br />
HCT Implementation Strategy<br />
Road, dedicated lanes could be installed within the existing right‐<strong>of</strong>‐way; however, this also<br />
would have a high cost. Implementation <strong>of</strong> effective transit preferential treatments such as TSP<br />
may be difficult considering the heavy traffic volumes that this roadway carries, particularly<br />
during peak commute periods. As a state highway, ADOT will require that a detailed engineering<br />
study be performed at each proposed transit stop location. On segments that have a posted speed<br />
limit above 45 mph, ADOT prohibits bus pullouts at transit stops.<br />
Another challenge for implementation <strong>of</strong> BRT on this corridor is the low population and<br />
employment density along this corridor, particularly north <strong>of</strong> River Road. This low density<br />
applies to current conditions as well as projected 2040 densities. With these low densities, it may<br />
be difficult to generate the transit demand throughout the day that will support BRT service.<br />
Implementation Plan<br />
• Monitor existing express bus service that connects Oro Valley with Tucson Mall and<br />
downtown Tucson. As demand increases—including <strong>of</strong>f‐peak demand—reassess the<br />
viability <strong>of</strong> providing a BRT service on Oracle Road. Expansion <strong>of</strong> express bus service may<br />
be a more cost‐effective option.<br />
• Preserve right‐<strong>of</strong>‐way north <strong>of</strong> Ina Road, extending to Pinal County, for future dedicated<br />
HCT lanes.<br />
• Ensure that new development and redevelopment in the interim is “transit‐ready.” (See<br />
Section 9.0.)<br />
8.3.4 Campbell Avenue/Kino Parkway<br />
Proposed HCT Service<br />
The proposed long‐term HCT service on Campbell Avenue includes both streetcar (Tucson Mall<br />
to Speedway Boulevard) and BRT (UA to TIA) service.<br />
Streetcar Service<br />
The proposed streetcar line would function as an extension <strong>of</strong> the currently planned Tucson<br />
Modern Streetcar, which is due to begin operation in 2011/2012 and connects downtown Tucson<br />
with UA and the Arizona Health Sciences Center. The Tucson Modern Streetcar terminates at the<br />
Arizona Health Sciences Center just north <strong>of</strong> Speedway Boulevard on Helen Street and will be<br />
“stubbed out” to allow for such an extension north on Campbell Avenue. A potential route<br />
extension to the Tucson Mall was included in Section 6.0.<br />
The purpose <strong>of</strong> this streetcar service is to provide circulation and support economic development<br />
in an area where population and employment densities, as well as land use, <strong>of</strong>fer promise for<br />
TOD. The spacing <strong>of</strong> stops would typically be 1/4‐mile and no more than 1/2‐mile. TSP would be<br />
required.<br />
BRT Service<br />
172
High Capacity Transit System Plan - <strong>Final</strong> <strong>Report</strong> June 2009<br />
HCT Implementation Strategy<br />
BRT service would extend from UA to TIA. It would share a station at the university with the<br />
Broadway Boulevard BRT route to allow easy transfers. Placement <strong>of</strong> a park‐and‐ride lot adjacent<br />
to the university station would provide a central location for travelers destined for TIA;<br />
management <strong>of</strong> long‐term parking would be required. Stops would be spaced one mile or farther<br />
apart, and TSP will be required.<br />
Existing and Programmed/Planned Transit Service<br />
Fixed‐route bus service is currently provided along Campbell Avenue, but no express bus service<br />
currently exists. Route 15 has a weekday ridership <strong>of</strong> approximately 1,800 passengers. The route,<br />
which runs between the Tohono Tadai Transit Center and Reid Park with a primary stop at UA,<br />
travels on Campbell Avenue from Roger Road to just south <strong>of</strong> 22nd Street. South <strong>of</strong> 22nd Street,<br />
there is no continuous transit service. Route 15 service during both weekdays and weekends was<br />
recently extended. No additional transit service within the corridor is currently planned or<br />
programmed.<br />
HCT Implementation Constraints<br />
Running an extension <strong>of</strong> the streetcar between the Health Sciences Center and Tucson Mall along<br />
Campbell Avenue could be problematic considering the lack <strong>of</strong> right‐<strong>of</strong>‐way to add dedicated<br />
HCT lanes and the heavy traffic volumes that the roadway carries. Widening Campbell Avenue<br />
would be cost‐prohibitive. If streetcar runs in the general purpose lanes, the forecasted level <strong>of</strong><br />
service on Campbell Avenue suggests that the streetcar will experience delays from general<br />
purpose traffic and may have an adverse impact on general purpose traffic as well. Unless<br />
dedicated streetcar right‐<strong>of</strong>‐way can be provided, implementation <strong>of</strong> this route will be difficult.<br />
Implementation <strong>of</strong> BRT service between UA and TIA is essentially unconstrained, assuming that<br />
BRT would run in general purpose lanes.<br />
An additional constraint is existing corridor ridership not being high enough for Very Small<br />
Starts eligibility.<br />
Implementation Plan<br />
• The success <strong>of</strong> the initial phase <strong>of</strong> the Tucson Modern Streetcar, measured by ridership as<br />
well as resulting redevelopment, will determine the viability <strong>of</strong> an extension between UA<br />
and Tucson Mall. To qualify for Very Small Starts funding, BRT should benefit at least<br />
3,000 riders.<br />
• As transit demand between UA and TIA increases, implementation <strong>of</strong> express bus should<br />
be considered prior to BRT.<br />
• Ensure that new development and redevelopment in the interim is “transit‐ready.” (See<br />
Section 9.0.)<br />
173
High Capacity Transit System Plan - <strong>Final</strong> <strong>Report</strong> June 2009<br />
HCT Implementation Strategy<br />
8.3.5 Grant Road<br />
Proposed HCT Service<br />
The proposed HCT service within the Grant Corridor is envisioned to be BRT in general purpose<br />
lanes. The proposed BRT system would extend from Oracle Road to Tanque Verde Road,<br />
approximately 7.5 miles, and would serve the Tucson Medical Center and residential areas along<br />
Grant Road. The spacing <strong>of</strong> stops would be no closer than one mile, and TSP will be required.<br />
Park‐and‐ride lots would be provided at key locations along the corridor to serve potential future<br />
BRT users.<br />
Existing and Programmed/Planned Transit Service<br />
Fixed‐route bus service is currently provided along Grant Road; there is no express service. Route<br />
9, which runs between Tanque Verde Road and Campbell Avenue, has a weekday ridership <strong>of</strong><br />
approximately 2,300 passengers. Route 20 runs from Campbell Avenue to approximately<br />
Silverbell Road. Route 9 service during both weekdays and weekends was recently extended.<br />
Weekend service was recently added to Route 20. No additional transit service within the<br />
corridor is currently planned or programmed.<br />
HCT Implementation Constraints<br />
With the exception <strong>of</strong> the Tucson Medical Center, this corridor does not have major trip<br />
generators, and employment density is at low levels currently and is not projected to increase<br />
significantly in 2040. These conditions will make it difficult to generate the transit demand<br />
throughout the day that will support BRT service. Additionally, employing effective transit<br />
preferential treatments may be difficult considering the heavy traffic volumes that this roadway<br />
carries, particularly during peak commute periods.<br />
An additional constraint is existing corridor ridership not being high enough for Very Small<br />
Starts eligibility.<br />
Implementation Plan<br />
• Monitor transit ridership demand along Grant Road to determine if and when express bus<br />
service or a BRT system will be justified. To qualify for Very Small Starts funding, BRT<br />
should benefit at least 3,000 riders.<br />
• Ensure that new development and redevelopment in the interim is “transit‐ready.” (See<br />
Section 9.0.)<br />
8.3.6 Speedway Boulevard<br />
Proposed HCT Service<br />
The proposed HCT service within the Speedway Corridor is envisioned to be BRT operating in<br />
general purpose lanes.<br />
174
High Capacity Transit System Plan - <strong>Final</strong> <strong>Report</strong> June 2009<br />
HCT Implementation Strategy<br />
The proposed BRT system would extend from Campbell Avenue to Houghton Road,<br />
approximately 10 miles, and would connect UA with residential and employment areas along<br />
Speedway Boulevard. The spacing <strong>of</strong> stops would be no closer than one mile, and TSP will be<br />
required. Park‐and‐ride lots would be provided along the corridor, particularly west <strong>of</strong> Craycr<strong>of</strong>t<br />
Road. As HCT service along Broadway Boulevard expands, implementation <strong>of</strong> a parallel BRT<br />
system along Speedway Boulevard may need to be considered.<br />
Existing and Programmed/Planned Transit Service<br />
Fixed‐route and express bus service are currently provided along Speedway Boulevard. Route 4,<br />
which runs from the Harrison Road park‐and‐ride lot to Stone Avenue, has a weekday ridership<br />
<strong>of</strong> over 5,000 passengers. Route 4 service during both weekdays and weekends was recently<br />
extended. Existing express bus service includes three routes: Foothills/Downtown Express (105X),<br />
Catalina Highway/Downtown Express (109X), and Eastside/Aero Park Express (201X). Route<br />
105X runs on Speedway Boulevard between Swan Road and Downtown; however, the only stop<br />
on Speedway Boulevard is at Campbell Avenue. Route 109X runs on Speedway Boulevard<br />
between Columbus Avenue and downtown Tucson, with one stop at Highland Avenue. Route<br />
201X runs on Speedway Boulevard between Harrison Road and Alvernon Way with three stops<br />
(Harrison Road, Kolb Road, and Alvernon Way). No additional transit service within the corridor<br />
is currently planned or programmed.<br />
HCT Implementation Constraints<br />
Considering the lack <strong>of</strong> available right‐<strong>of</strong>‐way and the prohibitively high cost <strong>of</strong> adding<br />
designated HCT lanes, particularly since most adjacent property is commercial, BRT service on<br />
Speedway Boulevard will have to run in general purpose lanes. Implementation <strong>of</strong> BRT service in<br />
general purpose lanes will be constrained primarily by land use compatibility and lack <strong>of</strong><br />
potential for TOD. Employment density along this corridor is currently at levels lower than those<br />
desired for TOD and is not projected to increase significantly in 2040. With these low densities, it<br />
will be difficult to generate the transit demand throughout the day that will support a BRT<br />
service. Additionally, employing effective transit preferential treatments will be difficult<br />
considering the heavy traffic volumes that this roadway carries, particularly during peak<br />
commute periods.<br />
Implementation Plan<br />
• Monitor transit ridership demand along Speedway Boulevard to determine if additional<br />
express bus service, particularly from Harrison Road or Houghton Road, serving UA and<br />
downtown Tucson is needed. Expansion <strong>of</strong> express bus service is likely a precursor to<br />
implementation <strong>of</strong> BRT service.<br />
• Ensure that new development and redevelopment in the interim is “transit‐ready.” (See<br />
Section 9.0)<br />
175
High Capacity Transit System Plan - <strong>Final</strong> <strong>Report</strong> June 2009<br />
HCT Implementation Strategy<br />
8.3.7 I-10 (Marana to Downtown and Vail to Downtown);<br />
I-19 (Sahuarita to Downtown)<br />
Proposed HCT Service<br />
CRT is envisioned as the long‐term HCT service connecting the Towns <strong>of</strong> Marana, Sahuarita, and<br />
Vail with Tucson. Planning for this service is being carried out by ADOT as part <strong>of</strong> a larger rail<br />
planning effort that is looking at CRT between Tucson, Phoenix, and Flagstaff. As a precursor to<br />
rail, implementation <strong>of</strong> a BRT line between Marana and Downtown Tucson, running on I‐10, has<br />
been proposed. Similarly, BRT service between Sahuarita, Raytheon, and downtown Tucson, and<br />
between Vail and downtown Tucson would likely be implemented before rail.<br />
BRT service between Marana and Downtown Tucson would provide an efficient and cost<br />
effective HCT service, particularly running on the interstate. Stations would likely be at 2‐mile or<br />
greater spacing. The line would likely begin at Marana Road with stops at Twin Peaks, Cortaro<br />
Road, Tangerine Road, and Ina Road. A Sahuarita/Tucson BRT line would likely begin at<br />
Continental Road in Green Valley and could either run on I‐19 or Old Nogales Highway. An Old<br />
Nogales Highway route would have a longer travel time but would allow for better service to<br />
Raytheon, TIA, and downtown Tucson. A Vail/Tucson BRT line could begin at Vail Road or<br />
Houghton Road, depending upon demand.<br />
Existing and Programmed/Planned Transit Service<br />
Currently, Route 104X, Marana‐Downtown Express, provides direct service from a park‐and‐ride<br />
lot in the Arizona Pavilions at Cortaro Road to downtown Tucson. Three buses run during both<br />
morning and evening commute periods. Route 110X, Rita Ranch/Downtown Express, provides<br />
three buses during the morning and evening commute period, connecting the Rita Ranch,<br />
including the UA Science and Technology Park, with downtown Tucson. Route 110X runs on I‐<br />
10. A new express route will be added in 2009/2010 connecting Green Valley and Sahuarita with<br />
Raytheon and downtown Tucson. This route will begin at a park‐and‐ride lot near the I‐<br />
19/Continental Road interchange, run on I‐19 to Sahuarita Road with a stop in Sahuarita, and<br />
then run on Nogales Highway to Raytheon and on to Downtown Tucson.<br />
HCT Implementation Constraints<br />
There are no apparent constraints with the implementation <strong>of</strong> BRT on any <strong>of</strong> these three lines.<br />
Park‐and‐ride facilities would need to be acquired in close proximity to interchanges. BRT service<br />
along Old Nogales Highway will likely run in general purpose lanes with TSP provided.<br />
Implementation Plan<br />
• Monitor express route service demand within each corridor to determine when<br />
implementation <strong>of</strong> BRT service will be justified.<br />
• Look for opportunities to generate express bus ridership, including higher density<br />
residential development within each corridor and particularly near interchanges. As<br />
176
High Capacity Transit System Plan - <strong>Final</strong> <strong>Report</strong> June 2009<br />
HCT Implementation Strategy<br />
demand increases, expand express transit service to provide shorter headways during<br />
peak commute periods as well as service during <strong>of</strong>f‐peak periods.<br />
8.4 REGIONAL HCT IMPLEMENTATION PLAN<br />
SUMMARY<br />
Table 34 summarizes the proposed implementation plan for HCT within the region. The time<br />
frames used are Near Term (0‐10 years), Mid Term (10‐20 years), and Long Term (>20 years).<br />
Table 34 HCT Implementation Plan<br />
Route<br />
HCT Mode<br />
Near Term Mid Term Long Term<br />
(0-10 yrs) (10-20 yrs) (>20 yrs)<br />
Speedway Blvd, Oracle Rd to Houghton Rd<br />
Express Bus X<br />
BRT<br />
X<br />
Broadway Blvd, Downtown to Houghton Rd BRT X<br />
Broadway Blvd, Downtown to El Con Mall Streetcar X<br />
Campbell Ave, U <strong>of</strong> A to Tucson Mall Streetcar X<br />
Campbell Ave/Kino Pkwy, U <strong>of</strong> A to TIA<br />
Express Bus X<br />
BRT<br />
X<br />
Oracle Rd, Congress St to Rancho Vistoso Blvd<br />
Express Bus X<br />
BRT<br />
X<br />
Express Bus X<br />
I-10, Marana to Downtown<br />
BRT<br />
X<br />
CRT<br />
X<br />
Express Bus X<br />
I-10, Vail to Downtown<br />
BRT<br />
X<br />
CRT<br />
X<br />
Express Bus X<br />
I-19, Sahuarita to Downtown<br />
BRT<br />
X<br />
CRT<br />
X<br />
Grant Rd, Oracle Rd to Tanque Verde Rd<br />
Express Bus X<br />
BRT<br />
X<br />
6th Ave/Nogales Hwy, Downtown to TIA BRT X<br />
6th Ave/Nogales Hwy, Downtown to Laos Transit Ctr Streetcar X<br />
Tucson Modern Street Car, Downtown to UAHSC Streetcar X<br />
8.5 CONCLUSIONS AND RECOMMENDATIONS FOR<br />
IMPLEMENTATION<br />
8.5.1 Conclusions<br />
The project team concludes the following:<br />
• Monitoring <strong>of</strong> other potential HCT corridors is needed to determine if and when the<br />
proposed HCT modes should be considered for implementation. This monitoring could<br />
occur in conjunction with the update <strong>of</strong> the RTP. Several factors (including ridership<br />
potential) should be tracked.<br />
177
High Capacity Transit System Plan - <strong>Final</strong> <strong>Report</strong> June 2009<br />
HCT Implementation Strategy<br />
8.5.2 Recommendations<br />
The project team recommends the following actions for HCT implementation:<br />
• Implement HCT according to Table 34, making use <strong>of</strong> the monitoring process described in<br />
Section 8.2 and Appendix A.<br />
178
High Capacity Transit System Plan - <strong>Final</strong> <strong>Report</strong> June 2009<br />
HCT Implementation Strategy<br />
9.0 LAND USE PLANNING FOR HCT<br />
9.1 INTRODUCTION<br />
Section 9.0 includes a review <strong>of</strong> land use policies and design standards and identification <strong>of</strong><br />
potential areas <strong>of</strong> change to local plans and codes. Land use planning activities that can be<br />
undertaken in the region to support HCT are addressed. The section presents relevant<br />
information by describing various transit‐oriented “models” for HCT corridors and station areas.<br />
The project team believes that these models include elements relevant to development <strong>of</strong> HCT in<br />
Tucson. Another advantage <strong>of</strong> the models is that they are either based on existing development or<br />
are currently being used to guide TOD and planning. This section also overviews existing city<br />
and town codes from the perspective <strong>of</strong> HCT‐supportive land use and development and provides<br />
information on financing <strong>of</strong> TOD.<br />
Section 9.0 answers the following questions:<br />
• What land use planning activities need to occur to support HCT?<br />
• What have other regions done to encourage land use that supports HCT?<br />
• How HCT‐supportive are the plans and codes <strong>of</strong> cities and towns in the region?<br />
Examples <strong>of</strong> transit‐supportive land use planning and development are contained in Figure 66<br />
through Figure 72.<br />
SOURCE: http://www.gonctd.com/pdf_dep_development/carlsbadppt.pdf<br />
Figure 66<br />
3rd Street Promenade (Santa Monica, CA)<br />
179
High Capacity Transit System Plan - <strong>Final</strong> <strong>Report</strong> June 2009<br />
HCT Implementation Strategy<br />
SOURCE: Elizabeth Moule and Stefanos Polyzoides through http://www.cnu.org<br />
Figure 67<br />
Del Mar Station TOD (Pasadena, CA)<br />
SOURCE: www.beavertonround.com<br />
Figure 68<br />
The Round at Beaverton Central TOD (outside Portland, OR)<br />
180
High Capacity Transit System Plan - <strong>Final</strong> <strong>Report</strong> June 2009<br />
HCT Implementation Strategy<br />
Figure 69<br />
Portland Streetcar Station at Portland State University<br />
SOURCE: Reconnecting America/CTOD<br />
Figure 70<br />
LRT Station TOD (Charlotte)<br />
181
High Capacity Transit System Plan - <strong>Final</strong> <strong>Report</strong> June 2009<br />
HCT Implementation Strategy<br />
SOURCE: Reconnecting America/CTOD<br />
Figure 71<br />
Streetcar Station TOD (Dallas)<br />
Before<br />
After<br />
SOURCE: www.bostonredevelopmentauthority.org and siteresources.worldbank.org<br />
Figure 72<br />
Fan Pier TOD Before and After along Silver Line BRT (Boston)<br />
182
High Capacity Transit System Plan - <strong>Final</strong> <strong>Report</strong> June 2009<br />
HCT Implementation Strategy<br />
9.2 TRANSIT-ORIENTED CORRIDOR AND STATION<br />
MODELS<br />
9.2.1 Selected HCT Station Models<br />
Transit-Oriented Development “Place Types”<br />
In Station Area Planning: How to Make Great Transit‐Oriented Places, 4 the Center for Transit‐<br />
Oriented Development (CTOD) defines a hierarchy <strong>of</strong> TOD “place types.” These are:<br />
• Regional Center. Primary centers <strong>of</strong> activity in any region. Characterized by a dense mix <strong>of</strong><br />
housing, employment, regional retail, and entertainment. Typical residential density is 75‐<br />
300 units per acre, and typical employment floor area ratio (FAR) is 5.0. Served by mix <strong>of</strong><br />
transit modes, including HCT. Typical peak transit frequency is less than 5 minutes.<br />
Examples are downtown San Francisco, Boston, and Denver.<br />
• Urban Center. Mix <strong>of</strong> housing, employment, retail, and entertainment. Usually slightly less<br />
dense than Regional Centers. Commuter hubs. Historic character preserved. Typical<br />
residential density is 50‐150 units per acre, and typical employment FAR is 2.5. Multiple<br />
transit options, including HCT. Typical peak transit frequency is 5‐15 minutes. Examples<br />
are downtown Baltimore, Pasadena (CA), and the Texas Medical Center in Houston.<br />
• Suburban Center. Mix <strong>of</strong> housing, employment, retail, and entertainment with densities<br />
similar to those <strong>of</strong> Urban Centers. Can be both an origin and a destination for commuters.<br />
Development tends to be newer than in Urban Centers. Less mix <strong>of</strong> uses than in Urban<br />
Centers. Typical residential density is 35‐100 units per acre, and typical employment FAR<br />
is 4.0. May be served by HCT. Typical peak transit frequency is 5‐15 minutes. Examples<br />
are Evanston (IL), Stamford (CT), and Silver Spring (MD).<br />
• Transit Town Center. Local‐serving centers <strong>of</strong> economic and community activity. Less mix<br />
<strong>of</strong> uses than in Suburban Centers. Typical residential density is 20‐75 units per acre, and<br />
typical employment FAR is 2.0. Variety <strong>of</strong> transit modes, including commuter service to<br />
regional jobs. Less secondary transit service and lower housing density than in Regional<br />
4<br />
Station Area Planning: How to Make Great Transit‐Oriented Places. Sponsored by the Federal Transit<br />
Administration. Reconnecting America’s Center for Transit‐Oriented Development, Oakland, CA, February<br />
2008. Available at http://reconnectingamerica.org/public/display_asset/tod202.<br />
183
High Capacity Transit System Plan - <strong>Final</strong> <strong>Report</strong> June 2009<br />
HCT Implementation Strategy<br />
Centers, Urban Centers, and Suburban Centers. Typical peak transit frequency is 15‐30<br />
minutes. Examples are Winchester, MA (outside <strong>of</strong> Boston), and Hillsboro, OR (outside <strong>of</strong><br />
Portland).<br />
• Urban Neighborhood. Primarily residential neighborhoods. Well‐connected to Regional<br />
Centers and Urban Centers. Moderate to high densities. Housing usually mixed with<br />
local‐serving retail. Commercial uses limited to small businesses and some industry.<br />
Typical residential density is 40‐100 units per acre, and typical employment FAR is 1.0.<br />
Transit may or may not be a focal point as in Regional Centers, Urban Centers, Suburban<br />
Centers, and Transit Town Centers. Typical peak transit frequency is 5‐15 minutes.<br />
Examples are Portland’s Pearl District, Greenwich Village in New York City, and<br />
University City in Philadelphia.<br />
• Transit Neighborhood. Primarily residential neighborhoods. Served by HCT at one location.<br />
Low to moderate densities. Economic activity not concentrated around transit stations.<br />
May include retail nodes but residential density <strong>of</strong>ten is not high enough to support much<br />
local‐serving retail. May <strong>of</strong>fer significant development opportunities. Secondary transit<br />
service is less frequent and less well‐connected. Typical residential density is 20‐50 units<br />
per acre, and typical employment FAR is 1.0. Typical peak transit frequency is 15‐30<br />
minutes. Examples are Plano, TX (outside <strong>of</strong> Dallas), Barrio Logan in San Diego, and<br />
Ohlone‐Chynoweth, CA (outside San Jose).<br />
• Special Use/Employment District. Often single‐use. May be low‐ to moderate‐density<br />
employment centers or focused around an institution or entertainment venue. Economic<br />
activity not concentrated around transit stations. Development is typically more recent.<br />
May be significant opportunities for mixed‐use development and regional connections.<br />
Secondary transit service is infrequent and focused on stations. Typical residential density<br />
is 50‐150 units per acre, and typical employment FAR is 2.5. Typical peak transit<br />
frequency is 15‐30 minutes. Examples are South <strong>of</strong> Market in San Francisco, Camden<br />
Station in Baltimore, and Portland’s South Waterfront.<br />
• Mixed‐Use Corridor. Have no distinct center but are a focus <strong>of</strong> economic and community<br />
activity. Mix <strong>of</strong> moderate‐density uses. Housing is typically more recent along the<br />
corridor, with older housing just outside. Good opportunities for infill and mixed‐use<br />
development. Typical residential density is 25‐60 units per acre, and typical employment<br />
FAR is 2.0. May be developed along streetcar, BRT, or premium bus lines with closely<br />
spaced stops. Typical peak transit frequency is 5‐15 minutes. Examples are International<br />
Boulevard in Oakland, Washington Street in Boston, and University Avenue in St. Paul.<br />
For each <strong>of</strong> these place types, CTOD identifies retail characteristics, describes major planning and<br />
development challenges, and discusses the typical housing mix for new development. Target<br />
densities and intensities are provided for different kinds <strong>of</strong> development (included mixed‐use).<br />
Open spaces (e.g., Plazas and Small Parks) are discussed. A detailed TOD planning checklist is<br />
also provided, as are many photos <strong>of</strong> existing TODs.<br />
184
High Capacity Transit System Plan - <strong>Final</strong> <strong>Report</strong> June 2009<br />
HCT Implementation Strategy<br />
Transit-Oriented Development “Typology”<br />
CTOD presents a “typology” <strong>of</strong> TODs in The New Transit Town: Best Practices in Transit‐Oriented<br />
Development. 5 The typology consists <strong>of</strong> the follow TOD types:<br />
• Urban Downtown. Primary <strong>of</strong>fice center with urban entertainment and mix <strong>of</strong> uses.<br />
Minimum housing density is typically 60 units per acre. Housing types include<br />
multifamily and l<strong>of</strong>ts. Regional connectivity is high. Typically a transportation hub. Any<br />
transit mode may be found. Transit frequencies typically less than 10 minutes.<br />
• Urban Neighborhood. Residential area with retail and commercial. Minimum housing<br />
density is typically 20 units per acre. Housing types include multifamily, l<strong>of</strong>t, townhome,<br />
and single‐family. Medium access to downtown, with sub‐regional circulation. Typical<br />
transit modes are LRT, streetcar, rapid bus (BRT and/or express bus), and local bus.<br />
Transit frequencies typically 10 minutes during peak and 15 minutes during <strong>of</strong>f‐peak.<br />
• Suburban Center. Primary <strong>of</strong>fice center with urban entertainment and mix <strong>of</strong> uses.<br />
Minimum housing density is typically 50 units per acre. Housing types include multifamily,<br />
l<strong>of</strong>t, and townhome. High access to downtown. Sub‐regional hub. Typical transit<br />
modes are rail, streetcar, rapid bus, local bus, and paratransit. Transit frequencies typically<br />
10 minutes during peak and 10‐15 minutes during <strong>of</strong>f‐peak.<br />
• Suburban Neighborhood. Residential area with neighborhood retail and local <strong>of</strong>fice.<br />
Minimum housing density is typically 12 units per acre. Housing types include<br />
multifamily, townhome, and single family. Medium access to suburban center. Access to<br />
downtown. Typical transit modes are LRT, rapid bus, local bus, and paratransit. Transit<br />
frequencies typically 20 minutes during peak and 30 minutes during <strong>of</strong>f‐peak.<br />
• Neighborhood Transit Zone. Residential area with neighborhood retail. Minimum housing<br />
density is typically 7 units per acre. Housing types include townhome and single family.<br />
Low regional connectivity. Typical transit modes are local bus and paratransit. Transit<br />
frequencies typically 25‐30 minutes.<br />
• Commuter Town Center. Retail center with residential. Minimum housing density is<br />
typically 12 units per acre. Housing types include multifamily, townhome, and single<br />
5<br />
Dittmar, H., and G. Ohland, Eds. The New Transit Town: Best Practices in Transit‐Oriented Development.<br />
Sponsored by Reconnecting America’s Center for Transit‐Oriented Development. Island Press,<br />
Washington, D.C., 2004. Available by purchase only.<br />
185
High Capacity Transit System Plan - <strong>Final</strong> <strong>Report</strong> June 2009<br />
HCT Implementation Strategy<br />
family. Low regional connectivity. Typical transit modes are commuter rail and rapid bus.<br />
Transit typically provided during peak only.<br />
“Transit District” and “Transit Village”<br />
In Developing Around Transit: Strategies and Solutions That Work, 6 the Urban Land Institute (ULI)<br />
devotes a chapter to “transit district” planning. A transit district is defined as an area that extends<br />
at least 1/4 mile (a five‐ to 10‐minute walk) from a transit station. Accordingly, a major focus <strong>of</strong><br />
the transit district is on areas beyond the immediate station area. ULI identifies the following<br />
elements <strong>of</strong> transit district planning:<br />
• The arrangement <strong>of</strong> land uses (mix and density) concentrates activity near transit.<br />
• The arrangement <strong>of</strong> land uses both generates ridership and supports transit users.<br />
• The design and mix <strong>of</strong> uses within walking distance <strong>of</strong> stations must promote walking.<br />
• The design and mix <strong>of</strong> uses within cycling distance <strong>of</strong> stations must promote cycling.<br />
ULI references Peter Calthorpe’s “transit village” concept, which reflects the following principles:<br />
• Growth should be compact and transit‐supportive.<br />
• Commercial, residential, employment, open space, and civic uses should be placed within<br />
walking distance <strong>of</strong> transit stops.<br />
• Street networks should be pedestrian‐friendly and connect local destinations.<br />
• A mix <strong>of</strong> housing types and densities should be provided.<br />
• Habitats and open space should be preserved.<br />
• Buildings and neighborhoods should be oriented to public spaces.<br />
• Infill and redevelopment along transit corridors should be encouraged.<br />
6<br />
Dunphy, R.T., R. Cervero, F.C. Dock, M. McAvey, D.R. Porter, and C. J. Swenson. Developing Around<br />
Transit: Strategies and Solutions That Work. Urban Land Institute, Washington, D.C., 2004. Available by<br />
purchase only.<br />
186
High Capacity Transit System Plan - <strong>Final</strong> <strong>Report</strong> June 2009<br />
HCT Implementation Strategy<br />
Figure 73, developed by the City <strong>of</strong> Austin, 7 illustrates Calthorpe’s transit village concept by<br />
comparing a preferred development form to a discouraged development form.<br />
SOURCE: City <strong>of</strong> Austin<br />
Figure 73<br />
Transit Village Concept<br />
7<br />
Transit‐Oriented Development (TOD) Guidebook. City <strong>of</strong> Austin Neighborhood Planning and Zoning<br />
Department, Austin, TX, April 2006. Available at<br />
http://www.ci.austin.tx.us/planning/tod/tod_documents.htm.<br />
187
High Capacity Transit System Plan - <strong>Final</strong> <strong>Report</strong> June 2009<br />
HCT Implementation Strategy<br />
“Transit Station Communities”<br />
“Transit station communities” is the Puget Sound Regional Council’s term for development<br />
around transit that combines walkability with livability. 8 Walkability focuses on convenient walk<br />
access to and from transit service, while livability focuses on providing a variety <strong>of</strong> job, housing,<br />
and recreation opportunities. The principles behind a transit station community are as follows:<br />
• Compact, mixed‐use development<br />
• Site and design the station to maximize development opportunities.<br />
• Establish a compact mix <strong>of</strong> land uses within a defined station area.<br />
• Establish a range <strong>of</strong> complementary land uses within the station area.<br />
• Concentrate commercial retail close to the station facility.<br />
• Establish an employment base close to the station facility.<br />
• Promote residential development opportunities near transit facilities.<br />
• Encourage infill and/or redevelopment <strong>of</strong> under‐developed land.<br />
• Encourage the mix <strong>of</strong> uses both within buildings and on adjacent sites.<br />
• Encourage pedestrian‐oriented land uses in the station area.<br />
• Locate public buildings within the station area.<br />
• Establish adequate park space in a station area.<br />
• Consider the importance <strong>of</strong> land uses outside <strong>of</strong> the defined station area.<br />
• Protect and preserve important natural features.<br />
• Protect and preserve historic character.<br />
• Pedestrian‐friendly design<br />
• Identify and enhance “pedestrian streets” within the station area.<br />
• Design street right‐<strong>of</strong>‐way for pedestrian travel.<br />
• Establish continuous and uninterrupted walking routes.<br />
• Ensure safe, convenient, and frequent street crossings.<br />
• Design intersections that balance pedestrian and auto movements.<br />
• Locate building entrances close to public walkways.<br />
8<br />
http://www.psrc.org/projects/tod/index.htm<br />
188
High Capacity Transit System Plan - <strong>Final</strong> <strong>Report</strong> June 2009<br />
HCT Implementation Strategy<br />
• Orient commercial establishments based on their different needs.<br />
• Design parking areas for pedestrian movement.<br />
• Establish a coordinated system <strong>of</strong> bikeways.<br />
• Provide attractive, safe, and convenient transit stops.<br />
• Provide pedestrian amenities within the station area.<br />
• Parking and access management<br />
• Carefully control the total supply <strong>of</strong> parking.<br />
• Use parking charges to control demand for parking.<br />
• Keep the size <strong>of</strong> surface lots small.<br />
• Design and plan surface lots to convert to other uses over time.<br />
• Encourage the development <strong>of</strong> parking structures.<br />
• Encourage development on street‐side edges <strong>of</strong> parking structures.<br />
• Carefully plan and design park‐and‐ride lots.<br />
• Locate parking lots behind buildings or in the interior <strong>of</strong> a block.<br />
• Design parking lots and garages with pedestrians in mind.<br />
• Provide adequate bicycle parking.<br />
• Encourage joint use <strong>of</strong> parking spaces.<br />
• Support the creation <strong>of</strong> public community parking lots.<br />
• Provide on‐street parking on pedestrian streets.<br />
• Ensure convenient access for transit vehicles.<br />
“Transit-Oriented Development” vs. “Transit-Ready Development”<br />
The Charlottesville‐Albemarle (Virginia) Metropolitan Planning Organization (MPO) contrasts<br />
TOD and “transit‐ready development” to distinguish areas that already have premium transit<br />
from those that will have it in the future.<br />
The MPO’s definition <strong>of</strong> a TOD is:<br />
“...a mixed‐use residential and commercial area focused around a major transit station. It is<br />
designed to maximize access by transit, walking, and bicycling. A TOD has a center with a<br />
bus or rail station surrounded by relatively high‐density development for a few blocks<br />
around each station or along the route.<br />
“...As part <strong>of</strong> a coordinated land use and transportation program, a TOD encourages transit<br />
ridership. But, in addition to shifting car trips to transit, a TOD increases accessibility and<br />
transportation options by mixing residential and commercial buildings, reduces the need for<br />
automobile use and excessive parking lots, encourages walking and cycling (both for single<br />
trips and as part <strong>of</strong> a transit trip), and allows some households to reduce their car<br />
ownership by providing real options for getting around.”<br />
189
High Capacity Transit System Plan - <strong>Final</strong> <strong>Report</strong> June 2009<br />
HCT Implementation Strategy<br />
The MPO’s definition <strong>of</strong> a “transit‐ready development” is:<br />
“While transit‐oriented development is built around existing transit stations, transit‐ready<br />
development prepares for future transit expansion with neighborhoods and road networks<br />
designed for maximum efficiency <strong>of</strong> all transportation modes. Elements <strong>of</strong> transit‐ready<br />
communities include a mix <strong>of</strong> land uses, pedestrian‐friendly layout with sidewalks buffered<br />
from traffic by planting strips with street trees, appropriate locations and routes for transit<br />
(either incorporated into current development or factored into future plans), an ʺurbanʺ<br />
street grid (providing plenty <strong>of</strong> connections instead <strong>of</strong> cul‐de‐sacs), public facilities designed<br />
as transit targets, and appropriate housing densities to support transit.<br />
“Working with area transit providers, transit‐ready developers could also help subsidize<br />
peak‐hour commuter express buses in the early years in order to provide a competitive<br />
market advantage and allow families to reduce the number <strong>of</strong> cars required.”<br />
Additional, detailed information about transit‐ready development is available in Capital Metro’s<br />
Transit‐Ready Development Guide. 9<br />
9.2.2 Selected Transit Corridor Models<br />
“Main Streets”<br />
There are multiple uses <strong>of</strong> the designation “Main Streets.” Metro (Portland, OR) 10 defines a Main<br />
Street as an area type that provides neighborhood retail and services, sometimes <strong>of</strong>fers a<br />
specialized market (like antiques) that draws regional trips, and is characterized by a strong<br />
business and civic community. The Maryland State Highway Administration’s usage is not<br />
accompanied by a formal definition, but the suggested definition is that a Main Street is a central<br />
road through a community. 11 In general the designation has primarily an economic development<br />
9<br />
Transit‐Ready Development Guide. Capital Metro, Austin, TX, 2008. Available at<br />
http://allsystemsgo.capmetro.org/downloads/Transit%20Ready%20Development%20Guide%202008.pdf.<br />
10<br />
Regional Mainstreets: An Implementation Strategy to Promote Main Street and Corridor Development. Metro,<br />
Portland, OR, July 1995.<br />
190
High Capacity Transit System Plan - <strong>Final</strong> <strong>Report</strong> June 2009<br />
HCT Implementation Strategy<br />
focus. PAG’s MainStreet Program, for example, is intended to manage the impacts <strong>of</strong> construction<br />
on small businesses.<br />
“Great Streets”<br />
The Great Streets Initiative 12 in Washington, D.C., is a corridor improvement program based on<br />
the book Great Streets by Allan Jacobs. A “Great Street” is defined by the District Department <strong>of</strong><br />
Transportation (DDOT) as follows:<br />
“Great Streets are vital to great cities. A Great Street promotes both community and<br />
commerce. It is an inviting place where people want to visit, shop, walk, and enjoy. A Great<br />
Street supports and strengthens existing local businesses while attracting improved and<br />
expanded retail services. A Great Street is unique and memorable—it tells a story about its<br />
adjacent communities. A Great Street is safe and comfortable to walk along and provides<br />
many different ways <strong>of</strong> movement <strong>of</strong> accessibility—by foot, bike, bus, streetcar, subway, or<br />
car.”<br />
The guiding principles <strong>of</strong> the Great Streets Initiative are as follows:<br />
• Energize. Change the public and market perceptions <strong>of</strong> the corridors through streetscape<br />
and transportation improvements and reposition them as one <strong>of</strong> the best places to live and<br />
work, consequently expanding the cityʹs tax base.<br />
• Refresh. Transform roadways and intersections into environmentally friendly and usable<br />
community open spaces.<br />
• Move. Change the existing ʺcorridorsʺ function from major vehicular arterials into streets<br />
that sustain healthy pedestrian and transit based activities and consequently support the<br />
cityʹs air quality and transportation agendas.<br />
• Distinguish. Transform each corridor into a place that is memorable, compelling, and<br />
desirable to visit again and again.<br />
11<br />
When Main Street is a State Highway: Blending Function, Beauty, and Identity: A Handbook for Communities<br />
and Designers. Maryland Department <strong>of</strong> Transportation, State Highway Administration, Annapolis, MD,<br />
2001.<br />
12<br />
www.greatstreetsdc.com<br />
191
High Capacity Transit System Plan - <strong>Final</strong> <strong>Report</strong> June 2009<br />
HCT Implementation Strategy<br />
• Care. Reposition the street as a vital neighborhood asset, and thus increase the<br />
communityʹs stake in its design, upkeep, and stewardship.<br />
The Great Streets Initiative includes several performance measures tied to the above principles.<br />
“Complete Streets”<br />
Complete Streets 13 is a movement that emphasizes use <strong>of</strong> streets by multiple transportation<br />
modes and types <strong>of</strong> travelers. Members <strong>of</strong> the Complete Streets coalition’s steering committee<br />
include the American Planning <strong>Association</strong>, the American Public Transportation <strong>Association</strong>, the<br />
Institute <strong>of</strong> Transportation Engineers, and the National Center for Bicycling and Walking. The<br />
definition <strong>of</strong> “complete streets” is as follows:<br />
“Complete streets are designed and operated to enable safe access for all users. Pedestrians,<br />
bicyclists, motorists, and transit riders <strong>of</strong> all ages and abilities must be able to safely move<br />
along and across a complete street.<br />
“Creating complete streets means transportation agencies must change their orientation<br />
toward building primarily for cars. Instituting a complete streets policy ensures that<br />
transportation agencies routinely design and operate the entire right <strong>of</strong> way to enable safe<br />
access for all users. Places with complete streets policies are making sure that their streets<br />
and roads work for drivers, transit users, pedestrians, and bicyclists, as well as for older<br />
people, children, and people with disabilities.<br />
“Since each complete street is unique, it is impossible to give a single description. But<br />
ingredients that may be found on a complete street include sidewalks, bike lanes (or wide<br />
paved shoulders), special bus lanes, comfortable and accessible transit stops, frequent<br />
crossing opportunities, median islands, accessible pedestrian signals, curb extensions, and<br />
more. A complete street in a rural area will look quite different from a complete street in a<br />
highly urban area. But both are designed to balance safety and convenience for everyone<br />
using the road.”<br />
13<br />
www.completestreets.org<br />
192
High Capacity Transit System Plan - <strong>Final</strong> <strong>Report</strong> June 2009<br />
HCT Implementation Strategy<br />
“World Class Streets”<br />
World Class Streets: Remaking New York’s Public Realm 14 is a 2008 report by the New York City<br />
Department <strong>of</strong> Transportation (NYCDOT) that outlines a strategy for improving and managing<br />
public places (including streets and plazas) in the city. The vision behind the World Class Streets<br />
initiative is to create streets that are “world class” on the scale <strong>of</strong> the Champs‐Élysées in Paris.<br />
The World Class Street strategies take inspiration globally and include the following:<br />
• A plaza program<br />
• World‐class boulevards<br />
• Complete streets projects and design standards<br />
• A public art program<br />
• Use <strong>of</strong> new streetscape materials<br />
• A coordinated street furniture program<br />
• Weekend pedestrian and cycling streets<br />
Features <strong>of</strong> the city that enable NYCDOT’s vision to be achieved consist <strong>of</strong> high densities, a welldeveloped<br />
public transportation network, high volumes <strong>of</strong> pedestrians, and a street grid that is<br />
efficient and includes streets with space to accommodate many different users.<br />
9.2.3 Summary <strong>of</strong> Station and Corridor Models<br />
What is evident in reviewing the above descriptions <strong>of</strong> transit corridor and station models are the<br />
commonalities. The common elements <strong>of</strong> the models are:<br />
• Recognition <strong>of</strong> a variety <strong>of</strong> station types and station environments (<strong>of</strong>ten presented as a<br />
hierarchy)<br />
• Walkability and pedestrian focus<br />
• Mix <strong>of</strong> uses<br />
• Densities and intensities that encourage transit ridership<br />
• Management <strong>of</strong> parking and access to promote alternative mode use<br />
14<br />
http://www.nyc.gov/html/dot/downloads/pdf/World_Class_Streets_Gehl_08.pdf<br />
193
High Capacity Transit System Plan - <strong>Final</strong> <strong>Report</strong> June 2009<br />
HCT Implementation Strategy<br />
The models also recognize that TOD and transit‐oriented planning are tied to livability, economic<br />
development, and community pride. These concepts can be expressed through investments in<br />
sustainability (such as solar‐powered bus stop lighting), public art, landscaping, and<br />
streetscaping.<br />
9.3 REVIEW OF PLANS AND CODES IN THE<br />
REGION<br />
The following sections summarize a high‐level review <strong>of</strong> general plans, land development codes,<br />
and other planning documents to identify elements that support HCT. Areas for potential HCTsupportive<br />
amendments to these documents are also suggested. Detailed review comments can<br />
be found in Appendix B.<br />
9.3.1 Summary <strong>of</strong> Plan and Code Review<br />
Local governments in the region are HCT‐ and TOD‐supportive to a varying degree. Specific HCT<br />
modes are not identified, but characteristics <strong>of</strong> HCT‐ and TOD‐supportive development (such as<br />
mix <strong>of</strong> uses and increased densities and intensities) are identified.<br />
The project team believes that there is a need for a regional HCT station classification scheme to<br />
ensure consistent HCT “branding” and equitable investment system‐wide while allowing<br />
individual HCT stations to be compatible with city and town goals, constraints, and identity.<br />
Section 9.2.1 provided examples <strong>of</strong> station classification schemes that have been developed<br />
elsewhere and could serve as models for the Tucson region. Some <strong>of</strong> these models accounted for<br />
typical densities and intensities, market area or scale, amount <strong>of</strong> transit service provided, and<br />
regional connectivity. Some evoked a sense <strong>of</strong> place by describing TODs as “districts,” “villages,”<br />
or “communities.” A simple regional HCT station classification scheme that accounts for both<br />
facets is as follows:<br />
• Downtown TOD District. An example is downtown Tucson. HCT stations may be closely<br />
spaced in the Downtown TOD District, so more than one HCT station area may be<br />
included. Densities, intensities, and building heights are the highest in the region. HCT<br />
stations can include a wide‐range <strong>of</strong> amenities and may be the largest in the system. One<br />
<strong>of</strong> the HCT stations in a given district may be a transit center.<br />
• Urban TOD District. Examples are 6th Avenue South at the VA Hospital and Broadway<br />
Boulevard at El Con Mall. The HCT station may be tied to a transit center or park‐and‐ride<br />
lot. Densities, intensities, and building heights could be as high as those in portions <strong>of</strong> the<br />
Downtown TOD District.<br />
• Suburban TOD District. Examples are Broadway Boulevard/Houghton Road and Oracle<br />
Road/Tangerine Road. The HCT station may be tied to a transit center and/or park‐andride<br />
lot.<br />
194
High Capacity Transit System Plan - <strong>Final</strong> <strong>Report</strong> June 2009<br />
HCT Implementation Strategy<br />
• Special Use TOD District. An example is UA. This category <strong>of</strong> HCT station is for unique<br />
generators with unique characteristics.<br />
These classifications should be sensitive to HCT mode. On one end <strong>of</strong> the spectrum, CRT stations<br />
are widely spaced and likely to include significant parking areas, so CRT station areas may be<br />
relatively large. On the other end <strong>of</strong> the spectrum, streetcar stations are closely spaced and likely<br />
to experience significant walk access, so station areas may be relatively small. Recommended<br />
HCT station area sizes are a 1/2‐mile radius for CRT and LRT, a 1/4‐mile radius for BRT, and a<br />
1/8‐mile radius for streetcar.<br />
The above classifications are not land use designations or zoning designations. Each city and town can<br />
add one or more new land use or zoning designations to support the regional HCT station<br />
classification scheme. Specific densities, intensities, design requirements, and neighborhood<br />
buffer requirements can be specified in the general plan and/or land use code.<br />
Earlier discussion in Section 9.2 suggests that cities and towns have several options for<br />
implementing land use and/or zoning designations associated with the regional HCT station<br />
classification scheme. These options include the following:<br />
• Applying existing or amended land use and zoning designations inside HCT station areas<br />
• Developing one or more new land use designations expressly for TODs<br />
• Developing one or more new zoning designations or overlays expressly for TODs<br />
• Developing one or more land use designations for mixed‐use developments and applying<br />
the designations inside HCT station areas<br />
• Developing one or more zoning designations or overlays for mixed‐use developments and<br />
applying the designations inside HCT station areas<br />
• Various combinations <strong>of</strong> the above options<br />
As stated earlier, the benefit <strong>of</strong> implementing a TOD‐specific land use or zoning designation and a<br />
mixed‐use land use or zoning designation is the ability to clearly distinguish sites that are within<br />
walking distance <strong>of</strong> HCT stations from those that are not. A site within walking distance <strong>of</strong> an<br />
HCT station (and thus receiving the TOD‐specific designation) may receive additional incentives<br />
or take advantage <strong>of</strong> a mode split reduction when traffic impact studies are prepared, transit<br />
infrastructure is provided, transportation demand management (TDM) programs are<br />
implemented, and so forth.<br />
Other observations about local cities’ and towns’ plans and codes are as follows:<br />
• The conflict between increasing building heights (i.e., increasing densities and intensities)<br />
and preserving scenic views is a consideration for all <strong>of</strong> the reviewed cities and towns.<br />
While higher densities and intensities around HCT corridors is important for generating<br />
HCT ridership and successful TODs, managing design elements such as massing (see the<br />
“stepped back” building floors shown in Figure 74) and parking supply and configuration<br />
may result in TOD that is sensitive to preserving scenic views.<br />
195
High Capacity Transit System Plan - <strong>Final</strong> <strong>Report</strong> June 2009<br />
HCT Implementation Strategy<br />
• Cost estimates for HCT stations include the basic station components (e.g., the shelter<br />
structure and real‐time passenger information displays). It would be up to local<br />
governments to select public art or otherwise tailor the stations to reflect the local<br />
community. This could present an opportunity for local governments to enhance<br />
community aesthetics, develop TODs, explore solar power applications, or explore<br />
activities that support local goals.<br />
• The positive environmental benefits <strong>of</strong> increased transit use via TOD and HCT can be<br />
enhanced by tying TOD to green building initiatives<br />
• An appropriate perspective to take for long‐term HCT projects is that <strong>of</strong> implementing<br />
“transit‐ready development.”<br />
Figure 74<br />
Building with Upper Floors “Stepped Back” from the Street (Tucson)<br />
9.4 HCT DEVELOPMENT FINANCIAL INCENTIVES<br />
In addition to zoning and development codes, several methods <strong>of</strong> encouraging TOD from a<br />
financial perspective may be applied. These methods have been used in other jurisdictions and<br />
the project team believes that they may be effective in Tucson as well. However, it should be<br />
noted that, if such a measures were implemented, a detailed analysis on the impact to HCT<br />
196
High Capacity Transit System Plan - <strong>Final</strong> <strong>Report</strong> June 2009<br />
HCT Implementation Strategy<br />
capital and operating funding would be required as property taxes are considered as a possible<br />
revenue source.<br />
Tax incentive zones for transit may be formed where a permanent reduction in property tax rates<br />
would be applied to mixed‐use developments in HCT corridors or around transit stations. This<br />
could result in a greater number <strong>of</strong> people having immediate access to HCT facilities and thus an<br />
increase in ridership.<br />
Tax abatements could be applied to mixed‐use developments in HCT corridors or around<br />
transition stations. These could be structured to eliminate property taxes in these areas for a<br />
period <strong>of</strong> time; or could be structured to have reduced property taxes initially with a return to full<br />
property tax rates being applied gradually over a period <strong>of</strong> time. It should be noted that if such a<br />
measure were implemented, a detailed analysis on the impact to HCT capital and operating<br />
funding would be required as property taxes are considered as a revenue source.<br />
Figure 75 illustrates components <strong>of</strong> one transit agency’s TOD assistance program.<br />
197
High Capacity Transit System Plan - <strong>Final</strong> <strong>Report</strong> June 2009<br />
HCT Implementation Strategy<br />
TOD Infrastructure & Housing Support Program<br />
The TOD Infrastructure and Housing Support Program—or TOD Bond Program—will provide financial assistance<br />
for pedestrian improvements, bicycle facilities, housing projects, and parking facilities within 1/4 mile <strong>of</strong> transit<br />
stations. Specific features <strong>of</strong> this program include:<br />
• Multi-year funding to finance pedestrian improvements, bicycle facilities, housing projects, and parking<br />
facilities in mixed use developments located within 1/4 mile <strong>of</strong> a transit station.<br />
• At least 25% <strong>of</strong> the units in housing projects must be affordable to households earning up to 80% <strong>of</strong> the<br />
area median income.<br />
• Priority will be given to projects that are part <strong>of</strong>, or proximate to, an existing or proposed high quality TOD.<br />
Commercial Area Transit Node Housing Program<br />
• Will provide $10M over 5 years to finance housing in commercial areas within 1/4 mile <strong>of</strong> transit.<br />
• At least 51% <strong>of</strong> the housing units must be affordable @ 80% <strong>of</strong> the area median income.<br />
Chapter 40R: Smart Growth Incentive Zoning<br />
Will provide direct payments to municipalities that adopt smart growth overlay zoning districts in downtowns,<br />
commercial centers, and around transit stations and issue building permits in these areas to create new<br />
opportunities for housing. Chapter 40R [state legislation] essentially provides an incentive for rezoning around<br />
transit stations for higher densities, mixed use, reduced parking, and other changes to facilitate TOD.<br />
SOURCE: www.mbta.com<br />
Figure 75<br />
Priority Development Fund<br />
MassHousing, the state's affordable housing bank, lends money at rates below the conventional market to support<br />
housing opportunities for low-and moderate-income residents <strong>of</strong> the Commonwealth. Recently, MassHousing has<br />
established two important funds to help spur transit-oriented development:<br />
• Financing for Affordable Rental Housing: Funded by MassHousing and administered by the Department <strong>of</strong><br />
Housing and Community Development (DHCD), this program has earmarked $22 million to fund the<br />
development <strong>of</strong> new affordable rental housing located near transit stations.<br />
• Planning Assistance for Housing Production: Also funded by MassHousing and administered by the DHCD,<br />
this program provides grants <strong>of</strong> up to $50,000 per project for financial assistance for planning, education,<br />
outreach, financial feasibility analyses and other planning activities related to increasing housing production<br />
through planning and zoning changes.<br />
• MassHousing is also working with the MBTA to provide construction and permanent financing for housing<br />
development on MBTA-owned or controlled sites.<br />
Massachusetts Bay Transportation Authority TOD Financing Programs (Boston)<br />
9.5 CONCLUSIONS AND RECOMMENDATIONS FOR<br />
LAND USE PLANNING<br />
9.5.1 Conclusions<br />
The project team concludes the following:<br />
198
High Capacity Transit System Plan - <strong>Final</strong> <strong>Report</strong> June 2009<br />
HCT Implementation Strategy<br />
• Many sources <strong>of</strong> information about HCT‐supportive land use planning exist and are<br />
available to local governments in the Tucson region. Some <strong>of</strong> these sources are referenced<br />
in this report.<br />
• The general plans, land use codes, and development standards <strong>of</strong> the cities and towns<br />
affected by HCT include HCT‐ and TOD‐supportive components, but opportunities exist<br />
to refine and target the components and requirements. One such opportunity is<br />
development <strong>of</strong> a regional HCT station classification scheme.<br />
9.5.2 Recommendations<br />
The project team recommends the following actions for HCT implementation:<br />
• The local governments in the region should consider revising their general plans, land use<br />
codes, and design standards to add or enhance HCT‐ and TOD‐supportive components as<br />
described in Section 9.2. To maximize FTA project ratings, the region must have transitsupportive<br />
land use policies and, ideally, land use patterns in place at the time an<br />
application for federal funding is submitted. The most urgent need for revisions is in the<br />
Broadway Boulevard and 6th Avenue/Nogales Highway corridors, where HCT may be<br />
implemented in the near term.<br />
• The region should develop an HCT station classification scheme as discussed in Section<br />
9.2.1. Station‐area overlay zoning tied to the station classifications is a means <strong>of</strong> locally<br />
implementing HCT‐ and TOD‐supportive densities, intensities, and design standards and<br />
ensuring that new developments near potential HCT stations are “HCT‐ready” to the<br />
extent possible. The classification scheme suggested in Section 9.2.1 is simple enough to be<br />
used as a starting point. Regional coordination will be needed to determine which<br />
classifications are appropriate for specific HCT station areas, and regional cooperation will<br />
be needed to ensure that station areas are “HCT‐ready.”<br />
199
High Capacity Transit System Plan - <strong>Final</strong> <strong>Report</strong> June 2009<br />
HCT Implementation Strategy<br />
10.0 NEXT STEPS<br />
Recommended next steps for the Tucson region are as follows:<br />
• The near term projects identified in Table 34 should be added to the RTP as part <strong>of</strong> the<br />
2009 RTP update.<br />
• PAG should incorporate the recommended HCT monitoring process into the RTP update<br />
process beginning with the next update <strong>of</strong> the RTP. Monitoring could begin the year<br />
before the update is drafted so that HCT projects can be incorporated into the updated<br />
RTP.<br />
• Local governments in the region should form a task force to develop a regional HCT<br />
classification scheme.<br />
• Local governments in the region should review general plans, land use codes, and design<br />
standards to add or enhance HCT‐ and TOD‐supportive components. Affected<br />
components include future land use designations, zoning designations, and funding<br />
sources.<br />
• Move forward with near‐term Broadway Boulevard BRT development as the first HCT<br />
route.<br />
• Identify an agency or local government to take the lead in implementation.<br />
• Establish coordination with FTA Region IX staff.<br />
• Begin the process <strong>of</strong> conducting an Alternatives Analysis.<br />
• Begin the process <strong>of</strong> including the project in the RTP.<br />
• Begin lining up the local match for Very Small Starts.<br />
200
APPENDIX A:<br />
Steps in HCT<br />
Implementation<br />
Monitoring Process
High Capacity Transit System Plan - <strong>Final</strong> <strong>Report</strong> June 2009<br />
Appendix A<br />
Steps in HCT Implementation Monitoring Process<br />
The following tables are referenced in Section 8.2 and are based on the transit quality <strong>of</strong> service<br />
(QOS) framework recommended in the second edition <strong>of</strong> the Transit Capacity and Quality <strong>of</strong> Service<br />
Manual (TCQSM). The tables provide QOS thresholds that serve as triggers for potential<br />
investment in HCT or features associated with HCT. The project team notes that the term ʺquality <strong>of</strong><br />
serviceʺ in the tables is intended to represent the rider perspective rather than the transit agency<br />
perspective, so the use <strong>of</strong> letter grades from A to F connotes what is ʺacceptableʺ and<br />
ʺunacceptableʺ to a rider but not necessarily what is an appropriate public investment given<br />
available funding, regional priorities, and Title VI concerns. Part 3 <strong>of</strong> the TCQSM provides more<br />
detail about the data and assumptions upon which the tables are based.<br />
Step 1: Scale <strong>of</strong> Application<br />
The proposed monitoring process applies to one‐way travel from one end <strong>of</strong> each potential HCT<br />
corridor to the other. Evaluation should occur on a regular basis as budget permits or more<br />
frequently in response to agency or public interest in a particular corridor. Each QOS measure in<br />
the flowchart should be evaluated.<br />
Step 2: Transit-Auto Travel Time QOS<br />
Table A‐1 provides information to assess how competitive transit travel time is with respect to<br />
auto travel time by associating QOS thresholds with the difference between transit and auto<br />
travel times for a given trip (i.e., a one‐way trip along the length <strong>of</strong> a potential HCT corridor). If<br />
transit service is not competitive with auto travel in terms <strong>of</strong> travel time, transit service may not<br />
be seen as a desired option. Transit travel times can be taken from schedules and should include<br />
walk access time to and from transit. Auto travel times can be based on travel time runs, which<br />
are currently part <strong>of</strong> PAG’s regional traffic monitoring program, and should also include walk<br />
access time to and from parking. The TCQSM uses a default walk access time <strong>of</strong> three minutes for<br />
both transit and auto travel. Travel times can reflect a peak period and/or the <strong>of</strong>f‐peak period, and<br />
it may be appropriate to establish a different QOS standard for each period.<br />
A-1
High Capacity Transit System Plan - <strong>Final</strong> <strong>Report</strong> June 2009<br />
Appendix A<br />
QOS<br />
Travel Time Difference<br />
(minutes)*<br />
Table A-1 Transit-Auto Travel Time QOS<br />
Comments<br />
A 60 Unacceptable to most riders<br />
*Should be considered in the context <strong>of</strong> overall travel time<br />
Transit service speed can be increased by investments in transit preferential treatments, dedicated<br />
lanes, operation in exclusive right‐<strong>of</strong>‐way, increased stop spacing, and reduced dwell times—all<br />
<strong>of</strong> which are associated with HCT.<br />
QOS D is the project team’s recommended Transit‐Auto Travel Time QOS standard for determining if<br />
investments in HCT features, an HCT mode, or an upgraded HCT mode should be studied. If Transit‐<br />
Auto Travel Time QOS is D or worse according to Table A‐1, investment in HCT or HCT features<br />
is desired. If Transit‐Auto Travel Time QOS is C, investment in HCT or HCT features may be<br />
desired, depending on the length <strong>of</strong> the route and other features <strong>of</strong> existing transit service that<br />
impact ridership (e.g., number <strong>of</strong> transfers and stop/station amenities). If Transit‐Auto Travel<br />
Time QOS is A or B, no investment in HCT or HCT features is needed.<br />
Step 3: Reliability QOS<br />
Table A‐2 and Table A‐3 are two measures <strong>of</strong> Reliability QOS. Reliability reflects the<br />
predictability or regularity <strong>of</strong> transit vehicle arrivals at a transit stop. Poor reliability can be an<br />
indicator <strong>of</strong> congestion delays, traffic signal delays, variations in boarding volumes, and/or<br />
variations in fare collection times. If a transit service’s reliability is poor, riders may choose not to<br />
use transit. On‐Time Performance QOS is appropriate for services with headways greater than 10<br />
minutes (like express bus) because riders typically plan their arrival at the stop to coincide with<br />
the printed schedule. Headway Adherence QOS is appropriate for services with headways less<br />
than or equal to 10 minutes (like HCT) because riders tend to arrive randomly, knowing that the<br />
next bus will be along shortly.<br />
A-2
High Capacity Transit System Plan - <strong>Final</strong> <strong>Report</strong> June 2009<br />
Appendix A<br />
Table A-2 On-Time Performance QOS<br />
QOS On-Time Percentage Comments*<br />
A 95.0-100.0% No more than 1 late transit vehicle every 2 weeks<br />
B 90.0-94.9% 1 late transit vehicle every week<br />
C 85.0-89.9% 3 late transit vehicles every 2 weeks<br />
D 80.0-84.9% 2 late transit vehicles every week<br />
E 75.0-79.9% 1 late transit vehicle every day<br />
F 0.75 Most vehicles bunched<br />
NOTE: This table differs from the corresponding table in the TCQSM.<br />
On‐Time Performance QOS reflects predictability: whether or not vehicles arrive at the scheduled<br />
time or within an acceptable window <strong>of</strong> time around the scheduled time (e.g., no more than five<br />
minutes after the scheduled time). On‐Time Performance QOS is calculated as the percentage <strong>of</strong><br />
arrivals that are “on time” within a certain span <strong>of</strong> time. The TCQSM suggests that the span is a<br />
minimum <strong>of</strong> 20 observations at a given stop. On‐time performance data can be obtained using<br />
automatic vehicle location (AVL) data or by manual ride‐checks.<br />
Headway Adherence QOS reflects the coefficient <strong>of</strong> variation <strong>of</strong> headways. The coefficient <strong>of</strong><br />
variation <strong>of</strong> headways represents the regularity <strong>of</strong> headways. It is calculated as follows:<br />
coefficient <strong>of</strong> variation<br />
<strong>of</strong> headways<br />
=<br />
standard deviation <strong>of</strong> headway deviations<br />
average scheduled headway<br />
In the above equation, headway deviation is the difference between the scheduled headway and<br />
the actual headway.<br />
A-3
High Capacity Transit System Plan - <strong>Final</strong> <strong>Report</strong> June 2009<br />
Appendix A<br />
Transit reliability can be increased by investments in TSP, queue jump lanes, bypass lanes,<br />
dedicated lanes, operation in exclusive right‐<strong>of</strong>‐way, advanced on‐board fare collection<br />
technology, and <strong>of</strong>f‐board fare collection because such improvements can reduce congestion and<br />
variability in travel times. Such investments may be associated with HCT.<br />
QOS D is the project team’s recommended Reliability QOS standard for determining if investments in<br />
HCT features, an HCT mode, or an upgraded HCT mode should be studied. If either Reliability QOS<br />
measure is QOS D or worse, investment in HCT or HCT features is desired. If either Reliability<br />
QOS measure is QOS C, investment in HCT or HCT features may be desired, depending on other<br />
features <strong>of</strong> existing transit service that impact ridership (e.g., number <strong>of</strong> transfers and stop/station<br />
amenities). If either Reliability QOS measure is QOS A or B, no investment in HCT or HCT<br />
features is needed.<br />
Step 4: Passenger Load QOS<br />
Table A‐4 provides information to assess how crowded buses are and if additional buses are<br />
needed in the corridor. Crowded buses may result from poor reliability, so Passenger Load QOS<br />
should be evaluated in tandem with Reliability QOS. Passenger Load QOS is based on the<br />
average load factor during a peak period or the <strong>of</strong>f‐peak period. Load factor is calculated as<br />
follows:<br />
load factor =<br />
number <strong>of</strong> passengers on board<br />
vehicle seating capacity + vehicle standing capacity<br />
Standing capacity may differ by the type <strong>of</strong> service under evaluation. Commuter services like<br />
express bus, for example, typically operate over longer distances and at higher speeds, so rider<br />
safety may dictate that all riders should have a seat. As a result, the standing capacity in the<br />
equation above may be very low—even zero. A streetcar circulator, on the other hand, serves<br />
shorter trips, so a significant number <strong>of</strong> standing passengers may be acceptable. The number <strong>of</strong><br />
passengers on board can be determined through ride‐checks or by using APC’s.<br />
Table A-4 Passenger Load QOS<br />
QOS Load Factor Comments<br />
A 0.00-0.50 No passenger need sit next to another<br />
B 0.51-0.75 Passengers can choose where to sit<br />
C 0.76-1.00 All passengers can sit<br />
D 1.01-1.25 Comfortable standee load for design<br />
E 1.26-1.50 Maximum schedule load<br />
F >1.50 Crush load<br />
NOTE: This table differs from the corresponding table in the TCQSM.<br />
QOS E is the project team’s recommended peak period Reliability QOS standard for determining if<br />
investments in HCT features, an HCT mode, or an upgraded HCT mode should be studied. The project<br />
team recommends QOS D for <strong>of</strong>f‐peak periods. If the peak period Passenger Load QOS is QOS E, then<br />
planning for improvements to ease bus crowding may be warranted. These improvements may<br />
A-4
High Capacity Transit System Plan - <strong>Final</strong> <strong>Report</strong> June 2009<br />
Appendix A<br />
be larger buses, increased frequency, or, if increased frequency cannot be achieved because there<br />
is too much congestion to maintain reliable service, transit preferential treatments, dedicated<br />
lanes, or exclusive transit right‐<strong>of</strong>‐way. Larger buses, short headways, transit preferential<br />
treatments, dedicated lanes, and exclusive transit right‐<strong>of</strong>‐way can all be associated with HCT.<br />
Step 5: HCT-Supportive Densities QOS<br />
Section 4.5 includes a series <strong>of</strong> figures that show where population and employment densities<br />
meet HCT‐supportive thresholds. Table A‐5 below summarizes the HCT‐supportive thresholds<br />
used to produce the series <strong>of</strong> figures. When the RTP is updated, the land uses shown in Tucsonarea<br />
governments’ General Plans can be compared against the HCT‐supportive densities in Table<br />
A‐5 to determine if HCT‐supportive densities are being planned within walking distance <strong>of</strong> the<br />
potential HCT corridors (or within a park‐and‐ride “catchment area” associated with the<br />
potential HCT corridors). If HCT‐supportive densities are planned, implementation <strong>of</strong> HCT or<br />
HCT features in the corridors may be warranted.<br />
HCT Service<br />
Table A-5 Development Density Thresholds for HCT<br />
Minimum<br />
Residential Density<br />
(households/gross acre)<br />
Minimum<br />
E mployment Density<br />
(jobs/ gross acre)<br />
Comments<br />
Express bus 2.0 50.5 for 2 square mile tributary area<br />
Bus rapid transit 4.0 67.2 for corridor <strong>of</strong> 100-150 square miles<br />
Light rail transit/<br />
streetcar<br />
6.0 84.0 for corridor <strong>of</strong> 25-100 square miles<br />
Commuter rail 1.3 N/A for 20 square mile tributary area<br />
SOURCES: Pushkarev and Zupan (1987) and Developing Around Transit (Urban Land Institute, 2004)<br />
0 translates the information in Table A‐5 to HCT‐Supportive Densities QOS thresholds. 0 should<br />
be applied for each HCT mode under consideration in a given corridor (i.e., HCT modes that are<br />
upgrades <strong>of</strong> existing transit service). The degree to which the corridor meets a given HCTsupportive<br />
density threshold is calculated as follows:<br />
% <strong>of</strong> corridor meeting HCTsupportive<br />
threshold<br />
=<br />
HCT‐supportive area within walking<br />
distance <strong>of</strong> corridor<br />
total area within walking distance <strong>of</strong><br />
corridor<br />
A-5
High Capacity Transit System Plan - <strong>Final</strong> <strong>Report</strong> June 2009<br />
Appendix A<br />
Table A-6 HCT-Supportive Densities QOS<br />
QOS<br />
% <strong>of</strong> Corridor Meeting<br />
HCT-Supportive<br />
Comments<br />
Threshold<br />
A
APPENDIX B:<br />
Review <strong>of</strong> General Plans<br />
and Codes
High Capacity Transit System Plan - <strong>Final</strong> <strong>Report</strong> June 2009<br />
Appendix B<br />
City <strong>of</strong> Tucson<br />
General Plan<br />
The adopted version <strong>of</strong> the City <strong>of</strong> Tucson’s General Plan is dated 2001 and is currently<br />
undergoing an update that is anticipated to conclude in 2011. Review <strong>of</strong> the General Plan in this<br />
section focuses on the 2001 version <strong>of</strong> the General Plan. Relevant General Plan elements reviewed<br />
are the Land Use element, the Circulation element, and the Community Character and Design<br />
element.<br />
Table B-1 City <strong>of</strong> Tucson General Plan Review<br />
HCT-Supportive Component<br />
Do the purposes, goals, and<br />
objectives <strong>of</strong> the General Plan<br />
place importance on the use <strong>of</strong><br />
alternative transportation modes?<br />
Are HCT modes in particular a part<br />
<strong>of</strong> the local government’s vision?<br />
Do the purposes, goals, and<br />
objectives <strong>of</strong> the General Plan<br />
place importance on TOD?<br />
Are there any purposes and goals<br />
that conflict with HCT and TOD?<br />
Are there HCT-supportive land use<br />
designations?<br />
Are densities, intensities, and land<br />
use mix requirements under<br />
existing mixed-use land use<br />
designations HCT-supportive?<br />
Can HCT-supportive land use<br />
designations be applied in the HCT<br />
corridors?<br />
Is housing mix addressed in the<br />
General Plan?<br />
Yes<br />
No<br />
Yes<br />
Maybe<br />
Yes<br />
No<br />
Yes<br />
Yes<br />
Comments<br />
“Development and redevelopment should ... promote more efficient<br />
use <strong>of</strong> land and public infrastructure, reduce automobile dependence,<br />
[and] better support alternative modes <strong>of</strong> transportation....” Land Use<br />
Sub-Policy 3.8 indicates that pedestrian-oriented development and<br />
TOD should be located along major streets and in or adjacent to<br />
centers and nodes. Land Use Policy 4 indicates that development in<br />
future growth areas should be transit-supportive and have maximal<br />
multimodal connectivity.<br />
Express bus, BRT, streetcar, LRT, and commuter rail are not<br />
specifically identified, but a “regional circulation system” is mentioned.<br />
According to the Land Use Vision, mixed-use activity centers are “ the<br />
centerpiece for the land use vision in the urbanized area.” “Greater<br />
integration <strong>of</strong> land uses will be encouraged in the urbanized area.”<br />
Land Use Policy 5 states that “proposed commercial and <strong>of</strong>fice<br />
development will be evaluated with regard to ... the potential for<br />
pedestrian- and transit-oriented development....” TOD is linked to<br />
livability and sustainability. Policies such as Land Use Policy 8 identify<br />
potential redevelopment sites.<br />
Neighborhood preservation is an important goal <strong>of</strong> the Land Use<br />
element; it is the “critical residential land use theme.” Neighborhood<br />
preservation efforts may limit the ability to achieve an HCT-supportive<br />
land use mix, for example, in a given neighborhood.<br />
HCT-supportive residential designations are primarily Mid-Urban<br />
Character and Urban Character. HCT-supportive nonresidential<br />
designations include Mixed Use Character, Activity Centers, Existing<br />
Master Planned Communities, and several master planning<br />
designations. (The residential land use designations allow nonresidential<br />
uses to a varying degree.) “Grouping commercial uses in<br />
nodes or mixed-use activity centers” is an important nonresidential<br />
theme. Land Use Sub-Policy 5.10 suggests zoning overlay districts for<br />
TOD and mixed-use projects.<br />
These are found in the Land Use Code. Densities are specified in the<br />
General Plan only for residential land use designations. The densest,<br />
Urban Character, allows a minimum <strong>of</strong> 15 units/acre.<br />
Mid-Urban Character and Urban Character residential development<br />
should be located along arterials and/or adjacent to activity centers<br />
per Land Use Policy 3. Mixed-use development should be located<br />
along or at intersections <strong>of</strong> major streets or adjacent to<br />
commercial/employment centers per Land Use Policy 3.<br />
Land Use Policy 2 encourages a mix <strong>of</strong> housing types.<br />
B-1
High Capacity Transit System Plan - <strong>Final</strong> <strong>Report</strong> June 2009<br />
Appendix B<br />
HCT-Supportive Component<br />
Does the General Plan identify infill<br />
and redevelopment as methods for<br />
increasing densities and improving<br />
land use patterns?<br />
Is coordination with other regional<br />
governments and agencies on HCT<br />
and TOD matters a part <strong>of</strong> the<br />
General Plan?<br />
Yes<br />
Yes<br />
Comments<br />
“New growth will be accommodated primarily through compatible infill,<br />
higher density activity centers, and redevelopment corridors rather<br />
than peripheral sprawl.” The General Plan acknowledges that, “In<br />
many cases, the opportunities for higher-density infill will be limited to<br />
large vacant or underdeveloped sites on major arterials or adjacent to<br />
activity centers.” Land Use Sub-Policy 3.6 discusses redevelopment<br />
<strong>of</strong> underutilized areas. Future growth areas are addressed in Land<br />
Use Policy 4.<br />
The introduction to the Land Use Element acknowledges the 1989<br />
Tucson Vision document and a “regional effort to encourage growth in<br />
appropriate areas.” Land Use Policy 9 addresses regional<br />
coordination.<br />
Observations and suggested amendments to the General Plan to enhance support for HCT are as<br />
follows:<br />
• Overall, the Tucson General Plan is supportive <strong>of</strong> HCT and TOD. It acknowledges the<br />
value <strong>of</strong> activity center−focused development and other land use attributes that are<br />
characteristic <strong>of</strong> TOD.<br />
• The Vision in the Land Use element states that industries will be encouraged to locate near<br />
major transportation corridors such as the interstates and the Southern Pacific Railroad.<br />
Proximity to regional transportation is a very desirable characteristic <strong>of</strong> industrial sites<br />
but, because these corridors are potential HCT corridors, the City could add clarifying<br />
language to address how TOD can be provided in a manner that is compatible with<br />
industrial development (e.g., by requiring buffers).<br />
• Land Use Sub‐Policy 2.4 states that the City will “investigate ways to apply density<br />
bonuses and other development incentives for residential development or redevelopment<br />
projects that preserve significant cultural or natural features and provide enhanced open<br />
space areas.” Land Use Sub‐Policy 6.13 mentions incentives for development in or near<br />
existing activity centers. Bonuses and incentives (which may include increased building<br />
heights and reduced parking requirements) could also be allowed for projects that are<br />
HCT‐supportive. Criteria for receiving the HCT‐supportive development density bonus<br />
may include one or more <strong>of</strong> the following (some <strong>of</strong> which are stated in Land Use Sub‐<br />
Policy 6.13 for Activity Centers):<br />
• Location <strong>of</strong> project within ¼‐ mile <strong>of</strong> an HCT station<br />
• Both residential and non‐residential uses provided on the site<br />
• A mix <strong>of</strong> housing types and prices provided on the site<br />
• Minimum residential density <strong>of</strong> X units per acre achieved and/or minimum job<br />
density <strong>of</strong> Y per acre achieved (densities per Appendix A)<br />
• Provision <strong>of</strong> multimodal infrastructure (e.g., pedestrian connections to HCT stations)<br />
• The C ity could add a new land use designation to the Land Use element, perhaps called<br />
“TO D District.” The new land use designation could be tiered to reflect different HCT<br />
station environments. These tiers should be coordinated on a regional level with other local<br />
B-2
High Capacity Transit System Plan - <strong>Final</strong> <strong>Report</strong> June 2009<br />
Appendix B<br />
governments. Specific densities, intensities, design requirements, and neighborhood buffer<br />
requirements can be specified in the General Plan or in the Land Use Code.<br />
• As an alternative to creating a “TOD District” designation, the Mixed Use Character,<br />
Activity Centers, Mid‐Urban Character, and Urban Character land use designations<br />
could be applied to (or required in) HCT station areas. These land use designations<br />
may require revisions to specify additional requirements or provide incentives for<br />
mix <strong>of</strong> uses, mix <strong>of</strong> housing types, minimum densities and intensities, and design<br />
standards.<br />
• Another alternative is implementing specific TOD zoning designations or overlays,<br />
as suggested in Land Use Sub‐Policy 5.10.<br />
• Care should be taken when implementing any HCT‐ or TOD‐related amendments to<br />
ensure that neighborhoods are protected because neighborhood preservation is an<br />
important goal <strong>of</strong> the Land Use element. Neighborhood preservation efforts may, for<br />
example, limit the City’s ability to achieve HCT‐supportive densities in a given<br />
neighborhood. Public involvement efforts should accompany designation <strong>of</strong> TOD Districts<br />
(if pursued) to ensure that neighborhoods understand the value <strong>of</strong> TOD and have an<br />
opportunity to contribute to implementation <strong>of</strong> TOD.<br />
Zoning and Development Standards<br />
The City <strong>of</strong> Tucson’s Zoning Code and Development Standards are in Article II <strong>of</strong> the Land Use<br />
Code. Parking requirements are in Article III Division 3.<br />
Observations and suggested amendments to the Zoning Code and Development Standards are as<br />
follows:<br />
• Division 6 <strong>of</strong> Article II is set aside for Mixed Use Zones. The mixed‐use zoning<br />
designations relevant to HCT are Office/Commercial/ Residential Zone 1 and 2, Planned<br />
Area Development Zone, and Planned Community Development District.<br />
• The Rio Nuevo and Downtown Zone addresses the downtown pedestrian environment,<br />
promotion <strong>of</strong> public‐private partnerships, and downtown revitalization.<br />
• Broadway Boulevard, Campbell Avenue, Valencia Road, and part <strong>of</strong> Oracle Road are<br />
“Gateway Arterial” roadways. The Gateway Corridor Overlay Zone addresses visual<br />
improvements to key corridors. The visual improvements are intended to present a<br />
favorable impression to visitors to the city, and they include pedestrian improvements<br />
along major transit routes. The visual improvements are also linked to private investment<br />
and buffers. Implementation <strong>of</strong> HCT can support Gateway Corridor improvements.<br />
B-3
High Capacity Transit System Plan - <strong>Final</strong> <strong>Report</strong> June 2009<br />
Appendix B<br />
Table B-2 City <strong>of</strong> Tucson Zoning and Development Standards Review<br />
HCT-Supportive Component<br />
Are there TOD-specific zoning<br />
designations?<br />
Are there mixed-use zoning<br />
designations?<br />
Are densities and intensities<br />
specified for zoning designations?<br />
Are building heights specified for<br />
zoning designations?<br />
Do zoning designations promote<br />
use <strong>of</strong> non-auto modes, infill,<br />
redevelopment, mixed uses, and<br />
TOD?<br />
Do development standards<br />
promote use <strong>of</strong> non-auto modes,<br />
infill, redevelopment, mixed uses,<br />
and TOD?<br />
Do parking standards promote use<br />
<strong>of</strong> non-auto modes, infill,<br />
redevelopment, mixed uses, and<br />
TOD?<br />
No<br />
Yes<br />
Yes<br />
Yes<br />
Yes<br />
Maybe<br />
Yes<br />
Comments<br />
The mixed-use zoning designations relevant to HCT are<br />
Office/Commercial/ Residential Zone 1 and 2, Planned Area<br />
Development Zone, and Planned Community Development District.<br />
Residential uses are allowed in some nonresidential zoning<br />
designations and vice versa.<br />
These are specified in the Summary <strong>of</strong> Zoning Classifications and<br />
Development Designators table.<br />
Building heights are important components <strong>of</strong> the overlay zones.<br />
Language for the mixed-use zoning designations locates such<br />
developments “in major activity centers or at transit centers” and<br />
requires multimodal assessments in traffic impact studies. Some <strong>of</strong><br />
the overlay zones address transit and pedestrian improvements. The<br />
Rio Nuevo and Downtown Zone addresses the downtown pedestrian<br />
environment, promotion <strong>of</strong> public-private partnerships, and downtown<br />
revitalization. Tucson also has a downtown Infill Incentive District,<br />
which includes portions <strong>of</strong> some HCT corridors.<br />
Design criteria address walkability.<br />
The Purpose Statement in Article III, Division 3, states parking<br />
regulations are intended to “reduce excessive <strong>of</strong>f-street parking by<br />
encouraging the shared use <strong>of</strong> vehicular use areas and the use <strong>of</strong><br />
public transit.” Section 3.3.5 focuses on mixed-use parking<br />
requirements; mixed-use developments are allowed to share parking if<br />
certain conditions are met. Parking requirements can also be reduced<br />
under conditions such as provision <strong>of</strong> a shaded transit stop within 400<br />
feet <strong>of</strong> a mall entrance.<br />
• The Major Streets and Routes Setback Overlay Zone affects several HCT corridors. This<br />
overlay addresses land use from a post–roadway widening perspective. One <strong>of</strong> the<br />
provisions is “establishing regulations which ensure availability <strong>of</strong> land for street<br />
widening purposes, including alternate modes <strong>of</strong> transportation such as bicycle,<br />
pedestrian, and mass transit.”<br />
• Building heights may need to be reviewed in combination with minimum lot size and<br />
maximum lot coverage to ensure that densities and intensities are HCT‐supportive.<br />
•<br />
The Purpose Statement in the parking regulations states that the City’s parking<br />
regulations are intended to “reduce excessive <strong>of</strong>f‐street parking by encouraging the shared<br />
use <strong>of</strong> vehicular use areas and the use <strong>of</strong> public transit.” Parking requirements can be<br />
reduced in mixed‐use developments or under conditions such as provision <strong>of</strong> a shaded<br />
transit stop within 400 feet <strong>of</strong> a mall entrance.<br />
• The City’s perspective appears to be one <strong>of</strong> giving developers an incentive to mix<br />
uses and provide multimodal infrastructure.<br />
• An alternate perspective is strictly limiting parking as a means <strong>of</strong> encouraging<br />
transit use. This is the de facto situation in many large downtowns, where limited<br />
parking supply and/or high parking costs encourage travelers to choose non‐auto<br />
modes.<br />
B-4
High Capacity Transit System Plan - <strong>Final</strong> <strong>Report</strong> June 2009<br />
Appendix B<br />
• Section 3.3.7 requires <strong>of</strong>f‐site parking in most locations to be provided within 600 feet <strong>of</strong> a<br />
development’s principal use. This is less than half the maximum walking distance to a bus<br />
stop (1,320 feet) assumed in the regional HCT study analyses. To promote HCT, walking<br />
distance to/from transit and walking distance to/from parking should be competitive for<br />
the same type <strong>of</strong> trips (e.g., work trips or shopping trips). Walk access time is a critical<br />
part <strong>of</strong> the HCT monitoring methodology described in Section 8.2.1.<br />
• In the Downtown Redevelopment District, parking may be 1,500 feet away. This is<br />
compatible with employee parking and typical walking distance to a bus stop.<br />
• On‐street parking can count toward required parking in some cases.<br />
City <strong>of</strong> South Tucson<br />
Comprehe nsive Plan<br />
The City <strong>of</strong> South Tucson’s Comprehensive Plan is dated 1999. Relevant Comprehensive Plan<br />
elements reviewed are the Land Use element, the Transportation element, and the Housing<br />
element.<br />
Observations and suggested amendments to the Comprehensive Plan are as follows:<br />
• Overall, the City <strong>of</strong> South Tucson Comprehensive Plan is supportive <strong>of</strong> HCT and TOD. It<br />
acknowledges that 6th Avenue South is a key transportation corridor and is appropriate<br />
for denser development and mixed‐use development.<br />
• Several <strong>of</strong> the City’s goals could be advanced using HCT and TOD. These goals include<br />
providing local employment opportunities, promoting infill and redevelopment,<br />
improving streetscapes, creating public art opportunities, and providing opportunities for<br />
affordable housing. One <strong>of</strong> the Housing strategies is encouraging non‐pr<strong>of</strong>it agencies to<br />
buy and develop City‐owned land; Boston is an example <strong>of</strong> a city in which non‐pr<strong>of</strong>it<br />
agencies are involved in TOD.<br />
• When developed, strategies related to parking on South 6th Avenue should be reviewed<br />
to ensure compatibility with HCT.<br />
• One <strong>of</strong> the Land Use strategies encourages community groups to adopt street segments<br />
for upkeep. HCT stations could be similarly adopted. Benefits may include improved<br />
station safety and maintenance.<br />
B-5
High Capacity Transit System Plan - <strong>Final</strong> <strong>Report</strong> June 2009<br />
Appendix B<br />
Table B-3 City <strong>of</strong> South Tucson General Plan Review<br />
HCT-Supportive Component<br />
Do the purposes, goals, and<br />
objectives <strong>of</strong> the General Plan<br />
place importance on the use <strong>of</strong><br />
alternative transportation modes?<br />
Are HCT modes in particular a part<br />
<strong>of</strong> the local government’s vision?<br />
Do the purposes, goals, and<br />
objectives <strong>of</strong> the General Plan<br />
place importance on TOD?<br />
Are there any purposes and goals<br />
that conflict with HCT and TOD?<br />
Are there HCT-supportive land use<br />
designations?<br />
Are densities, intensities, and land<br />
use mix requirements under<br />
existing mixed-use land use<br />
designations HCT-supportive?<br />
Can HCT-supportive land use<br />
designations be applied in the HCT<br />
corridors?<br />
Is housing mix addressed in the<br />
General Plan?<br />
Does the General Plan identify infill<br />
and redevelopment as methods for<br />
increasing densities and improving<br />
land use patterns?<br />
Is coordination with other regional<br />
governments and agencies on HCT<br />
and TOD matters a part <strong>of</strong> the<br />
General Plan?<br />
Yes<br />
No<br />
No<br />
Maybe<br />
Yes<br />
N/A<br />
Yes<br />
No<br />
Yes<br />
Maybe<br />
Comments<br />
The General Plan’s overall purpose statement is brief and does not<br />
identify specific issues, but various goals and strategies identify<br />
potential investments in alternative modes. One <strong>of</strong> these investments<br />
is use <strong>of</strong> abandoned UPRR right-<strong>of</strong>-way as a park and multi-use path.<br />
HCT stations have been tentatively located within a few blocks <strong>of</strong> this<br />
site.<br />
Bus service is acknowledged as a significant component <strong>of</strong> the South<br />
Tucson transportation system. The General Plan states that “the<br />
majority <strong>of</strong> residential South Tucson is within two blocks <strong>of</strong> bus<br />
service” and “the City <strong>of</strong> South Tucson has a significant number <strong>of</strong><br />
people who ride buses.” Relevant Transportation strategies include<br />
establishing bus, trolley, and shuttle services and improving bus stops.<br />
The General Plan’s purpose statement is brief and does not identify<br />
specific issues, but the South Tucson Five-Year Economic<br />
Development Strategic Plan referenced in the General Plan identifies<br />
mixing land uses as a strategy.<br />
The discussion <strong>of</strong> vacant lands in the General Plan states, “One <strong>of</strong> the<br />
strategies in the Economic Development Strategic Plan is to continue<br />
current patterns <strong>of</strong> housing...” where the current pattern is<br />
predominantly single-family residential. The discussion <strong>of</strong> land use<br />
conflicts states that such conflicts may exist where there is a change<br />
in development density. Both <strong>of</strong> statements suggest a potential conflict<br />
with HCT-supportive development.<br />
The Residential land use designation allows multi-family development.<br />
One <strong>of</strong> the Land Use objectives is adopting a mixed-use zoning<br />
category. This zoning will be applicable along South 6th Avenue. It will<br />
be characterized by a mix <strong>of</strong> commercial and residential uses and<br />
efforts to encourage the growth <strong>of</strong> small businesses. This zoning--and<br />
an equivalent land use designation--should be adopted.<br />
Densities and intensities are not specified in the General Plan.<br />
The General Plan states that infill and redevelopment are desirable<br />
(e.g., in one <strong>of</strong> the Land Use objectives). Specific redevelopment sites<br />
are identified.<br />
The importance <strong>of</strong> regional coordination on transportation issues is<br />
acknowledged.<br />
B-6
High Capacity Transit System Plan - <strong>Final</strong> <strong>Report</strong> June 2009<br />
Appendix B<br />
• Major traffic generators identified in the General Plan have also been recognized in the<br />
HCT study. These include the VA Hospital and the rodeo grounds.<br />
• The South 6th Avenue streetscaping project lends itself to implementation <strong>of</strong> HCT.<br />
Zoning and Development Standards<br />
The City <strong>of</strong> South Tucson’s Zoning Code and Development Standards are in Chapter 24 <strong>of</strong> the<br />
City Code.<br />
Table B-4 City <strong>of</strong> South Tucson Zoning and Development Standards Review<br />
HCT-Supportive Component<br />
Are there TOD-specific zoning<br />
designations?<br />
Are there mixed-use zoning<br />
designations?<br />
Are densities and intensities<br />
specified for zoning designations?<br />
Are building heights specified for<br />
zoning designations?<br />
Do zoning designations promote<br />
use <strong>of</strong> non-auto modes, infill,<br />
redevelopment, mixed uses, TOD,<br />
and HCT?<br />
Do development standards<br />
promote use <strong>of</strong> non-auto modes,<br />
infill, redevelopment, mixed uses,<br />
TOD, and HCT?<br />
Do parking standards promote use<br />
<strong>of</strong> non-auto modes, infill,<br />
redevelopment, mixed uses, TOD,<br />
and HCT?<br />
No<br />
No<br />
No<br />
Yes<br />
No<br />
Maybe<br />
Maybe<br />
Comments<br />
Some zoning designations could be considered HCT-supportive in<br />
terms <strong>of</strong> densities and intensities.<br />
Residential uses are allowed in some nonresidential zoning<br />
designations and vice versa, but there is no true mixed-use zoning.<br />
The General Plan states that mixed-use zoning should be developed.<br />
Densities and intensities are not specified for all zoning designations.<br />
Minimum lot sizes and maximum lot coverage are specified for some<br />
zoning designations.<br />
Building heights may need to be reviewed in combination with<br />
minimum lot size and maximum lot coverage to ensure that densities<br />
and intensities are HCT-supportive.<br />
While some zoning designations are single-use but could be<br />
considered HCT-supportive due to their densities/intensities, there do<br />
not appear to be any unique requirements or incentives that otherwise<br />
distinguish HCT-supportive development from conventional<br />
development.<br />
See the preceding comment. Also, current buffer requirements may<br />
need to be reviewed when mixed-use zoning is developed.<br />
Section 24-525(a) restricts parking garage construction; structured<br />
parking can be a component <strong>of</strong> TOD because it makes more efficient<br />
use <strong>of</strong> land. Section 24-615(a) does not allow shared parking; shared<br />
parking enables more efficient use <strong>of</strong> land. Section 24-617 states that<br />
<strong>of</strong>f-site parking must be provided within 600 feet <strong>of</strong> a development’s<br />
principal use; this is half the maximum walking distance to a bus stop<br />
assumed in the regional HCT study.<br />
Observations and suggested amendments to the Zoning Code and Development Standards are as<br />
follows:<br />
• Residential uses are allowed in some nonresidential zoning designations and vice versa,<br />
but there is no true mixed‐use zoning (i.e., zoning that allows a mix <strong>of</strong> uses on a single<br />
site). The General Plan states that mixed‐use zoning should be developed.<br />
• Building heights may need to be reviewed in combination with minimum lot size and<br />
maximum lot coverage to ensure that densities and intensities are HCT‐supportive.<br />
• Buffer requirements and parking garage locational restrictions may need to be reviewed<br />
when the mixed‐use zoning designation is developed.<br />
• Calculation <strong>of</strong> parking requirements for mixed uses in Section 24‐615(a) does not currently<br />
allow shared parking. The project team recommends that parking supply requirements<br />
reflect opportunities to share parking because shared parking can result in more efficient<br />
B-7
High Capacity Transit System Plan - <strong>Final</strong> <strong>Report</strong> June 2009<br />
Appendix B<br />
use <strong>of</strong> land, less run‐<strong>of</strong>f, and opportunities to provide amenities such as landscaping<br />
instead <strong>of</strong> parking stalls. Parking can be shared when the parking demand generated by<br />
uses in the same area peaks at different times. The Urban Land Institute recently updated<br />
its Shared Parking handbook, which provides detailed procedures and data for<br />
determining shared parking supply.<br />
• Section 24‐617 requires <strong>of</strong>f‐site parking to be provided within 600 feet <strong>of</strong> a development’s<br />
principal use, which is less than half the maximum walking distance to a bus stop (1,320<br />
feet) assumed in the regional HCT study analyses. To promote HCT ridership, walking<br />
distance to/from transit and walking distance to/from parking should be competitive for<br />
the same type <strong>of</strong> trips (e.g., work trips or shopping trips). The project team notes that walk<br />
access time to/from transit and parking is a critical part <strong>of</strong> the HCT monitoring<br />
methodology described in Section 8.2.1.<br />
Town <strong>of</strong> Sahuarita<br />
General Plan<br />
The Town <strong>of</strong> Sahuarita’s General Plan is dated 2003. Relevant General Plan elements reviewed are<br />
the Land Use element, the Circulation element, the Growth Areas element, the Public Facilities<br />
and Services element, the Environmental Planning element, and the Cost <strong>of</strong> Development<br />
element.<br />
Observations and suggested amendments to the General Plan are as follows:<br />
• Overall, the Town <strong>of</strong> Sahuarita General Plan is supportive <strong>of</strong> HCT and TOD, despite the<br />
Circulation element acknowledgment that non‐auto modes are not a significant part <strong>of</strong> the<br />
existing transportation system. The Plan’s Vision Statement acknowledges many potential<br />
outcomes <strong>of</strong> HCT and TOD, including positive environmental benefits, economic<br />
development, and increased mobility choices.<br />
• Increasing live/work unit opportunities as stated in Policy LU‐5.2.2 is a good strategy<br />
town‐wide for mixing uses and reducing traffic congestion. While live/work units may<br />
eliminate potential transit trips, they are more likely to eliminate auto trips. Live/work<br />
units can be part <strong>of</strong> TOD.<br />
• The Cost <strong>of</strong> Development Element describes a unique Town funding source in the 3%<br />
construction sales tax.<br />
•<br />
Several <strong>of</strong> the City’s goals could be advanced using HCT and TOD. These goals include<br />
revitalization and VMT reduction.<br />
• Policy GA‐1.1.3 states that barriers to mixed‐use development in zoning and development<br />
standards should be removed. Implementation <strong>of</strong> this policy is encouraged.<br />
B-8
High Capacity Transit System Plan - <strong>Final</strong> <strong>Report</strong> June 2009<br />
Appendix B<br />
HCT-Supportive Component<br />
Do the purposes, goals, and<br />
objectives <strong>of</strong> the General Plan<br />
place importance on the use <strong>of</strong><br />
alternative transportation modes?<br />
Are HCT modes in particular a part<br />
<strong>of</strong> the local government’s vision?<br />
Do the purposes, goals, and<br />
objectives <strong>of</strong> the General Plan<br />
place importance on TOD?<br />
Are there any purposes and goals<br />
that conflict with HCT and TOD?<br />
Are there HCT-supportive land use<br />
designations?<br />
Are densities, intensities, and land<br />
use mix requirements under<br />
existing mixed-use land use<br />
designations HCT-supportive?<br />
Can HCT-supportive land use<br />
designations be applied in the HCT<br />
corridors?<br />
Is housing mix addressed in the<br />
General Plan?<br />
Does the General Plan identify infill<br />
and redevelopment as methods for<br />
increasing densities and improving<br />
land use patterns?<br />
Is coordination with other regional<br />
governments and agencies on HCT<br />
and TOD matters a part <strong>of</strong> the<br />
General Plan?<br />
Table B-5 Town <strong>of</strong> Sahuarita General Plan Review<br />
Yes<br />
No<br />
Maybe<br />
No<br />
Yes<br />
N/A<br />
Yes<br />
Yes<br />
Comments<br />
The Vision Statement recognizes mobility choices. Goal GA-1 states<br />
that the Town will “promote balanced, efficient development to areas<br />
that ... encourage multimodal transportation.” Circulation Goal CIR-1<br />
states that the Town will “improve the mobility <strong>of</strong> people and goods by<br />
providing effective, convenient, accessible, and safe transportation<br />
options....” The Introduction to the Circulation Element also<br />
acknowledges the importance <strong>of</strong> alternative transportation modes.<br />
Express bus, BRT, streetcar, LRT, and commuter rail are not<br />
specifically identified, but Policy ENV-1.7.3 advocates a regional bus<br />
system.<br />
TOD is not expressly mentioned, but components <strong>of</strong> TOD are<br />
discussed. Goal LU-3 and its objectives and policies, for example,<br />
address increased densities in major corridors and mixed-use<br />
development. Some developable areas are identified.<br />
HCT-supportive residential land use designations are Low-Medium<br />
Density Residential, Medium Density Residential, and High Density<br />
Residential. HCT-supportive nonresidential land use designations<br />
include Commercial and Mixed Use. Commercial allows high-density<br />
residential. Mixed Use allows Medium Density Residential, High<br />
Density Residential, and various nonresidential uses.<br />
Such requirements are not specified in the General Plan.<br />
The Special Planning Areas map dated October 4, 2002, shows that<br />
these designations have been applied in the Highway 19B corridor.<br />
The General Plan Land Use Map shows these areas as part <strong>of</strong> the<br />
100-year floodplain, however, so HCT stations may have to be located<br />
outside the Highway 19B corridor. A CRT station may have to be<br />
located along a spur line.<br />
Goal LU-4 addresses housing diversity.<br />
Yes Infill is acknowledged in Objectives PSF-2.5 and PSF-2.6.<br />
Yes<br />
Coordination with Sun Tran and the County about transit is part <strong>of</strong><br />
Policy CIR-1.3.1.<br />
• The Land Use Element notes that the Town’s General Plan assumes a higher rate <strong>of</strong><br />
growth than PAG does.<br />
• Like the Commercial land use designation, the Employment land use designation could<br />
allow high‐density residential development.<br />
• A new land use designation such as “TOD District” could be developed if existing land<br />
use designations are determined to be inadequate (which does not appear to be the case).<br />
This should be coordinated on a regional level with other local governments.<br />
• A precedent for TOD joint development is arguably found in Objective GA‐1.4, which<br />
addresses coordination <strong>of</strong> public infrastructure funding with the private sector.<br />
B-9
High Capacity Transit System Plan - <strong>Final</strong> <strong>Report</strong> June 2009<br />
Appendix B<br />
• Policy CIR‐1.6.6 acknowledges that parking standards are “flexible tools to achieve other<br />
overall transportation policies.” Parking management is an important tool in the success<br />
<strong>of</strong> TOD.<br />
• The Implementation Element recommendation regarding creation <strong>of</strong> a mixed‐use zone<br />
should be implemented. The mixed‐use zone may allow development incentives for TOD<br />
at HCT stations.<br />
Zoning and Development Standards<br />
The Town <strong>of</strong> Sahuarita’s Zoning Code and Development Standards are in Chapter 18 <strong>of</strong> the City<br />
Cod e.<br />
Table B-6 Town <strong>of</strong> Sahuarita Zoning and Development Standards Review<br />
HCT-Supportive Component<br />
Comments<br />
Are there TOD-specific zoning<br />
designations?<br />
Are there mixed-use zoning<br />
designations?<br />
Are densities and intensities<br />
specified for zoning designations?<br />
Are building heights specified for<br />
zoning designations?<br />
Do zoning designations promote<br />
use <strong>of</strong> non-auto modes, infill,<br />
redevelopment, mixed uses, TOD,<br />
and HCT?<br />
Do development standards<br />
promote use <strong>of</strong> non-auto modes,<br />
infill, redevelopment, mixed uses,<br />
TOD, and HCT?<br />
Do parking standards promote use<br />
<strong>of</strong> non-auto modes, infill,<br />
redevelopment, mixed uses, TOD,<br />
and HCT?<br />
No<br />
Yes<br />
Maybe<br />
Yes<br />
Maybe<br />
Maybe<br />
Maybe<br />
These are Mixed-Dwelling Type Zone, Multiple Residence Zone, and<br />
Multiple Use Zone. Residential uses are allowed in some<br />
nonresidential zoning designations and vice versa.<br />
Densities tend to be expressed in terms <strong>of</strong> minimum lot area per<br />
dwelling unit. Intensities tend to be expressed in terms <strong>of</strong> setbacks,<br />
buffers, and building height restrictions.<br />
Building heights may need to be reviewed in combination with<br />
minimum lot size, setbacks, and buffers to ensure that densities and<br />
intensities are HCT-supportive.<br />
Mixed-use zoning designations exist. There are no TOD-specific or<br />
HCT-specific zoning designations or overlays.<br />
Development standards address walkability issues but there are no<br />
TOD-specific or HCT-specific requirements in the zoning designations.<br />
However, Chapter 18.89 (“Comprehensive Plan”) includes land use<br />
categories that are not in the General Plan. Some <strong>of</strong> these land use<br />
categories may be supportive <strong>of</strong> HCT and/or TOD; they reference<br />
“special design standards,” direct access to transit, etc.<br />
Parking standards allow shared parking.<br />
Observations and suggested amend ments to the Zoning Code and Development Standards are as<br />
follows:<br />
• The mixed‐use zoning designations are Mixed‐Dwelling Type Zone, Multiple Residence<br />
Zone, and Multiple Use Zone. There are no TOD‐specific or HCT‐specific zoning<br />
designations or overlays.<br />
• Building heights may need to be reviewed in combination with minimum lot size,<br />
setbacks, and buffers to ensure that densities and intensities are HCT‐supportive.<br />
• The project team notes that Chapter 18.89 (“Comprehensive Plan”) includes land use<br />
categories that are not in the General Plan. Some <strong>of</strong> these land use categories (which<br />
consist <strong>of</strong> Regional Activity Center, Community Activity Center, Neighborhood Activity<br />
Center, Multifunctional Corridor, High Intensity Urban, Medium/High Intensity Urban,<br />
B-10
High Capacity Transit System Plan - <strong>Final</strong> <strong>Report</strong> June 2009<br />
Appendix B<br />
and Medium Intensity Urban) may be supportive <strong>of</strong> HCT and/or TOD. For example, some<br />
<strong>of</strong> these categories require direct access to transit.<br />
Tow n <strong>of</strong> Oro Valley<br />
General Plan<br />
The Town <strong>of</strong> Oro Valley’s General Plan is dated 2005. Relevant General Plan elements reviewed<br />
are the Land Use element, the Community Design element, the Economic Development element,<br />
the Cost <strong>of</strong> Development element, and the Circulation element.<br />
Observations and suggested amendments to the General Plan are as follows:<br />
• Overall, the Town <strong>of</strong> Oro Valley General Plan is supportive <strong>of</strong> HCT and TOD to a limited<br />
degree, even though Oracle Road is identified as the “priority north‐south transit<br />
corridor” in Circulation Policy 5.6.2. The Land Use Element purpose statement and Land<br />
Use Policy 1.2.1 focus on maintaining a low‐density residential development pattern,<br />
which may not be HCT‐ or TOD‐supportive. One <strong>of</strong> the Key Policy Issues in the Element<br />
acknowledges that, “In some cases, this development pattern could result in increased<br />
environmental impacts, traffic congestion, monotony in residential subdivision design,<br />
and strip development that is oriented to the automobile,” but Land Use Policy 1.4.9<br />
introduces another challenge to TOD by suggesting that massing and visibility <strong>of</strong> higherintensity<br />
uses along arterials is not desirable. (Such higher‐intensity uses may be needed<br />
for successful TOD and HCT.)<br />
• Medium‐Density Residential and High‐Density Residential could be HCT‐supportive; the<br />
minimum density for the latter may be too low in immediate HCT station areas. However,<br />
while several Land Use policies recognize placing compatible uses in close proximity to<br />
each other, only the Master Planned Community designation recognizes mixing uses on<br />
one site. Buffers can be provided between uses on a single site so that compatibility can be<br />
achieved even as walkability is maximized. A new land use designation such as “TOD<br />
District” could be developed if HCT‐supportive revisions to existing land use<br />
designations are not practicable. This should be coordinated on a regional level with other local<br />
governments.<br />
B-11
High Capacity Transit System Plan - <strong>Final</strong> <strong>Report</strong> June 2009<br />
Appendix B<br />
Table B-7 Town <strong>of</strong> Oro Valley General Plan Review<br />
HCT-Supportive Component<br />
Comments<br />
Do the purposes, goals, and<br />
Policies such as Land Use Policies 1.3.6 and 1.5.5 mention nonmotorized<br />
travel and transit. The most significant discussion is in the<br />
objectives <strong>of</strong> the General Plan<br />
Yes<br />
place importance on the use <strong>of</strong><br />
Circulation Element’s purpose statement, Key Policy Issues, and<br />
alternative transportation modes?<br />
Objectives 5.5 and 5.6.<br />
Are HCT modes in particular a part<br />
However, Oracle Road is identified as the “priority north-south transit<br />
No<br />
<strong>of</strong> the local government’s vision?<br />
corridor” in Circulation Policy 5.6.2.<br />
Do the purposes, goals, and<br />
objectives <strong>of</strong> the General Plan Maybe<br />
TOD is expressly mentioned in Circulation Policy 5.6.3 with respect to<br />
design standards and zoning, but this does not appear to be a<br />
place importance on TOD?<br />
component <strong>of</strong> the Land Use Element.<br />
The Land Use Element purpose statement and Land Use Policy 1.2.1<br />
focus on maintaining a low-density residential development pattern,<br />
which may not be HCT- or TOD-supportive. One <strong>of</strong> the Key Policy<br />
Issues in the Element acknowledges that, “In some cases, this<br />
Are there any purposes and goals<br />
development pattern could result in increased environmental impacts,<br />
Maybe<br />
that conflict with HCT and TOD?<br />
traffic congestion, monotony in residential subdivision design, and<br />
strip development that is oriented to the automobile.” Land Use Policy<br />
1.4.9 addresses massing and visibility <strong>of</strong> higher-intensity uses along<br />
arterials; such higher-intensity uses may be needed for successful<br />
TOD and HCT.<br />
Medium-Density Residential and High-Density Residential could be<br />
HCT-supportive; the minimum density for the latter may be too low in<br />
immediate HCT station areas. However, while several Land Use<br />
Are there HCT-supportive land use<br />
designations?<br />
Are densities, intensities, and land<br />
use mix requirements under<br />
existing mixed-use land use<br />
designations HCT-supportive?<br />
Can HCT-supportive land use<br />
designations be applied in the HCT<br />
corridors?<br />
Is housing mix addressed in the<br />
General Plan?<br />
Does the General Plan identify infill<br />
and redevelopment as methods for<br />
increasing densities and improving<br />
land use patterns?<br />
Is coordination with other regional<br />
governments and agencies on HCT<br />
and TOD matters a part <strong>of</strong> the<br />
General Plan?<br />
Yes<br />
N/A<br />
Yes<br />
M aybe<br />
Yes<br />
Yes<br />
policies recognize placing compatible uses in close proximity, only the<br />
Master Planned Community designation recognizes mixing uses on<br />
one site. Buffers can be provided between uses on a single site, so<br />
that compatibility can be maximized even as walkability is maximized.<br />
Such requirements are not specified in the General Plan. There does<br />
not appear to be a formal mixed-use land use designation.<br />
The Planned Land Use - 2020 map indicates that some HCTsupportive<br />
designations have been applied adjacent to Oracle Road.<br />
Housing mix is addressed under the land use designation descriptions<br />
and in the Housing Element. However, with the possible exception <strong>of</strong><br />
encouraging a mix <strong>of</strong> densities in Master Planned Communities,<br />
mixing housing types on a single site does not appear to be the focus<br />
<strong>of</strong> the language.<br />
Cost <strong>of</strong> Development Policy 4.1.9 refers to infill incentive areas. This<br />
appears to be the only mention <strong>of</strong> infill.<br />
Coordination with Sun Tran and the County about transit is part <strong>of</strong><br />
Circulation Policy 5.5.3.<br />
B-12
High Capacity Transit System Plan - <strong>Final</strong> <strong>Report</strong> June 2009<br />
Appendix B<br />
• Land Use Policy 1.4.3 states, “The Town reasonably wishes to be satisfied that sufficient<br />
demand exists before authorizing a higher land use intensity than present zoning<br />
permits.” While TOD should only be developed where there is a market for it, the policy<br />
may be a TOD deterrent if TOD‐supportive development must complete analyses that<br />
conventional development does not or meet more rigorous tests than conventional<br />
development.<br />
• Growth in three <strong>of</strong> the four “growth areas” in the Land Use Element may have an<br />
opportunity to be coordinated with HCT.<br />
• TOD/HCT can be a tool for addressing various Town aims (e.g., air quality improvements,<br />
public art opportunities, and increased pr<strong>of</strong>essional employment opportunities).<br />
• Regarding Circulation Policy 5.5.1, HCT can be viable for choice riders as well as transitdependent<br />
riders.<br />
• A precedent for TOD joint development is arguably found in Parks and Recreation<br />
Objective 8.6.<br />
• The Master Planned Community land use designation appears to be intended for large<br />
sites only. Uses could be mixed on smaller sites. It is recommended that the Town revise<br />
its land use designations to allow compatible mixed‐use development on sites <strong>of</strong> all sizes.<br />
Zoning and Development Standards<br />
The Town <strong>of</strong> Oro Valley’s zoning regulations and development standards are in Chapters 23‐27 <strong>of</strong><br />
the Zoning Code.<br />
Observations and suggested amendments to the Zoning Code are as follows:<br />
• Planned Area Development is the zoning designation that appears to be the most<br />
applicable to HCT and TOD. It could be modified for application to HCT station areas<br />
(e.g., by allowing sites less than 20 acres in size or by adding TOD incentives) or it could<br />
serve as a model for a new, HCT station–oriented zoning designation or zoning overlay.<br />
• While high‐intensity development may not be desired along Oracle Road, this need not<br />
preclude higher densities and intensities around HCT stations.<br />
• HCT must be coordinated with the Oracle Road Scenic Corridor District. The detailed<br />
view analysis methodology presented in Addendum A to the Town’s Zoning Code<br />
suggests that express bus and BRT are the HCT modes least likely to impact the Oracle<br />
Road Scenic Corridor because these modes do not have overhead power infrastructure.<br />
• HCT presents an opportunity to provide public artwork per the provisions in the<br />
development standards.<br />
• Zoning Code Section 27.7 H presents a unique methodology for allowing development<br />
incentives in exchange for structured parking.<br />
• Zoning Code Section 27.7 (Off‐Street Parking) should tie <strong>of</strong>f‐street parking to transit.<br />
Parking management is a tool for encouraging transit use.<br />
B-13
High Capacity Transit System Plan - <strong>Final</strong> <strong>Report</strong> June 2009<br />
Appendix B<br />
Table B-8 Town <strong>of</strong> Oro Valley Zoning and Development Standards Review<br />
HCT-Supportive Component<br />
Are there TOD-specific zoning<br />
designations?<br />
Are there mixed-use zoning<br />
designations?<br />
Are densities and intensities<br />
specified for zoning designations?<br />
Are building heights specified for<br />
zoning designations?<br />
Do zoning designations promote<br />
use <strong>of</strong> non-auto modes, infill,<br />
redevelopment, mixed uses, TOD,<br />
and HCT?<br />
Do development standards<br />
promote use <strong>of</strong> non-auto modes,<br />
infill, redevelopment, mixed uses,<br />
TOD, and HCT?<br />
Do parking standards promote use<br />
<strong>of</strong> non-auto modes, infill,<br />
redevelopment, mixed uses, TOD,<br />
and HCT?<br />
No<br />
Yes<br />
Yes<br />
Yes<br />
Maybe<br />
Maybe<br />
Maybe<br />
Comments<br />
Planned Area Development appears to be the most applicable zoning<br />
designation; Neighborhood Commercial District is not encouraged<br />
along Oracle Road. Residential uses are allowed in some<br />
nonresidential zoning designations and vice versa.<br />
Building heights and buffers may need to be reviewed to ensure that<br />
densities and intensities are HCT-supportive.<br />
A mixed-use zoning designation that could be applied ( with<br />
modifications for TOD incentives) in HCT station areas exists, but “the<br />
Oracle Road corridor is de-emphasized for high intensity<br />
development.” In addition, the Oracle Road Scenic Corridor District<br />
may limit HCT modes and TOD along Oracle Road. While there are<br />
no TOD-specific or HCT-specific zoning designations or overlays,<br />
pedestrian connections are addressed under relevant zoning<br />
designations. Transit and pedestrian and bicycle infrastructure is not<br />
addressed in the subdivision regulations.<br />
Pedestrian connections and infill design standards are addressed.<br />
The Purpose Statement in Section 27.7 states that parking regulations<br />
are intended to “reduce excessive <strong>of</strong>f-street parking by encouraging<br />
the shared use <strong>of</strong> vehicular use areas” and notes that vehicle parking<br />
spaces can be beneficially converted to bicycle parking spaces.<br />
Parking standards allow shared parking, and Section 27.7 H presents<br />
a unique methodology for allowing development incentives in<br />
exchange for structured parking, but transit is not part <strong>of</strong> Section 27.7.<br />
Town <strong>of</strong> Marana<br />
General Plan<br />
The Town <strong>of</strong> Marana’s General Plan is dated 2007. Relevant General Plan elements reviewed are<br />
the Land Use element, Cost <strong>of</strong> Development element, and the Circulation element.<br />
B-14
High Capacity Transit System Plan - <strong>Final</strong> <strong>Report</strong> June 2009<br />
Appendix B<br />
Table B-9 Town <strong>of</strong> Marana General Plan<br />
HCT-Supportive Component<br />
Do the purposes, goals, and<br />
objectives <strong>of</strong> the General Plan<br />
place importance on the use <strong>of</strong><br />
alternative transportation modes?<br />
Are HCT modes in particular a part<br />
<strong>of</strong> the local government’s vision?<br />
Do the purposes, goals, and<br />
objectives <strong>of</strong> the General Plan<br />
place importance on TOD?<br />
Are there any purposes and goals<br />
that conflict with HCT and TOD?<br />
Are there HCT-supportive land use<br />
designations?<br />
Are densities, intensities, and land<br />
use mix requirements under<br />
existing mixed-use land use<br />
designations HCT-supportive?<br />
Can HCT-supportive land use<br />
designations be applied in the HCT<br />
corridors?<br />
Is housing mix addressed in the<br />
General Plan?<br />
Does the General Plan identify infill<br />
and redevelopment as methods for<br />
increasing densities and improving<br />
land use patterns?<br />
Is coordination with other regional<br />
governments and agencies on HCT<br />
and TOD matters a part <strong>of</strong> the<br />
General Plan?<br />
Yes<br />
Yes<br />
Maybe<br />
Maybe<br />
Yes<br />
Yes<br />
Yes<br />
Yes<br />
N/A<br />
Yes<br />
Comments<br />
This is addressed significantly only in the Circulation element. The<br />
Land Use goals do not specifically address alternative transportation<br />
modes; they address sustainability, natural and cultural resources,<br />
open space, development diversity, and quality design. TOD is<br />
mentioned in a sub-policy <strong>of</strong> Land Use Goal 3 as a tool for promoting<br />
compact urban form, but specific actions to promote TOD are not<br />
listed. The Circulation element acknowledges that the town is currently<br />
auto-oriented and “planning for future transit improvements is<br />
challenging due to Marana’s large land area, rural nature, low density<br />
<strong>of</strong> development, and diverse transportation needs.” The Circulation<br />
element also states that “transit improvements will be needed to<br />
provide safe, convenient, and accessible transit choices within and<br />
beyond the community” and “Public transit must be developed as a<br />
convenient, accessible alternative to vehicles, particularly for<br />
commuting to work.” Circulation Goals 1 and 2 discuss a long-term,<br />
full-service circulation system that includes multiple transportation<br />
modes. Circulation Goal 3 is about bicycle-friendliness.<br />
Intercity rail between Tucson and Phoenix is mentioned. CRT<br />
evaluation will be part <strong>of</strong> intercity rail planning.<br />
Development <strong>of</strong> a Town Center with higher-density housing and mix <strong>of</strong><br />
uses is desired. However, “residential communities will remain the<br />
dominant type <strong>of</strong> land development over the next two decades.”<br />
These communities may include a mix <strong>of</strong> uses, but they are a<br />
consequence <strong>of</strong> residential growth, not a generator <strong>of</strong> residential<br />
growth.<br />
“Areas along I-10 are particularly appropriate for commerce parks,<br />
industry, tourist services, and warehousing.”<br />
Medium Density Residential allows up to 8 units per acre; High<br />
Density Residential requires at least 8 units per acre. All residential<br />
designations appear to allow supportive non-residential development.<br />
Commercial allows mixed uses. Town Center Planning Area allows<br />
mixed uses and requires pedestrian-oriented circulation. Mixed Rural<br />
does not allow HCT-supportive densities. Master Plan Area allows<br />
mixed uses but may or may not be HCT-supportive. Transit is not<br />
specifically mentioned.<br />
However, the General Plan states, “Areas along I-10 are particularly<br />
appropriate for commerce parks, industry, tourist services, and<br />
warehousing.”<br />
Housing mix is addressed in the context <strong>of</strong> residential subdivisions.<br />
Land Use Goal 3 also discusses it.<br />
Much <strong>of</strong> the existing land in the town is vacant, so infill and<br />
redevelopment do not appear to be significant issues.<br />
Coordination with Sun Tran about transit is part <strong>of</strong> the Circulation<br />
element. Coordination regarding intergovernmental services and<br />
facilities is addressed in Cost <strong>of</strong> Development Goal 5.<br />
B-15
High Capacity Transit System Plan - <strong>Final</strong> <strong>Report</strong> June 2009<br />
Appendix B<br />
Observations and suggested amendments to the General Plan are as follows:<br />
• Overall, the Town <strong>of</strong> Marana General Plan contains much that is supportive <strong>of</strong> HCT and<br />
TOD. Zoning regulations and development standards are not so supportive.<br />
• The Circulation element discusses in detail the value <strong>of</strong> future investments in alternative<br />
modes (including transit). This perspective is not reflected in other General Plan elements.<br />
• The Cost <strong>of</strong> Development element lists a construction sales tax and improvement districts<br />
among current funding sources.<br />
• The project team notes that commercial uses are <strong>of</strong>ten considered in the General Plan as a<br />
consequence <strong>of</strong> residential growth, not a generator <strong>of</strong> residential growth.<br />
• To support HCT, consideration should be given to creating opportunities for mixed<br />
residential and non‐residential uses in HCT station areas along I‐10.<br />
• Much <strong>of</strong> the existing land in the town is vacant, so infill and redevelopment do not appear<br />
to be significant issues at this time.<br />
Zoning and Development Standards<br />
Relevant Town <strong>of</strong> Marana zoning regulations and development standards are in Titles 5, 7, 8, 22,<br />
and 28 <strong>of</strong> the Land Development Code.<br />
Table B-10<br />
HCT-Supportive Component<br />
Are there TOD-specific zoning<br />
designations?<br />
Are there mixed-use zoning<br />
designations?<br />
Are densities and intensities<br />
specified for zoning<br />
designations?<br />
Town <strong>of</strong> Marana Zoning and Development Standards<br />
No<br />
Maybe<br />
Maybe<br />
Comments<br />
Pre-1993 Designations<br />
Transportation Corridor Zone does not allow residential uses, but<br />
non-residential uses are permitted. The Specific Plan Zone may<br />
or may not be applicable.<br />
Post-1993 Designations<br />
There is one mixed-use designation—MU-1 Mixed-Use—but it is<br />
intended for “low density mixed uses in areas <strong>of</strong> the Town where<br />
public facilities and utilities may be limited.” This definition is<br />
not the definition used in this report. The Commercial<br />
designations allow commercial, <strong>of</strong>fice, public, and multi-family<br />
uses. The only non-residential uses allowed under the<br />
Residential zoning designations appear to be those that support<br />
the proximate residential uses.<br />
Pre-1993 Designations<br />
Densities and intensities are not specified for all but one <strong>of</strong> the<br />
designations. Densities and intensities are controlled by<br />
setbacks, lot size, and other regulations. Small Lot Zone is likely<br />
the densest designation. Large Lot Zone requires one dwelling<br />
unit or one non-residential establishment per 25 acres.<br />
Post-1993 Designations<br />
Densities and intensities are specified in terms <strong>of</strong> minimum lot<br />
sizes and maximum allowable lot coverage. R-12 Residential is<br />
likely the least dense Residential zoning that could support HCT.<br />
Commercial, Neighborhood Commercial, Village Commercial,<br />
and Campus Building Center could support HCT; FAR and<br />
building height may be limiting Commercial factors.<br />
B-16
High Capacity Transit System Plan - <strong>Final</strong> <strong>Report</strong> June 2009<br />
Appendix B<br />
HCT-Supportive Component<br />
Are building heights specified<br />
for zoning designations?<br />
Do zoning designations promote<br />
use <strong>of</strong> non-auto modes, infill,<br />
redevelopment, mixed uses,<br />
TOD, and HCT?<br />
Do development standards<br />
promote use <strong>of</strong> non-auto modes,<br />
infill, redevelopment, mixed<br />
uses, TOD, and HCT?<br />
Do parking standards promote<br />
use <strong>of</strong> non-auto modes, infill,<br />
redevelopment, mixed uses,<br />
TOD, and HCT?<br />
Maybe<br />
Maybe<br />
Maybe<br />
No<br />
Comments<br />
Pre-1993 Designations<br />
Buildings heights are not specified.<br />
Post-1993 Designations<br />
Buildings heights are specified. Upper floor setbacks are part <strong>of</strong><br />
some <strong>of</strong> the residential zoning designations.<br />
Pre-1993 Designations<br />
There is no promotion <strong>of</strong> these outcomes.<br />
Post-1993 Designations<br />
Promotion <strong>of</strong> these outcomes is very limited and is not detailed.<br />
Access requirements for Neighborhood Commercial, Village<br />
Commercial, and Campus Business Center are auto-oriented.<br />
The multi-family Residential designations are intended to<br />
“provide a housing type needed within the community when<br />
public and private facilities are available to serve the higher<br />
residential, such as public and private transportation systems....”<br />
Pedestrian circulation must be addressed according to the<br />
Regional Commercial zoning designation.<br />
There is promotion <strong>of</strong> outcomes that are not transit-specific.<br />
Residential building heights, setbacks, and lot coverage limits<br />
can be increased with Council approval and under certain<br />
conditions. “All subdivisions shall contribute to the Town’s<br />
regional park and trail system....” “Paths or trails within<br />
subdivisions shall be designed to link neighborhood<br />
components and amenities and connect to adjacent<br />
subdivisions.” An Alternative Neighborhood Design Plan allows<br />
flexibility consistent with TOD. Commercial design standards<br />
require “safe, efficient, and convenient vehicular and pedestrian<br />
access and circulation patterns within and between<br />
developments.” Plazas and other gathering spaces are<br />
encouraged; TOD presents and opportunity for this.<br />
Shared parking and parking-related incentives are not addressed<br />
in Title 22 <strong>of</strong> the Land Development Code.<br />
Observations and suggested amendments to the Land Development Code are as follows:<br />
• The Town has two sets <strong>of</strong> zoning designations. The first applies to properties that have not<br />
been re‐designated since April 1993. The second applies to properties that were<br />
designated or re‐designated after April 1993.<br />
• Transportation Corridor Zone (pre‐1993) does not allow residential development and<br />
likely applies to I‐10, in which case the zoning designation does not support HCT and<br />
TOD. Allowing residential in this zone should be considered.<br />
• The only <strong>of</strong>ficial “mixed‐use” zoning designation is MU‐1 Mixed‐Use, but it is intended<br />
for “low density mixed uses in areas <strong>of</strong> the Town where public facilities and utilities may<br />
be limited.” A mixed‐use designation that is HCT‐supportive or a new land use<br />
designation such as “TOD District” should be developed. This should be coordinated on a<br />
regional level with other local governments.<br />
• Densities and intensities are specified in terms <strong>of</strong> minimum lot sizes and maximum<br />
allowable lot coverage. R‐12 Residential is likely the least dense Residential zoning that<br />
could support HCT. Commercial, Neighborhood Commercial, Village Commercial, and<br />
B-17
High Capacity Transit System Plan - <strong>Final</strong> <strong>Report</strong> June 2009<br />
Appendix B<br />
Campus Building Center could support HCT; FAR and building height may be limiting<br />
Commercial factors.<br />
• Access requirements under the zoning designations should address non‐auto mode<br />
connectivity. Pedestrian connectivity is already assessed in the development standards,<br />
but transit and bicycle connectivity should also be addressed in the development<br />
standards.<br />
• The land development code encourages plazas and other public gathering spaces. TOD<br />
and HCT present an opportunity to develop such spaces.<br />
• Shared parking and parking‐related incentives are not addressed in Title 22 <strong>of</strong> the Land<br />
Development Code.<br />
B-18
High Capacity Transit System Plan September 2009<br />
Appendix C<br />
APPENDIX C:<br />
Public and Agency<br />
Involvement<br />
C-1
High Capacity Transit System Plan September 2009<br />
Appendix C<br />
SUMMARY OF TECHNICAL ADVISORY COMMITTEE MEETING #2 ‐ DRAFT<br />
PAG HIGH CAPACITY TRANSIT STUDY<br />
Date: June 24, 2008<br />
Participants: Cheri Campbell, PAG<br />
Jeremy Papuga, PAG<br />
Ann Chanecka, PAG<br />
Jim Schoen, Kittelson & Associates, Inc.<br />
Kelly Blume, Kittelson & Associates, Inc.<br />
Ramzi Awwad, Kittelson & Associates, Inc.<br />
Aimee Ramsey – Town <strong>of</strong> Oro Valley Transit Administrator<br />
Pat McGowan – <strong>Pima</strong> County Public Transportation Program Manager<br />
Tom Fisher – City <strong>of</strong> Tucson Department <strong>of</strong> Transportation, Transit<br />
Artemio Hoyos – Pascua Yaqui Tribe Planner<br />
Dennis Cady – Tucson Airport Authority<br />
Summary:<br />
The meeting opened with an introduction <strong>of</strong> those present.<br />
C-2
High Capacity Transit System Plan September 2009<br />
Appendix C<br />
Kelly Blume conducted a presentation reviewing Technical Memorandum #1,<br />
introducing the next steps for Technical Memorandum #2, and reviewing the project<br />
schedule.<br />
Subsequent to the review <strong>of</strong> Technical Memorandum #1, comments were sought and<br />
those that were made are highlighted as follows:<br />
• The proposed Oracle Road Corridor should connect to the proposed Tangerine<br />
Road Corridor.<br />
• For the Tucson Airport property, consider using the terminal portion <strong>of</strong> the<br />
property only when analyzing the employment density. Also consider the hotels<br />
nearby with high employment.<br />
• Consider obtaining the passenger per day information for the Tucson Airport as<br />
a better indicator <strong>of</strong> travel demand.<br />
• Consider an East/West route along Valencia Road providing service to the<br />
airport<br />
• Providing Commuter Rail from Tucson to Phoenix without extending the service<br />
to the Tucson Airport would have a negative impact on the airport. Consider<br />
extending commuter rail to the Tucson Airport as this would have a positive<br />
impact.<br />
• It is premature to screen out Light Rail Transit (LRT) at this point. Consider how<br />
installing such a system would affect and change densities as well as the possible<br />
changes in travel behavior caused by the dramatic increases <strong>of</strong> fuel prices.<br />
Kittelson & Associates Response: LRT is now being considered as an option for the Broadway<br />
Boulevard Corridor. It is also now being considered as a near term (2030) option for the<br />
Oracle Road Corridor and the South Campbell Avenue/Kino Parkway Corridor.<br />
• Consider the effect <strong>of</strong> Commuter Rail on the neighboring county to the north.<br />
C-3
High Capacity Transit System Plan September 2009<br />
Appendix C<br />
• A figure showing all bus stops with a dot representing the stops, scaled<br />
according to the number <strong>of</strong> boardings per day would be useful. The data for the<br />
number <strong>of</strong> boardings at each stop is available.<br />
• Near term (2030) does not show LRT for any corridors. Could this change based<br />
on the application <strong>of</strong> additional criteria?<br />
Kittelson & Associates Response: Application <strong>of</strong> additional criteria would change the<br />
potential high capacity transit mode and LRT would be included as a possibility for some<br />
corridors in the near term (2030).<br />
• For the 6 th Avenue Corridor and the Campbell Avenue Corridor, Street Car (SC)<br />
is shown as a possible mode; however, LRT is not shown as a possible mode.<br />
Why is this the case?<br />
Kittelson & Associates Response: For these corridors, it is expected that the trips will be<br />
shorter in length and the number <strong>of</strong> stops are expected to be greater. This is more conducive<br />
to SC and less desirable for LRT.<br />
• Various examples <strong>of</strong> Bus Rapid Transit (BRT) have been discussed; will the study<br />
recommend a particular type?<br />
Kittelson & Associates Response: Yes, this will be based on types that are available as well as<br />
community development.<br />
• Consider options that would be applicable in a time frame that is nearer than<br />
2030.<br />
• Consider studying the existing LOS <strong>of</strong> the current local bus service as an<br />
indicator <strong>of</strong> the possible success <strong>of</strong> the proposed high capacity transit solutions.<br />
• Consider a way to provide high capacity transit connecting the Tucson Airport<br />
and the Raytheon complex.<br />
• Consider the location <strong>of</strong> existing Transit Centers and Park/Ride lots as part <strong>of</strong> the<br />
evaluation <strong>of</strong> possible corridors as well as the impacts <strong>of</strong> relocating these<br />
facilities.<br />
C-4
High Capacity Transit System Plan September 2009<br />
Appendix C<br />
• Is the price <strong>of</strong> fuel considered in the corridor ridership estimation methodology?<br />
Kittelson & Associates Response: Although the details <strong>of</strong> the corridor ridership estimation<br />
methodology are not available to present at this time, “economic incentive” will be included<br />
in the methodology.<br />
• Consider discussions with City <strong>of</strong> Tucson Planners and with <strong>Pima</strong> County<br />
Planners.<br />
• Consider obtaining more information on the progress <strong>of</strong> the City <strong>of</strong> Phoenix LRT<br />
system.<br />
Kittelson & Associates Response: A day trip to Phoenix to collect information would be<br />
beneficial and September is suggested as a suitable time. (PAG staff indicated that they would<br />
take the lead in organizing the group <strong>of</strong> TAC members that would be interested in this event)<br />
C-5
High Capacity Transit System Plan September 2009<br />
Appendix C<br />
PAG HIGH CAPACITY TRANSIT STUDY<br />
SUMMARY OF TECHNICAL ADVISORY COMMITTEE MEETING #3 ‐<br />
DRAFT<br />
Date: October 14, 2008<br />
Participants: Cherie Campbell, PAG<br />
Jeremy Papuga, PAG<br />
Gabe Thum, PAG<br />
Ann Chanecka, PAG<br />
Dick Davis, PAG<br />
Paul Casertano, PAG<br />
Tom Fisher, City <strong>of</strong> Tucson Department <strong>of</strong> Transportation, Transit<br />
Pat McGowan, <strong>Pima</strong> County Public Transportation Program Manager<br />
Tom Amparano, University <strong>of</strong> Arizona<br />
Jim Schoen, Kittelson & Associates, Inc. (KAI)<br />
Kelly Blume, KAI<br />
Summary:<br />
The meeting opened with introductions.<br />
Kelly Blume then gave a presentation reviewing Technical Memorandum #2 (Task 5),<br />
introducing next steps for Technical Memorandum #3 (Task 6), and reviewing the<br />
project schedule.<br />
Highlights <strong>of</strong> the subsequent discussion (with KAI responses and follow‐up information<br />
in italics) are as follows:<br />
• The project team’s two recommended alternatives for more detailed study in<br />
Task 6 are BRT on Broadway Boulevard (Corridor 2B) and streetcar on 6th<br />
Avenue South/Kino Parkway (Corridor 13).<br />
The project team intends to move forward into Task 6 and complete more detailed<br />
analysis <strong>of</strong> these two alternatives. Task 6 will be focused on implementing HCT in the<br />
near and mid term. It will produce refined alignments and station locations for the two<br />
alternatives recommended in Task 5, compare an HCT system with the two alternatives<br />
to a baseline condition, and discuss systemwide strategies to support development <strong>of</strong> the<br />
two alternatives in the near and mid term as well as the other alternatives in the long<br />
term. (The other alternatives will be addressed again in Task 7.) The product <strong>of</strong> Task 6<br />
C-6
High Capacity Transit System Plan September 2009<br />
Appendix C<br />
may be hybrid HCT alternatives that consider interconnections with other transit<br />
services (including the initial streetcar project).<br />
• Corridor 3 (Campbell Avenue North) ridership projections seem low. Route 15<br />
buses are <strong>of</strong>ten full. Buses on Broadway Boulevard are over‐crowded now.<br />
The project team will review the ridership projections to ensure that the projections’<br />
relationship to ridership on local bus services is understood. HCT ridership consists <strong>of</strong><br />
riders who previously made the trip by local bus, riders who previously drove, and riders<br />
who are making new trips. Where local bus service is maintained after implementation <strong>of</strong><br />
HCT, some riders will continue to use local bus service for reasons such as the local bus<br />
serving a stop that is closer to the rider’s origin or destination.<br />
• All <strong>of</strong> the projects in the 2030 RTP are assumed to be built out in 2040.<br />
• The new Sun Tran maintenance facility will include two bays for 60’ buses. It<br />
will be finished within three years.<br />
• Add corridor names to the scoring matrix. Alternative numbers alone is a little<br />
confusing.<br />
The project team will be clearer in Technical Memorandum 3.<br />
• We need to eliminate adding another streetcar garage facility for the streetcar<br />
alternatives (e.g., Campbell Avenue North) since one will be constructed with the<br />
initial streetcar phase. The garage that will be constructed with the initial<br />
streetcar project is large and may have enough capacity for more vehicles.<br />
The project team will ensure that refined capital costs account for the opportunity to use<br />
the initial streetcar service’s garage if the garage has adequate capacity or can be<br />
expanded.<br />
• Make sure the high costs <strong>of</strong> fuel right now are included in operating costs.<br />
The project team will use unit operating cost data that reflect increasing fuel costs.<br />
• “Evolution” is a key word for development <strong>of</strong> the HCT system.<br />
• Can we adjust the land use and zoning in the model to reflect TOD, particularly<br />
on Broadway? Check with the City’s urban planning department.<br />
The project team has relied on the 2040 model to date, but, if PAG agrees and the project<br />
budget permits, we can look at alternative land use scenarios. We would like to note,<br />
however, that FTA is not likely to award funding to a project if transit‐supportive land<br />
uses and development standards have not already been incorporated into a comprehensive<br />
plan or land development code.<br />
• There will be an Urban Land Institute conference on December 3 at the Tucson<br />
Convention Center.<br />
C-7
High Capacity Transit System Plan September 2009<br />
Appendix C<br />
This event is entitled “ULI Arizona ‐ Crafting Tomorrowʹs Built Environment.” There<br />
is currently little detail about this event at www.uli.org.<br />
• Combine the Campbell Avenue North and South corridors. Consider serving<br />
Tucson Mall with the combined route.<br />
This may be an excellent alternative for longer term implementation.<br />
• Campbell Avenue North might be re‐constructed as a “transit street” with only<br />
two lanes for autos.<br />
This is an excellent idea, and it can be implemented in concert with HCT, as a precursor<br />
to HCT, or as a separate investment.<br />
• Projects such as BRT on Broadway Boulevard can be implemented in the near<br />
term for relatively low cost.<br />
• Sun Tran has Gillig BRT vehicles are on order.<br />
A low‐floor Gillig BRT vehicle is shown below for the TAC’s information. This vehicle is<br />
increasingly popular for BRT and non‐BRT applications because <strong>of</strong> its enhanced styling.<br />
C-8
High Capacity Transit System Plan September 2009<br />
Appendix C<br />
SUMMARY OF TECHNICAL ADVISORY COMMITTEE MEETING #4<br />
PAG HIGH CAPACITY TRANSIT STUDY<br />
Date: April 23, 2009<br />
Participants: Cheri Campbell, PAG<br />
Jeremy Papuga, PAG<br />
Aimee Ramsey – Town <strong>of</strong> Oro Valley Transit Administrator<br />
T. Van Hook – Town <strong>of</strong> Marana Director <strong>of</strong> Community Development<br />
Tom Fisher – City <strong>of</strong> Tucson Department <strong>of</strong> Transportation, Transit<br />
Jim Schoen, Kittelson & Associates, Inc.<br />
Kelly Blume, Kittelson & Associates, Inc.<br />
Ramzi Awwad, Kittelson & Associates, Inc.<br />
Summary:<br />
The meeting opened with an introduction <strong>of</strong> those present.<br />
Kelly Blume, Jim Schoen, and Ramzi Awwad conducted a presentation reviewing<br />
Technical Memorandum #4.<br />
During and subsequent to the presentation, comments were sought and those that were<br />
made are highlighted as follows:<br />
C-9
High Capacity Transit System Plan September 2009<br />
Appendix C<br />
• Consider providing design guidelines for bus pullouts and other HCT<br />
components <strong>of</strong> roadway projects. A document providing guidelines for bus<br />
pullouts is currently under development.<br />
• The Tucson Modern Streetcar has a public‐private partnership component. A<br />
development company is building the last segment <strong>of</strong> the streetcar.The proposed<br />
Oracle Road Corridor should connect to the proposed Tangerine Road Corridor.<br />
• Note that the Town <strong>of</strong> Marana currently uses a “Facility Improvement District”<br />
fee on Tangerine Road. This fee is $600 and is paid upon the sale <strong>of</strong> the property.<br />
• Consider providing guidance for local initiatives/process that could serve as an<br />
alternative to federal funding or as a match for federal funding.<br />
• Consider providing a map that suggests locations <strong>of</strong> TOD appropriate<br />
areas/districts, or transit supportive areas.<br />
• Consider providing cost estimates under various scenarios. For example, provide<br />
a cost with minimal amenities, and a cost with various levels <strong>of</strong> amenities.<br />
• Consider seeking input from the ADOT TAC member.<br />
C-10
<strong>Pima</strong> <strong>Association</strong> <strong>of</strong> <strong>Governments</strong><br />
High Capacity Transit<br />
Public Open House<br />
Tuesday, October 28, 2008<br />
Meeting Summary Information<br />
Kittelson & Associates<br />
Gordley Design Group
Transportation Public Meetings<br />
High Capacity Transit Project<br />
March 18 through Match 24, 2009<br />
Presented to:<br />
Kittelson and Associates, Inc.<br />
Gordley Design Group<br />
2009
Kittelson and Associates, Inc.<br />
<strong>Pima</strong> <strong>Association</strong> <strong>of</strong> <strong>Governments</strong> (PAG)<br />
Transportation Improvement Program Public Meetings<br />
High Capacity Transit Project<br />
March 2009<br />
Date, Location and Time<br />
o Joyner-Green Valley Library – Green Valley<br />
o Wednesday, March 18, 2009<br />
o 11 a.m. – 12:30 p.m.<br />
o Randolph Clubhouse – Tucson Metropolitan Area<br />
o Thursday, March 19, 2009<br />
o 4:30p.m.<br />
o Foothills Mall, Food Court – Northwest <strong>Pima</strong> County<br />
o Friday, March 20, 2009<br />
o 4:30 – 6:30 p.m.<br />
o Desert Sky Middle School – Southeast <strong>Pima</strong> County<br />
o Tuesday, March 24<br />
o 4:30 p.m.<br />
Format<br />
• Open house with displays and one-on-one interaction<br />
All public notification was handled by PAG<br />
Governmental Notification<br />
• Official letter announcing meeting e-mailed:<br />
o Week <strong>of</strong> Jan. 5, 2009<br />
o E-mailed notifications to government <strong>of</strong>ficials in multiple jurisdictions<br />
Public Notification<br />
• Flier invitation e-mailed:<br />
o Week <strong>of</strong> March 9, 2009<br />
o E-mailed to approximately 137 neighborhood associations and 12 bicycle shops in Tucson<br />
vicinity.<br />
• Newspaper notification:<br />
o Arizona Daily Star Sunday Edition – March 15, 2009<br />
• Press Release:<br />
o Arizona Daily Star<br />
o Green Valley News<br />
• Web site:<br />
o Meeting date and time was posted on the PAG Web site<br />
Team Attendance<br />
• PAG: Jeremy Papuga representing High Capacity Transit Project<br />
• Kittelson and Associates, Inc.: Jim Schoen<br />
• Gordley Design Group: Jan Gordley, Susan Parcells<br />
•<br />
Total Public Attendance<br />
• 61<br />
1
Kittelson and Associates, Inc.<br />
Comments<br />
• 15 comments were received during public open houses<br />
Materials<br />
• Comment forms for High Capacity Transit Project<br />
• Sign-in sheets<br />
Web site materials<br />
• Meeting notification<br />
Displays<br />
• High Capacity Transit Project display<br />
• Arizona Department <strong>of</strong> Transportation Building a quality Arizona (BqAZ) display<br />
• Marana Development display<br />
• <strong>Pima</strong> County Bike Advisory Coalition (BAC) Bike and Pedestrian display<br />
Room Set-up<br />
• Sign-in table<br />
• Display areas set up around the rooms or in the public locations<br />
Signs<br />
• A-frame signs to direct the public to the display’s within the mall food court.<br />
2
<strong>Pima</strong> <strong>Association</strong> <strong>of</strong> Governement Transportation Planning Open House - Hign Capacity Transit<br />
March 18 through March 24, 2009<br />
1. Do you agree with the corridors that were recommended as priority capacity transit corridors in the<br />
plan? If not, what three corridors should be given the highest priority?<br />
Green Valley<br />
Yes<br />
Yes<br />
Randolf Clubhouse Foothills Mall<br />
These corridors look reasonable Yes<br />
Since the corridors do not No we have bigger problems to<br />
encompass my needed fix in government, Them roads,<br />
transportation I cannot comment transit and busses<br />
on the usage level for these<br />
corridors. If it is where a good<br />
study says ridership is, that's<br />
where the corridor should be.<br />
Desert Sky Middle School<br />
University-Downtown<br />
Broadway-Downtown,<br />
Speedway-Downtown and ,<br />
Grant Road<br />
I agree<br />
We really need a north/south<br />
and an east/west corridor and<br />
maybe high speed loop.<br />
Adequate for now if the water Yes I agree with the corridors<br />
supply is available to support the also I think that Oracle Rd.- Ina<br />
projected population growth. Rd., Skyline/Sunrise and Swan<br />
Road should be considered as<br />
strongly.<br />
Agree somewhat, 6th Ave. is a<br />
good location. Not sure about<br />
Broadway. Stops need to be<br />
strategically located. Citizens<br />
need to start reconfiguring land<br />
they have purchased.<br />
2. Is there a particular high capacity transit system mode that is more attractive that others (Bus Rapid<br />
Transit, light rail, etc. Would you be more likely to use one over the other?<br />
Green Valley<br />
Randolf Clubhouse<br />
Foothills Mall<br />
Desert Sky Middle School<br />
Bus from Green Valley<br />
The mode would have to be<br />
wheelchair accessible. They<br />
should use a mode that is<br />
flexible- a bus can be moved<br />
from one route to another. Trains<br />
that use cables or rails cold not<br />
move as easily.<br />
Light rail and a train to Phoenix.<br />
Light rail in more attractive, I<br />
would be more likely to use.<br />
Light rail<br />
Light rail unless some future<br />
technology creates an<br />
environmentally friendly bus.<br />
Maybe and electric bus.<br />
No<br />
Page 1 <strong>of</strong> 3
Bus- Flexible<br />
Light rail<br />
Express bus service on an<br />
hourly basis.<br />
Most light rail, Bus<br />
I am in favor <strong>of</strong> electric rail like in<br />
Europe. Like the system in<br />
London. We could use a<br />
combination <strong>of</strong> ground and<br />
elevated.<br />
I think Rapid Bus Transit would<br />
be more feasible for the space.<br />
Need to examine<br />
Monorail/raised elevation. More<br />
<strong>of</strong> a long term solution, unless<br />
you going to use UPRR rails.<br />
3. If high capacity transit were available in a corridor, how likely would you use it?<br />
Green Valley<br />
Somewhat likely<br />
Very likely<br />
Randolf Clubhouse<br />
Somewhat unlikely, due to<br />
Depends on whether the<br />
corridors were where I needed<br />
to go. None <strong>of</strong> the proposed one<br />
meet that criteria.<br />
Very likely<br />
Very likely<br />
Somewhat likely, depending on<br />
the destination<br />
Foothills Mall<br />
I think you need to look<br />
Very likely if it were cost<br />
effective and went where I need<br />
to go. And reliable.<br />
Very likely<br />
No<br />
Very likely<br />
Desert Sky Middle School<br />
Very likely if there were<br />
4. If you would use the high capacity transit, how <strong>of</strong>ten would you ride it?<br />
Green Valley<br />
A few times a month<br />
Once a week<br />
Randolf Clubhouse<br />
Less than a few times a month<br />
Everyday if the corridor were<br />
close enough to walk and where<br />
I need it to go. Not all <strong>of</strong> the<br />
proposed corridors meet that<br />
requirement.<br />
Foothills Mall<br />
Few times a month<br />
If possible 3-4 times a week,<br />
during my work week. To save<br />
money, gas, vehicle wear and<br />
our environment, I currently<br />
commute 4 times a week.<br />
Desert Sky Middle School<br />
2-3 times a week<br />
Everyday<br />
Once a week<br />
No<br />
4 times a week<br />
Every available opportunity.<br />
2-3 times a week<br />
5. Would you consider moving closer to a high capacity transit route or line if it were available?<br />
Green Valley<br />
No<br />
Randolf Clubhouse Foothills Mall<br />
No not at this time<br />
If the routes went where I need<br />
to go.<br />
Desert Sky Middle School<br />
No, I just bought a house and<br />
will not move.<br />
No<br />
Yes<br />
Yes<br />
No<br />
Yes<br />
Page 2 <strong>of</strong> 3
No, not at this time I already live<br />
near the proposed line.<br />
Depends on the rent/housing<br />
and crime in the area.<br />
No<br />
That depends on the<br />
affordability and flexibility to<br />
move. We currently live in the<br />
city, yet mass transit focuses<br />
moving people from suburban<br />
sprawl to a few centers. Transit<br />
in this city is inefficient and<br />
difficult.<br />
Yes<br />
6. Should high capacity transit have a higher priority than currently planned roadway improvements?<br />
Green Valley<br />
Yes<br />
Randolf Clubhouse<br />
Desert Sky Middle School<br />
They are both priorities<br />
No, I think more people will use<br />
the roadway, including bicyclists<br />
and pedestrians.<br />
Foothills Mall<br />
No, roads need improvement<br />
now, but mass transit<br />
improvements need to continue,<br />
it will take longer to implement.<br />
No<br />
Yes<br />
6th Ave- Yes, Broadway No.<br />
Infrastructure not set the City<br />
seems to be lagging.<br />
No<br />
Yes, Current roads are not<br />
sustainable from wage point <strong>of</strong><br />
view. The number <strong>of</strong> cars keeps<br />
increasing, inefficient.<br />
No, high capacity transit has too<br />
limited focus in a few corridors.<br />
Personal transportation will<br />
remain the important overall<br />
mode, and require considerable<br />
improvement.<br />
I am on the fence on this. We<br />
need this system. However<br />
something has to be done about<br />
these roadways. The<br />
construction should be out <strong>of</strong><br />
state companies that can<br />
complete contracts in a timely<br />
manner.<br />
The current planned roadway<br />
improvements are necessary,<br />
and <strong>of</strong>fer a more timely<br />
completion to ease congestion.<br />
Also most <strong>of</strong> planned roadways<br />
enhance bike paths.<br />
Page 3 <strong>of</strong> 3
High Capacity Transit System Plan September 2009<br />
Appendix D<br />
APPENDIX D:<br />
HCT Infrastructure<br />
Planning<br />
D-1
High Capacity Transit System Plan September 2009<br />
Appendix D<br />
HCT Infrastructure Planning<br />
Infrastructure requirements for HCT systems depend heavily on the technology that is<br />
to be implemented. Express bus service simply requires park‐&‐ride facilities located at<br />
appropriate points along a route, while BRT and rail‐based technologies (street car or<br />
LRT) can require significant and costly infrastructure improvements, including exclusive<br />
lanes or running ways, new or widened structures (bridges, culverts, etc.), and transit<br />
stations/park & ride facilities. In order to reduce the overall cost <strong>of</strong> HCT<br />
implementation as well as secure needed right‐<strong>of</strong>‐way, including HCT system<br />
infrastructure requirements in regional and local long range plans is necessary. Based<br />
on the HCT system implementation plan defined in this study, the following<br />
infrastructure planning is recommended.<br />
Broadway Boulevard<br />
Refer to Section 6.3 and Figure 62 for infrastructure recommendations<br />
6 th Avenue/Nogales Highway<br />
Refer to Section 6.3 and Figure 63 for infrastructure recommendations<br />
Campbell Avenue (North)<br />
Refer to Section 6.3 and Figure 64 for infrastructure recommendations<br />
Speedway Boulevard<br />
Planned HCT service includes express bus initially, with potential longer term<br />
implementation <strong>of</strong> BRT in general purpose lanes. Park & ride lots should be planned in<br />
the vicinity <strong>of</strong> the Craycr<strong>of</strong>t Road or Kolb Road intersections. BRT stations, which could<br />
be associated with park & ride facilities or transit oriented development should be<br />
planned at approximately 1‐mile spacing, preferably at major intersections.<br />
Campbell Avenue/Kino Parkway<br />
Planned HCT service between the U <strong>of</strong> A and TIA includes express bus service,<br />
potentially evolving to BRT operating in general purpose lanes. Park & ride lots are<br />
envisioned south <strong>of</strong> the U <strong>of</strong> A between Broadway Boulevard and 6 th Street, between<br />
Valencia Road and Irvington Road, and north <strong>of</strong> I‐10 at the planned biotechnology park.<br />
BRT stations, located at major intersections or transit oriented developments should be<br />
spaced one‐mile or more apart.<br />
Oracle Road<br />
Proposed long term service within the Oracle Road corridor is envisioned to be BRT<br />
operating in general purpose lanes south <strong>of</strong> Ina Road and potentially exclusive lanes to<br />
the north. Expansion <strong>of</strong> existing express bus service on Oracle Road is recommended in<br />
the near term. HCT infrastructure planning would include preserving right‐<strong>of</strong>‐way<br />
along both sides <strong>of</strong> Oracle Road from Ina Road to the Pinal County line. Park & ride<br />
D-2
High Capacity Transit System Plan September 2009<br />
Appendix D<br />
facilities along Oracle Road should be planned in the vicinity <strong>of</strong> Tangerine Road, First<br />
Avenue and either Magee or Ina Road. BRT station planning should focus on major<br />
intersections or destinations (Honeywell, Tucson Mall, PCC Downtown Campus), major<br />
intersections, and transit oriented developments. BRT stations should be located at onemile<br />
spacing or greater.<br />
I-10, Marana to Downtown; Vail to Downtown<br />
I-19, Sahuarita to Downtown<br />
Planning for HCT includes expanding express bus service with BRT and potentially<br />
commuter rail service (CRT) as the ultimate transit service. Expanded express bus<br />
service would require provision <strong>of</strong> additional park & ride facilities. On I‐10 park & ride<br />
lots should be planned in the vicinity <strong>of</strong> the Marana Road, Tangerine Road, Twin Peaks,<br />
and possibly Ina Road interchanges. Park & ride lots should also be planned in the<br />
vicinity <strong>of</strong> the Vail Road and Kolb Road interchanges. On I‐19, park & ride should be<br />
planned in the vicinity <strong>of</strong> the Sahuarita Road and the Valencia Road interchanges.<br />
BRT planning should focus on identifying station locations at interchanges along each<br />
route. Since BRT service within the I‐19 corridor could run along Old Nogales Highway,<br />
planning should include preserving right‐<strong>of</strong>‐way for an exclusive running way and<br />
providing BRT stations at key destinations (e.g. Raytheon), major intersections, and<br />
transit oriented developments with stations spaced no closer than one mile.<br />
Grant Road<br />
Near term HCT includes express bus service with the potential <strong>of</strong> BRT running in<br />
general use lanes in the long‐term. A park & ride lot should be considered in the<br />
vicinity <strong>of</strong> Kolb Road or Craycr<strong>of</strong>t Road. BRT stations would occur at major<br />
intersections or at transit oriented development with minimum spacing <strong>of</strong> one mile. As<br />
part <strong>of</strong> the Grant Road improvement project, identifying locations for future BRT<br />
stations should be considered.<br />
Valencia Road<br />
Express bus service could potentially grow into a BRT line along Valencia Road from<br />
Ajo Way to Houghton Road. While existing park & ride facilities at Casino del Sol and<br />
on Houghton Road south <strong>of</strong> Valencia Road will serve initial demand, additional<br />
facilities should be considered at Kolb Road and I‐10. S<br />
Houghton Road<br />
Existing park & ride lots at Broadway Boulevard and Old Vail Road will serve express<br />
bus service along Houghton Road, which would likely be tied into service running on I‐<br />
10, Broadway Boulevard, or Speedway Boulevard.<br />
D-3
High Capacity Transit System Plan September 2009<br />
Appendix D<br />
Transit Stations<br />
Figure D‐1 presents existing and potential future locations for park & ride lots which<br />
would initially serve express bus service and could be tied into a BRT or LRT station in<br />
the future. Note that while general HCT infrastructure requirements are identified,<br />
specific requirements can only be determined based on more detailed evaluation <strong>of</strong> each<br />
<strong>of</strong> the HCT corridors. This was carried out for three <strong>of</strong> the HCT corridors – Broadway<br />
Boulevard, 6 th Avenue/Nogales Highway, and Campbell Avenue (North), and is<br />
described in Section 6.3 <strong>of</strong> this report.<br />
A discussion <strong>of</strong> potential station models that might be appropriate in the PAG region is<br />
provided in Section 9.2 <strong>of</strong> this report. While there is no typical model, stations should be<br />
located where residential and commercial densities encourage transit ridership, there is<br />
a mix <strong>of</strong> land uses, and there is a pedestrian focus. Station area options include:<br />
• Regional Center. Primary centers <strong>of</strong> activity in any region. Characterized by a<br />
dense mix <strong>of</strong> housing, employment, regional retail, and entertainment. Typical<br />
residential density is 75‐300 units per acre, and typical employment floor area<br />
ratio (FAR) is 5.0. Served by mix <strong>of</strong> transit modes, including HCT. Typical peak<br />
transit frequency is less than 5 minutes. Examples are downtown San Francisco,<br />
Boston, and Denver.<br />
• Urban Center. Mix <strong>of</strong> housing, employment, retail, and entertainment. Usually<br />
slightly less dense than Regional Centers. Commuter hubs. Historic character<br />
preserved. Typical residential density is 50‐150 units per acre, and typical<br />
employment FAR is 2.5. Multiple transit options, including HCT. Typical peak<br />
transit frequency is 5‐15 minutes. Examples are downtown Baltimore, Pasadena<br />
(CA), and the Texas Medical Center in Houston.<br />
• Suburban Center. Mix <strong>of</strong> housing, employment, retail, and entertainment with<br />
densities similar to those <strong>of</strong> Urban Centers. Can be both an origin and a<br />
destination for commuters. Development tends to be newer than in Urban<br />
Centers. Less mix <strong>of</strong> uses than in Urban Centers. Typical residential density is 35‐<br />
100 units per acre, and typical employment FAR is 4.0. May be served by HCT.<br />
Typical peak transit frequency is 5‐15 minutes. Examples are Evanston (IL),<br />
Stamford (CT), and Silver Spring (MD).<br />
• Transit Town Center. Local‐serving centers <strong>of</strong> economic and community activity.<br />
Less mix <strong>of</strong> uses than in Suburban Centers. Typical residential density is 20‐75<br />
units per acre, and typical employment FAR is 2.0. Variety <strong>of</strong> transit modes,<br />
including commuter service to regional jobs. Less secondary transit service and<br />
lower housing density than in Regional Centers, Urban Centers, and Suburban<br />
Centers. Typical peak transit frequency is 15‐30 minutes. Examples are<br />
Winchester, MA (outside <strong>of</strong> Boston), and Hillsboro, OR (outside <strong>of</strong> Portland).<br />
• Urban Neighborhood. Primarily residential neighborhoods. Well‐connected to<br />
Regional Centers and Urban Centers. Moderate to high densities. Housing<br />
D-4
High Capacity Transit System Plan September 2009<br />
Appendix D<br />
usually mixed with local‐serving retail. Commercial uses limited to small<br />
businesses and some industry. Typical residential density is 40‐100 units per<br />
acre, and typical employment FAR is 1.0. Transit may or may not be a focal point<br />
as in Regional Centers, Urban Centers, Suburban Centers, and Transit Town<br />
Centers. Typical peak transit frequency is 5‐15 minutes. Examples are Portland’s<br />
Pearl District, Greenwich Village in New York City, and University City in<br />
Philadelphia.<br />
• Transit Neighborhood. Primarily residential neighborhoods. Served by HCT at one<br />
location. Low to moderate densities. Economic activity not concentrated around<br />
transit stations. May include retail nodes but residential density <strong>of</strong>ten is not high<br />
enough to support much local‐serving retail. May <strong>of</strong>fer significant development<br />
opportunities. Secondary transit service is less frequent and less well‐connected.<br />
Typical residential density is 20‐50 units per acre, and typical employment FAR<br />
is 1.0. Typical peak transit frequency is 15‐30 minutes. Examples are Plano, TX<br />
(outside <strong>of</strong> Dallas), Barrio Logan in San Diego, and Ohlone‐Chynoweth, CA<br />
(outside San Jose).<br />
• Special Use/Employment District. Often single‐use. May be low‐ to moderatedensity<br />
employment centers or focused around an institution or entertainment<br />
venue. Economic activity not concentrated around transit stations. Development<br />
is typically more recent. May be significant opportunities for mixed‐use<br />
development and regional connections. Secondary transit service is infrequent<br />
and focused on stations. Typical residential density is 50‐150 units per acre, and<br />
typical employment FAR is 2.5. Typical peak transit frequency is 15‐30 minutes.<br />
Examples are South <strong>of</strong> Market in San Francisco, Camden Station in Baltimore,<br />
and Portland’s South Waterfront.<br />
• Mixed‐Use Corridor. Have no distinct center but are a focus <strong>of</strong> economic and<br />
community activity. Mix <strong>of</strong> moderate‐density uses. Housing is typically more<br />
recent along the corridor, with older housing just outside. Good opportunities for<br />
infill and mixed‐use development. Typical residential density is 25‐60 units per<br />
acre, and typical employment FAR is 2.0. May be developed along streetcar, BRT,<br />
or premium bus lines with closely spaced stops. Typical peak transit frequency is<br />
5‐15 minutes. Examples are International Boulevard in Oakland, Washington<br />
Street in Boston, and University Avenue in St. Paul.<br />
Of these options and considering the characteristics <strong>of</strong> the HCT corridors identified in<br />
the PAG region, suburban center and mixed‐use corridor models may be most<br />
appropriate. Suburban center type stations might be located in Oro Valley in the<br />
vicinity <strong>of</strong> Tangerine Road or Rancho Vistoso Boulevard at Oracle Road, in Marana at<br />
the Tangerine Road, Marana Road, and Cortaro Road interchanges, in Sahuarita at the<br />
Sahuarita Road interchange, and on I‐10 at the Vail Road and Kolb Road interchanges. A<br />
D-5
High Capacity Transit System Plan September 2009<br />
Appendix D<br />
smaller scale version <strong>of</strong> the mixed use corridor model would be appropriate at other<br />
locations along the HCT corridors.<br />
Transit stations should be incorporated into local land use planning. The locations<br />
shown in Figure D‐1 are intended to provide general guidance where these stations<br />
might be located. Transit districts can be designated in at these locations. Within these<br />
districts, developments or redevelopments would be required to support transit<br />
ridership and would include a mix <strong>of</strong> high density residential and commercial<br />
development, pedestrian and bicycle amenities, and park and ride facilities, akin to the<br />
transit village concept, as described in Section 9.2. Note that in Figure D‐1, the potential<br />
future HCT stations are anticipated to initially include park‐and‐ride facilities to support<br />
express bus service, eventually becoming full stations as other HCT technologies become<br />
viable. Existing park‐and‐ride facilities could also transform to full HCT transit stations.<br />
D-6
High Capacity Transit System Plan September 2009<br />
Appendix D<br />
D-7