Part I. R& D Status - pcaarrd - Department of Science and Technology
Part I. R& D Status - pcaarrd - Department of Science and Technology
Part I. R& D Status - pcaarrd - Department of Science and Technology

You also want an ePaper? Increase the reach of your titles
YUMPU automatically turns print PDFs into web optimized ePapers that Google loves.
Papaya Industry Situation<br />
○ ○ ○ ○ ○ ○ ○ ○ ○ ○ ○ ○ ○ ○ ○ ○ ○ ○ ○ ○ ○ ○ ○ ○ ○ ○ ○ ○ ○ ○ ○ ○ ○ ○ ○ ○ ○ ○ ○ ○ ○ ○ ○ ○ ○ ○ ○ ○ ○ ○ ○ ○ ○ ○ ○ ○ ○ ○ ○<br />
World Supply <strong>and</strong> Dem<strong>and</strong><br />
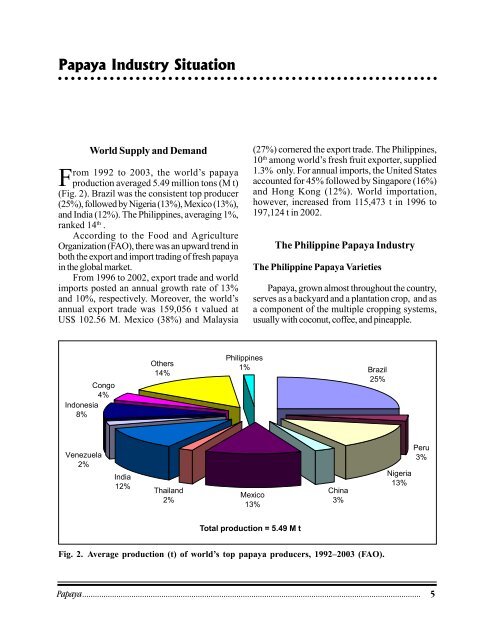
From 1992 to 2003, the world’s papaya<br />
production averaged 5.49 million tons (M t)<br />
(Fig. 2). Brazil was the consistent top producer<br />
(25%), followed by Nigeria (13%), Mexico (13%),<br />
<strong>and</strong> India (12%). The Philippines, averaging 1%,<br />
ranked 14 th .<br />
According to the Food <strong>and</strong> Agriculture<br />
Organization (FAO), there was an upward trend in<br />
both the export <strong>and</strong> import trading <strong>of</strong> fresh papaya<br />
in the global market.<br />
From 1996 to 2002, export trade <strong>and</strong> world<br />
imports posted an annual growth rate <strong>of</strong> 13%<br />
<strong>and</strong> 10%, respectively. Moreover, the world’s<br />
annual export trade was 159,056 t valued at<br />
US$ 102.56 M. Mexico (38%) <strong>and</strong> Malaysia<br />
(27%) cornered the export trade. The Philippines,<br />
10 th among world’s fresh fruit exporter, supplied<br />
1.3% only. For annual imports, the United States<br />
accounted for 45% followed by Singapore (16%)<br />
<strong>and</strong> Hong Kong (12%). World importation,<br />
however, increased from 115,473 t in 1996 to<br />
197,124 t in 2002.<br />
The Philippine Papaya Industry<br />
The Philippine Papaya Varieties<br />
Papaya, grown almost throughout the country,<br />
serves as a backyard <strong>and</strong> a plantation crop, <strong>and</strong> as<br />
a component <strong>of</strong> the multiple cropping systems,<br />
usually with coconut, c<strong>of</strong>fee, <strong>and</strong> pineapple.<br />
Congo<br />
4%<br />
Indonesia<br />
8%<br />
Others<br />
14%<br />
Philippines<br />
1%<br />
Brazil<br />
25%<br />
Venezuela<br />
2%<br />
India<br />
12%<br />
Thail<strong>and</strong><br />
2%<br />
Mexico<br />
13%<br />
China<br />
3%<br />
Nigeria<br />
13%<br />
Peru<br />
3%<br />
Total production = 5.49 M t<br />
Fig. 2. Average production (t) <strong>of</strong> world’s top papaya producers, 1992–2003 (FAO).<br />
Papaya.............................................................................................................................................................. 5