Report: The State of Preschool 2008: State Preschool Yearbook
Report: The State of Preschool 2008: State Preschool Yearbook
Report: The State of Preschool 2008: State Preschool Yearbook

You also want an ePaper? Increase the reach of your titles
YUMPU automatically turns print PDFs into web optimized ePapers that Google loves.
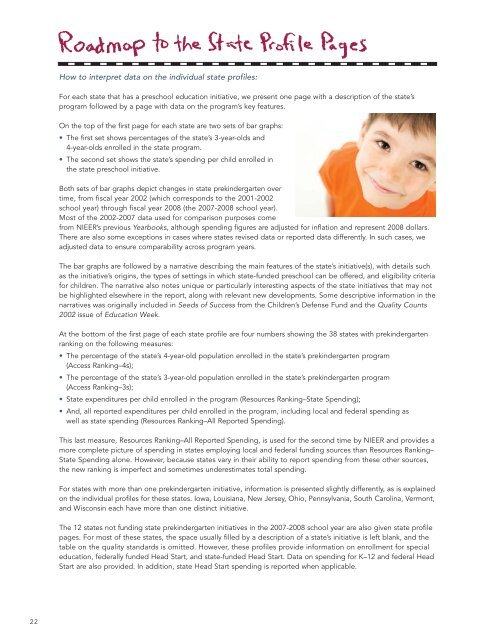
How to interpret data on the individual state pr<strong>of</strong>iles:<br />
For each state that has a preschool education initiative, we present one page with a description <strong>of</strong> the state’s<br />
program followed by a page with data on the program’s key features.<br />
On the top <strong>of</strong> the first page for each state are two sets <strong>of</strong> bar graphs:<br />
• <strong>The</strong> first set shows percentages <strong>of</strong> the state’s 3-year-olds and<br />
4-year-olds enrolled in the state program.<br />
• <strong>The</strong> second set shows the state’s spending per child enrolled in<br />
the state preschool initiative.<br />
Both sets <strong>of</strong> bar graphs depict changes in state prekindergarten over<br />
time, from fiscal year 2002 (which corresponds to the 2001-2002<br />
school year) through fiscal year <strong>2008</strong> (the 2007-<strong>2008</strong> school year).<br />
Most <strong>of</strong> the 2002-2007 data used for comparison purposes come<br />
from NIEER’s previous <strong>Yearbook</strong>s, although spending figures are adjusted for inflation and represent <strong>2008</strong> dollars.<br />
<strong>The</strong>re are also some exceptions in cases where states revised data or reported data differently. In such cases, we<br />
adjusted data to ensure comparability across program years.<br />
<strong>The</strong> bar graphs are followed by a narrative describing the main features <strong>of</strong> the state’s initiative(s), with details such<br />
as the initiative’s origins, the types <strong>of</strong> settings in which state-funded preschool can be <strong>of</strong>fered, and eligibility criteria<br />
for children. <strong>The</strong> narrative also notes unique or particularly interesting aspects <strong>of</strong> the state initiatives that may not<br />
be highlighted elsewhere in the report, along with relevant new developments. Some descriptive information in the<br />
narratives was originally included in Seeds <strong>of</strong> Success from the Children’s Defense Fund and the Quality Counts<br />
2002 issue <strong>of</strong> Education Week.<br />
At the bottom <strong>of</strong> the first page <strong>of</strong> each state pr<strong>of</strong>ile are four numbers showing the 38 states with prekindergarten<br />
ranking on the following measures:<br />
• <strong>The</strong> percentage <strong>of</strong> the state’s 4-year-old population enrolled in the state’s prekindergarten program<br />
(Access Ranking–4s);<br />
• <strong>The</strong> percentage <strong>of</strong> the state’s 3-year-old population enrolled in the state’s prekindergarten program<br />
(Access Ranking–3s);<br />
• <strong>State</strong> expenditures per child enrolled in the program (Resources Ranking–<strong>State</strong> Spending);<br />
• And, all reported expenditures per child enrolled in the program, including local and federal spending as<br />
well as state spending (Resources Ranking–All <strong>Report</strong>ed Spending).<br />
This last measure, Resources Ranking–All <strong>Report</strong>ed Spending, is used for the second time by NIEER and provides a<br />
more complete picture <strong>of</strong> spending in states employing local and federal funding sources than Resources Ranking–<br />
<strong>State</strong> Spending alone. However, because states vary in their ability to report spending from these other sources,<br />
the new ranking is imperfect and sometimes underestimates total spending.<br />
For states with more than one prekindergarten initiative, information is presented slightly differently, as is explained<br />
on the individual pr<strong>of</strong>iles for these states. Iowa, Louisiana, New Jersey, Ohio, Pennsylvania, South Carolina, Vermont,<br />
and Wisconsin each have more than one distinct initiative.<br />
<strong>The</strong> 12 states not funding state prekindergarten initiatives in the 2007-<strong>2008</strong> school year are also given state pr<strong>of</strong>ile<br />
pages. For most <strong>of</strong> these states, the space usually filled by a description <strong>of</strong> a state’s initiative is left blank, and the<br />
table on the quality standards is omitted. However, these pr<strong>of</strong>iles provide information on enrollment for special<br />
education, federally funded Head Start, and state-funded Head Start. Data on spending for K–12 and federal Head<br />
Start are also provided. In addition, state Head Start spending is reported when applicable.<br />
22