Q1 Presentation - PGS
Q1 Presentation - PGS
Q1 Presentation - PGS

Create successful ePaper yourself
Turn your PDF publications into a flip-book with our unique Google optimized e-Paper software.
Petroleum Geo-Services ASA<br />
Unaudited First Quarter 2013 Results<br />
Oslo, April 29, 2013
Cautionary Statement<br />
• This presentation contains forward looking information<br />
• Forward looking information is based on management<br />
assumptions and analyses<br />
• Actual experience may differ, and those differences may be<br />
material<br />
• Forward looking information is subject to significant<br />
uncertainties and risks as they relate to events and/or<br />
circumstances in the future<br />
• This presentation must be read in conjunction with the press<br />
release for the first quarter 2013 results and the disclosures<br />
therein<br />
-2-
GeoStreamer® Strengthens Profitability in an Improving Market<br />
• <strong>Q1</strong> 2013 financial performance:<br />
– EBITDA of USD 202.3 million - up 39%<br />
from <strong>Q1</strong> 2012<br />
– EBIT of USD 96.8 million - up 170% from<br />
<strong>Q1</strong> 2012<br />
– Group EBIT margin of 25%<br />
• Average 2013 marine contract prices<br />
expected 10-15 % above 2012<br />
• Further market strengthening and price<br />
increases expected in 2014<br />
• Ramform Titan to start North Sea<br />
MultiClient GeoStreamer acquisition<br />
early July<br />
Full year 2013 guidance reiterated<br />
-3-
USD million<br />
USD million<br />
USD million<br />
Financial Summary<br />
Revenues<br />
EBITDA*<br />
400<br />
300<br />
242<br />
327<br />
340 345<br />
365<br />
405<br />
388<br />
360<br />
395<br />
250<br />
200<br />
150<br />
164<br />
153<br />
145 146<br />
246<br />
222<br />
162<br />
202<br />
200<br />
100<br />
100<br />
50<br />
73<br />
-<br />
-<br />
120<br />
EBIT**<br />
111<br />
Cash Flow from Operations<br />
100<br />
80<br />
86<br />
97<br />
60<br />
40<br />
49<br />
44 45<br />
36<br />
61<br />
20<br />
0<br />
2<br />
*EBITDA, when used by the Company, means EBIT less other operating (income) expense, impairments of long-term assets and depreciation and<br />
amortization.<br />
**Excluding impairments of USD 0.1 million in Q4 2012, USD 2.6 million in Q4 2011 and reversal of impairment of USD 0.9 million in Q2 2012.<br />
.<br />
-4-
Order book:<br />
Sales Focus Primarily on Q4 and Early 2014<br />
• Order book end <strong>Q1</strong> of USD 592<br />
million<br />
– Unit pricing maintained<br />
– Backlog duration per vessel<br />
reduced<br />
– Still comfortable level<br />
• Vessel booking<br />
• ~95 % booked for Q2 2013<br />
• ~60 % booked for Q3 2013<br />
• ~40 % booked for Q4 2013<br />
Strong GeoStreamer interest<br />
-5-
Petroleum Geo-Services ASA<br />
Petroleum Geo-Services ASA<br />
Financials<br />
Unaudited First Quarter 2013 Results
Consolidated Statement of Operations Summary<br />
Quarter ended March 31<br />
Full year<br />
USD million (except per share data) 2013 2012 % change 2012<br />
Revenues 394.8 365.0 8% 1,518.3<br />
EBITDA* 202.3 145.7 39% 776.2<br />
Operating profit (EBIT) 96.8 35.8 170% 293.8<br />
Net financial items (8.9) (19.6) 55% (65.3)<br />
Income (loss) before income tax expense 87.9 16.2 444% 228.5<br />
Income tax expense (benefit) 25.4 3.6 606% 43.0<br />
Net income to equity holders 62.5 12.6 395% 185.5<br />
EPS basic $0.29 $0.06 383% $0.86<br />
EBITDA margin* 51.2 % 39.9 % 51.1 %<br />
EBIT margin 24.5 % 9.8 % 19.4 %<br />
• Net financial costs sigificantly reduced. <strong>Q1</strong> 2012 included a USD 7.5 million loss<br />
from redemption and cancellation of the convertible notes<br />
• Reported tax rate of 29%. Favorable effect of operating vessels in the Norwegian<br />
Tonnage Tax Regime was offset by currency changes (stronger USD) in the<br />
quarter<br />
*EBITDA, when used by the Company, means EBIT less other operating (income) expense, impairments of long-term assets and depreciation and<br />
amortization.<br />
The accompanying unaudited financial information has been prepared under IFRS. This information should be read in conjunction with the unaudited<br />
first quarter 2013 results, released on April 29, 2013.<br />
-7-
USD million<br />
-8-<br />
USD million<br />
<strong>Q1</strong> 2013 Highlights<br />
250<br />
200<br />
150<br />
100<br />
50<br />
0<br />
Contract revenues<br />
80 %<br />
207 70 %<br />
165<br />
165<br />
175<br />
159<br />
164<br />
156<br />
60 %<br />
138<br />
128<br />
50 %<br />
40 %<br />
30 %<br />
20 %<br />
10 %<br />
0 %<br />
<strong>Q1</strong> 11 Q2 11 Q3 11 Q4 11 <strong>Q1</strong> 12 Q2 12 Q3 12 Q4 12 <strong>Q1</strong> 13<br />
Contract revenues % 3D capacity allocated to contract<br />
200<br />
150<br />
100<br />
50<br />
0<br />
MultiClient revenues<br />
85.9<br />
65.7<br />
69.6<br />
49.4<br />
65.8<br />
83.0<br />
58.9<br />
107.6<br />
150.2<br />
121.3<br />
108.5<br />
18.0 89.7<br />
81.4<br />
92.6<br />
61.1<br />
34.3<br />
38.4<br />
<strong>Q1</strong> 11 Q2 11 Q3 11 Q4 11 <strong>Q1</strong> 12 Q2 12 Q3 12 Q4 12 <strong>Q1</strong> 13<br />
MultiClient late sales<br />
MultiClient pre-funding<br />
Pre-funding as % of MC cash investments<br />
250 %<br />
200 %<br />
150 %<br />
100 %<br />
50 %<br />
0 %<br />
• Total MultiClient revenues of USD 151.5 million in <strong>Q1</strong> 2013<br />
– Pre-funding of USD 92.6 million, 126% of MultiClient cash investments<br />
• Marine Contract revenues of USD 207.3 million with an EBIT margin of 30%<br />
• External Data Processing revenues of USD 27.1 million
USD million<br />
MultiClient Revenues per Region<br />
Pre-funding and Late Sales Revenues Combined<br />
250<br />
200<br />
150<br />
100<br />
• Strong pre-funding revenues<br />
driven by Africa and South<br />
America<br />
• Late sales primarily driven by<br />
Europe, Middle East and Asia<br />
Pacific<br />
50<br />
0<br />
<strong>Q1</strong> 11 Q2 11 Q3 11 Q4 11 <strong>Q1</strong> 12 Q2 12 Q3 12 Q4 12 <strong>Q1</strong> 13<br />
Europe Africa Middle East N. America S. America Asia Pacific<br />
• Full year 2013 pre-funding<br />
level to be above 110% of<br />
MultiClient cash investment<br />
38% of total vessel time was used for MultiClient in <strong>Q1</strong> 2013<br />
-9-
Vessel Utilization<br />
Seismic Streamer 3D Fleet Activity in Streamer Months<br />
100 %<br />
90 %<br />
80 %<br />
70 %<br />
60 %<br />
50 %<br />
40 %<br />
30 %<br />
Standby<br />
Yard<br />
Steaming<br />
MultiClient<br />
Contract<br />
• Strong vessel<br />
utilization in <strong>Q1</strong> 2013<br />
• Q2 and Q4 2013 will<br />
have significantly more<br />
steaming and yard<br />
time<br />
20 %<br />
10 %<br />
0 %<br />
<strong>Q1</strong> 11 Q2 11 Q3 11 Q4 11 <strong>Q1</strong> 12 Q2 12 Q3 12 Q4 12 <strong>Q1</strong> 13<br />
92% active vessel time in <strong>Q1</strong> 2013<br />
-10-
Key Operational Figures<br />
2013<br />
2012<br />
USD million <strong>Q1</strong> Q4 Q3 Q2 <strong>Q1</strong><br />
Contract revenues 207.3 156.3 163.8 128.5 174.9<br />
MultiClient Pre-funding 92.6 81.4 121.3 150.2 108.5<br />
MultiClient Late sales 58.9 65.8 65.7 85.9 49.4<br />
Data Processing 27.1 32.3 33.1 31.7 27.3<br />
Other 8.9 24.3 4.3 8.6 4.9<br />
Total Revenues 394.8 360.1 388.3 404.8 365.0<br />
Operating cost (192.5) (197.9) (166.2) (158.7) (219.3)<br />
EBITDA** 202.3 162.2 222.1 246.2 145.7<br />
Other operating income 0.2 0.2 0.2 0.2 0.5<br />
Depreciation (37.5) (37.7) (33.0) (31.4) (37.6)<br />
MultiClient amortization (68.2) (64.0) (78.5) (129.3) (72.8)<br />
EBIT* 96.8 60.7 110.9 85.6 35.8<br />
CAPEX, wether paid or not (71.4) (139.5) (76.6) (84.1) (67.9)<br />
Cash investment in MultiClient (72.9) (71.3) (91.4) (82.0) (52.7)<br />
Order book 592 829 608 689 655<br />
*Excluding impairments of long-term assets of USD 0.1 million in Q4 2012 and reversal of impairments of USD 0.9 million in Q2 2012.<br />
The accompanying unaudited financial information has been prepared under IFRS. This information should be read in conjunction with the unaudited first<br />
quarter 2013 results released on April 29, 2013.<br />
**EBITDA, when used by the Company, means EBIT less other operating (income) expense, impairments of long-term assets and depreciation and<br />
amortization. -11-
Group Cost * Development<br />
214<br />
231<br />
248<br />
228<br />
272<br />
240<br />
252<br />
268<br />
265<br />
• Stable development of<br />
total cost<br />
• Reduced cost in <strong>Q1</strong><br />
2013 relating to<br />
OptoSeis since<br />
equipment delivery was<br />
completed in December<br />
• Net amortized steaming<br />
cost increased in <strong>Q1</strong><br />
2013<br />
*Amounts show the sum of operating cost and capitalized MultiClient cash investment.<br />
-12-
Consolidated Statements of Cash Flows Summary<br />
Quarter ended March 31<br />
Full year<br />
USD million 2013 2012 2012<br />
Cash provided by operating activities 102.7 151.6 752.9<br />
Investment in MultiClient library (72.9) (52.7) (297.4)<br />
Capital expenditures (78.1) (63.4) (358.5)<br />
Other investing activities (8.1) (3.4) (2.1)<br />
Financing activities (22.3) (196.4) (129.3)<br />
Net increase (decr.) in cash and cash equiv. (78.7) (164.3) (34.4)<br />
Cash and cash equiv. at beginning of period 390.3 424.7 424.7<br />
Cash and cash equiv. at end of period 311.6 260.4 390.3<br />
• Improved earnings offset by increased working capital in <strong>Q1</strong> 2013<br />
• Working capital changes primarily project driven and reflecting usual seasonality<br />
after a low year-end 2012 working capital position<br />
The accompanying unaudited financial information has been prepared under IFRS. This information should be read in conjunction with the unaudited<br />
first quarter 2013 results released April 29, 2013.<br />
-13-
Strong Balance Sheet Position - Key Figures<br />
March 31<br />
December 31<br />
USD million 2013 2012 2012<br />
Total assets 3,301.0 2,945.9 3,275.6<br />
MultiClient Library 410.5 338.3 382.3<br />
Shareholders' equity 1,964.9 1,760.3 1,911.5<br />
Cash and cash equiv. 311.6 260.4 390.3<br />
Restricted cash 98.1 100.1 92.3<br />
Liquidity reserve 661.7 610.4 740.3<br />
Gross interest bearing debt * 921.1 770.7 921.5<br />
Net interest bearing debt 504.5 367.9 435.6<br />
*Includes capital lease agreements<br />
The accompanying unaudited financial information has been prepared under IFRS. This information should be read in conjunction with the unaudited first<br />
quarter 2013 results released on April 29, 2013.<br />
-14-
Petroleum Geo-Services ASA<br />
Petroleum Geo-Services ASA<br />
Operational Update and Market Comments
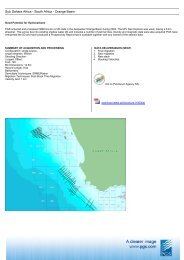
Streamer Operations mid-April 2013<br />
Atlantic Explorer<br />
(North Sea)<br />
Pacific Explorer<br />
(Nigeria)<br />
Ramform Vanguard<br />
(Uruguay)<br />
Ramform Sovereign<br />
Ramform Viking<br />
(Brazil)<br />
Ramform Challenger<br />
(Steaming to North Sea)<br />
<strong>PGS</strong> Apollo<br />
(Angola)<br />
Sanco Spirit – 2D<br />
(Namibia)<br />
Ramform Valiant<br />
Nordic Explorer – 2D<br />
(South Africa)<br />
Ramform Explorer<br />
(Australia)<br />
Ramform Sterling<br />
(Falkland Islands)<br />
GeoStreamer vessels<br />
Conventional streamer vessels<br />
-16-
USD million<br />
3 500<br />
3 000<br />
2 500<br />
2 000<br />
1 500<br />
1 000<br />
500<br />
-<br />
Robust Market Fundamentals<br />
• Sales leads promising for<br />
2014<br />
– Brazil license round<br />
– Russian shelf increased<br />
activity<br />
– Black Sea large surveys<br />
– South Atlantic very active<br />
– Canada very active<br />
– Egypt licensing round<br />
– Cyprus licensing round<br />
– GeoStreamer re-acquisition<br />
market<br />
• “Active Tenders” down<br />
post North Sea awards<br />
Active Tenders<br />
All Sales Leads (Including Active Tenders)<br />
Proportion of bids favoring GeoStreamer continues to increase<br />
Source: <strong>PGS</strong> internal estimate as of end March 2013. Value of active tenders and sales leads are the sum of active tenders and sales leads with a<br />
probability weight and represents Marine 3D contract seismic only.<br />
-17-
Market driver -<br />
Ultra Deep Water Dominates Lower Cost Production<br />
-18-
Market Shift Towards Larger Capacity Vessels<br />
2500<br />
2000<br />
1500<br />
1000<br />
500<br />
0<br />
2003 2004 2005 2006 2007 2008 2009 2010 2011 2012 2013 YTD<br />
Contract survey size average sqkm<br />
Contract + MC<br />
Survey size has grown strongly last 10 years
The Ramform Titan Takes Seismic Acquisition to a New Level<br />
• Focus on safe operations<br />
• Highest number of streamers possible<br />
• Largest production capacity in the industry<br />
• The right response for deep water and High Density seismic acquisition<br />
• Ensuring the best possible understanding of the sub-surface<br />
The most efficient marine seismic vessel ever<br />
-20-
Total 3D volume in '000 sq.km.<br />
Number of streamers<br />
Demand Growth Outpaces Supply Growth<br />
600<br />
500<br />
400<br />
300<br />
200<br />
100<br />
0<br />
700<br />
600<br />
500<br />
400<br />
300<br />
2006 2007 2008 2009 2010 2011 2012 2013 E<br />
• Growth in sqkm continues<br />
– Partly driven by larger surveys<br />
– Capacity constrained<br />
– From 2006 to end 2012 demand<br />
for seismic has grown by<br />
approximately 120% measured in<br />
sq.km.<br />
– Annual average growth rate of<br />
12%<br />
• Expected capacity increases<br />
– 4% increase in 2013<br />
– 5 % increase in 2014<br />
– 10 % increase in 2015<br />
200<br />
100<br />
0<br />
<strong>Q1</strong> 06 <strong>Q1</strong> 07 <strong>Q1</strong> 08 <strong>Q1</strong> 09 <strong>Q1</strong> 10 <strong>Q1</strong> 11 <strong>Q1</strong> 12 <strong>Q1</strong> 13 <strong>Q1</strong> 14 <strong>Q1</strong> 15<br />
Source to both graphs: <strong>PGS</strong> internal estimates. Capacity increases are calculated based on change from Q4 one year to Q4 the previous year.<br />
-21-
Petroleum Geo-Services ASA<br />
MultiClient update<br />
EVP MultiClient, Sverre Strandenes
$ million<br />
$ million<br />
Rev/NBV<br />
Library Peer Comparison (public reports)<br />
Revenues<br />
Ratios: Revenue / NBV<br />
1000<br />
900<br />
800<br />
700<br />
600<br />
500<br />
400<br />
300<br />
200<br />
100<br />
0<br />
2008 2009 2010 2011 2012<br />
Peer A<br />
Peer B<br />
Peer C<br />
Peer D<br />
<strong>PGS</strong><br />
2.5<br />
2<br />
1.5<br />
1<br />
0.5<br />
0<br />
2008 2009 2010 2011 2012<br />
Peer A<br />
Peer B<br />
Peer C<br />
Peer D<br />
<strong>PGS</strong><br />
800<br />
700<br />
Net Book Values<br />
• Peer A, B, D contain both marine and<br />
land numbers<br />
600<br />
500<br />
400<br />
300<br />
200<br />
100<br />
0<br />
2008 2009 2010 2011 2012<br />
Peer A<br />
Peer B<br />
Peer C<br />
Peer D<br />
<strong>PGS</strong><br />
• <strong>PGS</strong> library characteristics<br />
– Significant revenue growth since 2010<br />
– Lowest Net Book Value<br />
– Best trend in Rev / NBV<br />
– Strong cash flow<br />
– Improving profitability
Sq. kilometers<br />
GeoStreamer NW Europe Campaign in its 5 th Season<br />
GeoStreamer only<br />
16000<br />
14000<br />
12000<br />
Sq Km<br />
Investment<br />
160<br />
140<br />
120<br />
10000<br />
8000<br />
6000<br />
4000<br />
2000<br />
0<br />
PF Revenue<br />
2009 2010 2011 2012 2013E<br />
100<br />
80<br />
60<br />
40<br />
20<br />
0<br />
• 35,000 sq km of GeoStreamer MC3D acquired<br />
so far<br />
• Licensed by more than 50 oil co’s<br />
• Representing the new state of the art database<br />
in the North Sea<br />
• Applications from exploration through field<br />
development and production<br />
• About 12,000 sq km of GeoStreamer MC3D planned<br />
for the 2013 season<br />
• About 4,500 sq km to be acquired by Ramform Titan<br />
upon arrival in the North Sea early July<br />
• North Sea continues to be very active, with high<br />
interest and high prefunding levels
Uniquely Positioned in Eastern Mediterranean<br />
• Lebanon MC3D<br />
– 11,000 sq km MC3D<br />
constituting about 75 % of 3D<br />
coverage in Lebanon<br />
– Focus on the margin and near<br />
shore where finding an active<br />
oil system is more likely<br />
– 46 companies pre-qualified for<br />
upcoming license round<br />
• MC2D<br />
– 25,000 km recent MC2D in<br />
Lebanon and Cyprus<br />
– 12,400 km MC2D acquired in<br />
Greece
Positioning in Frontier Areas<br />
• Russia<br />
– 8,850 km regional 2D program designed to<br />
increase geological understanding of Russian<br />
arctic<br />
– Covers Barents- and Kara Sea<br />
– Seismic and interpretation report available for<br />
international licensing<br />
• Namibia<br />
– 10,000 km MC2D GeoStreamer GS data being<br />
acquired for deep water license round<br />
• Greece<br />
– 12,400 km MC2D GeoStreamer GS data acquired<br />
in preparation for 2014 license round<br />
• Canada (*)<br />
– 23,700 km MC2D GeoStreamer acquired in<br />
Labrador Sea<br />
– 9,000 km MC2D GeoStreamer acquired in North<br />
East Newfoundland slope<br />
– 3 rd season in planning<br />
Russian Barentsand<br />
Kara Sea<br />
Namibia<br />
Greece<br />
(*) Joint with TGS
New MC Business Model Favors Vessel Owners with Technology<br />
• Regulators shorten time from license<br />
award to first well<br />
– Larger license areas<br />
– Turn-around time for seismic projects<br />
becomes critical<br />
– Less margin for error poses high demand for<br />
state-of-the-art technology<br />
– Favors MC operators owning vessels and<br />
providing leading edge technology<br />
• <strong>PGS</strong> well positioned for these projects<br />
– Angola Kwanza GeoStreamer MC3D project<br />
– Uruguay GeoStreamer MC3D project<br />
– Exclusive rights in Greece for GeoStreamer<br />
GS MC2D in preparation for license round<br />
– Exclusive rights in deep water Namibia for<br />
GeoStreamer GS MC2D in preparation for<br />
deep water license round<br />
GeoStreamer offers exceptional resolution,<br />
higher accuracy, less room for errors -<br />
combined with better efficiency due to deep<br />
tow
<strong>PGS</strong>’ Strategic Ambition<br />
• To Care<br />
– For our employees<br />
– For the environment and society at large<br />
– For our customers’ success<br />
• To Deliver Productivity Leadership<br />
– Ramform platform + GeoStreamer<br />
– Reducing project turnaround time<br />
• To Develop Superior Data Quality<br />
– GeoStreamer (GS, SWIM, ++)<br />
– Imaging Innovations<br />
– Subsurface knowledge<br />
• To Innovate<br />
– First dual sensor streamer solution<br />
– First with 20+ towed streamer capability<br />
– Unique reservoir focused solutions<br />
• To Perform Over the Cycle<br />
– Profitable with robust balance sheet<br />
– Absolute focus on being best in our market segment<br />
<strong>PGS</strong> - A Clearer Image<br />
-28- -28-
GeoStreamer:<br />
The New Business and Technology Platform<br />
Full Waveform<br />
Inversion<br />
GeoStreamer<br />
GS:<br />
Offers the full deghosting<br />
solution<br />
SWIM:<br />
GeoStreamer<br />
enhanced<br />
imaging<br />
More reliable<br />
reservoir<br />
characterization<br />
????<br />
GeoStreamer – The New Business and Technology Platform:<br />
• Gives higher resolution, better depth imaging and improved<br />
operational efficiency<br />
• Improves the seismic value chain from acquisition to processing<br />
-29-
GeoStreamer Technology roll-out:<br />
More of the Ultra-High End<br />
GeoStreamer operations<br />
– Atlantic Explorer<br />
• (6 streamers)<br />
– Ramform Explorer<br />
• (10 streamers)<br />
– Ramform Challenger<br />
• (10 / 12 streamers)<br />
– Ramform Valiant<br />
• (12 streamers)<br />
– Ramform Viking<br />
• (12 streamers)<br />
– Ramform Vanguard<br />
• (12 streamers)<br />
– <strong>PGS</strong> Apollo<br />
• (10 Streamers)<br />
– Sanco Spirit (2D)<br />
– Nordic Explorer (2D)<br />
In exploration mode with 100 meter streamer separation<br />
Planned GeoStreamer rollout<br />
– Ramform Titan Q213<br />
• (16 streamers)<br />
– Ramform Atlas Q413<br />
• (16 streamers)<br />
– Ramform Sterling H114<br />
• (14 streamers)<br />
– Ramform Titan 3 H115<br />
• (16 streamers)<br />
– Ramform Titan 4 H215<br />
• (16 streamers)<br />
– Ramform Sovereign H116 latest<br />
• (14 streamers)<br />
8K offset.<br />
Only Ramform S-class left to do before 100% GeoStreamer
OptoSeis:<br />
Progressing in Permanent Reservoir Monitoring (“PRM”)<br />
• Pilot project delivered and installed to<br />
Petrobras in Q4 2012<br />
– The world’s first PRM system deployed<br />
deeper than 1,000 meters<br />
– 35 kilometers of sensor cable<br />
– Approximately 700 4-component sensors<br />
– First acquisition completed early February<br />
2013<br />
• <strong>PGS</strong> in a strong position for Brazil PRM<br />
market<br />
• Potential for future long term backlog and<br />
stable earnings flow
A New Business Opportunity:<br />
Successful Launch of Towed EM<br />
• Benefits with Towed EM<br />
Horizontal<br />
electric<br />
dipole source<br />
Densely<br />
sampled<br />
CMP<br />
coverage<br />
EM Streamer<br />
Multiple offsets<br />
recorded<br />
simultaneously<br />
– Efficiency – acquisition speed 4-5 knots<br />
– Online Quality Control<br />
– Portable system<br />
– Possible simultaneous seismic and EM<br />
acquisitions reduces utilization risk<br />
– Dense data coverage<br />
– Data analysis in context with seismic<br />
data<br />
• EM program for 2013 firming up<br />
-32-
-33-<br />
Outlook<br />
• Average 2013 marine contract<br />
pricing for up 10-15 % from 2012<br />
• High steaming and yard activity<br />
expected in Q2 and Q4<br />
• Market pricing expected to further<br />
strengthen in 2014 based on strong<br />
sales leads and current price<br />
negotiations<br />
• GeoStreamer interest continues to<br />
increase to new record levels
2013 Guidance<br />
• EBITDA in the range of USD 940-980 million<br />
• MultiClient cash investments in the range of USD 300-350 million<br />
– Pre-funding level to be above 110%<br />
• Capital expenditures in the range of USD 540-570 million<br />
– Of which approximately USD 325-350 million to new build program<br />
*<br />
-34-
In Conclusion:<br />
Well Positioned in a Growing Market<br />
• Strong market fundamentals<br />
• Improving productivity & scale<br />
• GeoStreamer delivers improved data quality,<br />
strong performance and better pricing<br />
• Leading edge imaging capabilities<br />
• Technology differentiation<br />
• Strong balance sheet<br />
Competitively Positioned – Performance Through the Cycle<br />
-35-
Thank You – Questions?
Appendix:<br />
Continuously Ahead of Competition<br />
1992 - 1996<br />
1998 - 1999 2007 - 2009<br />
2012 - 2014<br />
Competition<br />
4 – 6 streamers<br />
6 – 8 streamers 8 - 12 streamers<br />
10 - 20 streamers<br />
<strong>PGS</strong><br />
8 - 12 streamers<br />
12 - 18 streamers<br />
12 – 22 streamers<br />
14 - 24 streamers<br />
• <strong>PGS</strong> builds vessels to optimize cost and efficiency over the vessels’<br />
useful life<br />
• Growing capacity over the cycle rather than trying to time the market<br />
-37-<br />
• Larger vessels enable safer and more efficient high quality seismic
Relative cash cost efficiency per streamer per day<br />
Favorably Positioned on the Industry Cost Curve<br />
<strong>PGS</strong> fleet is positioned to generate the industry’s best margins<br />
Source: The cash cost curve is based on <strong>PGS</strong>’ internal estimates and typical number of streamer towed, and excludes GeoStreamer productivity effect. The<br />
graph shows all seismic vessels operating in the market and announced new-builds. The Ramform 9&10 are incorporated with 15 streamers, S-class with 14<br />
streamers and the V-class with 12 streamers.<br />
-38-
<strong>PGS</strong> Fleet Overview<br />
Ramforms<br />
Other vessels<br />
Titanclass<br />
Ramform Titan Ramform Atlas 2 for 2015 delivery<br />
<strong>PGS</strong> Apollo<br />
• Ramform fleet is<br />
improving further<br />
with 4 new Titanclass<br />
vessels<br />
S-<br />
class<br />
V-<br />
class<br />
Ramform Sterling<br />
Ramform Sovereign<br />
Ramform Valiant Ramform Viking Ramform Vanguard<br />
Atlantic Explorer<br />
Pacific Explorer<br />
2D<br />
Nordic Explorer<br />
• GeoStreamer<br />
contributes to<br />
productivity<br />
leadership<br />
• Industrialized<br />
approach to fleet<br />
renewal<br />
Ramform Challenger<br />
Ramform Explorer<br />
Sanco Spirit<br />
Ramform productivity is a key differentiator<br />
-39-
The Ultra High-end Segment:<br />
Several Production Records<br />
• Ramform S-class records<br />
– Monthly production record: 3,056 sq.km acquired (12 streamers x<br />
8,100 meters with 120m separation)<br />
– Weekly production record: 919 sq.km acquired<br />
– Daily production record: 143.6 sq.km acquired<br />
– BP Ceduna 3D S Australia: 12,030 sq.km in 186 days, 65 sq.km/day,<br />
remote and harsh environment<br />
– Petrobras, Largest deployment ever: 14 streamers x 8,100 meters<br />
with 50 meter separation – regular operations for almost 4 years<br />
• Ramform S and V-class 17 streamer tow with 50 meter separation<br />
• Kwanza MC3D Angola, Ramform Valiant and <strong>PGS</strong> Apollo<br />
– 25,500 sq.km in 470 days, 54 sq.km/day, remote and harsh<br />
environment<br />
– No recovery of streamers during project<br />
– No recordable safety incidents
Main Yard Stays Next 6 Months<br />
Vessel When Expected<br />
Duration<br />
Type of Yard Stay<br />
Ramform<br />
Sovereign<br />
Scheduled<br />
April / May 2013<br />
Approximately<br />
31 days<br />
Renewal class<br />
Pacific<br />
Explorer<br />
Scheduled<br />
May 2013<br />
Approximately<br />
22 days<br />
Renewal class<br />
Atlantic<br />
Explorer<br />
Scheduled<br />
Oct / Nov 2013<br />
Approximately<br />
21 days<br />
Renewal class<br />
Ramform<br />
Sterling<br />
Scheduled<br />
May 2013<br />
Approximately<br />
14 days<br />
Repairs<br />
Nordic<br />
Explorer<br />
Scheduled<br />
Oct / Nov 2013<br />
Approximately<br />
15 days<br />
Intermediate class<br />
-41-
Attractive Debt Structure<br />
Long term Credit Lines and<br />
Interest Bearing Debt<br />
Nominal Amount as<br />
of March 31, 2013<br />
Total<br />
Credit Line<br />
Financial Covenants<br />
USD 600 million Term Loan<br />
(“TLB”), Libor + 175 basis points,<br />
due 2015<br />
USD 470.5 million<br />
None, but incurrence test:<br />
total leverage ratio < 3.00:1<br />
Revolving credit facility (“RCF”),<br />
Libor + 225 basis points, due 2015<br />
Undrawn USD 350<br />
million<br />
Maintenance covenant: total<br />
leverage ratio < 2.75:1<br />
Japanese ECF, 12 year with semiannual<br />
installments. 50% fixed/<br />
50% floating interest rate<br />
Undrawn USD 250<br />
million<br />
None<br />
2018 Senior Notes, coupon of<br />
7.375%<br />
USD 450 million None, but incurrence test :<br />
Interest coverage<br />
ratio > 2.0:1<br />
-42-
Petroleum Geo-Services ASA<br />
Unaudited First Quarter 2013 Results<br />
Oslo, April 29, 2013