Nonlinear Finite Element Analysis of Concrete Structures
Nonlinear Finite Element Analysis of Concrete Structures
Nonlinear Finite Element Analysis of Concrete Structures

Create successful ePaper yourself
Turn your PDF publications into a flip-book with our unique Google optimized e-Paper software.
- 134 -<br />
Let us now consider the *~2 beam where shear re in forcessent is<br />
present and let us illustrate the behaviour <strong>of</strong> the beam with<br />
figures similar to figs. 4-7.<br />
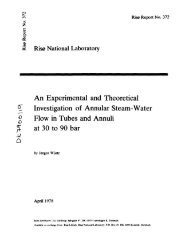
Fig. 8 shews the stress distribution at 63% loading. As previously<br />
noted, loadings are expressed in relation to the predicted<br />
failure load. Comparison with fig. 4 reveals that no<br />
principal difference seems to exist for beams with and without<br />
shear reinforcement.<br />
Fig. 5.3-8: Isostress curves and directions <strong>of</strong> the principal<br />
stresses in the A-2 beam. Loading = 63% <strong>of</strong> predicted<br />
failure load. Quantities are in HPa.<br />
Fig. 9 shows the development <strong>of</strong> the contour lines for the nonlinearity<br />
index in per cent with increasing loading. A comparison<br />
with fig. 5 again reveals no principal difference in the<br />
behaviour <strong>of</strong> the two beams. For the A-2 beam also the region<br />
adjacent to the load point is severely loaded; strain s<strong>of</strong>tening<br />
initi -es here a little earlier than for the OA-2 beam namely<br />
at 63% loading, i.e. for the stress distribution shown in fig. 8<br />
and on fig. 9. At the failure load, this region is loaded far<br />
into the post-failure region and just like the OA-2 beam this<br />
situation is considered to be the primary reason for *he bear,<br />
collapse.