Nonlinear Finite Element Analysis of Concrete Structures
Nonlinear Finite Element Analysis of Concrete Structures
Nonlinear Finite Element Analysis of Concrete Structures

You also want an ePaper? Increase the reach of your titles
YUMPU automatically turns print PDFs into web optimized ePapers that Google loves.
- 135 -<br />
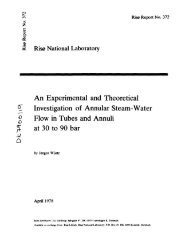
loading = 26 %<br />
loading = 63 %<br />
loading = 96 %<br />
Fig. 5.3-9: Development in the A-2 beam <strong>of</strong> contour lines for<br />
the nonlinearity index in per cent. Loadings expressed<br />
as per cent <strong>of</strong> predicted failure load.<br />
Let us now consider the predicted crack development <strong>of</strong> the A-2<br />
beam. This is shown in fig. 10. The reinforcement is also shown<br />
or this figure by the dotted lines whereas regions where yielding<br />
occurs in the bars are indicated by full lines. Note that<br />
identical loadings in per cent for the OA-2 and the A-2 beams<br />
correspond to a 12% larger absolute load for the A-2 beam. With<br />
this in mind figs. 10a) and 10b) correspond quite closely to<br />
figs. 6a) and 6b), respectively. However, some changes in the<br />
behaviour exist. Secondary cracks initiate now at 51% loading<br />
compared to 63% loading for the OA-2 beam. Strain s<strong>of</strong>tening<br />
adjacent to the load point develops now at 63% loading compared<br />
to 82% loading for the OA-2 beam. Yielding <strong>of</strong> the stirrups follows<br />
the location <strong>of</strong> the inclined cracks. A quite pronounced development<br />
<strong>of</strong> inclined cracks occurs at 81% loading. The crack<br />
pattern just before failure, fig. 10c), indicates a somewhat<br />
further development <strong>of</strong> inclined cracks compared to fig. 6c).<br />
Yielding at the load point <strong>of</strong> the compressive steel initiates