Nonlinear Finite Element Analysis of Concrete Structures
Nonlinear Finite Element Analysis of Concrete Structures
Nonlinear Finite Element Analysis of Concrete Structures

Create successful ePaper yourself
Turn your PDF publications into a flip-book with our unique Google optimized e-Paper software.
- 153 -<br />
<strong>of</strong> the resulting predictions with the experimental data <strong>of</strong><br />
Kupfer (1973) has previously been demonstrated, cf. fig. 2.2-6.<br />
In this figure, the value D = 0 was used instead <strong>of</strong> D = 0.6,<br />
but this affects the post-failure behaviour, only. In general,<br />
the weaker the concrete the more ductile is its post-failure<br />
behaviour, cf. for instance, Hognestad et al. (1955). This<br />
suggests the use <strong>of</strong> D = 0.6 instead <strong>of</strong> D = 0 as is apparent<br />
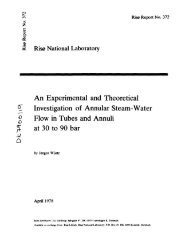
from fig. 4, where the normalized stress-strain curves using<br />
these two D-values are shown. The predicted failure load using<br />
the above concrete parameters underestimates the actual failure<br />
load by only 3%, and is plotted in fig. 8. Therefore, the calculations<br />
are in agreement with the experimental evidence showing<br />
that within the considered variation <strong>of</strong> the a -values, a<br />
linear relation exists between pull-out force and compressive<br />
strength.<br />
It is remarkable that the prolongation <strong>of</strong> the experimental line<br />
in fig. 8 intersects the ordinate axis at some distance from<br />
the origin. However, two aspects <strong>of</strong> concrete behaviour are<br />
dependent on compressive strength namely the ductility and the<br />
ratio <strong>of</strong> tensile strength to compressive strength. As has<br />
already been touched upon, the post-failure behaviour is more<br />
ductile the weaker the concrete. To investigate the influence<br />
<strong>of</strong> minor variations in the post-failure behaviour <strong>of</strong> the concrete,<br />
a calculation was performed using again the concrete having a<br />
strength <strong>of</strong> 18.7 MPa, but now having lesser ductility. Therefore<br />
the value D = 0 was used instead <strong>of</strong> the more realistic one D =<br />
0.6, cf. fig. 4. This in fact decreases the predicted failure<br />
load by 5% as shown in fig. 8. That the failure load depends<br />
on the particular s<strong>of</strong>tening behaviour <strong>of</strong> the concrete is indeed<br />
to be expected considering previous remarks in relation to fig.<br />
7. However, comparison in fig. 4 <strong>of</strong> the concrete having a =<br />
18.7 MPa and D = 0 with the concrete having a = 31.8 MPa and<br />
D = 0.2 shows an almost similar normalized behaviour. Moreover,<br />
the a /a -ratios are identical for these concretes. Using<br />
dimensional analysis, the failure loads should therefore be<br />
almost proportional to the a -value and this is in fact also<br />
observed for the two predicted failure loads, cf. fig. 8.