Download the 2012 full year results appendices data ... - Rolls-Royce
Download the 2012 full year results appendices data ... - Rolls-Royce
Download the 2012 full year results appendices data ... - Rolls-Royce

You also want an ePaper? Increase the reach of your titles
YUMPU automatically turns print PDFs into web optimized ePapers that Google loves.
<strong>2012</strong> Full-Year Results<br />
Data pack<br />
Trusted to deliver excellence<br />
1
Table of contents<br />
Section<br />
Page<br />
1. About <strong>the</strong> Group 03<br />
2. Financials 13<br />
3. Key Performance Indicators 26<br />
4. Details by Business Sector 28<br />
5. Additional Information 60<br />
Trusted to deliver excellence<br />
2
1. About <strong>the</strong> Group<br />
Data pack<br />
Trusted to deliver excellence<br />
3
Consistent strategy<br />
Place <strong>the</strong> customer at <strong>the</strong> heart of <strong>the</strong> organization<br />
Customer<br />
Understand and shape <strong>the</strong>ir requirements<br />
Focus on responsiveness<br />
Connect innovation to our customers<br />
Innovation<br />
Help our customers do more with less<br />
Develop technology, capability and infrastructure<br />
Grow our market share<br />
Grow Profitably<br />
Expand competitive portfolio<br />
Focus on cost and cash<br />
Trusted to deliver excellence<br />
4
Four global markets<br />
Civil Aerospace Defence Aerospace Marine Energy<br />
• 12,500 engines<br />
• Powers 30 types of aircraft<br />
• 300 airline & leasing customers<br />
• 20 million flying hours in <strong>2012</strong><br />
• 18,000 engines<br />
• 24 engine programmes<br />
• 103 countries<br />
• 160 armed forces<br />
• 25,000 propulsion units<br />
• 4,000 customers<br />
• 70 navies<br />
• Products on 30,000 vessels<br />
• 4,000 power systems<br />
• 1,600 customers<br />
• 120 countries<br />
• 73% of service revenue<br />
covered by LTSAs – TotalCare<br />
• 25% of service revenue covered<br />
by LTSAs - MissionCare<br />
• 5% of service revenue covered<br />
by LTSAs – mainly Naval<br />
• 25% of service revenue<br />
covered by LTSAs<br />
FY <strong>2012</strong> revenue £6,437m FY <strong>2012</strong> revenue £2,417m FY <strong>2012</strong> revenue £2,249m FY <strong>2012</strong> revenue £962m<br />
OE<br />
46%<br />
Services<br />
49%<br />
Development<br />
5%<br />
Services<br />
43%<br />
OE<br />
36%<br />
Services<br />
54%<br />
OE<br />
46%<br />
OE<br />
57%<br />
Services<br />
64%<br />
FY <strong>2012</strong> ROS 11.3% FY <strong>2012</strong> ROS 16.7% FY <strong>2012</strong> ROS 13.1% FY <strong>2012</strong> ROS 2.2%<br />
Trusted to deliver excellence<br />
5
Broadening our portfolio<br />
Underpinning long-term growth<br />
Trusted to deliver excellence<br />
6
Substantial order book*<br />
Order Book<br />
(£bn)<br />
FY <strong>2012</strong><br />
£60.1bn<br />
70<br />
60<br />
50<br />
40<br />
30<br />
20<br />
10<br />
0<br />
2002 2003 2004 2005 2006 2007 2008 2009 2010 2011 <strong>2012</strong><br />
Europe North America Asia / Middle East ROW IAE Removal*<br />
Substantial order book provides long-term visibility<br />
*Firm and announced order book stated on a constant currency basis<br />
**£4.6bn orders removed from Order book on completion of IAE restructuring<br />
Trusted to deliver excellence<br />
7
Balanced business portfolio<br />
£m FY <strong>2012</strong> FY 2011<br />
Underlying revenue 12,209 11,277<br />
Underlying services revenue 6,316 6,019<br />
Aftermarket Services<br />
52%<br />
Engine Holding<br />
1%<br />
Energy<br />
3%<br />
Marine<br />
10%<br />
Defence<br />
10%<br />
Civil<br />
24%<br />
Trusted to deliver excellence<br />
8
Managing challenges<br />
600%<br />
500%<br />
400%<br />
300%<br />
200%<br />
100%<br />
SARS<br />
9/11<br />
Programme Delays<br />
Weakening US$<br />
Commodity Inflation<br />
Gulf War II<br />
Financial Crisis<br />
0%<br />
2002 2003 2004 2005 2006 2007 2008 2009 2010 2011 <strong>2012</strong><br />
Order Book Revenue EPS<br />
An increasingly resilient portfolio<br />
Trusted to deliver excellence<br />
9
Growing Group revenues<br />
£bn<br />
14<br />
12<br />
10<br />
8<br />
10Y CAGR<br />
OE 6%<br />
Services 10%<br />
%<br />
100%<br />
80%<br />
60%<br />
6<br />
4<br />
2<br />
40%<br />
20%<br />
0<br />
2003 2004 2005 2006 2007 2008 2009 2010 2011 <strong>2012</strong><br />
0%<br />
Underlying Services Revenues Underlying OE Revenues Services as % of Total<br />
Growing installed based provides decades of aftermarket opportunities<br />
Trusted to deliver excellence<br />
10
Research & development<br />
1,200<br />
1,000<br />
800<br />
600<br />
400<br />
200<br />
0<br />
£m £m<br />
Total gross R&D spend (10Y) 7,954 Total net R&D spend (10Y) 4,302<br />
2003 2004 2005 2006 2007 2008 2009 2010 2011 <strong>2012</strong><br />
Gross R&D Net R&D Net R&D as a % of Sales<br />
7%<br />
6%<br />
5%<br />
4%<br />
3%<br />
2%<br />
1%<br />
0%<br />
• Our capabilities reflect continuous R&D investment over decades<br />
• R&D is a major structural competitive advantage, securing a market-leading position in wide body aircraft<br />
• R&D improves ongoing engine performance, reducing LTSA costs and improving profitability<br />
• 2013 guidance is for a modest decrease in P&L charge due to capitalisation of Trent XWB<br />
Continuous investment in future technology protects barriers to entry<br />
Trusted to deliver excellence<br />
11
Average net cash<br />
(£m)<br />
1500<br />
A strong balance sheet<br />
Debt maturities<br />
(£m)<br />
1,500<br />
1000<br />
1,000<br />
500<br />
500<br />
0<br />
-500<br />
2005 2006 2007 2008 2009 2010 2011 <strong>2012</strong><br />
-<br />
2013 2014 2015 2016 2017 2018 2019 2020<br />
Drawn<br />
Undrawn<br />
Strong liquidity position – Total liquidity £3.5bn<br />
• S&P raised its long and short term R-R credit ratings to ‘A/A-1’ from ‘A-/A-2’, with a stable outlook<br />
• ‘A’ credit rating and liquidity all provide confidence for:<br />
• Customers signing long-term service agreements<br />
spanning decades<br />
• Customer and supplier financing<br />
• Investing in opportunities at <strong>the</strong> right time<br />
• Suppliers and JV partners making long-term<br />
investments<br />
• Wea<strong>the</strong>ring financial market uncertainties<br />
Trusted to deliver excellence<br />
12
2. Financials<br />
Data pack<br />
Trusted to deliver excellence<br />
13
Historic financial highlights<br />
Full Year<br />
FY 2008 FY 2009 FY 2010 FY 2011 FY <strong>2012</strong><br />
Underlying revenue (£m) 9,147 10,108 10,866 11,277 12,209<br />
Underlying profits before tax (£m) 880 915 955 1,157 1,429<br />
Underlying EPS 36.70p 39.67p 38.73p 48.54p 59.27p<br />
Cash flow (£m) 570 (183) 258 (1,310) 1,094<br />
Average net cash (£m) 375 635 960 320 (145)<br />
Order intake (£bn) 20.4 14.1 12.3 16.3 16.1<br />
Order book (£bn) 55.5 58.3 59.2 62.2 60.1*<br />
Dividend per share 14.3p 15.0p 16.0p 17.5p 19.5p<br />
*£4.6bn orders removed from Order book on completion of IAE restructuring<br />
Trusted to deliver excellence<br />
14
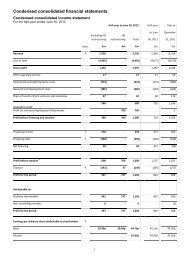
Headline to underlying adjustment<br />
Revenues<br />
Profit before financing<br />
(£m) FY <strong>2012</strong> FY 2011 FY <strong>2012</strong> FY 2011<br />
Headline 12,161 11,124 2,072 1,189<br />
FX gain/(loss) 48 153 48 117<br />
Pensions (164)<br />
Acquisition accounting 69 64<br />
O<strong>the</strong>r (699)*<br />
Underlying 12,209 11,277 1,490 1,206<br />
*Headline profit on restructuring of IAE<br />
Trusted to deliver excellence<br />
15
Underlying income statement<br />
(£m) FY <strong>2012</strong> FY 2011<br />
Underlying revenue 12,209 11,277<br />
Underlying gross profit 2,796 2,393<br />
Commercial and administrative costs (981) (970)<br />
Net R&D charge (589) (463)<br />
O<strong>the</strong>r Income & costs 264 246<br />
UPBFCT 1,490 1,206<br />
Net financing charge (61) (49)<br />
UPBT 1,429 1,157<br />
Tax (318) (261)<br />
Minority interests (14) 2<br />
UPAT 1,097 898<br />
Underlying EPS (p/share) 59.27p 48.54p<br />
Payment to shareholders (p/share) 19.5p 17.5p<br />
Trusted to deliver excellence<br />
16
Underlying financing costs<br />
(£m) FY <strong>2012</strong> FY 2011<br />
UPBFCT 1,490 1,206<br />
Interest (payable) / receivable (41) (31)<br />
Financial RRSPs (10) (11)<br />
O<strong>the</strong>r (10) (7)<br />
Underlying net finance charge (61) (49)<br />
UPBT 1,429 1,157<br />
Trusted to deliver excellence<br />
17
Summary balance sheet<br />
(£m) FY <strong>2012</strong> FY 2011<br />
Intangible assets 2,901 2,882<br />
Property, plant and equipment 2,564 2,338<br />
Net post retirement scheme deficits (545) (397)<br />
Net working capital (1,100) (1,098)<br />
Net funds 1,317 223<br />
Provisions (461) (502)<br />
Net financial assets and liabilities (127) (718)<br />
Share of <strong>results</strong> of joint ventures and associates 1,800 1,680<br />
Assets held for sale 4 178<br />
O<strong>the</strong>r net assets and liabilities (248) (67)<br />
Net assets 6,105 4,519<br />
O<strong>the</strong>r items FY <strong>2012</strong> FY 2011<br />
USD hedge book ($m) $22,500 $22,000<br />
Net TotalCare assets (£m) 1,312 956<br />
Trusted to deliver excellence<br />
18
Group cash flow<br />
(£m) FY <strong>2012</strong> FY 2011<br />
Group UPBT 1,429 1,157<br />
Depreciation and Amortisation 487 410<br />
Net Working Capital (175) 253<br />
Capital Expenditure and Intangibles (685) (775)<br />
O<strong>the</strong>r (142) (110)<br />
Trading Cash Flow 914 935<br />
Pension / Tax / O<strong>the</strong>r (459) (410)<br />
Shareholder Payments (318) (315)<br />
Base cash flow (exc. Acquisitions & FX) 137 210<br />
Acquisitions / FX 957 (1,520)<br />
Gross cash flow 1,094 (1,310)<br />
Period end cash balance 1,317 223<br />
Average net cash (145) 320<br />
Trusted to deliver excellence<br />
19
Half <strong>year</strong> analysis<br />
Year on Year<br />
Half on Half<br />
H2 <strong>2012</strong> H2 2011 Change H1 <strong>2012</strong> Change<br />
Order book* (£bn) 60.1 57.6 4% 60.1 0%<br />
Underlying revenue (£m) 6,452 5,814 11% 5,757 12%<br />
Underlying OE revenue (£m) 3,170 2,667 19% 2,723 16%<br />
Underlying Services revenue (£m) 3,282 3,147 4% 3,034 8%<br />
UPBT (£m) 792 562 41% 637 24%<br />
Net cash (£m) 1317 223 869<br />
Average Net cash (£m) 300 (140) (590)<br />
*2011 order book restated to exclude IAE orders of £4.6bn<br />
Trusted to deliver excellence<br />
20
Research & development<br />
Full Year<br />
£m 2008 2009 2010 2011 <strong>2012</strong><br />
Gross R&D (885) (864) (923) (908) (919)<br />
Net R&D (490) (471) (506) (520) (577)<br />
Net R&D expenditure as a percentage of underlying revenues 5.4% 4.7% 4.7% 4.6% 4.7%<br />
Capitalised 113 121 111 93 38<br />
Amortised (26) (29) (27) (36) (50)<br />
R&D charged to Income Statement (403) (379) (422) (463) (589)<br />
Trusted to deliver excellence<br />
21
Foreign exchange<br />
FY <strong>2012</strong> FY 2011 FY <strong>2012</strong> FY 2011<br />
Period average rates<br />
Period end-spot rate<br />
USD 1.59 1.60 USD 1.63 1.55<br />
Euro 1.23 1.15 Euro 1.23 1.20<br />
NOK 9.21 8.99 NOK 9.05 9.27<br />
Translation effects (Revenue and Profit)<br />
• Changes in average FX rates (mainly EUR) caused a<br />
(1.2%) headwind on Group Revenue<br />
• Segmental revenue headwinds:<br />
• Civil (1.4%); Marine (2.2%)<br />
• Translation impact on Group UPBT of (£28m); mainly<br />
caused by EUR<br />
• Segmental effect concentrated in Civil and Marine<br />
Balance Sheet effects<br />
• Changes in period end FX rates cause overseas cash<br />
balances to be valued differently at <strong>the</strong> B/S date<br />
• FX rates at FY12 vs FY11 caused a (£54m) reduction in<br />
<strong>the</strong> value of cash balances held<br />
Transaction Effects<br />
Good visibility of improving achieved rates<br />
30<br />
Cover (£bn)<br />
Average rate in book (RHS)<br />
1.8<br />
• Continuing to take US$ cover<br />
• US$ hedge book at $22.5bn with average rate of $1.6 at<br />
31 December <strong>2012</strong><br />
• On average <strong>the</strong> net exposure is around $4bn per annum –<br />
approx 5 <strong>year</strong>s cover in place<br />
20<br />
10<br />
0<br />
2008 2009 2010 2011 <strong>2012</strong><br />
1.7<br />
1.6<br />
1.5<br />
Trusted to deliver excellence<br />
22
Pension risks substantially reduced<br />
• UK pension schemes make up around 90% of gross liabilities; 95% of gross assets<br />
• Significantly reduced risk and volatility over <strong>the</strong> last five <strong>year</strong>s<br />
• UK defined benefit schemes closed to new members in 2007<br />
• £500m special injection in 2007<br />
• More than 80% of assets in lower risk, liability driven investments (LDI)<br />
• Longevity swap provides greater certainty over future funding requirements<br />
• UK schemes<br />
• Surplus of £180m (calculated on an IAS19 basis*)<br />
• <strong>2012</strong> contributions of £250m including £101m of deficit reduction payments<br />
• Level of contributions expected to continue in 2013<br />
• Triennial review underway on RRPF<br />
• Overseas Schemes<br />
• Deficit of (£725m) (IAS19 basis*) principally made up of unfunded US healthcare schemes (£481m)<br />
• <strong>2012</strong> contributions of £47m<br />
• Contributions expected in 2013 around £40m<br />
Prudent pension management has reduced risk<br />
*IAS19 reporting basis discounts liabilities using a AA bond rate – while this is <strong>the</strong> required reporting method it does not match <strong>the</strong><br />
method used to manage <strong>the</strong> pension schemes which discounts liabilities using a swap curve to match <strong>the</strong> LDI portfolio.<br />
Trusted to deliver excellence<br />
23
Customer finance<br />
Strong financial position allows <strong>the</strong> Group to provide financing support to customers in <strong>the</strong><br />
form of guaranteed financing, asset-value guarantees and leasing transactions<br />
• Selective and designed to minimize risk:<br />
• Board guidelines limit gross and net exposures by counterparty, product type and <strong>year</strong><br />
• Commitments continually monitored with suitable management policies in place<br />
• Exposures audited twice <strong>year</strong>ly with independent asset value appraisals<br />
• Stable contingent liabilities – as of December 31 st <strong>2012</strong>:<br />
• Total Gross Exposure: US$925m;<br />
• Total Net Exposure (less security): US$114m;<br />
• Total Stressed Exposure (assumes 20% asset discount): US$216m<br />
• Liabilities are spread across multiple geographies, customers and aircrafts<br />
Trusted to deliver excellence<br />
24
Group guidance - 2013<br />
Revenue Growth<br />
Profit Growth<br />
Group Modest Good<br />
Civil Modest Strong<br />
Defence Modest Modest reduction<br />
Marine Modest Modest<br />
Energy Some improvement Some improvement<br />
Foreign Exchange<br />
Neutral<br />
Tax Rate Underlying tax rate 22% - 23%<br />
R&D<br />
Capital Expenditure<br />
Pensions<br />
Modest increase in expenditure<br />
Modest decrease in P&L charge due to capitalisation of Trent XWB<br />
c. £100m increase in expenditure<br />
No material changes expected to funding levels<br />
Trusted to deliver excellence<br />
25
3. Key performance indicators<br />
Data pack<br />
Trusted to deliver excellence<br />
26
Group KPIs<br />
Selection of Group KPIs FY 2008 FY 2009 FY 2010 FY 2011 FY <strong>2012</strong><br />
Capital Expenditure (£m) 283 291 361 467 491<br />
Engine Deliveries 1,621 1,600 1,657 1,853 1,922<br />
Installed Thrust* (m/lbs) 348 367 382 400 360<br />
Percentage of Civil Fleet Under<br />
Management<br />
57% 59% 70% 68% 73%<br />
Return on Capital Employed** 17.1% 17.2% 17.3% 17.8% 18.1%<br />
* 60m/lbs of thrust removed from <strong>the</strong> installed base on completion of IAE restructuring<br />
** Return on capital employed is calculated as <strong>the</strong> after-tax underlying profit, divided by <strong>the</strong> average net<br />
assets during <strong>the</strong> <strong>year</strong>, adjusted for net cash, net post-retirement deficits, and goodwill previously written off.<br />
Trusted to deliver excellence<br />
27
4a. Details by business sector – Civil<br />
Data pack<br />
Trusted to deliver excellence<br />
28
Civil Aerospace<br />
FY <strong>2012</strong> underlying revenues = £6,437m<br />
OE<br />
46%<br />
Wide-body<br />
58%<br />
Narrow-body<br />
6%<br />
Services<br />
54%<br />
Corporate<br />
& Regional<br />
36%<br />
OE volume drives revenue growth<br />
• Growth coming from >50% market share of <strong>the</strong> largest wide-body fleet replacement cycle and market expansion in history<br />
• Trent engine family powers most major wide-body platforms; over 2,200 in service with around 2,400 in <strong>the</strong> order book<br />
• Fur<strong>the</strong>r order book growth potential via sole share of A350, with an opportunity for an additional 2,500 Trent engine units<br />
Operational leverage in OE and Services<br />
• Significant increase in Trent unit volumes provides better opportunity to absorb fixed costs<br />
• Operational leverage applies not only to OE but also to services that represented 54% of FY12 Civil Aerospace revenue<br />
Competitive advantage of high LTSA coverage<br />
• LTSAs allow better matching of load vs. capacity by managing <strong>the</strong> timing and scope of maintenance<br />
• LTSAs rising from 73% <strong>2012</strong> services revenue to over 90% over <strong>the</strong> next decade<br />
Trusted to deliver excellence<br />
29
m/lbs of installed thrust<br />
Growth in <strong>the</strong> installed base<br />
OE volume drives revenue growth<br />
• Growth coming from >50% market share of <strong>the</strong> largest wide-body fleet replacement cycle and market expansion in history<br />
• Trent engine family powers most major wide-body platforms; over 2,200 in service with around 2,400 in <strong>the</strong> order book<br />
• Fur<strong>the</strong>r order book growth potential via sole share of A350, with an opportunity for an additional 2,500 Trent engine units<br />
700<br />
600<br />
FY <strong>2012</strong><br />
500<br />
400<br />
360 m/lbs<br />
300<br />
200<br />
100<br />
0<br />
1988 1992 1996 2000 2004 2008 <strong>2012</strong> 2016 2020<br />
Narrow-body Corporate & Regional Trent RB211<br />
*Installed thrust is shown net of retirements and includes 50% of <strong>the</strong> V2500 programme up to to H1 <strong>2012</strong><br />
Trusted to deliver excellence<br />
30
Market leader in large aircraft<br />
Market leader<br />
Launch engine<br />
Engine<br />
Trent 700<br />
Trent 800 Trent 500 Trent 900 Trent 1000 Trent XWB<br />
Market share<br />
(Aircraft)<br />
57% 40% 100% 44% 41% 100%<br />
Engines in<br />
service<br />
980 450 524 216<br />
52<br />
= 2,222<br />
50% market share of firm backlog on wide-body platforms<br />
Trent order book around 2,400 engines<br />
Trusted to deliver excellence<br />
31
The mid-size strategy<br />
• IAE restructuring completed<br />
• $1.5bn cash received on completion (excluded from Group level guidance)<br />
• Headline profit on disposal of £699m (excluded from underlying profit figures)<br />
• Order Book – Civil order book reduced by £4.6bn<br />
• Ongoing revenue based on a $/EFH basis for 15 <strong>year</strong>s<br />
• <strong>Rolls</strong>-<strong>Royce</strong> continues engineering, component manufacturing and final assembly<br />
activities<br />
• Civil Aerospace operating profit benefitted from a £92m uplift in H2 <strong>2012</strong><br />
• Joint venture announced with P&W to develop new engines for<br />
future generation mid-size aircraft<br />
• Focus on high bypass geared technologies<br />
• Equal partnership with both bringing unique capabilities<br />
• Subject to regulatory approval<br />
Trusted to deliver excellence<br />
32
Civil engine deliveries<br />
Delivered<br />
Engines<br />
1200<br />
1000<br />
800<br />
600<br />
400<br />
200<br />
Delivered<br />
Thrust* (m/lbs)<br />
35<br />
30<br />
25<br />
20<br />
15<br />
10<br />
5<br />
0<br />
0<br />
2002 2003 2004 2005 2006 2007 2008 2009 2010 2011 <strong>2012</strong><br />
Wide-body Narrow-body* Corporate & Regional Delivered Thrust* m/lbs<br />
• <strong>Rolls</strong>-<strong>Royce</strong> powers over 30 types of commercial aircraft<br />
• With around 3,100 engines in <strong>the</strong> Civil Order book, deliveries will grow strongly<br />
*Delivery of engines and thrust are shown net of retirements and includes 50% of <strong>the</strong> V2500 programme until completion of IAE restructuring<br />
Trusted to deliver excellence<br />
33
Civil engine deliveries<br />
Number of engines<br />
2003 2004 2005 2006 2007 2008 2009 2010 2011<br />
HY<br />
<strong>2012</strong><br />
<strong>2012</strong><br />
Wide-body 169 171 170 203 145 193 225 185 224 125 275<br />
Narrow-body* 216 237 327 319 308 351 347 371 418 220 220<br />
Corporate and Regional 361 416 384 334 398 443 272 290 320 188 393<br />
Civil Total 746 824 881 856 851 987 844 846 962 533 888<br />
*Engine Deliveries are shown net of retirements and includes 50% of <strong>the</strong> V2500 programme until completion of IAE restructuring<br />
*<strong>2012</strong> Narrowbody deliveries include V2500 until completion of IAE restructuring<br />
Trusted to deliver excellence<br />
34
TotalCare – A powerful model<br />
Value to Customers<br />
Predictable costs<br />
Supports outsourcing strategies<br />
Flexible contract design<br />
Risk transfer<br />
Value to <strong>Rolls</strong>-<strong>Royce</strong><br />
Expand revenue opportunity<br />
Manage overhaul load and capacity effectively<br />
Incentivises cost reduction<br />
Best positioned to manage risk<br />
Features<br />
• Key assumptions: Utilisation of engines; material and labour costs; inflation; FX; frequency and scope of overhaul<br />
• TotalCare has been available on wide-body since 1997<br />
• Growing installed base of products with useful lives of >25+ <strong>year</strong>s <strong>results</strong> in stable, long-term annuity of services<br />
revenue = 54% FY<strong>2012</strong> revenue<br />
• The OEM is best placed to own and manage life-cycle product costs leading to improved cost efficiencies in<br />
LTSAs and reduced customer disruption<br />
• LTSAs allows better matching of load vs. capacity by managing <strong>the</strong> timing and type of maintenance performed<br />
• LTSAs rising from 73% FY<strong>2012</strong> installed fleet to over 90% over <strong>the</strong> next decade<br />
• We can use decades of Civil LTSA experience to better serve customers in Defence, Marine and Energy<br />
Adding value for <strong>Rolls</strong>-<strong>Royce</strong> and our customers<br />
Trusted to deliver excellence<br />
35
TotalCare – A powerful model<br />
Example below shows a launch customer with OE losses linked to an LTSA, and a stable margin assumed<br />
throughout <strong>the</strong> contract.<br />
Contract Profits<br />
• Margin booked progressively reflecting latest view of actual performance compared with assumptions<br />
• Cash flow reflects a combination of steady flying hour ($/EFH) receipts through <strong>the</strong> contract and periodic overhaul spend<br />
• Difference between cash received and profit booked is recorded as ei<strong>the</strong>r a trade receivable or payable depending on <strong>the</strong><br />
position of <strong>the</strong> contract<br />
Trusted to deliver excellence<br />
36
Civil installed thrust<br />
Millions of pounds (m/lbs) of installed thrust* in service<br />
2003 2004 2005 2006 2007 2008 2009 2010 2011<br />
HY<br />
<strong>2012</strong><br />
<strong>2012</strong><br />
Wide-body 175 183 193 202 209 215 226 235 246 253 260<br />
Narrow-body* 27 30 33 37 41 45 49 54 58 0 0<br />
Corporate and Regional 72 75 78 81 84 88 91 93 96 97 100<br />
Civil Total 274 288 305 320 334 348 367 382 400 350 360<br />
*Installed thrust is shown net of retirements and includes 50% of <strong>the</strong> V2500 programme until completion of IAE restructuring<br />
In <strong>2012</strong> approximately 60 m/lbs of V2500 installed thrust was excluded from <strong>the</strong> installed fleet total<br />
Trusted to deliver excellence<br />
37
Installed base by age<br />
Total installed thrust* – 360 m/lbs – December <strong>2012</strong><br />
50%<br />
40%<br />
30%<br />
20%<br />
10%<br />
0%<br />
0-10 <strong>year</strong>s 11-20 <strong>year</strong>s >20 <strong>year</strong>s<br />
Age of Aircraft<br />
Wide-body<br />
Corporate & Regional<br />
Younger, more fuel efficient aircraft are typically parked last<br />
Trusted to deliver excellence<br />
38
4b. Details by business sector – Defence<br />
Data pack<br />
Trusted to deliver excellence<br />
39
Defence Aerospace<br />
FY <strong>2012</strong> underlying revenues = £2,417m<br />
OE<br />
46%<br />
Combat<br />
36%<br />
UAV/Trainer<br />
10%<br />
Development<br />
5%<br />
Services<br />
49%<br />
Transport<br />
54%<br />
Broad and Diverse Portfolio<br />
• Installed base of 18,000 engines includes 24 engine programmes in 103 countries with 160 armed forces<br />
• Broad portfolio and large installed fleet positions <strong>the</strong> Defence business well to meet <strong>the</strong> challenges of customer<br />
budget pressures<br />
Resilient characteristics of military transport market<br />
• Market leader in military transport market with stable customer flying hours experienced over <strong>the</strong> last 5 <strong>year</strong>s<br />
Opportunities to increase LTSA coverage<br />
• Budgetary pressures and customers’ requirements for increased value and more flexible contracts provide<br />
opportunities for additional services and collaboration<br />
• Such contracts will increase LTSA coverage and drive operational efficiencies<br />
Trusted to deliver excellence<br />
40
Defence portfolio<br />
Combat Jets<br />
>1,500 engines in service<br />
Trainers<br />
>1,200 engines in service<br />
Transport<br />
>9,000 engines in service<br />
Helicopters<br />
>5,000 engines in service<br />
Engine<br />
Platform(s)<br />
EJ200<br />
Eurofighter Typhoon<br />
Adour SEPECAT Jaguar BAE Hawk Mitsubishi F-1<br />
Pegasus<br />
Harrier<br />
RB199<br />
Tornado<br />
<strong>Rolls</strong>-<strong>Royce</strong> LiftSystem F35-B<br />
Adour BAE Hawk T-45 Goshawk<br />
FJ44<br />
Saab SK60<br />
AE1107C<br />
V22 Osprey<br />
AE2100<br />
C130 J Hercules<br />
T56 C130 A-H Hercules P-3C Orion E-2C Hawkeye<br />
TP400<br />
A400M<br />
AE3007 Global Hawk EMB45<br />
MTR390<br />
Eurocopter Tiger<br />
RTM322 Blackhawk Apache NHI NH90<br />
CTS800 Super Lynx 300<br />
Gem<br />
Lynx<br />
Gnome<br />
Augusta Westland Sea King<br />
Trusted to deliver excellence<br />
41
Developing <strong>the</strong> Defence business<br />
Tranche<br />
3a<br />
Typhoon<br />
contract<br />
signed<br />
AV-8B enters service<br />
Allison purchase<br />
brings T-56 & AE<br />
2100 markets<br />
EJ200<br />
enters<br />
service<br />
Deal to power 72 aircraft with<br />
EJ200 from Saudi Arabia<br />
AirTanker<br />
awarded<br />
UK Tanker<br />
contract<br />
EJ200 engine<br />
in first combat<br />
deployment<br />
1988<br />
1990<br />
1992<br />
1994<br />
1996<br />
1998<br />
2000<br />
2002<br />
2004<br />
2006<br />
2008<br />
2010<br />
<strong>2012</strong><br />
T800 engine<br />
launched<br />
GE & <strong>Rolls</strong>-<br />
<strong>Royce</strong> team for<br />
JSF<br />
RTM322 enters<br />
service with<br />
Royal Navy<br />
Oakland R&O base<br />
purchased in US<br />
Full production of<br />
AE1107C for V-22<br />
Global Hawk<br />
UAV passes<br />
10,000 hours<br />
service<br />
First flight of<br />
A400M powered<br />
by TP400<br />
Engine certification<br />
for TP400 in A400M<br />
STOVL - 1st<br />
Vertical<br />
Engagement of<br />
LiftSystem<br />
Trusted to deliver excellence<br />
42
Defence engine deliveries<br />
Number of Engines<br />
1000<br />
900<br />
800<br />
700<br />
600<br />
500<br />
400<br />
300<br />
200<br />
100<br />
0<br />
2003 2004 2005 2006 2007 2008 2009 2010 2011 <strong>2012</strong><br />
Transport Helicopters Combat Trainers / O<strong>the</strong>r<br />
• Installed base of 18,000 engines includes 24 engine programmes in 103 countries with 160 armed forces<br />
• Market leader in military transport market with stable customer flying hours experienced over <strong>the</strong> last 5 <strong>year</strong>s<br />
Increasing installed base delivers aftermarket revenues for decades<br />
Trusted to deliver excellence<br />
43
Defence engine deliveries<br />
2003 2004 2005 2006 2007 2008 2009 2010 2011<br />
HY<br />
<strong>2012</strong><br />
<strong>2012</strong><br />
Transport 124 121 120 117 134 133 218 265 289 131 296<br />
Helicopters 257 242 332 285 271 264 323 343 412 197 447<br />
Combat 73 94 80 71 64 93 103 102 103 62 113<br />
Trainers / O<strong>the</strong>r 56 52 33 41 26 27 18 0 10 3 8<br />
Defence Total 510 509 565 514 495 517 662 710 814 393 864<br />
Trusted to deliver excellence<br />
44
4c. Details by business sector – Marine<br />
Data pack<br />
Trusted to deliver excellence<br />
45
Marine<br />
FY <strong>2012</strong> underlying revenues = £2,249m<br />
Services<br />
43%<br />
Merchant<br />
20%<br />
Naval<br />
33%<br />
OE<br />
57%<br />
Offshore<br />
47%<br />
Ship design capability<br />
• <strong>Rolls</strong>-<strong>Royce</strong> designs ships, selecting products from its own market-leading portfolio to create integrated ship solutions<br />
• <strong>Rolls</strong>-<strong>Royce</strong> design + OE capabilities = c. 60% ship contract value<br />
• Recent investment in global network of 38 services centres = opportunity to capture better share of services market<br />
Opportunities from stricter emissions requirements<br />
• International Maritime Organisation beginning strict emissions limits in 2016<br />
• Drives OE and services opportunities for ship designers with broad product portfolios<br />
Long-standing nuclear capabilities in Naval<br />
• Unique capabilities in pressurised water reactors for <strong>the</strong> UK MoD’s nuclear powered submarine fleet<br />
Price of oil<br />
• High price of oil drives significant activity around deepwater offshore exploration for oil, increasing demand for<br />
products and services in developing markets, such as Brazil<br />
Trusted to deliver excellence<br />
46
Marine – Business overview<br />
Market Sector Description Products<br />
Offshore<br />
Supply of vessels benefit from cutting-edge<br />
technology, providing safe, flexible and<br />
reliable solutions - purpose fitted to support<br />
<strong>the</strong> offshore oil & gas drilling industry<br />
Full ship design, allowing integration of<br />
propulsion, motion control, winches and deck<br />
handling and power plant systems<br />
Merchant<br />
Decades of experience in designing,<br />
developing and equipping vessels in <strong>the</strong><br />
cargo, tugs and workboats, passenger, and<br />
luxury yacht sectors<br />
World leading range of propulsion and<br />
manoeuvring systems for tugs and workboats<br />
Environmental rules are driving innovation in<br />
low emissions<br />
Naval<br />
Supply of power systems and auxiliary<br />
equipment to a range of naval applications;<br />
from patrol and supply vessels to<br />
conventional combatants and more recent<br />
fast attack craft<br />
Pioneered <strong>the</strong> development of nuclear power<br />
for <strong>the</strong> UK submarine fleet<br />
Active role in developing new technologies<br />
for <strong>the</strong> future<br />
Requirements for more power and greater<br />
flexibility. <strong>Rolls</strong>-<strong>Royce</strong> MT30 gas turbine<br />
selected for US Littoral Combat Ship and two<br />
new UK aircraft carriers<br />
Supply and support of nuclear power<br />
systems on <strong>the</strong> entire UK submarine fleet,<br />
including <strong>the</strong> new Astute class<br />
Trusted to deliver excellence<br />
47
Marine Order Trends<br />
£bn<br />
3<br />
2.5<br />
2<br />
1.5<br />
1<br />
0.5<br />
£bn<br />
6<br />
5<br />
4<br />
3<br />
2<br />
1<br />
0<br />
H1 2007 H2 2007 H1 2008 H2 2008 H1 2009 H2 2009 H1 2010 H2 2010 H1 2011 H2 2011 H1 <strong>2012</strong> H2 <strong>2012</strong><br />
Order intake OE Sales Order Book (Right hand axis)<br />
0<br />
Order intake is a lead indicator for revenue growth<br />
Trusted to deliver excellence<br />
48
Unique capabilities for Offshore<br />
<strong>Rolls</strong>-<strong>Royce</strong> designs and integrates complex systems<br />
100%<br />
80%<br />
60%<br />
40%<br />
Steel<br />
Labour<br />
Ship Design<br />
Engine<br />
Commissioning<br />
Propulsion<br />
• Ship Design is a key enabler<br />
• Design stage allows <strong>Rolls</strong>-<strong>Royce</strong> to <strong>full</strong>y<br />
integrate all high technology systems<br />
• <strong>Rolls</strong>-<strong>Royce</strong> supplies <strong>the</strong> highest value-add<br />
components<br />
• Integrated systems and deep product<br />
knowledge streng<strong>the</strong>ns long-term service<br />
offerings<br />
20%<br />
0%<br />
Deck Machinery<br />
<strong>Rolls</strong>-<strong>Royce</strong> Scope<br />
Non <strong>Rolls</strong>-<strong>Royce</strong> Scope<br />
<strong>Rolls</strong>-<strong>Royce</strong> Key Enabler<br />
Trusted to deliver excellence<br />
49
4d. Details by business sector – Energy<br />
Data pack<br />
Trusted to deliver excellence<br />
50
Energy<br />
FY <strong>2012</strong> underlying revenues = £962m<br />
Services<br />
64%<br />
OE<br />
36%<br />
Oil & Gas<br />
64%<br />
Power<br />
Generation<br />
25%<br />
Civil<br />
Nuclear<br />
11%<br />
Global energy demand outstripping available supply<br />
• Global demand will require a range of energy solutions<br />
Price of oil<br />
• High price of oil drives demand for gas turbines, compression and pumping engines in <strong>the</strong> oil & gas sector<br />
Power generation in developing markets<br />
• Well-positioned to capture demand for localised energy production in less developed regions where power generation<br />
infrastructure is nascent<br />
Long-term opportunities in Civil Nuclear<br />
• <strong>Rolls</strong>-<strong>Royce</strong> has acquired over many <strong>year</strong>s unique instrumentation & controls, inspection and component capabilities<br />
in Civil Nuclear to support <strong>the</strong> growing ambitions of <strong>the</strong> major primes<br />
Trusted to deliver excellence<br />
51
Energy – Business overview<br />
Oil & Gas Power Generation Civil Nuclear<br />
Market Sector Description Products<br />
Oil & Gas<br />
<strong>Rolls</strong>-<strong>Royce</strong> utilises its gas<br />
turbine technology, coupled<br />
with its centrifugal<br />
compressors, to provide a <strong>full</strong><br />
product range for gas<br />
compression and oil pumping<br />
duties both on and offshore.<br />
RB211<br />
Aero-derivative<br />
Avon<br />
Aero-derivative<br />
Barrel compressors<br />
Pipeline<br />
compressors<br />
650 units<br />
worldwide<br />
1,200 units<br />
>700 units<br />
24 million hours<br />
operational experience<br />
60 million hours<br />
operational experience<br />
Huge experience in<br />
natural gas handling<br />
950 units Up to 90% efficiency<br />
Power<br />
Generation<br />
<strong>Rolls</strong>-<strong>Royce</strong> offers a wide<br />
range gas turbine based<br />
solutions for <strong>the</strong> power<br />
generation market, backed up<br />
by a comprehensive range of<br />
service solutions<br />
More than 130 million hours of<br />
operating experience with<br />
industrial gas turbines.<br />
501-K<br />
Aero-derivative<br />
Trent 60<br />
500 customers<br />
40 countries<br />
60 million hrs operating<br />
experience<br />
The most advanced aeroderivative<br />
industrial gas turbine available today.<br />
Delivering up to 64MW of electric power in<br />
simple cycle service, <strong>the</strong> Trent 60 has<br />
established a new benchmark for fuel<br />
economy and cost savings.<br />
Trusted to deliver excellence<br />
52
Energy – Business overview<br />
Oil & Gas Power Generation Civil Nuclear<br />
Market Sector Description Products<br />
Civil Nuclear<br />
Instrumentation and Control<br />
Systems<br />
Mechanical Systems and<br />
Component Engineering<br />
Safety, Licensing and<br />
Environmental Engineering<br />
Delivering technology and services to improve <strong>the</strong> reliability,<br />
availability and safety of nuclear plants. <strong>Rolls</strong>-<strong>Royce</strong> systems are<br />
installed in over 200 nuclear reactors across 20 countries worldwide<br />
<strong>Rolls</strong>-<strong>Royce</strong> offers <strong>full</strong> engineering service, including analysis,<br />
design, manufacturing, specialist procurement and supply of key<br />
components for steam supply and<br />
An integrated approach to environmental management is a key part<br />
of our project delivery, encompassing radiological and<br />
environmental impact assessment and radiation dose modelling.<br />
Reactor Support Services<br />
<strong>Rolls</strong>-<strong>Royce</strong> aims to maximise safety and plant availability, minimise<br />
unplanned outages and achieve optimal performance for our<br />
customers.<br />
Trusted to deliver excellence<br />
53
Energy – Civil Nuclear<br />
• MoUs with AREVA, Westinghouse, EdF, Larsen & Toubro (India) and Rosatom<br />
(Russia)<br />
• World-leader in safety-critical digital instrumentation and control systems (I&C) for<br />
nuclear reactors, <strong>Rolls</strong>-<strong>Royce</strong> has nuclear I&C systems installed in over 200<br />
reactors across 20 countries.<br />
• <strong>Rolls</strong>-<strong>Royce</strong> has I&C systems in all 58 reactors in France and contracts in place to<br />
supply systems to more than 70% of reactors in operation or under construction in<br />
China today<br />
• Through our teaming arrangement with Westinghouse, we provide reactor<br />
inspection services to 70% of all pressurised water reactors in <strong>the</strong> US<br />
• Growing demand for safety systems and service on existing reactors.<br />
<strong>Rolls</strong>-<strong>Royce</strong> is a critical supplier in <strong>the</strong> Civil Nuclear market<br />
Trusted to deliver excellence<br />
54
4d. Details by business sector –<br />
Engine Holding<br />
Trusted to deliver excellence<br />
55
Engine Holding<br />
Bergen AG<br />
Tognum<br />
Description<br />
Products<br />
Bergen<br />
Bergen AG is a leading<br />
developer and producer of<br />
medium speed diesel and gas<br />
propulsion engines<br />
and generator sets.<br />
Diesel Engines<br />
Gas Engines<br />
Our medium-speed Bergen diesel engine<br />
portfolio comprises established and newly<br />
developed models in <strong>the</strong> 1.8 to 8MW power<br />
range.<br />
Bergen lean-burn gas engines are meeting<br />
<strong>the</strong> emerging market for low-emission<br />
propulsion and are <strong>the</strong> cleanest and most<br />
efficient on <strong>the</strong> market available in powers<br />
from 1.4 to 7MW.<br />
Tognum<br />
Engines<br />
On-site Energy and<br />
Components<br />
The product portfolio of <strong>the</strong> Engines business unit comprises MTU<br />
engines and propulsion systems for ships, for heavy land, rail and<br />
defence vehicles and for <strong>the</strong> oil and gas industry.<br />
The On-site Energy business unit supplies distributed power<br />
generation systems carrying <strong>the</strong> MTU Onsite Energy brand. These<br />
comprise diesel engines for emergency power, prime power and<br />
continuous power, as well as cogeneration power plants based on<br />
gas engines and gas turbines that generate both power and heat.<br />
Trusted to deliver excellence<br />
56
Tognum joint venture<br />
In March 2011 <strong>Rolls</strong>-<strong>Royce</strong> and Daimler announced JV offer for Tognum, a leading<br />
manufacturer of high speed diesels used in Marine, Energy and industrial applications<br />
• Engine Holding (JV) today owns over 99% of Tognum<br />
• Court has granted <strong>the</strong> right to “squeeze out” <strong>the</strong> minority shareholders, subject to customary court<br />
appeals process, which is ongoing<br />
• <strong>Rolls</strong>-<strong>Royce</strong> and Daimler have appointed representatives to <strong>the</strong> supervisory board<br />
Tognum JV provides strong growth opportunities<br />
• Our Marine ship design business and service business model provide opportunities to grow <strong>the</strong><br />
aftermarket business<br />
• Tognum’s Energy solutions business complements our power generation business<br />
• We see fur<strong>the</strong>r synergy opportunities in oil & gas markets<br />
• Daimler brings expertise in high volume manufacturing and global market access<br />
• Preliminary <strong>2012</strong> financials – EBIT of €296m<br />
Future Plans<br />
• Develop <strong>the</strong> roadmap for growth<br />
• Fully consolidated from 01 January 2013<br />
• No financial guidance for Tognum while independently listed<br />
Trusted to deliver excellence<br />
57
Bergen – Transfer to Engine Holding<br />
<strong>Rolls</strong>-<strong>Royce</strong>’s Full Year 2011 financial <strong>results</strong> reflected management of <strong>the</strong> Bergen AS within <strong>the</strong> Marine and Energy<br />
business segments.<br />
On 2 nd January <strong>2012</strong> Bergen transferred to Engine Holding. <strong>Rolls</strong>-<strong>Royce</strong>’s 2011 <strong>full</strong> <strong>year</strong> business segment <strong>results</strong> have<br />
been restated to allow comparison with <strong>the</strong> performance of <strong>the</strong> business segments as <strong>the</strong>y are reported in <strong>Rolls</strong>-<br />
<strong>Royce</strong>’s <strong>2012</strong> <strong>results</strong>..<br />
Bergen – Business Mechanics<br />
Marine<br />
• Bergen sells diesel engines to <strong>Rolls</strong>-<strong>Royce</strong> Marine<br />
• <strong>Rolls</strong>-<strong>Royce</strong> Marine sells engines as part of a<br />
package to <strong>the</strong> end customer<br />
• Transfer of Bergen from Marine moves profit earned<br />
to Bergen (Engine Holding) segment<br />
• Marine revenues unchanged as sales to end<br />
customer are unchanged<br />
• Intersegment sales (Bergen to Marine) are<br />
eliminated at Group level<br />
Energy<br />
• Bergen sells diesel engines direct to power<br />
generation customers - all revenue and profit are<br />
realised in Bergen.<br />
• Before <strong>the</strong> Bergen transfer, revenues and profits<br />
flowed through Energy segment <strong>results</strong><br />
• Transfer of Bergen into Engine Holding removes all<br />
related revenue and profit from Energy <strong>results</strong><br />
• There is no intersegment trading between Energy<br />
and Bergen<br />
Bergen diesel engine business transfers into Engine Holding<br />
Trusted to deliver excellence<br />
58
Bergen – Results Restatement<br />
FY 2011 restatement<br />
Underlying Turnover<br />
Underlying Profit<br />
FY2011<br />
As reported<br />
Impact of<br />
Restatement<br />
FY2011<br />
Restated<br />
FY2011<br />
As reported<br />
Impact of<br />
Restatement<br />
FY2011<br />
Restated<br />
Civil Aerospace 5,572 5,572 499 499<br />
Defence Aerospace 2,235 2,235 376 376<br />
Marine 2,271 0 2,271 323 (36) 287<br />
Energy 1,199 (116) 1,083 24 (8) 16<br />
Engine Holding 331 331 36 44 80<br />
Intersegment Elimination (215) (215) - - -<br />
Central Costs (52) (52)<br />
<strong>Rolls</strong>-<strong>Royce</strong> Holdings 11,277 0 11,277 1,206 0 1,206<br />
Effect of new Bergen trading set up as part of Engine Holding<br />
Trusted to deliver excellence<br />
59
5. Additional information<br />
Data pack<br />
Trusted to deliver excellence<br />
60
Investor Relations<br />
Simon Goodson<br />
Director – Investor Relations<br />
Tel +44(0)207 227 9237<br />
simon.goodson@rolls-royce.com<br />
Graeme Barnes<br />
Manager – Investor Relations<br />
Tel +44 (0)1332 823821<br />
graeme.barnes@rolls-royce.com<br />
Jilinda Crowley<br />
Assistant Director – Investor Relations<br />
Tel: +44(0)207 227 9282<br />
jilinda.crowley@rolls-royce.com<br />
Jacinta Francis<br />
Programme Coordinator – Investor Relations<br />
Tel +44(0)207 227 9237<br />
jacinta.francis@rolls-royce.com<br />
For more information:<br />
www.rolls-royce.com/investors<br />
Trusted to deliver excellence<br />
61
Investor Relations - iPad App<br />
Available as a free<br />
download on iTunes<br />
Trusted to deliver excellence<br />
62
Safe harbour statement<br />
This Results Announcement contains certain forward-looking statements. These<br />
forward-looking statements can be identified by <strong>the</strong> fact that <strong>the</strong>y do not relate only<br />
to historical or current facts. In particular, all statements that express forecasts,<br />
expectations and projections with respect to future matters, including trends in<br />
<strong>results</strong> of operations, margins, growth rates, overall market trends, <strong>the</strong> impact of<br />
interest or exchange rates, <strong>the</strong> availability of financing to <strong>the</strong> Company, anticipated<br />
cost savings or synergies and <strong>the</strong> completion of <strong>the</strong> Company's strategic<br />
transactions, are forward-looking statements. By <strong>the</strong>ir nature, <strong>the</strong>se statements<br />
and forecasts involve risk and uncertainty because <strong>the</strong>y relate to events and<br />
depend on circumstances that may or may not occur in <strong>the</strong> future. There are a<br />
number of factors that could cause actual <strong>results</strong> or developments to differ<br />
materially from those expressed or implied by <strong>the</strong>se forward-looking statements<br />
and forecasts. The forward-looking statements reflect <strong>the</strong> knowledge and<br />
information available at <strong>the</strong> date of preparation of this Results Announcement, and<br />
will not be updated during <strong>the</strong> <strong>year</strong>. Nothing in this Results Announcement should<br />
be construed as a profit forecast.<br />
Trusted to deliver excellence<br />
63