- Page 1 and 2: Annual Performance Plan 2013 / 2014
- Page 3 and 4: Official Sign-off This Annual Perfo
- Page 5 and 6: 4.4 Quarterly Targets…………
- Page 7 and 8: STRATEGIC GOAL(SG) STRATEGIC OBJECT
- Page 9 and 10: 5. Foreword I am privileged to make
- Page 11 and 12: Part B: Strategic Overview 1. Revis
- Page 13 and 14: SCHOOLING 2025 AND ACTION PLAN TO 2
- Page 15 and 16: GOALS IN SCHOOLING 2025 AND ACTION
- Page 17: GOALS IN SCHOOLING 2025 AND ACTION
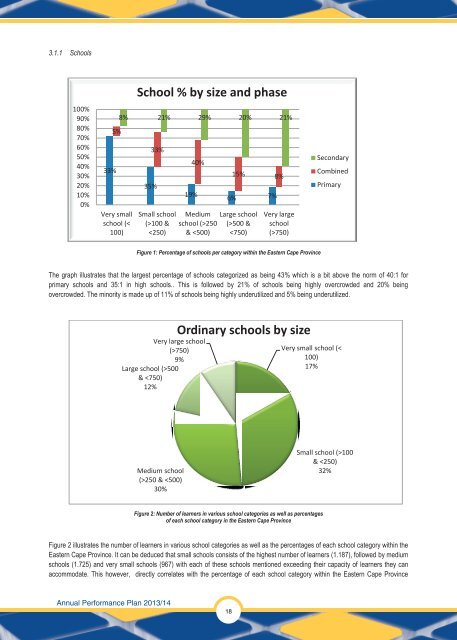
- Page 21 and 22: 100% 90% 80% 70% 60% 50% 40% 30% 20
- Page 23 and 24: Figure 8: Number of learners enroll
- Page 25 and 26: 3.1.6 Reported pregnancies Figure 1
- Page 27 and 28: 3.1.9 School Infrastructure: To ens
- Page 29 and 30: Figure 21: Funding per learner by e
- Page 31 and 32: 3.3.2.7 Public Service Act, 1994, [
- Page 33 and 34: 4. Planned interventions and progra
- Page 35 and 36: 4.1.1.7 Grade 12 Learner Support Th
- Page 37 and 38: 4.1.3.1 LTSM use in class - texts,
- Page 39 and 40: 4.1.10 Image of the sector The Depa
- Page 41 and 42: Annual Performance Plan 2013/14 40
- Page 43 and 44: Part C: Programme and sub-programme
- Page 45 and 46: Annual Performance Plan 2013/14 1.1
- Page 47 and 48: 2014/15 Estimated 2015/16 Estimated
- Page 49 and 50: Annual Performance Plan 2013/14 48
- Page 51 and 52: Programme 2: Public Ordinary school
- Page 53 and 54: Annual Performance Plan 2013/14 Str
- Page 55 and 56: Annual Performance Plan 2013/14 2.3
- Page 57 and 58: PPM 208 Number of full service scho
- Page 59 and 60: BT 205 Public Ordinary School - Res
- Page 61 and 62: Annual Performance Plan 2013/14 60
- Page 63 and 64: Grand Total 148 97 667 000.00 31 08
- Page 65 and 66: ►PPM301 Number of subsidised lear
- Page 67 and 68: Annual Performance Plan 2013/14 66
- Page 69 and 70:
Annual Performance Plan 2013/14 Pro
- Page 71 and 72:
Annual Performance Plan 2013/14 5.1
- Page 73 and 74:
Annual Performance Plan 2013/14 Pro
- Page 75 and 76:
Annual Performance Plan 2013/14 6.1
- Page 77 and 78:
Annual Performance Plan 2013/14 PRO
- Page 79 and 80:
3 All Grade R practitioners in the
- Page 81 and 82:
Annual Performance Plan 2013/14 Pro
- Page 83 and 84:
Annual Performance Plan 2013/14 82
- Page 85 and 86:
►PPM801 Number of public ordinary
- Page 87 and 88:
Annual Performance Plan 2013/14 BT
- Page 89 and 90:
HIV and AIDS Programme The core bus
- Page 91 and 92:
Annual Performance Plan 2013/14 90
- Page 93 and 94:
4 *The wording of this PPM is not t
- Page 95 and 96:
Annual Performance Plan 2013/14 Pro
- Page 97 and 98:
2 Building facilities maintenance p
- Page 99 and 100:
The condition ratings referred to i
- Page 101 and 102:
Annual Performance Plan 2013/14 2.
- Page 103 and 104:
Annual Performance Plan 2013/14 12.
- Page 105 and 106:
Annual Performance Plan 2013/14 STR
- Page 107 and 108:
Annual Performance Plan 2013/14 106
- Page 109 and 110:
Annual Performance Plan 2013/14 108
- Page 111 and 112:
6 Number of Grade 12 learners passi
- Page 113 and 114:
Not available yet Not available yet
- Page 115 and 116:
Annual Performance Plan 2013/14 KEY
- Page 117 and 118:
Annual Annual Performance Plan 2013
- Page 119 and 120:
Annual Annual Annual Performance Pl
- Page 121 and 122:
Annual Performance Plan 2013/14 120
- Page 123 and 124:
Indicator title PM103 Percentage of
- Page 125 and 126:
Indicator title Short definition Pu
- Page 127 and 128:
Indicator title Short definition Pu
- Page 129 and 130:
PROGRAMME 3 Indicator title Short d
- Page 131 and 132:
Indicator title Short definition Pu
- Page 133 and 134:
PROGRAMME 6 Indicator title Short d
- Page 135 and 136:
Indicator title PPM703: Number of E
- Page 137 and 138:
Indicator title Short definition Pu
- Page 139 and 140:
PROGRAMME 9 Indicator title Short d
- Page 141 and 142:
Indicator title Short definition Pu
- Page 143 and 144:
Indicator title Short definition PP
- Page 145 and 146:
Annual Performance Plan 2013/14 144
- Page 147 and 148:
2012/13 Actual Annual Performance P
- Page 149 and 150:
Annual Performance Plan 2013/14 TAB
- Page 151 and 152:
Number of Public Ordinary Schools 5
- Page 153 and 154:
Age 9 127 148 4 207 299 - - 145 801
- Page 155 and 156:
4.1 Number of learners that are in
- Page 157 and 158:
Annual Performance Plan 2013/14 156