5 Year Strategic Plan 2005/06 - Department of Education
5 Year Strategic Plan 2005/06 - Department of Education
5 Year Strategic Plan 2005/06 - Department of Education
Create successful ePaper yourself
Turn your PDF publications into a flip-book with our unique Google optimized e-Paper software.
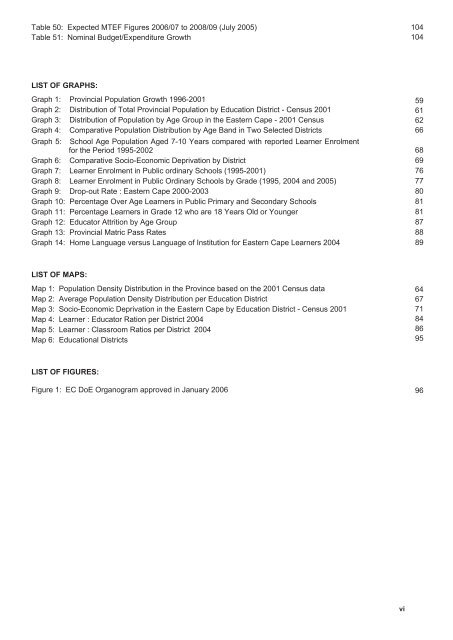
Table 50: Expected MTEF Figures 20<strong>06</strong>/07 to 2008/09 (July <strong>2005</strong>) 254<br />
Table 51: Nominal Budget/Expenditure Growth 254<br />
104<br />
104<br />
LIST OF GRAPHS:<br />
Graph 1: Provincial Population Growth 1996-2001 3<br />
Graph 2: Distribution <strong>of</strong> Total Provincial Population by <strong>Education</strong> District - Census 2001 3<br />
Graph 3: Distribution <strong>of</strong> Population by Age Group in the Eastern Cape - 2001 Census 3<br />
Graph 4: Comparative Population Distribution by Age Band in Two Selected Districts 3<br />
Graph 5: School Age Population Aged 7-10 <strong>Year</strong>s compared with reported Learner Enrolment<br />
for the Period 1995-2002 3<br />
Graph 6: Comparative Socio-Economic Deprivation by District 3<br />
Graph 7: Learner Enrolment in Public ordinary Schools (1995-2001) 3<br />
Graph 8: Learner Enrolment in Public Ordinary Schools by Grade (1995, 2004 and <strong>2005</strong>) 3<br />
Graph 9: Drop-out Rate : Eastern Cape 2000-2003 3<br />
Graph 10: Percentage Over Age Learners in Public Primary and Secondary Schools 3<br />
Graph 11: Percentage Learners in Grade 12 who are 18 <strong>Year</strong>s Old or Younger 3<br />
Graph 12: Educator Attrition by Age Group 3<br />
Graph 13: Provincial Matric Pass Rates 3<br />
Graph 14: Home Language versus Language <strong>of</strong> Institution for Eastern Cape Learners 2004 3<br />
59<br />
61<br />
62<br />
66<br />
68<br />
69<br />
76<br />
77<br />
80<br />
81<br />
81<br />
87<br />
88<br />
89<br />
LIST OF MAPS:<br />
Map 1: Population Density Distribution in the Province based on the 2001 Census data 3<br />
Map 2: Average Population Density Distribution per <strong>Education</strong> District 3<br />
Map 3: Socio-Economic Deprivation in the Eastern Cape by <strong>Education</strong> District - Census 2001 3<br />
Map 4: Learner : Educator Ration per District 2004 3<br />
Map 5: Learner : Classroom Ratios per District 2004<br />
Map 6: <strong>Education</strong>al Districts 3<br />
64<br />
67<br />
71<br />
84<br />
86<br />
95<br />
LIST OF FIGURES:<br />
Figure 1: EC DoE Organogram approved in January 20<strong>06</strong> 3<br />
96<br />
iv<br />
vi


