goodrich petroleum corporation - RR DONNELLEY FINANCIAL
goodrich petroleum corporation - RR DONNELLEY FINANCIAL
goodrich petroleum corporation - RR DONNELLEY FINANCIAL

Create successful ePaper yourself
Turn your PDF publications into a flip-book with our unique Google optimized e-Paper software.
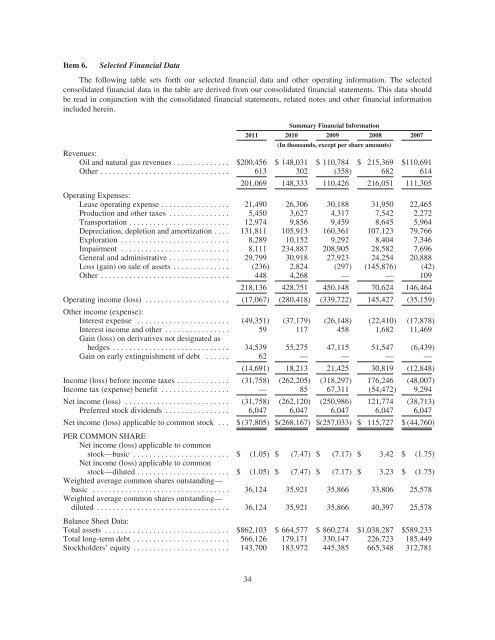
Item 6. Selected Financial Data<br />
The following table sets forth our selected financial data and other operating information. The selected<br />
consolidated financial data in the table are derived from our consolidated financial statements. This data should<br />
be read in conjunction with the consolidated financial statements, related notes and other financial information<br />
included herein.<br />
Summary Financial Information<br />
2011 2010 2009 2008 2007<br />
(In thousands, except per share amounts)<br />
Revenues:<br />
Oil and natural gas revenues .............. $200,456 $ 148,031 $ 110,784 $ 215,369 $110,691<br />
Other ................................ 613 302 (358) 682 614<br />
201,069 148,333 110,426 216,051 111,305<br />
Operating Expenses:<br />
Lease operating expense ................. 21,490 26,306 30,188 31,950 22,465<br />
Production and other taxes ............... 5,450 3,627 4,317 7,542 2,272<br />
Transportation ......................... 12,974 9,856 9,459 8,645 5,964<br />
Depreciation, depletion and amortization .... 131,811 105,913 160,361 107,123 79,766<br />
Exploration ........................... 8,289 10,152 9,292 8,404 7,346<br />
Impairment ........................... 8,111 234,887 208,905 28,582 7,696<br />
General and administrative ............... 29,799 30,918 27,923 24,254 20,888<br />
Loss (gain) on sale of assets .............. (236) 2,824 (297) (145,876) (42)<br />
Other ................................ 448 4,268 — — 109<br />
218,136 428,751 450,148 70,624 146,464<br />
Operating income (loss) ..................... (17,067) (280,418) (339,722) 145,427 (35,159)<br />
Other income (expense):<br />
Interest expense ....................... (49,351) (37,179) (26,148) (22,410) (17,878)<br />
Interest income and other ................ 59 117 458 1,682 11,469<br />
Gain (loss) on derivatives not designated as<br />
hedges ............................. 34,539 55,275 47,115 51,547 (6,439)<br />
Gain on early extinguishment of debt ...... 62 — — — —<br />
(14,691) 18,213 21,425 30,819 (12,848)<br />
Income (loss) before income taxes ............. (31,758) (262,205) (318,297) 176,246 (48,007)<br />
Income tax (expense) benefit ................. — 85 67,311 (54,472) 9,294<br />
Net income (loss) .......................... (31,758) (262,120) (250,986) 121,774 (38,713)<br />
Preferred stock dividends ................ 6,047 6,047 6,047 6,047 6,047<br />
Net income (loss) applicable to common stock . . . $ (37,805) $(268,167) $(257,033) $ 115,727 $ (44,760)<br />
PER COMMON SHARE<br />
Net income (loss) applicable to common<br />
stock—basic ........................ $ (1.05) $ (7.47) $ (7.17) $ 3.42 $ (1.75)<br />
Net income (loss) applicable to common<br />
stock—diluted ....................... $ (1.05) $ (7.47) $ (7.17) $ 3.23 $ (1.75)<br />
Weighted average common shares outstanding—<br />
basic .................................. 36,124 35,921 35,866 33,806 25,578<br />
Weighted average common shares outstanding—<br />
diluted ................................. 36,124 35,921 35,866 40,397 25,578<br />
Balance Sheet Data:<br />
Total assets ............................... $862,103 $ 664,577 $ 860,274 $1,038,287 $589,233<br />
Total long-term debt ........................ 566,126 179,171 330,147 226,723 185,449<br />
Stockholders’ equity ........................ 143,700 183,972 445,385 665,348 312,781<br />
34