Download - Station Biologique de Roscoff - Portail des applications
Download - Station Biologique de Roscoff - Portail des applications
Download - Station Biologique de Roscoff - Portail des applications

Create successful ePaper yourself
Turn your PDF publications into a flip-book with our unique Google optimized e-Paper software.
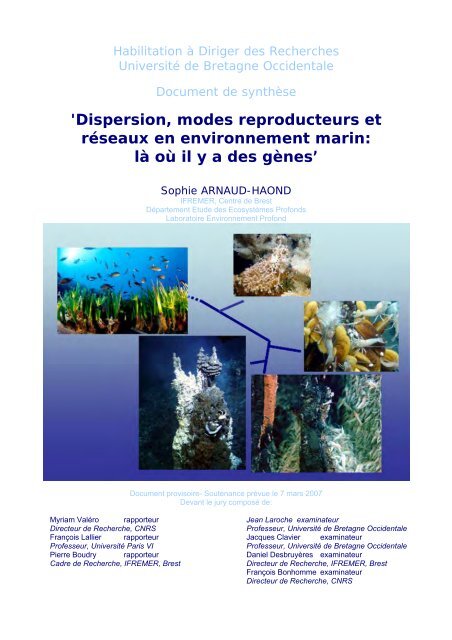
Habilitation à Diriger <strong>de</strong>s Recherches<br />
Université <strong>de</strong> Bretagne Occi<strong>de</strong>ntale<br />
Document <strong>de</strong> synthèse<br />
'Dispersion, mo<strong>de</strong>s reproducteurs et<br />
réseaux en environnement marin:<br />
là où il y a <strong>de</strong>s gènes’<br />
Sophie ARNAUD-HAOND<br />
IFREMER, Centre <strong>de</strong> Brest<br />
Département Etu<strong>de</strong> <strong>de</strong>s Ecosystèmes Profonds<br />
Laboratoire Environnement Profond<br />
Document provisoire- Soutenance prévue le 7 mars 2007<br />
Devant le jury composé <strong>de</strong>:<br />
Myriam Valéro rapporteur<br />
Directeur <strong>de</strong> Recherche, CNRS<br />
François Lallier rapporteur<br />
Professeur, Université Paris VI<br />
Pierre Boudry rapporteur<br />
Cadre <strong>de</strong> Recherche, IFREMER, Brest<br />
Jean Laroche examinateur<br />
Professeur, Université <strong>de</strong> Bretagne Occi<strong>de</strong>ntale<br />
Jacques Clavier examinateur<br />
Professeur, Université <strong>de</strong> Bretagne Occi<strong>de</strong>ntale<br />
Daniel Desbruyères examinateur<br />
Directeur <strong>de</strong> Recherche, IFREMER, Brest<br />
François Bonhomme examinateur<br />
Directeur <strong>de</strong> Recherche, CNRS
Caminante no hay camino…….<br />
Manu San Felix<br />
...se hace el camino a andar…<br />
- Antonio Machado –<br />
2
Sophie ARNAUD-HAOND - Candidature à une Habilitation à Diriger <strong>de</strong>s Recherches, Février 2008<br />
Sommaire<br />
SOMMAIRE<br />
Sommaire ...........................................................................................................................3<br />
Avant-Propos .....................................................................................................................4<br />
Curiculum Vitae .................................................................................................................8<br />
Résumé <strong>de</strong>s travaux <strong>de</strong> Recherche ...............................................................................22<br />
I. Le milieu marin : un milieu hétérogène et instable ..................................................23<br />
I.1 Migration-Dérive : hétérogénéité, barrières au flux génique et taille efficace....................... 23<br />
I.2 Sélection ....................................................................................................................................... 28<br />
I.3 Impact <strong>de</strong>s activités anthropiques ............................................................................................. 30<br />
II. Clonalite, ecologie et evolution ...............................................................................33<br />
II.1 Assessing genetic diversity in clonal organisms: Low diversity or low resolution?<br />
Combining power and cost efficiency in selecting markers. Journal of Heredity, 2005............... 34<br />
II.2 Within-population spatial genetic structure, neighbourhood size and clonal subrange in<br />
the seagrass Cymodocea nodosa. Molecular Ecology, 2005........................................................... 42<br />
II.3 Standardizing methods to <strong>de</strong>scribe population structure of clonal organisms. Molecular<br />
Ecology, Invited Review, 2007............................................................................................................. 55<br />
II.4 Feed-backs between genetic structure and perturbation-driven <strong>de</strong>cline in seagrass<br />
(Posidonia oceanica) meadows. Conservation Genetics, 2007....................................................... 82<br />
II.5 GenClone 1.0: a new program to analyse genetics data on clonal organisms. Molecular<br />
Ecology Notes, 2007. ............................................................................................................................ 98<br />
II.6 Conclusions et Perspectives................................................................................................ 102<br />
III. Les métapopulations considérées comme <strong>de</strong>s systèmes complexes : networks<br />
génétiques ....................................................................................................................103<br />
III.1 Spectrum of genetic diversity and networks of clonal populations. Journal of the Royal<br />
Society Interface, 2007. ...................................................................................................................... 108<br />
III.2 Population genetics networks: i<strong>de</strong>ntifying weak and strong links in a metapopulation<br />
system. Soumis................................................................................................................................... 119<br />
IV. Perspective : Biodiversité et évolution <strong>de</strong>s écosystèmes profonds .......................143<br />
IV.1 Du milieu terrestre au milieu profond : un abysse <strong>de</strong> recherche et d’efforts.................. 143<br />
IV.2 Quelques un <strong>de</strong>s écosystèmes profonds principaux ........................................................ 146<br />
IV.3 Axes <strong>de</strong> Recherche................................................................................................................ 149<br />
V. Références............................................................................................................155<br />
3
Sophie ARNAUD-HAOND - Candidature à une Habilitation à Diriger <strong>de</strong>s Recherches, Février 2008<br />
Avant-Propos<br />
AVANT-PROPOS<br />
La démarche scientifique est un terme qui évoque la rigueur, la planification à long<br />
terme, le respect d’un parcours millimétré pour atteindre les buts, tester les hypothèses,<br />
dévoiler les processus, faire la lumière sur les mystérieux mécanismes dont nous<br />
cherchons les clés, comme <strong>de</strong>s enfants <strong>de</strong>vant un fascinant jeu <strong>de</strong> mécano … Le parcours<br />
du chercheur, lui, est tout autre parce qu’il s’effectue dans « la vraie vie ». A la différence<br />
<strong>de</strong> la théorie, ou <strong>de</strong> la réalité in silico (n’en déplaise aux modèles <strong>de</strong> mes collègues<br />
physiciens) « la vraie vie » est hétérogène, chaotique, pleine d’imprévus, <strong>de</strong> rencontres,<br />
<strong>de</strong> trains ratés, d’inci<strong>de</strong>nts, <strong>de</strong> surprises. Un examen mieux ou moins bien réussi que<br />
prévu, une lettre <strong>de</strong> motivation écrite un jour <strong>de</strong> blues ou d’euphorie, un entretien<br />
pathétique ou empreint d’un miraculeux et incompréhensible éclair <strong>de</strong> génie…et bien que<br />
nous ayons tracé nos plans sur la comète pour faire ci, nous nous retrouvons à faire ça,<br />
ou encore ci^10 . Quelques portes qui semblent se fermer irrémédiablement pour en laisser<br />
d’autres, parfois inespérées, s‘ouvrir bientôt, parfois mieux… Il en est <strong>de</strong> même pour le<br />
parcours scientifique, pour les mêmes raisons et bien d’autres encore. Malgré nos<br />
analyses méticuleuses, nos théories à l’épreuve <strong>de</strong>s équations, nos plans expérimentaux<br />
irréprochables et nos échantillonnages hiérarchiques improbables, ce que nous avons<br />
trouvé <strong>de</strong> mieux est parfois (souvent ?) ce que nous n’avions pas pensé à chercher. Le<br />
défi quotidien est <strong>de</strong> gar<strong>de</strong>r notre regard d’enfant pour être capable <strong>de</strong> considérer un<br />
imprévu comme une curiosité plutôt qu’un obstacle ou un contretemps irritant. De se<br />
défaire <strong>de</strong> nos œillères <strong>de</strong> temps en temps pour changer <strong>de</strong> cap si un autre semble plus<br />
prometteur, malgré le rapport <strong>de</strong> projet qu’il faudra peut-être rendre dans 2 ans sur la base<br />
<strong>de</strong>s objectifs qu’on avait mis sur le papier l’année <strong>de</strong>rnière… par exemple. Ce n’est pas<br />
un mince défi…<br />
Ainsi va, souvent, le parcours du chercheur : souvent chaotique, parfois<br />
désespérant (exaspérant ?), toujours imprévisible, et <strong>de</strong> temps à autre exaltant. A l’heure<br />
<strong>de</strong> rédiger un mémoire <strong>de</strong> synthèse sur les recherches passées, et <strong>de</strong> se projeter dans le<br />
futur, j’ai tendance à chercher une ligne directrice qui me permettrai <strong>de</strong> tracer un chemin<br />
bien droit avec une ligne <strong>de</strong> fuite bien comme il faut, bref qui homogénéiserait tout cela<br />
pour le confort du lecteur. Et pour toutes ces raisons je m’aperçois que c’est plutôt une<br />
mosaïque <strong>de</strong> type habitat fragmenté, <strong>de</strong> pièces qui, certes, appartiennent pour la plupart<br />
au même puzzle (enfin, j’espère…), mais bien distantes parfois les unes <strong>de</strong>s autres. Parce<br />
que dans le miroir <strong>de</strong> la migration, le spectre <strong>de</strong> la sélection est apparu, qu’en cherchant<br />
dérive et conservation je me suis heurtée au système reproducteur, qu’en essayant <strong>de</strong> me<br />
débrouiller <strong>de</strong>s problèmes d’équilibre, je me suis pris les pieds dans les réseaux…je<br />
présente mes humbles excuses à ceux qui, par <strong>de</strong>voir ou par masochisme, lirons ce<br />
4
Sophie ARNAUD-HAOND - Candidature à une Habilitation à Diriger <strong>de</strong>s Recherches, Février 2008<br />
Avant-Propos<br />
document et auront donc peut-être du mal à y trouver un fil conducteur. J’ai envie <strong>de</strong> leur<br />
dire qu’ils se rassurent : il n’y en a pas. Disons alors que c’est un puzzle qui parle <strong>de</strong> vie,<br />
d’évolution, <strong>de</strong> spéciation et d’extinction, et que je me suis concentrée sur la partie<br />
immergée du tableau. Parmi les milliards <strong>de</strong> pièces probablement nécessaires à sa<br />
réalisation, on en retrouvera ici quelques unes (si peu) qui appartiennent à <strong>de</strong>s scènes<br />
illustrant (avec un suite chronologique un peu personnelle) la migration et ses limites, la<br />
dynamique <strong>de</strong> la distribution, la sélection, le sexe –et son absence-, la diversité ; et<br />
quelques efforts pour relier ce tableau à d’autres, principalement à l’un d’entre eux, qui<br />
parle <strong>de</strong> la matière et <strong>de</strong> son mouvement.<br />
J’ai choisi <strong>de</strong> ne pas donner le même poids à ces différents thèmes. Certains<br />
seront évoqués brièvement, principalement les plus anciens, tandis que d’autres, ceux<br />
probablement pour lesquels je me sens encore ‘dans le feu <strong>de</strong> l’action’ et donc plus<br />
enthousiaste, seront plus approfondis : l’étu<strong>de</strong> <strong>de</strong> la clonalité, l’approche <strong>de</strong>s<br />
métapopulations sous forme <strong>de</strong> réseaux. Ce sont ceux qui constituent les « steppingstones<br />
» qui me permettent d’amorcer en douceur ma migration récente <strong>de</strong>puis les côtes<br />
vers le milieu profond.<br />
J’ai commencé mon parcours à Montpellier, lorsque l’opportunité m’a été offerte en<br />
DEA <strong>de</strong> concilier ma passion pour la biologie marine et mon intérêt pour l’écologie avec<br />
ma plus récente curiosité pour la théorie <strong>de</strong> l’évolution ; intérêt éveillé par les cours<br />
inoubliables <strong>de</strong> Jean-Jacques Jaeger, Louis Thaler, Isabelle Olivieri et Patrice David.<br />
François Bonhomme a démarré dans son laboratoire la génétique <strong>de</strong>s populations <strong>de</strong>s<br />
organismes marins : c’est ce que je cherchais sans le savoir. Et c’était parti pour défier le<br />
paradigme <strong>de</strong> la panmixie en milieu dispersif, et rechercher <strong>de</strong>s barrières aux flux génique<br />
en milieu marin en travaillant sur les chinchards, poissons pélagiques exploités par les<br />
pêcheries Indonésiennes. Ce projet était réalisé en collaboration avec l’IRD a1 et<br />
s’inscrivait également dans le cadre <strong>de</strong> la gestion <strong>de</strong>s ressources. C’est durant ce stage<br />
que j’ai encadré pour la première fois un étudiant, il s’agissait <strong>de</strong> Céline Viray qui à l’issu<br />
<strong>de</strong> sa maîtrise, souhaitait faire un stage d’été. Je suis donc passée <strong>de</strong> la théorie à<br />
l’empirique au sujet <strong>de</strong> « …ce qui se conçoit bien s’énonce clairement… » 1 . J’ai découvert<br />
qu’en apprenant, on touche du doigt <strong>de</strong>s failles dont on ignorait l’existence dans notre<br />
compréhension <strong>de</strong>s concepts clés, et que souvent, tel est appris qui croyait apprendre. Je<br />
n’ai pas pu poursuivre cette aventure dans l’Indo Pacifique et le mystère <strong>de</strong> la<br />
concentration <strong>de</strong> biodiversité marine qu’on y trouve. Mais toujours au sein du même<br />
laboratoire avec François Bonhomme, et co-encadrée par Françoise Blanc (Université<br />
Montpellier III) et Mario Monteforte (CIBNOR <strong>de</strong> La Paz, Mexique), j’ai continué à étudier<br />
la structure génétique et les barrières au flux géniques en milieu marin. Il s’agissait <strong>de</strong><br />
définir, avec <strong>de</strong>s marqueurs moléculaires a2,3 les stocks génétiquement différenciés <strong>de</strong>s<br />
1 Boileau, l’Art Poétique, Chant I<br />
5
Sophie ARNAUD-HAOND - Candidature à une Habilitation à Diriger <strong>de</strong>s Recherches, Février 2008<br />
Avant-Propos<br />
nacres perlières du Mexique a2,6 , et <strong>de</strong> Polynésie a5 , aidée par Jérôme du Barry et Lionel<br />
Valera qui souhaitaient dans leurs cursus respectifs s’initier aux joies <strong>de</strong> la biologie<br />
moléculaire.<br />
Mon premier post-doctorat a été en quelque sorte la continuité <strong>de</strong> ma thèse. Il<br />
s’agissait d’approfondir et <strong>de</strong> réactualiser nos connaissances <strong>de</strong>s stocks <strong>de</strong> nacres<br />
perlière en Polynésie, entre l’IFREMER <strong>de</strong> la Trembla<strong>de</strong> et celui <strong>de</strong> Vairao, et <strong>de</strong> tenter<br />
d’évaluer l’impact <strong>de</strong>s pratiques culturales sur les ressources génétique et l’évolution<br />
« naturelle » <strong>de</strong>s populations a4,10, s27 . Les <strong>applications</strong> <strong>de</strong> la génétique <strong>de</strong>s populations à<br />
l’aquaculture et à la gestion <strong>de</strong>s stocks exploités sont passionnantes, en particulier grâce<br />
au travail d’équipe réalisé avec Emmanuel Goyard, qui m’a permis une incursion dans le<br />
mon<strong>de</strong> <strong>de</strong>s écloseries et <strong>de</strong> la valorisation <strong>de</strong>s ressources a9,a18 et Vincent Vonau qui m’a<br />
toujours rappelé que le bon sens peut (et doit !) primer sur la théorie. Toutefois, en<br />
l’absence <strong>de</strong> données démographiques et écologiques pour essayer d’élaguer un peu la<br />
forêt <strong>de</strong> scénarios explicatifs qui s’offraient à moi je me sentais fortement limitée dans<br />
l’interprétation <strong>de</strong>s données génétiques.<br />
J’ai donc rejoint un projet Européen portant sur phanérogames marines, entre le<br />
laboratoire d’Ester Serrão au CCMar (Faro, Portugal) où je <strong>de</strong>vais assumer la partie<br />
« génétique <strong>de</strong>s populations », et celui <strong>de</strong> Carlos Duarte à l’IMEDEA (Mallorque, Espagne)<br />
où je <strong>de</strong>vais assurer l’interface génétique / démographie, écologie. Durant ces cinq<br />
années certains objectifs initiaux ont du être drastiquement révisés, voire abandonnés<br />
(comment comprendre les interactions entre la démographie, phénomène éminemment<br />
contemporain, et la composition génétique <strong>de</strong>s populations d’une plante quand ses genets<br />
peuvent atteindre plusieurs millénaires…). Ces révisions ont été le fruit d’interactions<br />
scientifiques passionnantes avec <strong>de</strong>s scientifiques <strong>de</strong> culture différentes. J’étais venue<br />
étudier la biogéographie et la conservation <strong>de</strong>s prairies <strong>de</strong> phanérogames a15,17,s26 avec<br />
Filipe Alberto a7,14,24 et Elena Diaz-Almela a20 dans le cadre <strong>de</strong> leurs thèses respectives.<br />
Nous nous avons finalement passé au moins autant <strong>de</strong> temps à nous interroger sur<br />
l’influence <strong>de</strong> la clonalité sur nos analyses et conclusions que sur la dynamique et l’histoire<br />
<strong>de</strong>s populations a12,13,17,22 .<br />
Finalement, toutes ces questions ont fini par en rejoindre d’autres, sur<br />
l’interprétation <strong>de</strong>s données quand on étudie les espèces qui sont les plus fréquemment<br />
étudiées à l’ai<strong>de</strong> <strong>de</strong> marqueurs moléculaires. Il s’agit pour ne citer qu’elles <strong>de</strong>s espèces<br />
invasives, en déclin, ou même encore les espèces pathogènes, qui sont étudiées<br />
précisément pour <strong>de</strong>s raisons qui font que nous savons d’emblée que les hypothèses<br />
sous-jacentes aux modèles classiques <strong>de</strong> génétique <strong>de</strong>s populations ne sont pas<br />
respectées (équilibre migration-dérive, égalité <strong>de</strong>s tailles <strong>de</strong> populations, <strong>de</strong> migration<br />
symétrique, etc…). Par ailleurs les avancées <strong>de</strong>s techniques moléculaires nous<br />
permettent <strong>de</strong> réunir <strong>de</strong>s jeux <strong>de</strong> données <strong>de</strong> plus en plus fourni, qu’il est souvent frustrant<br />
<strong>de</strong> réduire à <strong>de</strong>s « statistiques résumées » telles que les indices F ou H. Au détour d’une<br />
6
Sophie ARNAUD-HAOND - Candidature à une Habilitation à Diriger <strong>de</strong>s Recherches, Février 2008<br />
Avant-Propos<br />
rencontre avec <strong>de</strong>s physiciens passionnés <strong>de</strong> réseaux et <strong>de</strong> systèmes complexes a germé<br />
l’idée d’essayer <strong>de</strong> prendre le problème par l’autre bout. C'est-à-dire d’oublier<br />
temporairement ce que nous savions ou croyions savoir, théoriquement, <strong>de</strong> la dynamique<br />
<strong>de</strong> la transmission <strong>de</strong>s gènes dans l’espace et dans le temps, pour analyser en aveugle<br />
nos données moléculaires en considérant, tout simplement, nos groupes d’individus ou<br />
nos systèmes <strong>de</strong> métapopulations et leurs génotypes comme <strong>de</strong>s systèmes complexes. A<br />
ce titre nous avons donc tenté <strong>de</strong> leur appliquer une <strong>de</strong>s métho<strong>de</strong>s d’étu<strong>de</strong> adaptées : la<br />
théorie <strong>de</strong>s réseaux. Ce travail a été pour moi, et est encore (j’espère qu’il le restera<br />
longtemps), l’un <strong>de</strong>s plus passionnants auquel il m’ait été donné <strong>de</strong> participer.<br />
L’universalité <strong>de</strong>s systèmes complexes rends la théorie <strong>de</strong>s réseaux fascinante, et le fait<br />
<strong>de</strong> se retrouver en groupe mélangé <strong>de</strong> physiciens et <strong>de</strong>s biologistes qui doivent d’abord<br />
s’entraîner à parler le même langage (un pré-requis qui s’est avéré ne pas être trivial !),<br />
puis essayer <strong>de</strong> se faire passer les uns aux autres les clés qui donnent accès aux bases<br />
<strong>de</strong> nos disciplines respectives a été une expérience extraordinairement drôle, humaine, et<br />
enrichissante. Cet amusement collectif <strong>de</strong> chaque instant, malgré les points <strong>de</strong> blocages<br />
et les tensions parfois, ne nous a pas déçus. Les premiers résultats scientifiques, pas<br />
seulement les publications qui commencent à émerger après bientôt trois ans d’efforts<br />
mais ce que nous apprenons les uns <strong>de</strong>s autres et les perspectives que nous pensons voir<br />
dans ces résultats nous encouragent à poursuivre dans cette voie a21,s25 . A l’heure ou un<br />
projet national (NETWORK) qui nous a permis <strong>de</strong> démarrer se termine, nous commençons<br />
un projet Européen (EDEN) : l’aventure ne fait, nous l’espérons, que commencer.<br />
Mais je parlais <strong>de</strong> migration, en profon<strong>de</strong>ur. Les <strong>de</strong>rniers axes que je viens<br />
d’évoquer et qui sont suffisamment méthodologiques et/ou théorique pour offrir une<br />
certaine plasticité, ils m’ont donc permis d’intégrer l’Ifremer au Département d’Etu<strong>de</strong>s <strong>de</strong>s<br />
Ecosystème Profonds <strong>de</strong> Brest pour continuer à les développer et les mettre en<br />
application sur <strong>de</strong>s invertébrés, et éventuellement sur leurs symbiontes. La secon<strong>de</strong> partie<br />
<strong>de</strong> ce manuscrit sera dédiée aux perspectives <strong>de</strong> Recherches et aux quelques projets déjà<br />
ébauchés avec pour thème/modèles spécifiques les populations et assemblages<br />
d’espèces d’environnement profond.<br />
7
Sophie ARNAUD-HAOND - Candidature à une Habilitation à Diriger <strong>de</strong>s Recherches, Février 2008<br />
1. Curriculum vitae<br />
CURICULUM VITAE<br />
Date <strong>de</strong> naissance: 25 Mai 1973<br />
Nationalité : Française<br />
Statut familial : mariée, <strong>de</strong>ux enfants<br />
Adresse : 20 rue <strong>de</strong>s Camélias. 292170 Plougonvelin;<br />
Téléphone : +33 (0)6 50 00 87 14<br />
Email:<br />
sarnaud@ifremer.fr; sarnaud@ualg.pt<br />
FORMATION UNIVERSITAIRE ET PARCOURS PROFESSIONNEL<br />
2007- Cadre <strong>de</strong> Recherche, « Ecologie évolutive <strong>de</strong>s écosystèmes<br />
chimiosynthétiques : dynamique du flux génique et <strong>de</strong> la sélection<br />
dans <strong>de</strong>s habitats extrêmes et chroniquement instables »<br />
Au Centre Ifremer <strong>de</strong> Brest, Département Etu<strong>de</strong> <strong>de</strong>s Ecosystèmes<br />
Profonds, Laboratoire Environnement Profond dirigé par Daniel<br />
DESBRUYERES.<br />
2005-2007 Contrat post-doctoral: « Diversité génétique neutre et<br />
sélectionnée, et stabilité démographique » et « Propriétés<br />
émergentes <strong>de</strong>s networks, et analyses <strong>de</strong> données génétiques »<br />
Au Centre <strong>de</strong>s Sciences Marines (Université <strong>de</strong> Faro, Portugal),<br />
superviseurs scientifiques : Ester A. SERRÃO (CCMar, Faro,<br />
Portugal) et Carlos M. DUARTE (Instituto Mediterraneo <strong>de</strong><br />
Estudios Avanzados, Baléares, Espagne).<br />
2002-2005 Contrat post-doctoral: « Démographie et stratégies <strong>de</strong><br />
reproduction, dispersion et biogéographie d’une phanérogame<br />
marine clonale, Posidonia oceanica. » et « Impact <strong>de</strong>s activités<br />
anthropiques et <strong>de</strong> la fragmentation <strong>de</strong> l'habitat sur la variabilité<br />
génétique <strong>de</strong>s populations <strong>de</strong> mangroves du genre Avicennia sp.<br />
en Asie »<br />
Au Centre <strong>de</strong>s Sciences Marines (Université <strong>de</strong> Faro, Portugal),<br />
superviseurs scientifiques : Ester A. SERRÃO (CCMar, Faro,<br />
Portugal) et Carlos M. DUARTE (Instituto Mediterraneo <strong>de</strong><br />
Estudios Avanzados, Baléares, Espagne).<br />
2000-2002 Contrat post-doctoral : « Structure génétique spatio-temporelle<br />
<strong>de</strong> populations sauvages et d’élevages <strong>de</strong> la nacre perlière <strong>de</strong><br />
Polynésie, Pinctada margaritifera». Evaluation <strong>de</strong>s ressources<br />
génétiques sauvages et <strong>de</strong> l’impact <strong>de</strong>s pratiques culturales sur<br />
les populations naturelles.<br />
Au Laboratoire d'Aquaculture Tropicale (Ifremer Tahiti), en<br />
collaboration avec Emmanuel GOYARD (Ifremer-Cop, Tahiti) et<br />
Pierre BOUDRY (Ifremer La Trembla<strong>de</strong>).<br />
8
Sophie ARNAUD-HAOND - Candidature à une Habilitation à Diriger <strong>de</strong>s Recherches, Février 2008<br />
1. Curriculum vitae<br />
1997-2000 Thèse <strong>de</strong> doctorat <strong>de</strong> l’Université Montpellier II (Mention très<br />
honorable) : « Flux génique et phylogéographie comparés <strong>de</strong><br />
<strong>de</strong>ux espèces <strong>de</strong> bivalves du Pacifique Pinctada mazatlanica et<br />
Pinctada margaritifera, marqueurs mitochondriaux et nucléaires ».<br />
Thèse réalisée au CIBNOR <strong>de</strong> La Paz (Mexique) et au Laboratoire<br />
"Génome, Populations, Interactions" (Université Montpellier II),<br />
sous la direction <strong>de</strong> : François BONHOMME et Françoise BLANC.<br />
1995-1996 DEA « Biologie <strong>de</strong> l’Evolution et Ecologie » <strong>de</strong> l’Université<br />
Montpellier II, spécialisation en génétique <strong>de</strong>s populations et<br />
génétique évolutive (Mention AB).<br />
Stage :<br />
"Le chinchard Decapterus macrosoma, poisson pélagique<br />
d’importance halieutique en mer <strong>de</strong> Java, un exemple d’espèce<br />
marine génétiquement structurée".<br />
Stage effectué au laboratoire "Génome et Populations" sous la<br />
direction <strong>de</strong> François BONHOMME.<br />
1994-1995 Maîtrise <strong>de</strong> Biologie <strong>de</strong>s Organismes et <strong>de</strong>s Populations <strong>de</strong><br />
l’Université Montpellier II, spécialisation écologie et évolution<br />
(Mention B).<br />
EXPERIENCE PROFESSIONNELLE<br />
Participation à la réalisation ou à la gestion <strong>de</strong> projets <strong>de</strong> recherche (travail<br />
réalisé dans le cadre <strong>de</strong> la gestion du projet, montant obtenu pour les projets<br />
dont l’obtention <strong>de</strong> financement et la coordination sont ou ont été à ma charge) :<br />
Post-doctorat Ifremer (2000-2002)<br />
1) Acquisition et utilisation <strong>de</strong> marqueurs moléculaires comme outils <strong>de</strong><br />
caractérisation génétique <strong>de</strong> la nacre perlière, Pinctada margaritifera : Ai<strong>de</strong><br />
à la conservation <strong>de</strong>s ressources génétiques et à l’amélioration <strong>de</strong>s<br />
cheptels. FIDES, 2000-2001. (Réalisation du travail, rédaction du rapport<br />
final et <strong>de</strong> publications).<br />
2) Ressources génétiques <strong>de</strong> l'huître perlière <strong>de</strong> Polynésie française,<br />
Pinctada margaritifera : recherche <strong>de</strong> populations locales originales et ai<strong>de</strong><br />
à la définition d'une stratégie <strong>de</strong> conservation. Contrat <strong>de</strong><br />
Développement État-Territoire <strong>de</strong> Polynésie Française, 2000-2002<br />
(Réalisation du travail, rédaction du rapport final et <strong>de</strong> publications)<br />
9
Sophie ARNAUD-HAOND - Candidature à une Habilitation à Diriger <strong>de</strong>s Recherches, Février 2008<br />
1. Curriculum vitae<br />
3) Gestion <strong>de</strong>s ressources génétiques <strong>de</strong> l’huître perlière Pinctada<br />
margaritifera <strong>de</strong> Polynésie française : Caractérisation génétique <strong>de</strong>s<br />
populations et optimisation du recrutement pour l'exploitation perlière.<br />
BRG (Bureau <strong>de</strong>s Ressources Génétiques), 2002 (26 Keuros ; réalisation<br />
du travail et rédaction du rapport final).<br />
Post-doctorat CCMar (I : 2002-2005)<br />
4) PREDICT. Prediction of the resilience and recovery of disturbed coastal<br />
communities in the tropics. Projet INCO-DC: International Cooperation with<br />
<strong>de</strong>veloping countries, 1998-2002 (Finalisation <strong>de</strong> travaux et rédaction<br />
d’articles)<br />
5) Monitoring and Management of seagrasses. Projet Européen 5 ème<br />
PCRD, 2001-2004 (réalisation <strong>de</strong> la partie du travail concernant la diversité<br />
génétique, <strong>de</strong>s herbiers <strong>de</strong> Posidonie, rédaction <strong>de</strong> rapports et <strong>de</strong><br />
publications, participation à la rédaction d’un chapitre <strong>de</strong> livre à <strong>de</strong>stination<br />
<strong>de</strong>s gestionnaires <strong>de</strong> réserves).<br />
Projets en cours<br />
6) Networks Génétiques et Evolution : <strong>de</strong>s individus aux populations.<br />
Fondation <strong>de</strong>s Sciences et Technologies, 2005-2007 (45 Keuros;<br />
coordination du projet).<br />
7) Gènes neutres et non neutres : Diversité et stabilité <strong>de</strong>s populations.<br />
Fondation <strong>de</strong>s Sciences et Technologies, 2006-2009 (86 Keuros;<br />
coordination du projet).<br />
8) Conservation <strong>de</strong>s prairies marines: Causes et effets <strong>de</strong> la régression sur<br />
le fonctionnement <strong>de</strong>s écosystèmes. Fondation FBBVA., 2006-2010<br />
(coordination d’un workpackage).<br />
9) Divergence adaptative <strong>de</strong>s populations, et structure comparée <strong>de</strong>s<br />
populations d’algues brunes du genre Fucus. Fondation <strong>de</strong>s Sciences et<br />
Technologies, 2006-2009 (chercheur associé).<br />
0<br />
10
Sophie ARNAUD-HAOND - Candidature à une Habilitation à Diriger <strong>de</strong>s Recherches, Février 2008<br />
1. Curriculum vitae<br />
10) Diversité génétique et différentiation chez les phanérogames Zostera<br />
noltii et Cymodocea nodosa à la jonction Atlantique - Méditerranée.<br />
Fondation <strong>de</strong>s Sciences et Technologies, 2006-2008 (chercheur associé).<br />
11) Écologie et évolution du système reproducteur chez une algue fucoi<strong>de</strong>.<br />
Fondation <strong>de</strong>s Sciences et Technologies, 2006-2008 (chercheur associé).<br />
12) EDEN : Ecological Diversity and Evolutionary Networks . Projet<br />
Européen. 6 ème PCRD, 2006-2010 (coordination d’un workpackage).<br />
13) DeepOases : Biodiversité <strong>de</strong>s écosystème chimiosynthétiques dans<br />
l’environnement profond. Projet <strong>de</strong> l’Agence Nationale pour la Recherche,<br />
2007-2010 (chercheur associé).<br />
14) CORALFISH : Assessment of the interaction between corals, fish and<br />
fisheries, in or<strong>de</strong>r to <strong>de</strong>velop monitoring and predictive mo<strong>de</strong>lling tools for<br />
ecosystem based management in the <strong>de</strong>ep waters of Europe and beyond.<br />
Projet Européen 7ème PCRD, 2008-2012 (coordination d’un<br />
workpackage).<br />
Participation aux networks d’excellence Européens Marine Biodiversity and<br />
Ecosystem Functioning (implication dans les Actions concertées « Diversité<br />
Génétique » du Thème 1 et « Stabilité <strong>de</strong>s écosystèmes » du Thème 2) dans<br />
les et Marine Genomics. (participation au nœud « algue- génomique<br />
environnementale »).<br />
11
Sophie ARNAUD-HAOND - Candidature à une Habilitation à Diriger <strong>de</strong>s Recherches, Février 2008<br />
1. Curriculum vitae<br />
ENCADREMENT, ENSEIGNEMENT ET TRAVAIL D’EQUIPE<br />
Expérience d’encadrement<br />
Supervision <strong>de</strong> post-doctorants<br />
Yann Moalic (2007-) ‘Network of gene flow’. Post-doctorat supervisé avec<br />
Carlos M. Duarte.<br />
Co-encadrement <strong>de</strong> thèses.<br />
Filipe Alberto (2001-2005) : thèse soutenue en septembre 2005 ‘Sex and<br />
dispersal in the sea’ (articles a12-a14, a17, a22, a23). Thèse co-encadrée<br />
avec Ester Serrão et Carlos M. Duarte. Statut actuel : chercheur associé au<br />
CCMar, Faro, Portugal.<br />
Sara Mira (2001-2006): thèse soutenue en novembre 2006 ‘Population<br />
genetics of an endangered species : the Bonelli’s eagle’ (Hieraaetus<br />
fasciatus)’. Thèse encadrée par Leonor Cancela. Statut actuel : postdoctorante<br />
au CCMar Faro, Portugal.<br />
Elena Diaz-Almela (2002- soutenance <strong>de</strong> thèse prévue en 2008) : (articles<br />
a19, a20, s26). Thèse encadrée par Carlos M. Duarte et Nuria Marba.<br />
Sonia Massa (2006-) : Genetic diversity of basal species and the stability of<br />
population and ecosystems. Thèse co-encadrée avec Gareth Pearson.<br />
Tania Aires (2006-) : Biotic interactions and the success of invasive<br />
species: the case of the bacterial flora of Caulerpa taxifolia. Thèse coencadrée<br />
avec Ester Serrão et Carlos M. Duarte.<br />
Encadrement d'étudiants en stages <strong>de</strong> Master II ou équivalent (Stage ‘prédoctoraux’)<br />
Sara Teixeira (2002-2003, 18 mois): Finalisation du stage <strong>de</strong> Master II:<br />
‘Study of the population genetics of South-Eastern Asian mangroves’, et<br />
initiation à la génétique <strong>de</strong>s populations (articles a13, a15, a19, s24). Statut<br />
actuel : thèse 2003-2007 dans le département d’écologie et évolution <strong>de</strong><br />
l’Université <strong>de</strong> Lausanne, en contrat au CCMar (Université d’Algarve).<br />
12
Sophie ARNAUD-HAOND - Candidature à une Habilitation à Diriger <strong>de</strong>s Recherches, Février 2008<br />
1. Curriculum vitae<br />
Sonia Massa (2005, 6 mois) : Stage <strong>de</strong> fin d’étu<strong>de</strong>, initiation à la génétique<br />
<strong>de</strong>s populations appliquée à la conservation (articles a19, a23, s24). Statut<br />
actuel : doctorante.<br />
Tania Aires (2005-2006, 18 mois) : Stage <strong>de</strong> fin d’étu<strong>de</strong>, initiation à la<br />
génétique <strong>de</strong>s populations et à la génomique. Statut actuel : doctorante.<br />
Encadrement d’étudiants <strong>de</strong> Master I ou équivalent (4).<br />
Mélanie Veyret (2001, 2 mois) stage <strong>de</strong> fin <strong>de</strong> Master I, Option Génétique<br />
<strong>de</strong>s Populations. Mémoire : "Migration et différentiation génétique entre les<br />
stocks <strong>de</strong> nacre perlière <strong>de</strong> Polynésie", (article a4). Statut actuel :<br />
institutrice.<br />
Jérôme De Barry (1999, 3 mois) stage <strong>de</strong> Maîtrise De Biochimie, Option<br />
Génétique (Université <strong>de</strong> Montpellier II), 3 mois. Mémoire : ‘Utilisation <strong>de</strong><br />
marqueurs moléculaires pour l’étu<strong>de</strong> <strong>de</strong> la dynamique <strong>de</strong>s populations <strong>de</strong><br />
<strong>de</strong>ux espèces <strong>de</strong> nacres perlières’. ?.<br />
Lionel Valera (1999, 2 mois) stage <strong>de</strong> fin <strong>de</strong> première année d’école<br />
d’ingénieur (INSA, Lyon), 2 mois. Mémoire ‘Étu<strong>de</strong> phylogénétique <strong>de</strong> <strong>de</strong>ux<br />
espèces <strong>de</strong> nacres perlières à partir <strong>de</strong> séquences d’haplotypes<br />
mitochondriaux‘. Statut actuel : Cadre chez ‘BioRad’.<br />
Céline Viray (1997, 2 mois) Céline Viray (1996, 2 mois). Licence <strong>de</strong><br />
Biologie <strong>de</strong>s Organismes. Mémoire " Utilisation <strong>de</strong>s techniques <strong>de</strong> biologie<br />
moléculaire pour résoudre <strong>de</strong>s Problématiques Ecologiques: Etu<strong>de</strong> <strong>de</strong><br />
structure <strong>de</strong> populations." ?.<br />
Responsable <strong>de</strong> techniciens :<br />
Vincent Vonau, Ifremer 18 mois (articles a4, a9, a10, a18, s27).<br />
Catherine Rouxel, Ifremer, 6 mois (article s27).<br />
Vincent Bishoff, VAT Ifremer, 10 mois (article a9).<br />
Carla Monteiro, CCmar 4 mois.<br />
Vacations d’enseignement<br />
Les Organismes Clonaux : un défi en termes <strong>de</strong> théorie et d’analyse <strong>de</strong><br />
13
Sophie ARNAUD-HAOND - Candidature à une Habilitation à Diriger <strong>de</strong>s Recherches, Février 2008<br />
1. Curriculum vitae<br />
données en écologie et en évolution. Cours <strong>de</strong> DEA ‘Biologie <strong>de</strong><br />
l’Evolution et Ecologie’, Module ‘Génétique <strong>de</strong>s Populations Marines’.<br />
Université Montpellier II<br />
Ecosystèmes côtiers en Méditerranée : états <strong>de</strong>s lieux et enjeux. Cours<br />
<strong>de</strong> Master <strong>de</strong> Biologie Marine, Université <strong>de</strong> Faro, Portugal.<br />
Bases théoriques et travaux pratiques d’écologie moléculaire<br />
appliquée à la gestion <strong>de</strong>s ressources exploitées (Ecole thématique<br />
“ Concepts and methods for studying marine biodiversity, from gene to<br />
ecosystem “ à l’Observatoire océanologique <strong>de</strong> Banyuls-sur-mer, réalisée<br />
dans le cadre du Programme Européen TMR -Training Mobility and<br />
Research- en Mars 1998).<br />
Animation scientifique<br />
Organisation <strong>de</strong>s séminaires internes du laboratoire Ecologie et Evolution<br />
<strong>de</strong>s Organismes Marins (MAREE) pendant 3 ans à l’Université d’Algarve.<br />
Organisation d’un workshop dans le cadre du réseau Européen d’Excellence<br />
Marbef (Responsive Mo<strong>de</strong> Program GBIRM : Genetic Biodiversity) : 2-5 Mai<br />
2006 à Tavira (Portugal).<br />
Participation à <strong>de</strong>s jurys <strong>de</strong> thèse :<br />
Filipe Alberto (septembre 2005) ‘Sex and dispersal in the Sea’<br />
Sara Mira (novembre 2006) ‘Population genetics of an endangered<br />
species : the Bonelli’s eagle’ (Hieraaetus fasciatus)’.<br />
AUTRES<br />
-Outils informatiques : programmation (Delphi, R, Mathematica).<br />
-Langues : Français, Anglais, Espagnol, Portugais.<br />
-Permis côtier, Plongée -CMAS 3-<br />
14
Sophie ARNAUD-HAOND - Candidature à une Habilitation à Diriger <strong>de</strong>s Recherches, Février 2008<br />
2. Liste <strong>de</strong> publications et communications<br />
LISTE DE PUBLICATIONS<br />
Revues scientifiques internationales à comité <strong>de</strong> lecture:<br />
a23. Alberto, F., Massa, S.I., Diaz-Almela, E., Arnaud-Haond, S., Duarte, C.M., Serrão,<br />
E.A.,Genetic differentiation in the seagrass Cymodocea nodosa across the<br />
Mediterranean-Atlantic transition region. Journal of Biogeography, sous-presse.<br />
a22. Arnaud-Haond, S., Duarte, C.M., Alberto, F., Serrão, E.A. (2007). Standardizing<br />
methods to <strong>de</strong>scribe population structure of clonal organisms. Molecular Ecology<br />
16: 5115-5139 .<br />
a21. Rozenfeld AF, Arnaud-Haond S, Hernán<strong>de</strong>z-García E, Eguíluz VM, Matías MA,<br />
Serrão EA and CM Duarte (2007) Spectrum of genetic diversity and networks of<br />
clonal populations Journal of the Royal Society Interface 4: 1093-1102.<br />
a20. Diaz-Almela E, Arnaud-Haond S, van <strong>de</strong> Vliet MS, Alvarez E, Marba N, Duarte CM<br />
and EA Serrão (2007) Feed-backs between genetic structure and perturbationdriven<br />
<strong>de</strong>cline in seagrass (Posidonia oceanica) meadows Conservation Genetics<br />
8: 1377-1391.<br />
a19. Arnaud-Haond, S., Miggliaccio M., Diaz-Almela, E., Teixeira, S., Alberto, F.,<br />
Procaccini, G., Duarte, C.M. and E.A. Serrão (2007). Vicariance patterns in the<br />
Mediterranean Sea : East-West cleavage and low dispersal in the en<strong>de</strong>mic<br />
seagrass Posidonia oceanica. Journal of Biogeography 34: 963-976.<br />
a18. Arnaud-Haond S., Goyard E., Vonau V., Herbaut C., Prou J. and D. Saulnier (2007)<br />
Pearl formation: Persistence of the graft during the entire process of biomineralization.<br />
Marine Biotechnology 9: 113-116.<br />
a17. Arnaud-Haond S, Belkhir K (2007) GenClone 1.0: a new program to analyse genetics<br />
data on clonal organisms. Molecular Ecology Notes 7, 15-17.<br />
a16. Hernan<strong>de</strong>z-Garcia E, Rozenfeld AF, Eguiluz VM, Arnaud-Haond S and CM Duarte<br />
(2006) Clone size distributions in networks of genetic similarity. Physica D 224: 166-<br />
173<br />
a15. Arnaud-Haond, S., Teixeira, S., Massa, S.I., Billot, C.P., Saenger, P., Coupland, G.,<br />
Duarte, C.M. and E.A. Serrão (2006) Genetic structure at range-edge: low diversity and<br />
high inbreeding in SE Asia mangrove (Avicennia marina) populations. Molecular Ecology,<br />
15: 3515-3525<br />
15
Sophie ARNAUD-HAOND - Candidature à une Habilitation à Diriger <strong>de</strong>s Recherches, Février 2008<br />
2. Liste <strong>de</strong> publications et communications<br />
a14. Alberto, F., Arnaud-Haond, S., Duarte, C.M. and E. A. Serrão (2006) Genetic diversity of<br />
a clonal angiosperm near its range limit: the case of Cymodocea nodosa in the Canary<br />
Islands. Marine Ecology Progress Series, 309: 117-129.<br />
a13. Alberto, F., L. Gouveia, S. Arnaud-Haond, J. L. Pérens-Lloréns, C. M. Duarte, and E. A.<br />
Serrão (2005) Spatial genetic structure, neighbourhood size and clonal subrange in<br />
seagrass (Cymodocea nodosa) populations. Molecular Ecology, 14: 2669-2681.<br />
a12. Arnaud-Haond, S., Alberto, F., Teixeira, S., Procaccini, G., Serrão, E.A., and C.M.<br />
Duarte (2005) Assessing molecular markers of genetic diversity in clonal organisms:<br />
combining power and cost-efficiency in selecting markers. Journal of Heredity, 96: 434-<br />
440.<br />
a11. Arnaud-Haond, S., F. Blanc, F. Bonhomme, and M. Monteforte (2005) Recent<br />
foundation of Mexican populations of pearl oysters (Pteria sterna) revealed by lack of<br />
genetic variation on two mitochondrial genes. Journal of the Marine Biological Association<br />
of the United Kingdom, 85:363-366.<br />
a10. Arnaud-Haond, S., Vonau, V., Bonhomme, F., Blanc, F., Boudry, P. , Prou, J.,<br />
Seaman, T., and E. Goyard (2004) On the impact of cultural practices on genetic<br />
resources: evolution of the genetic composition of wild stocks of pearl oyster (Pinctada<br />
margaritifera cumingii) in French Polynesia after ten years of spat translocation.<br />
Molecular Ecology 13: 2001-2007.<br />
a9. Goyard E., Arnaud-Haond, S., Vonau, V., Bishoff, V., Mouchel O., Guogenheim J.,<br />
Pham D., and Aquacop. (2003) Residual genetic variability in domesticated populations<br />
of the Pacific blue shrimp (Litopenaeus stylirostris) of New Caledonia, French Polynesia<br />
and Hawaii and some management recommendations. Aquatic Living Ressources. 16:<br />
501-508.<br />
a8. Teixeira, S., Arnaud-Haond, S., Duarte, C.M., and E. A. Serrão (2003) Polymorphic<br />
microsatellite DNA markers in the mangrove tree Avicennia alba. Molecular Ecology<br />
Notes, 3: 544-546.<br />
a7. Alberto, F., Correia, L., Arnaud-Haond, S., Billot, C., Duarte, C.M., and E. A. Serrão<br />
(2003) New microsatellite markers for the en<strong>de</strong>mic Mediterranean seagrass Posidonia<br />
oceanica. Molecular Ecology Notes, 3: 353-355.<br />
a6. Arnaud-Haond, S., Monteforte, M., Blanc, F., and F. Bonhomme (2003) Evi<strong>de</strong>nce for<br />
male-biased effective sex ratio and recent colonisation in the bivalve Pinctada<br />
mazatlanica. Journal of Evolutionary Biology,16: 790-796.<br />
16
Sophie ARNAUD-HAOND - Candidature à une Habilitation à Diriger <strong>de</strong>s Recherches, Février 2008<br />
2. Liste <strong>de</strong> publications et communications<br />
a5. Arnaud-Haond, S., Bonhomme, F., and F. Blanc (2003) Large discrepancies in<br />
differentiation of allozymes, nuclear and mitochondrial DNA loci in recently foun<strong>de</strong>d<br />
Pacific populations of the pearl oyster Pinctada margaritifera. Journal of Evolutionary<br />
Biology,16:388-398.<br />
a4. Arnaud-Haond, S., Vonau, V., Bonhomme, F., Boudry, P., Prou, J., Seaman, T.,<br />
Veyret, M., and E. Goyard (2003) Spat collection of the pearl oyster (Pinctada<br />
margaritifera cumingii) in French Polynesia: an evaluation of the potential impact on<br />
genetic variability of wild and farmed populations after 20 years of commercial<br />
exploitation. Aquaculture, 219 : 181-192.<br />
a3. Arnaud-Haond, S., Boudry, P. , Saulnier, D. , Seaman, T., Vonau, V., Bonhomme, F.,<br />
E. Goyard (2002) New anonymous nuclear DNA markers for the pearl oyster Pinctada<br />
margaritifera and other Pinctada species. Molecular Ecology Notes, 2:220-222.<br />
a2. Arnaud, S., Galtier, N., Monteforte, M., Blanc, F., and F. Bonhomme (2000) Genetic<br />
structure and variability of protected populations of pearl oysters (Pinctada<br />
mazatlanica) from American Pacific coasts. Conservation Genetics, 1: 299-308.<br />
a1. Arnaud, S., Bonhomme, F., and P. Borsa (1999) Mitochondrial DNA analysis of the<br />
genetic relationships among South-East Asian scad mackerel Decapterus macarellus,<br />
D. macrosoma and D. russelli populations. Marine Biology, 135: 699-707.<br />
Soumis<br />
s24. Arnaud-Haond, S., Teixeira, S., Massa, S.I., Terrados, J., Tri, N.H., Hong, P.N.,<br />
Duarte, C., Serrao, E.A., submitted. Mangrove Genetic Diversity Three Deca<strong>de</strong>s<br />
after Agent Orange.<br />
s25. Rozenfeld, A.F., Arnaud-Haond, S., Hernán<strong>de</strong>z-García, E., Eguíluz, V.M., Serrão,<br />
E.A., Duarte, C.M. Population genetics networks: i<strong>de</strong>ntifying weak and strong links<br />
in a metapopulation system.<br />
s26. Arnaud-Haond, S., Duarte, C.M., Diaz-Almela, E., Marbà, N., Serrao, E.A., Extant<br />
Pleistocene Clones Detected in a Threatened Seagrass<br />
s27. Arnaud-Haond, S., Vonau, V., Rouxel, C., Bonhomme, F., Prou, J., Goyard, E.,<br />
Boudry, P. Contrasted patterns of genetic structure at different spatial scales in the<br />
pearl oyster (Pinctada margaritifera cumingii) in French Polynesian lagoons.<br />
17
Sophie ARNAUD-HAOND - Candidature à une Habilitation à Diriger <strong>de</strong>s Recherches, Février 2008<br />
2. Liste <strong>de</strong> publications et communications<br />
Autres : vulgarisation, diffusion:<br />
Arnaud-Haond, S., E. Goyard, J. Prou, V. Vonau, F. Bonhomme, and P. Boudry. 2005.<br />
Gestion <strong>de</strong>s Ressources génétiques <strong>de</strong> l’huitre perlière Pinctada margaritifera <strong>de</strong><br />
Polynésie Française : caractérisation génétiques <strong>de</strong>s populations et optimisation du<br />
recrutement pour l’exploitation perlière. Les Actes du BRG (2005), 215-229.<br />
Arnaud-Haond, S., Goyard, E., Blanc, F., Saulnier, D., Prou, J., Vonau, V., Dao, T.,<br />
Seaman, T., Bonhomme, F. 2003 Gestion durable <strong>de</strong>s ressources <strong>de</strong> Polynésie :<br />
Premiers apports <strong>de</strong> la génétique à la perliculture polynésienne. Te Reko Parau (Revue<br />
Polynésienne <strong>de</strong>stinée aux Perliculteurs).<br />
Arnaud, S., Borsa, P., Bonhomme, F. 1999. Mitochondrial DNA Variation in the South-<br />
East Asian Scad Mackerel Decapterus cf. macrosoma. Proc. 5 th Indo-Pac. Fish Conf.<br />
Nouméa 1997. Séret B; & J. Y. Sire eds Paris: Soc. Fr. Ictyol., 1999: 407-411.<br />
Arnaud S., Bonhomme, F., 1998. Genetic structure and biogeography of South east Asian<br />
scad mackerels Decapterus macarellus, D. macrosoma and D. russelli. Oceanis, 24(4):<br />
1-7.<br />
Chapitre <strong>de</strong> livre :<br />
l1. Kennedy, H., Papadimitriou, S., Marba, N., Duarte, C.M., Serrão, E.A., Arnaud-Haond,<br />
S. 2004. How are seagrass processes, genetics and chemical composition monitored?<br />
in: European seagrasses: an introduction to ecology, monitoring and management.<br />
Eds: Jens Borum, Carlos M. Duarte and Dorte Krause-Jensen, pp54-62.<br />
18
Sophie ARNAUD-HAOND - Candidature à une Habilitation à Diriger <strong>de</strong>s Recherches, Février 2008<br />
2. Liste <strong>de</strong> publications et communications<br />
PARTICIPATION A DES CONGRES<br />
Communications orales réalisées:<br />
Rozenfeld AF, Arnaud-Haond S, Hernán<strong>de</strong>z-García E, Eguilúz, VM, Serrao E.A., Duarte<br />
C.M. Population genetics networks: gene flow, source and sinks in the metapopulation<br />
system of the seagrass Posidonia oceanica. ASLO aquatic science meeting, Santa Fe<br />
(New Mexico, USA), 4-9 February 2007.<br />
Rozenfeld A.F., Arnaud-Haond S., Hernán<strong>de</strong>z-García E., Eguilúz, V.M., Serrao E.A.,<br />
Duarte CM. Population genetics networks: i<strong>de</strong>ntifying weak and strong links in a<br />
metapopulation system. Marbef General Assembly, Lecce 8-12 May 2006.<br />
Arnaud-Haond, S., S. Teixeira, Massa SI, C. Billot, P. Saenger, C. M. Duarte, and E. A.<br />
Serrao. Genetic structure and mating system at range-edge: low diversity and high<br />
inbreeding in SE Asia mangrove (Avicennia marina) populations. First DIVERSITAS open<br />
science conference: integrating biodiversity science for human well being, Oaxaca,<br />
Mexico, 9-12 Novembre 2005.<br />
Arnaud-Haond, S., Vonau, V., Bonhomme, F., Boudry, P., Prou, J., Seaman, T., Goyard,<br />
E. Gestion <strong>de</strong>s ressources génétiques <strong>de</strong> l'huître perlière Pinctada margaritifera <strong>de</strong><br />
Polynésie française : caractérisation génétique <strong>de</strong>s populations et optimisation du<br />
recrutement pour l'exploitation perlière. 5 ème Colloque national du Bureau <strong>de</strong>s<br />
Ressources Génétiques, Lyon, France, 3-5 Novembre 2004.<br />
Arnaud-Haond, S., Vonau, V., Bonhomme, F., Boudry, P., Prou, J., Seaman, T., Goyard,<br />
E. On the impact of cultural practices on marine genetic resources: evolution of the<br />
genetic composition of wild stocks of pearl oyster (Pinctada margaritifera cumingii) in<br />
French Polynesia after ten years of spat translocation. Biodiversity of Coastal Marine<br />
Ecosystems, Renesee, Hollan<strong>de</strong>, 11-15 Mai 2003.<br />
Arnaud, S., Blanc, F., Bonhomme, F. Comparative analysis of Polynesian stocks of the<br />
pearl oyster Pinctada margaritifera using nuclear and mitochondrial DNA markers.<br />
International meeting of the World Aquaculture Society, Nice, Mai 2000.<br />
Arnaud, S., Bonhomme, F., Blanc, F. Phylogeography of two pearl oysters Pinctada<br />
margaritifera and Pinctada mazatlanica using mitochondrial markers. International<br />
meeting on Biology and Evolution of the Bivalvia, Cambridge Septembre 1999.<br />
19
Sophie ARNAUD-HAOND - Candidature à une Habilitation à Diriger <strong>de</strong>s Recherches, Février 2008<br />
2. Liste <strong>de</strong> publications et communications<br />
Arnaud, S., Bonhomme, F., Borsa, P. Mitochondrial DNA analysis of the genetic structure<br />
among population of South-East Asian scad mackerel D. macrosoma. Petit Pois<br />
Déridé, Université <strong>de</strong> Perpignan, Septembre1997.<br />
Communications orales réalisées par <strong>de</strong>s collaborateurs:<br />
Alberto, F., Massa, S.I., Manent, P., Diaz-Almela, E., Arnaud-Haond, S., Duarte, C.M. &<br />
Serrão, E.A. Genetic differentiation in the Seagrass Cymodocea nodosa across the<br />
Mediterranean-Atlantic transition region. Third International Biogeography Society<br />
Conference, Tenerife, January 9-13, 2007.<br />
Procaccini G., Arnaud-Haond, S., Migliaccio, M., Diaz-Almela, E., Teixeira, S., Alberto, F.,<br />
Duarte, C.M., Serrão, E. A.. Vicariance patterns in the Mediterranean Sea: East-West<br />
cleavage and low dispersal in the en<strong>de</strong>mic seagrass Posidonia oceanica.<br />
Mediterranean Seagrass Workshop, Malta May 29- June 3 2006.<br />
Posters:<br />
Hernán<strong>de</strong>z-García, E. Rozenfeld, A. F. Arnaud-Haond, S. Eguíluz, V.M., Serrão, E.A. and<br />
Duarte, C. M.. Genetic similarity networks: Weak and strong links in populations and in<br />
metapopulations. European Conference on Complex Systems (ECCS07). Dres<strong>de</strong>n,<br />
Germany, 30 September - 6 October 2007.<br />
Rozenfeld, A., Eguíluz, V., Hernán<strong>de</strong>z-García, E., Matías, M. A., Duarte, C.M., Arnaud-<br />
Haond, S. Network Approach to the Genetic Structure of Clonal Plants. IV Jorna<strong>de</strong>s <strong>de</strong><br />
la Xarxa Temàtica Nonlinear Dynamics of Spatio-Temporal Self organization.<br />
Barcelona, 1-3 febrero 2006.<br />
Rozenfeld, A, F., Eguíluz, V. M., Hernón<strong>de</strong>z-García, E., Matías M. A., Duarte, C.M.,<br />
Arnaud-Haond, S. Network approach to the genetic relationship between clonal plants.<br />
Dynamics Days 2005, Berlin, 25-28 Julio 2005.<br />
Arnaud-Haond, S., Diaz-Almela, E., Teixeira, S., Alberto, F., Procaccini, G., Duarte, C.,<br />
Serrão, E.A. Vicariance patterns in the Mediterranean Sea : East-West cleavage and<br />
low dispersal in the en<strong>de</strong>mic seagrass Posidonia oceanica. 8 th Evolutionary Biology<br />
Meeting at Marseilles, Marseilles, France, 22-14 Septembre 2004.<br />
20
Sophie ARNAUD-HAOND - Candidature à une Habilitation à Diriger <strong>de</strong>s Recherches, Février 2008<br />
2. Liste <strong>de</strong> publications et communications<br />
Arnaud-Haond, S., Alberto, F., Teixeira, S., Diaz-Almela, E., Procaccini, G., Duarte, C.,<br />
Serrão, E.A. Genetic variability and population stability in Posidonia oceanica (Delile)<br />
meadows. Biodiversity of Coastal Marine Ecosystems, Renesee, Hollan<strong>de</strong>, 11-15 Mai<br />
2003.<br />
Arnaud-Haond, S., Boudry, P., Blanc, F., Saulnier, D., Prou, J., Vonau, V., Seaman, T.,<br />
Bonhomme, F., Goyard, E.. Perliculture et gestion durable <strong>de</strong>s ressources génétiques<br />
<strong>de</strong> l'huître perlière, Pinctada margaritifera <strong>de</strong> Polynésie française : constat et<br />
recommandations. 4 ème Colloque national du Bureau <strong>de</strong>s Ressources Génétiques, La<br />
Châtre, France, 14-16 Octobre 2002.<br />
Goyard, E., Arnaud-Haond, S., Vonau, V., Pham, D., Boudry, P., Aquacop. Ressources<br />
génétiques <strong>de</strong> la population <strong>de</strong> crevettes Litopenaeus stylirostris domestiquée en<br />
Nouvelle-Calédonie: définition d'une stratégie <strong>de</strong> ré-introduction <strong>de</strong> la variabilité. 4 ème<br />
Colloque national du Bureau <strong>de</strong>s Ressources Génétiques, La Châtre, France, 14-16<br />
Octobre 2002.<br />
Arnaud, S., Goyard, E., Blanc, F., Saulnier, D., Prou, J., Vonau, V., Seaman, T.,<br />
Bonhomme, F. What has to be conserved in the genetic ressources of the Pearl Oyster<br />
Pinctada margaritifera of French Polynesia? Marine Conservation Biology Institute’s<br />
Second Symposium, San Francisco, Juin 2001.<br />
Arnaud, S., Bonhomme, F., Blanc, F. Pattern of genetic variation of two species of pearl<br />
oyster of genus Pinctada : on the impact of past and present ecological factors on<br />
restriction to gene flow. VIITH Congress of the European Society for Evolutionary<br />
Biology, Universitat Autonoma <strong>de</strong> Barcelona, Août 1999.<br />
21
Sophie ARNAUD-HAOND - Candidature à une Habilitation à Diriger <strong>de</strong>s Recherches, Février 2008<br />
3. Résumé <strong>de</strong>s travaux <strong>de</strong> Recherche<br />
RESUME DES TRAVAUX DE RECHERCHE ET PERSPECTIVES<br />
La génétique <strong>de</strong>s populations, apparue au début du vingtième siècle, visait à l’origine à<br />
concilier les lois <strong>de</strong> Men<strong>de</strong>l récemment découvertes avec la théorie <strong>de</strong> l'évolution<br />
proposée par Darwin quelques années plus tôt. Les développements ont dans un<br />
premier temps été uniquement théoriques (Fisher 1930, Wright 1931, Haldane 1932). Si<br />
ces théories ont pu être mise en pratique, <strong>de</strong> façon limitée, sur la base <strong>de</strong> caractères<br />
phénotypiques dont l’hérédité était supposée, elles ont pu être réellement confrontées<br />
aux données empiriques vers la fin <strong>de</strong>s années 50, lorsque les premiers systèmes<br />
allozymiques ont été isolés et étudiés par électrophorèse (Markert & Moller 1959).<br />
Depuis lors, l’utilisation <strong>de</strong>s marqueurs moléculaires dans <strong>de</strong>s étu<strong>de</strong>s empiriques <strong>de</strong><br />
génétique <strong>de</strong> populations n’a cessé <strong>de</strong> s’accroître, particulièrement avec le<br />
développement <strong>de</strong> marqueurs basés sur le principe <strong>de</strong> Polymérisation en Chaîne (PCR)<br />
qui a connu son essor au début <strong>de</strong>s années 1990 (Cavalli-Sforza 1965, Levin et al.<br />
1972, Jarne & Lagoda 1996, Morin et al. 2004). Il a permis <strong>de</strong>s avances considérables<br />
dans la compréhension <strong>de</strong>s forces évolutives agissant à <strong>de</strong>s échelles spatio-temporelles<br />
différentes sur les populations et les espèces (Avise 1989, Parker et al. 1998, Luikart et<br />
al. 2003).<br />
En écologie comme en biologie évolutive, l’interprétation <strong>de</strong>s données<br />
moléculaires sur la base <strong>de</strong>s modèles théoriques <strong>de</strong> génétique <strong>de</strong>s populations a permis<br />
l’étu<strong>de</strong> <strong>de</strong> phénomènes qui ne pouvaient être observés directement, à l’échelle<br />
humaine. Il s’agit bien entendu <strong>de</strong> révéler <strong>de</strong>s évènements passés ayant influencé<br />
l’évolution <strong>de</strong>s espèces ou <strong>de</strong>s populations (phylogénie, phylogéographie, évolution<br />
moléculaire), mais également <strong>de</strong>s phénomènes contemporains que les moyens<br />
techniques ne nous permettent pas, ou très difficilement, d’étudier <strong>de</strong> façon directe.<br />
Dans cette catégorie on peut citer l’étu<strong>de</strong> <strong>de</strong>s mouvements d’individus dans l’espace<br />
(migration), <strong>de</strong>s variations démographiques (dérive), <strong>de</strong>s variations environnementales<br />
ou <strong>de</strong>s comportements reproducteurs (processus sélectifs, mo<strong>de</strong>s <strong>de</strong> reproduction), ou<br />
encore <strong>de</strong> l’impact <strong>de</strong>s activités anthropiques sur la dynamique et l’évolution <strong>de</strong>s<br />
populations et <strong>de</strong>s espèces. Les obstacles à l’observation ou au suivi direct sont<br />
considérablement accentués en milieu marin, dont la difficulté d’accès a longtemps<br />
limité nos connaissances dans ces domaines. La combinaison <strong>de</strong>s approches<br />
moléculaires et du cadre théorique <strong>de</strong> la génétique <strong>de</strong>s populations ont apporté les<br />
outils et le cadre conceptuel qui ont permis <strong>de</strong> remplacer l’approche directe consistant<br />
dans le suivi <strong>de</strong>s individus et <strong>de</strong>s populations dans l’espace, là ou elle est<br />
techniquement impossible, par une approche indirecte visant à retracer les mouvements<br />
<strong>de</strong>s gènes dans l’espace et dans le temps.<br />
C’est dans ce contexte que s’inscrit ma démarche <strong>de</strong> recherche. Elle consiste à<br />
étudier les déterminants <strong>de</strong> l’évolution, en particulier <strong>de</strong>s populations marines, en<br />
utilisant <strong>de</strong>s données moléculaires analysées dans le cadre théorique <strong>de</strong> la génétique<br />
<strong>de</strong>s populations. Initié au milieu <strong>de</strong>s années 1990, mon parcours scientifique m’a permis<br />
22
Sophie ARNAUD-HAOND - Candidature à une Habilitation à Diriger <strong>de</strong>s Recherches, Février 2008<br />
3. Résumé <strong>de</strong>s travaux <strong>de</strong> Recherche<br />
d’assister à l’essor <strong>de</strong> ce type d’approche empirique, d’apprécier les connaissances<br />
qu’elles ont permis d’acquérir en une décennie sur l’écologie et l’évolution <strong>de</strong>s<br />
populations et <strong>de</strong>s espèces, mais également <strong>de</strong> voir leurs limites se <strong>de</strong>ssiner, et <strong>de</strong><br />
tenter <strong>de</strong> les repousser en améliorant l’analyse et l’interprétation <strong>de</strong>s données<br />
auxquelles nous avons accès. Cette synthèse <strong>de</strong> mes expériences <strong>de</strong> recherche, sera<br />
donc construite <strong>de</strong> façon à résumer d’une part les résultats obtenus et les<br />
connaissances qu’ils ont permis <strong>de</strong> contribuer à acquérir, et d’autre part les problèmes<br />
d’analyse et d’interprétation communément rencontrés et les métho<strong>de</strong>s que nous avons<br />
tenté <strong>de</strong> développer pour les résoudre. La transition avec les Projets <strong>de</strong> Recherche se<br />
fera à la partie 3, qui résume les résultats et ouvre également sur les perspectives <strong>de</strong><br />
développement <strong>de</strong> ces axes <strong>de</strong> recherches que je compte poursuivre durant les 4<br />
prochaines années en les appliquant davantage aux populations d’organismes vivants<br />
dans les écosystèmes profonds.<br />
I. LE MILIEU MARIN : UN MILIEU HETEROGENE ET INSTABLE<br />
Le milieu marin a longtemps été considéré comme un milieu extrêmement<br />
homogène et relativement dépourvu <strong>de</strong> barrières physiques au passage <strong>de</strong>s individus,<br />
et donc <strong>de</strong>s gènes. Ainsi, la panmixie a souvent été attendue comme une règle dans<br />
les populations <strong>de</strong>s organismes marins (Vermeij 1987), accompagnée au <strong>de</strong>là d’une<br />
certaine distance dépendant <strong>de</strong> l’organisme étudié, d’une différentiation génétique<br />
progressive (<strong>de</strong> type pas japonais, ou isolement par la distance ; voir Encadré 1) en<br />
relation étroite avec le potentiel <strong>de</strong> dispersion <strong>de</strong> l’espèce (Palumbi 1992, 1994). Les<br />
différentes étu<strong>de</strong>s <strong>de</strong> génétique <strong>de</strong>s populations marines ont rapi<strong>de</strong>ment poussé à<br />
réviser ce paradigme <strong>de</strong> panmixie, probablement lié à notre difficulté à formaliser le<br />
concept <strong>de</strong> barrière au flux génique et à notre méconnaissance <strong>de</strong>s preferenda<br />
écologiques en milieu marin (Avise 1994, Hedgecock 1994, Palumbi 1994).<br />
Mon objectif au cours <strong>de</strong> mes premières expériences <strong>de</strong> recherche a été d’utiliser<br />
différents types <strong>de</strong> marqueurs moléculaires pour i<strong>de</strong>ntifier les principaux déterminants<br />
présents et passés <strong>de</strong> la divergence génétique en milieu marin. En parallèle, il s’agissait<br />
également <strong>de</strong> tester <strong>de</strong> façon comparative les différents marqueurs disponibles, et<br />
d’inférer leurs propriétés comparées et leur adéquation en fonction <strong>de</strong>s questions<br />
posées et <strong>de</strong>s échelles <strong>de</strong> temps concernées.<br />
I.1 Migration-Dérive : hétérogénéité, barrières au flux génique et taille efficace<br />
La fragmentation <strong>de</strong> l’habitat<br />
L’étu<strong>de</strong> <strong>de</strong> la structure génétique <strong>de</strong>s populations permet <strong>de</strong> révéler les zones<br />
géographiques <strong>de</strong> restriction du flux génique, <strong>de</strong> part et d’autre <strong>de</strong>squelles les<br />
populations évoluent <strong>de</strong> façon relativement indépendante, conduisant à une divergence<br />
23
Sophie ARNAUD-HAOND - Candidature à une Habilitation à Diriger <strong>de</strong>s Recherches, Février 2008<br />
3. Résumé <strong>de</strong>s travaux <strong>de</strong> Recherche<br />
.<br />
Encadré 1: Modèles classiques <strong>de</strong> structure <strong>de</strong> populations:<br />
basés sur <strong>de</strong>s dèmes échangeant <strong>de</strong>s taux uniformes m <strong>de</strong> migrants avec les autres dèmes<br />
du système<br />
I. Modèle en îles <strong>de</strong> Wright (1931)<br />
Chaque dème échange m/(n-1) avec les<br />
autres n dèmes du système: aucune<br />
relation n’est attendue entre<br />
distance génétique et distance<br />
géographique<br />
II.<br />
Modèle en pas japonais <strong>de</strong> Kimura<br />
a)<br />
b)<br />
c)<br />
a) une dimension (chaque dème échange<br />
m/2 avec les dèmes voisins).<br />
b) une dimension, modifié pour éviter les<br />
“effets bords” (Maruyama, 1971).<br />
c) <strong>de</strong>ux dimensions (chaque dème échange<br />
m/4 avec ses quatre plus proches voisins;<br />
un tore <strong>de</strong>vrait représenter sa<br />
modification pour éviter les” effets bords”).<br />
III. Ceci est la « version discrète » du modèle<br />
d’isolement par la distance proposé initialement par<br />
Malécot (1950).<br />
Le taux <strong>de</strong> migration est une fonction décroissante et continue <strong>de</strong> la<br />
Dans les <strong>de</strong>ux cas (pas japonais discret ou isolement par la distance continu) on attends une<br />
décroissance –exponentielle dans un système à <strong>de</strong>ux dimensions) <strong>de</strong> la corrélation entre<br />
gènes lorsque la distance augmente.<br />
génétique. En fonction <strong>de</strong> la durée d’isolement, cette divergence peut se traduire par<br />
une différence <strong>de</strong>s fréquences alléliques, ou si le temps d’isolement a été plus long, par<br />
l’accumulation <strong>de</strong> mutations propres à chaque entité, l’apparition d’allèles propres et la<br />
divergence <strong>de</strong>s séquences. L’analyse <strong>de</strong> populations réparties <strong>de</strong> part et d’autre <strong>de</strong> ces<br />
zones permet <strong>de</strong> mettre en évi<strong>de</strong>nce les caractéristiques topographiques ou<br />
écologiques du milieu qui sont (Edmands et al. 1996, Planes et al. 1996) ou ont été<br />
dans le passé (Saun<strong>de</strong>rs et al. 1986, Bowen & Avise 1990, Benzie & Williams 1997)<br />
24
Sophie ARNAUD-HAOND - Candidature à une Habilitation à Diriger <strong>de</strong>s Recherches, Février 2008<br />
3. Résumé <strong>de</strong>s travaux <strong>de</strong> Recherche<br />
susceptibles <strong>de</strong> jouer le rôle <strong>de</strong> barrière au flux génique. Une approche idéale pour<br />
mettre en relation la limitation du flux génique et les barrières environnementales<br />
potentielles, en minimisant les risques d’interférence avec <strong>de</strong>s caractéristiques<br />
biologiques distinctes <strong>de</strong>s espèces étudiées, est la comparaison d’espèces très proches<br />
dans <strong>de</strong>s habitats présentant <strong>de</strong>s caractéristiques spécifiques différentes.<br />
Cette approche a été réalisée durant ma thèse, dont l’un <strong>de</strong>s objectifs était<br />
d’évaluer la possibilité d’effectuer <strong>de</strong>s prédictions sur le modèle théorique <strong>de</strong><br />
métapopulations résumant au mieux le patron <strong>de</strong> différentiation génétique <strong>de</strong>s<br />
populations d’une espèce en fonction <strong>de</strong>s caractéristiques <strong>de</strong> son habitat. Nous avons<br />
comparé les patrons <strong>de</strong> structure génétique chez <strong>de</strong>ux espèces proches <strong>de</strong> bivalves,<br />
Pinctada mazatlanica et P. margaritifera, présentant <strong>de</strong>s exigences écologiques et <strong>de</strong>s<br />
caractéristiques biologiques (notamment la durée <strong>de</strong> la phase larvaire dispersante)<br />
extrêmement similaires mais ayant une répartition géographique très différente :<br />
continue le long <strong>de</strong>s côtes pour P. mazatlanica et fragmentée autour <strong>de</strong>s îles du<br />
Pacifique pour P. margaritifera.<br />
Chez la nacre mexicaine P. mazatlanica le long <strong>de</strong>s côtes américaines, bien que trois<br />
groupes <strong>de</strong> populations qui n’étaient pas significativement différenciées entre elle ait été<br />
détecté, un patron d’isolement par la distance a été observé a2 (Figure 1). A l’inverse, en<br />
Polynésie, une structuration génétique indépendante <strong>de</strong> la distance géographique a été<br />
mise en évi<strong>de</strong>nce a5 (Figure 2) correspondant davantage à un modèle en île. Ces<br />
résultats ont contribué à démontrer l’importance <strong>de</strong> la distribution <strong>de</strong> l’habitat (continu ou<br />
fragmenté) dans les patrons <strong>de</strong> différentiation génétique.<br />
Les barrières au flux géniques<br />
Le patron <strong>de</strong> structure génétique en Polynésie comme au Mexique, correspond<br />
en plusieurs points à la mosaïque délimitée par les principaux courants <strong>de</strong> surface a2,a5 ,<br />
comme cela avait été suggéré sur <strong>de</strong>s espèces <strong>de</strong> poissons et d’invertébrés (Edmands<br />
et al. 1996, Planes et al. 1996).<br />
25
Sophie ARNAUD-HAOND - Candidature à une Habilitation à Diriger <strong>de</strong>s Recherches, Février 2008<br />
3. Résumé <strong>de</strong>s travaux <strong>de</strong> Recherche<br />
Manuae<br />
Manuae<br />
Raïatea<br />
Maupihaa<br />
Mangareva<br />
Mangareva<br />
Takaroa<br />
Takaroa<br />
Suwarrow<br />
Tahuata<br />
Perhyn<br />
0.1<br />
0.1<br />
Figure 2: patron <strong>de</strong> différentiation génétique entre les populations <strong>de</strong>s îles d’archipels Polynésiens, et courants<br />
principaux dans la zone.<br />
Dans une autre étu<strong>de</strong> portant cette fois sur <strong>de</strong>s populations du phanérogame<br />
marin Posidonia oceanica les résultats que nous avions obtenus suggéraient également<br />
l’influence <strong>de</strong>s courants marins en tant que barrière au flux génique a19,s25 . Dans cette<br />
même étu<strong>de</strong> l’existence <strong>de</strong> terres émergées s’est également révélée être un facteur<br />
limitant du flux génique, comme j’avais pu l’observer sur <strong>de</strong>s poissons pélagiques <strong>de</strong><br />
l’Indo-Pacifique a1 . Cela peut sembler évi<strong>de</strong>nt quand ces barrières cloisonnent l’aire <strong>de</strong><br />
distribution actuelle <strong>de</strong> l’espèce étudiée comme cela s’est produit lors <strong>de</strong> la fermeture<br />
<strong>de</strong> l’isthme <strong>de</strong> Panama (Knowlton et al. 1993), mais dans le cas <strong>de</strong>s Posidonies ces<br />
barrières ont agit lors d’ères géologiques antérieures et ont <strong>de</strong>puis disparu. Les traces<br />
d’un événement <strong>de</strong> vicariance induit par la séparation quasi totale <strong>de</strong>s bassins Est et<br />
Ouest durant le Pléistocène ont cependant été retrouvées sur le patron <strong>de</strong> distribution<br />
a19, s25<br />
<strong>de</strong> la variabilité génétique <strong>de</strong> Posidonia oceanica à l’échelle <strong>de</strong> la Méditerranée<br />
(Figure 3).<br />
Ce patron s'est apparemment maintenu jusqu'à aujourd'hui du fait <strong>de</strong> <strong>de</strong>ux<br />
facteurs : i) d’une part d'une dispersion très limitée à l’échelle <strong>de</strong> seulement quelques<br />
dizaines <strong>de</strong> mètres comme le montre les analyses d'autocorrélation spatiale au sein <strong>de</strong>s<br />
herbiers ii) d’autre part un recrutement par voie sexuée pouvant être très faible. Nous<br />
avons en effet obtenu par ailleurs <strong>de</strong>s résultats indiquant que certains clones <strong>de</strong><br />
Posidonie peuvent s’étendre sur plusieurs dizaines <strong>de</strong> kilomètres. Ce résultat interprété<br />
à la lumière <strong>de</strong>s modèles <strong>de</strong> croissances les plus conservatifs (Sintes et al. 2006)<br />
permet d’estimer la date <strong>de</strong> l’évènement <strong>de</strong> reproduction sexuée au moins au<br />
Pleistocène s26 , suggérant un turn-over très limité au moins dans les prairies où ces<br />
genets ‘géants’ prédominent.<br />
26
Sophie ARNAUD-HAOND - Candidature à une Habilitation à Diriger <strong>de</strong>s Recherches, Février 2008<br />
3. Résumé <strong>de</strong>s travaux <strong>de</strong> Recherche<br />
Figure 3: Distribution <strong>de</strong> la richesse allélique et <strong>de</strong>s allèles communs à plusieurs zones (bleu), privés<br />
au bassin Ouest (orange), Est (vert), et à la zone Siculo Tunisienne (rouge) interprétée à l’issue <strong>de</strong> ce<br />
travail comme une zone <strong>de</strong> contact entre les populations <strong>de</strong> l’Est et <strong>de</strong> l’Ouest <strong>de</strong> la Méditerranée<br />
<strong>de</strong>meurées isolées pendant les <strong>de</strong>rnières glaciations du Pléistocène.<br />
Certaines étu<strong>de</strong>s phénologiques et caryotypiques avaient suggéré l’existence <strong>de</strong><br />
sous-espèces présentes dans chacun <strong>de</strong>s bassins Est et Ouest. Cependant, aucun<br />
déséquilibre <strong>de</strong> liaison ni déficit en hétérozygotes n’a été observé dans les populations<br />
mixtes <strong>de</strong> la zone <strong>de</strong> contact, suggérant l’absence d’isolement reproducteur entre les<br />
populations <strong>de</strong>s bassins Est et Ouest, malgré une divergence ancienne a19 . Toutefois,<br />
ces observations reposent sur l’analyse <strong>de</strong> fréquences alléliques avec <strong>de</strong>s données<br />
microsatellites. L’étu<strong>de</strong> <strong>de</strong>s populations à l’ai<strong>de</strong> <strong>de</strong> séquences nucléaire <strong>de</strong> type ITS est<br />
en court afin <strong>de</strong> vérifier l’absence <strong>de</strong> divergence génétique <strong>de</strong>s lignées présentes dans<br />
chacun <strong>de</strong>s <strong>de</strong>ux bassins.<br />
La taille efficace<br />
On retrouve également l’importance et la trace d’événement historiques sur les<br />
données <strong>de</strong> séquences mitochondriales <strong>de</strong>s <strong>de</strong>ux espèces <strong>de</strong> Pinctada, non plus sous<br />
la forme <strong>de</strong> barrières aux flux géniques, mais sous la forme d’effets fondateurs passés<br />
qui semblent influencer encore aujourd’hui le patron <strong>de</strong> structure génétique a5, a6 .<br />
L’étu<strong>de</strong> <strong>de</strong>s mangroves du <strong>de</strong>lta du Mekong, éradiquées pendant la guerre du<br />
Vietnam par l’agent orange, nous a également permis <strong>de</strong> montrer que la recolonisation<br />
génétique est un processus lent nécessitant plus <strong>de</strong> temps que celui nécessaire à la<br />
récupération démographique s23 . En effet, le couvert <strong>de</strong> mangrove a été recouvré<br />
seulement quelques années après la fin <strong>de</strong> la guerre. L’utilisation <strong>de</strong>s tries <strong>de</strong><br />
croissances pour dater les arbres échantillonnés pour être analysés avec <strong>de</strong>s<br />
marqueurs microsatellites montre qu’au contraire la richesses allélique n’a cessé<br />
d’augmenter dans les 20 années qui sont suivi. Malgré une augmentation marginale les<br />
27
Sophie ARNAUD-HAOND - Candidature à une Habilitation à Diriger <strong>de</strong>s Recherches, Février 2008<br />
3. Résumé <strong>de</strong>s travaux <strong>de</strong> Recherche<br />
cinq <strong>de</strong>rnières années, cette augmentation<br />
semble indiquer que l’état d’équilibre n’est<br />
pas encore atteint et que la recolonisation<br />
génétique n’est pas achevée.<br />
L'influence d'une taille efficace<br />
réduite sur le niveau et la distribution du<br />
polymorphisme peut également être stable<br />
dans le temps, comme c'est souvent le cas<br />
dans les populations qui se trouvent en<br />
limite <strong>de</strong> distribution, leur taille, leur <strong>de</strong>nsité<br />
et leur fécondité sont réduites. C'est le cas<br />
par exemple <strong>de</strong>s populations <strong>de</strong> mangroves<br />
<strong>de</strong> l'espèce Avicennia marina, sur<br />
lesquelles <strong>de</strong>s marqueurs microsatellites<br />
montrent une variabilité génétique moindre<br />
et une structure génétique plus forte dans<br />
les populations situées au Nord <strong>de</strong> l'aire <strong>de</strong><br />
répartition (en Asie du Sud Est) que dans<br />
les populations australiennes situées dans<br />
le centre <strong>de</strong> distribution <strong>de</strong> l'espèce a15 . Il est<br />
intéressant <strong>de</strong> noter que cette réduction <strong>de</strong><br />
taille efficace dans les populations<br />
marginales semble s’accompagner d’un<br />
bouleversement du système reproducteur.<br />
Dans les populations du centre <strong>de</strong><br />
distribution aucun écart a la panmixie n’a<br />
été détecté, tandis que <strong>de</strong> forts déficits en<br />
hétérozygotes sont observés en limite,<br />
particulièrement au Nord, suggérant<br />
l’existence d’auto-fécondation dans ces<br />
populations isolées et <strong>de</strong> tailles réduites.<br />
Allelic richness<br />
F is<br />
8<br />
6<br />
4<br />
2<br />
0<br />
Limite Nord<br />
1.0<br />
0.5<br />
0.0<br />
LimiteNord<br />
Centre <strong>de</strong> distribution<br />
Centre <strong>de</strong> distribution<br />
Limite Sud<br />
Limite Sud<br />
Figure 4: Richesse allélique et estimations <strong>de</strong> F is<br />
dans les population du Centre <strong>de</strong> distribution (Nord<br />
<strong>de</strong> l’Australie), comparée à celles <strong>de</strong>s limites Nord<br />
(Sud-Est Asiatique) et du Sud (Sud <strong>de</strong> l’Australie)<br />
<strong>de</strong> l’aire <strong>de</strong> distribution <strong>de</strong>s arbres <strong>de</strong> mangrove<br />
Avicennia marina.<br />
I.2 Sélection<br />
Depuis les années 1970, la théorie neutraliste <strong>de</strong> l’évolution <strong>de</strong> Kimura désignait la<br />
dérive comme le principal moteur <strong>de</strong> l’évolution, au contraire <strong>de</strong>s développements <strong>de</strong> la<br />
théorie Darwiniste qui avait auparavant conduit à considérer la sélection comme le<br />
processus prédominant. Les étu<strong>de</strong>s empiriques en génétique <strong>de</strong>s populations ont donc<br />
pendant <strong>de</strong>ux décennies été pratiquées en considérant comme acquise la neutralité <strong>de</strong>s<br />
marqueurs polymorphes utilisés. Toutefois, les avancées <strong>de</strong> la biologie moléculaire et le<br />
développement parallèle d’un nombre croissant <strong>de</strong> marqueurs utilisés en génétique <strong>de</strong>s<br />
28
Sophie ARNAUD-HAOND - Candidature à une Habilitation à Diriger <strong>de</strong>s Recherches, Février 2008<br />
3. Résumé <strong>de</strong>s travaux <strong>de</strong> Recherche<br />
populations ont peu à peu conduit à repositionner la sélection au centre du débat en<br />
évolution. Il s’est agit dans un premier temps d’indices indirects apportés par la<br />
comparaison <strong>de</strong> multiples marqueurs supposés neutres comme les allozymes ou les<br />
microsatellites, puis <strong>de</strong>s développements <strong>de</strong>s outils génomiques qui ont permis<br />
d’i<strong>de</strong>ntifier un certain nombre <strong>de</strong> gènes soumis à <strong>de</strong>s processus sélectifs i<strong>de</strong>ntifiés.<br />
L’utilisation <strong>de</strong> multiples locus <strong>de</strong> différents types a d’abord permit d’i<strong>de</strong>ntifier <strong>de</strong>s<br />
marqueurs au comportement atypique (Figure 3), puis <strong>de</strong> développer et d’utiliser <strong>de</strong>s<br />
tests d’hypothèse permettant <strong>de</strong> mettre en évi<strong>de</strong>nce l’existence <strong>de</strong> sélection (Beaumont<br />
& Nichols 1996, Depaulis & Veuille 1998, Lemaire et al. 2000, Luikart et al. 2003). Nous<br />
avons utilisé ce type d’approche comparative sur les échantillons <strong>de</strong> P. margaritifera<br />
(ADN mitochondrial, 8 allozymes, marqueurs nucléaires anonymes a3 ) et mis en<br />
évi<strong>de</strong>nce le comportement atypique <strong>de</strong> trois marqueurs allozymiques a5 . L’utilisation d’un<br />
test <strong>de</strong> neutralité (Raufaste &<br />
Bonhomme soumis) a montré pour <strong>de</strong>ux<br />
d’entre eux un écart significatif à<br />
l’hypothèse nulle <strong>de</strong> neutralité,<br />
suggérant une forme <strong>de</strong> sélection<br />
équilibrante induisant un niveau <strong>de</strong><br />
différentiation génétique inférieur aux<br />
estimations réalisées sur la base <strong>de</strong>s<br />
autres locus a5 . L’utilisation <strong>de</strong>s<br />
marqueurs moléculaires supposés<br />
neutres, en génétique <strong>de</strong> la<br />
Fst<br />
conservation notamment, fait l’objet<br />
Figure 5:I<strong>de</strong>ntification <strong>de</strong>s locus atypiques: Distribution<br />
d’une interprétation qui peut sembler<br />
hypothétique du Fst (divergence génétique) entre les<br />
paradoxale : l’interprétation <strong>de</strong>s<br />
locus neutres échantillonnés dans le génome. Les<br />
effets locus spécifiques révèlent quelques locus<br />
données repose sur l’hypothèse <strong>de</strong> leur<br />
atypiques ( zones rouge et verte ) montrant une valeur<br />
neutralité, mais que le niveau <strong>de</strong><br />
<strong>de</strong> Fst très différente <strong>de</strong> la plupart <strong>de</strong>s autres locus.<br />
polymorphisme est par la suite<br />
Modifié à partir <strong>de</strong> Luikart et al. (2003)<br />
interprété comme un estimateur du<br />
‘potentiel évolutif’ <strong>de</strong>s espèces. Il existe donc une hypothèse sous-jacente implicite, mais<br />
non démontrée, qui est que le niveau <strong>de</strong> polymorphisme aux marqueurs neutres <strong>de</strong>vrait<br />
permettre une estimation indirecte satisfaisante <strong>de</strong> celui caractérisant les gènes soumis à<br />
sélection, et être un bon indicateur <strong>de</strong> la résilience <strong>de</strong>s populations.<br />
Dans le cadre d’un projet (DivStab) et d’une thèse (celle <strong>de</strong> Sonia Massá) nous<br />
avons choisi <strong>de</strong> tester ces hypothèses. D’une part nous avons mis au point <strong>de</strong>s<br />
expériences visant à estimer l’impact <strong>de</strong> la diversité génétique aux marqueurs neutres<br />
sur la résistance et la résilience <strong>de</strong> la phanérogame marine Zostera noltii à <strong>de</strong> fortes<br />
températures. En parallèle nous développons <strong>de</strong>s banques EST’s qui seront criblées<br />
pour sélectionner <strong>de</strong>s marqueurs impliqués dans la réponse aux chocs <strong>de</strong> température<br />
chez cette plante s28 et retenir <strong>de</strong>s marqueurs polymorphes. A terme il s’agira <strong>de</strong> tester<br />
Nombre <strong>de</strong> loci<br />
29
Sophie ARNAUD-HAOND - Candidature à une Habilitation à Diriger <strong>de</strong>s Recherches, Février 2008<br />
3. Résumé <strong>de</strong>s travaux <strong>de</strong> Recherche<br />
l’existence d’une corrélation entre le polymorphisme aux <strong>de</strong>ux types <strong>de</strong> marqueurs<br />
utilisés, afin <strong>de</strong> tester l’hypothèse qu’un set <strong>de</strong> marqueurs neutres <strong>de</strong> type allozymes ou<br />
microsatellites présente un polymorphisme représentatif du génome dans son<br />
ensemble, y compris du polymorphisme potentiellement soumis à sélection.<br />
I.3 Impact <strong>de</strong>s activités anthropiques<br />
Enfin, il est difficile, voire impossible, <strong>de</strong> s’intéresser à l’écologie et à l’évolution<br />
<strong>de</strong>s populations marines aujourd’hui sans prendre en compte et tenter d’évaluer<br />
l’importance d’un autre facteur influençant <strong>de</strong> plus en plus fréquemment la répartition<br />
spatiale <strong>de</strong> variabilité génétique dans les populations naturelles : les activités<br />
anthropiques agissant directement (exploitation) ou non (modification <strong>de</strong> l’habitat,<br />
introduction d'espèces) sur les populations naturelles a2,a4,a10, s23 .<br />
Dans le cas <strong>de</strong> la nacre perlière par exemple, l’analyse d’échantillons prélevés dans<br />
<strong>de</strong>ux archipels avant et après <strong>de</strong>s épiso<strong>de</strong>s <strong>de</strong> transferts liés à l’aquaculture en milieu<br />
naturel a mis en évi<strong>de</strong>nce l’impact <strong>de</strong> l’importation <strong>de</strong> souches différenciées sur la<br />
composition génétique <strong>de</strong>s stocks sauvages. La divergence génétique initiale, quoique<br />
faible entre <strong>de</strong>ux archipels a complètement disparu, et la contribution <strong>de</strong>s quelques<br />
individus importés dans les fermes (par rapport à l’importance <strong>de</strong>s bancs naturels)<br />
semble forte. Ces résultats suggèrent la possible existence d’heterosis qui augmente la<br />
migration efficace (Ingvarsson & Whitlock 2000) ou, <strong>de</strong> façon plus probable, un succès<br />
reproducteur accru dans les conditions d’élevage en fermes dû à la forte <strong>de</strong>nsité<br />
(Levitan et al. 1992) <strong>de</strong>s individus qui y sont stockés a10 .<br />
AXE 2<br />
0,3<br />
0,2<br />
0,1<br />
0,0<br />
-0,1<br />
-0,2<br />
-0,3<br />
MA -O<br />
MH-N<br />
MP-O<br />
MA -N<br />
TA-O<br />
MG-N<br />
MP-N<br />
TA-N<br />
MH-O<br />
AR-N<br />
MG-O<br />
AR-O<br />
HO-O<br />
HO-N<br />
-0,4<br />
-0,5<br />
-0,4 -0,3 -0,2 -0,1 0,0 0,1 0,2 0,3 0,4 0,5<br />
AXE 1<br />
Figure 6: analyse factorielle<br />
<strong>de</strong>s correspondances (AFC)<br />
sur la base <strong>de</strong>s données<br />
moléculaire <strong>de</strong>s populations <strong>de</strong><br />
Polynésie échantillonnées<br />
dans les années 1980s (en<br />
bleu) et en 2000s (en orange).<br />
Les flèches rouges indiquent le<br />
changement drastique <strong>de</strong><br />
composition génétique <strong>de</strong>s<br />
atolls dans lesquels <strong>de</strong>s<br />
translocations on été réalisées<br />
dans les années 1990s à partir<br />
<strong>de</strong> naissain collecté<br />
principalement dans les <strong>de</strong>ux<br />
atolls cerclés <strong>de</strong> rouge.<br />
30
Sophie ARNAUD-HAOND - Candidature à une Habilitation à Diriger <strong>de</strong>s Recherches, Février 2008<br />
3. Résumé <strong>de</strong>s travaux <strong>de</strong> Recherche<br />
Enfin, dans le cas <strong>de</strong> la Posidonie nous avons pu montrer dans le cadre <strong>de</strong> la<br />
thèse d’Elena Diaz-Almela que la pollution liée aux installations aquacoles à proximité<br />
<strong>de</strong>s herbiers, responsable <strong>de</strong> fortes mortalités, modifie la composition clonale, et donc<br />
génétique, <strong>de</strong>s prairies en favorisant les clones les plus grands qui semblent survivre<br />
mieux aux perturbations a20 .<br />
En conclusion, j’ai pu durant ces différentes expériences tester, et observer les<br />
limites <strong>de</strong> validité, d’ un certain nombre d’hypothèses a priori quant à la structure <strong>de</strong>s<br />
populations marines appréhendée avec <strong>de</strong>s marqueurs supposés neutres (Encadré 2).<br />
Encadré 2: Hypothèses a priori testées et réfutées dans certains<br />
cas.<br />
HYPOTHESES a priori<br />
Marqueurs<br />
neutres<br />
Absence <strong>de</strong><br />
barrière<br />
Gran<strong>de</strong><br />
taille <strong>de</strong><br />
population<br />
Forte<br />
dispersion<br />
Sélection<br />
a5<br />
a5<br />
Barrières<br />
Physiques<br />
(courants,<br />
fragmentation<br />
<strong>de</strong> l’habitat)<br />
a1,2,6<br />
Faible taille<br />
efficace,<br />
variance du<br />
succès<br />
reproducteur<br />
a4,10,11,14,15, 23<br />
Faible<br />
dispersion<br />
réalisée<br />
a14,20,22<br />
31
Sophie ARNAUD-HAOND - Candidature à une Habilitation à Diriger <strong>de</strong>s Recherches, Février 2008<br />
3. Résumé <strong>de</strong>s travaux <strong>de</strong> Recherche<br />
Durant ce parcours <strong>de</strong> recherche, j’ai rencontré <strong>de</strong> façon directe <strong>de</strong>ux limites<br />
importantes à l’analyse et à l’interprétation <strong>de</strong>s données moléculaires dans le cadre <strong>de</strong><br />
la génétique <strong>de</strong>s populations. La première est la prise en compte <strong>de</strong>s spécificités<br />
conférées par la clonalité dans l’étu<strong>de</strong> et l’interprétation <strong>de</strong> la génétique <strong>de</strong>s populations<br />
d’organismes clonaux. La secon<strong>de</strong> est l’écart récurrent aux hypothèses sous-jacentes et<br />
aux conditions requises pour l’interprétation <strong>de</strong>s données moléculaires avec les outils<br />
classiques <strong>de</strong> génétique <strong>de</strong>s populations.<br />
J’ai commencé à abor<strong>de</strong>r chacun <strong>de</strong> ces problèmes lors <strong>de</strong> mes différentes<br />
expériences post-doctorales, et étant donné leur large spectre d’<strong>applications</strong><br />
potentielles, ainsi que mon implication dans un projet Européen portant sur l’utilisation<br />
<strong>de</strong> la théorie <strong>de</strong>s réseaux en évolution, ces <strong>de</strong>ux problématiques se trouvent à la<br />
charnière entre activités passées et perspectives <strong>de</strong> développement futur. J’ai donc<br />
choisi <strong>de</strong> les détailler davantage avant d’expliquer comment elles s’inscriront dans les<br />
perspectives et futurs projets dont les modèles d’étu<strong>de</strong> s’orienteront maintenant<br />
davantage vers le milieu océanique profond.<br />
32
Sophie ARNAUD-HAOND - Candidature à une Habilitation à Diriger <strong>de</strong>s Recherches, Février 2008<br />
3. Résumé <strong>de</strong>s travaux <strong>de</strong> Recherche<br />
II. CLONALITE, ECOLOGIE ET EVOLUTION<br />
La première est l’existence d’un système reproducteur complexe, la clonalité,<br />
qui pose d’abord le problème <strong>de</strong> l’accès au niveau individuel sur le plan technique,<br />
mais également conceptuel. Quelle est l’unité démographique chez un organisme<br />
clonal (l’entité individuelle ou l’ensemble <strong>de</strong>s unités dérivées du même évènement <strong>de</strong><br />
reproduction sexuée et partageant le même patrimoine génétique ; chez les plantes :<br />
ramet ou le genet ?). Doit-on considérer le problème <strong>de</strong> façon différente selon que<br />
les unités sont indépendantes physiquement les unes <strong>de</strong>s autres (comme les<br />
bactéries, ou certains organismes pathogènes) ou conservent un certain niveau<br />
d’interconnexion et d’interdépendance (plantes clonales, colonies coralliennes…) ?<br />
Comment i<strong>de</strong>ntifier les lignées clonales, pour commencer ?<br />
La complexité <strong>de</strong> ces problèmes est reflétée en premier lieu par l’absence<br />
d’outils standardisés permettant <strong>de</strong> prendre en compte <strong>de</strong> façon spécifique la<br />
clonalité dans les analyses <strong>de</strong> données génétiques. Le premier volet <strong>de</strong> ce travail a<br />
donc consisté à proposer <strong>de</strong>s métho<strong>de</strong>s d'analyses <strong>de</strong> données permettant <strong>de</strong><br />
prendre en compte <strong>de</strong> façon spécifique les caractéristiques <strong>de</strong>s organismes clonaux.<br />
Il s'agissait <strong>de</strong> définir <strong>de</strong>s <strong>de</strong>scripteurs génétiques adaptés à l’étu<strong>de</strong> <strong>de</strong>s organismes<br />
clonaux a17,21,22 , pour i) reconnaître les lignées clonales a12,19,22 , ii) extraire les<br />
informations dérivées <strong>de</strong>s données génétiques en terme <strong>de</strong> diversité et <strong>de</strong> structure<br />
clonale a13,22 , iii) rendre possible la comparaison <strong>de</strong>s résultats obtenus lors <strong>de</strong><br />
différentes étu<strong>de</strong>s sur différents organismes a13,21,22, s25 , et pour iv) intégrer les<br />
données démographiques avec le patron <strong>de</strong> croissance et <strong>de</strong> diversité clonale a22,s26 .<br />
Ces différentes approches sont rapportées dans les cinq manuscrits qui<br />
suivent.<br />
33
Sophie ARNAUD-HAOND - Candidature à une Habilitation à Diriger <strong>de</strong>s Recherches, Février 2008<br />
3. Résumé <strong>de</strong>s travaux <strong>de</strong> Recherche<br />
II.1 Assessing genetic diversity in clonal organisms: Low diversity or low<br />
resolution? Combining power and cost efficiency in selecting markers.<br />
Journal of Heredity, 2005.<br />
Dans un premier temps nous nous sommes attachés à démontrer l'importance <strong>de</strong>s<br />
métho<strong>de</strong>s moléculaires et statistiques pour accé<strong>de</strong>r au niveau individuel et réaliser<br />
<strong>de</strong>s estimations non biaisées <strong>de</strong> la clonalité. On peut citer à titre d'exemple le cas <strong>de</strong><br />
Posidonia oceanica, qui a longtemps été considérée comme extrêmement clonale<br />
sur la base d'analyses moléculaires réalisées avec <strong>de</strong>s marqueurs trop peu<br />
polymorphes (Figure 7a). Nous avons utilisé cet exemple pour proposer <strong>de</strong>s<br />
métho<strong>de</strong>s statistiques permettant <strong>de</strong> s'assurer du pouvoir discriminant <strong>de</strong>s<br />
marqueurs utilisés et <strong>de</strong> la capacité d’accé<strong>de</strong>r <strong>de</strong> détecter tous les génotypes<br />
présents dans les échantillons analysés (Figure 7b). Il s’agit d’un pré requis pour<br />
espérer faire <strong>de</strong>s inférences sur le niveau <strong>de</strong> clonalité <strong>de</strong>s populations ou analyser<br />
plus avant les données avec les outils statistiques classiques en génétique <strong>de</strong>s<br />
populations.<br />
a)<br />
b)<br />
Diversité clonale: (G-1)/(N-1)<br />
Diversité clonale: (G-1)/(N-1)<br />
0.8<br />
0.6<br />
0.4<br />
0.2<br />
0.0<br />
1.0<br />
0.8<br />
0.6<br />
0.4<br />
0.2<br />
allozymes RAPD's trinucleoti<strong>de</strong>s dinucleoti<strong>de</strong>s<br />
0.0<br />
0 2 4 6 8 10<br />
Nombre <strong>de</strong> locus<br />
Formentera<br />
FECS<br />
PortLigat<br />
Denia<br />
Tavolara<br />
Otranto<br />
Paphos<br />
Malta<br />
Figure 7 : Niveaux <strong>de</strong> diversité clonale estimée<br />
(en fonction du nombre N d’échantillons analysés<br />
et G <strong>de</strong> génotypes multilocus distincts i<strong>de</strong>ntifiés)<br />
obtenus dans les herbiers <strong>de</strong> Posidonia oceanica<br />
avec les différents types <strong>de</strong> marqueurs utilisés<br />
(a) dans différentes étu<strong>de</strong>s en comparant les<br />
valeurs moyennes obtenues avec les allozymes,<br />
les RAPD’s et les marqueurs microsatellites<br />
trinucléoti<strong>de</strong>s ou dinucléoti<strong>de</strong>s, et (b) en<br />
comparant les échantillons <strong>de</strong>s huit mêmes<br />
herbiers avec un nombre croissant <strong>de</strong> marqueurs<br />
microsatellites di (bleu) ou tri (orange)<br />
nucléoti<strong>de</strong>s utilisés pour i<strong>de</strong>ntifier les différents<br />
génotypes présents dans les échantillons. La<br />
différence <strong>de</strong> pouvoir discriminant est flagrante,<br />
et les marqueurs les plus discriminants<br />
permettent d’obtenir une asymptote, c'est-à-dire<br />
une diversité génotypique reflétant <strong>de</strong> façon<br />
fiable la diversité clonale, avec environ 6 à 7<br />
locus. On peut noter que le problème n’est pas<br />
seulement quantitatif (sous estimation <strong>de</strong> la<br />
diversité clonale et non discrimination <strong>de</strong>s lignées<br />
clonales) mais également qualitatif : l’herbier <strong>de</strong><br />
Malte présentait la plus faible diversité<br />
génotypique selon les marqueurs tri-nucléoti<strong>de</strong>s<br />
et est en fait le porteur <strong>de</strong> la plus importante<br />
diversité clonale.<br />
34
Journal of Heredity 2005:96(4):434–440<br />
doi:10.1093/jhered/esi043<br />
Advance Access publication March 2, 2005<br />
ª The American Genetic Association. 2005. All rights reserved.<br />
For Permissions, please email: journals.permissions@oupjournals.org.<br />
Assessing Genetic Diversity in Clonal<br />
Organisms: Low Diversity or Low<br />
Resolution? Combining Power and Cost<br />
Efficiency in Selecting Markers<br />
S. ARNAUD-HAOND, F.ALBERTO, S.TEIXEIRA, G.PROCACCINI, E.A.SERRÃO, AND C. M. DUARTE<br />
From CCMAR, CIMAR—Laboratório Associado, FCMA- Univ. Algarve, Gambelas, P-8005-139, Faro, Portugal<br />
(Arnaud-Haond, Alberto, Teixeira, and Serrão); Instituto Mediterraneo <strong>de</strong> Estudios Avanzados, CSIC-Univ. Illes Balears,<br />
C/ Miquel Marques 21, 07190 Esporles, Mallorca, Spain (Duarte); and Stazione Zoologica ‘‘A. Dohrn,’’ Laboratorio di<br />
Ecologia <strong>de</strong>l Benthos, 80077 Ischia, Naples, Italy (Procaccini).<br />
Address correspon<strong>de</strong>nce to S. Arnaud-Haond at the address above, or e-mail: sarnaud@ualg.pt or eserrao@ualg.pt.<br />
The increasing use of molecular tools to study populations of<br />
clonal organisms leads us to question whether the low<br />
polymorphism found in many studies reflects limited genetic<br />
diversity in populations or the limitations of the markers<br />
used. Here we used microsatellite datasets for two sea grass<br />
species to provi<strong>de</strong> a combinatory statistic, combined with a<br />
likelihood approach to estimate the probability of i<strong>de</strong>ntical<br />
multilocus genotypes (MLGs) to be shared by distinct<br />
individuals, in or<strong>de</strong>r to ascertain the efficiency of the markers<br />
used and to optimize cost-efficiently the choice of markers<br />
to use for <strong>de</strong>riving unbiased estimates of genetic diversity.<br />
These results strongly indicate that conclusions from studies<br />
on clonal organisms <strong>de</strong>rived using markers showing low<br />
polymorphism, including microsatellites, should be reassessed<br />
using appropriate polymorphic markers.<br />
The <strong>de</strong>velopment of molecular techniques over the last<br />
<strong>de</strong>ca<strong>de</strong> has provi<strong>de</strong>d new tools to examine genetic variability<br />
within and among populations (Avise 1989, 1994; Parker<br />
et al. 1998; Sunnucks 2000). However, the efficient use of<br />
new molecular techniques often lags behind their accelerating<br />
<strong>de</strong>velopment (Parker et al. 1998). In a variety of cases,<br />
conclusions previously drawn from the first markers used,<br />
commonly allozymes or random amplified polymorphic<br />
DNA (RAPD), have been significantly revised in light of<br />
results obtained using new markers, either due to evi<strong>de</strong>nce<br />
for selection on some markers, or to very low levels of variability<br />
limiting their ability to estimate population parameters<br />
(Beaumont and Pether 1996; Charlesworth 1998; Lemaire<br />
et al. 2000; Parker et al. 1998; Pogson et al. 1995).<br />
Limited marker resolution becomes even more critical<br />
when studying clonal organisms for which multilocus<br />
genotypes are the only way to discriminate genetically distinct<br />
individuals, such as plants or bacteria (Hagen and Hamrick<br />
1996; Hamrick and Godt 1989). Aquatic plants, many of which<br />
are highly clonal, are particularly prone to erroneous inferences<br />
on the genetic structure of their populations <strong>de</strong>rived from the<br />
use of low-power markers. In<strong>de</strong>ed, initial evi<strong>de</strong>nce based on<br />
allozymes indicated wi<strong>de</strong>spread genetic monomorphism in<br />
submerged plants (Barrett et al. 1993), suggesting a much larger<br />
role for clonal than for sexual propagation. However,<br />
subsequent research using more powerful markers provi<strong>de</strong>d<br />
evi<strong>de</strong>nce of a wi<strong>de</strong>r range of clonal diversity, from apparently<br />
monoclonal meadows (Waycott et al. 1996) to multiclonal and<br />
highly genetically diverse ones (Alberte et al. 1994; Laushman<br />
1993; Reusch et al. 2000; Waycott 1995).<br />
Very low levels of genetic variability have been reported<br />
for the Mediterranean sea grass Posidonia oceanica, inferred to<br />
be highly clonal, both when using allozymes (Capiomont et al.<br />
1996) and RAPD markers (Procaccini et al. 1996; Procaccini<br />
and Mazzella 1996). The recent application of new RAPD<br />
primers (Jover et al. 2003) and of tri- and heptanucleoti<strong>de</strong><br />
microsatellites (Procaccini and Waycott 1998) revealed higher<br />
clonal diversity (Table 1 and Figure 1), suggesting that<br />
previous reports of low genetic variability were largely <strong>de</strong>rived<br />
from the limited power of allozymes and of the first RAPD<br />
markers that were used. Yet the level of genetic variability<br />
revealed by those microsatellites remained low, still suggesting<br />
a predominance of clonal growth in the maintenance of<br />
natural populations (Procaccini et al. 2001). Recently<br />
<strong>de</strong>veloped dinucleoti<strong>de</strong> microsatellites suggested a much<br />
higher level of clonal diversity in the P. oceanica meadow used<br />
to test for polymorphism (Alberto et al. 2003a). The<br />
increasing revelation of the genetic diversity of clonal<br />
organisms, as new tools are introduced, questions the extent<br />
to which inferences <strong>de</strong>rived from any one marker type provi<strong>de</strong><br />
434<br />
35
Brief Communications<br />
Table 1.<br />
Sampling methods applied in the studies of population genetics of P. oceanica using distinct molecular markers<br />
Markers SD N md Md SA L(p)/P A References<br />
Allozymes H 4–51 — — 5000 8(2) 2 Capiomont et al. (1996)<br />
RAPD 1 Lr 16 10 40 — 65(1)/11 1 Procaccini et al. (1996)<br />
RAPD 2 H 9–15 5–10 — — 28(26)/2 2 Jover et al. (2003)<br />
M tc Lr 20–47 5–8 145–232 — 5 4 Procaccini et al. (2001)<br />
M d (popul. 1–4, 8) R 38–50 0.5–1.5 67–79 1600 8 12.5 Present study<br />
(popul. 5–7) Lr 29–40 5–8 145–232 —<br />
Details are given as to the markers used (M tc : tri- and heptanucleoti<strong>de</strong> microsatellites, M d : dinucleoti<strong>de</strong> microsatellites), the sampling <strong>de</strong>sign (SD; Lr: linear<br />
transect with equally spaced sampling points; R: random coordinates in 80 m 3 20 m; H: haphazard sampling), sample size (N), the approximate minimum<br />
and maximum distances (md, Md, respectively) in meters between sampled shoots, as well as the area sampled when nonlinear sampling was used (SA, in<br />
m 2 ), the number of loci (L), and when distinct, the number of polymorphic loci (p) analyzed, or the number of RAPD primers used (P), the average number<br />
of alleles per polymorphic loci (A), and the corresponding references.<br />
reliable accounts of the genetic diversity of these populations<br />
or reflect the limitations of these markers (Reusch 2001).<br />
Here we propose a combined approach using both the<br />
exploration of all marker combinations and the likelihood<br />
probability of i<strong>de</strong>ntical multilocus genotypes (MLGs) to be<br />
shared by distinct individuals to ascertain a priori the <strong>de</strong>pen<strong>de</strong>nce<br />
of the estimates of genetic diversity of clonal organisms on<br />
the number and efficiency of the markers used. This approach<br />
can also be used to optimize, in terms of cost-efficiency, the<br />
choice of markers to <strong>de</strong>rive unbiased estimates of genetic<br />
diversity of the clonal organism studied. We <strong>de</strong>monstrate this<br />
approach using microsatellite markers for two clonal sea grass<br />
species, P. oceanica and Cymodocea nodosa (Alberto et al. 2003a,b).<br />
Materials and Methods<br />
For P. oceanica, approximately 40 shoots were collected from<br />
each of eight localities (Table 2). A portion of each shoot was<br />
<strong>de</strong>siccated and preserved in silica crystals. For C. nodosa, 38<br />
shoots were collected in patches in Alfacs Bay (northern<br />
Spain). A sample of 45 seedlings collected in Cadiz Bay was<br />
used as a control for marker power, since no clonal replicates<br />
are expected in seedlings.<br />
Clonal diversity<br />
0.7<br />
0.6<br />
0.5<br />
0.4<br />
0.3<br />
0.2<br />
0.1<br />
0.0<br />
allozymes RAPD's trinucleoti<strong>de</strong>s dinucleoti<strong>de</strong>s<br />
Figure 1. Estimated levels of clonal diversity (R ¼ G ÿ 1/<br />
N ÿ 1), where G is the number of genotypes and N is the<br />
number of samples analyzed, reported in P. oceanica meadows<br />
with allozymes (A), RAPD (R), tri- and heptanucleoti<strong>de</strong><br />
microsatellites (T), and dinucleoti<strong>de</strong> microsatellites (D).<br />
Genomic DNA was isolated following the CTAB method<br />
(Doyle and Doyle 1988). Samples from eight meadows of<br />
P. oceanica were fully genotyped for four trinucleoti<strong>de</strong>s, one 7-<br />
nucleoti<strong>de</strong> (Procaccini and Waycott 1998), and eight dinucleoti<strong>de</strong>s<br />
(Alberto et al. 2003a) microsatellites. The samples of C.<br />
nodosa were genotyped for 12 dinucleoti<strong>de</strong> microsatellites, as<br />
<strong>de</strong>scribed in Alberto et al. (2003b).<br />
The clonal or genotype diversity is often estimated as P d ¼<br />
G/N, whereG is the number of distinct genotypes i<strong>de</strong>ntified<br />
and N is the number of shoots analyzed. However, for a<br />
monoclonal stand (i.e., with a single genotype), this in<strong>de</strong>x would<br />
indicate a different value of genotypic diversity <strong>de</strong>pending on<br />
the sample size, and thus we chose to modify it slightly by using<br />
R ¼ G ÿ 1/N ÿ 1, which will always be zero for a single clone<br />
stand and one for maximal genotypic diversity, when every<br />
sampled unit is a new genet (Dorken and Eckert 2001). The<br />
in<strong>de</strong>x maintains the same or<strong>de</strong>r of magnitu<strong>de</strong> and can still be<br />
approximately compared with the classical P d values reported in<br />
the literature, although care must still be taken when comparing<br />
values from studies using different sampling <strong>de</strong>signs.<br />
Genotypic diversity as revealed by any possible combinations<br />
of any number of the available markers was then<br />
computed in or<strong>de</strong>r to select the most parsimonious marker<br />
combination allowing efficient discrimination of genets.<br />
Submatrices were produced from the complete genotype<br />
matrix by selecting all combinations C L l of l from the L available<br />
loci (with 1 l L and L ¼ 5 for tri- and heptanucleoti<strong>de</strong>s,<br />
and L ¼ 8 for dinucleoti<strong>de</strong>s). For each rank of l, the average<br />
genotypic diversity R was computed, as well as the standard<br />
error, and the combination of l loci revealing more distinct<br />
genotypes was retained. This exercise was performed using a<br />
routine written in C (Gencount, available from F. Alberto upon<br />
request) on each population and both sets of markers (tri- þ<br />
heptanucleoti<strong>de</strong>s, and dinucleoti<strong>de</strong>s). The curves <strong>de</strong>scribing the<br />
<strong>de</strong>pen<strong>de</strong>nce of the average R (6 SE) on l were drawn and<br />
compared. The minimal combination of l markers allowing the<br />
discrimination of the maximum MLGs with a satisfying<br />
likelihood probability was retained and compared among<br />
populations in or<strong>de</strong>r to find a minimal consensus combination<br />
allowing the discrimination of all MLGs in any population.<br />
In addition, and to test whether all of the samples with<br />
i<strong>de</strong>ntical genotypes belong to the same genet, we used the<br />
round-robin method (Parks and Werth 1993) to estimate allelic<br />
36<br />
435
Journal of Heredity 2005:96(4)<br />
Table 2.<br />
Sampling <strong>de</strong>tails for P. oceanica populations used in this study<br />
Geographic zone (from west to east) Sampling location SD N s N g 5triR 5diR R<br />
Northern Spain Port Lligat R 40 13 0.17 0.24 0.31<br />
Southern Spain Las Rotes R 50 34 0.23 0.58 0.67<br />
Balearic islands (Formentera) Illetes R 36 23 0.22 0.54 0.63<br />
Balearic islands (Formentera) Es Calo <strong>de</strong> Oli R 40 15 0.23 0.34 0.36<br />
Italy (Sar<strong>de</strong>gna) Tavolara Lr 40 20 0.20 0.41 0.49<br />
Italy (southeastern) Otranto Lr 29 24 0.21 0.70 0.82<br />
Malta Malta Lr 39 33 0.14 0.78 0.84<br />
Cyprus Paphos R 38 26 0.21 0.58 0.68<br />
Sampling location, sample size (N s ), sampling <strong>de</strong>sign (SD; Lr: linear transect with equally spaced sampling points; R: random coordinates in 80 m 3 20 m). number<br />
of genotypes (N g ), average clonal diversity with five di- and tri- þ heptanucleoti<strong>de</strong> microsatellites (5 3 R) microsatellites, and with all the eight dinucleoti<strong>de</strong>s (R).<br />
frequencies and genotype probabilities in each population. This<br />
subsampling approach avoids overestimation of rare allele<br />
frequencies by estimating the allelic frequencies for each locus<br />
on the basis of a sample pool composed of all the genotypes<br />
distinguished on the basis of all the loci, except the one being<br />
estimated. This procedure is repeated for all loci, and the<br />
unique genotype probability is then calculated as follows:<br />
p gen<br />
¼ Yl<br />
ð f i Þ2 h ;<br />
i¼1<br />
where l is the number of loci, f i is the frequency in the<br />
population of each allele (two per locus) at the ith locus,<br />
and h is the number of heterozygous loci. When the same<br />
genotype is <strong>de</strong>tected more than once, the probability of these<br />
being <strong>de</strong>rived from distinct reproductive events (i.e., different<br />
genets) can be estimated by the binomial expression<br />
p sex<br />
¼ XN N !<br />
x!ðN ÿ xÞ! 3 ½ p genŠ x 3 ½1 ÿ p gen Š N ÿx ;<br />
x¼n<br />
where N is the number of sampling units and n is the number<br />
of separated fragments with i<strong>de</strong>ntical genotype to a previously<br />
encountered ramet (Parks and Werth 1993; Stenberg et al.<br />
2003; Tibayrenc et al. 1990). In or<strong>de</strong>r to test whether all<br />
replicates of a MLG belong to the same genet, significance<br />
was consi<strong>de</strong>red for P sex from the first re-encounter (n = 1).<br />
In or<strong>de</strong>r to evaluate the importance of somatic<br />
mutations, the frequency distribution of the number of<br />
different alleles between all pairs of MLGs was plotted for<br />
each population.<br />
Results<br />
The analysis of clonal diversity performed on eight P. oceanica<br />
populations with four trinucleoti<strong>de</strong> and one heptanucleoti<strong>de</strong><br />
nuclear microsatellites (Figure 2a) showed low levels of diversity<br />
ranging from 0.14 (Malta) to 0.23 (Formentera Illetas). Much<br />
higher diversity was revealed when using the same number<br />
(five) of dinucleoti<strong>de</strong>s (Figure 2b); the level of diversity<br />
ranged from 0.24 (Port Lligat) to 0.78 (Malta). With all eight<br />
dinucleoti<strong>de</strong> loci, the variability was between 0.31 (Port<br />
Lligat) and 0.84 (Malta). In the same way, the number of<br />
alleles per locus was 3 with the septanucleoti<strong>de</strong>s, approximately<br />
4 with trinucleoti<strong>de</strong>s, and 12.5 with dinucleoti<strong>de</strong>s.<br />
For C. nodosa, all seedlings had different MLGs<br />
(Figure 2c) as expected, whereas lower clonal diversity of<br />
approximately 0.44 was observed for the northern Spain<br />
population. However, both samples reached the maximum<br />
clonal diversity with a minimum combination of four markers.<br />
In all the P. oceanica samples, all i<strong>de</strong>ntical genotypes<br />
i<strong>de</strong>ntified with dinucleoti<strong>de</strong>s were estimated to have a<br />
probability of less than .01 of having originated from two or<br />
more distinct events of sexual reproduction (i.e., distinct<br />
genets), except for three genotype pairs from Paphos and Port<br />
Lligat (where .01 , P sex , .05), whereas this was not the case<br />
for tri- and heptanucleoti<strong>de</strong> microsatellites. In all populations,<br />
some MLGs <strong>de</strong>fined with these last markers showed a higher<br />
probability (P sex . .05), thus indicating that several distinct<br />
individuals may be inclu<strong>de</strong>d in the same MLG groups (data not<br />
shown). In<strong>de</strong>ed, this was confirmed by the discrimination<br />
within those groups of several individuals bearing distinct<br />
MLGs when using dinucleoti<strong>de</strong> microsatellites. In the same<br />
way, the relationship between the number of tri- and<br />
heptanucleoti<strong>de</strong> microsatellites and the apparent genetic<br />
diversity (Figure 2a) indicated that even using the full set<br />
un<strong>de</strong>restimates the genetic diversity of P. oceanica populations.<br />
In contrast, we observed an asymptotic relationship between<br />
the number of dinucleoti<strong>de</strong> markers used and the clonal<br />
diversity revealed by these for most populations of both P.<br />
oceanica and C. nodosa, which reached unity for the C. nodosa<br />
seedlings, as expected (Figure 2). This relationship indicates<br />
that it is possible to select one or several subsets of markers<br />
yielding accurate estimates of clonal diversity for these species.<br />
The optimal combination of markers, leading both to an<br />
asymptotic shape and to low P sex values (,.05), was found to<br />
be, for P. oceanica, a set of seven dinucleoti<strong>de</strong>s, and for C. nodosa,<br />
a set of six dinucleoti<strong>de</strong>s.<br />
Finally, the frequency distribution of the number of<br />
different alleles between all MLG pairs showed unimodal<br />
distributions in all populations, with no apparent trend toward<br />
higher frequency or extra peak at very low values, as might be<br />
expected if somatic mutation was a common event (see the<br />
appendix). The seed sample of C. nodosa can be consi<strong>de</strong>red as a<br />
control distribution in which no somatic mutation should be<br />
expected. Slightly more low values can be observed in P.<br />
oceanica than in C. nodosa, which may be attributed to their<br />
distinct mating system, P. oceanica being monoecious and able<br />
to self-fertilize, whereas C. nodosa is dioecious.<br />
436<br />
37
Brief Communications<br />
a)<br />
Clonal diversity<br />
b)<br />
Clonal diversity<br />
c)<br />
Clonal diversity<br />
0.30<br />
0.25<br />
0.20<br />
0.15<br />
0.10<br />
0.05<br />
0.00<br />
0 1 2 3 4 5 6<br />
Number of loci<br />
1.0<br />
0.8<br />
0.6<br />
0.4<br />
0.2<br />
0.0<br />
0 2 4 6 8 10<br />
Number of loci<br />
1.0<br />
0.8<br />
0.6<br />
0.4<br />
0.2<br />
0.0<br />
0 2 4 6 8 10 12 14<br />
Number of loci<br />
Discussion<br />
Formentera<br />
FECS<br />
PortLigat<br />
Denia<br />
Tavolara<br />
Otranto<br />
Paphos<br />
Malta<br />
Formentera<br />
FECS<br />
PortLigat<br />
Denia<br />
Tavolara<br />
Otranto<br />
Paphos<br />
Malta<br />
Alfacs<br />
Cadiz<br />
Figure 2. Curves <strong>de</strong>scribing the genotypic resolution of<br />
microsatellites with (a) tri- and heptanucleoti<strong>de</strong> and (b)<br />
dinucleoti<strong>de</strong> motifs in P. oceanica, and in (c) C. nodosa, based on<br />
analysis of all possible combinations C l n<br />
of n loci (n ¼ 1,...,l; l ¼<br />
number of loci available), giving the average clonal diversity R<br />
(6SE) for each n. Clonal diversity estimated by R ¼ G ÿ 1/N ÿ<br />
1, where G is the number of genotypes and N is the sample size.<br />
Very different conclusions can be reached concerning the level<br />
of genetic polymorphism, either in terms of alleles or genotypic<br />
diversity, <strong>de</strong>pending on the markers used (Figure 1 and Table 2),<br />
not only between allozymes (R ¼ 0.14) and RAPD (an average of<br />
0.07 in the first study and 0.49 in the second study), but<br />
dinucleoti<strong>de</strong> (0.60) and tri- and heptanucleoti<strong>de</strong> (0.38) microsatellites.<br />
One may be concerned by the influence of distinct<br />
sampling strategies on this result. However, the area sampled for<br />
allozymes studies was larger than for any other studies (Table 1),<br />
which then cannot explain the lowest level of genotypic diversity<br />
observed with those markers. More important, samples collected<br />
from eastern to western Mediterranean localities have common<br />
allozyme MLG profiles. As for studies using RAPD or<br />
microsatellites, the sampling scheme and average distance<br />
between shoots were similar, except in the study with<br />
dinucleoti<strong>de</strong> microsatellites, in which the distance between<br />
shoots was less (Table 1), which would nevertheless tend<br />
to increase the chance to sample shoots from the same clones<br />
and would therefore not cause the higher genotypic diversities<br />
observed here for these markers. However, in the present study,<br />
a very different estimation of R could be <strong>de</strong>rived from analysis of<br />
the same number of markers (five) on the same population<br />
samples with dinucleoti<strong>de</strong> (0.52) and tri- and heptanucleoti<strong>de</strong><br />
(0.20) microsatellites (Figure 2a,b and Table 2).<br />
Reports of limitations linked to microsatellite markers<br />
are more scarce than limitations linked to allozymes or RAPD<br />
(Allendorf and Seeb 2000; Beaumont and Nichols 1996; Parker<br />
et al. 1998). However, different levels of genetic variability<br />
<strong>de</strong>pending on microsatellite motif have been reported in some<br />
eukaryote genomes, and the relative mutation rate of dinucleoti<strong>de</strong>s<br />
versus tri- and heptanucleoti<strong>de</strong>s is estimated to be between<br />
1.5 and 2.1 (An<strong>de</strong>rson et al. 2000; Chakraborty et al. 1997). This is<br />
thought to be due to both the differential mutation rate during<br />
replication and to a higher rate of recombination and consequent<br />
mismatch repair (Chakraborty et al. 1997; Li et al. 2002). The<br />
average number of alleles per locus is a linear function of 4N e l,<br />
where N e is the effective population size and l is the mutation<br />
rate (Kimura 1983). In our study, this number is 2.5 to 3 times<br />
higher for dinucleoti<strong>de</strong>s than for trinucleoti<strong>de</strong>s, instead of 1.5 to<br />
2.1, suggesting a ratio of respective mutation rates (l di /l tri )<br />
somewhat higher than estimated thus far, although this could be<br />
a consequence of variance due to the limited number of<br />
microsatellites used. This mutation rate should lead to careful<br />
screening for possible bias due to somatic mutations at<br />
dinucleoti<strong>de</strong> loci. However, in the present study, the frequency<br />
distribution of the pairwise number of allele differences in all<br />
populations did not show evi<strong>de</strong>nce for a significant bias of<br />
genotypic diversity due to somatic mutations. Although slightly<br />
more low values can be observed in P. oceanica than in C. nodosa,<br />
this may be due to their distinct mating system, P. oceanica being<br />
monoecious and able to self-fertilize, whereas C. nodosa is<br />
dioecious. A higher frequency of related individuals may then be<br />
observed in P. oceanica meadows. Yet no secondary peak toward<br />
very low values was observed, but instead, an unimodal<br />
distribution shape appeared to be the rule.<br />
The perils of drawing inferences on the population<br />
structure of clonal organisms using markers of insufficient<br />
resolution are evi<strong>de</strong>nt when comparing the results obtained<br />
in P. oceanica with different microsatellites. In particular, the<br />
population sampled in Malta exhibited the lowest number of<br />
clones with tri- and heptanucleoti<strong>de</strong>s (R ¼ 0.14), suggesting<br />
this meadow relies on clonal (versus sexual) reproduction<br />
(Table 2 and Figure 2a). However, the population in Malta<br />
clearly emerges as one of the most genetically diverse (R ¼<br />
0.84) when examined with the more powerful dinucleoti<strong>de</strong><br />
microsatellites, suggesting high level of sexual reproduction<br />
in this particular meadow (Table 2 and Figure 2b). Hence the<br />
use of markers of limited power introduces both quantitative<br />
and qualitative errors in assessments of the genetic diversity<br />
of populations of clonal organisms, as not only was clonal<br />
38<br />
437
Journal of Heredity 2005:96(4)<br />
diversity un<strong>de</strong>restimated, but the relative ranking of clonal<br />
diversity among the populations examined was also in error.<br />
The combined method reported here provi<strong>de</strong>s a<br />
convenient method for selecting the best combination of<br />
microsatellites to obtain accurate <strong>de</strong>scriptions of the genetic<br />
diversity of populations of clonal organisms, provi<strong>de</strong>d<br />
sufficient highly polymorphic markers are available. The<br />
results presented confirm the expected asymptotic shape of<br />
the relationship between the number of microsatellites used<br />
and the genetic diversity they reveal (Figure 2b,c), and<br />
<strong>de</strong>monstrate that failure to observe such asymptotic patterns<br />
is indicative of insufficient power (Figure 2a). In addition, all<br />
the calculated probabilities for any pair of i<strong>de</strong>ntical genotypes<br />
to be <strong>de</strong>rived from two distinct events of sexual reproduction<br />
(P sex ) were less than .05, further indicating that unambiguous<br />
estimates of clonal diversity of the meadows examined could<br />
be <strong>de</strong>rived with the markers used. The usefulness of this<br />
combined approach is stressed by the fact that it would have<br />
warned of the likelihood of drawing erroneous inferences on<br />
the population structure of P. oceanica with the use of the<br />
tri- or heptanucleoti<strong>de</strong> markers, where no genotypic diversity<br />
asymptotic value was reached and i<strong>de</strong>ntity probabilities were<br />
not significant for all groups of MLG. The application of the<br />
method to C. nodosa seedlings (Figure 2c), for which the<br />
relationship between the number of microsatellite markers<br />
used and the estimated genetic diversity converged to the<br />
expected asymptotic value of one, further confirms that the<br />
approach provi<strong>de</strong>d here allows assessment of the accuracy of<br />
inferences on the genetic diversity of clonal organisms<br />
<strong>de</strong>rived using different sets of markers.<br />
Although genotyping as many distinct loci as possible<br />
will ensure the maximal genotype diversity of the samples<br />
analyzed, this practice is seldom realistic because of resource<br />
limitations, both time and money. Un<strong>de</strong>r these circumstances,<br />
the procedure can also been used in a pilot study to<br />
select the minimum combination of markers <strong>de</strong>livering<br />
accurate estimates of genetic diversity (i.e., asymptotic values<br />
and significant P sex values), thereby helping to optimize the<br />
cost-efficiency of research efforts in terms of genotyping<br />
and in terms of time and money. The most cost-effective<br />
combinations inclu<strong>de</strong> seven and six markers for P. oceanica<br />
and C. nodosa, respectively.<br />
In conclusion, the results presented here <strong>de</strong>monstrate<br />
the risks of <strong>de</strong>livering quantitatively and qualitatively<br />
erroneous inferences on the genetic diversity of populations<br />
of clonal organisms when the markers available have<br />
insufficient power. These results show that conclusions<br />
about low sexual reproduction in populations of clonal<br />
species <strong>de</strong>rived with the use of markers showing low<br />
polymorphism (i.e., a small number of alleles, or not evenly<br />
distributed) need to be reassessed using markers capable of<br />
revealing the distinct genotypes of the population. The<br />
approach provi<strong>de</strong>d here, applicable to any clonal organism,<br />
allows the combined assessment of the asymptotic trend of<br />
the markers and of the significance of the associated<br />
likelihood probability of i<strong>de</strong>ntity in or<strong>de</strong>r to ascertain the<br />
<strong>de</strong>tection of all distinct genotypes sampled, and thus to<br />
provi<strong>de</strong> accurate estimates of population genetic diversity,<br />
while estimating the most cost-effective combination of<br />
markers to achieve this goal.<br />
Appendix<br />
Frequency distribution of the pairwise number of allele<br />
differences between MLGs in each of eight P. oceanica<br />
samples and in two C. nodosa samples. The x-axis represent<br />
438<br />
39
Brief Communications<br />
the number of allele differences and the y-axis is the<br />
frequency distribution for each x rank.<br />
Acknowledgments<br />
This research was fun<strong>de</strong>d by projects M&Ms (EVK3-CT-2000-00044)<br />
and LIFE-Posidonia (2000/NAT/E/7303) of the European Union. The<br />
European Science Foundation (ESF) and Fundacao para a Ciencia ea<br />
Tecnologia (FCT), Portugal fun<strong>de</strong>d a postdoctoral (to S.A.-H.) and a<br />
doctoral (to F.A.) fellowship. We thank E. Díaz-Almela, R. Santiago-<br />
Doménech, and E. Álvarez-Perez for help with sample collection, and G.<br />
Pearson and three anonymous referees for useful comments on a<br />
preliminary version of this manuscript.<br />
References<br />
Alberte RS, Suba GK, Procaccini G, Zimmerman RC, and Fain SR, 1994.<br />
Assessment of genetic diversity of seagrass populations using DNAfingerprinting—implications<br />
for population stability and management.<br />
Proc Natl Acad Sci USA 91:1049–1053.<br />
Alberto F, Correia L, Arnaud-Haond S, Billot C, Duarte CM, and Serrão E,<br />
2003a. New microsatellites markers for the en<strong>de</strong>mic Mediterranean seagrass<br />
Posidonia oceanica. Mol Ecol Notes 3:253–255.<br />
Alberto F, Correia L, Billot C, Duarte CM, and Serrao E, 2003b. Isolation<br />
and characterization of microsatellite markers for the seagrass Cymodocea<br />
nodosa. Mol Ecol Notes 3:397–399.<br />
Allendorf FW and Seeb LW, 2000. Concordance of genetic divergence<br />
among sockeye salmon populations at allozyme, nuclear DNA, and<br />
mitochondrial DNA markers. Evolution 54:640–651.<br />
An<strong>de</strong>rson TJC, Su XZ, Roddam A, and Day KP, 2000. Complex mutations<br />
in a high proportion of microsatellite loci from the protozoan parasite<br />
Plasmodium falciparum. Mol Ecol 9:1599–1608.<br />
Avise JC, 1989. A role for molecular genetics in the recognition and<br />
conservation of endangered species. Trends Ecol Evol 4:279–281.<br />
Avise JC, 1994. Molecular markers, natural history, and evolution. New<br />
York: Chapman & Hall.<br />
Barrett SCH, Eckert CG, and Husband BC, 1993. Evolutionary processes<br />
in aquatic plant-populations. Aquat Bot 44:105–145.<br />
Beaumont AR and Pether SMJ, 1996. Allozyme variation and gene flow<br />
between cockle Cerasto<strong>de</strong>rma edule populations in southern United Kingdom.<br />
Fish Res 28:263–275.<br />
Beaumont MA and Nichols RA, 1996. Evaluating loci for use in the<br />
genetic analysis of population structure. Proc R Soc Lond B 263:<br />
1619–1626.<br />
40<br />
439
Journal of Heredity 2005:96(4)<br />
Capiomont A, Sandmeier M, Caye G, and Meinesz A, 1996. Enzyme<br />
polymorphism in Posidonia oceanica, a seagrass en<strong>de</strong>mic to the Mediterranean.<br />
Aquat Bot 54:265–277.<br />
Chakraborty R, Kimmel M, Stivers DN, Davison LJ, and Deka R, 1997.<br />
Relative mutation rates at di-, tri-, and tetranucleoti<strong>de</strong> microsatellite loci.<br />
Proc Natl Acad Sci USA 94:1041–1046.<br />
Charlesworth B, 1998. Measure of divergence between populations and the<br />
effects of forces that reduce variability. Mol Biol Evol 15:538–543.<br />
Dorken ME and Eckert CG, 2001. Severely reduced sexual reproduction in<br />
northern populations of a clonal plant, Decodon verticillatus (Lythraceae).<br />
J Ecol 89:339–350.<br />
Doyle JJ and Doyle JL, 1988. Natural interspecific hybridization in eastern<br />
North American Claytonia. Am J Bot 75:1238–1246.<br />
Hagen MJ and Hamrick JL, 1996. Population level processes in<br />
Rhizobium leguminosarum bv trifolii: the role of foun<strong>de</strong>r effects. Mol Ecol<br />
5:707–714.<br />
Hamrick JL and Godt MJW, 1989. Allozyme diversity in plant species. In:<br />
Plant population genetics, breeding and genetic resources (Brown AHD,<br />
Clegg MT, Kahler AL, and Weir BS, eds). Sun<strong>de</strong>rland, MA: Sinauer<br />
Associates.<br />
Jover MA, <strong>de</strong>l Castillo-Agudo L, Garcia-Carrascosa M, and Segura J, 2003.<br />
Random amplified polymorphic DNA assessment of diversity in western<br />
Mediterranean populations of the seagrass Posidonia oceanica. Am J Bot<br />
90:364–369.<br />
Kimura M, 1983. The neutral theory of molecular evolution. Cambridge:<br />
Cambridge University Press.<br />
Laushman RH, 1993. Population-genetics of hydrophilous angiosperms.<br />
Aquat Bot 44:147–158.<br />
Lemaire C, Allegrucci G, Naciri M, Bahri-Sfar L, Kara H, and Bonhomme<br />
F, 2000. Do discrepancies between microsatellites and allozyme variation<br />
reveal differential selection between sea and lagoon in the sea bass<br />
(Dicentrarchus labrax)? Mol Ecol 9:457–468.<br />
Li YC, Korol AB, Fahima T, Beiles A, and Nevo E, 2002. Microsatellites:<br />
genomic distribution, putative functions and mutational mechanisms: a<br />
review. Mol Ecol 11:2453–2465.<br />
Parker PG, Sow AA, Schug MD, Booton GC, and Fuerst PA, 1998. What<br />
molecules can tell us about populations: choosing and using a molecular<br />
marker. Ecology 79:361–382.<br />
Parks JC and Werth CR, 1993. A study of spatial features of clones in a<br />
population of bracken fern, Pteridium aquilinum (Dennstaedtiaceae). Am J<br />
Bot 80:537–544.<br />
Pogson GH, Mesa KA, and Boutilier RG, 1995. Genetic population and<br />
gene flow in the Atlantic cod Gadhus morhua: a comparison of allozyme and<br />
nuclear RFLP loci. Genetics 139:375–385.<br />
Procaccini G, Alberte RS, and Mazzella L, 1996. Genetic structure of the<br />
seagrass Posidonia oceanica in the western Mediterranean: ecological<br />
implications. Mar Ecol Prog Ser 140:153–160.<br />
Procaccini G and Mazzella L, 1996. Genetic variability and reproduction<br />
in two Mediterranean seagrasses In: Seagrass Biology: Proceedings of an<br />
International Workshop, Rottnest Island, Western Australia, January 25–29,<br />
1996. Nedlands, Western Australia: University of Western Australia;<br />
85–92.<br />
Procaccini G, Orsini L, Ruggiero MV, and Scardi M, 2001. Spatial patterns<br />
of genetic diversity in Posidonia oceanica, an en<strong>de</strong>mic Mediterranean seagrass.<br />
Mol Ecol 10:1413–1421.<br />
Procaccini G and Waycott M, 1998. Microsatellite loci i<strong>de</strong>ntified in the<br />
seagrass Posidonia oceanica (L.) Delile. J Hered 89:562–568.<br />
Reusch TBH, 2001. New markers—old questions: population genetics of<br />
seagrasses. Mar Ecol Prog Ser 211:261–274.<br />
Reusch TBH, Stam WT, and Olsen JL, 2000. A microsatellite-based<br />
estimation of clonal diversity and population subdivision in Zostera marina, a<br />
marine flowering plant. Mol Ecol 9:127–140.<br />
Stenberg P, Lundmark M, and Saura A, 2003. MLGsim: a program<br />
for <strong>de</strong>tecting clones using a simulation approach. Mol Ecol Notes 3:<br />
329–331.<br />
Sunnucks P, 2000. Efficient genetic markers for population biology. Trends<br />
Ecol Evol 15:199–203.<br />
Tibayrenc M, Kjellberg F, and Ayala F, 1990. A clonal theory of parasitic<br />
protozoa: the population structures of Entamoeba, Giardia, Leishmania,<br />
Naegleria, Plasmodium, Trichomonas, and Trypanosoma and their<br />
Medical and Taxonomical Consequences. Proc Natl Acad Sci USA 87:<br />
2414–2418.<br />
Waycott M, 1995. Assessment of genetic variation and clonality in the<br />
seagrass Posidonia australis using RAPD and allozyme analysis. Mar Ecol<br />
Prog Ser 116:289–295.<br />
Waycott M, Walker DI, and James SH, 1996. Genetic uniformity in<br />
Amphibolis antarctica, a dioecious seagrass. Heredity 76:578–585.<br />
Received February 16, 2004<br />
Accepted December 15, 2004<br />
Corresponding Editor: James Hamrick<br />
440<br />
41
Sophie ARNAUD-HAOND - Candidature à une Habilitation à Diriger <strong>de</strong>s Recherches, Février 2008<br />
3. Résumé <strong>de</strong>s travaux <strong>de</strong> Recherche<br />
II.2<br />
Within-population spatial genetic structure, neighbourhood size and<br />
clonal subrange in the seagrass Cymodocea nodosa. Molecular Ecology,<br />
2005.<br />
Dans le cadre <strong>de</strong> la thèse <strong>de</strong> Filipe Alberto, l'étu<strong>de</strong> <strong>de</strong> la dispersion clonale<br />
versus sexuée chez Cymodocea nodosa a été réalisée dans <strong>de</strong>s herbiers présentant<br />
<strong>de</strong>s niveaux <strong>de</strong> perturbation contrastés. Nous avons développé et appliqué le<br />
principe <strong>de</strong> clonal subrange (qui corresponds à l’éventail <strong>de</strong>s distances minimales<br />
d’extension clonale) afin d’estimer les distances <strong>de</strong> dispersion par voie clonale<br />
(Figure 8a). Cette métho<strong>de</strong> permet d’obtenir la distribution <strong>de</strong> la probabilité d’i<strong>de</strong>ntité<br />
génétique en fonction <strong>de</strong> la distance, et <strong>de</strong> visualiser la distance maximale observée<br />
entre <strong>de</strong>ux unités d’échantillonnage appartenant à la même lignée clonale.<br />
0.25<br />
0.20<br />
0.15<br />
0.10<br />
0.05<br />
0.00<br />
-0.05<br />
-0.10<br />
○Coancestry (f ij ): ramets<br />
● Coancestry (f ij ): genets<br />
■ Probabilité d’i<strong>de</strong>ntité clonale<br />
5 10 15 20 25 30 35 40<br />
Figure 8: Autocorrélation spatiale et Clonal<br />
subrange : distribution <strong>de</strong>s coefficients <strong>de</strong><br />
parenté sur le jeu <strong>de</strong> données complet<br />
(ramets), ou en excluant les distances entre<br />
réplicats (uniquement entre genets), et<br />
probabilité d’i<strong>de</strong>ntité génotypique/clonale en<br />
fonction <strong>de</strong> la distance entre échantillons.<br />
Logiquement, la probabilité <strong>de</strong>vient nulle à<br />
l’endroit ou les courbes <strong>de</strong> parenté entre<br />
ramets et entre genets convergent.<br />
Nous avons également adapté les métho<strong>de</strong>s classiques d’autocorrélation<br />
spatiale à <strong>de</strong>s jeux <strong>de</strong> données dans lesquels le même ‘individu génétique’ peut<br />
apparaître plusieurs fois sur différentes coordonnées géographiques. Trois<br />
métho<strong>de</strong>s ont testées pour exclure les réplicats et pratiquer les analyses à l’échelle<br />
<strong>de</strong>s genets : choix <strong>de</strong>s coordonnées centrales, choix <strong>de</strong>s plus proches, ou<br />
permutations. L’approche sur permutation, qui permet d’obtenir une enveloppe <strong>de</strong><br />
distribution <strong>de</strong>s coefficients <strong>de</strong> parenté ou distances génétiques versus distance<br />
géographique, nous a paru préférable car elle s’applique sous <strong>de</strong>s conditions moins<br />
restrictives (avec moins d’hypothèses a priori sur la dispersion) que les <strong>de</strong>ux autres.<br />
Nous avons donc choisi cette approche pour estimer les tailles <strong>de</strong> voisinages, bien<br />
que dans le cas <strong>de</strong> la Cymodocée, les résultats se soient avérés i<strong>de</strong>ntiques<br />
qualitativement (significativité du patron) et similaires quantitativement (distance <strong>de</strong><br />
dispersion ou taille <strong>de</strong> voisinage) avec les trois métho<strong>de</strong>s testées.<br />
42
Molecular Ecology (2005) 14, 2669–2681<br />
doi: 10.1111/j.1365-294X.2005.02640.x<br />
Within-population spatial genetic structure, neighbourhood<br />
Blackwell Publishing, Ltd.<br />
size and clonal subrange in the seagrass Cymodocea nodosa<br />
FILIPE ALBERTO,* LICÍNIA GOUVEIA,* SOPHIE ARNAUD-HAOND,* JOSÉ L. PÉREZ-LLORÉNS,†<br />
CARLOS M. DUARTE‡ and ESTER A. SERRÃO*<br />
*CCMAR, CIMAR-Laboratório Associado, University of Algarve, Campus <strong>de</strong> Gambelas, 8005–139 Faro, Portugal, †Area <strong>de</strong> Ecología,<br />
Universidad <strong>de</strong> Cadiz, Facultad <strong>de</strong> Ciencias <strong>de</strong>l Mar y Ambientales, 11510 Puerto Real, Cadiz, Spain, ‡IMEDEA (CSIC-UIB) Instituto<br />
Mediterraneo <strong>de</strong> Estudios Avanzados, C/Miquel Marques 21, 07190 Esporles, Mallorca, Spain<br />
Abstract<br />
The extent of clonality within populations strongly influences their spatial genetic structure<br />
(SGS), yet this is hardly ever thoroughly analysed. We employed spatial autocorrelation<br />
analysis to study effects of sexual and clonal reproduction on dispersal of the dioecious<br />
seagrass Cymodocea nodosa. Analyses were performed both at genet level (i.e. excluding clonal<br />
repeats) and at ramet level. Clonal structure was characterized by the clonal subrange, a<br />
spatial measure of the linear limits where clonality still affects SGS. We show that the<br />
clonal subrange is equivalent to the distance where the probability of clonal i<strong>de</strong>ntity<br />
approaches zero. This combined approach was applied to two meadows with different<br />
levels of disturbance, Cadiz (stable) and Alfacs (disturbed). Genotypic richness, the<br />
proportion of the sample representing distinct genotypes, was mo<strong>de</strong>rate (0.38 Cadiz, 0.46<br />
Alfacs) mostly due to dominance of a few clones. Expected heterozygosities were comparable<br />
to those found in other clonal plants. SGS analyses at the genet level revealed extremely<br />
restricted gene dispersal in Cadiz (Sp = 0.052, a statistic reflecting the <strong>de</strong>crease of pairwise<br />
kinship with distance), the strongest SGS found for seagrass species, comparable only to<br />
values for selfing herbaceous land plants. At Cadiz the clonal subrange exten<strong>de</strong>d across<br />
shorter distances (20–25 m) than in Alfacs (30–35 m). Comparisons of sexual and vegetative<br />
components of gene dispersal suggest that, as a dispersal vector within meadows, clonal<br />
spread is at least as important as sexual reproduction. The restricted dispersal and SGS pattern<br />
in both meadows indicates that the species follows a repeated seedling recruitment<br />
strategy.<br />
Keywords: clonal plant, clonal subrange, Cymodocea nodosa, microsatellites, seagrass, SGS<br />
Received 1 February 2005; revision received 15 April 2005; accepted 6 May 2005<br />
Introduction<br />
Genetic structure can be <strong>de</strong>fined as the <strong>de</strong>velopment of a<br />
nonrandom distribution of alleles at a given spatial scale<br />
resulting from limited dispersal, selection, genetic drift<br />
and population history. An important concept related to<br />
dispersal is isolation by distance, which predicts the expected<br />
pattern of spatial genetic structure (SGS) un<strong>de</strong>r restricted<br />
dispersal and local genetic drift (Vekemans & Hardy 2004).<br />
The amount and scale of gene flow <strong>de</strong>termines the role of<br />
local adaptation and population SGS in the evolutionary<br />
Correspon<strong>de</strong>nce: Ester A. Serrão, Fax: +351 289818353; E-mail:<br />
eserrao@ualg.pt<br />
process (Wright 1977; Fenster et al. 2003). In plants, SGS is<br />
the result of the joint effect of pollen and seed dispersal<br />
and, for the numerous plant species exhibiting clonality, of<br />
the pattern of clonal growth. In<strong>de</strong>ed, clonality is expected<br />
to greatly influence the patterns of SGS, both because of the<br />
expected aggregated distribution of clone mates with an<br />
i<strong>de</strong>ntical genotype, and because clonal growth is also a<br />
component of spatial dispersal (Gliddon et al. 1987). The<br />
strength of the influence of clonality on SGS will <strong>de</strong>pend on<br />
the type and rate of clonal growth (Marbà & Duarte 1998),<br />
intermingling among clones, fragmentation and the lifespan<br />
of the genets. For example if the clone becomes fragmented<br />
and is present at long distances from the initial seedling<br />
germination site, then clonal reproduction increases the<br />
© 2005 Blackwell Publishing Ltd<br />
43
2670 F. ALBERTO ET AL.<br />
genet dispersal (Chung & Epperson 1999, 2000; Chung<br />
et al. 2000). Species or stages that exhibit a ‘guerrilla’ type<br />
of clonal growth (irregular shape and wi<strong>de</strong>spread ramets:<br />
Lovett Doust 1981) are expected to show high clonal intermingling<br />
and dispersal. Conversely, a ‘phalanx’ strategy<br />
(regularly shaped radiating circles of <strong>de</strong>nsely clumped<br />
ramets) will lead to clone mate clustering and consequently<br />
to increased SGS. A key question specific to clonal organisms<br />
is the effect of clonality on SGS, i.e. the i<strong>de</strong>ntification of the<br />
spatial scales over which clonal processes affect the genetic<br />
structure of the population, which we hereafter refer to as<br />
the clonal subrange of the SGS. Despite this, some studies<br />
purposely increase the porosity of the sampling program so<br />
as to avoid any effects of clonality on the resulting <strong>de</strong>piction<br />
of the SGS (i.e. selecting a minimum sampling distance greater<br />
than the expected spread of the clones). This approach<br />
results in loss of information on both the role of clonality as<br />
a driver of SGS, and on the SGS at small spatial scales.<br />
Spatial genetic autocorrelation analysis examines the<br />
genetic relatedness between pairs of individuals with<br />
regard to their relative positions in space (cf. Epperson<br />
2003 and Vekemans & Hardy 2004). Theoretical mo<strong>de</strong>ls of<br />
isolation by distance predict patterns of SGS at drift–<br />
dispersal equilibrium, and recent theoretical and methodological<br />
advances allow new inferences about gene dispersal<br />
and neighbourhood size (Rousset 1997; Hardy & Vekemans<br />
1999; Vekemans & Hardy 2004). For neutral genetic markers<br />
the expected outcome of SGS on spatial autocorrelograms<br />
is a linear <strong>de</strong>crease in the mean genetic kinship coefficient<br />
with the logarithm of spatial distance for two-dimensional<br />
populations. The slope of the regression equation <strong>de</strong>scribing<br />
this <strong>de</strong>cline can be used to estimate SGS parameters<br />
such as gene dispersal and Wright’s ‘neighbourhood size’<br />
(Fenster et al. 2003).<br />
Effective sexual recruitment is the result of pollen and<br />
seed dispersal, seed germination and establishment,<br />
and seedling growth. Recruitment behaviour and genet<br />
dynamics in clonal plants have been <strong>de</strong>scribed in an<br />
i<strong>de</strong>alized and simplified way by Eriksson (1993, 1997) as a<br />
continuum from ‘repeated seedling recruitment’ (RSR)<br />
into adult populations, and unique ‘initial seedling recruitment’<br />
(ISR) at the beginning of population history. In the<br />
RSR strategy seedlings recruit regularly within stands of<br />
established adults, whereas in the ISR strategy they only<br />
establish during the initial colonization period, and further<br />
<strong>de</strong>velopment of the meadow is due to clonal growth (Eriksson<br />
1993, 1997). It has been hypothesized that repeated seedling<br />
recruitment would be more common in clonal marine<br />
plants than in their terrestrial counterparts (Inglis 2000),<br />
since the micro-environment provi<strong>de</strong>d by established<br />
meadows may increase seedling survival (Terrados 1993).<br />
Here we analyse the SGS and clonal structure of a dioecious<br />
seagrass (Cymodocea nodosa) in two meadows by<br />
means of spatial autocorrelation using pairwise kinship<br />
coefficients estimated from microsatellite alleles and four<br />
different methods of analysing the data. Based on C. nodosa<br />
seed morphology and position, we expected sexual dispersal<br />
to be weak and the meadows to exhibit ‘repeated seedling<br />
recruitment’, while the high vegetative growth rate of<br />
this species suggests that clonal propagation should be an<br />
important dispersal vector. Therefore, our objective in the<br />
present study was to analyse the relative importance of<br />
clonal and sexual dispersal. To achieve this, we evaluated<br />
the potential of spatial autocorrelograms to estimate dispersal<br />
parameters such as (i) the neighbourhood size and<br />
gene dispersal, and (ii) the clonal subrange; a measure of<br />
the spatial scale at which the probability of clonal i<strong>de</strong>ntity<br />
is near zero (Harada & Iwasa 1996; Harada et al. 1997),<br />
estimating the spatial range over which clonality directly<br />
affects SGS.<br />
Materials and methods<br />
Mo<strong>de</strong>l species<br />
Cymodocea nodosa (Cymodoceaceae) is a dioecious, rhizomatous<br />
seagrass (Hemminga & Duarte 2000) that exhibits<br />
fast clonal growth, with maximum linear clonal extension<br />
rates in excess of 2 m/year (Duarte & Sand-Jensen 1990). It<br />
occurs throughout the Mediterranean basin and in the<br />
North Atlantic from central Portugal to Cap d’Arguin in<br />
Senegal, as well as in the Canary Archipelago and the Ma<strong>de</strong>ira<br />
Islands. Cymodocea nodosa exhibits basicarpy, producing<br />
two seeds at the base of the female shoots where, in the<br />
absence of disturbance, they remain buried un<strong>de</strong>r the<br />
sediment until germination occurs (Buia & Mazzella 1991).<br />
This suggests highly restricted seed dispersal, and although<br />
there are anecdotal observations of seeds cast upon the<br />
shore and seeds transported by positively buoyant <strong>de</strong>tached<br />
shoots, these mechanisms appear to represent rare dispersal<br />
events. To date, no direct estimates of seed dispersal are<br />
available for this species and the potential for pollen<br />
dispersal remains un<strong>de</strong>termined. While C. nodosa seedlings<br />
have been found at the periphery of established patches,<br />
the probability that they could grow and <strong>de</strong>velop a new<br />
patch is estimated at about 10% (Duarte & Sand-Jensen 1990),<br />
although this figure may be higher insi<strong>de</strong> established<br />
meadows (Terrados 1993).<br />
Study sites and sampling<br />
Two contrasting meadows, separated by over 1000 km<br />
along the Spanish coast, were sampled in June 2003 to<br />
examine the spatial structure of C. nodosa microsatellite<br />
genotypes (see Fig. 1). The Cadiz population occurs on the<br />
southwest margin of the tidal bay of Cadiz in the Atlantic,<br />
where it extends from 0.5 to 3 m water <strong>de</strong>pth. The Alfacs<br />
population grows in the ti<strong>de</strong>less Alfacs Bay in the<br />
© 2005 Blackwell Publishing Ltd, Molecular Ecology, 14, 2669–2681<br />
44
SPATIAL GENETIC STRUCTURE IN CYMODOCEA NODOSA 2671<br />
Fig. 1 Sampling sites of Cymodocea nodosa<br />
for spatial genetic structure analyses.<br />
(A) Alfacs Bay in the Mediterranean coast of<br />
Spain, associated with the Ebro River <strong>de</strong>lta.<br />
(B) Cadiz Bay in the South Atlantic coast of<br />
Spain.<br />
Mediterranean, at 0.5 m <strong>de</strong>pth. The two populations are<br />
also subject to contrasting disturbance regimes: Alfacs Bay<br />
is periodically disturbed by the migration of subaqueous<br />
dunes (Marbà et al. 1994; Marbà & Duarte 1995) and the<br />
local landscape, dominated by C. nodosa patches, is characterized<br />
by an extinction–recolonization balance (Vidondo<br />
et al. 1997). In contrast, in Cadiz Bay the C. nodosa meadows<br />
are continuous and apparently undisturbed.<br />
At each site, sampling was performed along a grid of<br />
20 × 38 m. The internal grid spacing was 2 m yielding a total<br />
of 220 sampling units per population. For each sampling<br />
unit, the meristematic portion of 3–5 shoots, belonging to<br />
the same rhizome/genet, was preserved and dried on<br />
silica crystals before transportation to the laboratory.<br />
Microsatellite genotyping<br />
After DNA extraction (Doyle & Doyle 1988) samples were<br />
genotyped for nine microsatellite loci (Alberto et al. 2003).<br />
Three polymerase chain reaction (PCR) multiplexes with<br />
fluorescently labelled primers (MA, MB and MC) followed<br />
by two electrophoresis multiplexes (MA + MC and MB)<br />
were sufficient to analyse all loci on an ABI 377 automated<br />
sequencer using the genescan software (Applied Biosystems).<br />
Approximately 10 ng of DNA were amplified in a 15-µL<br />
volume, containing 60 µm of each dCTP, dGTP, dATP and<br />
dTTP, 2 mm of MgCl 2<br />
, 200 mm Tris-HCl (pH 8.4), 500 mm<br />
KCl and 1 U Taq DNA polymerase (Invitrogen, Life<br />
Technologies). Each reaction contained one of the following<br />
multiplexes of fluorescently labelled C. nodosa microsatellite<br />
primers: (MA) Cn2–86/6-FAM, Cn2–38/HEX<br />
and Cn2–14/6-FAM; (MB) Cn2–16/HEX, Cn2–18/6-FAM,<br />
Cn4–29/NED and Cn2–45/6-FAM; (MC) Cn2–24/NED<br />
and Cn4–19/NED. Individual primer concentration ranged<br />
from 0.06 to 0.23 µm. Cycling conditions consisted of an<br />
initial <strong>de</strong>naturing step of 4 min at 94 °C, followed by 24<br />
cycles of ‘touchdown’ PCR consisting of 30 s at 94 °C, 30 s<br />
at 55 °C (reduced by 0.2 °C in each subsequent cycle), and<br />
30 s at 72 °C, 10 additional cycles consisting of 30 s at 94 °C,<br />
30 s at 50 °C and 40 s at 72 °C, and a final elongation step<br />
at 72 °C for 10 min.<br />
Clone i<strong>de</strong>ntification<br />
Observed i<strong>de</strong>ntical multilocus genotypes (MLGs) can<br />
either be the result of sampling the same clone/genet at<br />
© 2005 Blackwell Publishing Ltd, Molecular Ecology, 14, 2669–2681<br />
45
2672 F. ALBERTO ET AL.<br />
two different spatial coordinates, or two different genotypes<br />
originated by two distinct sexual reproduction events<br />
but sharing the same alleles for all genotyped loci (Arnaud-<br />
Haond et al. 2005). The probability of encountering the<br />
latter <strong>de</strong>pends on the population frequencies for the alleles<br />
in that genotype and the number of loci used to fingerprint<br />
samples. To address this issue, we estimated the probability<br />
of a given multilocus genotype occurring n times as a<br />
consequence of different sexual reproduction events (P sex<br />
),<br />
according to Parks & Werth (1993). Detailed <strong>de</strong>scription of<br />
P sex<br />
estimation and genet assignment using an appropriate<br />
set of markers is reported elsewhere (Arnaud-Haond et al.<br />
2005). Once clones were i<strong>de</strong>ntified genotypic richness was<br />
estimated for each site according to Dorken & Eckert (2001)<br />
as:<br />
G − 1<br />
R =<br />
N − 1<br />
(eqn 1)<br />
Where G is the number of distinct genotypes and N the<br />
sample size. The distribution of clone size was <strong>de</strong>scribed<br />
using the distance between the farthest clone mates as a<br />
conservative estimate of the linear size of the clone. In<br />
clonal plants this distribution is typically skewed with only<br />
a few clones having large dimensions. Hämmerli & Reusch<br />
(2003a) found for the seagrass Zostera marina that clonal<br />
size increased with heterozygosity, suggesting that more<br />
outbred genets would be better competitors for space<br />
occupation. We examined the hypothesis of a relationship<br />
between genet heterozygosity and clone size (number of<br />
clonal replicates) using a Monte Carlo simulation provi<strong>de</strong>d<br />
by the program clonality version 1 (Prugnolle et al. 2004).<br />
This program tests if MLGs repeated in the sample (i.e.<br />
clonal growth) have an increasing effect on population<br />
heterozygosity, resulting in a <strong>de</strong>crease of the inbreeding<br />
coefficient F IS<br />
. The program first estimates F IS<br />
, using Weir<br />
& Cockerham’s (1984) unbiased estimator f, without removing<br />
repeated MLGs (sample N) and <strong>de</strong>tects how many<br />
MLGs have multiple copies and how many copies for each<br />
of these. It proceeds by reducing the data to a single copy for<br />
each MLG (sample U), and a new sample is then generated<br />
(sample R1) by amplifying randomly chosen genotypes<br />
of sample U so that the sample size and the amount of<br />
repetitions of multilocus genotypes are kept i<strong>de</strong>ntical to<br />
those found in sample N (see Fig. 1, Prugnolle et al. 2004).<br />
The procedure is repeated 5000 times (samples R1 to R5000)<br />
and a corresponding f Ri<br />
is computed each time (f R1<br />
to f R5000<br />
).<br />
A P value is obtained by computing the proportion of<br />
times that f Ri<br />
≤ f.<br />
Population genetic statistics<br />
Allele frequencies, expected heterozygosities (H E<br />
) and<br />
inbreeding coefficients (f ) were estimated using the software<br />
genepop (Raymond & Rousset 1995). Hardy–Weinberg<br />
equilibrium and genotypic linkage disequilibrium (using a<br />
single copy per genet) were tested for each population<br />
using the exact Hardy–Weinberg test (Weir 1990) and the<br />
Fisher exact test, respectively, both available in genepop.<br />
Spatial genetic structure<br />
Two main types of analyses were performed with both data<br />
sets, one with the repetitions of MLGs kept throughout,<br />
and another using a single copy per MLG; they are hereafter<br />
called ramet- and genet-level analyses, respectively. At the<br />
ramet level one tries to characterize the potential amplifying<br />
effects of clonality on SGS, created by the genetic correlation<br />
between clone mate pairs. The genet-level analysis circumvents<br />
the latter problem; however, clonality is a component<br />
of dispersal and so affects the observed SGS pattern even<br />
when repeated MLGs are removed.<br />
The genetic co-ancestry between pairs of individuals can<br />
be summarized over a range of distance intervals in terms<br />
of multilocus estimates of kinship (F ij<br />
). In or<strong>de</strong>r to do so, we<br />
used a kinship coefficient used in Loiselle et al. (1995) and<br />
implemented in the software spagedi (Hardy & Vekemans<br />
2002). Average kinship coefficients were estimated for the<br />
following distance classes: 0–2; 2–4; 4–6; 6–8; 8–10; 10–12;<br />
12–14; 14–16; 16–18; 18–20; 20–25; 25–30 and 30–45 m.<br />
Correlograms were constructed by plotting mean pairwise<br />
kinship coefficients as a function of spatial distance class.<br />
Pairwise kinship coefficients were regressed on the logarithm<br />
of spatial distance to estimate a regression slope (blog).<br />
For each population, spatial locations were randomly<br />
permuted among individuals 10 000 times in or<strong>de</strong>r to test,<br />
for each spatial distance class, whether the observed mean<br />
kinship values were different from those expected un<strong>de</strong>r a<br />
random distribution of genotypes. To test the significance<br />
of the observed SGS pattern, a distribution of regression<br />
slopes was also constructed using a permutation test, and<br />
P values for the observed regression were estimated as the<br />
fraction of this distribution greater than the observed slope<br />
(tests available in spagedi). Ramet- and genet-level analyses<br />
are <strong>de</strong>tailed below.<br />
Ramet-level analysis<br />
Coupled to the traditional ramet-level analyses an additional<br />
method was performed using all sampled ramets but<br />
now consi<strong>de</strong>ring only the kinship values for pairs between<br />
different genets (using the option 4.3.3.5.3, in spagedi<br />
software, where categories correspon<strong>de</strong>d to different clones).<br />
In this analysis all spatial information for a given multisampled<br />
genet is kept since all repetitions from a given<br />
genotype are used, but the potential inflating effect on SGS<br />
produced by clone mate pairs is removed. Hereafter we<br />
will refer to this method as the among-genet analyses.<br />
Where clonal growth results in the spatial clustering of<br />
© 2005 Blackwell Publishing Ltd, Molecular Ecology, 14, 2669–2681<br />
46
SPATIAL GENETIC STRUCTURE IN CYMODOCEA NODOSA 2673<br />
clone mates, the ‘ramet level’ will produce higher kinship<br />
values than the ‘among genet’ within the spatial range<br />
where clone mates are clumped, beyond which both<br />
take similar values. In fact, if we plot both correlograms<br />
together, we show that the point where the two curves<br />
merge is an estimate of the spatial range at which clonality<br />
has non-negligible effects on the SGS, here <strong>de</strong>fined as<br />
clonal subrange. In or<strong>de</strong>r to further illustrate the clonal<br />
subrange we <strong>de</strong>termined the probability of clonal i<strong>de</strong>ntity<br />
(F r<br />
) as a function of spatial distance (Harada & Iwasa 1996).<br />
For that purpose we computed, for a set of distance<br />
intervals, the fraction of pairs of ramets sharing the same<br />
multilocus genotype. The values were plotted on top of<br />
the above-<strong>de</strong>scribed autocorrelogram. This analysis was<br />
performed using an r 1.6.1 (The r Development Core<br />
Team, 2002) co<strong>de</strong>.<br />
Genet-level analysis<br />
SGS was characterized after removing clonal replicates<br />
from the data set and consi<strong>de</strong>ring the central coordinates of<br />
each clone (average of x and y coordinates of clone mates).<br />
Using a genet’s central coordinates for its spatial representation<br />
can be justified as this point is the most parsimonious<br />
position of the clone’s birthplace. However this assumes<br />
isotropic growth and no disturbance causing loss of a<br />
sector of the clone. The first assumption is not supported<br />
by available information that shows that the origin of the<br />
patch/clone is always displaced relative to the geometric<br />
centre (Duarte & Sand-Jensen 1990; Vidondo et al. 1997). A<br />
resampling technique was used to analyse the variance<br />
in the estimates resulting from the selection of different<br />
spatial coordinates to represent the clone. A random<br />
representative ramet from each genotype repeated in the<br />
sample was resampled to create a matrix with a single copy<br />
of each genet, the procedure was repeated 100 times to<br />
estimate the dispersion of the estimates. The proportion of<br />
these 100 data sets yielding significant mean kinship values<br />
for the first distance class and/or significant regression<br />
slopes was recor<strong>de</strong>d.<br />
Indirect estimation of dispersal, and neighbourhood<br />
size<br />
The intersection between the correlogram curve and the<br />
x-axis of the plot is often consi<strong>de</strong>red as an estimate of the<br />
distance within which individuals reproduce with their<br />
close relatives, or the radius of a patch (Epperson 2003).<br />
However, this method is highly <strong>de</strong>pen<strong>de</strong>nt on the spatial<br />
scale of sampling (Fenster et al. 2003). Thus, we rather<br />
estimated the neighbourhood size (Nb), the number of<br />
individuals that characterize the strength of genetic drift in<br />
the population (Vekemans & Hardy 2004). A re<strong>de</strong>finition<br />
of the concept is proposed by Fenster et al. (2003), <strong>de</strong>fining<br />
neighbourhood area as a circular area containing such Nb<br />
individuals, within which biparental inbreeding remains<br />
insignificant. If the SGS pattern is produced by an isolationby-distance<br />
process, at drift–dispersal equilibrium in a<br />
two-dimensional space, Nb can be estimated from blog<br />
and is equal to –(1 – F (1)<br />
)/blog (Hardy & Vekemans 1999;<br />
Fenster et al. 2003), where F 1<br />
is the average F ij<br />
between<br />
individuals belonging to the first distance class (here F 1<br />
=<br />
F [2m]<br />
). However, un<strong>de</strong>r the above-mentioned conditions,<br />
kinship is expected to <strong>de</strong>crease linearly with the logarithm<br />
of spatial distance for a restricted range (σ to 20σ, where σ<br />
is the axial standard <strong>de</strong>viation of gene dispersal distances;<br />
Rousset 1997). As σ is unknown, an iterative approach<br />
available in spagedi was used to estimate blog using the<br />
observed genotype <strong>de</strong>nsity as the effective population<br />
<strong>de</strong>nsity (D). The neighbourhood area was calculated as<br />
the surface that would contain the Nb individuals for<br />
each population. Because blog <strong>de</strong>pends to some extent<br />
on the sampling scale used and it is negative, we also<br />
estimated the Sp statistic which absolute value reflects<br />
the rate of <strong>de</strong>crease of pairwise kinship with distance<br />
(Vekemans & Hardy 2004). This allowed us to compare<br />
the SGS pattern in C. nodosa with the strength of patterns<br />
observed among other species. The Sp statistic is equal to<br />
–blog/(1 – F (1)<br />
).<br />
Finally we evaluated the relative importance of clonal<br />
growth and sexual reproduction to gene dispersal. First we<br />
computed the axial variance of gene dispersal mediated by<br />
clonal growth σ2<br />
veg<br />
(Gliddon et al. 1987), as one-half the<br />
mean squared distance between a ramet and the central<br />
coordinates of the clone to which it belongs. To calculate<br />
σ2<br />
veg<br />
, we used all sampled genets, not only those that had<br />
more than one ramet sampled, and in or<strong>de</strong>r to do so an<br />
arbitrary distance of 1 m (half the minimum distance<br />
between consecutive sample units) was consi<strong>de</strong>red for<br />
genets which appeared only once in the sample. Then we<br />
applied the Gliddon et al. (1987) mo<strong>de</strong>l of parent–offspring<br />
dispersal variance (σ 2 ):<br />
1<br />
σ = σ + σ + σ ⇔ σ = σ + σ<br />
2<br />
2 2 2 2 2 2 2<br />
p s veg sex veg<br />
(eqn 2)<br />
where σ2 p<br />
is the pollen dispersal variance and σ2<br />
s<br />
the seed<br />
dispersal variance and consequently the sexual mediated<br />
dispersal variance is σ2 sex<br />
= 12 / σ2 p<br />
+ σ2<br />
s. The genet-level<br />
SGS-based estimate of Nb (see above) is also a function of<br />
the sexual and vegetative components of dispersal variance<br />
and can be used to estimate the total variance σ 2 = Nb/4πD.<br />
An estimate of σ2<br />
sex<br />
can then be obtained by subtracting<br />
from σ 2 the above-estimated<br />
2<br />
.<br />
σ veg<br />
Scoring errors and/or somatic mutations effects on SGS<br />
We evaluated the potential bias caused by scoring errors or<br />
somatic mutations, on the strength of positive autocorrelation<br />
© 2005 Blackwell Publishing Ltd, Molecular Ecology, 14, 2669–2681<br />
47
2674 F. ALBERTO ET AL.<br />
at smaller distance classes. This problem can arise if clone<br />
mates are erroneously assigned as different, thus being<br />
inclu<strong>de</strong>d in the analyses where clonal repeats are exclu<strong>de</strong>d.<br />
We produced an r 1.6.1 (The r Development Core Team,<br />
2002) routine to <strong>de</strong>tect which pairs differ by only a single<br />
allele while being neighbours in the 2-m sampling scale.<br />
When such pairs were found the smaller genet was removed<br />
from the data set as a potential source of error. A total of<br />
18 genotypes in Cadiz and 14 genotypes in Alfacs were<br />
removed. Separate analysis after the exclusion of these<br />
genotypes did not differ from those with the complete<br />
data set.<br />
Results<br />
Genotypic richness and clonal structure<br />
The number of alleles amplified was 41 and 39, and a total<br />
of 83 and 95 different microsatellite multilocus genotypes<br />
(MLG) were i<strong>de</strong>ntified for Cadiz Bay and Alfacs Bay,<br />
respectively. All repetitions of the same MLG, for all MLGs<br />
observed in more than one sample unit, had P sex<br />
values < 0.05<br />
and so were consi<strong>de</strong>red to result from repeated sampling<br />
of the same clone. Therefore, the number of different MLGs<br />
found corresponds to the number of clones present in our<br />
samples. The spatial organization of clonal repetitions<br />
(Fig. 2) shows that both meadows were dominated by a<br />
few large clones, which appeared aggregated in space. In<br />
Cadiz Bay and Alfacs Bay, respectively, only four and two<br />
clones had more than 10 repeats (representing 41% and<br />
33% of the 220 sampled shoots) and only 24 and 18 clones<br />
appeared more than once (70% and 57% of the sampled<br />
shoots). This resulted in an extremely skewed distribution<br />
of clone size, as observed by the distribution of the linear<br />
dimension of the clones (Fig. 3), with a median clonal<br />
dimension of 3.6 m and 3.4 m in Cadiz Bay and Alfacs Bay,<br />
respectively. Genotypic richness was below 0.5 for both<br />
meadows, although Alfacs Bay showed higher levels<br />
(0.46) than Cadiz Bay (0.38). The highly skewed clone size<br />
distribution, and the low number of clones with more than<br />
one observation, indicate that this mo<strong>de</strong>rate genotypic<br />
richness is the result of the dominance of a few, large<br />
Fig. 2 Sampling grids of Cymodocea nodosa in<br />
Cadiz Bay and Alfacs Bay. The minimum<br />
distance between consecutive sampling points<br />
was 2 m. The numbers shown co<strong>de</strong> the different<br />
genets; different patterns are used to<br />
represent each of the clones with more than<br />
one copy. Some sampling sites had no cover;<br />
these are represented by blank grid units.<br />
© 2005 Blackwell Publishing Ltd, Molecular Ecology, 14, 2669–2681<br />
48
SPATIAL GENETIC STRUCTURE IN CYMODOCEA NODOSA 2675<br />
Fig. 3 Distribution of the linear dimensions<br />
of Cymodocea nodosa clones for Cadiz Bay<br />
and Alfacs Bay. The linear dimension is the<br />
minimum clone size estimated as the distance<br />
between the farthest clonemates.<br />
Table 1 Number of alleles (Na), expected heterozygosity (H E<br />
) and inbreeding coefficient (F IS<br />
) for genet-level analysis and ramet-level<br />
analysis of Cymodocea nodosa at Cadiz Bay and Alfacs Bay. Significant <strong>de</strong>partures from the null hypothesis of Hardy–Weinberg equilibrium<br />
are co<strong>de</strong>d: ***P < 0.001; **0.001 < P < 0.01; and *0.01 < P < 0.05<br />
Cadiz Bay<br />
Alfacs Bay<br />
Loci<br />
Na<br />
Genet level Ramet level Genet level Ramet level<br />
H E<br />
F IS<br />
H E<br />
F IS<br />
Na H E<br />
F IS<br />
H E<br />
F IS<br />
Cn2–86 4 0.748 −0.220*** 0.736 −0.281*** 6 0.748 −0.022** 0.730 −0.172***<br />
Cn2–38 5 0.611 −0.046 0.572 −0.101* 4 0.485 −0.016 0.486 −0.142<br />
Cn2–14 3 0.498 −0.477*** 0.482 −0.548*** 4 0.617 0.015 0.576 −0.135**<br />
Cn2–24 10 0.787 0.249*** 0.819 0.152*** 5 0.380 −0.187 0.451 −0.286***<br />
Cn4–19 5 0.456 0.040 0.472 0.170*** 6 0.652 0.005* 0.632 −0.166***<br />
Cn2–16 3 0.523 −0.110 0.508 0.047 2 0.259 0.475*** 0.174 0.350***<br />
Cn2–18 3 0.447 −0.219 0.480 −0.331*** 2 0.478 −0.162 0.478 −0.421***<br />
Cn4–29 3 0.498 −0.357*** 0.516 −0.356*** 6 0.524 −0.120 0.496 −0.009***<br />
Cn2–45 5 0.666 −0.191 0.664 −0.172*** 4 0.662 −0.251*** 0.646 −0.419***<br />
Multilocus 41 0.582 −0.129*** 0.583 −0.144*** 39 0.534 −0.064*** 0.519 −0.197***<br />
clones, <strong>de</strong>spite the presence of many unique clones in the<br />
samples.<br />
Heterozygote excess<br />
Both meadows showed significant heterozygote excesses<br />
before and after clonal replicates were removed (all P <<br />
0.001) although the F IS<br />
values were higher for the latter<br />
analysis (Table 1). We did not find any significant association<br />
between clone size and heterozygosity, P = 0.58 and P =<br />
0.07 for Cadiz and Alfacs, respectively. When testing<br />
for genotypic linkage disequilibrium, and after applying<br />
Bonferroni correction, only nine (Cadiz) and six (Alfacs)<br />
pairs of loci, from a total of 36 pairs, rejected the null<br />
hypothesis of genotypes at one locus being in<strong>de</strong>pen<strong>de</strong>nt<br />
from genotypes at the other locus. The pairs of loci involved<br />
were not consistent across the two sites.<br />
Ramet-level analysis and clonal subrange<br />
Clonal structure was characterized by analysing the spatial<br />
autocorrelation of microsatellite genotypes using the<br />
kinship coefficient (F ij<br />
) at the ramet and among genet<br />
levels. The distance class where these correlograms merge<br />
(see Fig. 4) represents the clonal subrange, the distance<br />
range beyond which clonality has negligible effects on<br />
genetic structure, as less than 1% of the pairs are clonal.<br />
For Cadiz, the clonal subrange exten<strong>de</strong>d across shorter<br />
distances (20–25 m) than it did in Alfacs Bay (30–35 m).<br />
The probability of clonal i<strong>de</strong>ntity (F r<br />
), plotted on Fig. 4,<br />
<strong>de</strong>clined with increasing distance, from around 25% for<br />
both meadows in the first distance class (2 m) to reach zero<br />
and 2.5% at 30 m in Cadiz and Alfacs, respectively. At<br />
the point where the ramet level and among genets level<br />
correlograms merge, F r<br />
takes values lower than 1% (as less<br />
© 2005 Blackwell Publishing Ltd, Molecular Ecology, 14, 2669–2681<br />
49
2676 F. ALBERTO ET AL.<br />
Alfacs (F (2,m)<br />
= 0.021; P > 0.05). Yet for the random selection<br />
method 100 and 68 of the 100 generated data sets had<br />
positive significant F (2,m)<br />
values for Cadiz [F (2,m)<br />
± SE (over<br />
100 data sets) = 0.089 ± 9 × 10 −3 ] and Alfacs [F (2,m)<br />
± SE<br />
(over 100 data sets) = 0.029 ± 4 × 10 −3 ], respectively.<br />
Within the sampled range, the average kinship coefficients<br />
between pairs of individuals <strong>de</strong>clined linearly with<br />
the increasing logarithm of the spatial distance (Table 2)<br />
and there was a significant SGS pattern (all slope tests were<br />
significant, see Table 2 and Fig. 5). The steeper regression<br />
slopes (blog) for Cadiz Bay (−0.044; P < 0.001), than for<br />
Alfacs (−0.012 to −0.014; P < 0.001), resulted in smaller Nb<br />
estimates and a stronger Sp statistic in Cadiz (Table 2). The<br />
estimated vegetative component of gene dispersal σ2<br />
veg<br />
was<br />
10.9 and 17.6 in Cadiz Bay and Alfacs Bay, respectively.<br />
The sexual component of dispersal ( σ2<br />
sex<br />
) estimated on the<br />
basis of those values was consequently lower in Cadiz (7.1)<br />
than in Alfacs (20.5). Finally, the relative importance of the<br />
sexual and vegetative components of gene dispersal,<br />
<strong>de</strong>scribed by the ratio σ2 sex<br />
/ σ2<br />
veg<br />
, was 0.65 in Cadiz and 1.16<br />
in Alfacs.<br />
Discussion<br />
Spatial genetic structure and sexual reproduction<br />
Fig. 4 Analysis of Cymodocea nodosa clonal structure by means of<br />
spatial autocorrelation analysis of kinship coefficients for Cadiz<br />
Bay and Alfacs Bay. Three distinct analyses were used: (i) a rametlevel<br />
analysis which inclu<strong>de</strong>s all ramets sampled; (ii) an amonggenet<br />
analysis, where only pairs between different genets are<br />
allowed (see Methods); and (iii) the probability of clonal i<strong>de</strong>ntity.<br />
The spatial distance where the ramet-level and among-genet<br />
correlograms merge corresponds to a probability of clonal i<strong>de</strong>ntity<br />
close to zero and estimates the radius of the clonal subrange.<br />
than 1% of the pairs at that distance interval share the same<br />
genotype). These distances correspond to the dimensions<br />
of the largest clones found in each of the populations<br />
(Fig. 3).<br />
Genet-level analysis and indirect dispersal estimates<br />
A summary of results from the autocorrelation of genetic<br />
variation using kinship coefficients and different methods<br />
of data analysis is presented in Table 2. The coefficient<br />
estimates from the ramet and among genets levels are presented<br />
only for comparison with the genet-level estimates.<br />
Ramet-level estimates are higher due to the correlations<br />
between clone mates. When the central method was used<br />
to represent the spatial coordinates of the clones the average<br />
kinship coefficient was significantly positive at the first<br />
distance class for Cadiz (F (2,m)<br />
= 0.119; P < 0.001) but not for<br />
The pronounced SGS observed in Cadiz suggests extremely<br />
limited dispersal for Cymodocea nodosa in that bay. This<br />
pattern is the strongest observed so far for any seagrass<br />
species (Reusch et al. 1999a; Hämmerli & Reusch 2003b)<br />
and the Sp values found here are among the strongest<br />
patterns reported for land plants, observed in selfing<br />
herbaceous species (Caujapé-Castells & Pedrola-Monfort<br />
1997; Bonin et al. 2001; review in Vekemans & Hardy 2004).<br />
Yet, un<strong>de</strong>r equal seed dispersal, dioecious species such as<br />
C. nodosa are expected to show lower SGS than selfing<br />
species, because of pollen flow (Vekemans & Hardy 2004).<br />
Seed dispersal in C. nodosa is expected to be limited as<br />
a consequence of seed size (Eriksson 1997; Inglis 2000),<br />
negative buoyancy, position at the base of the shoot buried<br />
in the sediment (Buia & Mazzella 1991), and association<br />
with female plants (Caye & Meinesz 1985). Nevertheless,<br />
the strong SGS observed here may also be related to<br />
limited pollen dispersal. Restricted pollen dispersal has<br />
been suggested from the observation that the abundance<br />
of seed production is related to the proximity of male to<br />
female plants in the seagrass beds (Caye & Meinesz 1985),<br />
although the authors did not quantify the spatial scale<br />
of this observation. Terrados (1993) did not <strong>de</strong>tect pollen<br />
limitation, although this was only over distances of less<br />
than 0.5 m.<br />
The weaker SGS pattern observed in Alfacs may be<br />
partially explained by the different disturbance regimes<br />
affecting both sites. The mo<strong>de</strong>l used to estimate dispersal<br />
© 2005 Blackwell Publishing Ltd, Molecular Ecology, 14, 2669–2681<br />
50
SPATIAL GENETIC STRUCTURE IN CYMODOCEA NODOSA 2677<br />
Table 2 Summary of kinship autocorrelation in two Cymodocea nodosa meadows using different methods of analysing a data set from a<br />
clonal organism (see methods). Mean F ij<br />
kinship values found for the shortest distance interval (F (2,m)<br />
). The slope of the regression of mean<br />
kinship with the logarithm of spatial distance (blog) and the Sp statistic with the jackknife estimated standard error (Sp). Finally the<br />
estimated neighbourhood size (Nb) and the area containing such number of individuals based on the observed genet <strong>de</strong>nsity in each<br />
meadow. Nb values for the genet-level (central) analysis are estimated using an iterative procedure (see methods). Significant values of<br />
F (2,m)<br />
, blog and Sp are shown in bold (α = 0.025). For the random method (last row) standard errors are given based on the distribution of<br />
parameters obtained after analysing 100 of these data sets<br />
Method F (2,m)<br />
blog Sp (SE) Nb Area m 2 (radius m)<br />
Cadiz Bay<br />
Ramet level 0.133 −0.083 0.096 ± 0.022 10.4 101 (5.7)<br />
Among gemet 0.051 −0.049 0.052 ± 0.020 19.4 187 (7.7)<br />
Genet level (central) 0.119 −0.044 0.052 ± 0.016 23.5 226 (8.5)<br />
Genet level (random) 0.089 ± 9 × 10 −3 −0.044 ± 1 × 10 −3 0.048 ± 2 × 10 −3 19.8 ± 0.8 191 ± 6 (7.8 ± 0.2)<br />
Alfacs Bay<br />
Ramet level 0.094 −0.044 0.050 ± 0.007 20.6 198 (7.9)<br />
Among gemet 0.030 −0.024 0.025 ± 0.008 40.4 390 (11.1)<br />
Genet level (central) 0.021 −0.014 0.015 ± 0.004 56.8 548 (13.2)<br />
Genet level (random) 0.029 ± 4 × 10 −3 −0.012 ± 0.000 0.012 ± 0.000 80.9 ± 4.15 780 ± 40 (15.8 ± 0.5)<br />
Fig. 5 Genet-level analysis correlogram<br />
showing mean kinship coefficients (circles)<br />
between individual Cymodocea nodosa genets<br />
as a function of spatial distance at Cadiz<br />
Bay and Alfacs Bay. The first row shows the<br />
correlogram produced when central coordinates<br />
were used to represent the spatial<br />
coordinates of the genet. Broken lines<br />
<strong>de</strong>limit 95% confi<strong>de</strong>nce intervals around<br />
the null hypothesis of random distribution<br />
of genets in space. In the second row the<br />
correlograms (continuous line) are based<br />
on the mean kinship coefficients found<br />
after 100 data files were analysed, each<br />
containing a single randomly selected ramet<br />
for each genotype. Dotted lines <strong>de</strong>limit<br />
the maximum and minimum values found.<br />
This procedure generates confi<strong>de</strong>nce intervals<br />
for the kinship and dispersal estimators.<br />
assumes that the SGS has reached a stationary phase<br />
representative of the drift–dispersal equilibrium (Rousset<br />
1997; Vekemans & Hardy 2004), whereas the periodical<br />
disturbance imposed by the migration of a subaqueous<br />
dune (Marbà et al. 1994; Marbà & Duarte 1995) can prevent<br />
the population from reaching the required equilibrium<br />
state. An SGS pattern takes several generations to <strong>de</strong>velop<br />
<strong>de</strong>pending on the scale of analyses. In Alfacs Bay this is by<br />
far longer than the disturbance period (Marbá et al. 1994;<br />
Marbá & Duarte 1995) suggesting that the SGS pattern<br />
observed could be a transient one. The analysis of the<br />
shape of the correlogram, at a spatial scale smaller than the<br />
axial standard <strong>de</strong>viation of gene dispersal distances (σ),<br />
can provi<strong>de</strong> information about the relative contributions<br />
of seeds and pollen to the overall level of gene dispersal<br />
(Heuertz et al. 2003; Vekemans & Hardy 2004). In our case<br />
the initial curvature in Alfacs (downward concave form)<br />
suggests a more important contribution of seed dispersal<br />
than in Cadiz; this should be the most likely scenario if<br />
disturbance cleared space facilitating seed dispersal along<br />
the sediment surface. Another consequence of disturbance<br />
and higher population turnover should be a younger<br />
© 2005 Blackwell Publishing Ltd, Molecular Ecology, 14, 2669–2681<br />
51
2678 F. ALBERTO ET AL.<br />
meadow age. Both arguments could explain a weak SGS<br />
pattern, still influenced by foun<strong>de</strong>r events, such as observed<br />
here for Alfacs Bay.<br />
Although a few genets dominated the studied meadows,<br />
the majority of the genets, in both sites, appeared only<br />
once. This high frequency of young genets suggests that<br />
both meadows are characterized by successful sexual<br />
reproduction and low probability of young genets to grow<br />
to ol<strong>de</strong>r/larger clones. However, genotypic richness (R),<br />
which provi<strong>de</strong>s an estimation of the balance of sexual and<br />
clonal reproduction over several generations, was only<br />
mo<strong>de</strong>rate due to the presence of a few dominant clones,<br />
although equivalent to what has been found for other<br />
clonal plants (Ellstrand & Roose 1987). Nevertheless our<br />
results clearly suggest that, for the analysed meadows,<br />
sexual reproduction is an important means of population<br />
recruitment for C. nodosa. It is important, however, to keep<br />
in mind that seagrass populations can show a wi<strong>de</strong> range<br />
of genotypic richness levels, from monoclonal stands (e.g.<br />
Waycott et al. 1996; Reusch et al. 1999b; Alberto et al. 2001;<br />
Billingham et al. 2003) to highly diverse ones (e.g. Procaccini<br />
& Mazzella 1996; Reusch et al. 2000; Coyer et al. 2004;<br />
Arnaud-Haond et al. 2005).<br />
Consi<strong>de</strong>red together our findings of restricted dispersal,<br />
successful sexual recruitment, and skewed genet size<br />
distribution suggest that sexual recruitment in C. nodosa is<br />
more important at the local meadow scale than on an intermeadow<br />
scale. This type of life history trait has been referred<br />
to as repeated seedling recruitment (RSR in Eriksson 1993)<br />
and has been reported for other plant species (Auge &<br />
Brandl 1997; Suzuki et al. 1999; Stehlik & Hol<strong>de</strong>regger 2000;<br />
Auge et al. 2001; Shimizu et al. 2002; Ziegenhagen et al.<br />
2003). Seeds lacking specialized dispersal traits are expected<br />
to exhibit a greater competitive ability than seeds with<br />
higher dispersal capacity (Eriksson 1997), as they may<br />
un<strong>de</strong>rgo selection resulting from intraspecific competition<br />
in a crow<strong>de</strong>d environment. If the population shows some<br />
level of biparental inbreeding, the most homozygous<br />
seedlings might be affected by some level of inbreeding<br />
<strong>de</strong>pression influencing the growth traits relevant for<br />
space competition in <strong>de</strong>nse seagrass stands. Evi<strong>de</strong>nce for<br />
inbreeding <strong>de</strong>pression affecting clonal growth has been<br />
reported for the seagrass Zostera marina (Hämmerli &<br />
Reusch 2003a). Such processes may partly explain the<br />
observed heterozygosity excess in both meadows, which<br />
persisted even when the clonal replicates were removed<br />
from the data set (Table 1). The initial seedling growth<br />
stage corresponds to the most important bottleneck for<br />
clonal patch <strong>de</strong>velopment, characterized by high seedling<br />
mortality (80–90% annually, Duarte & Sand-Jensen 1990,<br />
1996) and where only half of the clone patches survive<br />
longer than 0.8 year (Vidondo et al. 1997). Even though we<br />
did not find any association between clone size and heterozygosity,<br />
our sampling did not cover the complete size<br />
spectra of C. nodosa clones. It is thus possible that significant<br />
relationships between individual heterozygosity and<br />
the capacity to initiate patch growth would be observed<br />
had we sampled seedlings in the initial growth stages.<br />
Such a selection hypothesis awaits support by further<br />
investigation, but it is interesting to note that we have not<br />
observed heterozygote excess in young seedlings (less than<br />
1 year old) from Cadiz Bay, analysed with the same microsatellite<br />
markers (Alberto et al. 2003).<br />
Clonal structure and subrange<br />
The spatial organization of C. nodosa clones found here<br />
(Fig. 2) reveals that clonal replicates tend to aggregate in<br />
space. Recently, Sintes et al. (2004) used a clonal growth<br />
mo<strong>de</strong>l to follow the colonization of space by a single<br />
<strong>de</strong>veloping C. nodosa clone. These authors showed that<br />
the growing network is characterized by a guerrilla-type<br />
growth in the initial colonization phase, but later on, and<br />
merely due to simple clonal growth rules (rhizome elongation,<br />
rhizome branching rate, branching angle and spacer length<br />
between consecutive shoots), the clone becomes compacted<br />
and circular (4–5 years of age) and changes to a growth<br />
mo<strong>de</strong>l typical of compact structures. The aggregation of<br />
clonal replicates found for the ol<strong>de</strong>r/larger clones in this<br />
study validates the predictions of the Sintes et al. (2004)<br />
mo<strong>de</strong>l for natural meadows composed of several growing<br />
clones, although most genets found here are still small<br />
clones in the early growth phases. This highly skewed<br />
clone size distribution indicates again high mortality at the<br />
early growth phases, a type of structure often found for<br />
clonal plants (Chung & Epperson 1999, 2000; Herben et al.<br />
2002). At the periphery of larger clones there were smaller,<br />
apparently fragmented, groups of additional clonal<br />
replicates, perhaps produced by the <strong>de</strong>cay of the rhizome<br />
connections. It is likely that through this process ol<strong>de</strong>r<br />
compacted clones give rise to smaller clonally integrated<br />
units, in<strong>de</strong>pen<strong>de</strong>nt of the ol<strong>de</strong>r/larger original clone.<br />
Alternatively the apparent fragmentation of large clones<br />
could simply be due to clone intermingling, as in this study<br />
the spatial scale is not totally suitable to disentangle genetic<br />
diversity at scales smaller than 2 m.<br />
We have here implemented an original method based on<br />
spatial autocorrelation to study the effects of clonality on<br />
the SGS pattern. This approach was based on pairwise kinship<br />
coefficients estimated for the data set containing all<br />
sampled individuals, analysed in two different ways; consi<strong>de</strong>ring<br />
all possible pairs and only the among-genet pairs.<br />
We show that the point where the two resulting correlograms<br />
merge (Fig. 4) is equivalent to a probability of clonal<br />
i<strong>de</strong>ntity (probability of sampling the same clone at a certain<br />
spatial distance) close to zero, termed the clonal subrange.<br />
Such characterization of the clonal subrange can also be<br />
used to select a minimum distance between adjacent<br />
© 2005 Blackwell Publishing Ltd, Molecular Ecology, 14, 2669–2681<br />
52
SPATIAL GENETIC STRUCTURE IN CYMODOCEA NODOSA 2679<br />
samples when the objective is to maximize the genotypic<br />
richness in a given sample or to estimate parameters that<br />
require removal of clonal replicates. For the meadows analysed,<br />
the probability of sampling the same clone <strong>de</strong>clined<br />
to zero at 30 m in Cadiz whereas in Alfacs it was still 2.5%<br />
at that distance.<br />
Indirect estimation of dispersal<br />
Neighbourhood size (Nb) estimates indicate the balance<br />
between drift and gene flow at a local scale (Fenster et al.<br />
2003). Smaller Nb estimates, around 20–24 in Cadiz, suggest<br />
that genetic drift and inbreeding play an important role,<br />
and that the homogenizing effects of gene flow should<br />
be low. In or<strong>de</strong>r to estimate the neighbourhood area we<br />
should have used the effective <strong>de</strong>nsity (D) instead of the<br />
observed genotype <strong>de</strong>nsity (Hardy & Vekemans 2002).<br />
However, the former is extremely difficult to <strong>de</strong>rive for<br />
clonal plants, where the simple estimation of the number<br />
of individuals in a population is a challenge (distinction<br />
between genets and ramets). By using the observed genotype<br />
<strong>de</strong>nsity to estimate patch size we are most likely<br />
un<strong>de</strong>restimating the total number of genotypes (G) in the<br />
surface analysed, because G is a function of the sampling<br />
effort. On the other hand, and partially compensating for<br />
this, the real effective population size is expected to be<br />
smaller than G (Orive 1993), an effect which in this case is<br />
magnified by the unbalanced individual contribution to<br />
reproduction expected from the skewed distribution of<br />
clone sizes.<br />
We estimated the axial variance of the clone mates’ spatial<br />
distribution ( σ2<br />
veg<br />
) as an alternative way to quantify the<br />
contribution of clonal growth to gene dispersal. The mo<strong>de</strong>l<br />
of Gliddon et al. (1987) and the Nb value estimated through<br />
the SGS analysis can be used to extract the sexual component,<br />
allowing estimation of the relative importance of<br />
sexual vs. vegetative dispersal. The results obtained suggest<br />
that, at least for Cadiz Bay, clonal spread might be<br />
an important gene dispersal vector, equivalent to sexual<br />
reproduction. However the comparison is based on<br />
assumptions ma<strong>de</strong> concerning the effective <strong>de</strong>nsity and<br />
caution must be exercised in its interpretation. Also Gliddon<br />
et al.’s formula does not assume overlapping generations<br />
and the regression slope gives a mean estimate of<br />
dispersal over several generations, whereas the axial variance<br />
estimated from the width of genets gives the current<br />
vegetative dispersal. Finally, vegetative dispersal may be<br />
un<strong>de</strong>restimated because of edge effects associated with the<br />
sampling scale. Ecological and genetic simulation studies<br />
such as the ones produced by Sintes et al. (2004) and<br />
Heuertz et al. (2003) should be employed together in or<strong>de</strong>r<br />
to validate the methods presented here and/or provi<strong>de</strong><br />
additional ways of <strong>de</strong>scribing the influence of clonal reproduction<br />
on SGS.<br />
Acknowledgements<br />
This research is a contribution of the EU-project M&MS (ref.<br />
EVK3-CT-2000-00044), and project PNAT/1999/BIA/15003/C of<br />
the Portuguese Science Foundation (FCT). We thank T. Simões, J.J.<br />
Vergara and F. Brun for help in field collections and L. Correia for<br />
technical help, C. Perrin and G. Pearson for a careful reading of<br />
this manuscript and anonymous reviewers for their suggestions.<br />
Fellowships to F. Alberto (PhD) and S. Arnaud-Haond (postdoctoral)<br />
were granted by FCT and the European Social Fund.<br />
References<br />
Alberto F, Mata L, Santos R (2001) Genetic homogeneity in the seagrass<br />
Cymodocea nodosa at its northern Atlantic limit revealed<br />
through RAPD. Marine Ecology Progress Series, 221, 299–301.<br />
Alberto F, Correia L, Billot C, Duarte CM, Serrão E (2003) Isolation<br />
and characterization of microsatellite markers for the seagrass<br />
Cymodocea nodosa. Molecular Ecology Notes, 3, 397–399.<br />
Arnaud-Haond S, Alberto F, Procaccini G, Serrão EA, Duarte CM<br />
(2005) Assessing genetic diversity in clonal organisms: low<br />
diversity or low resolution? Combining power and cost-efficiency<br />
in selecting markers. Journal of Heredity, 3, 1–7.<br />
Auge H, Brandl R (1997) Seedling recruitment in the invasive<br />
clonal shrub, Mahonia aquifolium Pursh (Nutt). Oecologia, 110,<br />
205–211.<br />
Auge H, Neuffer B, Erlinghagen F, Grupe R, Brandl R (2001)<br />
Demographic and random amplified polymorphic DNA analyses<br />
reveal high levels of genetic diversity in a clonal violet.<br />
Molecular Ecology, 10, 1811–1819.<br />
Billingham M, Reusch TB, Alberto F, Serrão EA (2003) Is asexual<br />
reproduction more important at geographical limits? A genetic<br />
test of the seagrass Zostera marina in the Ria Formosa, Portugal.<br />
Marine Ecology Progress Series, 265, 77–83.<br />
Bonin I, Ronfort J, Wozniak F, Olivierri I (2001) Spatial effects and<br />
rare outcrossing events in Medicago truncatula (Fabaceae).<br />
Molecular Ecology, 10, 1371–1384.<br />
Buia MC, Mazzella L (1991) Reproductive phenology of the Mediterranean<br />
seagrasses Posidonia oceanica (L.) Delile, Cymodocea<br />
nodosa (Ucria) Aschers, and Zostera noltii Hornem. Aquatic<br />
Botany, 40, 343–362.<br />
Caujapé-Castells J, Pedrola-Monfort J (1997) Space-time patterns<br />
of genetic structure within a stand of Androcymbium gramineum<br />
(Cav.) McBri<strong>de</strong> (Colchicaceae). Heredity, 79, 341–349.<br />
Caye G, Meinesz A (1985) Observations of the vegetative <strong>de</strong>velopment,<br />
flowering and seeding of Cymodocea nodosa (Ucria)<br />
Acherson on the Mediterranean coasts of France. Aquatic Botany,<br />
22, 277–289.<br />
Chung MG, Epperson BK (1999) Spatial genetic structure and<br />
clonal and sexual reproduction in populations of A<strong>de</strong>nophora<br />
grandiflora (Campanulaceae). Evolution, 53, 1068–1078.<br />
Chung MG, Epperson BK (2000) Clonal and spatial genetic structure<br />
in Eurya emarginata (Theaceae). Heredity, 84, 170–177.<br />
Chung MG, Chung JM, Chung MY, Epperson BK (2000) Spatial<br />
distribution of allozyme polymorphisms following clonal and<br />
sexual reproduction in populations of Rhus javanica (Anacardiaceae).<br />
Silvae Genetica, 48, 223–227.<br />
Coyer JA, Diekmann OE, Serrao EA et al. (2004) Genetic differentiation<br />
of the seagrass, Zostera noltii, populations throughout<br />
its european, asian and african range. Marine Ecology Progress<br />
Series, 281, 51–62.<br />
© 2005 Blackwell Publishing Ltd, Molecular Ecology, 14, 2669–2681<br />
53
2680 F. ALBERTO ET AL.<br />
Dorken ME, Eckert CG (2001) Severely reduced sexual reproduction<br />
in northern populations of a clonal plant, Decodon verticillatus<br />
(Lythraceae). Journal of Ecology, 89, 339–350.<br />
Doyle JJ, Doyle JL (1988) Natural interspecific hybridization in<br />
eastern North American Claytonia. American Journal of Botany,<br />
75, 1238–1246.<br />
Duarte CM, Sand-Jensen K (1990) Seagrass colonization: patch<br />
formation and patch growth in Cymodocea nodosa. Marine Ecology<br />
Progress Series, 65, 193–200.<br />
Duarte CM, Sand-Jensen K (1996) Nutrient constraints on<br />
establishment from seed and on vegetative expansion of the<br />
Mediterranean seagrass Cymodocea nodosa. Aquatic Botany, 54,<br />
279–286.<br />
Ellstrand NC, Roose ML (1987) Patterns of genotypic diversity in<br />
clonal plant species. American Journal of Botany, 74, 123–131.<br />
Epperson BK (2003) Geographical Genetics: Monographs in Population<br />
Biology. Princeton University Press, Princeton, New Jersey.<br />
Eriksson O (1993) Dynamics of genets in clonal plants. Trends in<br />
Ecology & Evolution, 8, 313–316.<br />
Eriksson O (1997) Clonal life histories and the evolution of seed<br />
recruitment. In: The Ecology and Evolution of Clonal Plants (eds <strong>de</strong><br />
Kroon H, van Groenendael J), pp. 211–226. Backhuys Publishers,<br />
Lei<strong>de</strong>n, The Netherlands.<br />
Fenster CB, Vekemans X, Hardy OJ (2003) Quantifying gene flow<br />
from spatial genetic structure data in a metapopulation of<br />
Chamaecrista fasciculate (Leguminosae). Evolution, 57, 995–1007.<br />
Gliddon C, Belhassen E, Gouyon PH (1987) Genetic neighborhoods<br />
in plants with diverse systems of mating and different<br />
patterns of growth. Heredity, 59, 29–32.<br />
Hämmerli A, Reusch TBH (2003a) Inbreeding <strong>de</strong>pression influences<br />
genet size distribution in a marine angiosperm. Molecular<br />
Ecology, 12, 619–629.<br />
Hämmerli A, Reusch TBH (2003b) Genetic neighbourhood of<br />
clone structures in eelgrass meadows quantified by spatial<br />
autocorrelation of microsatellite markers. Heredity, 91, 448–455.<br />
Harada Y, Iwasa Y (1996) Analyses of spatial patterns and population<br />
processes of clonal plants. Researches on Population Ecology,<br />
38, 153–164.<br />
Harada Y, Kawano S, Iwasa Y (1997) Probability of clonal i<strong>de</strong>ntity:<br />
inferring the relative success of sexual versus clonal reproduction<br />
from spatial genetic patterns. Journal of Ecology, 85, 591–600.<br />
Hardy OJ, Vekemans X (1999) Isolation by distance in a continuous<br />
population: reconciliation between spatial autocorrelation<br />
and population genetics mo<strong>de</strong>ls. Heredity, 83, 145–154.<br />
Hardy OJ, Vekemans X (2002) spagedi: a versatile computer<br />
program to analyse spatial genetic structure at the individual or<br />
population levels. Molecular Ecology Notes, 2, 618–620.<br />
Hemminga MA, Duarte CM (2000) Seagrass Ecology. Cambridge<br />
University Press, Cambridge.<br />
Herben T, Hara T, Handicova V et al. (2002) Neighborhood effects<br />
and genetic structure in a clonal grass: the role of the spatial<br />
structure of the environment. Plant Species Biology, 16, 1–11.<br />
Heuertz M, Vekemans X, Hausman F, Paladas M, Hardy OJ (2003)<br />
Estimating seed vs. pollen dispersal from spatial genetic<br />
structure in the common ash. Molecular Ecology, 12, 2483–<br />
2495.<br />
Inglis GJ (2000) Variation in the recruitment behaviour of seagrass<br />
seeds: implications for population dynamics and resource<br />
management. Pacific Conservation Biology, 5, 251–259.<br />
Loiselle BA, Sork VL, Nason JD, Graham C (1995) Spatial genetic<br />
structure of a tropical un<strong>de</strong>rstory shrub. American Journal of<br />
Botany, 82, 1420–1425.<br />
Lovett Doust L (1981) Population dynamics and local specialization<br />
in a clonal perennial (Rannunculus repens) I. The dynamics<br />
of ramets in contrasting habitats. Journal of Ecology, 69, 743–755.<br />
Marbà N, Cebrian J, Enríquez S, Duarte CM (1994) Migration of<br />
large scale subaqueous bedforms measured using seagrasses<br />
(Cymodocea nodosa) as tracers. Limnology and Oceanography, 39,<br />
126–133.<br />
Marbà N, Duarte CM (1995) Coupling of seagrass (Cymodocea<br />
nodosa) patch dynamics to subaqueous dune migration. Journal<br />
of Ecology, 83, 381–389.<br />
Marbà N, Duarte CM (1998) Rhizome enlongation and seagrass<br />
clonal growth. Marine Ecology Progress Series, 174, 269–280.<br />
Orive M (1993) Effective population size in organisms with<br />
complex life-histories. Theoretical Population Biology, 44, 316–340.<br />
Parks JC, Werth CR (1993) A Study of spatial features of clones in<br />
a population of Bracken fern, Pteridium aquilinum (Dennstaedtiaceae).<br />
American Journal of Botany, 80, 537–544.<br />
Procaccini G, Mazzella L (1996) Genetic Variability and Reproduction<br />
in Two Mediterranean Seagrasses. Seagrass Biology: Proceedings of<br />
an International Workshop, pp. 85–92. Rottnest Island, Western<br />
Australia.<br />
Prugnolle F, Choisy M, Théron A, Durand P, De Meeûs T (2004)<br />
Sex-specific correlation between heterozygosity and clone size<br />
in the tremato<strong>de</strong> Schistosma mansoni. Molecular Ecology, 13,<br />
2859–2864.<br />
Raymond M, Rousset F (1995) genepop (version 1.2): population<br />
genetics software for exact tests and ecumenicism. Journal of<br />
Heredity, 86, 248–249.<br />
R Development Core Team (2004) R: A language and environment for<br />
statistical computing. R Foundation for Statistical Computing,<br />
Vienna, Austria. ISBN 3-900051-00-3, URL http://www.Rproject.org.<br />
Reusch TBH, Hukrie<strong>de</strong> W, Stam WT, Olsen JL (1999a) Differentiating<br />
between clonal growth and limited gene flow using spatial<br />
autocorrelation of microsatellites. Heredity, 83, 120–126.<br />
Reusch TBH, Boström C, Stam WT, Olsen JL (1999b) An ancient<br />
eelgrass clone in the Baltic Sea. Marine Ecology Progress Series,<br />
183, 301–304.<br />
Reusch TBH, Stam WT, Olsen JL (2000) A microsatellite-based<br />
estimation of clonal diversity and population subdivision in<br />
Zostera marina, a marine flowering plant. Molecular Ecology, 9,<br />
127–140.<br />
Rousset F (1997) Genetic differentiation and estimation of gene<br />
flow from F-statistics un<strong>de</strong>r isolation by distance. Genetics, 145,<br />
1219–1228.<br />
Shimizu Y, Ando M, Sakai F (2002) Clonal structure of natural<br />
populations of Cryptomeria japonica growing at different<br />
positions on slopes, <strong>de</strong>tected using RAPD markers. Biochemical<br />
Systematics and Ecology, 30, 733–748.<br />
Sintes T, Marbà N, Duarte CM, Kendrick GA (2004) Nonlinear<br />
processes in seagrass colonisation explained by simple clonal<br />
growth rules. Oikos, 108, 165–175.<br />
Stehlik I, Hol<strong>de</strong>regger R (2000) Spatial genetic structure and clonal<br />
diversity of Anemone nemorosa in late successional <strong>de</strong>ciduous<br />
woodlands of Central Europe. Journal of Ecology, 88, 424–435.<br />
Suzuki JI, Herben T, Krahulec F, Hara T (1999) Size and spatial<br />
pattern of Festuca rubra genets in a mountain grassland: its relevance<br />
to genet establishment and dynamics. Journal of Ecology,<br />
87, 942–954.<br />
Terrados J (1993) Sexual reproduction and seed banks of Cymodocea<br />
nodosa (Ucria) Ascherson meadows on the southeast<br />
Mediterranean coast of Spain. Aquatic Botany, 46, 293–299.<br />
© 2005 Blackwell Publishing Ltd, Molecular Ecology, 14, 2669–2681<br />
54
SPATIAL GENETIC STRUCTURE IN CYMODOCEA NODOSA 2681<br />
Vekemans X, Hardy OJ (2004) New insights from fine-scale spatial<br />
genetic structure analyses in plant populations. Molecular Ecology,<br />
13, 921–935.<br />
Vidondo B, Duarte CM, Mid<strong>de</strong>lboe AL, Stefasen K, Lutzen T,<br />
Nielsen SL (1997) Dynamics of a landscape mosaic: size and<br />
age distributions, growth and <strong>de</strong>mography of seagrass<br />
Cymodocea nodosa patches. Marine Ecology Progress Series, 158,<br />
131–138.<br />
Waycott M, Walker DI, James SH (1996) Genetic uniformity in<br />
Amphibolis antarctica, a dioecious seagrass. Heredity, 76, 578–585.<br />
Weir BS (1990) Genetic Data Analysis. Sinauer Associates, Sun<strong>de</strong>rland,<br />
Massachusetts.<br />
Weir BS, Cockerham CC (1984) Estimating F-statistics for the<br />
analysis of population structure. Evolution, 38, 1358–1370.<br />
Wright S (1977) Evolution and the Genetics of Populations. Vol. 4.<br />
Variability Within and Among Populations. University of Chicago<br />
Press, Chicago.<br />
Ziegenhagen B, Bialozyt R, Kuhlenkamp V, Schulze I, Ulrich A,<br />
Wulf M (2003) Spatial patterns of maternal lineages and clones<br />
of Galium odoratum in a large ancient woodland: inferences<br />
about seedling recruitment. Journal of Ecology, 91, 578–586.<br />
Filipe Alberto conducted this study as part of his PhD, and is<br />
interested in population genetics of marine organisms. Licínia<br />
Gouveia collaborated in this study as part of her un<strong>de</strong>rgraduate<br />
studies in marine biology. Sophie Arnaud-Haond is a post<br />
doctoral associate interested in marine evolution and population<br />
genetics, currently focusing on marine plants and clonal organisms<br />
in general. José L. Pérez-Llorens is interested in ecophysiology of<br />
marine macrophytes. Carlos M. Duarte leads a team studying<br />
marine biodiversity from the genetic, species and habitat level<br />
to global biogeochemical cycles. Ester A. Serrão leads a research<br />
group that is primarily interested in marine ecology, adaptation<br />
and population genetics.<br />
© 2005 Blackwell Publishing Ltd, Molecular Ecology, 14, 2669–2681<br />
55
Sophie ARNAUD-HAOND - Candidature à une Habilitation à Diriger <strong>de</strong>s Recherches, Février 2008<br />
3. Résumé <strong>de</strong>s travaux <strong>de</strong> Recherche<br />
II.3<br />
Standardizing methods to <strong>de</strong>scribe population structure of clonal<br />
organisms. Molecular Ecology, Invited Review, 2007.<br />
Dans cet article, nous nous sommes attaché à souligner un certain nombre <strong>de</strong><br />
problèmes récurrents en écologie moléculaire <strong>de</strong>s organismes clonaux, sur la base<br />
d’une revue bibliographique. Il s’agissait <strong>de</strong> proposer un premier pas vers la<br />
standardisation <strong>de</strong>s métho<strong>de</strong>s d’analyses, <strong>de</strong>puis la stratégie d’échantillonnage, le<br />
choix <strong>de</strong>s outils moléculaires, l’i<strong>de</strong>ntification <strong>de</strong>s lignées clonales basée sur une<br />
combinaison d’approches moléculaires et statistiques, les indices <strong>de</strong>scripteurs <strong>de</strong> la<br />
clonalité et la <strong>de</strong>scription <strong>de</strong> ses composantes spatiales.<br />
Nous avons perfectionné, par rapport à notre première publication en 2005, les<br />
métho<strong>de</strong>s <strong>de</strong> reconnaissance <strong>de</strong>s lignées clonales. Il s’agissait d’une part <strong>de</strong><br />
répondre aux questions 1/ ‘quand considère-t-on <strong>de</strong>s génotypes i<strong>de</strong>ntiques comme<br />
un indice d’i<strong>de</strong>ntité clonale ?’ en améliorant la métho<strong>de</strong> proposée auparavant afin <strong>de</strong><br />
prendre en compte les écarts à l’équilibre <strong>de</strong> Hardy-Weinberg car ils sont fréquents<br />
chez les organismes clonaux et 2/ ‘<strong>de</strong>s génotypes différents impliquent-il <strong>de</strong>s lignées<br />
clonales différentes ?’ en s’intéressant au problème <strong>de</strong>s mutation somatiques et en<br />
introduisant la notion <strong>de</strong> Lignées Multi Locus (MLLs) plutôt que <strong>de</strong> Génotype Multi<br />
Locus (MLGs).<br />
Puis, nous avons fait la synthèse <strong>de</strong>s approches proposées dans la littérature,<br />
notamment <strong>de</strong> celles empruntées aux estimateurs <strong>de</strong> richesse spécifique. Nous<br />
avons examiné les points forts et faibles <strong>de</strong> ces indices ou groupes d’indices, et<br />
proposé <strong>de</strong> <strong>de</strong>scripteurs <strong>de</strong> la diversité, <strong>de</strong> l’architecture et <strong>de</strong> la croissance clonale,<br />
notamment <strong>de</strong>s <strong>de</strong>scripteurs permettant la comparaison <strong>de</strong>s caractéristiques<br />
clonales et démographiques.<br />
Ces <strong>de</strong>rnières considérations sur les composantes spatiales <strong>de</strong> la clonalité<br />
nous ont amené à une discussion sur l’importance <strong>de</strong> la stratégie d’échantillonnage<br />
et à proposer <strong>de</strong>s stratégies ‘minimum’ afin <strong>de</strong> permettre une interprétation fiable <strong>de</strong>s<br />
données obtenues et <strong>de</strong> rendre possible <strong>de</strong>s comparaisons ultérieures avec d’autres<br />
étu<strong>de</strong>s.<br />
56
Molecular Ecology (2007) 16, 5115–5139<br />
doi: 10.1111/j.1365-294X.2007.03535.x<br />
Blackwell Publishing Ltd<br />
INVITED REVIEW<br />
Standardizing methods to address clonality in population<br />
studies<br />
S. ARNAUD-HAOND,* C. M. DUARTE,† F. ALBERTO* and E. A. SERRÃO*<br />
*CCMAR — CIMAR Laboratório Associado, Univ. Algarve, Gambelas, 8005-139, Faro, Portugal, †IMEDEA, CSIC-Univ.<br />
Illes Balears, C/Miquel Marques 21, 07190 Esporles, Mallorca, Spain<br />
Abstract<br />
Although clonal species are dominant in many habitats, from unicellular organisms to<br />
plants and animals, ecological and particularly evolutionary studies on clonal species have<br />
been strongly limited by the difficulty in assessing the number, size and longevity of<br />
genetic individuals within a population. The <strong>de</strong>velopment of molecular markers has<br />
allowed progress in this area, and although allozymes remain of limited use due to their<br />
typically low level of polymorphism, more polymorphic markers have been discovered<br />
during the last <strong>de</strong>ca<strong>de</strong>s, supplying powerful tools to overcome the problem of clonality<br />
assessment. However, population genetics studies on clonal organisms lack a standardized<br />
framework to assess clonality, and to adapt conventional data analyses to account for the<br />
potential bias due to the possible replication of the same individuals in the sampling.<br />
Moreover, existing studies used a variety of indices to <strong>de</strong>scribe clonal diversity and structure<br />
such that comparison among studies is difficult at best. We emphasize the need for<br />
standardizing studies on clonal organisms, and particularly on clonal plants, in or<strong>de</strong>r to<br />
clarify the way clonality is taken into account in sampling <strong>de</strong>signs and data analysis, and<br />
to allow further comparison of results reported in distinct studies. In or<strong>de</strong>r to provi<strong>de</strong> a first<br />
step towards a standardized framework to address clonality in population studies, we<br />
review, on the basis of a thorough revision of the literature on population structure of clonal<br />
plants and of a complementary revision on other clonal organisms, the indices and statistics<br />
used so far to estimate genotypic or clonal diversity and to <strong>de</strong>scribe clonal structure in<br />
plants. We examine their advantages and weaknesses as well as various conceptual issues<br />
associated with statistical analyses of population genetics data on clonal organisms. We do<br />
so by testing them on results from simulations, as well as on two empirical data sets of<br />
microsatellites of the seagrasses Posidonia oceanica and Cymodocea nodosa. Finally, we<br />
also propose a selection of new indices and methods to estimate clonal diversity and<br />
<strong>de</strong>scribe clonal structure in a way that should facilitate comparison between future studies<br />
on clonal plants, most of which may be of interest for clonal organisms in general.<br />
Keywords: clonal diversity, clonal size, clonal subrange, clonality, methods, molecular markers,<br />
power law, sampling <strong>de</strong>sign, spatial autocorrelation, species richness<br />
Received 15 May 2007; revision 27 July 2007<br />
Introduction<br />
Clonality is a life-history strategy, particularly wi<strong>de</strong>spread<br />
in plants, allowing organisms to produce offspring without<br />
sexual reproduction, hence typically genetically i<strong>de</strong>ntical<br />
Correspon<strong>de</strong>nce: S. Arnaud-Haond, E-mail: sarnaud@ifremer.fr;<br />
eserrao@ualg.pt<br />
Present address: Ifremer, Centre <strong>de</strong> Brest BP70, Department DEEP,<br />
29280 Plouzané, France<br />
— at the exception of possible somatic mutations — to<br />
themselves. Despite the large number of clonal species present<br />
across a wi<strong>de</strong> variety of taxa and habitats, evolutionary<br />
theory and mo<strong>de</strong>ls are mostly based on singular genetic<br />
individuals. A specific consi<strong>de</strong>ration of clonality is largely<br />
lacking, probably because ecological and particularly<br />
evolutionary studies of clonal plants have long been <strong>de</strong>terred<br />
by the difficulty in discriminating between genetically<br />
distinct individuals and clonal replicates [i.e. to discriminate<br />
© 2007 The Authors<br />
Journal compilation © 2007 Blackwell Publishing Ltd<br />
57
5116 S. ARNAUD-HAOND ET AL.<br />
Fig. 1 (a) Time course of the number of studies on clonal plants using molecular markers per year, among the 247 published studies on<br />
clonal plants reviewed (bars), and the temporal evolution of the percentage of studies using allozymes (−), multibanding (RAPDs, AFLP<br />
and fingerprints; ···) and microsatellites (---). (b) The distribution of clonal diversity (R) estimated with Allozymes, Fingerprints (RAPDs,<br />
AFLP), and Microsatellites markers over the 297 studies reviewed, presented as the average (± SE) for the studies using different marker<br />
types on the left panel, and as the cumulated frequency of increasing R-values on the right panel with lines pointing at the median values<br />
of R for different marker types.<br />
between distinct genets and distinct ramets; sensu Harper<br />
(1977)]. The advent and subsequent <strong>de</strong>velopment of markers<br />
powerful enough to resolve genotypic i<strong>de</strong>ntity has now<br />
bypassed that bottleneck, stimulating research efforts<br />
towards the examination of the genetic structure of clonal<br />
plant populations. This is indicated by the fact that 83% of<br />
the articles on clonal plants published in that area over the<br />
past three <strong>de</strong>ca<strong>de</strong>s, as revealed by a literature search on<br />
the ISI Web of Knowledge, were produced after 1995<br />
(Fig. 1a). The bulk of these articles characterized the<br />
genetic structure of clonal populations through the computation<br />
of general indices of genetic structure, such as<br />
heterozygosity, F estimators or spatial autocorrelation<br />
analysis, all methods <strong>de</strong>veloped for nonclonal organisms<br />
and therefore not explicitly addressing the issue of clonality.<br />
Yet the clonal nature of the populations poses specific<br />
challenges that impinge on their genetic structure, and this<br />
introduces some uncertainties in the interpretation of<br />
results <strong>de</strong>rived in the past. Moreover, the implications of<br />
the clonal nature of the organisms studied are so pervasive<br />
that clonality affects the study of population genetics even<br />
at the sampling stage. This aspect has not been specifically<br />
addressed as yet, possibly leading to errors in the use and<br />
interpretation of the indices applied.<br />
58<br />
© 2007 The Authors<br />
Journal compilation © 2007 Blackwell Publishing Ltd
POPULATION STRUCTURE AND CLONALITY 5117<br />
A substantial fraction of the research effort has attempted<br />
to characterize the extent of clonality in populations through<br />
the use of diversity indices, borrowed from the species’<br />
diversity literature. These inclu<strong>de</strong> the ratio of the number<br />
of genotypes (or clonal lineages) over the number of samples<br />
(Ellstrand & Roose 1987), the Shannon-Wiener in<strong>de</strong>x<br />
(Pielou 1966; Peet 1974), the complement of Simpson’s<br />
in<strong>de</strong>x (Gini 1912; Simpson 1949) and the corresponding<br />
evenness indices. However, the use of different indices<br />
across studies preclu<strong>de</strong>s an efficient and useful comparison<br />
of their results in terms of clonal diversity. In general, none<br />
of the available software for general population genetics<br />
analyses inclu<strong>de</strong>s routines and options for clonal organisms,<br />
signalling a lack of sufficient awareness of the specificities<br />
of clonality and the need for a standardized set of indices<br />
and methods. Some specific software have been <strong>de</strong>veloped<br />
in the last few years, allowing the analysis of some clonal<br />
components at the intrapopulation levels (Stenberg et al.<br />
2003; Meirmans & Van Tien<strong>de</strong>ren 2004; Peakall & Smouse<br />
2006; Arnaud-Haond & Belkhir 2007). Also, none of the<br />
calculations used so far specifically consi<strong>de</strong>r how different<br />
clones are distributed in space, which is a fundamental<br />
trait of the genetic structure of clonal populations (van<br />
Groenendael & <strong>de</strong> Kroon 1990; Reusch 2001), and it was<br />
only very recently that a software was released allowing<br />
those features to be specifically analysed for clonal organisms<br />
(Arnaud-Haond & Belkhir 2007). Hence, there is a<br />
need to standardize the methods used to characterize the<br />
genetic structure of clonal organisms both in or<strong>de</strong>r to facilitate<br />
the gathering and integration of future data and their<br />
comparison among studies.<br />
Here we provi<strong>de</strong> an overview, on the basis of a review of<br />
the published literature, of current methods to assess the<br />
genetic structure of clonal plant populations and formulate<br />
new methods where appropriate. We specifically focus<br />
on indices and statistics to (i) relate genotypic and clonal<br />
i<strong>de</strong>ntity, (ii) <strong>de</strong>scribe clonal diversity, and (iii) <strong>de</strong>scribe the<br />
spatial pattern of clonal distribution. We examine the properties<br />
of the statistics most commonly encountered in the<br />
literature, on the basis of simulated and empirical microsatellite<br />
data sets of populations of the clonal seagrasses<br />
Posidonia oceanica and Cymodocea nodosa (Alberto et al. 2003a, b,<br />
2005) used as test cases. These simulated and empirical data<br />
sets are also used to examine and discuss the implications<br />
of clonality for sampling <strong>de</strong>sign.<br />
Literature survey<br />
We searched the published literature for studies using<br />
molecular markers to assess population genetic structure<br />
of clonal plants published between 1973 and 2003. We<br />
did so by searching the ISI Web of Knowledge for entries<br />
of published studies including the terms ‘plants’ and<br />
(‘clonality’ or ‘clonal’ or ‘clone’ or ‘asexual’) and a variety<br />
of molecular markers [e.g. allozymes, microsatellites,<br />
random amplified polymorphic DNA (RAPD), amplified<br />
fragment length polymorphism (AFLP), simple sequence<br />
repeats), and screening the references obtained for molecular<br />
analysis of clonal plants. A first screening of the<br />
literature <strong>de</strong>livered about 450 studies, of which further<br />
scrutiny revealed only about 280 to be relevant, 246 of<br />
which could be retrieved and analysed. Additionally, searches<br />
on genetic structure of nonplant clonal organisms were<br />
also conducted, for articles published between 2000 and<br />
2005, of which 51 were analysed. The list of those references<br />
can be found in Table S1, Supplementary material, summarizing<br />
the information extracted from each article. For<br />
each article, the methods used to estimate and <strong>de</strong>scribe clonal<br />
diversity and spatial clonal distribution, as well as the spatial<br />
<strong>de</strong>sign of the sampling were extracted (Table S1, Table 1).<br />
The examination of the publication trends shows a major<br />
growth in the number of published studies on population<br />
structure of clonal plants using molecular markers (Fig. 1a),<br />
as well as a shift in the relative use of different markers. The<br />
publication effort on population structure of clonal plants<br />
increased abruptly in 1998 coinciding with the advent of<br />
the use of microsatellite markers (Fig. 1a). All published<br />
studies used allozymes until the early 1980s, when the<br />
introduction of fingerprinting approaches in the literature<br />
led to a shift in methods followed by an uprise in the use<br />
of microsatellites as the most powerful markers to assess<br />
clonal membership yet available (Fig. 1a).<br />
Genotypic vs. clonal membership, estimating<br />
sexual input<br />
The genotyping of sampling units, or ramets, with multiple<br />
in<strong>de</strong>pen<strong>de</strong>nt markers will allow their assignment to several<br />
groups of multilocus genotypes (MLGs). Two additional<br />
steps are necessary before being able to reasonably assume<br />
that (i) all replicates of the same MLG are part of the same<br />
clone, or genet; and (ii) each distinct MLG belongs to a<br />
distinct clone, or genet (Halkett et al. 2005b). The first part<br />
requires estimating the probability of finding i<strong>de</strong>ntical MLGs<br />
resulting from distinct zygotes, and the second requires a<br />
careful analysis of the pairwise differences among MLGs in<br />
or<strong>de</strong>r to <strong>de</strong>tect possible somatic mutations or scoring errors<br />
that may result in distinct MLGs characterizing sampling<br />
units actually belonging to the same clone. Procedures to<br />
accomplish both these steps are <strong>de</strong>tailed below and<br />
illustrated in Box 1.<br />
The analysis of clonal populations requires the capacity<br />
to assess the likelihood that two individuals with the same<br />
multilocus genotype, within the power of the markers used,<br />
are in<strong>de</strong>ed part of the same clone and therefore unlikely to<br />
be <strong>de</strong>rived from distinct sexual reproductive events. These<br />
tests have been used in about 30% of the reviewed studies.<br />
For the calculation of this probability, the population allelic<br />
© 2007 The Authors<br />
Journal compilation © 2007 Blackwell Publishing Ltd<br />
59
5118 S. ARNAUD-HAOND ET AL.<br />
Box 1 Genotypic vs. clonal membership<br />
a) Assessing whether all replicates of the same MLG<br />
are part of the same clone<br />
The probability of a given genotype i un<strong>de</strong>r the<br />
assumption of Hardy–Weinberg equilibrium can be<br />
estimated as:<br />
l<br />
p f<br />
h<br />
∑ ( i<br />
)2<br />
gen = i=<br />
1<br />
(eqn 1)<br />
where l is the number of loci, f i<br />
the frequency of each<br />
allele at the i th locus (estimated using the round-robin<br />
method, see text), and h the number of heterozygous<br />
loci in the sample.<br />
When taking into account <strong>de</strong>partures from Hardy–<br />
Weinberg equilibrium (using F IS<br />
), this equation<br />
becomes:<br />
l<br />
∏<br />
p ( F ) = [( f g ) × ( 1+ ( z × ( F )))] 2<br />
gen IS i i i IS()<br />
i<br />
i=<br />
1<br />
(eqn 2)<br />
where l is the number of loci, h is the number of<br />
heterozygote loci, and f and g are the allelic frequencies<br />
of the alleles f and g at the i th locus (with f and g i<strong>de</strong>ntical<br />
for homozygotes), F IS(i)<br />
is the F IS<br />
estimated for the<br />
i th locus (using allelic frequencies estimated with<br />
the round-robin method), and z i<br />
=1 if the i th locus is<br />
homozygous (for f i<br />
= g i<br />
) and z i<br />
=–1 if the i th locus is<br />
heterozygous.<br />
When the same genotype is <strong>de</strong>tected n times in a<br />
sample of N sampling units, the probability that the<br />
repeated genotypes originate from distinct sexual<br />
reproductive events (i.e. from different zygotes, thus<br />
being different genets), <strong>de</strong>rived from the binomial<br />
expression, is:<br />
h<br />
p<br />
sex<br />
=<br />
N<br />
∑<br />
i=<br />
n<br />
N!<br />
p − p<br />
i N − i) [ gen<br />
!( !<br />
][ 1<br />
gen<br />
]<br />
i N − i<br />
(eqn 3)<br />
In this calculation, the probability of the genotype<br />
p gen<br />
can be replaced by p gen<br />
(F IS<br />
) to consi<strong>de</strong>r possible<br />
<strong>de</strong>partures to Hardy–Weinberg equilibrium, in or<strong>de</strong>r to<br />
obtain a more conservative estimate of p sex<br />
.<br />
A Monte Carlo procedure can be applied to ensure<br />
that the set of loci used provi<strong>de</strong>s enough power to discriminate<br />
all MLGs present in the sample:<br />
Fig. B1.1: Box plot <strong>de</strong>scribing the genotypic resolution<br />
of microsatellites in a data set of the seagrass Cymodocea<br />
nodosa containing 220 sampling units genotyped using<br />
nine microsatellites, analysed for of all possible combinations<br />
C<br />
K<br />
l<br />
of K loci (K = 1, ... , l; l is the number of loci<br />
available). the edges of the boxes show the minimum<br />
and maximum number of genotypes and the central<br />
line shows the average number of genoptypes i<strong>de</strong>ntified<br />
in the sample using X microsatellites (Alberto et al.<br />
2005). The example illustrated here shows that a set of<br />
seven loci allows an accurate <strong>de</strong>termination of the<br />
number of genotypes in the sample.<br />
b) Ascertaining that each distinct MLG belongs to a<br />
distinct clone, or genet (Halkett et al. 2005a); <strong>de</strong>fining<br />
clonal lineages (MLL)<br />
This procedure can be used if the distribution of genetic<br />
distances among sampling units does not follow a strict<br />
unimodal distribution but shows high peaks toward<br />
low distances, susceptible to reveal the existence of somatic<br />
mutations or scoring errors in the data set resulting in low<br />
distances among slightly distinct MLG actually <strong>de</strong>riving<br />
from a single reproductive event. The use of the frequency<br />
distribution of distances to <strong>de</strong>tect such events<br />
Fig. B1.1<br />
60<br />
© 2007 The Authors<br />
Journal compilation © 2007 Blackwell Publishing Ltd
POPULATION STRUCTURE AND CLONALITY 5119<br />
Box 1 Continued<br />
Fig. B1.2<br />
has been proposed four times so far, to our knowledge<br />
(Douhovnikoff & Dodd 2003; Meirmans & Van Tien<strong>de</strong>ren<br />
2004; Arnaud-Haond et al. 2005; Rozenfeld et al. 2007).<br />
In a recent work on Posidonia (Arnaud-Haond et al. 2007)<br />
we introduced the concept of MLL to <strong>de</strong>sign genets<br />
represented by slightly distinct MLG, due to mutation or<br />
scoring errors. We propose a two step approach, consisting<br />
in (i) screening each MLG pair presenting extremely<br />
low distance, and originating a primary small peak in<br />
the frequency distribution of distances, making it bimodal<br />
rather than unimodal (see the dashed line in Fig. B1.2).<br />
Then we propose (ii) using p sex<br />
on the set of i<strong>de</strong>ntical<br />
loci in or<strong>de</strong>r to estimate the likelihood that those<br />
slightly distinct MLG would actually be <strong>de</strong>rived from<br />
distinct reproductive events. When such likelihood<br />
was lower than a chosen threshold (in that case 0.01),<br />
then the slightly distinct MLG may be consi<strong>de</strong>red as<br />
being <strong>de</strong>rived from the same genet and being slightly<br />
distinct representatives of the same MLL. Numerous<br />
distance metrics can be chosen, such as the number<br />
of distinct alleles, Jaccard similarity in particular for<br />
multibanding patterns (Douhovnikoff & Dodd 2003)<br />
or the number of microsatellite motifs (Arnaud-Haond<br />
et al. 2007) un<strong>de</strong>r the hypothesis of a stepwise mutation<br />
mo<strong>de</strong>l for somatic mutations.<br />
Fig. B1.2: (A) Frequency distribution of the pairwise<br />
number of alleles differences between MLGs for the<br />
same sample of C. nodosa (Alberto et al. 2005), compared<br />
with (B) the frequency distribution of the pairwise distances<br />
in a set of seeds from the same location (Cadiz,<br />
Spain) in which neither i<strong>de</strong>ntical MLG nor somatic<br />
mutation are expected. The x-axis represents the number<br />
of allele differences and the y-axis is the frequency<br />
distribution for each x rank. The dashed line in the<br />
adult distribution represents the threshold below which<br />
i<strong>de</strong>ntical MLG have a p sex<br />
, estimated after excluding the<br />
slightly different loci, that supports the slightly distinct<br />
MLG as having originated from the same MLL (i.e. from<br />
the same zygote).<br />
© 2007 The Authors<br />
Journal compilation © 2007 Blackwell Publishing Ltd<br />
61
5120 S. ARNAUD-HAOND ET AL.<br />
frequencies can be estimated using a ‘round-robin’ method<br />
(Parks & Werth 1993; Arnaud-Haond et al. 2005). This subsampling<br />
approach avoids the overestimation of the rare<br />
allele frequencies, by estimating the allelic frequencies for<br />
each locus on the basis of a sample pool composed of all the<br />
MLGs distinguished on the basis of all the loci, except that<br />
for which allelic frequencies are estimated. This procedure<br />
is repeated for all loci, and the unique genotype probability<br />
(p gen<br />
) is then estimated un<strong>de</strong>r the assumption of Hardy–<br />
Weinberg equilibrium (Box 1, equation 1).<br />
A constraint on this procedure is the possible occurrence<br />
of <strong>de</strong>partures from panmixia in the population studied, as<br />
may occur due to selfing and biparental inbreeding, or<br />
high linkage disequilibrium. In these cases, the estimated<br />
probability p gen<br />
may be significantly lower than the real<br />
probability of occurrence of a given repeated MLG originated<br />
from different zygotes. The corresponding p sex<br />
may<br />
in those cases represent an un<strong>de</strong>restimation of the likelihood<br />
of encountering this particular MLG twice or more. It<br />
has been proposed that the genetic composition of the population<br />
could be taken into account to improve the estimate<br />
of p gen<br />
, by using samples collected at the zygote stages (for<br />
example seeds) in or<strong>de</strong>r to assess the level of linkage disequilibrium<br />
and <strong>de</strong>parture from Hardy–Weinberg in the<br />
population of sexual individuals (Gregorius 2005). Yet, for<br />
those species, numerous among clonal plants, that experience<br />
large variance in reproductive success or variable<br />
selection regimes in space and time, this approach may not<br />
be realistic, or may even lead to more biased results than<br />
the classical estimates of p gen<br />
. We therefore recommend<br />
the use of F IS<br />
values obtained using allelic frequencies<br />
estimated with of the round-robin method, to improve<br />
estimates of p gen<br />
by taking into account <strong>de</strong>partures from<br />
Hardy–Weinberg equilibrium, as first suggested by Young<br />
et al. (2002: Box 1, equation 2).<br />
These estimates of p gen<br />
, or of the upper bound of its confi<strong>de</strong>nce<br />
interval, are often (about 13% of studies) used to<br />
ascertain whether replicated MLGs result from clonal<br />
reproduction. This is not appropriate, as the p gen<br />
is the<br />
probability of finding a given MLG i<br />
when analysing only<br />
one sampling unit, not the probability of finding that MLG i<br />
in the N sampling units collected and analysed. A similar<br />
problem occurs with other methods, used in 5% of the articles<br />
reviewed, estimating the probability for a given MLG i<br />
to occur n times due to sexual reproduction as pgen<br />
n . This<br />
calculation actually <strong>de</strong>livers the probability of finding n<br />
times the MLG i<br />
when analysing exactly n sampling units,<br />
instead of the probability of MLG i<br />
occurring n times in a<br />
sample of N sampling units. Therefore, these calculations<br />
do not address the question ‘are one or more of the n replicates<br />
of a given MLG i<br />
encountered in a sample of N sampling<br />
units likely to be issued from in<strong>de</strong>pen<strong>de</strong>nt events of<br />
sexual reproduction?’. To address this question when the<br />
same genotype i is <strong>de</strong>tected more than once (n) in a sample<br />
composed of N sampling units, the probability that the<br />
sampling units with the same genotype actually originate<br />
from distinct sexual reproductive events (i.e. from separate<br />
genets) is best <strong>de</strong>rived from the binomial expression<br />
<strong>de</strong>scribing p sex<br />
(Tibayrenc et al. 1990: Box 1, equation 3,<br />
Parks & Werth 1993), which has only been used in 6% of the<br />
articles reviewed.<br />
In very particular cases of high clonal dominance and<br />
very low clonal diversity, a limitation exists to this method.<br />
First, it will not be known whether the estimates of allelic<br />
frequencies on the basis of very few sampled chromosome<br />
will accurately represent population allelic frequencies<br />
(if all existing genets have been inclu<strong>de</strong>d in the sample, as<br />
in a monoclonal population) or if there are many more genets<br />
in the population but which the sampling scheme was<br />
unable to <strong>de</strong>tect. Second, and above all, the low statistical<br />
power in such a data set is likely to lead to nonsignificant<br />
probabilities p sex<br />
, thus not allowing exclusion of the possibility<br />
that the most common MLGs would have occurred<br />
in<strong>de</strong>pen<strong>de</strong>ntly several times in the studied population as a<br />
result of distinct events of sexual reproduction. Such situation<br />
is paradoxical as this implies that in the cases where<br />
the dominance of clonality would be more obvious, it may<br />
not be possible to <strong>de</strong>monstrate its occurrence statistically.<br />
One recommendation in such cases may be the increase in<br />
sample size, or the extension of the sampling area, to attempt<br />
collecting more distinct and rare MLG, if they exist in the<br />
population . The increase in the number of distinct MLGs<br />
sampled would in<strong>de</strong>ed increase the reliability of allelic<br />
frequency estimates and the statistical power to ascertain<br />
the clonal i<strong>de</strong>ntity of the numerous i<strong>de</strong>ntical MLGs. If<br />
however, a population contains only one or only a few genotypes,<br />
even with very high sampling effort no further<br />
MLGs are <strong>de</strong>tected, and although the allelic frequencies of<br />
the population are exhaustively sampled, statistical power<br />
associated with p sex<br />
may be low. The recommendation in<br />
those cases is to increase the number of variable loci in the<br />
analysis, towards levels at which the probability of finding<br />
the exact same MLG but originated from distinct zygotes,<br />
would be very low.<br />
It may be wise to proceed with these tests of clonal<br />
i<strong>de</strong>ntity for i<strong>de</strong>ntical multilocus genotypes before engaging<br />
in analyses that assume these to <strong>de</strong>rive in<strong>de</strong>ed from<br />
the same clone. A further test for the likelihood of clonal<br />
i<strong>de</strong>ntity between two samples with the same multilocus<br />
genotype may be to sample, using a Monte Carlo procedure,<br />
subsets of loci and examine the robustness of the<br />
inferred clonal membership to changes in the power of the<br />
analysis. In<strong>de</strong>ed, this procedure allows testing whether<br />
or not the power to discriminate the maximum number of<br />
distinct genotypes is satisfactorily reached with the number<br />
of markers used, thereby allowing the accurate estimation<br />
of the clonal diversity (Arnaud-Haond et al. 2005, see Box 1,<br />
Fig. B1.1).<br />
62<br />
© 2007 The Authors<br />
Journal compilation © 2007 Blackwell Publishing Ltd
POPULATION STRUCTURE AND CLONALITY 5121<br />
Once the set of loci has been assessed to be powerful<br />
enough to resolve all distinct clones in a set of samples (i.e.<br />
each MLG corresponds to a single clone), the second step<br />
is to ascertain the clonal membership of each MLG (i.e. each<br />
clone corresponds to a single MLG). In<strong>de</strong>ed, the assignment<br />
of genetic i<strong>de</strong>ntity of clones has recently been questioned<br />
(Klekowski 2003). Multiple MLGs belonging to the same<br />
clone may be found either due to the existence of somatic<br />
mutation or scoring errors (Douhovnikoff & Dodd 2003),<br />
which would lead to the overestimation of the number of clones<br />
in the sample analysed. This potential bias can be tested for<br />
by inspecting the frequency distribution of genetic distances<br />
among pairs of MLGs (Douhovnikoff & Dodd 2003;<br />
Meirmans & Van Tien<strong>de</strong>ren 2004). The occurrence of somatic<br />
mutation or scoring errors at a significant rate is expected<br />
to be reflected in the existence of a peak in the frequency<br />
distribution of genetic distances at very low, non-null, genetic<br />
distances (Douhovnikoff & Dodd 2003; Van <strong>de</strong>r Hulst et al.<br />
2003: see Box 1, Fig. B1.2A and B). A threshold of genetic distance<br />
can in those cases be <strong>de</strong>fined, below which the hypothesis<br />
that distinct MLGs belong to the same clone cannot<br />
be rejected (Douhovnikoff & Dodd 2003; Meirmans & Van<br />
Tien<strong>de</strong>ren 2004). These MLGs will then be assembled into<br />
groups of distinct ‘multilocus lineages’ (MLLs) corresponding<br />
to the best possible i<strong>de</strong>ntification of distinct clonal lineages<br />
(Arnaud-Haond et al. 2007; Diaz-Almela et al. in press).<br />
The ten<strong>de</strong>ncy for studies to use a growing number of<br />
increasingly polymorphic markers will likely lead to an<br />
increase in the number of apparent MLGs relative to the<br />
number of MLLs in the sample, as more somatic mutations<br />
and scoring errors are expected as marker number and<br />
resolution increase. This suggests that the procedure <strong>de</strong>scribed<br />
above should be routinely used to avoid bias in clonal<br />
diversity estimates (Loxdale & Lushai 2003). Although the<br />
concept of clone was first introduced by the ancient Greeks<br />
to <strong>de</strong>sign entities issued from asexual reproduction, and<br />
did not necessarily imply exact genetic i<strong>de</strong>ntity (unlike the<br />
term genet, <strong>de</strong>fined much later by Harper in 1977), it has<br />
been traditionally used in biology to refer both to biological<br />
units <strong>de</strong>rived from asexual reproduction and those sharing<br />
genetic i<strong>de</strong>ntity. In<strong>de</strong>ed, the capacity to ascertain genetic<br />
i<strong>de</strong>ntity is a recent achievement, and the consequences of<br />
the ambiguity of the traditional use of the term ‘clone’ are<br />
only now becoming apparent (Tibayrenc & Ayala 2002).<br />
At this stage, the concept of ‘clonal lineages’, <strong>de</strong>fined as<br />
‘the asexual <strong>de</strong>scendants of a given genotype differing<br />
from the originator only via mutation and mitotic recombination’<br />
(An<strong>de</strong>rson & Kohn 1995) may therefore be more<br />
precise and operative than that of the more ambiguous<br />
term ‘clones’.<br />
Only once these tests have been conducted that the indices<br />
<strong>de</strong>scribed below may be consi<strong>de</strong>red indices of clonal,<br />
and not genotypic, diversity, which is a requirement to<br />
assess the spatial distribution of the clonal lineages. It is<br />
in<strong>de</strong>ed important to recognize that the terms ‘clonal lineages’<br />
(or MLLs) and ‘clonal’ do not necessarily correspond<br />
to ‘genotypes’ (or MLGs) and ‘genotypic’, respectively.<br />
This step is also required to obtain reliable estimates of<br />
the rate of clonal vs. sexual reproduction. The successful<br />
assessment of the level of ‘individual’ or ‘clonal lineage’<br />
(arising from a single zygote) through these two steps is<br />
also particularly important to further apply classical<br />
population genetic analyses such as F IS<br />
or F ST<br />
, or autocorrelation<br />
analysis (see below) in or<strong>de</strong>r to extract information<br />
on inbreeding, heterozygote selective values, dispersal and<br />
migration rate via sexual propagules vs. clonal spread.<br />
One of the most common problems affecting the estimates<br />
reported in the literature is the lack of resolution due to the<br />
limited polymorphism of the markers used. This preclu<strong>de</strong>s<br />
the accurate discrimination of some distinct lineages that<br />
falsely appear i<strong>de</strong>ntical, on the basis of the set of markers used,<br />
leading to the overestimation of clonal input (i.e. the un<strong>de</strong>restimation<br />
of clonal diversity).The comparison of the average<br />
clonal diversity <strong>de</strong>rived using five types of molecular markers<br />
across the studies reporting clonal richness suggest that<br />
microsatellites and RAPD are more efficient in distinguishing<br />
among clones on the basis of their multilocus genotypes<br />
than AFLP or allozymes are (Fig. 1b). In<strong>de</strong>ed studies with<br />
microsatellites or RAPD tend to report higher clonal diversity<br />
than studies using AFLP, with the mean clonal diversity<br />
across the studies reviewed here increasing from allozymes<br />
to fingerprints and to microsatellites (Fig. 1b). There has<br />
been a shift in the use of these markers, from a dominance<br />
of studies using allozymes to a rapid spread of the use of<br />
fingerprints and microsatellites (Fig. 1a). However, it is also<br />
important to note that whatever kind of marker can led to<br />
erroneous estimates if the polymorphism is insufficient, as<br />
was observed comparing two sets of distinct microsatellites<br />
revealing very contrasting results for the seagrass Posidonia<br />
oceanica (Alberto et al. 2003a, Arnaud-Haond et al. 2005).<br />
Description of the components of clonal diversity<br />
As in studies addressing species biodiversity (e.g. Peet 1974),<br />
several components can be used to estimate clonal diversity<br />
in a particular population: clonal richness, representing<br />
either the absolute number or the proportion of distinct<br />
entities (clonal lineages or genets) present in the sample<br />
relative to the number of sampling units; clonal heterogeneity,<br />
which is influenced both by the richness and the relative<br />
abundance of the entities in the sample; and clonal evenness,<br />
<strong>de</strong>scribing the equitability of the distribution of the sampling<br />
units (or ramets) among these entities.<br />
Clonal richness<br />
The simplest and most wi<strong>de</strong>ly used (about 72% of the studies)<br />
in<strong>de</strong>x of clonal richness is the number of genotypes of<br />
© 2007 The Authors<br />
Journal compilation © 2007 Blackwell Publishing Ltd<br />
63
5122 S. ARNAUD-HAOND ET AL.<br />
Box 2 Clonal richness estimates<br />
The in<strong>de</strong>x of clonal diversity proposed by Ellstrand<br />
& Roose (1987) for a sample of size N in which G<br />
genotypes are discriminated is estimated as:<br />
P<br />
d =<br />
G<br />
N<br />
(eqn 4)<br />
This modification was proposed by Dorken & Eckert<br />
(2001):<br />
G<br />
R = ( −1)<br />
( N −1)<br />
(eqn 5)<br />
such that the smallest possible value in a monoclonal<br />
stand is always 0, in<strong>de</strong>pen<strong>de</strong>ntly of sample size,<br />
and the maximum value is still 1, when all the<br />
different samples analysed correspond to distinct<br />
clonal lineages.<br />
These indices provi<strong>de</strong> an estimate of the clonal (vs.<br />
sexual) input, once the set of loci allowed assessing the<br />
clonal membership, as previously <strong>de</strong>tailed. Else, this<br />
in<strong>de</strong>x may overestimate clonal input, as it will ignore<br />
the reproduction of the same multilocus genotype<br />
through sexual reproduction (Stoddart 1983; Uthike<br />
et al. 1998). To estimate the extent of this possible bias in<br />
estimating sexual input, one method was <strong>de</strong>veloped<br />
(Stoddart 1983; Stoddart & Taylor 1988) involving two<br />
of those components. The first is the estimate of genotypic<br />
diversity in the sample:<br />
G<br />
o<br />
=<br />
G<br />
∑<br />
1<br />
i=<br />
1<br />
p<br />
2<br />
i<br />
(eqn 6)<br />
where p i<br />
is the observed frequency of the i th of G<br />
genotypes, as <strong>de</strong>scribed in Stoddart (1983). This first<br />
component happens to be also the inverse of the<br />
Simpson in<strong>de</strong>x of genotypic heterogeneity commonly<br />
used to <strong>de</strong>scribe clonal diversity (equation 20). It is used<br />
in a ratio with the second component, the expected<br />
genotypic diversity un<strong>de</strong>r Hardy–Weinberg and random<br />
assortment between all pairs of loci:<br />
Ge * = 1<br />
⎛<br />
(eqn 7)<br />
D<br />
P ⎞<br />
⎜ +<br />
N<br />
⎟<br />
⎝ ⎠<br />
where D is the sum of all p2<br />
i<br />
for all p i<br />
where (p i<br />
× N) ><br />
1 , and P the sum of p i<br />
for all (p i<br />
× N) < 1. The clonal input<br />
is then estimated as:<br />
G<br />
G<br />
o<br />
e *<br />
(eqn 8)<br />
When the data set used is ma<strong>de</strong> of markers exhibiting<br />
high polymorphism and allowing an optimal discriminating<br />
power, a very high number of genotypes may<br />
be expected and P will be negligible. The estimator<br />
(equation 19) will approximate estimator (15) as the<br />
number of multilocus lineages is more accurately estimated,<br />
and when reaching full resolution of MLLs P d<br />
(or R)<br />
provi<strong>de</strong>s then a reliable estimate of the clonal input.<br />
the population estimated by G, the number of multilocus<br />
genotypes or lineages <strong>de</strong>tected in a sample. This in<strong>de</strong>x is<br />
obviously <strong>de</strong>pen<strong>de</strong>nt on the sample size. As proposed for<br />
species richness S, the rarefaction method used to compare<br />
allelic richness estimates (Petit et al. 1998) or a permutation<br />
approach should be used (Leberg 2002) to compare two<br />
samples differing in sample size, n and N > n. These<br />
methods allow the estimation of expected G in the second<br />
population if only n units would have been sampled. A<br />
bootstrap approach can be used to subsample n individuals<br />
from the total sample universe available (N), and reiterate<br />
this process to estimate the average G, along with confi<strong>de</strong>nce<br />
intervals (Arnaud-Haond & Belkhir 2007).<br />
After G, the most commonly (about 38% of the studies)<br />
used in<strong>de</strong>x of clonal richness is the ‘clonal diversity’ in<strong>de</strong>x<br />
P d<br />
as proposed by Ellstrand & Roose (1987), the fraction<br />
of distinct clonal lineages in the population relative to<br />
the number of sampling units (Box 2, equation 15). The<br />
expected confi<strong>de</strong>nce limits of P d<br />
can be <strong>de</strong>rived from tables<br />
of confi<strong>de</strong>nce limits of percentages <strong>de</strong>pending on sample<br />
size (Sokal & Rohlf 1995, Table P). Examination of these<br />
tables reveals that P d<br />
estimates are very sensitive to sample<br />
size for low percentage values (i.e. strongly clonal populations).<br />
In<strong>de</strong>ed, this estimator can be seriously biased when<br />
analysing data from population with an extreme composition,<br />
such as monoclonal stands (richness will be overestimated),<br />
particularly when sample sizes are small. As an<br />
example, the finding of a single MLG among 20 individuals<br />
(i.e. a monoclonal set) would still lead to an estimated P d<br />
of<br />
0.05, the same as encountering five distinct clonal lineages<br />
among 100 sampling units. To attenuate this flaw for the<br />
extreme cases of monoclonal or low richness stands with<br />
small sample size, a slight modification has been proposed<br />
by Dorken & Eckert (2001) as R (Box 2, equation 16). Clonal<br />
diversity ranges across all possible values (from monoclonal<br />
R = 0 to absence of clonality R or P d<br />
= 1) across studies<br />
(Fig. 1b, Table 2), reflecting the variable extent of clonality<br />
of populations. Moreover, studies including comparative<br />
analyses of R or P d<br />
across populations typically display<br />
broad differences among populations of individual species<br />
(Table S1). Numerous examples can be observed in<br />
all kinds of organisms, where the same species can occur<br />
64<br />
© 2007 The Authors<br />
Journal compilation © 2007 Blackwell Publishing Ltd
POPULATION STRUCTURE AND CLONALITY 5123<br />
Table 1 Sampling geometries, strategies, and statistics used for clonal plants in 246 reviewed articles. The symbols are linking this information<br />
to the text and to the raw data available in Table S1, Supplementary material, <strong>de</strong>tailing the findings of the literature review. The percentage<br />
of studies using various sampling geometries (shape of the area sampled) and sampling strategies (choice of sampling units) is<br />
<strong>de</strong>tailed; the frequency of the statistics used to <strong>de</strong>scribe clonal richness and diversity, as well as to ascertain clonal i<strong>de</strong>ntity of the replicates<br />
of the same MLG are also <strong>de</strong>tailed. Finally, recommendations are suggested as to the use of sampling geometries, strategies and the choice<br />
of statistics (labelled * and ** corresponds to recommen<strong>de</strong>d and highly recommen<strong>de</strong>d methods, respectively)<br />
Description<br />
Symbols<br />
Percentage<br />
of studies<br />
Recommendation<br />
(if any)<br />
Sampling<br />
Sampling geometry<br />
Un<strong>de</strong>fined G u<br />
46.7 Avoid<br />
Linear L 46.7 Avoid<br />
Rectangles Q 28.9 * , †<br />
Square S 10.7 **<br />
Circle C 1.5 **<br />
Patches p 2.5 *<br />
Sampling strategy<br />
Un<strong>de</strong>fined nd 25.9 Avoid<br />
Haphazard h 26.4 Avoid<br />
Regular re 21.8 *<br />
Random coordinates ra 3.0 **<br />
Minimum spacing min 18.8 * , ‡<br />
Exhaustive exh 6.6 * , §<br />
Coordinates coord. 33.7<br />
Statistics<br />
Richness<br />
No estimates — 18.8 Avoid<br />
Number of genotypes G 68.0 *<br />
Ratio (G/N) P d<br />
(or IC = 1 – P d<br />
) 37.1 *<br />
Ratio (G − 1)/(N − 1) R 1.0 ** , <br />
Resampling to standardize richness estimates<br />
sub-sampling 0.7 ** , ††<br />
to the minimum sample size<br />
Heterogeneity and evenness<br />
Simpson complement D* 31.0 ** , ‡‡<br />
Simpson (or Fager) evenness V 15.2 *<br />
Shannon-Wiener H' 5.0 *<br />
Shannon-Wiener evenness V'H' 1.0 *<br />
P (getting the most common MLG by chance) PG 1.5 *<br />
Ascertain clonal i<strong>de</strong>ntity (Studies not consi<strong>de</strong>ring by <strong>de</strong>fault i<strong>de</strong>ntical MLG=i<strong>de</strong>ntical clones)<br />
25.8<br />
Probability of a given MLG p gen<br />
15.2 Avoid, §§<br />
p(getting a given MLG n times by chance) p n gen<br />
6.3 Avoid, <br />
p(i<strong>de</strong>ntical MLG to <strong>de</strong>rive from distinct reproductive events) p sex<br />
4.6 **<br />
1/G max simulated<br />
or (1 − p i<strong>de</strong>ntity<br />
) (with the set of loci used) 1−p i<strong>de</strong>ntity<br />
2.0 Avoid, †††<br />
†If low perimeter/area ratio, note that squares and circles are inducing less edge effect.<br />
‡If based on pilot studies or prior knowledge of average clonal size.<br />
§If not <strong>de</strong>trimental to the population.<br />
Minimize the bias when N is low (lower than 20).<br />
††If necessary for comparison purposes.<br />
‡‡The less redundant with classical richness estimates.<br />
§§Is the probability of getting a given MLGi when analyzing only one sampling unit, without taking into account the number of sampling<br />
units, N, collected and analyzed.<br />
Delivers the probability of getting n times a given MLG when analyzing exactly n and not N (sample size) sampling units.<br />
†††An average value is not reliable as the probability may be extremely distinct among genotypes, besi<strong>de</strong>s, this method does not take into<br />
account the number of sampling units analyzed.<br />
© 2007 The Authors<br />
Journal compilation © 2007 Blackwell Publishing Ltd<br />
65
5124 S. ARNAUD-HAOND ET AL.<br />
Table 2 Range of values reported for the main indices of clonal diversity and clonal size (linear) or surface area encompassed in different<br />
categories of clonal organisms (values for each study are <strong>de</strong>tailed in Table S1)<br />
Organisms R or P d<br />
diversity<br />
Simpson<br />
Simpson<br />
evenness Clonal size (m) Clonal area (m)<br />
Terrestrial plants [0.00, 1.00] [0.00, 1.00] [0.00, 1.00] [0.25, 1000.00] [1.00, 7000.00]<br />
Aquatic plants [0.00, 1.00] [0.00, 0.99] [0.00, 0.99] 30.00 —<br />
Marine plants [0.00, 1.00] [0.00, 1.00] [0.00, 1.00] [8.00, 80.00] [31.00, 6400.00]<br />
Marine invertebrates [0.03, 1.00] — — — —<br />
both in monoclonal stands and in stands where the clonal<br />
diversity reaches, or almost, its maximum (Piquot et al.<br />
1996; Ayre & Hughes 2000; Freeland et al. 2000; Kapralov<br />
2004; Olsen et al. 2004; Halkett et al. 2005a) These observations<br />
show that the extent of clonality is highly flexible not<br />
just among but also within clonal species, suggesting<br />
consi<strong>de</strong>rable plasticity in the apportioning of reproductive<br />
effort between clonality and sexual reproduction.<br />
Finally, several methods have been <strong>de</strong>veloped and mostly<br />
used for clonal invertebrates (Stoddart 1983; Stoddart &<br />
Taylor 1988; Uthike et al. 1998), to estimate the sexual vs.<br />
clonal input with a limited set of markers (see Box 2,<br />
equations 17–19).<br />
Clonal heterogeneity<br />
Clonal richness indices only <strong>de</strong>scribe the proportion of the<br />
sample that is variable and do not <strong>de</strong>scribe the distribution<br />
of the sampling units among MLLs (i.e. evenness). In<strong>de</strong>ed<br />
for the same amount of clonal richness, the sample could<br />
comprise either very few highly represented clonal lineages<br />
with several rare ones, or evenly distributed ones. Discriminating<br />
between these contrasting clonal compositions is<br />
essential, since clonal heterogeneity is a fundamental feature<br />
<strong>de</strong>termining the ecology and evolution of the populations.<br />
This issue parallels the old <strong>de</strong>bate in ecology, when the<br />
need to combine richness with evenness was proposed to<br />
<strong>de</strong>scribe species heterogeneity in communities (Simpson<br />
1949; Peet 1974). In<strong>de</strong>ed species heterogeneity indices have<br />
been borrowed to <strong>de</strong>scribe clonal diversity (Parker 1979;<br />
Ellstrand & Roose 1987).<br />
The most wi<strong>de</strong>ly used in<strong>de</strong>x of clonal heterogeneity (28%<br />
of the studies reviewed) is the Simpson in<strong>de</strong>x (Simpson 1949),<br />
which was <strong>de</strong>veloped originally to calculate the probability<br />
that two individuals selected at random from the sample<br />
will belong to the same species. When applied to clonal<br />
diversity, this can be interpreted as estimating the probability<br />
that two sample units chosen at random from the sample<br />
universe would belong to the same clonal lineage (Box 3,<br />
equations 20–22). The reciprocal in<strong>de</strong>x (Hurlbert 1971; Hill<br />
1973), reflects the ‘apparent number of clonal lineages in the<br />
sample’ (Box 3, equation 23).<br />
The Shannon-Wiener’s in<strong>de</strong>x is the best known and most<br />
used diversity in<strong>de</strong>x in ecology, although it has only been<br />
used in about 6% of the articles on clonal diversity. It was<br />
<strong>de</strong>rived in<strong>de</strong>pen<strong>de</strong>ntly by Shannon and Wiener (Wiener<br />
1948, Shannon & Weaver 1949 both in Washington 1984;<br />
see also Washington 1984 for clarification on the incorrect<br />
use of the <strong>de</strong>signation Shannon-Weaver). It should be noted<br />
that this last in<strong>de</strong>x is prone to a large sampling variance<br />
(Pielou 1966). For a given clonal richness, the Shannon-Wiener<br />
in<strong>de</strong>x is not expected to be very sensitive to the variation in<br />
the dominance of a particular MLL, whereas for a constant<br />
dominance it is more sensitive than the Simpson’s in<strong>de</strong>x to<br />
the increase in the number of rare MLLs (Peet 1974).<br />
The choice of in<strong>de</strong>x <strong>de</strong>pends on the question posed.<br />
If the goal is the estimation of genotypic diversity or the<br />
amount of sexual vs. asexual reproduction in different<br />
populations, then the Shannon-Wiener’s estimators may be<br />
most a<strong>de</strong>quate. On the other hand, if the study addresses<br />
historical processes, such as the way colonization occurred<br />
in different populations, or ecological processes such as<br />
intraspecific competition un<strong>de</strong>r different environmental<br />
conditions, the Simpson’s in<strong>de</strong>x may be more informative.<br />
However, the interpretation of spatial or temporal variability<br />
with either of these indices is often difficult given<br />
that they vary with both clonal richness and evenness,<br />
making it often necessary to assess these two components<br />
in<strong>de</strong>pen<strong>de</strong>ntly of each other. In all of the distinct types of<br />
organisms studied, wi<strong>de</strong>ly diverse Simpson clonal heterogeneity<br />
values were reported ranging between 0 and 1<br />
(Table 2), consistent with the similarly broad ranges of R.<br />
Clonal evenness<br />
As the indices of heterogeneity do not reflect equitability,<br />
the indices of evenness used in ecology have also been<br />
adapted to estimate the equitability in the distribution of<br />
clonal membership among samples. The indices of heterogeneity<br />
of Simpson and Shannon both have a corresponding<br />
in<strong>de</strong>x of evenness (Box 3, equations 26 and 27). Both of these<br />
most commonly used evenness indices (respectively in 12%<br />
and 1% studies) vary from 0 to 1 when all MLLs have equal<br />
abundance. The performance of equitability indices is<br />
66<br />
© 2007 The Authors<br />
Journal compilation © 2007 Blackwell Publishing Ltd
POPULATION STRUCTURE AND CLONALITY 5125<br />
Box 3 Clonal heterogeneity and evenness<br />
estimates<br />
Clonal heterogeneity<br />
Gpop<br />
Simpson in<strong>de</strong>x: λ=<br />
(eqn 9)<br />
∑ p2<br />
i<br />
i=<br />
1<br />
where p i<br />
is the frequency of the MLLi in the population,<br />
and G pop<br />
the number of distinct MLLs in the population.<br />
An unbiased estimator of λ for a sample of size N is:<br />
G<br />
⎡ ni<br />
ni<br />
− ⎤<br />
L = ∑ ⎢<br />
( 1 )<br />
⎥<br />
i=<br />
1 ⎣ NN ( − 1)<br />
⎦<br />
(eqn 10)<br />
where G is the number of MLLs <strong>de</strong>tected in the<br />
sample, and n i<br />
is the number of sampled units with<br />
the MLLi.<br />
The Simpson in<strong>de</strong>x can be modified to vary positively<br />
with heterogeneity (Pielou 1969), as an in<strong>de</strong>x first proposed<br />
in economical sciences (Gini 1912; Peet 1974), and<br />
the resulting complement of Simpson in<strong>de</strong>x then <strong>de</strong>scribes<br />
the probability of encountering distinct MLLs when<br />
randomly taking two units in the sample:<br />
Gpop<br />
∑ p i<br />
i=<br />
1<br />
Simpson’s complement: D = 1 −<br />
2<br />
(eqn 11)<br />
pop<br />
for which the unbiased estimator from a sample of size<br />
N is D* = 1 – L that ranges from 0 to almost 1 − (1/G).<br />
As proposed for species heterogeneity indices, the<br />
reciprocal of Simpson in<strong>de</strong>x is:<br />
Simpson’s reciprocal: 1<br />
(eqn 12)<br />
λ<br />
for which the unbiased estimator for a sample of size N<br />
is 1/L.<br />
Simpson’s reciprocal ranges from 1 to G, and it can<br />
be interpreted as the number of equally represented<br />
MLLs required to obtain the same heterogeneity as<br />
observed in the sample (Hurlbert 1971; Hill 1973), or<br />
as the ‘apparent number of clonal lineages in the<br />
sample’.<br />
The Shannon-Wiener’s in<strong>de</strong>x <strong>de</strong>scribes clonal diversity<br />
as:<br />
Gpop<br />
∑<br />
H′ =− p logp<br />
i=<br />
1<br />
i<br />
i<br />
(eqn 13)<br />
using the estimator:<br />
H′′ =−<br />
(eqn 14)<br />
This in<strong>de</strong>x quantifies the level of uncertainty regarding<br />
the MLL of a sample unit taken at random (Pielou<br />
1966). This in<strong>de</strong>x of clonal diversity increases with the<br />
number of MLLs and the evenness in the assignment<br />
of individuals (ramets) to the MLLs, since this leads<br />
to a greater uncertainty in predicting the MLL of a<br />
randomly drawn sample unit.<br />
Clonal evenness<br />
A way of <strong>de</strong>scribing clonal equitability, which is<br />
in<strong>de</strong>pen<strong>de</strong>nt of clonal richness but not explicitly<br />
<strong>de</strong>scribed by any diversity in<strong>de</strong>x (see above), is to use<br />
an evenness in<strong>de</strong>x. So far the most wi<strong>de</strong>ly used<br />
evenness in<strong>de</strong>x in clonal plant studies is the Simpson’s<br />
complement in<strong>de</strong>x (Hurlbert 1971; Fager 1972):<br />
(eqn 15)<br />
with D min<br />
and D max<br />
being the approximate minimum<br />
and maximum values of Simpson’s complement in<strong>de</strong>x<br />
given the sample size N and the sample clonal richness<br />
G, estimated as:<br />
This evenness formulation can also be used with the<br />
Shannon-Wiener in<strong>de</strong>x (e.g. Hurlbert 1971), or alternatively<br />
evenness can also be estimated as V′, the ratio of<br />
observed to maximal diversity (using either heterogeneity<br />
in<strong>de</strong>x). In this case, when using the Shannon-Wiener<br />
in<strong>de</strong>x, the corresponding evenness in<strong>de</strong>x, sometimes<br />
called Pielou’s evenness (J′, Pielou 1975) and hereafter<br />
referred to as such, can be estimated as:<br />
where<br />
G<br />
∑<br />
i=<br />
1<br />
ni<br />
ni<br />
log<br />
N N<br />
( D−<br />
Dmin)<br />
V =<br />
( D − D )<br />
D<br />
D<br />
min<br />
max<br />
max<br />
min<br />
⎡( 2N − G) × ( G−1)<br />
⎤ N<br />
= ⎢<br />
⎣ N<br />
⎥<br />
⎦<br />
× and<br />
2<br />
( N − 1)<br />
=<br />
J′ = VH ′ ′′=<br />
( G − 1)<br />
G<br />
H′′<br />
′′<br />
H max<br />
N<br />
×<br />
( N − 1)<br />
H′ max<br />
= log G.<br />
(eqn 16)<br />
© 2007 The Authors<br />
Journal compilation © 2007 Blackwell Publishing Ltd<br />
67
5126 S. ARNAUD-HAOND ET AL.<br />
Box 4 Power law (Pareto) distribution of clonal<br />
membership<br />
The distribution of elements into size classes has been<br />
shown to follow a power law for a very broad diversity<br />
of systems and phenomena, all of which (from distributions<br />
in social sciences to astrophysics and the<br />
commonality of gene expression) conform to a particular<br />
probability <strong>de</strong>nsity distribution referred to as the<br />
Pareto distribution (e.g. Pareto 1897 in Vidondo et al.<br />
1997; Ueda et al. 2004). A power law distribution applies<br />
to systems where the distribution of elements into<br />
classes is highly skewed, with much fewer large classes<br />
than small ones. The use of a power distribution allows<br />
the efficient and parsimonious <strong>de</strong>scription of the distribution<br />
of the studied elements into classes. We therefore<br />
propose here the use of the Pareto distribution as a continuous<br />
approximation to <strong>de</strong>scribe the discrete distribution<br />
of sample units, or ramets (elements) into groups of<br />
clonal sizes (classes), where clonal sizes are <strong>de</strong>fined by<br />
the number of sampling units belonging to that clone<br />
(MLL). This relationship is <strong>de</strong>scribed by the equation:<br />
N<br />
≥X<br />
= aX−<br />
β<br />
(eqn 17)<br />
where N ≥X<br />
is the number of sampled ramets belonging<br />
to lineages (MLLs) containing X, or more, ramets in<br />
the sample of the population studied, and the parameters<br />
a and β are fitted by regression analysis. In<br />
practice, the power slope (–β) is <strong>de</strong>rived as the slope of<br />
the fitted log-log regression equation <strong>de</strong>scribing the rate<br />
of <strong>de</strong>cline in the relative frequency of ramets that belong<br />
to MLLs of size equal to or larger than a given number<br />
of ramets X (when both are in log scale; Fig. B4.1). The<br />
parameter β (–slope) therefore indicates the scaling of<br />
the partitioning of the ramets among MLL size classes<br />
(Fig. B4.1).<br />
Fig. B4.1: (a) Distribution of replicates among MLLs<br />
in Cymodocea nodosa from Alfacs Bay (Alberto et al. 2005),<br />
showing the steep <strong>de</strong>cline in number of MLLs with<br />
increasing clonal membership typical of power law<br />
distributions; (b) transformed into a log-log reverse<br />
cumulative distribution.<br />
Fig. B4.1<br />
<strong>de</strong>pen<strong>de</strong>nt on that of the heterogeneity indices they are<br />
based upon: if based on the Shannon-Wiener in<strong>de</strong>x, they<br />
will give more weight to the rarer components (species<br />
or genotypes) than when based on the Simpson in<strong>de</strong>x.<br />
In addition, a review of these and other evenness indices<br />
(Smith & Wilson 1996) reports that V’H′′ (= J′, equation 27)<br />
remains sensitive to changes in richness (also shown here<br />
below) <strong>de</strong>spite inten<strong>de</strong>d to be in<strong>de</strong>pen<strong>de</strong>nt of richness.<br />
As for richness and diversity, Simpson evenness values<br />
encompass the maximum, or almost the maximum, range<br />
(Table 2).<br />
Clonal distribution<br />
In fact, the problem on hand amounts to the <strong>de</strong>scription of<br />
the distribution of elements (ramets) into classes (clonal<br />
lineages, or genets), so that the use of a <strong>de</strong>nsity distribution<br />
may be more appropriate than the calculation of a compound<br />
in<strong>de</strong>x. An overview of the literature shows that the distribution<br />
of replicates among lineages, when <strong>de</strong>tailed, is always<br />
left skewed (all of the 45 studies reporting this information)<br />
with an exponential <strong>de</strong>cay (Table S1). Transformed in a reverse<br />
cumulative frequency distribution, this empirical distribution<br />
can be approximated by a power law distribution, appropriately<br />
<strong>de</strong>scribed by the Pareto distribution (e.g. Pareto 1897 in<br />
Vidondo et al. 1997; Box 4). All of the distributions of clonal<br />
membership found in the literature review conformed to<br />
the Pareto. This distribution in<strong>de</strong>ed applied to a range of<br />
clonal organisms encompassing herbaceous plants and<br />
trees (Parks & Werth 1993; Hangelbroek et al. 2002; Chung<br />
et al. 2004; Nagamitsu et al. 2004), corals (Bastidas et al. 2001;<br />
Le Goff-Vitry et al. 2004), bivalves (Taylor & Foighil 2000),<br />
and ostracods (Cywinska & Hebert 2002). The mo<strong>de</strong>l was<br />
shown to appropriately fit all of the distributions, with all<br />
68<br />
© 2007 The Authors<br />
Journal compilation © 2007 Blackwell Publishing Ltd
POPULATION STRUCTURE AND CLONALITY 5127<br />
Fig. 2 Pareto plots showing the distribution of clonal membership across a range of species of terrestrial plants (Chung et al. 2004;<br />
Nagamitsu et al. 2004) and marine invertebrates: corals (Bastidas et al. 2001; Le Goff-Vitry et al. 2004), clams (Taylor & Foighil 2000) and<br />
ostracods (Cywinska & Hebert 2002). Pareto plots represent the fraction of sampling units belonging to clones representing by ≥ X units as<br />
a function of X on a double logarithmic scale (Y = proportion of sampling units belonging to clonal lineages represented in the samples by<br />
X or more sampling units, and X = observed clonal sizes quantified as the numbers of sampling units found for every clonal lineage). This<br />
plot should display a straight line if the distribution of clonal membership conforms to a Pareto distribution, and the Pareto parameters can<br />
be estimated from the least squares regression line. The coefficient β, <strong>de</strong>scribing the Pareto distribution (–1 × regression slope), the<br />
correlation coefficient (r 2 ) and the significance of the regression (P value) are given for each panel.<br />
regressions showing high significance and high r 2 values<br />
spanning from 0.84 to 0.99 (Fig. 2). Hence, the Pareto mo<strong>de</strong>l<br />
a<strong>de</strong>quately <strong>de</strong>scribes the frequency distribution of clonal<br />
membership for populations of clonal organisms.<br />
Now, the next step would be to be able to interpret the<br />
Pareto distribution in terms of diversity and evenness.<br />
Simulations, <strong>de</strong>scribed in <strong>de</strong>tail in the Supplementary<br />
material, were performed to explore cases where evenness<br />
would vary when diversity would be fixed, and conversely,<br />
in or<strong>de</strong>r to relate the properties of diversity and evenness<br />
in the populations studied and the shape and parameters<br />
of the Pareto distribution. The results (Fig. 3) show that the<br />
slope of the Pareto distribution, β, increases exponentially<br />
with increasing evenness of the distribution of sampling<br />
units into MLLs (with r 2 ranging from 0.62 to 0.93 <strong>de</strong>pending<br />
on the richness level). A high evenness with clonal lineages<br />
all having approximately comparable sizes, will therefore<br />
result in a steep slope (high β value), whereas the outcome<br />
of a skewed distribution with very few, large clonal lineages<br />
and many small ones will be a shallow slope (low β<br />
© 2007 The Authors<br />
Journal compilation © 2007 Blackwell Publishing Ltd<br />
69
5128 S. ARNAUD-HAOND ET AL.<br />
Fig. 3 The relationship between the parameters <strong>de</strong>scribing the Pareto distribution, and the richness and evenness level in the samples<br />
analysed. The data were obtained on the basis of simulations by distributing replicates (N = 50) among groups of genotypes (G=5, 15, 25,<br />
30, 45) across an increasing level of evenness (E = 1–5). The right panel illustrates the exponential increase of the Pareto parameter β with<br />
the level of evenness (r 2 between 0.60 and 0.93) for the five levels of richness explored. The left panel shows the exponential <strong>de</strong>crease in the<br />
size of the smallest size of genotype groups (in terms of number of replicates) with the increase in richness (r 2 between 0.91 and 0.99) for<br />
the five levels of evenness used.<br />
value). Also, the results of the simulation showed that<br />
the sizes of the smallest and highest MLLs classes <strong>de</strong>crease<br />
exponentially with increasing richness (with r 2 ranging,<br />
respectively, from 0.88 to 0.99 and from 0.89 to 0.99 <strong>de</strong>pending<br />
on the evenness level), so that as the lowest and highest<br />
size classes tend to get larger, the richness is expected to<br />
<strong>de</strong>crease. The Pareto distribution is therefore influenced<br />
both by richness and evenness, and provi<strong>de</strong>s an intuitive,<br />
graphical <strong>de</strong>piction of the heterogeneity in the distribution<br />
of replicates among lineages, which appears to be of<br />
universal application to populations of clonal organisms.<br />
The representation of the Pareto distribution synthesizes<br />
the information in graphical form, rather than simply as a<br />
compound numerical estimate as the other indices reviewed<br />
here do, providing a clear <strong>de</strong>piction of the size distribution<br />
of clonal lineages in the population (Fig. 2). The β values<br />
obtained by compiling these data from the literature were<br />
spanning between 0.88, indicating a skewed distribution<br />
with dominance of some big clonal lineages and 2.96 indicating<br />
much higher evenness, although the minimum (i.e.<br />
most skewed) we observed, with β = 0.06, is a meadow of<br />
Posidonia oceanica dominated by a very big genet surroun<strong>de</strong>d<br />
by several marginally represented MLG; Fig. 4). In the highest<br />
evenness scenario where all lineages bear the same number<br />
of replicates, estimation of the Pareto distribution parameters<br />
by regression is likely not to be possible as only one or two<br />
points would be available, but in this particular case, the<br />
interpretation of this finding as revealing extreme evenness<br />
is sufficient, provi<strong>de</strong>d enough lineages have been sampled.<br />
Furthermore, the maximum clonal size reached in terms<br />
of number of sampling units, and the frequency of those<br />
relatively dominant clonal lineages can also be observed on<br />
the graph (Fig. 2). An additional property, is that the application<br />
of the Pareto distribution allows calculation of the<br />
fractal dimension of the process un<strong>de</strong>r study, here the distribution<br />
of clonal size in the population, which equals 1 +<br />
β (Schroe<strong>de</strong>r 1991), allowing, among other <strong>applications</strong>,<br />
the simulation of populations with a genetic structure<br />
similar to observed ones. Finally, the use of the Pareto distribution<br />
to <strong>de</strong>scribe the distribution of ramets into clonal<br />
lineages has the additional advantage that it is based on<br />
linear regression, providing estimates of uncertainty, therefore<br />
allowing statistical comparisons, which is not readily<br />
possible for other indices of clonal diversity.<br />
The use of the Pareto distribution to <strong>de</strong>scribe clonal<br />
diversity is exemplified here for the Mediterranean seagrass<br />
(P. oceanica) populations sampled. The fitted Pareto<br />
distributions yiel<strong>de</strong>d β values that ranged between 0.033<br />
± 0.015, for Sa Paret (Cabrera, Balearic islands; Fig. 4),<br />
a population which was dominated by a large clonal lineage<br />
that contained most of the shoots sampled (35 of 40<br />
shoots), and 1.48 ± 0.52, for the Acqua Azzurra (Sicily, Italy)<br />
three populations where almost all (33) genotypes were<br />
observed once, except two represented three and four times<br />
(data not shown). Figure 4 shows contrasting Pareto distributions<br />
illustrating clonal structure in four populations<br />
with highly contrasting richness (R spanning from 0.10 to<br />
0.77) and evenness (as estimated by Simpson evenness V<br />
ranging from 0.20 to 0.73). Both richness and evenness<br />
influence the shape of the Pareto distribution and its associated<br />
β value, as can be observed by comparing samples<br />
with similar R and distinct V (Campomanes and Playa<br />
Cavallets) or, conversely, with similar V and distinct R<br />
(Carboneras and Playa Cavallets), all pairwise comparisons<br />
revealing contrasting Pareto distribution and associated<br />
β values. Yet, consistent with the results of simulations<br />
(Fig. 2), increasing richness from Carboneras to Playa<br />
Cavallets (R increasing from 0.3 to 0.73) is reflected in<br />
<strong>de</strong>creasing maximum MLL size (from 15 to 5) that can be<br />
easily <strong>de</strong>rived from the Pareto plot (provi<strong>de</strong>d comparable<br />
sample sizes, which is the case here). In the same way, the<br />
comparison of samples like Campomanes and Playa Cavallets<br />
70<br />
© 2007 The Authors<br />
Journal compilation © 2007 Blackwell Publishing Ltd
POPULATION STRUCTURE AND CLONALITY 5129<br />
Fig. 4 Pareto plot of clonal membership distribution in four populations of the seagrass Posidonia oceanica (Es Castel, Porto Colom,<br />
Campomanes, Playa Cavallets). The coefficient β, <strong>de</strong>scribing the Pareto distribution, the correlation coefficient (r 2 ) and the significance of<br />
the regression (P value) are given for each panel.<br />
shows how, R being equal, a higher evenness (as measured<br />
by Simpson in<strong>de</strong>x of evenness V increasing from 0.47<br />
to 0.77) translate into a steeper Pareto slope (with the associated<br />
β parameter of Pareto increasing from 0.40 to 1.23).<br />
Relationship and possible redundancy between the<br />
different indices of clonal diversity<br />
The various indices of clonal diversity discussed above<br />
are not in<strong>de</strong>pen<strong>de</strong>nt of each other, as they are based on<br />
the same basic information, but differ in the weight each<br />
assigns to the basic clonal richness and to the equitability of<br />
the distribution of replicates among clonal lineages. Hence,<br />
the application of all these indices may be redundant, and<br />
a small subset may suffice to capture the crucial information<br />
in terms of richness and equitability.<br />
The relationship between these different indices was<br />
assessed using correlation analysis on both empirical and<br />
simulated data sets. The empirical data set was obtained in<br />
the 34 populations of the seagrass P. oceanica used here as a<br />
test case. Monte Carlo simulations were also performed to<br />
explore the relationship between clonal diversity indices<br />
(richness, heterogeneity and evenness) and to test for the<br />
generality of the links between different indices of clonal<br />
diversity <strong>de</strong>rived from the analysis of the P. oceanica data<br />
set. The <strong>de</strong>tails on the simulations conducted are provi<strong>de</strong>d<br />
in the Supplementary material.<br />
All correlation estimates were transformed as ‘1-Pearson<br />
r’ in or<strong>de</strong>r to perform a cluster analysis and draw a hierarchical<br />
tree using this in<strong>de</strong>x as an estimate of distance<br />
among indices. These analyses were performed using<br />
statistica 6 software (StatSoft 2001).<br />
The estimates of the indices <strong>de</strong>rived from the simulated<br />
data set were in<strong>de</strong>ed positively correlated to one another<br />
(Fig. 5). Qualitatively, the same correlation structure between<br />
indices was obtained on the basis of the P. oceanica data set,<br />
with r-values quantitatively similar to those obtained on<br />
the basis of simulations (data not shown). Examination<br />
of the correlation structure between the various indices<br />
showed that the genotypic richness R, the Simpson’s complement<br />
D, the Shannon-Wiener H′, and Pielou’s evenness<br />
V′H″ are very redundant (r=0.82–0.95), whereas the Pareto<br />
β was the least redundant, followed — as expected — by the<br />
Simpson evenness V.<br />
The redundancy between these indices is synthetically<br />
grasped upon examination of the cluster linking them<br />
(Fig. 5). A relationship with richness had been reported in<br />
the literature on species diversity for the Pielou evenness<br />
© 2007 The Authors<br />
Journal compilation © 2007 Blackwell Publishing Ltd<br />
71
5130 S. ARNAUD-HAOND ET AL.<br />
Fig. 5 Cluster analysis of indices <strong>de</strong>scribing clonal diversity<br />
obtained on the basis of simulated data, using ‘1-Pearson r’ as<br />
clustering distance: clonal richness R, Shannon-Wiener’s heterogeneity<br />
H′ and Pielou evenness V’H′, Simpson’s complement<br />
heterogeneity D and evenness VD, and Pareto’s β. The same<br />
correlation and cluster structure was obtained on the basis of the<br />
Posidonia oceanica data set, with r values quantitatively similar to<br />
those obtained on the basis of simulations.<br />
in<strong>de</strong>x, when a small number of species (< 25) is observed,<br />
and can therefore apply to a large range of studies on clonal<br />
organisms, where the sample size per locality hardly<br />
encompasses 30–50, and the number of genotypes will<br />
therefore seldom be sufficient to avoid this bias (Smith &<br />
Wilson 1996). The Simpson evenness V (Hurlbert 1971) is<br />
least redundant with R (Fig. 1b; cf. Peet 1974), and appears<br />
therefore to be the most suitable in<strong>de</strong>x to estimate evenness<br />
in a given sample. Finally, the use of the Pareto distribution<br />
<strong>de</strong>livers the least redundant in<strong>de</strong>x (β), and can be useful<br />
to <strong>de</strong>pict heterogeneity. Hence, the three main types of<br />
information required to fully <strong>de</strong>scribe diversity: richness,<br />
evenness and heterogeneity are a<strong>de</strong>quately grasped by<br />
the combined use of R, V and the complement of the slope<br />
of the Pareto distribution (β), respectively. We therefore<br />
recommend use of these three metrics to <strong>de</strong>scribe clonal<br />
diversity.<br />
Spatial analyses of clonal structure<br />
Sampling geometry and strategy<br />
In contrast with species consisting of unique genotypes,<br />
clonal populations have the capacity to spread and multiply<br />
common clonal lineages in space, so that inferences about<br />
the spatial genetic structure within clonal populations are<br />
unavoidably linked to the distribution of the clonal lineages<br />
in space. Sampling <strong>de</strong>sign choices can easily influence and<br />
bias estimators of clonal diversity. Definition of the sampling<br />
strategy must consi<strong>de</strong>r: (i) sample size, (ii) sampling area<br />
size, shape, and replication, (iii) sampling regime (random,<br />
haphazard, regular), and (iv) whether to impose any minimum<br />
spacing constraints in or<strong>de</strong>r to reduce clonal repetitions<br />
in the sample. Each of these choices critically affects the<br />
perceived genetic structure of the population and should<br />
be therefore adopted on the basis on an informed un<strong>de</strong>rstanding<br />
of the consequences of alternative choices.<br />
The choice of sampling <strong>de</strong>sign <strong>de</strong>pends on the objectives<br />
of the study. If the main objective is comparison with previous<br />
studies, the best choice may be to use the same<br />
sampling methods and scheme, though possibly fraught<br />
with other problems, in or<strong>de</strong>r to avoid confounding the<br />
comparison with effects of differential sampling. When<br />
the objective is to estimate clonal diversity in a population,<br />
the i<strong>de</strong>al sampling <strong>de</strong>sign would be a random sampling<br />
along the distributional area of the entire target population<br />
so that every possible sampling unit would have equal probability<br />
of being inclu<strong>de</strong>d in the sample. In cases of patchy<br />
distribution of individuals, random coordinates can be<br />
generated and adjusted to the nearest possible sampling<br />
unit once on the field. Only this scheme would minimize<br />
bias in the estimation of diversity indices (Pielou 1966),<br />
and <strong>de</strong>liver the best approximation of the real population<br />
values (but see the next section on sampling <strong>de</strong>nsity). This<br />
i<strong>de</strong>al sampling regime is, however, often practically difficult,<br />
particularly in cases of patchy distribution of populations,<br />
and bias <strong>de</strong>rived from <strong>de</strong>viations from randomness<br />
and an uneven distribution across the whole population<br />
area are often introduced. An appropriate alternative may<br />
be a hierarchical (multistage sampling at randomly selected<br />
clusters) or a stratified random sampling <strong>de</strong>sign, particularly<br />
appropriate for heterogeneous populations where<br />
conspicuous subunits exist that can be <strong>de</strong>fined as sampling<br />
strata (e.g. areas of different population <strong>de</strong>nsities). Each of<br />
the sampling cluster or stratum should be several times<br />
larger than the expected clonal size, and each sampled in<br />
sufficient numbers to yield representative estimates of<br />
the proportion of distinct clonal lineages within sampled<br />
areas. The replication of these areas in different zones of the<br />
population reduces the potential bias due to larger-scale<br />
heterogeneity within the target population, and in fact allows<br />
testing for such heterogeneity, an important advantage<br />
over simple random sampling.<br />
Any sampling addressing the spatial structure of clonal<br />
lineages must be conducted along a two-dimensional area<br />
(i.e. avoiding linear transects, see below) recording the<br />
corresponding X–Y coordinates (absolute or relative). The<br />
location of the sampling units (i.e. the sampling coordinates)<br />
within this area can be selected randomly, haphazardly,<br />
or un<strong>de</strong>r a variety of regular schemes (e.g. simple lattice,<br />
hierarchical grid). Regular spacing of sampling coordinates<br />
should be based on information allowing best choice of<br />
relevant pore sizes (i.e. geographic distance between<br />
sampling units) in or<strong>de</strong>r to avoid bias. For instance, if<br />
72<br />
© 2007 The Authors<br />
Journal compilation © 2007 Blackwell Publishing Ltd
POPULATION STRUCTURE AND CLONALITY 5131<br />
Table 3 Influence of the sampling area geometry on the estimation of the number of genotypes (G) and genotypic richness (R), on the<br />
importance of edge effect (E e<br />
) and on its significance tested with a 1000 random resampling procedure (number of p (observe >random)<br />
5132 S. ARNAUD-HAOND ET AL.<br />
Box 5 Spatial components of clonality<br />
Edge effect<br />
In or<strong>de</strong>r to test whether for the sampling <strong>de</strong>sign used,<br />
apparent unique or rare MLLs are more distributed<br />
towards the edges of the sampling area, thereby<br />
inducing a possible overestimation of clonal diversity,<br />
the following in<strong>de</strong>x can be estimated:<br />
E<br />
e<br />
( Du<br />
− Da) = ,<br />
Da<br />
A<br />
with D u<br />
the average geographic distance between<br />
unique MLLs and the centre of the sampling area,<br />
and D a<br />
the average geographic distance between all<br />
sampling units and the centre of the sampling area.<br />
The significance of such in<strong>de</strong>x is tested against the<br />
null hypothesis of random distribution of unique and<br />
multiply represented MLLs. In practice, the likelihood<br />
of the observed difference D u<br />
– D a<br />
being only due to<br />
chance and not to edge effect can be tested for by<br />
permuting x times the positions of the samples (i.e.<br />
randomly reassigning the sample unit to the sampling<br />
coordinates), and calculating the in<strong>de</strong>x for each permutation<br />
to obtain an empirical distribution of E e<br />
.<br />
If the observed E e<br />
value lies beyond the critical value<br />
(function of the chosen alpha) in the distribution of E e<br />
in the permuted data, then a significant edge effect is<br />
present that may cause indices of clonal diversity to<br />
overestimate the population diversity.<br />
Aggregation in<strong>de</strong>x<br />
In or<strong>de</strong>r to test for the existence of spatial aggregation<br />
of clonemates, or MLGs belonging to i<strong>de</strong>ntical<br />
MLLs, the aggregation in<strong>de</strong>x A c<br />
can be estimated as<br />
follows:<br />
P P<br />
c =<br />
( sg<br />
− sp)<br />
Psg<br />
with P sg<br />
being the average probability of clonal i<strong>de</strong>ntity<br />
of all sample unit pairs and P sp<br />
the average probability<br />
of clonal i<strong>de</strong>ntity among pairwise nearest neighbours;<br />
these are estimated from the respective observed<br />
proportions in the sample. This in<strong>de</strong>x will typically<br />
range from 0, when the probability between nearest<br />
neighbours does not differ on average from the global<br />
one, to l when all nearest neighbours preferentially<br />
share the same MLL, in a situation of spatially distant<br />
distinct clonal lineages. The statistical significance of<br />
the calculated aggregation in<strong>de</strong>x can be tested against<br />
the null hypothesis of spatially random distribution<br />
of samples using a resampling approach, whereby the<br />
individuals sampled are randomly assigned to the<br />
existing sampling coordinates.<br />
Sampling <strong>de</strong>nsity<br />
Definition of the appropriate area of a sampling cluster or<br />
stratum and sample size in each area requires an a priori<br />
estimation of the average sampling <strong>de</strong>nsity (sample units<br />
per unit area) that would be high enough to encompass<br />
several repetitions of the same clonal lineages and of the<br />
average area that would be large enough to inclu<strong>de</strong> many<br />
different clonal lineages (also see discussion of clonal<br />
subrange below). Without a priori information on clonal<br />
structure, the only guidance to <strong>de</strong>sign sampling strategies<br />
<strong>de</strong>rives, in addition to the theoretical impact of geometry<br />
on edge effects, from knowledge on the clonal growth and<br />
<strong>de</strong>mography of the species (e.g. horizontal spread rates,<br />
branching angles, lifespans), which can, alone or through<br />
the use of mo<strong>de</strong>ls (e.g. Lovett-Doust 1981; Sintes et al. 2005),<br />
provi<strong>de</strong> expectations on the linear extent of the clonal<br />
lineages. In the absence of such information, limited pilot<br />
studies may be nee<strong>de</strong>d as a basis to <strong>de</strong>sign efficient,<br />
unbiased sampling strategies. These pilot studies should<br />
be focused on resolving clonal size structure at small<br />
spatial scales, as to ascertain the sampling <strong>de</strong>nsity and/or<br />
‘pore’ size (if relevant) of the subsequent study, since<br />
clonality is often not an issue for objectives related to the<br />
largest scales.<br />
The consequence of various sampling <strong>de</strong>nsities could be<br />
assessed by using a resampling approach, whereby clonal<br />
richness indices (G and R) would be estimated for multiple<br />
random combinations of sampling units, for sample sizes<br />
ranging from 1 to N (N = total sample size in a given area;<br />
Fig. 6).<br />
Inspection of the plot of the number of genotypes (G) vs.<br />
the number of sampling units would theoretically allow,<br />
as in the case of the selection of the number of markers<br />
required (see above), selection of the minimum sampling<br />
<strong>de</strong>nsity yielding asymptotic R values. However, an associated<br />
feature to the power law distribution of clonal membership<br />
size observed in all studies examined (Figs 2 and 4) is<br />
that no asymptotic R value is obtained until an exhaustive<br />
sample of the population is reached. In the test case examined<br />
here, no asymptotic value could be observed in any<br />
of the samples of 40 Posidonia oceanica populations, except<br />
two populations with an overwhelmingly dominant single<br />
clone each (data not shown), and no asymptotic stabilization<br />
of R with increasing sampling effort was observed<br />
in the most intensively sampled population, even after<br />
74<br />
© 2007 The Authors<br />
Journal compilation © 2007 Blackwell Publishing Ltd
POPULATION STRUCTURE AND CLONALITY 5133<br />
Fig. 6 (a) The relationship between the indices of clonal richness G and R and the number of sampling units N based on data sets of Posidonia<br />
oceanica (N = 149) and Cymodocea nodosa (N = 220), illustrating the absence of an asymptotic value of R and its strong <strong>de</strong>pen<strong>de</strong>nce on<br />
sampling <strong>de</strong>nsity. (b) Spline fit <strong>de</strong>scribing the rate of change in R with increasing N (∂R/∂N) for both samples (P. oceanica: λ = 1000; r 2 = 0.21,<br />
P < 0.05; C. nodosa: λ = 1000; r 2 =0.78, P < 0.001).<br />
sampling about 150 shoots in a quadrat limited to 50 ×<br />
50 m (Fig. 6). A similar lack of asymptotic stabilization of<br />
R with increasing sampling effort was observed in both<br />
Cymodocea nodosa populations with about 220 sampling<br />
units in a 20 × 60 m area each (Fig. 6). Although the value<br />
of R does not reach an asymptote with increasing sampling<br />
effort, the rate of change in R with increasing sample size<br />
N <strong>de</strong>clines as N increases following a law of diminishing<br />
returns <strong>de</strong>scribed by the spline fit of R vs. N (Fig. 6), such<br />
that sample sizes of 50 units provi<strong>de</strong>, in the test cases examined<br />
here, an a<strong>de</strong>quate approximation of R (Fig. 6). The fact<br />
that the value of R does not reach an asymptote with<br />
increasing N is a consequence of the Pareto distribution of<br />
clonal membership, as the lack of a statistically <strong>de</strong>fined mean<br />
value, unless the entire population is sampled, is a property<br />
of power law distributions such as the Pareto distribution.<br />
Since the review presented here shows that a power law<br />
distribution of MLL size (in terms of number of replicates)<br />
appears to be a universal feature of clonal organisms (Figs 2<br />
and 4), sample sizes should be as large as possible to ensure<br />
that R values are as stable as possible (e.g. N = 50 for the<br />
examples in Fig. 6b). We therefore recommend collecting<br />
excess samples to test whether R stabilizes for a given<br />
sampling size using a subsampling approach, genotyping<br />
additional samples until a mo<strong>de</strong>st change in R with further<br />
sample size increments is achieved. In any case, the limitations<br />
imposed by this un<strong>de</strong>sirable behaviour of R should<br />
be consi<strong>de</strong>red when comparing across-studies using<br />
different sample sizes or sampling <strong>de</strong>nsity. It is also important<br />
to mention that this property being due to the power<br />
law distribution of replicates among clones, the parameters<br />
<strong>de</strong>scribing the Pareto distribution are mostly unaffected<br />
by sampling <strong>de</strong>nsity, once enough genotypes have been<br />
sampled to allow the construction of a robust regression.<br />
The Pareto distribution may therefore be much more<br />
a<strong>de</strong>quate to compare properties of clonal diversity among<br />
sites and studies with different sampling <strong>de</strong>nsity, provi<strong>de</strong>d<br />
the sampling areas are comparable.<br />
Clearly, the sampling strategy, <strong>de</strong>nsity and spatial <strong>de</strong>sign<br />
strongly affect the estimates of clonal diversity. Remarkably<br />
however, almost half (49%) of the published reports<br />
reviewed did not inclu<strong>de</strong> any mention of the geometry,<br />
area or procedure (random or haphazard vs. regular) used<br />
in sampling. Among those that provi<strong>de</strong>d sufficient <strong>de</strong>tail,<br />
the geometry ranged from circles (only six studies, representing<br />
less than 4% of the studies) to rectangles or squares<br />
(40% and 18% of the studies, respectively) and linear<br />
transects (19% of the studies). Sampling was more often<br />
random or haphazard (38% of the records) than regular<br />
(27% of the records), and a minimum spacing between<br />
© 2007 The Authors<br />
Journal compilation © 2007 Blackwell Publishing Ltd<br />
75
5134 S. ARNAUD-HAOND ET AL.<br />
sample units was set at a scale <strong>de</strong>pending on a priori<br />
knowledge of species average clonal size in 31% of the<br />
studies (Table 1). Comparative analyses among studies<br />
are ren<strong>de</strong>red cumbersome, if not impossible, by the<br />
diversity of methods used, and by the lack of information<br />
on the sampling strategy used, particularly on the sampled<br />
area.<br />
Spatial autocorrelation<br />
Spatial autocorrelation analyses have been used to<br />
ascertain the scale-<strong>de</strong>pen<strong>de</strong>nce of clonal diversity in clonal<br />
populations, including those of clonal plants (about 22% of<br />
studies on genetic structure of clonal plant populations,<br />
and 8% in other clonal organisms). These inferences were<br />
<strong>de</strong>rived from spatial autocorrelation analyses representing<br />
the average genetic distance or kinship coefficient (Loiselle<br />
et al. 1995; Ritland 1996; Epperson & Li 1997; Rousset 2000)<br />
between pairs of individuals within specific ranges of<br />
geographic distance, weighed against the average genetic<br />
distance or kinship coefficient between all paired samples<br />
in the population, plotted against distance (Fig. 7). Autocorrelograms<br />
are commonly used to infer properties not<br />
specific to clonal plants, such as dispersal scale and neighbourhood<br />
size. However, spatial autocorrelograms can also<br />
be used to infer properties specific to the clonal nature of<br />
the studied organism (Reusch et al. 1999). Spatial autocorrelograms<br />
have been applied to clonal plants in the past<br />
including or excluding replicated MLLs, <strong>de</strong>pending on<br />
the specific question addressed. The comparison of spatial<br />
autocorrelograms including and excluding replicate MLLs<br />
(Fig. 7) and the estimation of the probability of clonal<br />
i<strong>de</strong>ntity have recently been shown to allow inferences on<br />
the linear spatial domain over which clonality affects the<br />
genetic structure of the population, referred to as the ‘clonal<br />
subrange’ of the population (Harada et al. 1997; Alberto<br />
et al. 2005). Using these approaches, the clonal subrange<br />
can be operationally <strong>de</strong>scribed as the spatial scale below<br />
which the spatial autocorrelograms <strong>de</strong>rived either including<br />
or removing pairs among i<strong>de</strong>ntical MLLs converge (Fig. 7,<br />
cf. Alberto et al. 2005), and at which the probability of<br />
clonal i<strong>de</strong>ntity approaches zero (Harada et al. 1997). This<br />
clonal subrange represents the characteristic maximum<br />
size of the clonal lineages in the sample, and is the spatial<br />
scale beyond which clonality does not affect genetic structure.<br />
Application of these techniques have inferred linear clonal<br />
subranges of 20–25–30–35 m for a Mediterranean seagrass<br />
species (C. nodosa, Alberto et al. 2005), and 140–190 m for<br />
two terrestrial species, Carpobrotus sp. (Suehs et al. 2004) and<br />
Aechmea magdalenae (Murawski & Hamrick 1990), respectively.<br />
For clonal plants, autocorrelation analysis have reported<br />
important spatial structure in the distribution of clones in<br />
space, both including all sampling units in the analysis<br />
(about 80% of the studies report significant autocorrelation)<br />
or excluding the effect of clonality in the sample by removing<br />
replicates or distances among pairs of the same MLLs<br />
(61% of the studies report significant autocorrelation). The<br />
few studies reporting estimates of neighbourhood size for<br />
clonal plants show very limited linear dispersal scales, of<br />
the or<strong>de</strong>r of tens to hundreds of metres (Table 2).<br />
Finally, it may be relevant to screen for the occurrence of<br />
clonally mediated dispersal (e.g. by means of fragmentation,<br />
dispersal and re-establishment), which can be an<br />
additional efficient source of dispersal susceptible to significantly<br />
affect the genetic neighbourhood (Charpentier<br />
2001; Hammerli & Reusch 2003). The autocorrelogram may<br />
show a non-null probability of clonal i<strong>de</strong>ntity at large<br />
geographic distance scales prece<strong>de</strong>d by null for several<br />
distance classes. This may signal the occurrence of dispersal<br />
by clonal fragmentation, although the absence of<br />
such profiles cannot be used to infer the absence of this<br />
process, which may be a rare event, requiring therefore<br />
large sampling efforts for its <strong>de</strong>tection.<br />
Aggregation<br />
Knowledge of the spatial position of the individuals<br />
sampled also allows the examination of the extent to which<br />
clonal lineages occur segregated or intermingled in the<br />
population. The extent of intermingling of clones in a<br />
population therefore provi<strong>de</strong>s insight into the history of<br />
clonal growth and space occupation, and the competitive<br />
interactions among clones. A segregated distribution of<br />
the clonal lineages in space (high aggregation) may for<br />
example arise from either recent colonization, where clonal<br />
lineages are still expanding in relatively empty space or<br />
due to competitive exclusion, as observed by Cheplick<br />
(1997). Conversely, an intermingled pattern suggests either<br />
a full occupation of space by a large number of clonal<br />
lineages due to a long history following colonization and/<br />
or high <strong>de</strong>nsity, and relatively weak competitive interactions<br />
among clones. We propose that the extent of intermingling<br />
or aggregation of the clonal lineages can be assessed by<br />
comparing the probability of clonal i<strong>de</strong>ntity (set as 0 among<br />
replicates of the same MLL and 1 among sampling units<br />
belonging to distinct MLLs) between nearest neighbours<br />
relative to that between pairs of sampling units drawn at<br />
random from the population. A spatial clonal aggregation<br />
in<strong>de</strong>x, A c<br />
, can therefore be estimated as <strong>de</strong>scribed in Box 5.<br />
The application of this estimator to the 34 populations of<br />
P. oceanica sampled across the Mediterranean showed very<br />
contrasting results spanning from 0.00 ns (implying high<br />
level of intermingling) to 0.68** (implying high and significant<br />
level of spatial aggregation of ramets belonging to<br />
the same MLLs). These two extremes were observed in two<br />
populations of the Balearic Islands, showing high variability<br />
in the extent of aggregation of clones in populations located<br />
relatively close to one another.<br />
76<br />
© 2007 The Authors<br />
Journal compilation © 2007 Blackwell Publishing Ltd
POPULATION STRUCTURE AND CLONALITY 5135<br />
Fig. 7 Spatial autocorrelation analysis of Cymodocea nodosa in Alfacs Bay (from Alberto et al. 2005). (a) Clonal structure and subrange (on<br />
top). Kinship estimates from all ramet pairs or only for pairs between ramets showing a different multilocus genotype, and probability of<br />
clonal i<strong>de</strong>ntity (proportion of pairs between ramets with i<strong>de</strong>ntical multilocus genotypes), with confi<strong>de</strong>nce limits (for P = 0.975 and P = 0.025)<br />
based on 1000 permutations of spatial coordinates. (b) Genet level analysis (below), using a single copy for each multilocus genotype. The<br />
slope of the regression of mean kinship estimates as a function of the logarithm of spatial distance is plotted on the left, using as spatial<br />
coordinates the central zone occupied by multiramet genets, with broken lines <strong>de</strong>limiting 95% confi<strong>de</strong>nce limits around the null hypothesis<br />
of random distribution of genets in space. On the right si<strong>de</strong> a single ramet per multiramet genet was randomly selected to create a 100-genet<br />
data file to generate the confi<strong>de</strong>nce limits for the correlogram.<br />
Software<br />
Some recently published software compute most of the<br />
indices and metrics <strong>de</strong>tailed in this work (Box 6), mlgsim<br />
(Stenberg et al. 2003), genalex (Peakall & Smouse 2006),<br />
genotype and genodive (Meirmans & Van Tien<strong>de</strong>ren<br />
2004), and genclone 1.0 (Arnaud-Haond & Belkhir 2007).<br />
Methods to assess clonality and clonal membership are<br />
available in all of them with slight differences, but only<br />
the last two, genotype and genodive (Meirmans & Van<br />
Tien<strong>de</strong>ren 2004) and genclone 1.0 (Arnaud-Haond &<br />
Belkhir 2007) allow resampling procedures to test for the<br />
© 2007 The Authors<br />
Journal compilation © 2007 Blackwell Publishing Ltd<br />
77
5136 S. ARNAUD-HAOND ET AL.<br />
Box 6 Software available to analyse molecular data on populations of clonal organisms<br />
Data sets analysed, methods to assess clonality and clonal membership, clonal diversity estimates, and methods proposed to<br />
<strong>de</strong>scribe spatial components of clonal growth: genalex (Peakall & Smouse 2006), genclone (Arnaud-Haond & Belkhir 2007),<br />
genotype and genodive (Meirmans & Van Tien<strong>de</strong>ren 2004) and mlgsim (Stenberg et al. 2003).<br />
mlgsim<br />
genotype<br />
and genodive genalex genclone<br />
Data sets<br />
Levels of ploidy Haploid ✓ ✓<br />
Diploid ✓ ✓ ✓ ✓<br />
Polyploid<br />
✓<br />
Markers Dominant ✓ ✓<br />
Codominant ✓ ✓ ✓ ✓<br />
Clonality and clonal membership<br />
MLGs discrimination ✓ ✓ ✓ ✓<br />
MLLs: use of frequency distribution of Frequency distribution ✓ ✓<br />
pairwise differences to group MLGs likely Allelic distance ✓ ✓<br />
to be distinct due to somatic<br />
Length distance (microsatellites)<br />
✓<br />
mutation or scoring errors<br />
Custom distance<br />
✓<br />
Probability of clonality, or of clonal i<strong>de</strong>ntity P gen<br />
✓ ✓ ✓ ✓<br />
P sex<br />
✓ ✓ ✓ ✓<br />
and confi<strong>de</strong>nce interval<br />
✓<br />
P I<br />
(exclusion over the sample)<br />
✓<br />
Subsampling frequency to test for<br />
✓<br />
the efficiency of the set of marker used<br />
Subsampling procedure to correct<br />
✓<br />
✓<br />
richness indices for different sample size<br />
Clonal richness and diversity<br />
Clonal richness G ✓ ✓<br />
P d<br />
✓ ✓<br />
R<br />
✓<br />
Clonal diversity and evenness Shannon diversity and evenness ✓ ✓<br />
Simpson diversity and evenness<br />
✓<br />
Hill diversity<br />
✓<br />
Pareto distribution ✓*<br />
Spatial components of clonality<br />
(When coordinates are available) Map clone ✓ ✓<br />
Clone size ✓ ✓<br />
Clonal subrange<br />
✓<br />
Spatial autocorrelation<br />
✓<br />
Edge effect ✓ ¥<br />
Aggregation in<strong>de</strong>x ✓ ¥<br />
*available in the newly released version of genclone, genclone 2.0.<br />
accuracy of the set of samples and loci used. The same two<br />
software, genodive and genclone 1.0, allow estimating<br />
richness and diversity indices, but only the latter allows<br />
estimating Simpson and <strong>de</strong>rived indices (Hill’s and<br />
evenness).<br />
Spatial components can be analysed using either genalex<br />
or genclone 1.0 by mapping clones or estimating maximum<br />
clone size and the latter also allows performing<br />
clonal subrange analysis and implements specific spatial<br />
autocorrelation methods adapted to the occurrence of<br />
replicates of the same genotype in the data set.<br />
Finally, the Pareto distribution and parameter, aggregation<br />
in<strong>de</strong>x and edge effects are proposed in the new<br />
version of the software genclone, genclone 2.0 (Arnaud-<br />
Haond, Belkhir, available for download on genclone<br />
website).<br />
78<br />
© 2007 The Authors<br />
Journal compilation © 2007 Blackwell Publishing Ltd
POPULATION STRUCTURE AND CLONALITY 5137<br />
Prospect<br />
The rapid growth in the research effort examining the<br />
clonal structure of populations is providing an important<br />
empirical basis to probe the implications of clonality. As<br />
this empirical basis grows ever larger, there is a need to<br />
standardize procedures to allow comparative analyses to<br />
be formulated and common patterns in the clonal diversity<br />
and structure of clonal populations to emerge. As discussed<br />
above, comparisons across studies are not straightforward<br />
as most of the <strong>de</strong>scriptors of clonal structure are strongly<br />
sensitive to sampling choices; hence the need to move<br />
towards standardized procedures.<br />
We recommend that studies of clonal diversity and<br />
structure be based on samples collected at random coordinates<br />
within sampling areas that minimize the perimeterto-area<br />
ratio (e.g. circles or squares). We try to dissipate<br />
present ambiguity in the use of the terms by introducing<br />
the concept of clonal lineage and MLL instead of clone and<br />
MLG, in or<strong>de</strong>r to inclu<strong>de</strong> in a clonal lineage (MLL) not only<br />
an MLG but also any group of MLGs characterized by very<br />
few genetic differences that appear more likely to be <strong>de</strong>rived<br />
from somatic mutations or scoring errors rather than from<br />
distinct zygotes. We <strong>de</strong>scribe how Monte-Carlo procedures<br />
can help ascertain the number of loci required to <strong>de</strong>liver<br />
accurate assignments of clonal lineages as well as to elucidate<br />
potential sampling biases <strong>de</strong>rived from edge effects,<br />
thereby <strong>de</strong>livering the most robust estimates of clonal richness<br />
possible. We recommend the use of genetic richness<br />
(R), the Simpson evenness in<strong>de</strong>x (V), and the complement<br />
of the slope of the Pareto distribution of clonal membership<br />
as the most parsimonious set of nonredundant indices of<br />
clonal diversity. The issue of sampling <strong>de</strong>sign and <strong>de</strong>nsity<br />
has also been shown to be far from trivial, and the sensitivity<br />
of most indices to these parameters, ren<strong>de</strong>ring risky any<br />
comparison among studies, that may be interpreted with<br />
high caution. A spline fit <strong>de</strong>scribing the rate of change in R<br />
with increasing N may be used to get the most accurate<br />
possible estimates of R and the Pareto distribution may be<br />
chosen for comparative proposes, as it is the less sensitive<br />
indices to sampling <strong>de</strong>nsity. Lastly, the preceding discussion<br />
emphasizes the critical importance of explicitly consi<strong>de</strong>ring<br />
the distribution of clonal lineages in space, allowing<br />
the analysis of spatial clonal traits such as estimates of the<br />
clonal subrange and the extent of clonal aggregation. Most<br />
of features are now available through four principal software<br />
packages released recently (Box 6), which should<br />
facilitate the use and standardization of these methods.<br />
The elements provi<strong>de</strong>d here represent a first step towards<br />
an increasing realization of the consequences of clonality in<br />
the <strong>de</strong>sign and analyses of studies, helping to <strong>de</strong>velop a<br />
coherent framework for the study of genetic structure of<br />
clonal plant populations. We believe that consi<strong>de</strong>ration of<br />
the recommendations herein proposed should help move<br />
this emerging research program further, and we hope they<br />
will provi<strong>de</strong> new impetus towards further exploration of<br />
the consequences of clonality for the population dynamics<br />
and evolution of species.<br />
Acknowledgements<br />
This work is a contribution of the EU Network of Excellence<br />
MARBEF-Marine Biodiversity and Ecosystem Function, the EU<br />
Project M&MS (EVK3-CT-2000-00044) a project fun<strong>de</strong>d by the<br />
Fundación BBVA, project PNAT/1999/BIA/15003/C of the<br />
Portuguese Science Foundation — FCT, and fellowships from<br />
FCT and ESF. We are grateful to Cécile Perrin, Ashwin Engelen,<br />
Onno Diekmann, Elena Varela and Elena Diaz-Almela for fruitful<br />
discussions, which helped improve this article, and to Gareth<br />
Pearson for revising the manuscript. We wish to thank the Editor<br />
and two anonymous referees for the improvements they suggested<br />
on previous versions of the manuscript.<br />
References<br />
Alberto F, Correia L, Arnaud-Haond S, Billot C, Duarte CM,<br />
Serrão EA (2003a) New microsatellites markers for the en<strong>de</strong>mic<br />
Mediterranean seagrass, Posidonia oceanica. Molecular Ecology<br />
Notes, 3, 253–255.<br />
Alberto F, Correia L, Billot C, Duarte CM, Serrao EA (2003b)<br />
Isolation and characterization of microsatellite markers for the<br />
seagrass, Cymodocea nodosa. Molecular Ecology Notes, 3, 397–399.<br />
Alberto F, Gouveia L, Arnaud-Haond S, Pérens-Lloréns JL, Duarte<br />
CM, Serrão EA (2005) Spatial genetic structure, neighbourhood<br />
size and clonal subrange in seagrass (Cymodocea nodosa) populations.<br />
Molecular Ecology, 14, 2669–2681.<br />
An<strong>de</strong>rson JB, Kohn LM (1995) Clonality in soilborne, plantpathogenic<br />
fungi. Annual Review of Phytopathology, 33, 369–391.<br />
Arnaud-Haond S, Alberto F, Teixeira S, Procaccini G, Serrao EA,<br />
Duarte CM (2005) Assessing genetic diversity in clonal organisms:<br />
low diversity or low resolution? Combining power and costefficiency<br />
in selecting markers. Journal of Heredity, 96, 434–440.<br />
Arnaud-Haond S, Belkhir K (2007) genclone 1.0: a new program<br />
to analyse genetics data on clonal organisms. Molecular Ecology<br />
Notes, 7, 15–17.<br />
Arnaud-Haond S, Diaz Almela E, Teixeira S, Alberto F, Duarte<br />
CM, Serrao EA (2007) Vicariance patterns in the Mediterranean<br />
sea: East-West cleavage and low dispersal in the en<strong>de</strong>mic<br />
seagrass Posidonia oceanica. Journal of Biogeography, 34, 963–976.<br />
Ayre DJ, Hughes TP (2000) Genotypic diversity and gene flow in<br />
brooding and spawning corals along the Great Barrier Reef,<br />
Australia. Evolution, 54, 1590–1605.<br />
Bastidas C, Benzie JAH, Uthicke S, Fabricius KE (2001) Genetic<br />
differentiation among populations of a broadcast spawning<br />
soft coral, Sinularia flexibilis, on the Great Barrier Reef. Marine<br />
Biology, 138, 517–525.<br />
Charpentier A (2001) Consequences of clonal growth for plant<br />
mating. Evolutionary Ecology, 15, 521–530.<br />
Cheplick GP (1997) Responses to severe competitive stress in a<br />
clonal plant: differences between genotypes. Oikos, 79, 581–591.<br />
Chung MY, Nason JD, Chung MG (2004) Implications of clonal<br />
structure for effective population size and genetic drift in a rare<br />
terrestrial orchid, Cremastra appendiculata. Conservation Biology,<br />
18, 1515–1524.<br />
© 2007 The Authors<br />
Journal compilation © 2007 Blackwell Publishing Ltd<br />
79
5138 S. ARNAUD-HAOND ET AL.<br />
Cywinska A, Hebert PDN (2002) Origins of clonal diversity in the<br />
hypervariable asexual ostraco<strong>de</strong> Cypridopsis vidua. Journal of<br />
Evolutionary Biology, 15, 134–145.<br />
Diaz-Almela E, Arnaud-Haond S, van <strong>de</strong> Vliet MS et al. Feed-backs<br />
between genetic structure and perturbation-driven <strong>de</strong>cline in<br />
seagrass (Posidonia oceanica) Meadows Conservation Genetics,<br />
doi: 10.1007/s10592-007-9288-0.<br />
Dorken ME, Eckert CG (2001) Severely reduced sexual reproduction<br />
in northern populations of a clonal plant, Decodon verticillatus<br />
(Lythraceae). Journal of Ecology, 89, 339–350.<br />
Douhovnikoff V, Dodd RS (2003) Intra-clonal variation and a<br />
similarity threshold for i<strong>de</strong>ntification of clones: application<br />
to Salix exigua using AFLP molecular markers. Theoretical and<br />
Applied Genetics, 106, 1307–1315.<br />
Ellstrand NC, Roose ML (1987) Patterns of genotypic diversity in<br />
clonal plant-species. American Journal of Botany, 74, 123–131.<br />
Epperson BK, Li TQ (1997) Gene dispersal and spatial genetic<br />
structure. Evolution, 51, 672–681.<br />
Fager EW (1972) Diversity: a sampling study. American Naturalist<br />
106, 293–310.<br />
Freeland JR, Noble LR, Okamura B (2000) Genetic diversity of<br />
North American populations of Cristatella mucedo, inferred from<br />
microsatellite and mitochondrial DNA. Molecular Ecology, 9,<br />
1375–1389.<br />
Gini C (1912) Variabilità e mutabilità. In: Studi Economico-Giuridici<br />
Facolta <strong>de</strong> Giurisprun<strong>de</strong>nza <strong>de</strong>ll’ Universita di Cagliari, A., Vol III,<br />
parte II.<br />
Gregorius H-R (2005) Testing for clonal propagation. Heredity, 94,<br />
173–179.<br />
van Groenendael J, <strong>de</strong> Kroon H (1990) Clonal Growth in Plants:<br />
Regulation and Function. SPB Aca<strong>de</strong>mic Publishers, The Hague,<br />
The Netherlands.<br />
Halkett F, Plantegenest M, Prunier-Leterme N, Mieuzet L,<br />
Delmotte F, Simon JC (2005a) Admixed sexual and facultatively<br />
asexual aphid lineages at mating sites. Molecular Ecology, 14,<br />
325–336.<br />
Halkett F, Simon JC, Balloux F (2005b) Tackling the population<br />
genetics of clonal and partially clonal organisms. Trends in<br />
Ecology & Evolution, 20, 194–201.<br />
Hammerli A, Reusch TBH (2003) Genetic neighbourhood of clone<br />
structures in eelgrass meadows quantified by spatial autocorrelation<br />
of microsatellite markers. Heredity, 91, 448–455.<br />
Hangelbroek HH, Ouborg NJ, Santamaria L, Schwenk K (2002)<br />
Clonal diversity and structure within a population of the pondweed<br />
Potamogeton pectinatus foraged by Bewick’s swans.<br />
Molecular Ecology, 11, 2137–2150.<br />
Harada Y, Kawano S, Iwasa Y (1997) Probability of clonal i<strong>de</strong>ntity:<br />
inferring the relative success of sexual versus clonal reproduction<br />
from spatial genetic patterns. Journal of Ecology, 85,<br />
591–600.<br />
Harper JL (1977) Population Biology of Plants. Aca<strong>de</strong>mic Press,<br />
London.<br />
Hill MO (1973) Diversity and evenness: a unifying notation and its<br />
consequences. Ecology, 54, 427–432.<br />
Hurlbert SH (1971) The nonconcept of species diversity: a critique<br />
and alternative parameters. Ecology, 52, 577–586.<br />
Kapralov MV (2004) Genotypic variation in populations of the<br />
clonal plant Saxifraga cernua in the central and peripheral regions<br />
of the species range. Russian Journal of Ecology, 35, 413–416.<br />
Klekowski EJ (2003) Plant clonality, mutation, diplontic selection<br />
and mutational meltdown. Biological Journal of the Linnean Society,<br />
79, 61–67.<br />
80<br />
Le Goff-Vitry MC, Pybus OG, Rogers AD (2004) Genetic structure<br />
of the <strong>de</strong>ep-sea coral Lophelia pertusa in the northeast Atlantic<br />
revealed by microsatellites and internal transcribed spacer<br />
sequences. Molecular Ecology, 13, 537–549.<br />
Leberg PL (2002) Estimating allelic richness: effects of sample size<br />
and bottlenecks. Molecular Ecology, 11, 2445–2449.<br />
Loiselle BA, Sork VL, Nason J, Graham C (1995) Spatial genetic<br />
structure of a tropical un<strong>de</strong>rstory shrub, Psychotria officinalis<br />
(Rubiaceae). American Journal of Botany, 82, 1420–1425.<br />
Lovett-Doust L (1981) Population dynamics and local specialization<br />
in a clonal perrenial (Ranunculus repens). I. The dynamics of<br />
ramets in contrasting habitats. Journal of Ecology, 69, 743–755.<br />
Loxdale HD, Lushai G (2003) Rapid changes in clonal lines: the<br />
<strong>de</strong>ath of a ‘sacred cow’. Biological Journal of the Linnean Society,<br />
79, 3–16.<br />
Meirmans PG, Van Tien<strong>de</strong>ren PH (2004) genotype and genodive:<br />
two programs for the analysis of genetic diversity of asexual<br />
organisms. Molecular Ecology Notes, 4, 792–794.<br />
Murawski DA, Hamrick JL (1990) Local genetic and clonal structure<br />
in the tropical terrestrial bromeliad, Aechmea magdalenae.<br />
American Journal of Botany, 77, 1201–1208.<br />
Nagamitsu T, Ogawa M, Ishida K, Tanouchi H (2004) Clonal diversity,<br />
genetic structure, and mo<strong>de</strong> of recruitment in a Prunus ssiori<br />
population established after volcanic eruptions. Plant Ecology,<br />
174, 1–10.<br />
Olsen JL, Stam WT, Coyer JA et al. (2004) North Atlantic phylogeography<br />
and large-scale population differentiation of the<br />
seagrass Zostera marina L. Molecular Ecology, 13, 1923–1941.<br />
Parker ED Jr (1979) Ecological implications of clonal diversity<br />
in parthenogenetic morphospecies. American Zoologist, 19, 753–<br />
762.<br />
Parks JC, Werth CR (1993) A study of spatial features of clones in<br />
a population of Bracken fern, Pteridium aquilinum (Dennstaedtiaceae).<br />
American Journal of Botany, 80, 537–544.<br />
Peakall R, Smouse P (2006) genalex 6: genetic analysis in Excel.<br />
Population genetic software for teaching and research. Molecular<br />
Ecology Notes, 6, 288–295.<br />
Peet R (1974) The measurement of species diversity. Annual Review<br />
of Ecology and Systematics, 5, 285–307.<br />
Petit RJ, El Mousadik A, Pons O (1998) I<strong>de</strong>ntifying populations for<br />
conservation on the basis of genetic markers. Conservation Biology,<br />
12, 844–855.<br />
Pielou EC (1966) Shannon’s formulae as a measure of species<br />
diversity: its use and misuse. American Naturalist, 100, 463–465.<br />
Pielou EC (1969) An Introduction to Mathematical Ecology. Wiley-<br />
Interscience, New-York.<br />
Pielou EC (1975) Ecological diversity. New York, USA, 165pp.<br />
Piquot Y, SaumitouLapra<strong>de</strong> P, Petit D, Vernet P, Epplen JT<br />
(1996) Genotypic diversity revealed by allozymes and oligonucleoti<strong>de</strong><br />
DNA fingerprinting in French populations of the<br />
aquatic macrophyte, Sparganium erectum. Molecular Ecology, 5,<br />
251–258.<br />
Reusch TBH (2001) New markers — old questions: population<br />
genetics of seagrasses. Marine Ecology — Progress Series, 211,<br />
261–274.<br />
Reusch TBH, Hukrie<strong>de</strong> W, Stam WT, Olsen JL (1999) Differentiating<br />
between clonal growth and limited gene flow using spatial<br />
autocorrelation of microsatellites. Heredity, 83, 120–126.<br />
Ritland K (1996) Estimators for pairwise relatedness and individual<br />
inbreeding coefficients. Genetical Research, 67, 175–185.<br />
Rousset F (2000) Genetic differentiation between individuals.<br />
Journal of Evolutionary Biology, 13, 58–62.<br />
© 2007 The Authors<br />
Journal compilation © 2007 Blackwell Publishing Ltd
POPULATION STRUCTURE AND CLONALITY 5139<br />
Rozenfeld AF, Arnaud-Haond S, Hernán<strong>de</strong>z-García E et al. (2007)<br />
Spectrum of genetic diversity and networks of clonal populations<br />
Journal of the Royal Society Interface.<br />
Schroe<strong>de</strong>r M (1991) Fractals, Chaos, Power Laws: Minutes from an<br />
Infinite Paradise. W.H. Freeman, New York.<br />
Simpson EH (1949) Measurements of diversity. Nature, 163, 688.<br />
Sintes T, Marba N, Duarte CM, Kendrick GA (2005) Nonlinear<br />
processes in seagrass colonisation explained by simple clonal<br />
growth rules. Oikos, 108, 165–175.<br />
Smith B, Wilson JB (1996) A consumer’s gui<strong>de</strong> to evenness measures<br />
Oikos, 76, 70–82.<br />
Sokal RR, Rohlf FJ (1995) Biometry. W.H. Freeman, New York.<br />
StatSoft I (2001) statistica (Data Analysis Software System), Version 6.<br />
www.statsoft.com.<br />
Stenberg P, Lundmark M, Saura A (2003) mlgsim: a program for<br />
<strong>de</strong>tecting clones using a simulation approach. Molecular Ecology<br />
Notes, 3, 329–331.<br />
Stoddart JA (1983) A genotypic diversity measure. Journal of Heredity,<br />
74, 489–490.<br />
Stoddart JA, Taylor JF (1988) Genotypic diversity — estimation and<br />
prediction in samples. Genetics, 118, 705–711.<br />
Suehs CM, Affre L, Medail F (2004) Invasion dynamics of two alien<br />
Carpobrotus (Aizoaceae) taxa on a Mediterranean island: I.<br />
Genetic diversity and introgression. Heredity, 92, 31–40.<br />
Taylor DJ, Foighil DO (2000) Transglobal comparisons of nuclear<br />
and mitochondrial genetic structure in a marine polyploid clam<br />
(Lasaea, Lasaeidae). Heredity, 84, 321–330.<br />
Tibayrenc M, Ayala FJ (2002) The clonal theory of parasitic protozoa:<br />
12 years on. Trends in Parasitology, 18, 405–410.<br />
Tibayrenc M, Kjellberg F, Ayala F (1990) A clonal theory of oarasitic<br />
protozoa: the population structures of Entamoeba, Giardia,<br />
Leishmania, Naegleria, Plasmodium, Trichomonas, and Trypanosoma<br />
and their medical and taxonomical consequences. Proceedings of<br />
the National Aca<strong>de</strong>my of Sciences, USA, 87, 2414–2418.<br />
Ueda HR, Hayashi S, Matsuyama S et al. (2004) Universality and<br />
flexibility in gene expression from bacteria to human. Proceedings<br />
of the National Aca<strong>de</strong>my of Sciences, USA, 101, 3765–3769.<br />
Uthike S, Benzie JAH, Ballment E (1998) Genetic structure of<br />
fissiparous populations of Holothuria (Halo<strong>de</strong>ima) atra on the<br />
Great Barrier Reef. Marine Biology, 132, 141–151.<br />
Van <strong>de</strong>r Hulst RGM, Mes THM, Falque M, Stam P, Den Nijs JCM,<br />
Bachmann K (2003) Genetic structure of a population sample of<br />
apomictic dan<strong>de</strong>lions. Heredity, 90, 326–335.<br />
Vidondo B, Prairie YT, Blanco JM, Duarte CM (1997) Some aspects<br />
of the analysis of size spectra in aquatic ecology. Limnology and<br />
Oceanography, 42, 184–192.<br />
Washington HG (1984) Diversity, biotic and similarity indices. A<br />
review with special relevance to aquatic ecosystems. Water<br />
Research, 18, 653–694.<br />
Young AG, Hill JH, Murray BG, Peakall R (2002) Breeding system,<br />
genetic diversity and clonal structure in the sub-alpine forb<br />
Rutidosis leiolepis F. Muell. (Asteraceae). Biological Conservation,<br />
106, 71–78.<br />
Sophie Arnaud-Haond is a researcher in IFREMER (France) and<br />
an associate researcher in CCMar (Portugal). Her research interests<br />
focus on the influence of mating system and clonality, dispersal<br />
and selection on the ecology and evolution of marine populations.<br />
Carlos M. Duarte leads a team in IMEDEA (Spain) studying<br />
marine biodiversity from the genetic, species and habitat level to<br />
global biogeochemical cycles. Fillipe Alberto is a post-doctoral<br />
researcher in CCMar, interested in marine population genetics and<br />
ecology, marine phylogeography and clonality. Ester Serrão leads a<br />
research group (CCMar) that is primarily interested in marine<br />
ecology, adaptation and population genetics.<br />
Supplementary material<br />
The following supplementary material is available for this<br />
article:<br />
Table S1 Survey list of published studies using molecular markers,<br />
and information extracted from the literature<br />
This material is available as part of the online article from:<br />
http://www.blackwell-synergy.com/doi/abs/<br />
10.1111/j.1365-294X.2007.03535.x<br />
(This link will take you to the article abstract).<br />
Please note: Blackwell Publishing are not responsible for the content<br />
or functionality of any supplementary materials supplied by<br />
the authors. Any queries (other than missing material) should be<br />
directed to the corresponding author for the article.<br />
© 2007 The Authors<br />
Journal compilation © 2007 Blackwell Publishing Ltd<br />
81
Sophie ARNAUD-HAOND - Candidature à une Habilitation à Diriger <strong>de</strong>s Recherches, Février 2008<br />
3. Résumé <strong>de</strong>s travaux <strong>de</strong> Recherche<br />
II.4 Feed-backs between genetic structure and perturbation-driven <strong>de</strong>cline in<br />
seagrass (Posidonia oceanica) meadows. Conservation Genetics, 2007.<br />
Dans le cadre <strong>de</strong> la thèse d’Elena Diaz-Almela, nous avons appliqué ces métho<strong>de</strong>s<br />
d’étu<strong>de</strong> <strong>de</strong>s composantes spatiales <strong>de</strong> la clonalité afin d’estimer l’impact <strong>de</strong>s<br />
perturbations démographiques, ici l’existence d’installations aquacoles modifiant la<br />
turbidité et la présence <strong>de</strong> matière organique <strong>de</strong> l’eau, sur la composition clonale <strong>de</strong>s<br />
prairies. Nous avons utilisé le ‘clonal subrange’ (CR), proposé dans l’article<br />
précé<strong>de</strong>nt avec Filipe Alberto, pour montrer une influence circulaire <strong>de</strong> la taille <strong>de</strong>s<br />
clones sur la mortalité. Les prairies présentant le moins <strong>de</strong> mortalité sont celles ou<br />
les herbiers contrôles montrent une dominance <strong>de</strong> grands clones, qui semblent être<br />
favorisés en terme <strong>de</strong> survie.<br />
a) b)<br />
Herbier Impacté<br />
Herbier contrôle<br />
Figure 9: ‘clonal subrange’ (CR) comparé entre zones impactées et zones contrôles, et<br />
CR par rapport au résidus <strong>de</strong> la relation mortalité / taux <strong>de</strong> sédimentation. On observe<br />
donc ici a) d’une part une relation positive entre taux <strong>de</strong> mortalité et la taille maximale <strong>de</strong>s<br />
clones dans les herbiers impactés, et b) d’autre part l’existence d’une relation significative<br />
entre le taux <strong>de</strong> mortalité en fonction <strong>de</strong> l’impact et la taille <strong>de</strong>s clones, suggérant une<br />
meilleure survie <strong>de</strong>s grands clones.<br />
82
Conserv Genet (2007) 8:1377–1391<br />
DOI 10.1007/s10592-007-9288-0<br />
ORIGINAL PAPER<br />
Feed-backs between genetic structure and perturbation-driven<br />
<strong>de</strong>cline in seagrass (Posidonia oceanica) meadows<br />
Elena Diaz-Almela Æ Sophie Arnaud-Haond Æ<br />
Mirjam S. Vliet Æ Elvira Álvarez Æ Núria Marbà Æ<br />
Carlos M. Duarte Æ Ester A. Serrão<br />
Received: 11 August 2006 / Accepted: 9 January 2007 / Published online: 11 April 2007<br />
Ó Springer Science+Business Media B.V. 2007<br />
Abstract We explored the relationships between<br />
perturbation-driven population <strong>de</strong>cline and genetic/<br />
genotypic structure in the clonal seagrass Posidonia<br />
oceanica, subject to intensive meadow regression<br />
around four Mediterranean fish-farms, using seven<br />
specific microsatellites. Two meadows were randomly<br />
sampled (40 shoots) within 1,600 m 2 at each site: the<br />
‘‘impacted’’ station, 5–200 m from fish cages, and the<br />
‘‘control’’ station, around 1,000 m downstream further<br />
away (consi<strong>de</strong>red a proxy of the pre-impact genetic<br />
structure at the site). Clonal richness (R), Simpson<br />
genotypic diversity (D*) and clonal sub-range (CR)<br />
were highly variable among sites. Nevertheless, the<br />
maximum distance at which clonal dispersal was<br />
<strong>de</strong>tected, indicated by CR, was higher at impacted<br />
stations than at the respective control station (paired t-<br />
test: P < 0.05, N = 4). The mean number of alleles (Â)<br />
and the presence of rare alleles (Â r ) <strong>de</strong>creased at impacted<br />
stations (paired t-test: P < 0.05, and P < 0.02,<br />
respectively, N = 4). At a given perturbation level<br />
(quantified by the organic and nutrient loads), shoot<br />
mortality at the impacted stations significantly<br />
E. Diaz-Almela (&) N. Marbà C. M. Duarte<br />
Laboratorio <strong>de</strong> Ecología Litoral, Grupo <strong>de</strong> Oceanografía<br />
Interdisciplinar (G.O.I), IMEDEA (CSIC-UIB), C/Miquel<br />
Marqués no 21, C.P. 07190 Esporles, Spain<br />
e-mail: elena.diaz-almela@uib.es<br />
S. Arnaud-Haond M. S. Vliet E. A. Serrão<br />
CCMAR, CIMAR – Laboratório Associado,<br />
F.C.M.A. – Univ. Algarve, Gambelas, 8005-139 Faro,<br />
Portugal<br />
E. Álvarez<br />
Dirección General <strong>de</strong> Pescas, Comunidad <strong>de</strong> las Islas<br />
Baleares, Palma <strong>de</strong> Mallorca, Spain<br />
<strong>de</strong>creased with CR at control stations (R 2 = 0.86,<br />
P < 0.05). Seagrass mortality also increased with Â<br />
(R 2 = 0.81, P < 0.10), R (R 2 = 0.96, P < 0.05) and D*<br />
(R 2 = 0.99, P < 0.01) at the control stations, probably<br />
because of the negative correlation between those<br />
parameters and CR. Therefore, the effects of clonal<br />
size structure on meadow resistance could play an<br />
important role on meadow survival. Large genotypes<br />
of P. oceanica meadows thus seem to resist better to<br />
fish farm-<strong>de</strong>rived impacts than little ones. Clonal<br />
integration, foraging advantage or other size-related<br />
fitness traits could account for this effect.<br />
Keywords Clonal sub-range Genetic diversity <br />
Population <strong>de</strong>cline Genotypic diversity Fish-farm<br />
impacts<br />
Introduction<br />
The interactions between perturbation-driven population<br />
<strong>de</strong>cline and genetic diversity are currently the<br />
focus of an intense research activity, both for its fundamental<br />
interest and for its implications to conservation<br />
biology. But the dissection of their influence on<br />
each other is a complex task, because a circular feedback<br />
is expected between both factors: population<br />
<strong>de</strong>cline may affect population genetic resources, and<br />
the genetic diversity present in the population prior to<br />
perturbation may influence its response.<br />
Strong reductions in population size are expected to<br />
ero<strong>de</strong> genetic variability, first through direct loss of<br />
genotypes and alleles, and thereafter through increased<br />
random genetic drift and elevated inbreeding within<br />
83<br />
123
1378 Conserv Genet (2007) 8:1377–1391<br />
the remnant population offspring (Wright 1931; Nei<br />
1975; Young et al. 1996). Although most experiments<br />
and field observations support positive interactions<br />
between population size and genetic diversity (Leimu<br />
et al. 2006), the effects of population <strong>de</strong>cline in the<br />
genetic diversity of the adult remnant populations are<br />
highly variable (e.g. Young et al. 1996; Lee et al. 2002;<br />
Edwards et al. 2005; Lowe et al. 2005; Reusch 2006).<br />
This variability can be accounted for by the role of lifehistory<br />
traits, such as the generation time or the<br />
breeding regime in the speed of genetic diversity erosion<br />
(Young et al. 1996; Collevatti 2001; Lee et al.<br />
2002; Lowe et al. 2005; Leimu et al. 2006). Moreover,<br />
intermediate perturbation levels may enhance genetic<br />
diversity in populations, producing space available for<br />
new genotypes to install, as has been <strong>de</strong>scribed among<br />
several clonal plants, in which <strong>de</strong>veloped and stable<br />
populations show dominance by a few clones (McNeilly<br />
and Roose 1984; Watkinson and Powel 1993).<br />
Among seagrasses (clonal plants), there is evi<strong>de</strong>nce<br />
that perturbation-induced regression may reduce meadow<br />
genetic polymorphism (Alberte et al. 1994; Micheli<br />
et al. 2005). Therefore, the empirical evi<strong>de</strong>nce suggests<br />
the existence of species-specific thresholds of population<br />
reduction and isolation un<strong>de</strong>r which population genetic<br />
diversity would not be significantly affected (Leberg<br />
1992; Young et al. 1996; Lowe et al. 2005).<br />
At a given perturbation level, populations bearing high<br />
genetic diversity are expected to be more resistant (i.e. to<br />
be less affected by a given perturbation), and to exhibit<br />
faster recovery than homogeneous ones because the<br />
probability of occurrence of resistant variants is expected<br />
to be higher and/or through processes of functional<br />
complementarity (Loreau and Hector 2001; Reuschand<br />
Hughes 2006). Overall, a majority of empirical studies<br />
indicate positive interactions between population genetic<br />
diversity and fitness (Leimu et al. 2006). But more studies<br />
are nee<strong>de</strong>d to confirm this ten<strong>de</strong>ncy (Leimu et al. 2006),<br />
especially for the population fitness components of<br />
resistance to and recovery from perturbations. In the<br />
seagrass Zostera marina, higher genetic diversity (in<br />
terms of allelic richness and/or heterozygosity) increased<br />
survival, growth and flowering rates of transplants<br />
(Williams 2001; Hämmerli and Reusch 2003).<br />
Among clonal plants, another component of population<br />
genetic diversity is genotypic diversity (clonal<br />
diversity), the number and evenness of genetic individuals<br />
(genets) represented among the ramets. Recent<br />
experiments indicate that genotypic diversity can increase<br />
resistance (Reusch et al. 2005) and speed of<br />
recovery (Hughes and Stachowicz 2004) of the clonal<br />
seagrass Zostera marina facing perturbations (Reusch<br />
and Hughes 2006).<br />
The seagrass Posidonia oceanica, is a slow-growing<br />
(Marbà and Duarte 1998) and extremely long-lived<br />
clonal plant (Mateo et al. 1997). Its primary reproductive<br />
mo<strong>de</strong> is vegetative, with sparse sexual reproduction<br />
(Gambi et al. 1996; Balestri and Cinelli 2003;<br />
Díaz-Almela et al. 2006). P. oceanica is en<strong>de</strong>mic to the<br />
Mediterranean coasts (<strong>de</strong>n Hartog 1970), where its<br />
meadows are the dominant ecosystems between 0.3<br />
and 45 m <strong>de</strong>pth (Bethoux and Copin-Monteagut 1986;<br />
Pasqualini et al. 1998). These meadows provi<strong>de</strong><br />
important ecosystem functions, both in terms of production<br />
and biodiversity (Hemminga and Duarte<br />
2000), which are being jeopardised by their ten<strong>de</strong>ncy<br />
towards a substantial <strong>de</strong>cline (e.g. Marbà et al. 2005).<br />
One of the major threats to P. oceanica meadows is<br />
the growing marine aquaculture activity (Holmer et al.<br />
2003). Fish farm effluents produce rapid reductions in<br />
meadow shoot <strong>de</strong>nsity, which are particularly intensive<br />
in the areas next to fish cages (Delgado et al. 1997,<br />
1999; Ruiz et al. 2001). If there is an effect of this<br />
perturbation on the genetic diversity and clonal structure<br />
of P. oceanica meadows, it should be best <strong>de</strong>tected<br />
in these areas.<br />
In the present work, we use seven microsatellite<br />
markers (Alberto et al. 2003; Arnaud-Haond et al.<br />
2005) to investigate the variability in genetic diversity<br />
and genotypic structure of P. oceanica meadows situated<br />
around four fish farms across the Mediterranean,<br />
for which <strong>de</strong>mographic trajectories have been evaluated<br />
(Diaz-Almela et al. submitted). Our objectives<br />
are (1) to elucidate the effects of shoot <strong>de</strong>nsity<br />
regression on meadow clonal structure and genetic<br />
diversity and (2) to <strong>de</strong>rive insights into the possible<br />
importance of the clonal structure and genetic diversity<br />
of the meadow previous to perturbation on its resistance<br />
to fish-farm impacts.<br />
Materials and methods<br />
Samples of the seagrass Posidonia oceanica were collected<br />
in meadows located around four fish farms along<br />
the Mediterranean (Fig. 1; Table 1), at water <strong>de</strong>pths<br />
ranging between 16 and 28 m among sites. The farms<br />
in Cyprus, Italy and Spain were located in open coasts<br />
about 1 km from shores, whereas the farm in Greece<br />
was located in a strait about 300 m from shore and was<br />
the shallowest. All studied meadows near (i.e. 5–15 m)<br />
the cages exhibited high rates of shoot <strong>de</strong>cline, as reflected<br />
by the annual balance between shoot recruitment<br />
and mortality rates assessed by shoot census in<br />
permanent plots (Table 1). Conversely, shoot populations<br />
were in steady state or <strong>de</strong>clining at slow rates,<br />
123<br />
84
Conserv Genet (2007) 8:1377–1391 1379<br />
80x20m 2<br />
Co.1<br />
Control<br />
1000m<br />
20m<br />
In.1<br />
5-15m<br />
Im.1<br />
Im.2<br />
In.2<br />
Impacted<br />
Co.2<br />
Fig. 1 Above: locations of the fish farm sites analysed in this<br />
study. Circle: El Campello (Spain), square: Porto Palo (Sicily),<br />
diamond: Sounion (Greece), triangle: Amathous (Cyprus).<br />
Below: sampling scheme of the genetic sampling stations<br />
(Impacted, Control). The genetic sampling areas encompass a<br />
variable number of <strong>de</strong>mographic census plots, belonging to<br />
impacted (Im) and intermediate (In) <strong>de</strong>mographic stations, in<br />
the case of the genetic impacted station, or to a control (Co)<br />
<strong>de</strong>mographic station, in the case of the genetic control station<br />
similar to those observed in other P. oceanica meadows<br />
elsewhere (Marbà et al. 2005), when growing at 800–<br />
1,200 m away from the cages (Table 1).<br />
The sampling for genetic structure was performed<br />
in each site, within two stations (i.e. hereafter called<br />
‘‘impacted’’ and ‘‘control’’ stations), encompassing<br />
an area of 80 · 20 m 2 each. These stations contained<br />
the permanent plots where annual shoot <strong>de</strong>mographic<br />
parameters were estimated (Table 1). Mean shoot<br />
<strong>de</strong>nsities within the ‘‘impacted’’ stations, located at<br />
the edge of the meadow nearest to fish cages, ranged<br />
from 20 (El Campello, Spain) to 165 (Sounion,<br />
Greece) shoots m –2 (Table 1). The ‘‘control’’ station,<br />
situated 1,000–1,200 m away from cages, in the direction<br />
of the main current, had mean shoot <strong>de</strong>nsities of<br />
68 (El Campello, Spain) to 395 (Porto Palo, Sicily)<br />
shoots m –2 .<br />
A total of 38–40 ramets (i.e. leaf shoots) were collected<br />
within each genetic sampling station, at randomly<br />
drawn coordinates, within a rectangular area of<br />
80 · 20 m 2 . The base of each leaf bundle, including the<br />
shoot apical meristem, was preserved in silica crystals<br />
until DNA extraction. Distributions of distances between<br />
pairs of collected samples (normal, slightly<br />
skewed towards low distances) were not significantly<br />
different among sampling sites and stations.<br />
Table 1 Location, water <strong>de</strong>pth, distance to fish cages and year of initiation of fish farm activities of each sampling site and station<br />
Site Coordinates Depth<br />
(m)<br />
Distance to<br />
cages (m)<br />
Fish farm<br />
initiated in:<br />
Demography<br />
station<br />
Shoots<br />
m –2<br />
Relative<br />
mortality<br />
rate (yr –1 )*<br />
Relative<br />
recruitment<br />
rate (yr –1 )*<br />
Amathous (Cyprus)<br />
IMPACTED 34°41¢96N 20.5 300 1992 Im. 1, 2 454 ± 42 0.186 ± 0.050 0.141 ± 0.041<br />
33°12¢00E<br />
CONTROL 34°41¢99N 19.5 1,200 Co. 1, 2 491 ± 51 0.185 ± 0.067 0.139 ± 0.047<br />
33°12¢36E<br />
Sounion (Greece)<br />
IMPACTED 37°39.586¢N 15.5 10–30 1996 Im.-In. 1, 2 165 ± 25 1.606 ± 0.479 0.095 ± 0.034<br />
23°57.291¢E<br />
CONTROL 37°39.550¢N 16.2 1,200 Co 1 365 ± 34 0.070 ± 0.020 0.056 ± 0.013<br />
23°58.240¢E<br />
Porto Palo (Sicily)<br />
IMPACTED 36°42.710¢N 22.5 5–50 1993–1994 Im.-In. 1 156 ± 17 1.241 ± 0.491 0.004 ± 0.003<br />
15°8.438¢E<br />
CONTROL 36°43.307¢N 20 1,000 Co. 1, 2 395 ± 35 0.577 ± 0.275 0.027 ± 0.009<br />
15°8.474¢E<br />
El Campello (Spain)<br />
IMPACTED 38°25.300¢ N 28 10–30 1995 Im.-In. 1, 2 20 ± 6 0.617 ± 0.128 0.091 ± 0.027<br />
0°20.829¢W<br />
CONTROL 38°24.875¢N 28 1,000 Co. 1 68 ± 4 0.056 ± 0.029 0.106 ± 0.019<br />
0°21.139¢W<br />
The <strong>de</strong>mographic stations encompassed by the genetic sampling stations at each site are also provi<strong>de</strong>d, as well as the mean shoot<br />
<strong>de</strong>nsities and mean mortality, and recruitment rates at the genetic sampling stations (Mean ± SE)<br />
85<br />
123
1380 Conserv Genet (2007) 8:1377–1391<br />
Genomic DNA was extracted following a standard<br />
CTAB extraction procedure (Doyle and Doyle 1988).<br />
The sample polymorphism was analysed with the most<br />
efficient combination (Arnaud-Haond et al. 2005) of<br />
seven nuclear microsatellites reported by Alberto et al.<br />
(2003) to allow the resolution of clonal membership,<br />
using the conditions <strong>de</strong>scribed by Arnaud-Haond et al.<br />
(2005). The number of alleles and size range (see<br />
Appendix) of some of the microsatellite loci was enlarged<br />
in this study as compared with the initially <strong>de</strong>scribed<br />
by Alberto et al. (2003).<br />
Clone discrimination:<br />
We used the round-robin method (Parks and Werth<br />
1993) to estimate the allelic frequencies in each<br />
population sample. This sub-sampling approach avoids<br />
the overestimation of the rare alleles, by estimating the<br />
allelic frequencies for each locus on the basis of a sample<br />
pool composed of all the genotypes distinguished among<br />
all the loci, except the one for which allelic frequencies<br />
are estimated. This procedure is repeated for all loci,<br />
taking into account Wright’s inbreeding coefficient estimated<br />
for each loci after the exclusion of i<strong>de</strong>ntical multi<br />
locus genotypes (Young et al. 2002), and the probability<br />
that the same multi-locus genotype is produced by different<br />
sexual events (P gen (f)) is then estimated as:<br />
P gen ðf Þ¼ Yl<br />
i¼1<br />
½ðf i g i Þð1 þðz i ðF isðiÞ ÞÞÞŠ2 h<br />
ð1Þ<br />
where l is the number of loci, h is the number of heterozygous<br />
loci, f i and g i the allelic frequencies of the alleles f<br />
and g at the ith locus (with f and g i<strong>de</strong>ntical for homozygotes),<br />
the F is estimated for the ith locus with the roundrobin<br />
method, and z i = 1 the ith locus that is homozygous<br />
and z i = –1 for the ith locus that is heterozygous.<br />
When the same genotype is <strong>de</strong>tected more than once<br />
(n) in a population sample composed of N ramets, the<br />
probability that the samples actually originate from<br />
distinct reproductive events (i.e. from separate genets)<br />
is <strong>de</strong>scribed by the binomial expression (Tibayrenc<br />
et al. 1990; Parks and Werth 1993):<br />
P sex ¼ XN<br />
i¼n<br />
N!<br />
i!ðN iÞ! ½P genŠ i ½1 P gen Š N i ð2Þ<br />
where n is the number of sampled ramets with the<br />
same multi-locus genotype, N is the sample size, and<br />
P gen is <strong>de</strong>fined above. Estimates were performed using<br />
the software GENCLONE 1.0 (Arnaud-Haond and<br />
Belkhir 2007)<br />
Clonal diversity and structure:<br />
The clonal, or genotype diversity (R) at each station<br />
has been estimated as:<br />
R ¼ ðG<br />
ðN<br />
1Þ<br />
1Þ<br />
ð3Þ<br />
where G is the number of genotypes in the sample and<br />
N is the number of ramets analysed, as was<br />
recommen<strong>de</strong>d by Dorken and Eckert (2001) and Arnaud-Haond<br />
et al. (2005). Using this estimator, the<br />
minimum value for clonal diversity in a monoclonal<br />
stand is always 0, in<strong>de</strong>pen<strong>de</strong>ntly of sample size, and the<br />
maximum value is still 1, when all the different samples<br />
analysed correspond to distinct genotypes.<br />
The complement of Simpson in<strong>de</strong>x (Pielou 1969) for<br />
genotypic diversity in each station, representing the<br />
probability of encountering distinct Multi-Locus<br />
Genotypes (MLG) when randomly taking two sample<br />
units was estimated as:<br />
D ¼1<br />
X G<br />
i¼1<br />
<br />
n i ðn i<br />
NðN<br />
<br />
1Þ<br />
1Þ<br />
ð4Þ<br />
where N is the number of sample units (ramets sampled),<br />
G the number of multi-locus genotypes, and n i is<br />
the number of sample units sharing the ith MLG.<br />
The clonal sub-range (i.e., the maximum distance in<br />
meters between two i<strong>de</strong>ntical genotypes belonging to<br />
the same clone) was estimated for each station (Harada<br />
et al. 1997; Alberto et al. 2005). All clonal<br />
diversity and structure parameters were calculated<br />
with GENCLONE 1.0 (Arnaud-Haond and Belkhir<br />
2007).<br />
Genetic diversity and structure:<br />
Genetic diversity within populations was estimated with<br />
the mean number of alleles per locus, which was standardized<br />
(Â) to the lowest sample size collected in a<br />
station (33 samples in Greece, control station), using<br />
GENCLONE 1.0 (Arnaud-Haond and Belkhir 2007).<br />
After i<strong>de</strong>ntification of ramets belonging to the same<br />
genets, replicates were removed from the dataset to<br />
perform the following calculations using the GENETIX<br />
4.0 package (Belkhir et al. 2004). Unbiased (H E ) and<br />
observed (H O ) gene diversity estimates (Nei 1987) were<br />
calculated. A permutation procedure (1,000 permutations)<br />
was used to test whether a particular estimate of<br />
the overall inbreeding coefficient (F is ), was significantly<br />
different from 0. Heterozygosity was also calculated<br />
for each genotype, and relationships of genotype<br />
123<br />
86
Conserv Genet (2007) 8:1377–1391 1381<br />
heterozygosity with genotype frequency and clonal subrange<br />
were explored through regression analysis.<br />
Spatial autocorrelation within stations was assessed<br />
using the kinship estimator coefficient of Ritland (^F ij )<br />
as a genetic relatedness statistic (Ritland 1996),<br />
calculated using the GENCLONE 1.0 software<br />
(Arnaud-Haond and Belkhir 2007). We performed<br />
regression analyses of mean ^F ij against the Log e of<br />
mean geographic distance, within each distance class.<br />
This allowed the test of the a<strong>de</strong>quacy of two-dimensional<br />
isolation-by-distance mo<strong>de</strong>ls in each station<br />
(Rousset 1997).<br />
The autocorrelation analyses were performed twice<br />
for each station and site: (i) first including all samples,<br />
which mostly estimates the genetic neighbourhood of<br />
ramets of the same genet and (ii) using permutations<br />
(1,000) in or<strong>de</strong>r to inclu<strong>de</strong> at each permutation only<br />
one ramet (and one of the possible corresponding<br />
coordinates, randomly chosen for each permutation<br />
step) from each genet. This approach removes the<br />
influence of the spatial pattern of clonal growth from<br />
estimates of the relationship between genetic and<br />
geographic distance, allowing us to test for limitations<br />
to gene dispersal through seeds and pollen. The spatial<br />
scale (80 · 20 m 2 ) and number of distance classes (6)<br />
were the same across stations. For each autocorrelation<br />
analysis the upper levels of distance classes were <strong>de</strong>fined<br />
in or<strong>de</strong>r to inclu<strong>de</strong>, as much as possible, an even<br />
number of distance pair comparisons among classes<br />
(Table 2). Among stations, the minimum geographic<br />
distance between pairs of samples was of 0.3–0.7 m<br />
(0.6–1.6 m when genotype replicates were exclu<strong>de</strong>d),<br />
and the maximum distance ranged between 63.4 and<br />
76.9 m. We tested the significance of the regression<br />
slopes using 1,000 random permutations of the sample<br />
coordinates.<br />
From the slopes of the regressions of genetic distance<br />
to geographic distance within each distance class,<br />
we calculated the Sp statistic (Vekemans and Hardy<br />
2004), following the equation (5):<br />
Sp ¼<br />
ð1<br />
^b F<br />
^Fð1Þ Þ<br />
ð5Þ<br />
where ^b F is the slope of the linear regression and ^F ð1Þ<br />
represents the mean Kinship coefficient within neighbours<br />
(i.e. the lowest distance class). We tested for<br />
differences between regression slopes from impacted<br />
and control stations within each site performing F-tests<br />
of the slopes, for the spatial autocorrelation with genet<br />
replicates. In the case of the spatial autocorrelation<br />
without genet replicates, we simply compared the 95%<br />
Table 2 Number of distance pairs per distance class in each station, with and without genet replicates<br />
<strong>Station</strong> No. distance pairs per distance class b F ±SE Sp ±SE<br />
Cyprus impacted<br />
Ramets 130 –0.009 ± 0.006 P = 0.08 0.009 ± 0.006<br />
Genets 27 (18 higher class) –0.011 ± 0.005 ns 0.010 ± 0.005<br />
Cyprus control<br />
Ramets 130 –0.006 ± 0.004 ns 0.006 ± 0.004<br />
Genets 54 (55 lower class) 0.003 ± 0.002 ns 0.003 ± 0.002<br />
Greece impacted<br />
Ramets 111 –0.030 ± 0.005*** 0.031 ± 0.005<br />
Genets 95 –0.030 ± 0.001*** 0.030 ± 0.001<br />
Greece control<br />
Ramets 88 –0.010 ± 0.002* 0.010 ± 0.002<br />
Genets 84 (76 higher class) –0.009 ± 0.002* 0.009 ± 0.002<br />
Italy impacted<br />
Ramets 130 –0.022 ± 0.006** 0.022 ± 0.006<br />
Genets 79 (70 higher class) –0.015 ± 0.002** 0.015 ± 0.002<br />
Italy control<br />
Ramets 130 –0.012 ± 0.005* 0.012 ± 0.005<br />
Genets 69 (61 higher class) –0.014 ± 0.002* 0.014 ± 0.002<br />
Spain impacted<br />
Ramets 123–124 –0.020 ± 0.003* 0.020 ± 0.003<br />
Genets 54 (55 lower class) –0.041 ± 0.009** 0.042 ± 0.009<br />
Spain control<br />
Ramets 130 –0.032 ± 0.006** 0.033 ± 0.006<br />
Genets 42 (43 lower class) –0.044 ± 0.007** 0.046 ± 0.007<br />
The observed regression coefficient b F between mean ^F ij and the Log e of mean geographic distance within each distance class ± SE and<br />
the Sp statistic for each spatial autocorrelation analysis. The significant values are in bold. *: P < 0.05; **: P < 0.01; ***: P < 0.001. The<br />
b F and Sp values un<strong>de</strong>rlined or marked in italics indicate significant differences between the stations signalled this way<br />
87<br />
123
1382 Conserv Genet (2007) 8:1377–1391<br />
confi<strong>de</strong>nce intervals of the permutations performed<br />
with one genet real coordinate each time.<br />
Testing for the impact of perturbation on genotypic<br />
and genetic variability in the meadows:<br />
In the absence of pre-disturbance samples, we have<br />
consi<strong>de</strong>red the genetic structure at control quadrats to<br />
provi<strong>de</strong> a proxy for the genetic structure of the meadow<br />
next to the fish farm prior to disturbance. We based this<br />
assumption on the fact that the distance between stations<br />
(800–1,200 m) was relatively low for a species<br />
forming long-lived large clones (Sintes et al. 2006) in<br />
which, for a large proportion of meadows, the genetic<br />
neighbourhood has been shown to exceed the sampling<br />
area of stations sampled in this work (1,600 m 2 ; Arnaud-<br />
Haond et al. 2007). Moreover, the sampling was parallel<br />
to the coast at uniform <strong>de</strong>pths between stations.<br />
We therefore compared genetic structures at control<br />
and impacted stations among sites. We consi<strong>de</strong>red the<br />
four sites across the Mediterranean as in<strong>de</strong>pen<strong>de</strong>nt<br />
replicates to test for a consistent impact of fish farms<br />
on the genetic and clonal diversity of the seagrass<br />
meadows. Differences in Clonal sub-range (CR),<br />
Genotypic richness (R), Simpson Clonal Diversity In<strong>de</strong>x<br />
(D*), the mean number of alleles (Â) and expected<br />
(H E ) and observed (H O ) heterozygosities between<br />
impacted and control stations were analysed performing<br />
pairwise t-tests over data around the Mediterranean.<br />
When significant pairwise differences between<br />
stations were <strong>de</strong>tected in a parameter, we searched for<br />
correlations between the magnitu<strong>de</strong> of the differences<br />
and benthic sediment inputs (total, organic matter and<br />
nutrients), which provi<strong>de</strong>s a metric for the intensity of<br />
fish farm pressures on the farms (Holmer et al. 2007)<br />
and shoot <strong>de</strong>nsity between stations.<br />
Testing for the influence of genetic diversity<br />
components on <strong>de</strong>mographic responses to<br />
perturbation:<br />
Data on meadow shoot recruitment and mortality were<br />
obtained by direct census of tagged plants within three<br />
permanent plots installed in each <strong>de</strong>mographic station<br />
(genetic sampling stations encompassed a variable<br />
number of <strong>de</strong>mographic stations, see Table 1) and site,<br />
as <strong>de</strong>scribed in Diaz-Almela et al. (submitted). In that<br />
work, shoot mortality and recruitment variability have<br />
been shown to change exponentially, or in some cases<br />
following a power-law with the total, organic and<br />
nutrient benthic input rates measured in situ. Therefore,<br />
the possible influences of genotypic and genetic<br />
diversity components on the <strong>de</strong>mographic response at<br />
a given environmental forcing were assessed by comparing<br />
the residuals (averaged within each genetic<br />
station, Table 3) of mortality and recruitment versus<br />
sediment inputs at impacted stations with the genetic<br />
and genotypic structure at control stations. Control<br />
stations were assumed to provi<strong>de</strong> a proxy for the<br />
genetic and genotypic structure prior to the impact at<br />
each site.<br />
Results<br />
Genetic variability:<br />
Clonal structure and genetic diversity showed high<br />
variability among sites (Table 3). Genotypic richness<br />
(R) ranged between 0.44 (Amathous, ‘‘Impacted’’) and<br />
0.97 (Sounion, Control, Table 3). The number of<br />
genotypes differing in just one dinucleoti<strong>de</strong> repetition<br />
at a unique locus varied among sites and stations (1 at<br />
Sounion Control station to 16 at El Campello impacted<br />
station). The frequency of such genotypes did not <strong>de</strong>pend<br />
on the station, the mean number of samples per<br />
genotype or the clonal sub range, but it was negatively<br />
correlated to the allelic diversity, suggesting that those<br />
very similar genotypes did not <strong>de</strong>rive from somatic<br />
mutations and arose naturally from the lower number<br />
of possible allelic combinations. The standardized<br />
mean number of alleles (Â) present in each station<br />
ranged between 20 (El Campello, Impacted, Table 3)<br />
and 48 (Sounion, Control), and the allelic frequencies<br />
were more similar between stations that between sites<br />
(see Appendix). The chances of obtaining the same<br />
multi-locus genotype by sexual recombination were<br />
very small (all P sex < 0.01). Therefore, i<strong>de</strong>ntical genotypes<br />
were consi<strong>de</strong>red members of the same clone.<br />
As clonal richness, Simpson clonal diversity was<br />
minimum at Amathous (‘‘Impacted’’, D* = 0.880) and<br />
was highest at Sounion (‘‘Control’’, D* = 0.998,<br />
Table 3). Conversely, the clonal sub-range was minimum<br />
at the Sounion ‘‘control’’ station (CR = 12.7 m)<br />
and maximum at the Amathous ‘‘impacted’’ station<br />
(CR = 76.6 m, Table 3). Genotypic and allelic diversities<br />
<strong>de</strong>creased with increasing clonal sub-range, as<br />
large clone sizes were linked to the dominance of the<br />
sample by a few clones (CR and R: R 2 = 0.80,<br />
P < 0.002; CR and D*: R 2 = 0.49, P < 0.04; CR and Â:<br />
R 2 = 0.79, P < 0.003, n = 8).<br />
The variability in genetic structure between stations<br />
was much lower than among sites. Moreover, common<br />
Multilocus genotypes (MLG) were found between<br />
impacted and control stations at Amathous (1 MLG),<br />
Porto Palo (2 MLG) and El Campello (2 MLG).<br />
123<br />
88
Conserv Genet (2007) 8:1377–1391 1383<br />
Table 3 Genotypic structure parameters at the stations investigated: number of multilocus genotypes discriminated (G) inN genotyped<br />
samples, the unbiased genotypic richness (R), Complement Simpson diversity (D*) and the clonal sub-range (CR), in meters<br />
Sampling locations Genotypic structure Genetic structure Mean residuals of mortality with inputs<br />
N G R D* CR Â ^Fis ^Fð1Þ Total OM N P<br />
Amathous<br />
IMPACTED 40 18 0.44 0.880 76.6 29 –0.14 –0.02 –0.85 –0.23 –0.07 –0.18<br />
CONTROL 40 25 0.62 0.937 65.1 30 0.01 –0.03 –0.24 –0.68 –0.29 –0.30<br />
Sounion<br />
IMPACTED 37 31 0.92 0.994 29.9 41 –0.01 0.01 0.98 1.26 0.68 0.24<br />
CONTROL 33 29 0.97 0.998 12.7 48 –0.02 –0.01 –0.27 –1.01 –1.19 –1.06<br />
Porto Palo<br />
IMPACTED 40 34 0.77 0.981 60.5 38 0.06 –0.01 0.19 –0.06 0.01 –0.17<br />
CONTROL 38 32 0.72 0.971 41.7 40 –0.04 0.00 –0.48 –0.49 –0.18 0.23<br />
El Campello<br />
IMPACTED 39 26 0.66 0.961 70.9 20 –0.27 0.02 –0.25 –0.36 –0.20 –0.18<br />
CONTROL 40 23 0.56 0.953 68.7 28 –0.24 0.04 –0.66 –1.34 –1.23<br />
Genetic structure parameters: the standardised mean number of alleles (Â), the standardised mean inbreeding coefficient (^F is , marked<br />
in bold when it <strong>de</strong>viates significantly from Hardy–Weinberg equilibrium), and the mean Ritland kinship coefficient between neighbour<br />
samples (^F ð1Þ , without genet replicates). The residuals of regressions between mortality and total, Organic Matter, Nitrogen and<br />
Phosphorus sedimentation rates are also provi<strong>de</strong>d<br />
Genotype heterozygosity was not correlated to<br />
genotype frequency or clonal sub-range (data not<br />
shown). Significant heterozygote excesses were <strong>de</strong>tected<br />
at the ‘‘control’’ station of El Campello (Spain,<br />
P < 0.001) and at the ‘‘impacted’’ station of Cyprus.<br />
The remaining stations did not differ significantly from<br />
Hardy–Weinberg equilibrium (Table 3). The mean<br />
Ritland kinship coefficient between neighbours was<br />
nearly 0 at all stations and sites (Table 3).<br />
Significant (P < 0.001 to P < 0.05) spatial autocorrelation<br />
patterns were <strong>de</strong>tected either with or without<br />
genotype replicates in all sites and stations with the<br />
exception of Cyprus (Table 2), revealing a negative<br />
relationship between genetic relatedness and geographic<br />
distance. The spatial autocorrelation patterns<br />
varied wi<strong>de</strong>ly across sites: comparing control stations<br />
among sites, it was lowest in the shallowest site<br />
(Greece: Sp = 0.010 ± 0.002, Table 2) and highest at<br />
the <strong>de</strong>epest site (Spain: Sp = 0.032 ± 0.006, Table 2).<br />
The removal of the MLG replicates did not affect the<br />
strength and patterns of the spatial autocorrelation in<br />
any consistent way (Table 2).<br />
Impact of perturbations on genotypic and genetic<br />
variability in the meadows:<br />
The slope of the spatial correlation and the Sp statistic<br />
were not significantly different between stations,<br />
except in Greece, where Sp at the impacted station<br />
was three times higher than at control station<br />
(P < 0.05). Such difference persisted when the autocorrelation<br />
was performed without MLG replicates<br />
(Table 2).<br />
The observed heterozygosity H o was lower at impacted<br />
than at control stations in every site with the<br />
exception of Cyprus, in which no significant differences<br />
were found in shoot <strong>de</strong>nsity and net population growth<br />
between the so called ‘‘impacted’’ and ‘‘control’’ stations.<br />
Nevertheless, the reduction was not significant,<br />
even excluding this site (Pairwise t-test, two tails,<br />
P = 0.17, n = 3).<br />
In turn the clonal sub-range was systematically and<br />
significantly higher at ‘‘impacted’’ stations than at control<br />
ones (paired t-test, P < 0.05, n =4,Fig.2). Despite<br />
their negative relationship with clonal sub-range, no<br />
consistent variation was found in clonal richness R or<br />
Simpson clonal diversity D* between impacted and<br />
control stations across sites (Fig. 2). Nevertheless, the<br />
mean number of alleles  (also inversely related to<br />
clonal sub-range) significantly <strong>de</strong>creased, as compared<br />
to their respective control stations (paired t-test,<br />
P < 0.05, n =4,Fig.2). The mean number of rare alleles<br />
 (frequency < 5% at any station of a given site) was<br />
also significantly lower at impacted stations as compared<br />
to their respective control stations (P < 0.02, n =4).<br />
The increase in clonal sub-range at impacted stations<br />
showed no significant correlations with differences in<br />
shoot mortality rates or shoot <strong>de</strong>nsities between impacted<br />
and control stations (R 2 = 0.66, P = 0.121, n =4;<br />
R 2 = 0.43, P = 0.211, n = 4, respectively). The systematic<br />
reduction in the mean number of alleles at impacted<br />
stations also showed a non-significant correlation with<br />
differences in shoot mortality rates (expressed as<br />
ln(year –1 ), R 2 = 0.73, P = 0.096, n = 4) and with differences<br />
in sediment input rates (expressed as<br />
ln(g(DW)m –2 d –1 ), R 2 = 0.49, P = 0.189, n = 4).<br />
89<br />
123
1384 Conserv Genet (2007) 8:1377–1391<br />
Fig. 2 Diagrams of clonal<br />
richness (R), mean number of<br />
alleles (Â), Simpson clonal<br />
diversity D* and clonal subrange<br />
(CR, in meters) at<br />
impacted and control stations.<br />
The symbols correspond to<br />
the sites indicated in Fig. 1<br />
R<br />
Â<br />
Impacted<br />
D*<br />
CR<br />
Table 4 Coefficient of <strong>de</strong>termination of linear regressions <strong>de</strong>scribing the relationship between differential shoot mortality at impacted<br />
stations (i.e. the residuals of shoot mortality with sedimentation rates) and clonal richness (R), Simpson clonal diversity (D*), mean<br />
number of alleles (Â) and maximum clonal range (CR, meters) at the respective control stations<br />
Demographic residuals at impacted stations Genetic structure at control stations (n =4)<br />
R D* Â CR (m)<br />
Mortality-Total inputs R 2 = 0.70, ns R 2 = 0.99** R 2 = 0.79, ns R 2 = 0.79, ns<br />
Mortality-OM inputs R 2 = 0.94* R 2 = 0.70, ns R 2 = 0.78, ns R 2 = 0.85, ns<br />
Mortality-N inputs R 2 = 0.96* R 2 = 0.67, ns R 2 = 0.81, ns R 2 = 0.86*<br />
Mortality-P inputs R 2 = 0.83, ns R 2 = 0.61, ns R 2 = 0.62, ns R 2 = 0.70, ns<br />
ns: P > 0.05; *: P < 0.05; **: P < 0.01<br />
Possible influence of genetic structure components<br />
on <strong>de</strong>mographic responses to perturbation:<br />
The residuals of shoot mortality with total, organic and<br />
nutrient inputs at the impacted stations were correlated<br />
with the clonal sub-range (CR) at the control stations<br />
(Table 4), assumed to be representative of meadow<br />
genetic structure in the area near the cages, before impact.<br />
The negative relationship was significant between<br />
CR and the residuals of shoot mortality with nitrogen<br />
input rates (R 2 = 0.86, P < 0.05, n = 4; Fig. 3, Table 4).<br />
The residuals of shoot mortality at the impacted stations<br />
were positively correlated with R, Â and D* at control<br />
stations (Table 4). The strongest and most significant<br />
correlations occurred between residuals of mortality<br />
with nitrogen (N) inputs at impacted stations and R at<br />
control stations (R 2 = 0.96, P = 0.014, n = 4; Fig. 3,<br />
Table 4) as well as between residuals of mortality with<br />
total sediment inputs at impacted stations and D* at<br />
control stations (R 2 = 0.99, P = 0.003, n = 4; Fig. 3,<br />
Table 4). Residuals of shoot recruitment vs. sediment<br />
inputs at impacted stations did not show any significant<br />
relationship with D*, R, Â or CR at control stations.<br />
Discussion<br />
The effect of disturbances on clonal structure and<br />
genetic diversity:<br />
In spite of the high mortality and rapid reductions on<br />
P. oceanica meadow <strong>de</strong>nsity near fish cages, most<br />
123<br />
90
Conserv Genet (2007) 8:1377–1391 1385<br />
Fig. 3 Regressions of Clonal<br />
richness (R), Simpson clonal<br />
diversity (D*), clonal subrange<br />
(CR) and mean number<br />
of alleles (Â) at the control<br />
stations with the residuals of<br />
shoot mortality with N<br />
sedimentation rate<br />
Residuals of mortality at impacted stations (yr -1 )<br />
R D*<br />
CR<br />
Â<br />
Genetic structure at control stations<br />
variability in genetic parameters was still attributable<br />
to differences among sites rather than to differences<br />
between stations, indicating that the recent effects of<br />
population <strong>de</strong>cline on genetic diversity have been<br />
lower than the longer term natural factors shaping the<br />
genetic structure across the species geographic range.<br />
In<strong>de</strong>ed, the similar genetic structure found at ‘‘impacted’’<br />
and ‘‘control’’ stations within each site, as well<br />
as the existence of common genotypes between stations<br />
of the same site, support the assumption of similar<br />
patterns of clonal structure and genetic diversity<br />
between stations previous to impact.<br />
Despite the low shoot <strong>de</strong>nsities reached at impacted<br />
stations (29% of shoot <strong>de</strong>nsity at ‘‘control’’ station in El<br />
Campello, which clearly compromise population viability<br />
in this slow growing species), effects on genetic<br />
diversity within the remaining meadows were limited to<br />
a reduction in the allelic richness, particularly affecting<br />
rare alleles. The lack of significant differences between<br />
stations for the observed heterozygosity or the<br />
inbreeding coefficient is consistent with predictions<br />
(Nei et al. 1975) and experiments (Leberg 1992), indicating<br />
that population bottlenecks have a stronger<br />
effect on allelic richness than on population heterozygosity<br />
(see also Widmer and Lexer 2001). The latter<br />
would in<strong>de</strong>ed require extreme bottleneck or foun<strong>de</strong>r<br />
effects through several generations to be clearly reduced<br />
(Leberg 1992). Such patterns of allelic richness<br />
reduction have also been observed in other long-lived<br />
species, like logged or fragmented populations of<br />
tropical trees (White et al. 1999). An extensive survey<br />
within this group of species indicates that genetic<br />
diversity loss through fragmentation or selective logging<br />
is better reflected in the resulting inbreeding in the<br />
progeny, over longer time scales (Lee et al. 2002; Lowe<br />
et al. 2005). This suggests that genetic diversity may<br />
keep on being lost slowly in the subsequent generations<br />
(Lowe et al. 2005), still affecting the population a long<br />
time after the perturbation occurred.<br />
Posidonia oceanica is an extremely long-lived species<br />
(Mateo et al. 1997) in which genets are expected to<br />
persist for centuries (Hemminga and Duarte 2000;<br />
Sintes et al. 2006), when they are allowed by the<br />
environmental conditions. The sparse sexual reproduction<br />
of the species (Gambi et al. 1996; Balestri and<br />
Cinelli 2003; Díaz-Almela et al. 2006) and its slow<br />
vegetative extension rate (Marbà and Duarte 1998)<br />
ensures that the genetic structure observed in a so<br />
91<br />
123
1386 Conserv Genet (2007) 8:1377–1391<br />
short time scale (all fish farms initiated operation<br />
Conserv Genet (2007) 8:1377–1391 1387<br />
observed significant reduction in shoot mortality at<br />
impacted stations with presumed larger initial clonal<br />
sub-range and number of shoots per genet suggests that<br />
mortality rates are slightly lower where clones are large<br />
and constituted of a high number of ramets.<br />
While the observation of larger clones at impacted<br />
stations could be explained as a simple matter of<br />
probability (i.e. given an equal shoot probability to die,<br />
it is more likely for little clones to disappear completely<br />
than for large ones), the increased mortality<br />
observed within meadows initially composed of little<br />
clones would suggest that the shoot probability of dying<br />
<strong>de</strong>creases with the size of the clone it belongs to.<br />
A major uncertainty about these inferences is the<br />
lack of information on the meadow genetic structure<br />
previous to the impact, which does not allow us to<br />
validate that of the control areas as a proxy. Experimental<br />
studies are nee<strong>de</strong>d to test for our conclusions.<br />
Nevertheless the results are based on the observation<br />
of a consistent pattern across four sites in the Mediterranean,<br />
where a basic similarity in the genetic<br />
structure between impacted and control stations supports<br />
the likelihood of our assumption. A major role<br />
for chance in producing such patterns appears unlikely.<br />
Altogether, those observations strongly suggest that<br />
some size-related fitness traits may influence the seagrass<br />
resistance to perturbation.<br />
Among clonal plants, clonal integration (share of resources<br />
and of probability-to-dye between ramets) has<br />
been shown to be a size-related adaptive trait (e.g. van<br />
Kleunen et al. 2000), which would provi<strong>de</strong> a selective<br />
advantage in environments with a low proportion of<br />
suitable habitat (Oborny et al. 2000; Oborny and Kun<br />
2002). It has been invoked to explain enhanced survival<br />
and accelerated growth of clone patches with clonal size<br />
in undisturbed conditions among several seagrass species<br />
(Olesen and Sand-Jensen 1994; Vidondo et al. 1997).<br />
In P. oceanica, clonal integration has been experimentally<br />
proven to exist within at least 20–30 cm distance<br />
(Marbà et al. 2002). The ramets of a clone can<br />
remain connected during <strong>de</strong>ca<strong>de</strong>s (as 40–50 years is the<br />
maximum life expectancy of P. oceanica shoots, Marbà<br />
and Duarte 1998) but given the slow horizontal growth<br />
rate of the species (1–6 cm year –1 ,Marbàand Duarte<br />
1998) we can hypothesize an upper limit for clonal<br />
integration in this species of 2.4–3 m, a range greater<br />
than the size estimated for most genotypes in this study,<br />
but much lower than the clonal sub-ranges registered at<br />
all the stations. This would suggest that other size-related<br />
fitness traits should account for the enhanced resistance<br />
to perturbation of large clones found in this work.<br />
Among other benefits, foraging capacity is improved<br />
by clonal size (Oborny and Kun 2002), which means that<br />
93<br />
a larger range of different micro-habitats can be explored<br />
by the same genetic individual when its number<br />
of modular units increases, optimizing its capacity to<br />
reach micro-environments it is better adapted to. Also,<br />
large clones may have reached such large size because<br />
they may have surmounted various regimes of selection,<br />
being better adapted to a larger range of conditions. This<br />
could be an additional factor accounting for the greater<br />
survival of large clones relative to small ones when exposed<br />
to disturbance <strong>de</strong>rived from fish farm operations.<br />
The lack of correlation between genotype heterozygosity<br />
and clonal sub-range with neutral markers is not<br />
enough to reject such hypothesis, because heterozygote<br />
advantage is not proven to occur in P. oceanica. Therefore,<br />
un<strong>de</strong>r disturbed conditions, such mechanisms (increased<br />
clonal integration, optimized foraging capacity,<br />
or dominance of the fittest genotypes) enhancing survival<br />
of larger clones could make a population constituted<br />
of a few large clones more resistant to perturbation<br />
than a diverse population consisting of many little<br />
clones, counterbalancing the potentially beneficial<br />
influence of genotypic and genetic diversity in population<br />
resistance to and recovery from perturbations<br />
(Reusch and Hughes 2006).<br />
The experiments by Williams (2001), Hughes and<br />
Stachowitz (2004) and Reusch et al. (2005) suggest the<br />
existence of positive effects of genotypic diversity on<br />
survival and recovery of seagrasses for clones of similar<br />
size. As genotypic and allelic richness tend to be reduced<br />
with increased dominance of meadows by a few<br />
clones, the results of this study point to the existence of<br />
a tra<strong>de</strong>-off between genetic or genotypic diversity and<br />
clone size in the potential of seagrass meadows to<br />
survive perturbations. This hypothesis <strong>de</strong>serves to be<br />
tested with experimental or field studies, which simultaneously<br />
test the effects of genotypic diversity with<br />
those of clonal size on plant survival and recovery. This<br />
study shows effects of fish farm-<strong>de</strong>rived mortality on<br />
the clonal structure and genetic diversity of seagrass<br />
meadows. What are the consequences of those changes,<br />
on the scope of recovery after disturbance, is difficult<br />
to ascertain. Provi<strong>de</strong>d seagrass meadows are<br />
experiencing losses worldwi<strong>de</strong> and will most likely<br />
continue to un<strong>de</strong>rgo in the near future (Duarte et al. in<br />
press), to un<strong>de</strong>rstand the feed-backs of genetic and<br />
clonal structure with disturbance may help to predict<br />
the trajectories of those meadows.<br />
Acknowledgments The present work has been financed by the<br />
MedVeg (Q5RS-2001-02456 of FP5) and THRESHOLDS (contract<br />
003933-2 of FP 6) of the European Union. We are grateful to<br />
Rocío Santiago, Fernando Lázaro and Alberto Rabito for their<br />
assistance in the field.<br />
123
1388 Conserv Genet (2007) 8:1377–1391<br />
Appendix Allelic frequencies of the seven loci at the four sites (C = Control station; I = Impacted station)<br />
Locus 1 141 143 145 147 149 151 153 155 157 158 159 161 163 165 167 A Locus 7 176 178 180 182 A<br />
Amathous C 0.60 0.22 0.16 0.02 4 0.40 0.60 2<br />
Amathous I 0.03 0.50 0.28 0.17 0.03 5 0.67 0.33 2<br />
Sounion C 0.02 0.19 0.02 0.52 0.19 0.05 0.02 0.02 8 0.52 0.45 0.03 3<br />
Sounion I 0.13 0.37 0.49 0.01 4 0.01 0.18 0.81 3<br />
Porto Palo C 0.02 0.02 0.50 0.22 0.09 0.05 0.07 0.03 8 0.55 0.45 2<br />
Porto Palo I 0.19 0.02 0.31 0.15 0.06 0.27 6 0.69 0.31 2<br />
Campello C 0.07 0.09 0.46 0.33 0.02 0.02 0.02 7 0.37 0.63 2<br />
Campello I 0.46 0.54 2 0.85 0.15 2<br />
Locus 2 154 156 164 166 172 174 182 184 188 198 A Locus 5 159 161 163 165 167 171 A<br />
Amathous C 0.94 0.04 0.02 3 0.48 0.52 2<br />
Amathous I 0.89 0.11 2 0.03 0.33 0.06 0.58 4<br />
Sounion C 0.08 0.83 0.09 3 0.02 0.16 0.16 0.67 4<br />
Sounion I 0.04 0.88 0.07 3 0.34 0.03 0.63 3<br />
Porto Palo C 0.69 0.19 0.03 0.09 4 0.60 0.29 0.10 3<br />
Porto Palo I 0.50 0.47 0.03 3 0.16 0.44 0.31 0.06 0.03 5<br />
Campello C 0.20 0.09 0.61 0.11 4 0.17 0.07 0.43 0.33 4<br />
Campello I 0.02 0.77 0.21 3 0.15 0.1 0.46 0.29 4<br />
Locus 3 194 198 200 206 208 210 212 214 216 218 220 222 224 226 228 230 232 234 236 238<br />
Amathous C 0.02 0.06 0.22 0.10 0.16 0.02 0.02 0.08 0.12<br />
Amathous I 0.28 0.11 0.22 0.06 0.28<br />
Sounion C 0.02 0.05 0.02 0.09 0.06 0.11 0.06 0.02 0.03 0.02<br />
Sounion I 0.01 0.12 0.04 0.01 0.04 0.04 0.13 0.03 0.01 0.04 0.10 0.10<br />
Porto Palo C 0.05 0.03 0.02 0.19 0.24 0.16 0.03 0.07 0.19 0.02<br />
Porto Palo I 0.02 0.02 0.21 0.24 0.06 0.06 0.11 0.10 0.16 0.02<br />
Campello C 0.28 0.35 0.11 0.15 0.02 0.09<br />
Campello I 0.31 0.44 0.04 0.21<br />
Locus 3 240 242 244 246 248 250 252 254 256 260 262 264 266 268 282 288 A<br />
Amathous C 0.08 0.06 0.02 0.04 12<br />
Amathous I 0.06 5<br />
Sounion C 0.02 0.02 0.03 0.11 0.09 0.03 0.03 0.03 0.08 0.02 0.03 0.02 0.02 0.02 13<br />
Sounion I 0.03 0.07 0.09 0.03 0.04 0.01 0.01 14<br />
Porto Palo C 10<br />
Porto Palo I 10<br />
Campello C 6<br />
Campello I 4<br />
123<br />
94
Conserv Genet (2007) 8:1377–1391 1389<br />
Appendix continued<br />
Locus 4 208 210 218 220 222 226 228 234 236 238 240 242 244 250 252 A Locus 6 168 170 172 174 178 A<br />
Amathous C 0.02 0.84 0.08 0.06 4 0.74 0.26 2<br />
Amathous I 0.64 0.33 2 0.83 0.17 2<br />
Sounion C 0.02 0.38 0.39 0.22 4 0.77 0.23 2<br />
Sounion I 0.01 0.35 0.01 0.40 0.03 0.18 0.01 7 0.82 0.18 2<br />
Porto Palo C 0.02 0.03 0.02 0.57 0.07 0.09 0.07 0.02 0.07 0.05 10 0.62 0.33 0.05 3<br />
Porto Palo I 0.02 0.03 0.63 0.08 0.06 0.02 0.08 0.08 8 0.69 0.19 0.06 0.05 4<br />
Campello C 0.91 0.09 2 0.20 0.39 0.41 3<br />
Campello I 1 1 0.02 0.81 0.15 0.02 4<br />
References<br />
Alberte RS, Suba GK, Procaccini G et al (1994) Assessment of<br />
genetic diversity of seagrass populations using DNA fingerprinting:<br />
implications for population stability and management.<br />
Proc Natl Acad Sci USA 91:1049–1053<br />
Alberto F, Correia L, Arnaud-Haond S et al (2003) New<br />
microsatellite markers for the en<strong>de</strong>mic Mediterranean<br />
seagrass Posidonia oceanica. Mol Ecol Notes 3:253–255<br />
Alberto F, Gouveia L, Arnaud-Haond S et al (2005) Spatial<br />
genetic structure, neighbourhood size and clonal sub-range<br />
in seagrass (Cymodocea nodosa) populations. Mol Ecol<br />
14:2669–2681<br />
Arnaud-Haond S, Belkhir K (2007) GenClone 1.0: a new<br />
software for population genetics analysis on clonal organisms.<br />
Mol Ecol Notes 7:15–17<br />
Arnaud-Haond S, Alberto F, Procaccini G et al (2005) Assessing<br />
genetic diversity in clonal organisms: low diversity or low<br />
resolution? Combining power and cost-efficiency in selecting<br />
markers. J Hered 94(6):434–440<br />
Arnaud-Haond S, Migliaccio M, Diaz-Almela E et al (2007)<br />
Vicariance patterns in the Mediterranean Sea: East-West<br />
cleavage and low dispersal in the en<strong>de</strong>mic seagrass Posidonia<br />
oceanica. J Biogeogr DOI: 10.1111/j.1365-2699.2006.<br />
01671.x<br />
Balestri E, Cinelli F (2003) Sexual reproductive success in<br />
Posidonia oceanica. Aquat Bot 75:21–32<br />
Belkhir K, Borsa P, Chikhi L et al (2004) GENETIX 4.05,<br />
logiciel sous Windows TM pour la génétique <strong>de</strong>s populations.<br />
Laboratoire Génome et Populations, Interactions,<br />
Adaptations, CNRS UMR5000, Université Montpellier II,<br />
Montpellier (France). http://www.genetix.univ-montp2.fr/<br />
genetix/genetix.htm<br />
Bethoux JP, Copin-Montegut G (1986) Biological fixation of<br />
atmospheric nitrogen in the Mediterranean Sea. Limnol<br />
Oceanogr 31:1353–1358<br />
Collevatti RG, Grattapaglia D, Hay JD (2001). Population<br />
genetic structure of the endangered tropical tree species<br />
Caryocar brasiliense, based on variability at microsatellite<br />
loci. Mol Ecol 10:349–356<br />
Delgado O, Grau A, Pou S et al (1997) Seagrass regression<br />
caused by fish cultures in Fornells Bay (Menorca, Western<br />
Mediterranean). Oceanol Act 20(3):557–563<br />
Delgado O, Ruiz JM, Pérez M et al (1999) Effects of fish farming<br />
on seagrass (Posidonia oceanica) in a Mediterranean bay:<br />
seagrass <strong>de</strong>cline after organic loading cessation. Oceanol<br />
Act 22(1):109–117<br />
<strong>de</strong>n Hartog C (1970) The Seagrasses of the world. North Holland<br />
Publishing Company, Amsterdam<br />
Díaz-Almela E, Marbà N, Álvarez E et al (2006) Patterns of<br />
seagrass (Posidonia oceanica) flowering in the Western<br />
Mediterranean. Mar Biol 148(4):723–742<br />
Diaz-Almela E, Marbà N, Álvarez E et al (submitted) Benthic<br />
inputs as predictors of seagrass (Posidonia oceanica) fish<br />
farm-induced <strong>de</strong>cline. MS available at http://www.arxiv.org;<br />
Reference: q-bio.QM/0611006<br />
Dorken ME, Eckert CG (2001) Severely reduced sexual reproduction<br />
in northern populations of a clonal plant, Decodon<br />
verticillatus (Lythraceae). J Ecol 89:339–350<br />
Doyle JJ, Doyle JL (1988) Natural interspecific hybridization in<br />
eastern North American Claytonia. Am J Bot 75:1238–1246<br />
Duarte CM, Borum J, Short FT, Walker DI (in press) Seagrass<br />
ecosystems: their global status and prospects. In: Polunin<br />
NVC (ed) Aquatic ecosystems: trends and global prospects.<br />
Cambridge University Press<br />
95<br />
123
1390 Conserv Genet (2007) 8:1377–1391<br />
Edwards KR, Travis SE, Proffitt CE (2005) Genetic effects of a<br />
large-scale Spartina alterniflora (Smooth Cordgrass) dieback<br />
and recovery in the Northern Gulf of Mexico. Estuaries<br />
28(2):204–214<br />
Gambi MC, Buia MC, Mazzella L (1996) Record of a diffuse<br />
germination of Posidonia oceanica (L.) Delile in the central<br />
Adriatic Sea (Croatia). Biol Mar Medit 3:467–470<br />
Hämmerli A, Reusch TBH (2003) Inbreeding <strong>de</strong>pression influences<br />
genet size distribution in a marine angiosperm. Mol<br />
Ecol 12:619–629<br />
Hamrick JL, Linhart YB, Mitton JB (1979) Relationships<br />
between life-history characteristics and electrophoretically<br />
<strong>de</strong>tectable genetic-variation in plants. Annu Rev Ecol Syst<br />
10:173–200<br />
Harada Y, Kawano S, Iwasa Y (1997) Probability of clonal<br />
i<strong>de</strong>ntity: inferring the relative success of sexual versus clonal<br />
reproduction from spatial genetic patterns. J Ecol 85:591–<br />
600<br />
Hemminga M, Duarte CM (2000) Seagrass ecology. Cambridge<br />
University Press, Cambridge<br />
Holmer M, Pérez M, Duarte CM (2003) Benthic primary<br />
producers – a neglected environmental problem in Mediterranean<br />
maricultures? Mar Poll Bull 46:1372–1376<br />
Holmer M, Marbà N, Diaz-Almela E et al (2007) Sedimentation<br />
of organic matter from fish farms in oligotrophic Mediterranean<br />
assessed through bulk and stable isotope (d 13 C and<br />
d 15 N) analyses. Aquaculture 262(2–4):268–280<br />
Hughes RA, Stachowicz JJ (2004) Genetic diversity enhances the<br />
resistance of a seagrass ecosystem to disturbance. Proc Natl<br />
Acad Sci 101:8998–9002<br />
Leberg PL (1992) Effects of population bottlenecks on genetic<br />
diversity as measured by allozyme electrophoresis. Evolution<br />
46(2):477–494<br />
Lee CT, Wickneswari R, Mahani MC et al (2002) Effect of<br />
selective logging on the genetic diversity of Scaphium<br />
macropodum. Biol Cons 104:107–118<br />
Leimu R, Multikainen P, Koricheva J, Fischer M (2006) How<br />
general are positive relationships between plant population<br />
size, fitness and genetic variation? J Ecol 94:942–952<br />
Loreau M, Hector A (2001) Partitioning selection and complementarity<br />
in biodiversity experiments. Nature 412:72–76<br />
Lowe AJ, Boshier D, Ward M et al (2005) Genetic resource<br />
impacts of habitat loss and <strong>de</strong>gradation; reconciling empirical<br />
evi<strong>de</strong>nce and predicted theory for neotropical trees.<br />
Heredity 95:255–273<br />
Marbà N, Duarte CM (1998) Rhizome elongation and seagrass<br />
clonal growth. Mar Ecol Progr Ser 174:269–280<br />
Marbà N, Duarte CM, Holmer M et al (2002) Effectiveness of<br />
protection of seagrass (Posidonia oceanica) populations in<br />
Cabrera National Park (Spain). Environ Conserv 29:509–<br />
518<br />
Marbà N, Duarte CM, Diaz-Almela E et al (2005) Direct<br />
evi<strong>de</strong>nce of imbalanced seagrass (Posidonia oceanica) shoot<br />
population dynamics in the Spanish Mediterranean. Estuaries<br />
28:53–62<br />
Mateo MA, Romero J, Pérez M et al (1997) Dynamics of<br />
millenary organic <strong>de</strong>posits resulting from the growth of the<br />
Mediterranean Seagrass Posidonia oceanica. Est Coast Shelf<br />
Sci 44:103–110<br />
McNeilly T, Roose ML (1984) The distribution of perennial<br />
ryegrass genotypes in swards. New Phytol 98:503–513<br />
Meinesz A, Lefevre JR (1984) Régéneration d’un herbier <strong>de</strong><br />
Posidonia oceanica quarante années après sa <strong>de</strong>struction par<br />
une bombe dans la ra<strong>de</strong> <strong>de</strong> Villefranche (Alpes Maritimes-<br />
France). In: Boudouresque CF, Jeudy <strong>de</strong> Grissac A, Olivier<br />
J (eds) International Workshop on Posidonia oceanica beds,<br />
vol 1. GIS Posidonie Publ. Marseille, France, 12–15 Oct.<br />
1983, pp 39–44<br />
Micheli C, Paganin P, Peirano A et al (2005) Genetic variability<br />
of Posidonia oceanica (L.) Delile in relation to local factors<br />
and biogeographic patterns. Aquat Bot 82:210–221<br />
Nei M (1975) Molecular population genetics and evolution.<br />
North Holland, Amsterdam<br />
Nei M (1987) Molecular evolutionary genetics. Columbia University<br />
Press, New York<br />
Oborny B, Kun A (2002) Fragmentation of clones: how does it<br />
influence dispersal and competitive ability? Evol Ecol<br />
15:319–346<br />
Oborny B, Kun A, Czaran T et al (2000) The effect of clonal<br />
integration on plant competition for mosaic habitat space.<br />
Ecology 81:3291–3304<br />
Olesen J, Sand-Jensen K (1994) Demography of shallow eelgrass<br />
(Zostera marina) populations – shoot dynamics and biomass<br />
<strong>de</strong>velopment. J. Ecol 82:379–390<br />
Parks JC, Werth CR (1993) A study of spatial features of clones<br />
in a population of bracken fern, Pteridium aquilinum<br />
(Dennstaedtiaceae). Am J Bot 80:537–544<br />
Pasqualini V, Pergent-Martini C Clabaut P et al (1998) Mapping<br />
of Posidonia oceanica using aerial photographs and si<strong>de</strong><br />
scan sonar: application off the island of Corsica (France).<br />
Est Coast Shelf Sci 47:359–367<br />
Pielou EC (1969) An introduction to mathematical ecology.<br />
Wiley-Interscience, New-York<br />
Reusch TBH (2006) Does disturbance enhance genotypic diversity<br />
in clonal organisms? A field test in the marine<br />
angiosperm Zostera marina. Mol Ecol 15:277–286<br />
Reusch TBH, Hughes AR (2006) The emerging role of genetic<br />
diversity for ecosystem functioning: estuarine macrophytes<br />
as mo<strong>de</strong>ls. Estuaries Coasts 29(1):159–164<br />
Reusch TBH, Boström C, Stam WT, Olsen JL (1999) An ancient<br />
eelgrass clone in the Baltic. Mar Ecol Progr Ser 183:301–304<br />
Reusch TB, Ehlers A, Hämmerli A et al (2005) Ecosystem<br />
recovery after climatic extremes enhanced by genotypic<br />
diversity. Proc Natl Acad Sci 102:2826–2831<br />
Ritland K (1996) Estimators for pairwise relatedness and<br />
individual inbreeding coefficients. Gen Res 67:175–185<br />
Rousset F (1997) Genetic differentiation and estimation of gene<br />
flow from F-statistics un<strong>de</strong>r isolation by distance. Genetics<br />
145(4):1219–1228<br />
Ruiz JM, Pérez M, Romero J (2001) Effects of fish farm loadings<br />
on seagrass (Posidonia oceanica) distribution, growth and<br />
photosynthesis. Mar Poll Bull 42(9):749–760<br />
Sintes T, Marbà N, Duarte CM (2006) Mo<strong>de</strong>ling non-linear seagrass<br />
clonal growth: assessing the efficiency of space occupation<br />
across the seagrass flora. Estuaries Coasts 29(1):72–80<br />
Tibayrenc M, Kjellberg F, Ayala FJ (1990) A clonal theory of<br />
parasitic protozoa: the population structures of Entamoeba,<br />
Giardia, Leishmania, Naegleria, Plasmodium, Trichomonas,<br />
and Trypanosoma and their medical and taxonomical<br />
consequences. Proc Nat Acad Sci USA 87:2414–2418<br />
van Kleunen M, Fischer M, Schmid B (2000) Clonal integration<br />
in Ranunculus reptans: by-product or adaptation? J Evol<br />
Biol 13:237–248<br />
Vekemans X, Hardy OJ (2004) New insights from fine-scale<br />
spatial genetic structure analyses in plant populations. Mol<br />
Ecol 13(4):921–935<br />
Vidondo B, Middleboe AL, Stefansen K et al (1997) Dynamics<br />
of a patchy seagrass (Cymodocea nodosa) landscape. Size<br />
and age distributions, growth and <strong>de</strong>mography of seagrass<br />
patches. Mar Ecol Prog Ser 158:131–138<br />
Watkinson AR, Powell JC (1993) Seedling recruitment and the<br />
maintenance of clonal diversity in plant populations–a<br />
123<br />
96
Conserv Genet (2007) 8:1377–1391 1391<br />
computer simulation of Ranunculus Repens. J Ecol<br />
81(4):707–717<br />
White GM, Boshier DH, Powell W (1999) Genetic variation<br />
within a fragmented population of Swietenia humilis Zucc.<br />
Mol Ecol 8:1899–1909<br />
Widmer A, Lexer C (2001) Glacial refugia: sanctuaries for allelic<br />
richness, but not for gene diversity. Trends Ecol Evol<br />
16(6):267–269<br />
Williams SL (2001) Reduced genetic diversity in eelgrass<br />
transplantations affects both population growth and individual<br />
fitness. Ecol Appl 11(5):1472–1488<br />
Wright S (1931) Evolution in Men<strong>de</strong>lian populations. Genetics<br />
16:97–159<br />
Young A, Boyle T, Brown T (1996) The population genetic<br />
consequences of habitat fragmentation for plants. Tree<br />
11:413–418<br />
Young AG, Hill JH, Murray BG et al (2002) Breeding system,<br />
genetic diversity and clonal structure in the sub-alpine forb<br />
Rutidosis leiolepis F. Muell. (Asteraceae). Biol Cons 106:71–78<br />
97<br />
123
Sophie ARNAUD-HAOND - Candidature à une Habilitation à Diriger <strong>de</strong>s Recherches, Février 2008<br />
3. Résumé <strong>de</strong>s travaux <strong>de</strong> Recherche<br />
II.5<br />
GenClone 1.0: a new program to analyse genetics data on clonal<br />
organisms. Molecular Ecology Notes, 2007.<br />
Il existait seulement trois logiciels permettant <strong>de</strong> prendre en compte la<br />
clonalité dans les analyses <strong>de</strong> données moléculaires, et la plupart étaient restreint à<br />
la reconnaissance <strong>de</strong>s lignées clonales. Aucun ne proposait l’étu<strong>de</strong> <strong>de</strong>s<br />
composantes spatiales <strong>de</strong> la clonalité (‘clonal subrange’, les nouveaux indices<br />
proposés dans notre article <strong>de</strong> revue). Nous avons donc développé un logiciel<br />
permettant d’utiliser les les différentes métho<strong>de</strong>s et indices compilés ou proposés<br />
dans l’article <strong>de</strong> revue, notamment l’adaptation <strong>de</strong>s analyses d’autocorrélation<br />
spatiale aux jeux <strong>de</strong> données moléculaires sur les organismes clonaux organismes<br />
clonaux.<br />
GenClone a déjà été mis à jour à <strong>de</strong>ux reprises (nous en somme au mois <strong>de</strong><br />
décembre 2007 à Genclone 2.0), la première fois afin <strong>de</strong> corriger d’inévitables ‘bugs’<br />
signalés par les premiers utilisateurs, et la secon<strong>de</strong> pour y intégrer les nouveaux<br />
outils statistiques développés et proposés dans la revue.<br />
http://si-wagner.ualg.pt/ccmar/maree/software.php?soft=genclon<br />
98
Molecular Ecology Notes (2007) 7, 15–17<br />
doi: 10.1111/j.1471-8286.2006.01522.x<br />
Blackwell Publishing Ltd<br />
PROGRAM NOTE<br />
GENCLONE: a computer program to analyse genotypic data, test<br />
for clonality and <strong>de</strong>scribe spatial clonal organization<br />
SOPHIE ARNAUD-HAOND* and KHALID BELKHIR†<br />
*Laboratory of ‘Ecology and Evolution of Marine Organisms’, CCMAR, F.C.M.A.-Universida<strong>de</strong> do Algarve, Faro, Portugal,<br />
†Laboratoire Génome, Populations, Interactions, Adaptation, Université <strong>de</strong> Montpellier II, France<br />
Abstract<br />
GENCLONE 1.0 is <strong>de</strong>signed for studying clonality and its spatial components using genotype<br />
data with molecular markers from haploid or diploid organisms. GENCLONE 1.0 performs<br />
the following tasks. (i) discriminates distinct multilocus genotypes (MLGs), and uses<br />
permutation and resampling approaches to test for the reliability of sets of loci and<br />
sampling units for estimating genotypic and genetic diversity (a procedure also useful<br />
for nonclonal organisms); (ii) computes statistics to test for clonal propagation or clonal<br />
i<strong>de</strong>ntity of replicates; (iii) computes various indices <strong>de</strong>scribing genotypic diversity; and<br />
(iv) summarizes the spatial organization of MLGs with adapted spatial autocorrelation<br />
methods and clonal subrange estimates.<br />
Keywords: clonality, individuals resampling, locus combination, multilocus genotypes, software,<br />
spatial distribution<br />
Received 15 June 2006; revision accepted 10 July 2006<br />
Clonal species, from unicellular organisms to marine invertebrates,<br />
are dominant in many habitats. In ecological studies<br />
on clonal organisms, particularly in clonal plants with cryptic<br />
rhyzomatic connections, the discrimination of individuals<br />
issued from sexual or clonal reproduction, or the estimation<br />
of sexual vs. clonal reproduction, are among the<br />
most challenging technical issues. Molecular markers are<br />
particularly useful since genetically i<strong>de</strong>ntical individuals<br />
issued from clonal reproduction can theoretically be<br />
recognized on the basis of their multilocus genotypes.<br />
However, reliable recognition of clonal i<strong>de</strong>ntity, on the<br />
basis of molecular markers, requires specific statistical<br />
tests and procedures. Two software packages have<br />
been recently <strong>de</strong>veloped, mlgsim (Stenberg et al. 2003) and<br />
genotype and genodive (Meirmans & Van Tien<strong>de</strong>ren<br />
2004), that provi<strong>de</strong> some of those required tests. The software<br />
<strong>de</strong>veloped here, genclone 1.0 implements new and<br />
improved statistical features such as accounting for <strong>de</strong>viation<br />
from Hardy–Weinberg equilibrium while testing for clonality,<br />
Correspon<strong>de</strong>nce: Sophie Arnaud-Haond, Fax: +61 7 4725-1570;<br />
E-mail: s-arnaud@ualg.pt or belkhir@univ-montp2.fr<br />
http://www.ualg.pt/ccmar/maree/software.php?soft=genclon<br />
and specially adapted analyses for studying the spatial<br />
components of clonality.<br />
genclone requires the following information for each<br />
individual: (i) a name; (ii) one to two spatial coordinates<br />
(when available); and (iii) genotype at each locus for<br />
codominant markers. The options available to users can be<br />
divi<strong>de</strong>d in three sets of analysis, corresponding to the<br />
three ‘upper panels’. (i) ‘Test’ — for checking for locus and<br />
‘sampling unit’ reliability for optimal multilocus genotypes<br />
(MLGs) and genetic individuals recognition; (ii) ‘MLG’ —<br />
for computing various genotypic richness and diversity<br />
<strong>de</strong>scriptors; and (iii) ‘Spatial components’ — for <strong>de</strong>scribing<br />
various spatial aspects of clonality.<br />
Tests<br />
These procedures use permutation approaches to test for<br />
data quality. (In other words, the power of the analysed<br />
sample and loci set to obtain an accurate estimate of the<br />
maximum number of multilocus genotypes present in the<br />
dataset and in the sampling area, respectively). All possible<br />
datasets corresponding to all possible combinations of loci<br />
(with L the number of analysed loci) and sampling units<br />
(with N the total number of ‘sampling units’) are generated,<br />
© 2006 The Authors<br />
Journal compilation © 2006 Blackwell Publishing Ltd<br />
99
16 PROGRAM NOTE<br />
and then the minimum, average and maximum number<br />
of discriminated MLGs for each class of number of locus<br />
(l) or sampling units (n) are obtained. When performed<br />
on the loci, this permutation procedure allows us to verify<br />
if an asymptote is reached when l tends towards L. It<br />
therefore allows ensuring that the set of loci used permit a<br />
good estimate of the real number of MLG present in the<br />
sample analysed. This procedure combined with the test<br />
for clonal i<strong>de</strong>ntity <strong>de</strong>tailed hereafter allows to ascertain<br />
the maximum efficiency of the chosen loci combination<br />
(Arnaud-Haond et al. 2005). When applied to individuals,<br />
it allows us to verify if the sampling <strong>de</strong>nsity (in terms of the<br />
number of sampling units) is sufficient to reliably estimate<br />
the true number of MLGs present in the sampled area. When<br />
the number of individuals or loci is high, the computation<br />
time can be very long due to the huge number of possible<br />
combinations. We have therefore <strong>de</strong>veloped two complementary<br />
procedures based on resampling without replacement:<br />
resampling x times from the set of L loci; and<br />
resampling x times from the set of N individuals; (where x<br />
is chosen by the users) and then estimating the average<br />
number of MLGs which can be distinguished with this<br />
number x of loci or individuals. These resampling procedures<br />
also provi<strong>de</strong> estimates of the maximum, minimum<br />
and average number of MLGs in the subset of data, as well<br />
as the maximum, minimum and the mean number of alleles<br />
and the heterozygosity (unbiased estimate, Nei 1978) for<br />
each subset of data generated. This is an alternative to the<br />
bootstrap, and to the rarefaction procedure (El Mousadik<br />
& Petit 1996), commonly used to compare the levels of<br />
diversity among sample sets of unequal size, and can also<br />
be used to compare allelic richness and heterozygosity in<br />
nonclonal organisms (Leberg 2002). The last test in this<br />
section is a test for clonal propagation based on the round<br />
robin method proposed by Parks & Werth (1993). This<br />
allows us to estimate, for each MLG, the probability P GEN<br />
and the <strong>de</strong>rived binomial P SEX<br />
. These probabilities are used<br />
to test both for clonal i<strong>de</strong>ntity and for clonal propagation<br />
(Arnaud-Haond et al. 2005; see also Tibayrenc et al. 1990;<br />
Gregorius 2005). A slightly more conservative test is also<br />
provi<strong>de</strong>d, which is based on estimates P GEN<br />
(f) and P SEX<br />
(f),<br />
of the same probabilities, but now taking into account the<br />
estimated F IS<br />
in the population (Young et al. 2002). Finally,<br />
a genetic distance matrix can be computed (based on the<br />
number of different alleles among sampling units). The<br />
frequency distribution of genetic distances can, for example,<br />
help to screen for scoring errors or somatic mutations<br />
(Douhovnikoff et al. 2004; Meirmans & Van Tien<strong>de</strong>ren<br />
2004; Arnaud-Haond et al. 2005). With a high number of<br />
loci, or loci characterized by a high mutation rate, this<br />
frequency distribution can also help to <strong>de</strong>fine a threshold<br />
below which MLGs separated by low genetic distance and<br />
can be consi<strong>de</strong>red as belonging to the same ‘clonal lineage’,<br />
or of the same genetic individual.<br />
MlG<br />
This option allows us to compute the usual estimators of<br />
genotypic richness in a sample of N sampling units. These<br />
are: G = the number of distinct MLGs; R = the modified<br />
in<strong>de</strong>x of genotypic richness, as proposed by Dorken and<br />
Eckert (Dorken & Eckert 2001). Additionally, the commonly<br />
used indices of genotypic diversity, <strong>de</strong>rived from species<br />
diversity indices, are computed. These are: the Simpson<br />
complement and, the Shannon-Wiener (Hurlbert 1971;<br />
Washington 1984) diversity and evenness indices, as<br />
well as Hill’s Simpson reciprocal (Hurlbert 1971; Hill 1973)<br />
(which corresponds to the ‘apparent number of genotypes<br />
in the sample’).<br />
Spatial components<br />
These procedures allow us to summarize spatial aspects<br />
of clonal diversity when geographic coordinates of the<br />
sampling units are available. A map of MLGs can be drawn<br />
and exported as a bitmap file. The clonal subrange section<br />
plots the probability of clonal i<strong>de</strong>ntity against distance<br />
(Harada & Iwasa 1996; Harada et al. 1997). Here we use a<br />
custom <strong>de</strong>finition of distance classes (either as a number<br />
of distance classes, or as a list of pre<strong>de</strong>fined maximum<br />
distances for each class), and estimate of the ‘clonal subrange’<br />
as the maximum spatial distance between two replicates of<br />
the same MLG (Alberto et al. 2005). Finally, autocorrelation<br />
procedures adapted to the existence of replicates are<br />
computed, using Loiselle et al. (1995) and Ritland (1996)<br />
kinship coefficients. Classical autocorrelation analysis are<br />
performed at the ‘ramet level’ (i.e. including all sampling<br />
units), and random permutations of the geographical coordinates<br />
are performed among sampling units in or<strong>de</strong>r<br />
to test for the significance of the observed spatial structure.<br />
Following Vekemans & Hardy (2004) F ij<br />
(the average kinship<br />
for each distance class) and b (the slope of the regression)<br />
are estimated and tested for significance. At the ‘genet level’<br />
(i.e. including only one copy of each MLG), autocorrelation<br />
is computed in three ways: (i) using central coordinates for<br />
each replicated MLG (Hämmerli & Reusch 2003; Alberto<br />
et al. 2005); (ii) using a weighted approach (Alberto et al.<br />
2005; Wagner et al. 2005;) to remove the distances among<br />
pairs of i<strong>de</strong>ntical genotype from the dataset; (iii) using<br />
a resampling approach in or<strong>de</strong>r to create and analyse<br />
subdatasets of size g (= the number of MLG i<strong>de</strong>ntified),<br />
with each MLG being attributed randomly one of the spatial<br />
coordinates corresponding to one of the sampling units<br />
exhibiting this given MLG (Alberto et al. 2005). For this<br />
last procedure, confi<strong>de</strong>nce intervals are computed at<br />
90% and 95% level, in or<strong>de</strong>r to test whether the ‘observed’<br />
distribution obtained by resampling significantly <strong>de</strong>part<br />
from the ‘random’ distribution generated by randomly<br />
permuting spatial coordinates among MLGs.<br />
100<br />
© 2006 The Authors<br />
Journal compilation © 2006 Blackwell Publishing Ltd
PROGRAM NOTE 17<br />
Acknowledgements<br />
We thank Kevin Dawson, Jim Coyer and Malia Chevolot for their<br />
help in improving the first versions of genclone and correcting<br />
the English.<br />
References<br />
Alberto F, Gouveia L, Arnaud-Haond S et al. (2005) Spatial genetic<br />
structure, neighbourhood size and clonal subrange in seagrass<br />
(Cymodocea nodosa) populations. Molecular Ecology, 14, 2669–<br />
2681.<br />
Arnaud-Haond S, Alberto F, Procaccini G, Serrao EA, Duarte CM<br />
(2005) Assessing genetic diversity in clonal organisms: low<br />
diversity or low resolution? Combining power and costefficiency<br />
in selecting markers. Journal of Heredity, 96, 1–8.<br />
Dorken ME, Eckert CG (2001) Severely reduced sexual reproduction<br />
in northern populations of a clonal plant, Decodon verticillatus<br />
(Lythraceae). Journal of Ecology, 89, 339–350.<br />
Douhovnikoff V, Cheng AM, Dodd RS (2004) Inci<strong>de</strong>nces size and<br />
spatial structure of clones in second-growth stands of coast<br />
redwood Sequoia sempervirens (Cupressaceae). American Journal<br />
of Botany, 91, 1140–1146.<br />
El Mousadik A, Petit RJ (1996) High level of genetic differentiation<br />
for allelic richness among populations of the argan tree [Argania<br />
spinosa (L.) Skeels] en<strong>de</strong>mic to Morocco. Theoretical and Applied<br />
Genetics, 92, 832–839.<br />
Gregorius H-R (2005) Testing for clonal propagation. Heredity, 94,<br />
173–179.<br />
Hämmerli A, Reusch TBH (2003) Genetic neighborhood of clone<br />
structures in eelgrass meadows quantified by spatial autocorrelation<br />
of microsatellite markers. Heredity, 91, 448–455.<br />
Harada K, Iwasa Y (1996) Analyses of spatial patterns and population<br />
processes of clonal plants. Researches on Population<br />
Ecology, 38, 153–164.<br />
Harada Y, Kawano S, Iwasa Y (1997) Probability of clonal i<strong>de</strong>ntity:<br />
inferring the relative success of sexual versus clonal reproduction<br />
from spatial genetic patterns. Journal of Ecology, 85, 591–600.<br />
Hill MO (1973) Diversity and eveness: a unifying notation and its<br />
consequences. Ecology, 54, 427–432.<br />
Hurlbert SH (1971) The nonconcept of species diversity: a critique<br />
and alternative parameters. Ecology, 52, 577–586.<br />
Leberg PL (2002) Estimating allelic richness: effects of sample size<br />
and bottlenecks. Molecular Ecology, 11, 2445–2449.<br />
Loiselle BA, Sork VL, Nason J, Graham C (1995) Spatial genetic<br />
structure of a tropical un<strong>de</strong>rstorey shrub, Psychotria officinalis<br />
(Rubiaceae). American Journal of Botany, 82, 1420–1425.<br />
Meirmans PG, Van Tien<strong>de</strong>ren PH (2004) genotype and genodive:<br />
two programs for the analysis of genetic diversity of asexual<br />
organisms. Molecular Ecology Notes, 4, 792–794.<br />
Nei M (1978) Estimation of heterozygosity and genetic distance<br />
from a small number of individuals. Genetics, 89.<br />
Parks JC, Werth CR (1993) A study of spatial features of clones in<br />
a population of bracken fern, Pteridium aquilinum (Dennstaedtiaceae).<br />
American Journal of Botany, 80, 537–544.<br />
Ritland K (1996) Estimators for pairwise relatedness and individual<br />
inbreeding coefficients. Genetical Research, 67, 175–185.<br />
Stenberg P, Lundmark M, Saura A (2003) mlgsim: a program for<br />
<strong>de</strong>tecting clones using a simulation approach. Molecular Ecology<br />
Notes, 3, 329–331.<br />
Tibayrenc M, Kjellberg F, Ayala F (1990) A clonal theory of<br />
parasitic protozoa: the population structures of Entamoeba,<br />
Giardia, Leishmania, Naegleria, Plasmodium, Trichomonas, and<br />
Trypanosoma and their medical and taxonomical consequences.<br />
Proceedings of the National Aca<strong>de</strong>my of Sciences, USA, 87, 2414–<br />
2418.<br />
Vekemans X, Hardy OJ (2004) New insights from fine-scale spatial<br />
genetic structure analyses in plant populations. Molecular Ecology,<br />
13, 921–935.<br />
Wagner HH, Hol<strong>de</strong>regger R, Werth S, Gugerli F, Hoebee SE,<br />
Schei<strong>de</strong>gger C (2005) Variogram analysis of the spatial genetic<br />
structure of continuous populations using multilocus microsatellite<br />
data. Genetics, 169, 1739–1752.<br />
Washington HG (1984) Diversity, biotic and similarity indices.<br />
A review with special relevance to aquatic ecosystems. Water<br />
Research, 18, 653–694.<br />
Young AG, Hill JH, Murray BG, Peakall R (2002) Breeding system,<br />
genetic diversity and clonal structure in the sub-alpine forb<br />
Rutidosis leiolepis F. Muell. (Asteraceae). Biological Conservation,<br />
106, 71–78.<br />
© 2006 The Authors<br />
Journal compilation © 2006 Blackwell Publishing Ltd<br />
101
Sophie ARNAUD-HAOND - Candidature à une Habilitation à Diriger <strong>de</strong>s Recherches, Février 2008<br />
3. Résumé <strong>de</strong>s travaux <strong>de</strong> Recherche<br />
II.6 Conclusions et Perspectives.<br />
Dans un premier temps nous avons tenté <strong>de</strong> standardiser le cadre ‘logistique’<br />
(échantillonnage) et ‘statistique’ <strong>de</strong>s étu<strong>de</strong>s afin d’optimiser les possibilités<br />
ultérieures d’interprétation <strong>de</strong>s résultats dans un contexte plus vaste, ou <strong>de</strong><br />
comparaison entre <strong>de</strong>s étu<strong>de</strong>s différentes. Nous n’avons toujours pas résolu le<br />
problème <strong>de</strong> l’échantillonnage et <strong>de</strong> sa <strong>de</strong>nsité. Les différentes espèces<br />
d’organismes clonaux sont réparties dans <strong>de</strong>s populations présentant <strong>de</strong>s <strong>de</strong>nsités<br />
et <strong>de</strong>s niveaux <strong>de</strong> fragmentation spatiales variables, et étant données les propriétés<br />
indésirables <strong>de</strong>s estimateurs classiques <strong>de</strong> diversité, il <strong>de</strong>meure difficile en l’absence<br />
<strong>de</strong> données démographiques <strong>de</strong> comparer ces indicateurs entre populations d’une<br />
même espèce, et donc a forciori entre espèces différentes. Nous continuons<br />
actuellement à explorer les propriétés <strong>de</strong> la distribution <strong>de</strong> Pareto face aux variation<br />
<strong>de</strong> <strong>de</strong>nsité, et testons également la validité d’autres distributions, <strong>de</strong> type<br />
exponentielle, à la <strong>de</strong>scription <strong>de</strong> la diversité clonale.<br />
Je poursuis à présent ce travail <strong>de</strong> réflexion en tentant <strong>de</strong> réaliser une autre<br />
revue et une révision <strong>de</strong>s concepts centraux en écologie et en évolution (taille<br />
efficace, temps <strong>de</strong> génération, unité soumise à la sélection naturelle, mutations<br />
somatiques…), et <strong>de</strong> la façon dont ils sont affectés par la clonalité. Que signifie le<br />
concept <strong>de</strong> taille efficace, quelle est l’unité sur laquelle les processus sélectifs<br />
s’appliquent (l’unité ou la lignée ?), que signifie le concept <strong>de</strong> générations –<br />
chevauchantes ou non- chez <strong>de</strong>s espèces où le génotype issu d’un zygote est<br />
susceptible <strong>de</strong> perdurer <strong>de</strong>s centaines <strong>de</strong> milliers d’années s26 ?<br />
Il s’agit <strong>de</strong> faire un premier pas, primaire et synthétique, afin <strong>de</strong> stimuler une<br />
réflexion collective nécessaire à la compréhension <strong>de</strong> la façon dont la clonalité<br />
influence la dynamique et l’évolution <strong>de</strong>s populations et <strong>de</strong>s espèces et sur notre<br />
façon d’appréhen<strong>de</strong>r ce mo<strong>de</strong> <strong>de</strong> fonctionnement particulier et ses implications pour<br />
nos étu<strong>de</strong>s.<br />
102
Sophie ARNAUD-HAOND - Candidature à une Habilitation à Diriger <strong>de</strong>s Recherches, Février 2008<br />
3. Résumé <strong>de</strong>s travaux <strong>de</strong> Recherche<br />
III. LES METAPOPULATIONS CONSIDEREES COMME DES SYSTEMES<br />
COMPLEXES : NETWORKS GENETIQUES<br />
A l’instar <strong>de</strong> beaucoup d’étu<strong>de</strong>s d’écologie moléculaire, les travaux auxquels<br />
j’ai contribué ont porté sur une majorité d’espèces dont les populations naturelles<br />
connaissent <strong>de</strong>s fluctuations ou <strong>de</strong>s perturbation importantes. C’est le cas <strong>de</strong>s<br />
espèces exploitées (le chinchard, la nacre perlière), menacées (les Mangroves, les<br />
Phanérogames), invasives (comme l’algue Caulerpa taxifolia, thèse <strong>de</strong> Tânia Aires)<br />
ou pathogènes. Il semble en fait que la plupart <strong>de</strong>s espèces étudiées en écologie<br />
moléculaire appartiennent à l’une <strong>de</strong> ces catégories, et sont étudiées précisément<br />
parce qu’elles se trouvent dans une condition démographique particulière impliquant<br />
un écart au postulat d’équilibre migration-dérive nécessaire à l’interprétation <strong>de</strong>s<br />
données <strong>de</strong> génétique <strong>de</strong>s populations avec les outils statistiques classiques. De<br />
plus, les modèles classiques ten<strong>de</strong>nt à considérer toutes les populations comme<br />
étant équivalentes en terme <strong>de</strong> taille efficace et <strong>de</strong> flux migratoires notamment, et<br />
l’objectif principal est souvent <strong>de</strong> cibler les populations les plus importantes d’un<br />
système, qu’il s’agisse d’espèces menacées, invasives ou pathogènes.<br />
Par ailleurs, le développement croissant <strong>de</strong>s moyens moléculaires<br />
disponibles, la multiplication du nombre <strong>de</strong> locus et <strong>de</strong> la quantité <strong>de</strong> données qu’il<br />
est possible <strong>de</strong> réunir, ren<strong>de</strong>nt les jeux <strong>de</strong> données <strong>de</strong> plus en plus complexes. Il<br />
<strong>de</strong>vient <strong>de</strong> moins en moins satisfaisant d’utiliser <strong>de</strong>s statistiques résumées et <strong>de</strong><br />
réduire l’information réunie sur les centaines <strong>de</strong> locus et d’individus à un indice<br />
unique, dont l’interprétation reste par ailleurs sujette à caution.<br />
Pour conclure, nous étions à la recherche d’une métho<strong>de</strong> qui permette<br />
d’exploiter au mieux l’information contenue dans nos jeux <strong>de</strong> données, avec un<br />
minimum d’hypothèses sous-jacentes quant à la biologie du système étudié et la<br />
possibilité <strong>de</strong> comprendre le système dans son ensemble. Quelques conversations<br />
‘fortuites’ avec <strong>de</strong>s collègues physiciens spécialisés dans l’étu<strong>de</strong> <strong>de</strong>s systèmes<br />
complexes, nous ont amené à tenter l’expérience, avec eux, d’adapter une théorie en<br />
plein essor aux données <strong>de</strong> génétique <strong>de</strong>s populations: la théorie <strong>de</strong>s réseaux.<br />
Le problème spécifique posés par les systèmes définis comme ‘complexes’<br />
est la compréhension du fonctionnement d’un système composé <strong>de</strong> n composantes,<br />
dans un système non Euclidien, c’est à dire lorsque la compréhension du<br />
fonctionnement <strong>de</strong> chacune <strong>de</strong>s n composantes prises individuellement ne permet<br />
pas la compréhension du fonctionnement du système dans son entier. La théorie <strong>de</strong>s<br />
réseaux consiste à représenter un système complexe sous forme d’agents (les<br />
noeuds) reliés par <strong>de</strong>s liens qui représentent le flux d’information dans le système, et<br />
à analyser les propriétés révélées par la topologie du graphe en termes <strong>de</strong> flux<br />
d’information, <strong>de</strong> stabilité et d’évolution du système ( Figure 10).<br />
103
Sophie ARNAUD-HAOND - Candidature à une Habilitation à Diriger <strong>de</strong>s Recherches, Février 2008<br />
3. Résumé <strong>de</strong>s travaux <strong>de</strong> Recherche<br />
Figure 10:<br />
(a) Illustration shématique <strong>de</strong> réseau empruntée à Watts et Strogartz (1998), avec <strong>de</strong> gauche à<br />
droite le passage d’un réseau complètement régulier à un réseau ‘random’, selon la proportion p <strong>de</strong><br />
liens distribués au hasard entre les noeuds (ou vertex).<br />
(b) Illustration <strong>de</strong> l’évolution <strong>de</strong> <strong>de</strong>ux propriétés <strong>de</strong>s réseaux en fonction <strong>de</strong> p: le ‘clustering<br />
coefficient’ et le diamètre (L) (voir encadré 3).<br />
Développée au début du XXe siècle, elle a connu son réel essor avec le<br />
développement <strong>de</strong> l’informatique et <strong>de</strong> la puissance <strong>de</strong> calcul requise à son<br />
développement, à la fin <strong>de</strong>s années 1990 (Watts & Strogatz 1998, Albert et al. 1999).<br />
Elle a <strong>de</strong>puis été appliquée à <strong>de</strong>s champs <strong>de</strong> recherche allant <strong>de</strong> la sociologie (Watts<br />
1999, 2004) à la biologie cellulaire ou moléculaire (Ueda et al. 2004) ou à l’écologie<br />
(Bascompte et al. 2003, Bascompte et al. 2005, May 2006), ses <strong>applications</strong> initiales<br />
les plus populaires étant celles <strong>de</strong> la structure et <strong>de</strong> la dynamique d’internet (Albert et<br />
al. 1999, Barabasi et al. 2000). Basée sur la théorie <strong>de</strong>s graphes, la théorie <strong>de</strong>s<br />
réseaux permet dans un premier temps <strong>de</strong> représenter les liens entre agents d’un<br />
système complexe sans être contraint par une représentation dichotomique telle que<br />
nous la connaissons classiquement dans les arbres phylogénétiques représentant<br />
les réseaux d’individus ou <strong>de</strong> populations (Figure E.3, Figure 11).<br />
104
Sophie ARNAUD-HAOND - Candidature à une Habilitation à Diriger <strong>de</strong>s Recherches, Février 2008<br />
3. Résumé <strong>de</strong>s travaux <strong>de</strong> Recherche<br />
Figure 11 : réseau <strong>de</strong> populations <strong>de</strong> Posidonia oceanica en Méditerranée, élaboré sur la base <strong>de</strong>s<br />
distances <strong>de</strong> Goldstein et analysé au point <strong>de</strong> percolation (au niveau minimum <strong>de</strong> distance avant la<br />
déconnection du système). Le diamètre <strong>de</strong>s points reflète le niveau <strong>de</strong> betweeness-centrality, un<br />
indice utilisé pour résumer la proportion <strong>de</strong> chemins les plus courts passant par l’agent représenté, et<br />
qui reflète donc ici le rôle <strong>de</strong>s populations dans le relais <strong>de</strong> l’information –ici le flux génique- et le<br />
maintien <strong>de</strong> la connectivité du système.<br />
Une fois le graphe établi, il s’agit à partir <strong>de</strong> cette représentation statique,<br />
d’obtenir <strong>de</strong>s informations sur la dynamique du flux d’information dans le système.<br />
Les <strong>de</strong>scripteurs <strong>de</strong> la topologie du réseau (distribution <strong>de</strong>s liens, chemin le plus<br />
court, etc… voir Encadré 3) permettent d’extraire un certain nombre <strong>de</strong><br />
caractéristiques révélatrices <strong>de</strong> cette dynamique. D’une part l’existence <strong>de</strong> structure<br />
hiérarchique au sein <strong>de</strong>s populations (écart à la panmixie, existence <strong>de</strong> sousfamilles)<br />
peut-être révélée à l’échelle intra-populationnelle. De même à l’échelle d’un<br />
réseau <strong>de</strong> métapopulations, sans a priori sur les groupements ni aucune information<br />
géographique préalable, l’existence <strong>de</strong> sous-structure peut-être révélée et les<br />
groupes <strong>de</strong> sous populations, quelque soit leur nombre, i<strong>de</strong>ntifiés. Enfin le<br />
comportement particulier <strong>de</strong> certains nœuds ou groupes <strong>de</strong> nœuds -ou encore <strong>de</strong><br />
certains liens- dans le flux <strong>de</strong> l’information ou le maintien <strong>de</strong> l’intégrité du système,<br />
peuvent être révélées par l’analyse <strong>de</strong> certaines propriétés déductibles <strong>de</strong> la<br />
distribution <strong>de</strong>s liens (Encadré 3).<br />
105
Sophie ARNAUD-HAOND - Candidature à une Habilitation à Diriger <strong>de</strong>s Recherches, Février 2008<br />
3. Résumé <strong>de</strong>s travaux <strong>de</strong> Recherche<br />
Encadré 3: Différents types <strong>de</strong> réseaux et propriétés<br />
principales.<br />
Les réseaux sont constitués <strong>de</strong> noeuds (ou vertices) reliés entre eux par <strong>de</strong>s liens<br />
(edges). Plusieurs types <strong>de</strong> réseaux peuvent être construits en fonction <strong>de</strong> l’uniformité<br />
<strong>de</strong>s noeuds et <strong>de</strong>s liens, ou <strong>de</strong> la possibilité <strong>de</strong> pondérer ou <strong>de</strong> donner une direction aux<br />
liens<br />
Figure E 3.1: différentes sortes <strong>de</strong> réseaux :<br />
(a) simple et non dirigé, avec un seul type <strong>de</strong><br />
liens et <strong>de</strong> noeuds<br />
(b) existence <strong>de</strong> différents types <strong>de</strong> liens et<br />
noeuds<br />
(c) liens et noeuds pondérés<br />
(d) lien directionnels.<br />
Extrait <strong>de</strong> Newman, 2003<br />
Descripteurs <strong>de</strong> la topologie du réseau:<br />
‘<strong>de</strong>gree distribution’: distribution <strong>de</strong>s liens du systèmes entre les noeuds<br />
‘shortest path’, ou ‘geo<strong>de</strong>sic distance’: moyenne <strong>de</strong>s plus court chemins d’un<br />
noeud à l’autre<br />
‘diameter’: distance la plus importante séparant <strong>de</strong>ux noeuds dans un réseau<br />
‘clustering’ (ou ‘transitivity’): ratio <strong>de</strong> triplet <strong>de</strong> noeuds interconnecté par rapport au<br />
nombre total <strong>de</strong> triplés dans le système. Peut-être utilisé comme un estimateur <strong>de</strong> la<br />
sous-structure du système.<br />
Small world: se dit d’un type spécifique <strong>de</strong> réseau présentant un faible diamètre et<br />
un fort clustering. Cette topologie typique a été rencontrée dans un très grand<br />
nombre <strong>de</strong> réseaux étudiés jusqu’à présent (internet, contact sociaux, etc…)<br />
Caractéristiques noeuds-spécifiques:<br />
‘betweeness-centrality’: nombre <strong>de</strong> chemin les plus courts passant par un noeud<br />
donné.<br />
‘<strong>de</strong>gree’: nombre <strong>de</strong> liens unissant un noeud donné à d’autres agents du système.<br />
Dans un premier temps, nous avons construit <strong>de</strong>s réseaux simples (<strong>de</strong> type a dans<br />
l’encadré 3), c'est-à-dire avec un seul type <strong>de</strong> nœuds et <strong>de</strong> lien, non dirigés et non<br />
pondérés. Nous avons réalisé les premiers essais et la mise au point sur la base d’un<br />
jeu <strong>de</strong> données <strong>de</strong> microsatellites <strong>de</strong> Posidonia oceanica échantillonnée tout autour<br />
<strong>de</strong> la Méditerranée.<br />
106
Sophie ARNAUD-HAOND - Candidature à une Habilitation à Diriger <strong>de</strong>s Recherches, Février 2008<br />
3. Résumé <strong>de</strong>s travaux <strong>de</strong> Recherche<br />
A l’échelle <strong>de</strong>s populations, <strong>de</strong>s réseaux d’unités d’échantillonnage (ramets) et <strong>de</strong><br />
clones (genets) ont été réalisés sur la base <strong>de</strong>s distances <strong>de</strong> Goldstein (1995)<br />
modifiées pour être adaptées au niveau inter individuel ; à l’échelle <strong>de</strong> l’aire <strong>de</strong><br />
distribution, les différentes localités d’échantillonnages ont été représentées par <strong>de</strong>s<br />
noeuds reliées par <strong>de</strong>s liens fonction <strong>de</strong> la distance <strong>de</strong> Goldstein (1997) entre les<br />
localités. Le but <strong>de</strong> cet exercice était d’établir, parmi les métho<strong>de</strong>s et les indices<br />
disponibles dans les analyses <strong>de</strong> réseaux, les plus adaptés à la <strong>de</strong>scription <strong>de</strong>s<br />
relations génétiques entre individus ou populations, et du flux <strong>de</strong> gènes dans<br />
l’espace. Nous espérions grâce à cet exercice i<strong>de</strong>ntifier <strong>de</strong>s individus ou <strong>de</strong>s<br />
populations ayant un rôle central dans l’histoire ou la dynamique du système.<br />
Dans le cadre du projet Européen qui vent <strong>de</strong> débuter, nous travaillons maintenant à<br />
l’analyse d’autres jeux <strong>de</strong> données, et également à la modélisation <strong>de</strong> systèmes <strong>de</strong><br />
métapopulations (avec <strong>de</strong>s sources-puits, <strong>de</strong> extinction –recolonisation, etc…) afin<br />
d’éluci<strong>de</strong>r la correspondance entre les propriétés du réseau et la distribution du flux<br />
génique dans un système <strong>de</strong> métapopulations.<br />
107
Sophie ARNAUD-HAOND - Candidature à une Habilitation à Diriger <strong>de</strong>s Recherches, Février 2008<br />
3. Résumé <strong>de</strong>s travaux <strong>de</strong> Recherche<br />
III.1 Spectrum of genetic diversity and networks of clonal populations. Journal<br />
of the Royal Society Interface, 2007.<br />
Au niveau intrapopulation, en considérant les unités d’échantillonnage (ramets) ou<br />
les lignées clonales (genets) comme les agents et leur distance génétique comme le<br />
lien qui les unis, les réseaux ont mis en évi<strong>de</strong>nce un structure typique dite ‘smallworld’.<br />
Cette structure s’applique à un très large éventail <strong>de</strong> systèmes complexes<br />
analysés jusqu’à aujourd’hui, caractérisés par l’existence d’une faible distance<br />
moyenne entre nœuds et d’un fort clustering, révélateurs <strong>de</strong> la propagation<br />
relativement rapi<strong>de</strong> <strong>de</strong> l’information au travers du système : dans notre cas d’une<br />
faible divergence génétique moyenne entre individus d’une même population, et une<br />
forte sous.<br />
L’analyse <strong>de</strong> la topologie <strong>de</strong>s réseaux et le fort clustering ont révélé l’existence<br />
<strong>de</strong> ‘sous-familles’ d’individus plus apparentés entre eux que d’un groupe à l’autre,<br />
révélant un écart à la panmixie. La seule métho<strong>de</strong> performante permettant <strong>de</strong><br />
détecter ce type <strong>de</strong> structure hiérarchique au sein <strong>de</strong>s populations est<br />
l’autocorrélation spatiale. Toutefois cette métho<strong>de</strong> ne permet <strong>de</strong> mettre en évi<strong>de</strong>nce<br />
l’existence <strong>de</strong> sous structure que si la distance génétique (ou au contraire le<br />
coefficient <strong>de</strong> parenté) est corrélée (ou inversement corrélée) à la distance<br />
géographique entre individus. Enfin l’analyse <strong>de</strong> la distribution <strong>de</strong>s distances entre<br />
nœuds a permis d’i<strong>de</strong>ntifier <strong>de</strong>s individus ‘outsi<strong>de</strong>rs’, beaucoup plus divergent <strong>de</strong>s<br />
autres qui pourraient être issus d’un évènement <strong>de</strong> migration récent.<br />
108
J. R. Soc. Interface (2007) 4, 1093–1102<br />
doi:10.1098/rsif.2007.0230<br />
Published online 1 May 2007<br />
Spectrum of genetic diversity and networks<br />
of clonal organisms<br />
Alejandro F. Rozenfeld 1, *, Sophie Arnaud-Haond 2 ,<br />
Emilio Hernán<strong>de</strong>z-García 1 ,Víctor M. Eguíluz 1 , Manuel A. Matías 1 ,<br />
Ester Serrão 2 and Carlos M. Duarte 3<br />
1 Cross-Disciplinary Physics Department, IMEDEA (CSIC-UIB),<br />
Instituto Mediterráneo <strong>de</strong> Estudios Avanzados, Campus Universitat <strong>de</strong> les Illes Balears,<br />
07122 Palma <strong>de</strong> Mallorca, Spain<br />
2 CCMAR, CIMAR-Laboratório Associado, Universida<strong>de</strong> do Algarve,<br />
Gambelas, 8005-139 Faro, Portugal<br />
3 Natural Resources Department, IMEDEA (CSIC-UIB),<br />
Instituto Mediterráneo <strong>de</strong> Estudios Avanzados, C/Miquel Marques 21,<br />
07190 Esporles, Mallorca, Spain<br />
Clonal reproduction characterizes a wi<strong>de</strong> range of species including clonal plants in terrestrial<br />
and aquatic ecosystems, and clonal microbes such as bacteria and parasitic protozoa, with a<br />
key role in human health and ecosystem processes. Clonal organisms present a particular<br />
challenge in population genetics because, in addition to the possible existence of replicates of<br />
the same genotype in a given sample, some of the hypotheses and concepts un<strong>de</strong>rlying<br />
classical population genetics mo<strong>de</strong>ls are irreconcilable with clonality. The genetic structure<br />
and diversity of clonal populations were examined using a combination of new tools to<br />
analyse microsatellite data in the marine angiosperm Posidonia oceanica. These tools were<br />
based on examination of the frequency distribution of the genetic distance among ramets,<br />
termed the spectrum of genetic diversity (GDS), and of networks built on the basis of<br />
pairwise genetic distances among genets. Clonal growth and outcrossing are apparently<br />
dominant processes, whereas selfing and somatic mutations appear to be marginal, and the<br />
contribution of immigration seems to play a small role in adding genetic diversity to<br />
populations. The properties and topology of networks based on genetic distances showed a<br />
‘small-world’ topology, characterized by a high <strong>de</strong>gree of connectivity among no<strong>de</strong>s, and a<br />
substantial amount of substructure, revealing organization in subfamilies of closely related<br />
individuals. The combination of GDS and network tools proposed here helped in dissecting<br />
the influence of various evolutionary processes in shaping the intra-population genetic<br />
structure of the clonal organism investigated; these therefore represent promising analytical<br />
tools in population genetics.<br />
Keywords: genetic networks; small-world networks; genetic diversity; clonal organisms<br />
1. INTRODUCTION<br />
The consi<strong>de</strong>rable progress achieved during the last<br />
<strong>de</strong>ca<strong>de</strong>s in molecular biology and biotechnologies has<br />
greatly enhanced the potential of molecular markers for<br />
studying the process of evolution in natural populations<br />
in the framework of population genetics. As the empirical<br />
basis for population genetics is broa<strong>de</strong>ned, it is increasingly<br />
clear that the theoretical constructs un<strong>de</strong>r which<br />
population analyses are traditionally conducted involve<br />
assumptions that are often violated in natural scenarios,<br />
such as the random mating, equilibrium (Wright 1931),<br />
*Author for correspon<strong>de</strong>nce (alex@ime<strong>de</strong>a.uib.es).<br />
Electronic supplementary material is available at http://dx.doi.org/<br />
10.1098/rsif.2007.0230 or via http://www.journals.royalsoc.ac.uk.<br />
and non-overlapping generations commonly assumed for<br />
interpreting statistics on population genetic composition<br />
and structure (Hey & Machado 2003).<br />
The summary statistics used in population genetics<br />
to estimate relevant parameters such as <strong>de</strong>parture from<br />
panmixia or the population structure in<strong>de</strong>ed rely on<br />
theoretical and mathematical mo<strong>de</strong>ls that involve the<br />
adoption of a somewhat narrow range of un<strong>de</strong>rlying<br />
parameters and <strong>de</strong>mographic mo<strong>de</strong>ls; this greatly limits<br />
the scope of <strong>de</strong>mographic situations that can be<br />
accurately explored (Hey & Machado 2003). Among<br />
others, three examples in which the assumptions<br />
un<strong>de</strong>rlying the classical Wright–Fisher mo<strong>de</strong>l (Wright<br />
1931) of population genetics are violated are the cases<br />
of endangered and of invasive species, as well as<br />
pathogenic species exhibiting recurrent fluctuations<br />
in population size linked to epi<strong>de</strong>miologic events.<br />
Received 8 January 2007<br />
109<br />
Accepted 8 March 2007 1093 This journal is q 2007 The Royal Society
1094 Genetic diversity of clonal organisms A. F. Rozenfeld et al.<br />
These are among the type of species most studied in<br />
evolutionary ecology or molecular epi<strong>de</strong>miology, precisely<br />
because they exhibit population dynamics that<br />
strongly <strong>de</strong>part from equilibrium, which very much<br />
limits the interpretation of classical population genetics<br />
statistics. These constraints on the application of<br />
conventional metrics of population genetic structure<br />
are even more evi<strong>de</strong>nt for clonal organisms, the<br />
characteristics of which challenge the notions of<br />
effective population size and generation time (Orive<br />
1993; Yonezawa et al. 2004). Moreover, a clear concept<br />
of the unit (genetic individual) on which evolutionary<br />
forces are acting is lacking (Orive 1995; Fischer & Van<br />
Kleunen 2002) for clonal species.<br />
Examination of the genetic structure of populations<br />
is rooted in a comparison of the extent of genetic<br />
variability among individuals within populations, as<br />
well as differences among the populations, typically<br />
assessed using appropriate molecular markers applied<br />
to statistically representative samples of individuals.<br />
Hypervariable markers such as microsatellites are<br />
commonly consi<strong>de</strong>red to be the markers of choice in<br />
assessing the genetic variability and structure of<br />
populations. This is particularly true in the case of<br />
clonal organisms, for which they allow, in a given<br />
sample, proper assessment of the individual level<br />
through the isolation of distinct multi-locus genotypes<br />
or lineages, which is a prerequisite for estimating<br />
variability and structure in clonal populations.<br />
Furthermore, most evaluations of genetic composition<br />
of clonal (and non-clonal) populations are based on<br />
summary statistics, such as heterozygosity or fixation<br />
indices, that do not consi<strong>de</strong>r the distribution of genetic<br />
distances among the sampled individuals. In fact,<br />
except in the case of co-ancestry coefficients mostly<br />
used to assess spatial autocorrelation, inter-individual<br />
distances are not commonly used in the literature<br />
(Douhovnikoff & Dodd 2003; Meirmans & Van<br />
Tien<strong>de</strong>ren 2004).<br />
The <strong>de</strong>piction of a population structure as a<br />
concerted representation of the genetic distances<br />
between agents indicates that a network approach is<br />
suitable for examination of the genetic structure of<br />
populations in which the links between agents <strong>de</strong>pend<br />
on the genetic difference between them. The use of<br />
networks to graphically represent genetic relationships<br />
has emerged as a useful tool in cases in which the no<strong>de</strong>s<br />
are haplotypes (Templeton et al. 1992; Excoffier &<br />
Smouse 1994; Posada & Crandall 2001; Cassens et al.<br />
2003; Rueness et al. 2003; Morrison 2005) or populations<br />
(Dyer & Nason 2004). Here, we propose a<br />
network representation of the genetic structure of<br />
populations of a clonal organism, focused on the genetic<br />
individuals (in clonal plants <strong>de</strong>signed as ‘genets’,<br />
extending clonally by growing new shoots also called<br />
‘ramets’) as the interacting agents. We represent the<br />
intra-population genetic similarities among the genetic<br />
individuals as networks. In addition, we go one step<br />
further from the simple graphical representation of<br />
genetic relationships, and quantitatively analyse the<br />
properties of the resulting networks using tools (see §5)<br />
successfully applied to other problems (Proulx et al.<br />
2005) such as the characterization of food webs (Dunne<br />
et al. 2002a,b) and the analysis of protein (Jeong et al.<br />
2001) or gene (Davidson et al. 2002) interactions.<br />
We <strong>de</strong>monstrate this approach using a clonal<br />
seagrass species (Posidonia oceanica) for which a<br />
large dataset, including microsatellite data for approximately<br />
1500 shoots sampled from 37 populations across<br />
the Mediterranean, is available. We first propose a<br />
metric for genetic distances among individuals based on<br />
their observed multi-locus microsatellite genotypes,<br />
which allows us to <strong>de</strong>scribe the spectrum of genetic<br />
diversity within populations. We then explore the<br />
biological processes that yield the observed spectra, and<br />
use this knowledge to topologically represent the<br />
population as a network, from which structural<br />
diagnostics are then <strong>de</strong>rived.<br />
2. AVAILABLE DATA<br />
2.1. Mo<strong>de</strong>l species<br />
Posidonia oceanica is a clonal marine angiosperm<br />
restricted to the Mediterranean Sea, where it <strong>de</strong>velops<br />
extensive meadows ranging from 0 to 40 m in <strong>de</strong>pth<br />
(Hemminga & Duarte 2000). It is a very slow-growing<br />
organism, with the clones extending horizontally through<br />
the growth of rhizomes at approximately 2 cm yr K1 ,<br />
<strong>de</strong>veloping shoots (ramets, the individual module<br />
repeated to <strong>de</strong>velop clones) at intervals of approximately<br />
5–10 cm. This monecious species (i.e. both male and<br />
female flowers on the same shoot; Hemminga & Duarte<br />
2000) is characterized by sparse episo<strong>de</strong>s of sexual<br />
reproduction. Individual P. oceanica shoots (ramets)<br />
live for up to 50 years, and the clones have been aged to<br />
over 1000 years (Hemminga & Duarte 2000). The plants<br />
are experiencing basin-wi<strong>de</strong> <strong>de</strong>cline and are subject to<br />
specific protection and conservation measures (Marbà<br />
et al. 1996; Moreno et al. 2001; Marba et al. 2005).<br />
2.2. Multi-locus microsatellite genotypes<br />
Approximately 40 P. oceanica shoots were sampled in<br />
each of 37 localities ranging, from west to east, from the<br />
Spanish Mediterranean coast to Cyprus (table 2 in the<br />
electronic supplementary material), encompassing a<br />
distance range of approximately 3500 km. In all the<br />
meadows, shoots were collected at randomly drawn<br />
coordinates across an area of 20 m!80 m. Then a<br />
meristem portion of each shoot was removed, <strong>de</strong>siccated<br />
and preserved in silica crystals.<br />
Genomic DNA was isolated following a standard<br />
CTAB extraction procedure (Doyle & Doyle 1987).<br />
The 37 meadows were analysed with the most efficient<br />
combination (Alberto et al. 2003; Arnaud-Haond et al.<br />
2005) of seven nuclear markers, using the conditions<br />
<strong>de</strong>scribed by Arnaud-Haond et al. (Alberto et al. 2003;<br />
Arnaud-Haond et al. 2005). This set of microsatellite<br />
markers allows the unambiguous i<strong>de</strong>ntification of clonal<br />
membership (Arnaud-Haond et al. 2005).<br />
To avoid scoring errors, which would typically<br />
generate very small apparent genetic dissimilarities<br />
among individuals actually sharing the same multilocus<br />
microsatellite genotype and would thus affect our<br />
estimates of genetic distance, all ramets with a distinct<br />
J. R. Soc. Interface (2007)<br />
110
Genetic diversity of clonal organisms A. F. Rozenfeld et al. 1095<br />
genotype for only two or one alleles were re-genotyped<br />
for those loci to ascertain their dissimilarity or to<br />
correct for genotyping errors. The clonal or genotype<br />
diversity of a meadow was estimated as<br />
R Z GK1<br />
N K1 ;<br />
where G is the number of multi-locus genotypes<br />
discriminated (consi<strong>de</strong>red as many distinct genets)<br />
and N is the number of samples (i.e. ramets) analysed<br />
for the meadow.<br />
The spatial autocorrelation in those meadows was<br />
tested for using the kinship coefficient proposed by<br />
Ritland (1996, 2000) and the Sp statistics proposed by<br />
Vekemans & Hardy (2004). Using the slope of the<br />
autocorrelogram (^b f ) and the average kinship in the<br />
smallest distance class ( ^F 1 ), the Sp statistics is<br />
<strong>de</strong>scribed as follows:<br />
Sp Z K^b f<br />
:<br />
1K ^F 1<br />
The significance of Sp values is tested for using a 1000<br />
permutation test, assigning randomly one of the<br />
existing coordinates to each genet at each step<br />
(Arnaud-Haond & Belkhir 2007).<br />
3. SIMILARITY METRICS<br />
In or<strong>de</strong>r to characterize the genetic structure of the<br />
different populations, some measure of genetic similarity<br />
among ramets is nee<strong>de</strong>d yielding a distance of<br />
zero between i<strong>de</strong>ntical genotypes. In our particular<br />
case, where the un<strong>de</strong>rlying data are based on multilocus<br />
microsatellite genotypes, one ramet is characterized<br />
by a series of pairs of microsatellite repetitions<br />
at k loci with kZ7 in our case.<br />
More specifically, the genotype of a particular ramet,<br />
called A, is represented as<br />
A Z ða 1 ; A 1 Þða 2 ; A 2 Þ/ða k ; A k Þ;<br />
where a i and A i are the allele length (in number of<br />
nucleoti<strong>de</strong>s) in both chromosomes at locus i.<br />
Given a second ramet, B, with genotype<br />
B Z ðb 1 ; B 1 Þðb 2 ; B 2 Þ/ðb k ; B k Þ;<br />
we <strong>de</strong>fine a dissimilarity <strong>de</strong>gree between A and B at<br />
locus i as<br />
d i ðA;BÞ ZminðjA i KB i jCja i Kb i j;jA i Kb i jCja i KB i jÞ;<br />
which provi<strong>de</strong>s a parsimonious (i.e. minimal) representation<br />
of the genetic distance, un<strong>de</strong>rstood as the<br />
difference in allele length, between samples A and B.<br />
This distance is somehow similar to the Manhattan<br />
distance, <strong>de</strong>fined in geometry as the distance between two<br />
points measured along axes at right angles, as if we or<strong>de</strong>r<br />
the alleles at each locus in such a way that a i !A i and<br />
b i !B i , then the minimal (min) function always selects its<br />
first argument. We <strong>de</strong>fine genetic distance among ramets<br />
by averaging the contributions from all loci<br />
DðA;BÞ Z 1 k<br />
X k<br />
iZ1<br />
d i ;<br />
which provi<strong>de</strong>s the <strong>de</strong>gree of global dissimilarity between<br />
A and B. Since we have D(A, A)Z0, genetically i<strong>de</strong>ntical<br />
individuals (clones or genets) are at zero distance<br />
according to this <strong>de</strong>finition.<br />
To the best of our knowledge, the genetic distance<br />
metric D proposed here to characterize dissimilarities<br />
among diploid organisms has not been formally <strong>de</strong>scribed<br />
as yet in the literature. It is, however (P. Meirmans 2006,<br />
personal communication), the distance <strong>de</strong>finition<br />
implemented for calculating distances among diploid<br />
organisms in the wi<strong>de</strong>ly used genetic software GENOTYPE<br />
(Meirmans & Van Tien<strong>de</strong>ren 2004).<br />
4. SIMULATIONS<br />
In this work, we focused on the ranges of inter-individual<br />
genetic distances generated within the population to<br />
un<strong>de</strong>rline the intra-population factors (clonality,<br />
mutation and mating system) that can account for<br />
such distances.<br />
In or<strong>de</strong>r to estimate the impact of the mating system in<br />
particular, we performed computer simulations to<br />
explore the genetic distance between parents and offspring.<br />
For each meadow, we started the simulation with<br />
the ramets sampled and generated new sets of virtual<br />
ramets by implementing separately two classes of<br />
reproductive events: sexual reproduction within<br />
clones (i.e. selfing) or among genetically different parents<br />
(i.e. outcrossing).<br />
In the simulations mo<strong>de</strong>lling outcrossing, we randomly<br />
picked pairs of parents from the consi<strong>de</strong>red<br />
meadow and generated by sexual reproduction 100 new<br />
individuals, constituting the first generation. Sexual<br />
reproduction consisted in the construction of a new<br />
multi-locus genotype (offspring) by randomly selecting,<br />
for each locus, one of the two microsatellite repeats<br />
present in each of two distinct parental genets at that<br />
locus. This procedure was repeated by selecting parents<br />
from the first generation to produce a second generation,<br />
then we picked parents from the second one to<br />
produce a third generation and so on up to 12<br />
generations. Once a new generation has been produced,<br />
we computed the distribution of genetic distances<br />
between its individuals and their corresponding ancestors<br />
placed at the original population (generation 0).<br />
The resulting distributions were characterized by their<br />
mean and s.d., and the process repeated 100 times, to<br />
improve by averaging the <strong>de</strong>termination of the mean<br />
intergeneration distances for each meadow.<br />
The simulations mo<strong>de</strong>lling selfing were similar,<br />
except that a single parental genet was selected from<br />
the meadow to produce each offspring by random<br />
recombination of its two microsatellite repeats present<br />
at each locus. In this case, only one generation of 100<br />
offspring was produced and the whole process was<br />
repeated 100 times to better estimate the mean selfing<br />
distance between parent and offspring.<br />
5. NETWORK ANALYSIS<br />
In mathematical terms, a network is represented by a<br />
graph. A graph is a pair of sets GZ{P, E}, where P is a<br />
set of N no<strong>de</strong>s and E is a set of edges connecting the no<strong>de</strong>s.<br />
J. R. Soc. Interface (2007)<br />
111
1096 Genetic diversity of clonal organisms A. F. Rozenfeld et al.<br />
As explained below, we will analyse networks, associated<br />
to each population, in which the no<strong>de</strong>s are the genets, i.e.<br />
the different multi-locus genotypes found at the meadow,<br />
and the links are established among genets at a genetic<br />
distance smaller than a threshold D th .Eachedgeconnects<br />
only two no<strong>de</strong>s (P i and P j ), and therefore can be assigned<br />
a weight or length equal to the distance or <strong>de</strong>gree of<br />
dissimilarity between them D(P i , P j ). Depending on the<br />
maximum value of the distance (D th ) allowed between<br />
two no<strong>de</strong>s for them to be connected, the range of possible<br />
networks is between a fully connected network (when all<br />
distances are accepted, and therefore all individuals are<br />
connected), or a network in which only i<strong>de</strong>ntical no<strong>de</strong>s are<br />
connected (D th Z0). Here, we chose to study for each<br />
population the network built by using as a threshold the<br />
average distance, d oc , found between parents and offspring<br />
in the simulations performed in that meadow to<br />
illustrate the pairwise genetic relationships within a ‘one<br />
generation’ path. It is worth noting here that the<br />
estimated percolation point of the networks in most<br />
populations (33 upon 37) is interestingly close to the<br />
d oc but slightly lower in general (regression equation is<br />
yZK0.36C1.03x, r 2 Z0.78 data not shown). The percolation<br />
point in a network is <strong>de</strong>fined as the point (in our<br />
case, the value of the genetic distance) at which the<br />
largest connected part of the network becomes fragmented,<br />
in a well-<strong>de</strong>fined mathematical sense (Havlin &<br />
Bun<strong>de</strong> 1996), i.e. most pairs of no<strong>de</strong>s are not connected by<br />
anypossiblelinkorpath,andthenetworkistherefore<br />
broken in several pieces ma<strong>de</strong> of small clusters or isolated<br />
no<strong>de</strong>s. This relationship between the percolation point<br />
and the estimated outcrossing distance suggests that<br />
precluding mechanisms generating distances slightly<br />
below the mean d oc wouldleadtothefragmentationof<br />
the entire system. In fact, the cases where the percolation<br />
point coinci<strong>de</strong>s with or is superior to the d oc estimated<br />
un<strong>de</strong>r the hypothesis of random rearrangement of<br />
gametes suggest the existence of <strong>de</strong>parture from<br />
panmixia in the studied population. In some populations,<br />
the networks in<strong>de</strong>ed appear to be fragmented or partially<br />
fragmented into clusters (connected components),<br />
possibly illustrating the occurrence of substructure in<br />
the meadows analysed. Insi<strong>de</strong> a cluster, there is a path<br />
connecting any two no<strong>de</strong>s. On the contrary, there is no<br />
path connecting no<strong>de</strong>s belonging to different clusters. We<br />
<strong>de</strong>fine the quantity S as the size (number of no<strong>de</strong>s) of the<br />
biggest cluster in the network. We have S%N.<br />
5.1. Local properties<br />
The <strong>de</strong>gree of connectivity k i of no<strong>de</strong> P i is <strong>de</strong>fined as the<br />
number of no<strong>de</strong>s linked to it (i.e. the number of neighbour<br />
no<strong>de</strong>s). If each of these neighbours were connected with<br />
all the others, there would be E ðmaxÞ<br />
i Zk i ðk i K1Þ=2 edges<br />
between them. The clustering coefficient C i of no<strong>de</strong> P i is<br />
<strong>de</strong>fined as<br />
C i Z<br />
2E i<br />
k i ðk i K1Þ ;<br />
where E i is the number of edges that actually exist<br />
between these k i neighbours of no<strong>de</strong> P i .<br />
5.2. Global properties<br />
The clustering coefficient of the whole network is the<br />
average of all individual clustering coefficients. Another<br />
important <strong>de</strong>scriptor of the network as a whole is the<br />
<strong>de</strong>gree distribution P(k), <strong>de</strong>fined as the proportion of<br />
no<strong>de</strong>s having <strong>de</strong>gree k. The average <strong>de</strong>gree hki may be<br />
<strong>de</strong>rived from it.<br />
The path length between any two no<strong>de</strong>s is <strong>de</strong>fined as<br />
the minimal number of hops separating them. The<br />
diameter L of the network is the maximal path length<br />
present in the network. Finally, the <strong>de</strong>nsity of links r is<br />
the ratio between the actual number of links present in<br />
the network and the number of links in a fully<br />
connected network (i.e. N(NK1)/2).<br />
5.3. Random networks<br />
In this work, we need to compare the networks observed<br />
with random networks having the same number of<br />
no<strong>de</strong>s and links. There are several ways to obtain a<br />
random network with a specific number of no<strong>de</strong>s and<br />
links. The standard random networks introduced by<br />
Erdös &Rényi (1959) simply distribute randomly the<br />
links between the no<strong>de</strong>s, keeping the number of no<strong>de</strong>s<br />
and links present in the original network for which<br />
significance is to be tested. However, this algorithm<br />
produces its own <strong>de</strong>gree distribution, introducing a bias<br />
in the numerous cases where the <strong>de</strong>gree distribution is<br />
not normal. To avoid this effect, the networks are<br />
usually randomized while keeping the <strong>de</strong>gree distribution<br />
observed in the original network. In particular,<br />
starting from the original network, we picked two links<br />
and permuted the end no<strong>de</strong>s as <strong>de</strong>scribed in Maslov &<br />
Sneppen (2002). By repeating this procedure, we<br />
obtained uncorrelated random networks with the<br />
original <strong>de</strong>gree distribution that allow testing for the<br />
significance of the original parameters.<br />
6. RESULTS AND DISCUSSION<br />
6.1. Genetic diversity spectrum<br />
The meadows sampled differed greatly in clonal diversity,<br />
ranging from high monoclonal dominance (e.g. Es Castell,<br />
Spain, RZ0.10) to highly diverse (e.g. Calabardina,<br />
Spain, RZ0.88; table 2 in the electronic supplementary<br />
material). The genetic distance between pairs of individuals<br />
within any population ranged from DZ0 for clonal<br />
mates to DZ30 for the most genetically divergent<br />
individuals present in any population. The distribution<br />
of D within any population is represented as a frequency<br />
distribution of all pairwise values, which we refer to as the<br />
genetic diversity spectrum (GDS) of each population. The<br />
GDS is analogous to the frequency distribution of<br />
pairwise differences used on some clonal organism to<br />
<strong>de</strong>tail the influence of clonality, as well as possible somatic<br />
mutations or scoring errors (Douhovnikoff & Dodd 2003;<br />
Van <strong>de</strong>r Hulst et al. 2003; Meirmans & Van Tien<strong>de</strong>ren<br />
2004). Nevertheless, we propose here to extend its<br />
interpretation beyond that particular application, using<br />
simulations to screen for the influence of some of the<br />
evolutionary forces that can contribute to shape the<br />
pattern of genetic diversity at the intra-population scale.<br />
J. R. Soc. Interface (2007)<br />
112
Genetic diversity of clonal organisms A. F. Rozenfeld et al. 1097<br />
(a)<br />
frequency<br />
0.6<br />
0.5<br />
0.4<br />
0.3<br />
0.2<br />
0.1<br />
0<br />
(b)<br />
0.08<br />
0.06<br />
0.04<br />
0.02<br />
2 4 6 8 0 5 10 15 20<br />
genetic distance<br />
Figure 1. The genetic diversity spectrum (GDS) for two<br />
representative populations (a) Es Castell which is a strictly<br />
clonal population (RZ0.1) and (b) Aqua Azzura 5 which has<br />
high clonal diversity (RZ0.72).<br />
In particular, we examine the importance of the mating<br />
system (outcrossing, selfing), which influences the way<br />
alleles are transmitted from one generation to the next,<br />
thereby playing a central role in the changing of allele<br />
frequencies across generations.<br />
The GDS of the populations studied showed a range<br />
of shapes across populations (figure 1 and electronic<br />
supplementary material, figure 5). Three of the<br />
populations sampled (namely Es Castell, Cala Fornells<br />
and Es Port) showed spectra indicative of a strongly<br />
clonal composition, characterized by a large spike at<br />
zero distance corresponding to the null distance<br />
between ramets pertaining to the same genetic individual,<br />
and discrete peaks located at characteristic genetic<br />
distances between the few distinct clones present in the<br />
population (figure 1a). Most of the populations<br />
sampled, however, are characterized by a broad,<br />
bimodal GDS (e.g. figure 1b), with a smaller (and<br />
broa<strong>de</strong>r) mo<strong>de</strong> at zero distance, indicating the existence<br />
of nearly i<strong>de</strong>ntical individuals forming clones, and a<br />
mo<strong>de</strong> at higher distances within a broad, skewed, bellshaped<br />
distribution.<br />
The common characteristic features of the GDS from<br />
the different P. oceanica populations were highlighted<br />
by producing a mean GDS, obtained by averaging the<br />
GDS across all sampled populations. The resulting<br />
normalized histogram, which we call hGDSi and show<br />
in figure 2, is strongly bimodal, showing a large peak at<br />
zero distance (a peak), suggesting that clonal reproduction<br />
constitutes one of the main factors influencing the<br />
intra-population genetic structure. The a peak is<br />
followed, at small genetic distances, by a <strong>de</strong>pression,<br />
indicating that low genetic distances between 0.57 and<br />
1.71 (corresponding to 4–12 nucleoti<strong>de</strong>s (nt) in case of<br />
genotypes composed of seven loci) are uncommon.<br />
A broad peak (b peak) at a modal pairwise genetic<br />
distance of 4.3 (approx. 30 nt) represents the most<br />
commonly observed genetic distance between genetically<br />
dissimilar (i.e. non-clonal) units sampled within<br />
populations. Above the b peak distance, the frequency<br />
of distances between individuals <strong>de</strong>clines exponentially<br />
(figure 2). Provi<strong>de</strong>d that enough polymorphic loci are<br />
used, which is assumed to be the case in our study where<br />
markers have been previously selected to that aim in a<br />
pilot work (Arnaud-Haond et al. 2005), the process<br />
responsible for generating genetic distances of zero<br />
frequency<br />
0.12<br />
0.10<br />
0.04<br />
0.02<br />
0<br />
a<br />
(1)<br />
d oc<br />
(2)<br />
d oc 10 –2<br />
(4)<br />
d d oc 10 –3<br />
c d m d s<br />
(8)<br />
d oc<br />
10 –4<br />
b<br />
10 –1 1<br />
(12)<br />
d oc<br />
0 5 10 15 20<br />
0 5 10 15<br />
genetic distance<br />
Figure 2. The GDS averaged across sampled populations<br />
(hGDSi). The error bars indicate the SE for each bin. The<br />
square points (and corresponding error bars) were obtained<br />
from numerical simulations aimed at i<strong>de</strong>ntifying mean (G<br />
s.e.) genetic distances generated by different biological<br />
processes: d c h0 (clonal reproduction), d m Z0.86 (somatic<br />
mutations), d s Z1.89G0.11 (selfing, sexual reproduction<br />
between genetically i<strong>de</strong>ntical individuals), d oc (outcrossing,<br />
sexual reproduction between genetically different individuals):<br />
d ð1Þ<br />
oc Z3:39G0:17, d ð2Þ<br />
oc Z4:24G0:23, d ð4Þ<br />
oc Z4:86G0:28,<br />
d ð8Þ<br />
oc Z5:05G0:29 and d ð12Þ<br />
oc Z5:1G0:29. The upper in<strong>de</strong>x<br />
indicates the number of generations apart for which the<br />
distance has been measured (1, 4, 8 and 12 generations). In the<br />
inset, we show the same distribution on a log–linear scale.<br />
The straight line is a gui<strong>de</strong> for the eye to highlight the<br />
exponential <strong>de</strong>cay of the tail.<br />
among individuals can be mostly assigned to clonal<br />
reproduction. In contrast, the processes generating<br />
specific classes of greater genetic distances are less<br />
apparent. However, this knowledge is essential for<br />
un<strong>de</strong>rstanding, from a biological and mechanistic point<br />
of view, the implications of the observed hGDSi on the<br />
prevalence of various mechanisms that generate genetic<br />
diversity and structure within the population. The<br />
simulations performed allowed us to explore the range<br />
of genetic distances between parents and offspring,<br />
<strong>de</strong>pending on the reproductive mo<strong>de</strong>. The mean, across<br />
the populations examined, simulated genetic distance<br />
(Gs.e.) generated by selfing and outcrossing was<br />
1.97G0.16 and 3.43G0.17, respectively (figure 2).<br />
The characteristic genetic distance generated by<br />
simulated outcrossing (d oc Zdoc ð1Þ ) is close to the modal<br />
b peak of the hGDSi (figure 2), suggesting that<br />
outcrossing is the main mechanism generating genetic<br />
diversity within the populations of this species. In<br />
contrast, the characteristic genetic distance generated<br />
by selfing (d s ) is located at the edge of the <strong>de</strong>pression<br />
between the a and b peaks in the hGDSi, implying a low<br />
contribution of selfing in generating genetic distances in<br />
the meadows, and therefore a limited rate of selfing<br />
when compared with outcrossing and clonality.<br />
Observation of the hGDSi also suggests that caution<br />
should be exercised when interpreting the valley<br />
between the a and b peaks in the spectrum of genetic<br />
J. R. Soc. Interface (2007)<br />
113
1098 Genetic diversity of clonal organisms A. F. Rozenfeld et al.<br />
distances in terms of somatic mutations or scoring<br />
errors, as proposed for obligatory outcrossing species<br />
(Douhovnikoff & Dodd 2003; Van <strong>de</strong>r Hulst et al. 2003),<br />
when <strong>de</strong>aling with possibly self-fertilizing species. A<br />
small genetic distance can also be generated by selfing,<br />
a possibility that should be consi<strong>de</strong>red along with the<br />
more probable explanation that these distances arise<br />
from somatic mutations or scoring errors. In the case of<br />
possible self-fertilizers, simulations may be useful in<br />
<strong>de</strong>fining the range of distances that can be generated<br />
sexually and the threshold below which clonality<br />
may be assumed. After such simulations in the case of<br />
P. oceanica, the uncommon distances between 0.29 and<br />
0.86 (corresponding to 2–6 nt for the case of seven loci<br />
genotypes) are still unlikely (data not shown) un<strong>de</strong>r a<br />
mixed mating system, with the selfing rate not<br />
exceeding the proportion expected on the basis of<br />
clone size (in terms of the number of shoots). Since we<br />
are confi<strong>de</strong>nt that the double-checking procedure<br />
applied to the first dataset allowed the correction of<br />
most scoring errors, these small distances must be<br />
mostly generated by somatic mutations accumulated in<br />
the process of multiple clonal reproductive events.<br />
In<strong>de</strong>ed, P. oceanica clones are extremely long-lived,<br />
with clones dated to millennia (Hemminga & Duarte<br />
2000), over which clones would have divi<strong>de</strong>d multiple<br />
times, hence providing opportunities for somatic<br />
mutations. In<strong>de</strong>ed, the frequency of individuals at<br />
distances between strictly clonal (DZ0) and the<br />
minimum observed in between the a and b peaks<br />
(DZ1.43) also <strong>de</strong>clines sharply, as expected from the<br />
low probability of accumulated mutations.<br />
Finally, the mean genetic distances from ancestors to<br />
offspring located n generations apart, obtained from<br />
simulations, increase very slowly with n, reaching an<br />
asymptote after approximately eight generations<br />
(figure 3). Comparison between the largest distances<br />
obtained by simulations and those observed on the<br />
hGDSi shows that the end of the distribution tail is not<br />
likely to be accounted for by sexual reproduction within<br />
the population. These distances are not likely to be<br />
generated by the random rearrangement of alleles<br />
during outcrossing or selfing over generations, but<br />
rather by external factors that generate diversity. The<br />
most probable process is a very low rate of immigration<br />
from other populations, which can sud<strong>de</strong>nly introduce<br />
individuals genetically very distinct from those present<br />
in the population. However, examination of the<br />
contribution of immigration requires GDS evaluation<br />
across the entire distribution range of the species,<br />
rather than population-specific analyses such as that<br />
presented here.<br />
6.2. Network representation of the GDS<br />
The discussion above indicates that the GDS is best<br />
conceptualized as the result of genetic exchanges<br />
among a network of individual genets. Network<br />
analysis may, thus, provi<strong>de</strong> a step forward in topologically<br />
characterizing the genetic relationships<br />
between population constituents <strong>de</strong>picted in the GDS.<br />
A first step to construct such network is to <strong>de</strong>fine the<br />
threshold genetic distance (D th ) representing closely<br />
percentage of sample unit pairs<br />
100<br />
80<br />
60<br />
40<br />
20<br />
mutations<br />
19%<br />
selfing<br />
28%<br />
generations<br />
1 2 4 8 .. 12<br />
42%<br />
60%<br />
53%<br />
63 .. 63.5%<br />
100<br />
80<br />
60<br />
40<br />
20<br />
0 5 10 15 20<br />
0 2 4 6 8 10<br />
genetic distance<br />
Figure 3. The cumulative distribution of genetic distances,<br />
obtained as the integral of the distribution shown in figure 2.<br />
We indicate the fraction of between-individual distances up to<br />
the values associated with different biological processes:<br />
mutation, selfing and outcrossing of 1, 2, 4 and 8–12<br />
generations. Inset: the whole range of genetic distances.<br />
genetically connected individuals, characterized by<br />
between-individual distances less than or equal to D th .<br />
Based on analysis of the GDS, we choose to represent<br />
D th by the one-generation outcrossing distance (i.e.<br />
D th Zd oc ), which approximately corresponds to the b<br />
peak in the GDS of each population and is also very<br />
closely related to the percolation point. The network<br />
resulting from the connection of individuals at distances<br />
less than or equal to D th represents the links<br />
among individuals that are approximately up to a<br />
generation apart, on the un<strong>de</strong>rstanding that the genetic<br />
distance is only an operational proxy for the kinship<br />
among the individuals. In this work, the no<strong>de</strong>s in our<br />
networks are different genetic individuals, or genets,<br />
but we comment that networks of ramets can also be<br />
constructed, with a topology straightforwardly related<br />
to the one consi<strong>de</strong>red here.<br />
The networks (examples in figure 4) for the<br />
P. oceanica populations differ greatly in shape and in<br />
properties (table 1) across the meadows analysed.<br />
As for the shape, the highly clonal population appears<br />
as a simple diagram of separate families with two or more<br />
clones each (figure 4a). In contrast, the network<br />
corresponding to the more diverse population is readily<br />
characterized by greater connectivity, showing a number<br />
of closely connected groups (subfamilies) linked together<br />
by connections to a small set of central individuals, which<br />
act as links connecting the different families<br />
(figure 4b,d,e). In addition, we can distinguish fragmented<br />
(figure 4c)fromconnected(figure 4f ) networks.<br />
Comparing the properties, the largest component, S,<br />
of each network contains most of the individuals of each<br />
meadow (table 1). The average <strong>de</strong>gree of network<br />
connectivity hki also differs greatly among populations<br />
(from 1.20 to 8.74, table 1), with an overall average<br />
connectivity <strong>de</strong>gree of 5.11, indicating that each<br />
individual is connected to, on average, five others. To<br />
indicate the significance of these numbers, we note that<br />
from the data in table 1, the quantity hki/(GK1) which<br />
is the average proportion of the genet population<br />
connected to a given individual, ranges between<br />
J. R. Soc. Interface (2007)<br />
114
Genetic diversity of clonal organisms A. F. Rozenfeld et al. 1099<br />
(a) (b) (c)<br />
(d) (e) (f )<br />
Figure 4. Network of genets for (a) Es Castell (Cabrera,<br />
Balearic Islands), (b) Cala Jonquet (Iberian Peninsula), (c)<br />
Rodalquilar (Iberian Peninsula), (d ) Aqua Azzura 5 (Sicily),<br />
(e) Roquetas (Iberian Peninsula) and ( f ) Playa Cavallets<br />
(Ibiza) after elimination of links representing genetic distances<br />
above the threshold D th Zd ð1Þ<br />
oc . The value of d ð1Þ<br />
oc was<br />
obtained by means of numerical simulations and corresponds<br />
to the distance generated, on average, by outcrossing across<br />
one generation in the population. The no<strong>de</strong> size is proportional<br />
to the number of i<strong>de</strong>ntical constituent ramets.<br />
0.13 and 0.55. This implies that each individual differs<br />
at most one average generation from about 13–55% of<br />
the individuals in the sample. Together with the<br />
average link <strong>de</strong>nsity, this shows that a large number<br />
of links are already present in the networks at the<br />
chosen threshold. In<strong>de</strong>ed, the <strong>de</strong>nsity of links in the<br />
network averages 27% (table 1), indicating that two<br />
randomly selected individuals in a given population<br />
have on average 27% probability of being less than one<br />
generation apart.<br />
The average genetic link <strong>de</strong>nsity of P. oceanica<br />
individuals (0.27; table 1) is much higher than observed<br />
in other complex networks analysed in the literature<br />
(Albert & Barabasi 2002). Similarly, the clustering<br />
coefficient C (0.73; table 1) is larger than observed in<br />
most reported networks, and generally larger than the<br />
clustering expected if the networks were random (i.e.<br />
COC r ; table 1). This <strong>de</strong>parture from a random network<br />
signals the abundance of highly clustered no<strong>de</strong>s at the<br />
level of closely related families. The average path length<br />
(L), representing the minimum number of steps (links<br />
representing reproductive events or somatic mutations)<br />
necessary to connect any two individual genets in the<br />
population, ranged from 1.00 to 3.44, averaging 1.88<br />
across populations (table 1). This average path length<br />
suggests that most genets have a high kinship, typically<br />
below that of cousins, and is comparable to that<br />
generated by a random network. Taken together, the<br />
presence of short path lengths not <strong>de</strong>parting from<br />
values expected in a random network (LzL r ) and of<br />
higher than expected clustering coefficient (COC r )<br />
indicate that the networks of genetic relationships in<br />
P. oceanica populations have the characteristics of a<br />
‘small world’ (Watts & Strogatz 1998). Small-world<br />
networks, as <strong>de</strong>scribed extensively in the social<br />
sciences, characterize complex systems in which every<br />
no<strong>de</strong> can be reached from every other using a small<br />
number of intermediate steps. This is indicative of a<br />
high <strong>de</strong>gree of genetic substructure within populations<br />
of P. oceanica.<br />
There is an interesting parallel between the substructure<br />
revealed by the networks shape and parameters,<br />
and the occurrence of spatial autocorrelation (Arnaud-<br />
Haond et al. in press) in some meadows (Cala Jonquet,<br />
Acqua Azzura 5; figure 4). In<strong>de</strong>ed, autocorrelation is<br />
used to <strong>de</strong>tect patterns of limited dispersion revealed by a<br />
significant relationship between genetic and geographical<br />
distance, but a significant pattern primarily implies a<br />
substructure of the population in clusters of closely<br />
related individuals. This is very clearly illustrated by the<br />
shape of the networks, particularly in meadows where a<br />
strong pattern was <strong>de</strong>tected such as Cala Jonquet<br />
(figure 4b), where two subfamilies of five and nine<br />
highly interconnected individuals are linked together<br />
by a tiny path of three links and two intermediate<br />
no<strong>de</strong>s/individuals. However, failure to <strong>de</strong>tect significant<br />
spatial autocorrelation does not imply the absence of<br />
subfamilies in the population, but only a lack of relationship<br />
between this genetic structure and geographical<br />
distance, or else low statistical power. Exploration of<br />
the network of individuals can therefore reveal the<br />
existence of a substructure of the meadows in various<br />
families, if it exists, even when no pattern of spatial<br />
autocorrelation can be <strong>de</strong>tected due to a lack of<br />
relationship between genetic and geographical<br />
distances. This is what is observed in most populations<br />
(table 1) where a small world topology was <strong>de</strong>tected,<br />
and the networks typically illustrate structures composed<br />
by highly connected subfamilies (or clusters)<br />
inter-connected by few central no<strong>de</strong>s.<br />
7. CONCLUSIONS<br />
The results presented here illustrate a novel approach,<br />
based on analysis of the spectrum of genetic diversity,<br />
to examine the population genetic structure of clonal<br />
organisms and for the <strong>de</strong>piction of inter-individual<br />
genetic distances by a network. As un<strong>de</strong>rlined by<br />
Dyer & Nason (2004), there are two fundamental<br />
distinctions between the classical genetic summary<br />
statistics, which involve <strong>de</strong>composing variance, and the<br />
use of graphs. In the latter case, we do not impose pre<strong>de</strong>fined<br />
hierarchical mo<strong>de</strong>ls that constrain the range of<br />
temporal scales and evolutionary processes that can be<br />
accurately screened, but rather take advantage of all<br />
the information contained in the dataset to let the data<br />
<strong>de</strong>fine their own topology and eventually offer a visual<br />
illustration. Here, we went one step further than<br />
graphical illustration by <strong>de</strong>tailing the network properties<br />
using statistical tools specific to network analyses<br />
to extract key information on the hierarchical genetic<br />
structure in the population studied. This approach can<br />
be exten<strong>de</strong>d to explore the genetic structure of virtually<br />
any populations beyond the specific case of a marine<br />
clonal plant examined here. In doing so, many new<br />
elements have been introduced, such as a parsimony<br />
metric of distance among individual diploid organisms,<br />
the basis for the construction of the spectrum of genetic<br />
diversity. We also used simple simulations to explore<br />
the partition of the contribution of different processes<br />
to the genetic diversity contained in the spectrum, and<br />
topological representations of networks of genetic<br />
relationships <strong>de</strong>rived from the spectrum of genetic<br />
J. R. Soc. Interface (2007)<br />
115
1100 Genetic diversity of clonal organisms A. F. Rozenfeld et al.<br />
Table 1. Summary of properties measured for population genetic networks of genets (non-similar ramets) at D th Zd oc .(G is the<br />
number of genets present in the meadow, S stands for the size of major connected components, C for the clustering, L for the<br />
diameter, C r , L r , 90% CI (C r ) and 90% CI (L r ) for the average clustering and diameter and their 90% confi<strong>de</strong>nce interval, after<br />
random rewiring, hki for the mean <strong>de</strong>gree of connectivity, r for the link <strong>de</strong>nsity and Sp for the spatial autocorrelation Sp statistics.<br />
For C, L and Sp, bold values indicate significance as <strong>de</strong>parture from the simulated random distributions ( p!0.05), and n.s.<br />
stands for non-significant. In the last four rows of the table, we statistically characterize each column: hxi stands for the mean and<br />
s for the s.d. In the last two rows, we show the minimum and maximum values.)<br />
G S C L C r 90% CI (C r ) L r 90% CI (L r ) hki r Sp<br />
Acqua Azzura 3 31 28 0.80 3.13 0.22 [0.15,0.29] 2.17 [2.12,2.22] 4.71 0.16 0.02<br />
Acqua Azzura 5 29 25 0.78 2.43 0.25 [0.19,0.31] 2.01 [1.95,2.06] 4.76 0.17 0.01<br />
Addaia 25 17 0.72 1.64 0.41 [0.34,0.48] 1.94 [1.87,2.01] 5.60 0.23 0.02<br />
Agios Nicolaos 28 18 0.81 2.41 0.32 [0.23,0.41] 1.87 [1.81,1.94] 5.50 0.20 0.06<br />
Amathous 3 18 11 0.77 1.45 0.27 [0.19,0.36] 2.17 [2.03,2.33] 4.67 0.27 0.01 n.s.<br />
Amathous 5 25 24 0.73 3.14 0.25 [0.19,0.32] 2.13 [2.07,2.19] 4.56 0.19 0.00 n.s.<br />
Calabardina 40 40 0.62 3.44 0.18 [0.13,0.24] 2.24 [2.17,2.31] 5.90 0.15 0.00 n.s.<br />
Cala Giverola 17 10 0.84 1.22 0.72 [0.67,0.77] 1.66 [1.55,1.77] 4.35 0.27 0.01 n.s.<br />
Cala Jonquet 20 18 0.79 2.95 0.36 [0.27,0.46] 1.90 [1.84,1.97] 4.60 0.24 0.07<br />
Campomanes 22 12 0.66 1.77 0.26 [0.14,0.40] 2.14 [2.01,2.28] 4.00 0.19 K0.01 n.s.<br />
Carboneras 16 16 0.78 1.75 0.73 [0.68,0.78] 1.51 [1.48,1.55] 8.50 0.57 0.03 n.s.<br />
El Arenal 32 27 0.76 2.74 0.28 [0.21,0.36] 2.12 [1.99,2.27] 5.25 0.17 0.02<br />
Es Castell 05 03 0.00 1.33 0.00 — 2.12 — 1.20 0.30 0.12<br />
Es Pujols 27 24 0.74 2.76 0.57 [0.50,0.64] 1.94 [1.84,2.04] 5.70 0.22 0.01 n.s.<br />
Es Calo <strong>de</strong> s’Oli 15 07 0.73 1.14 0.47 [0.36,0.60] 1.92 [1.74,2.11] 2.80 0.20 0.00 n.s.<br />
Ses Illetes 21 20 0.78 2.62 0.36 [0.28,0.46] 1.83 [1.78,1.88] 5.52 0.28 —<br />
Cala Fornells 05 03 1.00 1.00 1.00 — 1.00 — 1.20 0.30 K0.06 n.s.<br />
La Fossa Calpe 31 29 0.63 2.76 0.24 [0.19,0.29] 2.06 [1.96,2.16] 5.55 0.18 0.00 n.s.<br />
Las Rotes 34 21 0.75 1.98 0.20 [0.13,0.27] 2.26 [2.20,2.32] 4.65 0.14 0.04<br />
Los Genoveces 14 13 0.86 1.45 0.84 [0.82,0.87] 1.39 [1.34,1.43] 7.71 0.59 0.03 n.s.<br />
Magaluf 26 18 0.64 1.88 0.39 [0.29,0.50] 2.13 [2.03,2.24] 4.46 0.18 0.02 n.s.<br />
Malta 29 24 0.67 2.19 0.33 [0.26,0.40] 1.91 [1.85,1.97] 5.24 0.19 —<br />
Marzamemi 31 28 0.63 2.48 0.39 [0.31,0.48] 2.05 [1.95,2.15] 5.61 0.19 0.01<br />
Es Port 05 05 0.90 1.10 0.90 — 1.10 — 3.60 0.90 K0.01 n.s.<br />
Paphos 26 17 0.74 1.65 0.41 [0.34,0.49] 1.98 [1.91,2.04] 6.54 0.26 0.01 n.s.<br />
Playa Cavallets 28 24 0.63 2.45 0.32 [0.22,0.42] 1.96 [1.91,2.01] 4.86 0.18 0.00 n.s.<br />
Port Lligat 12 07 0.95 1.10 0.39 [0.27,0.52] 1.59 [1.55,1.64] 4.17 0.38 0.01 n.s.<br />
Porto Colom 21 16 0.83 1.42 0.72 [0.66,0.78] 1.51 [1.38,1.65] 7.62 0.38 0.06<br />
Punta Fanals 26 26 0.70 2.06 0.47 [0.41,0.53] 1.86 [1.80,1.93] 7.54 0.30 K0.01 n.s.<br />
Rodalquilar 27 14 0.84 1.32 0.37 [0.32,0.42] 1.77 [1.73,1.81] 8.22 0.32 0.00 n.s.<br />
Roquetas 35 34 0.79 2.47 0.33 [0.29,0.37] 1.82 [1.76,1.89] 8.74 0.26 0.01 n.s.<br />
C.Sta.Maria 13 20 19 0.73 2.37 0.42 [0.33,0.50] 1.79 [1.74,1.84] 5.50 0.29 0.01 n.s.<br />
C.Sta.Maria 7 22 16 0.66 1.74 0.57 [0.48,0.65] 1.91 [1.79,2.03] 4.91 0.23 0.01 n.s.<br />
Cala Torreta 21 10 0.75 1.84 0.13 [0.02,0.24] 2.44 [2.28,2.61] 3.33 0.17 0.06<br />
Torre <strong>de</strong> la Sal 15 13 0.71 1.64 0.58 [0.52,0.64] 1.50 [1.37,1.64] 4.93 0.35 0.03 n.s.<br />
Tunis 34 30 0.77 2.80 0.27 [0.20,0.34] 2.17 [2.10,2.24] 5.41 0.16 —<br />
Xilxes 12 05 0.47 1.80 0.29 [0.03,0.56] 1.98 [1.24,2.71] 1.50 0.14 —<br />
hxi 22.84 18.16 0.73 2.04 0.41 — 1.89 — 5.11 0.27 —<br />
s 8.54 8.82 0.16 0.65 0.22 — 0.31 — 1.77 0.15 —<br />
min(x) 5.00 3.00 0.00 1.00 1.00 — 2.44 — 1.20 0.14 —<br />
max(x) 40.00 40.00 1.00 3.44 0.00 — 1.00 — 8.74 0.90 —<br />
diversity to formally explore the properties of the<br />
resulting network. Each of these novel approaches is<br />
rooted in earlier <strong>de</strong>velopments in different fields such as<br />
computational population genetics (Meirmans & Van<br />
Tien<strong>de</strong>ren 2004), population genetics (Bowcock et al.<br />
1994; Dyer & Nason 2004), and network analysis<br />
<strong>de</strong>veloped in the realm of complex-systems theory<br />
(Watts & Strogatz 1998; Albert & Barabasi 2002;<br />
Maslov & Sneppen 2002), but are brought together here<br />
to provi<strong>de</strong> a synthetic parsimony analysis of population<br />
genetic structures.<br />
This interdisciplinary effort has allowed us to <strong>de</strong>rive<br />
key features of the population genetics of the clonal<br />
species studied, such as the low contribution of somatic<br />
mutations and selfing to genetic diversity, and the<br />
inference, <strong>de</strong>rived from examination of the spectrum of<br />
genetic diversity and subsequent network analysis, that<br />
P. oceanica populations show a rather high kinship level<br />
and low immigration of propagules produced in other<br />
populations. The network illustration allowed us to<br />
un<strong>de</strong>rline the high <strong>de</strong>gree of substructure in some<br />
meadows, clearly composed of several families. The<br />
analysis of network properties allowed us to <strong>de</strong>scribe<br />
P. oceanica populations as following a typical smallworld<br />
network shape, a feature already wi<strong>de</strong>ly <strong>de</strong>scribed<br />
in complex systems such as the world wi<strong>de</strong> web and social<br />
networks (26), characterized by small diameters. A closer<br />
inspection to networks topology reveals that most of the<br />
J. R. Soc. Interface (2007)<br />
116
Genetic diversity of clonal organisms A. F. Rozenfeld et al. 1101<br />
meadows are composed by separated subgroups<br />
(families) interconnected through few ‘central’ no<strong>de</strong>s.<br />
The analysis of multiple populations has allowed<br />
elucidation of the consi<strong>de</strong>rable variability in the spectra<br />
of genetic diversity among populations, while i<strong>de</strong>ntifying<br />
characteristic features in the spectrum. It would be<br />
very interesting to explore the methodology presented<br />
here by using alternative distances at the intrapopulation<br />
scale, <strong>de</strong>pending on the question to be<br />
addressed. The approach <strong>de</strong>monstrated here can be<br />
exten<strong>de</strong>d to a wi<strong>de</strong> range of organisms to explore<br />
genetic structure for a number of purposes. For<br />
instance, the topology of the genetic network for<br />
pathogens may help reveal important properties such<br />
as the clustering of strains, particularly when unusual<br />
transmission of genetic material such as lateral transfer<br />
are suspected to occur, and elucidate the evolutionary<br />
processes that shaped different lineages. The results<br />
presented here reveal the spectral and network analysis<br />
of genetic diversity as a promising tool to ascertain the<br />
genetic structure of populations and the role of different<br />
processes in shaping it.<br />
This research was fun<strong>de</strong>d by a project of the BBVA<br />
Foundation (Spain), by project NETWORK (POCI/MAR/<br />
57342/2004) of the Portuguese Science Foundation (FCT)<br />
and CONOCE2 (FIS2004-00953), and SICOFIP (FIS2006-<br />
09966) of the Spanish MEC. S.A.H. was supported by a<br />
postdoctoral fellowship from FCT and the European Social<br />
Fund and A.F.R. by a postdoctoral fellowship of the Spanish<br />
Ministry of Education and Science. We also thank MARBEF<br />
European network and CORONA for fruitful group discussions.<br />
REFERENCES<br />
Albert, R. & Barabasi, A. L. 2002 Statistical mechanics of<br />
complex networks. Rev. Mod. Phys. 74, 47–97. (doi:10.<br />
1103/RevModPhys.74.47)<br />
Alberto, F., Correia, L., Arnaud-Haond, S., Billot, C., Duarte,<br />
C. M. & Serrão, E. 2003 New microsatellites markers for<br />
the en<strong>de</strong>mic Mediterranean seagrass Posidonia oceanica.<br />
Mol. Ecol. Notes 3, 253–255. (doi:10.1046/j.1471-8286.<br />
2003.00415.x)<br />
Arnaud-Haond, S. & Belkhir, K. 2007 GENCLONE 1.0: a new<br />
program to analyse genetics data on clonal organisms. Mol.<br />
Ecol. Notes 7, 15–17. (doi:10.1111/j.1471-8286.2006.01522.x)<br />
Arnaud-Haond, S., Alberto, F., Teixeira, S., Procaccini, G.,<br />
Serrao, E. A. & Duarte, C. M. 2005 Assessing genetic<br />
diversity in clonal organisms: low diversity or low<br />
resolution? Combining power and cost-efficiency in selecting<br />
markers. J. Hered. 96, 434–440. (doi:10.1093/jhered/<br />
esi043)<br />
Arnaud-Haond, S., Diaz Almela, E., Teixeira, S., Alberto, F.,<br />
Duarte, C. M. & Serrao, E. A. In press. Vicariance patterns<br />
in the Mediterranean sea: east–west cleavage and low<br />
dispersal in the en<strong>de</strong>mic seagrass Posidonia oceanica.<br />
J. Biogeogr. (doi:10.1111/j.1365-2699.2006.01671.x)<br />
Bowcock, A. M., Ruizlinares, A., Tomfohr<strong>de</strong>, J., Minch, E.,<br />
Kidd, J. R. & Cavallisforza, L. L. 1994 High-resolution of<br />
human evolutionary trees with polymorphic microsatellites.<br />
Nature 368, 455–457. (doi:10.1038/368455a0)<br />
Cassens, I., Van Waerebeek, K., Best, P. B., Crespo, E. A.,<br />
Reyes, J. & Milinkovitch, M. C. 2003 The phylogeography<br />
of dusky dolphins (Lagenorhynchus obscurus): a critical<br />
examination of network methods and rooting procedures.<br />
Mol. Ecol. 12, 1781–1792. (doi:10.1046/j.1365-294X.2003.<br />
01876.x)<br />
Davidson, E. H. et al. 2002 A genomic regulatory network for<br />
<strong>de</strong>velopment. Science 295, 1669–1678. (doi:10.1126/<br />
science.1069883)<br />
Douhovnikoff, V. & Dodd, R. S. 2003 Intra-clonal variation<br />
and a similarity threshold for i<strong>de</strong>ntification of clones:<br />
application to Salix exigua using AFLP molecular markers.<br />
Theor. Appl. Genet. 106, 1307–1315.<br />
Doyle, J. J. & Doyle, J. L. I. 1987 A rapid DNA isolation<br />
procedure for small quantities of fresh leaf tissue.<br />
Phytochem. Bull. 11, 11–15.<br />
Dunne, J. A., Williams, R. J. & Martinez, N. D. 2002a Foodweb<br />
structure and network theory: the role of connectance<br />
and size. Proc. Natl Acad. Sci. USA 99, 12 917–12 922.<br />
(doi:10.1073/pnas.192407699)<br />
Dunne, J. A., Williams, R. J. & Martinez, N. D. 2002b<br />
Network structure and biodiversity loss in food webs:<br />
robustness increases with connectance. Ecol. Lett. 5,<br />
558–567. (doi:10.1046/j.1461-0248.2002.00354.x)<br />
Dyer, R. J. & Nason, J. D. 2004 Population graphs: the graph<br />
theoretic shape of genetic structure. Mol. Ecol. 13,<br />
1713–1727. (doi:10.1111/j.1365-294X.2004.02177.x)<br />
Erdös, P. & Rényi, A. 1959 On random graphs I. Publ. Math.<br />
6, 290.<br />
Excoffier, L. & Smouse, P. E. 1994 Using alleles frequencies<br />
and geographic subdivision to reconstruct gene trees<br />
within a species: molecular variance parsimony. Genetics<br />
136, 343–359.<br />
Fischer, M. & Van Kleunen, M. 2002 On the evolution of<br />
clonal plant life histories. Evol. Ecol. 15, 565–582. (doi:10.<br />
1023/A:1016013721469)<br />
Havlin, S. & Bun<strong>de</strong>, A. 1996 Fractals and disor<strong>de</strong>red systems,<br />
2nd edn. Berlin, Germany: Springer.<br />
Hemminga, M. A. & Duarte, C. M. 2000 Seagrass ecology.<br />
Cambridge, UK: Cambridge University Press.<br />
Hey, J. & Machado, C. A. 2003 The study of structured<br />
populations—new hope for a difficult and divi<strong>de</strong>d science.<br />
Nat. Rev. Genet. 4, 535–543. (doi:10.1038/nrg1112)<br />
Jeong, H., Mason, S. P., Barabasi, A. L. & Oltvai, Z. N. 2001<br />
Lethality and centrality in protein networks. Nature 411,<br />
41–42. (doi:10.1038/35075138)<br />
Marbà, N., Duarte, C. M., Cebrian, J., Gallegos, M. E.,<br />
Olesen, B. & SandJensen, K. 1996 Growth and population<br />
dynamics of Posidonia oceanica on the Spanish Mediterranean<br />
coast: elucidating seagrass <strong>de</strong>cline. Mar. Ecol.<br />
Prog. Ser. 137, 203–213.<br />
Marba, N., Duarte, C. M., Diaz-Almela, E., Terrados, J.,<br />
Alvarez, E., Martiinez, R., Santiago, R., Gacia, E. & Grau,<br />
A. M. 2005 Direct evi<strong>de</strong>nce of imbalanced seagrass<br />
(Posidonia oceanica) shoot population dynamics in the<br />
Spanish Mediterranean. Estuaries 28, 53–62.<br />
Maslov, S. & Sneppen, K. 2002 Specificity and stability in<br />
topology of protein networks. Science 296, 910–913.<br />
(doi:10.1126/science.1065103)<br />
Meirmans, P. G. & Van Tien<strong>de</strong>ren, P. H. 2004 GENOTYPE and<br />
GENODIVE: two programs for the analysis of genetic<br />
diversity of asexual organisms. Mol. Ecol. Notes 4,<br />
792–794. (doi:10.1111/j.1471-8286.2004.00770.x)<br />
Moreno, D., Aguilera, P. A. & Castro, H. 2001 Assessment of<br />
the conservation status of seagrass (Posidonia oceanica)<br />
meadows: implications for monitoring strategy and the<br />
<strong>de</strong>cision-making process. Biol. Conserv. 102, 325–332.<br />
(doi:10.1016/S0006-3207(01)00080-5)<br />
Morrison, D. A. 2005 Networks in phylogenetic analysis: new<br />
tools for population biology. Int. J. Parasitol. 35, 567–582.<br />
(doi:10.1016/j.ijpara.2005.02.007)<br />
Orive, M. E. 1993 Effective population-size in organisms with<br />
complex life-histories. Theor. Popul. Biol. 44, 316–340.<br />
(doi:10.1006/tpbi.1993.1031)<br />
J. R. Soc. Interface (2007)<br />
117
1102 Genetic diversity of clonal organisms A. F. Rozenfeld et al.<br />
Orive, M. E. 1995 Senescence in organisms with clonal<br />
reproduction and complex life-histories. Am. Nat. 145,<br />
90–108. (doi:10.1086/285729)<br />
Posada, D. & Crandall, K. A. 2001 Intraspecific gene<br />
genealogies: trees grafting into networks. Trends Ecol.<br />
Evol. 16, 37–45. (doi:10.1016/S0169-5347(00)02026-7)<br />
Proulx, S. R., Promislow, D. E. L. & Phillips, P. C. 2005<br />
Network thinking in ecology and evolution. Trends Ecol.<br />
Evol. 20, 345–353. (doi:10.1016/j.tree.2005.04.004)<br />
Ritland, K. 1996 Estimators for pairwise relatedness and<br />
individual inbreeding coefficients. Genet. Res. 67, 175–185.<br />
Ritland, K. 2000 Marker-inferred relatedness as a tool for<br />
<strong>de</strong>testing heritability in nature. Mol. Ecol. 9, 1195–1204.<br />
(doi:10.1046/j.1365-294x.2000.00971.x)<br />
Rueness, E. K., Stenseth, N. C., O’Donoghue, M., Boutin, S.,<br />
Ellegren, H. & Jakobsen, K. S. 2003 Ecological and genetic<br />
spatial structuring in the Canadian lynx. Nature 425,<br />
69–72. (doi:10.1038/nature01942)<br />
Templeton, A. R., Crandall, K. A. & Sing, C. F. 1992<br />
A cladistic analysis of phenotypic associations with<br />
haplotypes inferred from restriction endonuclease mapping<br />
and DNA sequence data. III. Cladogram estimation.<br />
Genetics 132, 619–633.<br />
Van <strong>de</strong>r Hulst, R. G. M., Mes, T. H. M., Falque, M., Stam, P.,<br />
Den Nijs, J. C. M. & Bachmann, K. 2003 Genetic structure<br />
of a population sample of apomictic dan<strong>de</strong>lions. Heredity<br />
90, 326–335. (doi:10.1038/sj.hdy.6800248)<br />
Vekemans, X. & Hardy, O. J. 2004 New insights from finescale<br />
spatial genetic structure analyses in plant populations.<br />
Mol. Ecol. 13, 921–935. (doi:10.1046/j.1365-294X.<br />
2004.02076.x)<br />
Watts, D. J. & Strogatz, S. H. 1998 Collective dynamics of<br />
‘small-world’ networks. Nature 393, 440–442. (doi:10.<br />
1038/30918)<br />
Wright, S. 1931 Evolution in Men<strong>de</strong>lian populations.<br />
Genetics 16, 97–159.<br />
Yonezawa, K., Ishii, T. & Nagamine, T. 2004 The effective<br />
size of mixed sexually and asexually reproducing populations.<br />
Genetics 166, 1529–1539. (doi:10.1534/genetics.<br />
166.3.1529)<br />
J. R. Soc. Interface (2007)<br />
118
Sophie ARNAUD-HAOND - Candidature à une Habilitation à Diriger <strong>de</strong>s Recherches, Février 2008<br />
3. Résumé <strong>de</strong>s travaux <strong>de</strong> Recherche<br />
III.2 Population genetics networks: i<strong>de</strong>ntifying weak and strong links in a<br />
metapopulation system. Soumis.<br />
Au niveau inter-population, nous retiendrons <strong>de</strong> cette expérience <strong>de</strong>ux éléments<br />
fondamentaux et encourageant pour la suite <strong>de</strong> nos travaux : 1) le réseau <strong>de</strong>s<br />
populations <strong>de</strong> Posidonia oceanica (Figure 11) permet tout d’abord une<br />
représentation <strong>de</strong>s liens entre les populations qui n’est pas contrainte par un schéma<br />
dichotomique comme le sont les représentations phylogénétiques habituelles, et<br />
corresponds mieux à la réalité <strong>de</strong>s connexions entre populations 2) L’étu<strong>de</strong> d’un<br />
certain nombre <strong>de</strong> propriétés du réseau, notamment le betweeness centrality, permet<br />
d’i<strong>de</strong>ntifier certaines populations ou groupes <strong>de</strong> populations qui semblent avoir une<br />
influence majeure sur la connectivité du système <strong>de</strong> métapopulations. A l’échelle<br />
Méditerranéenne, ces populations se trouvent au niveau <strong>de</strong> la zone <strong>de</strong> contact entre<br />
les bassins Est et Ouest. De même, à l’échelle <strong>de</strong>s côtes Espagnoles, cet indice,<br />
ainsi que le connectivity <strong>de</strong>gree, désignent les Baléares comme une région jouant ou<br />
ayant joué un rôle phare dans l’établissement et/ou le maintien <strong>de</strong>s populations <strong>de</strong><br />
Posidonies. Or c’est au Baléares que la prédominance dans certaines prairies <strong>de</strong><br />
clones ayant potentiellement atteint plusieurs dizaines <strong>de</strong> milliers d’années a été<br />
mise en évi<strong>de</strong>nce s26 . Ces résultats sont d’autant plus encourageants, si l’on<br />
considère la Figure 11, qu’aucune donnée géographique n’est utilisée dans la<br />
construction <strong>de</strong>s réseaux, mais uniquement les distances génétiques entre les<br />
agents (individus ou populations). Dans ce contexte, la cohérence entre la topologie<br />
et les propriétés du réseau et ce que nous savons <strong>de</strong> l’histoire et <strong>de</strong> la topographie<br />
<strong>de</strong> la Méditerranée est un résultat encourageant pour le futur développement <strong>de</strong><br />
l’application <strong>de</strong> la théorie <strong>de</strong>s réseaux en écologie moléculaire et en évolution.<br />
119
1<br />
Network analysis i<strong>de</strong>ntifies weak and strong links in a metapopulation<br />
system<br />
Alejandro F. Rozenfeld 1 , Sophie Arnaud-Haond 2,4 , Emilio Hernán<strong>de</strong>z-García 3 , Víctor<br />
M. Eguíluz 3 , Ester A. Serrão 2 and Carlos M. Duarte 1<br />
1 IMEDEA (CSIC-UIB), Instituto Mediterráneo <strong>de</strong> Estudios Avanzados, C/ Miquel<br />
Marqués 21, 07190 Esporles, Mallorca, Spain.<br />
2 CCMAR, CIMAR-Laboratório Associado, Universida<strong>de</strong> do Algarve, Gambelas,<br />
8005-139, Faro, Portugal<br />
3 IFISC, Instituto <strong>de</strong> Física Interdisciplinar y Sistemas Complejos (CSIC-UIB), Campus<br />
Universitat <strong>de</strong> les Illes Balears, E-07122 Palma <strong>de</strong> Mallorca, Spain.<br />
4 IFREMER, Centre <strong>de</strong> Brest, BP70, 29280 Plouzané, France<br />
Classification : Biological Sciences – Ecology, Physical Sciences – Applied<br />
Mathematics<br />
Corresponding Author : Alejandro Rozenfeld, alex@ifisc.uib.es, Instituto<br />
Mediterráneo <strong>de</strong> Estudios Avanzados, C/ Miquel Marqués 21, 07190 Esporles, Mallorca,<br />
Spain.<br />
Manuscript information: 15 pages, 6 figures, 2 tables.<br />
120
2<br />
Abstract<br />
The i<strong>de</strong>ntification of key populations for conservation or eradication is a major<br />
challenge in population ecology, particularly when <strong>de</strong>aling with threatened, invasive,<br />
and pathogenic species. Network theory was applied to map the genetic structure in a<br />
metapopulation system using microsatellite data from populations of the threatened<br />
seagrass Posidonia oceanica, as a mo<strong>de</strong>l, sampled across its whole geographical range.<br />
This approach allowed the characterization of hierarchical population structure, and the<br />
i<strong>de</strong>ntification of populations acting as hubs critical for relaying gene flow and<br />
sustaining the metapopulation system. This <strong>de</strong>velopment opens major perspectives in a<br />
broad range of <strong>applications</strong> of molecular ecology and evolution such as conservation<br />
biology and epi<strong>de</strong>miology, where targeting specific populations is crucial.<br />
121
3<br />
Un<strong>de</strong>rstanding the connectivity between components of a metapopulation system and<br />
their role as weak or strong links remains a major challenge of population ecology (1-3).<br />
Advances in molecular biology fostered the use of indirect approaches to un<strong>de</strong>rstand<br />
metapopulation structure, based on <strong>de</strong>scribing the distribution of gene variants (alleles)<br />
in space within the theoretical framework of population genetics (4-7). Yet, the<br />
premises of the classical Wright-Fisher mo<strong>de</strong>l (4, 6), such as “migration-drift<br />
equilibrium” (8), “equal population sizes” or symmetrical rate migration among<br />
populations, are often violated in real metapopulation systems. Threatened or pathogen<br />
species, for example, are precisely studied for their state of <strong>de</strong>mographic disequilibrium<br />
due to <strong>de</strong>cline and local extinctions in the first case, or to their complex dynamics of<br />
local <strong>de</strong>cline and sud<strong>de</strong>n pan<strong>de</strong>mic burst in the second. Furthermore, the un<strong>de</strong>rlying<br />
hypotheses of equal population size and symmetrical migration rates hamper the<br />
i<strong>de</strong>ntification of putative population “hubs” centralizing migration pathways or acting<br />
as sources in a metapopulation system, which is a central issue in conservation biology<br />
or epi<strong>de</strong>miology.<br />
Network theory is emerging as a powerful tool to un<strong>de</strong>rstand the behavior of<br />
complex systems composed of many interacting units (9-11). Although network theory<br />
has been applied to a broad array of problems (12-14), only recently has it been adapted<br />
to examining genetic relationships among populations or individuals (15, 16). Yet,<br />
relevant properties of networks, such as resistance (9) to perturbations (i.e. no<strong>de</strong><br />
paralysis or <strong>de</strong>struction), the ability to host coherent oscillations (17) or the predominant<br />
importance of no<strong>de</strong>s or cluster of no<strong>de</strong>s in maintaining the integrity of the system or<br />
relaying information through it can be <strong>de</strong>ducted from the network topology and specific<br />
characteristics (10, 11). Here we apply network theory to population genetics data of a<br />
threatened species, the Mediterranean seagrass Posidonia oceanica, to <strong>de</strong>monstrate its<br />
122
1102 Genetic diversity of clonal organisms A. F. Rozenfeld et al.<br />
Orive, M. E. 1995 Senescence in organisms with clonal<br />
reproduction and complex life-histories. Am. Nat. 145,<br />
90–108. (doi:10.1086/285729)<br />
Posada, D. & Crandall, K. A. 2001 Intraspecific gene<br />
genealogies: trees grafting into networks. Trends Ecol.<br />
Evol. 16, 37–45. (doi:10.1016/S0169-5347(00)02026-7)<br />
Proulx, S. R., Promislow, D. E. L. & Phillips, P. C. 2005<br />
Network thinking in ecology and evolution. Trends Ecol.<br />
Evol. 20, 345–353. (doi:10.1016/j.tree.2005.04.004)<br />
Ritland, K. 1996 Estimators for pairwise relatedness and<br />
individual inbreeding coefficients. Genet. Res. 67, 175–185.<br />
Ritland, K. 2000 Marker-inferred relatedness as a tool for<br />
<strong>de</strong>testing heritability in nature. Mol. Ecol. 9, 1195–1204.<br />
(doi:10.1046/j.1365-294x.2000.00971.x)<br />
Rueness, E. K., Stenseth, N. C., O’Donoghue, M., Boutin, S.,<br />
Ellegren, H. & Jakobsen, K. S. 2003 Ecological and genetic<br />
spatial structuring in the Canadian lynx. Nature 425,<br />
69–72. (doi:10.1038/nature01942)<br />
Templeton, A. R., Crandall, K. A. & Sing, C. F. 1992<br />
A cladistic analysis of phenotypic associations with<br />
haplotypes inferred from restriction endonuclease mapping<br />
and DNA sequence data. III. Cladogram estimation.<br />
Genetics 132, 619–633.<br />
Van <strong>de</strong>r Hulst, R. G. M., Mes, T. H. M., Falque, M., Stam, P.,<br />
Den Nijs, J. C. M. & Bachmann, K. 2003 Genetic structure<br />
of a population sample of apomictic dan<strong>de</strong>lions. Heredity<br />
90, 326–335. (doi:10.1038/sj.hdy.6800248)<br />
Vekemans, X. & Hardy, O. J. 2004 New insights from finescale<br />
spatial genetic structure analyses in plant populations.<br />
Mol. Ecol. 13, 921–935. (doi:10.1046/j.1365-294X.<br />
2004.02076.x)<br />
Watts, D. J. & Strogatz, S. H. 1998 Collective dynamics of<br />
‘small-world’ networks. Nature 393, 440–442. (doi:10.<br />
1038/30918)<br />
Wright, S. 1931 Evolution in Men<strong>de</strong>lian populations.<br />
Genetics 16, 97–159.<br />
Yonezawa, K., Ishii, T. & Nagamine, T. 2004 The effective<br />
size of mixed sexually and asexually reproducing populations.<br />
Genetics 166, 1529–1539. (doi:10.1534/genetics.<br />
166.3.1529)<br />
J. R. Soc. Interface (2007)<br />
123
4<br />
power to characterize population genetic structure and to i<strong>de</strong>ntify populations that are<br />
critical to the dynamics and sustainability of the whole system. These results open<br />
major perspectives in evolutionary ecology, and more specifically in conservation<br />
biology and epi<strong>de</strong>miology where the capacity to target populations <strong>de</strong>serving major<br />
efforts of conservation or control is crucial.<br />
Results and Discussion<br />
We build networks of population connectivity for a system of 37 meadows of the<br />
marine plant Posidonia oceanica, sampled across its entire geographic range -the<br />
Mediterranean Sea-, by using seven microsatellite markers (18). The network was built<br />
by consi<strong>de</strong>ring any pair of populations as linked when their genetic distance (Goldstein<br />
distance (19)) is smaller than a suitably chosen distance threshold (see Methods). We<br />
highlight these links as the relevant genetic relationships either at the Mediterranean<br />
(the full dataset) or at the regional (28 populations along Spanish coasts) scales.<br />
The topology of the network obtained at the Mediterranean scale (Fig. 1)<br />
highlights, without any a priori geographical information being used, the historical<br />
cleavage between Eastern and Western basins (18) and the transitional position of the<br />
populations from the Siculo-Tunisian Strait (see Fig. 1). The average clustering<br />
coefficient, =0.96, is significantly higher than the one expected after randomly<br />
rewiring the links (=0.76 with σ 0 =0.02, after 10000 randomizations) revealing the<br />
existence of clusters of populations more interconnected than expected by chance. The<br />
values of betweenness centrality, quantifying the relative importance of the meadows in<br />
relaying information flow through the network, immediately highlight a meadow in<br />
Sicily (present in 21% of all shortest paths among populations), together with another<br />
one in Cyprus (16%), as the main stepping-stones between the pairs of populations<br />
124
5<br />
sampled in the Western and Eastern basins, respectively (Fig. 1 and Table 1). These<br />
results are in agreement with the genetic structure revealed with classical population<br />
genetics analysis (Analysis of Molecular Variance “AMOVA”), revealing past vicariance<br />
(18) and a secondary contact zone in the Siculo-Tunisian Strait. The metapopulation<br />
structure, clustering and ‘transition zones’ <strong>de</strong>rived from the network analysis arise<br />
without any a priori input on clustering as nee<strong>de</strong>d for AMOVA, and without using<br />
geographic information in the analysis of allelic richness previously performed to<br />
support the existence and localization of a contact zone (18).<br />
Closer examination of the network conformed by the populations along the<br />
Spanish coasts (Figure 2, Table 2), more extensively and homogeneously sampled than<br />
the rest of the Mediterranean (Table 1), showed that the <strong>de</strong>gree distribution, P(k), i.e.<br />
the proportion of no<strong>de</strong>s with k connections to other no<strong>de</strong>s, <strong>de</strong>cays rapidly for large k<br />
(Fig 3.a) and that the six highest values are all observed in samples collected in the<br />
Balearic Islands (Fig 2, Table 2). The average clustering coefficient of =0.4 was<br />
significantly higher than that obtained in the corresponding randomized networks<br />
(=0.13 with σ 0 =0.05 after 10000 realizations), whereas the local clustering <strong>de</strong>cays<br />
as a function of the <strong>de</strong>gree k (Fig 3.b) which indicates that the central core is<br />
substructured into a small set of hubs, with high connectivity and low clustering, linking<br />
groups of closely connected no<strong>de</strong>s (i.e. with high clustering). Examination of the<br />
relationship between the <strong>de</strong>gree of a no<strong>de</strong> and the average <strong>de</strong>gree of the populations<br />
connected to it showed an abundance of links between highly connected and poorly<br />
connected no<strong>de</strong>s (Fig 3.c), a property termed dissortativity, present in many biological<br />
networks (20), and reveals a centralized topology. Observation of Fig. 2 indicates that<br />
seagrass populations along the Spanish continental coasts are genetically closer to<br />
Balearic populations than to geographically closer populations. Additionally, the highest<br />
125
6<br />
values of betweenness centrality (Table 2) are also attained at the Balearic populations,<br />
suggesting that the meadows of this region play or have played a central role in relaying<br />
gene flow at the scale of the Spanish coasts. Moreover, the betweenness centrality<br />
increases exponentially with the connectivity <strong>de</strong>gree k (Fig. 3d). All these findings<br />
reveal a star-like structure where hubs are connected in casca<strong>de</strong> and the central core is<br />
the set of Balearic populations. A clear perspective of this pattern is shown by the<br />
resulting Minimum Spanning Tree of populations (Fig. 4, see Methods). The biological<br />
implication is a great centrality of the Balearic Islands, acting or having acted as a hub<br />
for gene flow thorough the system.<br />
Populations with high <strong>de</strong>gree k might either be sources sustaining the system (i.e.<br />
spreading propagules), or sinks receiving gene flow from all the other populations, or<br />
both. The extremely low rate of sexual recruitment inferred in populations with low<br />
clonal diversity (R) ren<strong>de</strong>rs those, if highly connected, much more likely to disperse than<br />
to receive. The presence in the Balearic Islands of the two populations with the lowest<br />
observed clonal diversity and the highest connectivity (Es Port, R=0.1; k=10; and<br />
Fornells R=0.1; k=15), likely representing populations supplying “genetic material” to<br />
neighbor populations, suggests again that the Balearic islands is a key region for the<br />
dynamics and connectivity of the metapopulation system at the scale of the Spanish coast.<br />
Furthermore, 8 among 16 continental populations show extreme low connectivity (k=0),<br />
thereby allowing i<strong>de</strong>ntification of those least likely to be rescued by other populations,<br />
once threatened. As in any genetic approach to metapopulation management, the role of<br />
currently observed connectivity in future population rescuing is more important if<br />
current connectivity is limited by dispersal ability rather than by competitive interactions<br />
that could change in the future in <strong>de</strong>caying populations. Furthermore, given the<br />
particular millenary nature of P. oceanica clones, current genetic structure is likely to<br />
126
7<br />
integrate patterns of gene flow over past centuries, and thus may not reflect present-day<br />
dynamics.<br />
Both networks, that at the scale of the whole Mediterranean (Fig. 1) and that for<br />
the Spanish coasts (Fig. 2), presented “small world” properties (21), i.e. a diameter<br />
(L=1.39 and L=1.63 respectively) shorter than expected for random networks<br />
(=1.47 with σ 0 =0.01 and =2.53 with σ 0 =0.15 respectively, after 10000<br />
randomizations) whereas their clustering was much higher (see numerical values above),<br />
suggesting a highly hierarchical substructure. This provi<strong>de</strong>s clear evi<strong>de</strong>nce for the<br />
appearance of “short-cuts” in gene flow at multiple geographical scales along the<br />
history of this species, indicating rare events of large scale dispersal having a significant<br />
impact on the genetic composition of populations.<br />
These results <strong>de</strong>monstrate that network analyses are powerful tools to examine the<br />
structure of gene flow across different geographical scales. The use of specific network<br />
properties such as the betweenness centrality and the <strong>de</strong>gree distribution allowed to<br />
i<strong>de</strong>ntify populations relaying gene flow, or acting as sources supplying the system, as<br />
well as those less connected, increasing vulnerability to local extinction. The<br />
i<strong>de</strong>ntification of key populations to maintain the gene flow across the species range is<br />
essential to gui<strong>de</strong> conservation strategies for this endangered seagrass. In particular, this<br />
methodology successfully revealed the existence of an East-West cleavage in the<br />
Mediterranean and of a contact/transition zone in the Siculo-Tunisian Straight without<br />
any other a priori information such as geographic data or expected clustering of<br />
populations. Furthermore, network analysis tools provi<strong>de</strong>d graphical representations of<br />
the genetic relatedness between populations in a multidimensional space (15), free of<br />
some of the constraints (e.g. a tree-like structure or binary branching) compulsory in<br />
classical methods <strong>de</strong>scribing population relationships. Addressing gene flow using<br />
127
8<br />
network theory may prove a ground-breaking milestone in critical areas such as<br />
conservation biology, <strong>de</strong>aling with threatened or invasive species, and epi<strong>de</strong>miology,<br />
where the <strong>de</strong>finition of target populations to be conserved or eradicated is of crucial<br />
importance.<br />
Materials and Methods<br />
Molecular data. About 40 Posidonia shoots collected at each of the 37 sampled<br />
populations (Fig.1 and Table 1) were genotyped with a previously selected set of seven<br />
dinucleoti<strong>de</strong> microsatellites (22) allowing the i<strong>de</strong>ntification of clones (also called genets<br />
for clonal plants). Clonal diversity was estimated for each population as <strong>de</strong>scribed in<br />
Arnaud-Haond et al. (22), and replicates of the same clone were exclu<strong>de</strong>d for the<br />
estimation of inter-population distances. The matrix of interpopulation distances was<br />
built using Goldstein metrics (19), thus taking into account the level of molecular<br />
divergence among alleles, besi<strong>de</strong>s the differences in terms of allelic frequencies.<br />
Networks. We first built a fully connected network with the 37 populations<br />
consi<strong>de</strong>red as no<strong>de</strong>s. Each link joining pairs of populations was labeled with the<br />
Goldstein distance among them. We then removed links from this network of genetic<br />
similarity, starting from the one with the largest genetic distance and following in<br />
<strong>de</strong>creasing or<strong>de</strong>r, until the network reaches the percolation point (23, 24), beyond which<br />
it loses its integrity and fragments into small clusters. This means that gene flow across<br />
the whole system is disabled if connections at a distance smaller than this critical one,<br />
Dp, are removed. The precise location of this percolation point is ma<strong>de</strong> with the<br />
standard methodology a<strong>de</strong>quate for finite systems (23, 24), i.e., by calculating the<br />
128
9<br />
average size of the clusters excluding the largest one,<br />
S<br />
* 1<br />
=<br />
N<br />
∑<br />
s<br />
s<<br />
Smax<br />
2<br />
n s<br />
, as a function<br />
of the last distance value removed, thr, and i<strong>de</strong>ntifying the critical distance with the one<br />
at which * has a maximum. N is the total number of no<strong>de</strong>s not inclu<strong>de</strong>d in the<br />
largest cluster and n s is the number of clusters containing s no<strong>de</strong>s. Here we find Dp=91,<br />
as shown in Fig. 5.<br />
Once the network at percolation point is obtained, we analyzed its topology and<br />
characteristics (See Fig.1 and Table 1), and interpret those biologically. The first<br />
column in Table 1 contains also the estimated clonal diversity R of the different<br />
populations, <strong>de</strong>fined as the proportion of different genotypes found with respect to the<br />
total number of collected shoots.<br />
At the Spanish coasts scale, no percolation point is found using the above procedure,<br />
meaning that the genetic structure in this area is rather different from the one at the<br />
whole Mediterranean scale. To construct a useful network representation of the<br />
meadows genetic similarity, the following alternative process was applied in or<strong>de</strong>r to<br />
<strong>de</strong>termine a relevant distance threshold, thr, above which links are discar<strong>de</strong>d. At a very<br />
low threshold (thr=16, see Movie 1 provi<strong>de</strong>d as Supplementary Online Information)<br />
only the inner part of a central core, constituted by some meadows from the Balearic<br />
Islands, is connected. As the threshold is increased new meadows (from the central<br />
Spanish coast) become connected (thr=20). Beyond that value, more peripheral<br />
meadows are connected from the northern and southern Spanish coasts. The<br />
geographical extension of the connected cluster (Fig. 6) grows with the distance<br />
threshold and an important jump occurs at thr=22, when the northern and southern<br />
coasts get connected for the first time.<br />
129
10<br />
Further distance threshold increase does not contribute to geographical extension.<br />
Therefore, we find the value thr=22 and the resulting network as appropriate for<br />
topological characterization, since at this point the network contains a rich mixture of<br />
strong and weak links spanning all the available geographic scales within the<br />
Mediterranean Spanish coasts.<br />
Estimates of global and local properties of the network. The <strong>de</strong>gree k i of a<br />
given no<strong>de</strong> i is the number of other no<strong>de</strong>s linked to it (i.e., the number of neighbor<br />
no<strong>de</strong>s). The distribution P(k) gives the proportion of no<strong>de</strong>s in the network having<br />
<strong>de</strong>gree k.<br />
We <strong>de</strong>note by E i the number of links existing among the neighbors of no<strong>de</strong> i. This<br />
quantity takes values between 0 and<br />
E<br />
(max)<br />
i<br />
=<br />
ki<br />
( ki<br />
−1)<br />
, which is the case of a fully<br />
2<br />
connected neighborhood. The clustering coefficient C i of no<strong>de</strong> i is <strong>de</strong>fined as:<br />
C<br />
i<br />
=<br />
E<br />
E<br />
i<br />
(max)<br />
i<br />
=<br />
i<br />
2E<br />
k ( k<br />
i<br />
i<br />
−1)<br />
The clustering coefficient of the whole network is <strong>de</strong>fined as the average of<br />
all individual clustering coefficients in the system. The <strong>de</strong>gree <strong>de</strong>pen<strong>de</strong>nt clustering<br />
C(k) is obtained after averaging C i for no<strong>de</strong>s with <strong>de</strong>gree k.<br />
Real networks exhibit correlations among their no<strong>de</strong>s (20, 25-30) that play an<br />
important role in the characterization of the network topology. Those no<strong>de</strong> correlations<br />
are furthermore essential to un<strong>de</strong>rstand the dynamical aspects such as spreading of<br />
information or their robustness against targeted or random removal of their elements. In<br />
social networks, no<strong>de</strong>s having many connections tend to be connected with other highly<br />
connected no<strong>de</strong>s. This characteristic is usually referred to as assortativity, or assortative<br />
130
11<br />
mixing. On the other hand, technological and biological networks show rather the<br />
property that no<strong>de</strong>s having high <strong>de</strong>grees are preferably connected with no<strong>de</strong>s having<br />
low <strong>de</strong>grees, a property referred to as dissortativity. Assortativity is usually studied by<br />
<strong>de</strong>termining the properties of the average <strong>de</strong>gree of neighbors of a no<strong>de</strong> as a<br />
function of its <strong>de</strong>gree k (20, 29, 31). If this function is increasing, the network is<br />
assortative, since it shows that no<strong>de</strong>s of high <strong>de</strong>gree connect, on average, to no<strong>de</strong>s of<br />
high <strong>de</strong>gree. Alternatively, if the function is <strong>de</strong>creasing, the network is dissortative, as<br />
no<strong>de</strong>s of high <strong>de</strong>gree tend to connect to no<strong>de</strong>s of lower <strong>de</strong>gree. In this last case, the<br />
no<strong>de</strong>s with high <strong>de</strong>gree are therefore central hubs ensuring the connection of the whole<br />
system.<br />
The betweenness centrality (32) of no<strong>de</strong> i, bc(i), counts the fraction of shortest<br />
paths between pairs of no<strong>de</strong>s which pass through no<strong>de</strong> i. Let σ<br />
st<br />
<strong>de</strong>note the number of<br />
shortest paths connecting no<strong>de</strong>s s and t and σ (i)<br />
the number of those passing through<br />
the no<strong>de</strong> i. Then,<br />
σ<br />
st<br />
( i)<br />
bc( i)<br />
= ∑ .<br />
σ<br />
s≠t≠i<br />
st<br />
st<br />
The <strong>de</strong>gree-<strong>de</strong>pen<strong>de</strong>nt betweeness, bc(k), is the average betweeness value of no<strong>de</strong>s<br />
having <strong>de</strong>gree k.<br />
Minimum Spanning Tree. Given a connected, undirected graph, a spanning tree<br />
of that graph is a subgraph without cycles which connects all the vertices together. A<br />
single graph can have many different spanning trees. Provi<strong>de</strong>d each edge is labeled with<br />
a cost (in our analysis the genetic distance among the connected populations) each<br />
spanning tree can be characterized by the sum of the cost of its edges. A minimum<br />
131
14<br />
Figure Captions:<br />
Figure 1: The network of Mediterranean meadows in which only links with Goldstein<br />
distances smaller than the percolation distance Dp=91 (see Fig. 5) are present. No<strong>de</strong>s<br />
representing populations are roughly arranged according to their geographic origin. The<br />
precise geographic locations are indicated as diamonds in the background map. One can<br />
i<strong>de</strong>ntify two clusters of meadows, corresponding to the Mediterranean basins (east and<br />
west), separated by the Siculo-Tunisian Strait. The size of each no<strong>de</strong> indicates its<br />
betweenness centrality (i.e. the proportion of all shortests paths getting through the<br />
no<strong>de</strong>).<br />
Figure 2: The network constructed with the Spanish meadows at “geographic<br />
percolation” state (see Fig. 6). No<strong>de</strong>s are shown at the populations geographic locations.<br />
No<strong>de</strong> sizes characterize their betweenness centrality (i.e. the proportion of all shortests<br />
paths getting through the no<strong>de</strong>).<br />
Figure 3: Main topological properties found by analysing the structure of the network<br />
of meadows at the Spanish basin scale (Fig. 2). (a) The complementary cumulative<br />
<strong>de</strong>gree distribution P(<strong>de</strong>gree>k), (b) the local clustering C(k), (c) the average <strong>de</strong>gree<br />
in the neighbourhood of a meadow with <strong>de</strong>gree k, and (d) the <strong>de</strong>gree<strong>de</strong>pen<strong>de</strong>nt<br />
betweenness, bc(k), as a function of the connectivity <strong>de</strong>gree k.<br />
Figure 4: Minimum Spanning Tree based on Goldstein distance among Spanish<br />
meadows. This is the subgraph which connects the populations at the Spanish coast<br />
scale minimizing the total genetic distance along links.<br />
Figure 5. The average cluster size excluding the largest one, as a function of the<br />
imposed genetic threshold, at the whole Mediterranean scale. This i<strong>de</strong>ntifies Dp=91 as<br />
the percolation threshold.<br />
132
12<br />
spanning tree is then a spanning tree with minimal total cost. A minimum spanning tree<br />
is in fact the minimum-cost subgraph connecting all vertices, since subgraphs<br />
containing cycles necessarily have more total cost. Figure 4 shows the minimum<br />
spanning tree for the Spanish meadows. The star-like structure centered at Balearic<br />
populations is evi<strong>de</strong>nt.<br />
We acknowledge financial support from the Spanish MEC (Spain) and FEDER<br />
through project FISICOS (FIS2007-60327), the Portuguese FCT and FEDER through<br />
project NETWORK(POCI/MAR/57342/2004), the BBVA Foundation (Spain), and the<br />
European Commission through the NEST-Complexity project EDEN (043251).<br />
References.<br />
1. Haydon, D. T., Cleaveland, S., Taylor, L. H. & Laurenson, M. K. (2002)<br />
I<strong>de</strong>ntifying reservoirs of infection: A conceptual and practical challenge.<br />
Emerging Infectious Diseases 8, 1468-1473.<br />
2. Travis, J. M. J. & Park, K. J. (2004) Spatial structure and the control of invasive<br />
alien species. Animal Conservation 7, 321-330.<br />
3. Williams, J. C., ReVelle, C. S. & Levin, S. A. (2004) Using mathematical<br />
optimization mo<strong>de</strong>ls to <strong>de</strong>sign nature reserves. Frontiers in Ecology and the<br />
Environment 2, 98-105.<br />
4. Fisher, R. A. (1930) The genetical theory of natural selection (Clarendon press.<br />
5. Haldane, J. (1932) The Causes of Evolution (Longmans Green.<br />
6. Wright, S. (1931) Evolution in Men<strong>de</strong>lian populations. Genetics 16, 97-159.<br />
7. Wright, S. (1943) Isolation by distance. Genetics 28, 114-138.<br />
8. Hey, J. & Machado, C. A. (2003) The study of structured populations - New<br />
hope for a difficult and divi<strong>de</strong>d science. Nat. Rev. Genet. 4, 535-543.<br />
9. Albert, R., Jeong, H. & Barabasi, A. L. (2000) Error and attack tolerance of<br />
complex networks. Nature 406, 378-382.<br />
10. Amaral, L. A. N., Scala, A., Barthelemy, M. & Stanley, H. E. (2000) Classes of<br />
small-world networks. Proc. Natl. Acad. Sci. U. S. A. 97, 11149-11152.<br />
11. Strogatz, S. H. (2001) Exploring complex networks. Nature 410, 268-276.<br />
12. May, R. M. (2006) Network structure and the biology of populations. Trends<br />
Ecol. Evol. 21, 394-399.<br />
13. Proulx, S. R., Promislow, D. E. L. & Phillips, P. C. (2005) Network thinking in<br />
ecology and evolution. Trends Ecol. Evol. 20, 345-353.<br />
14. Watts, D. J. (1999) Networks, dynamics, and the small-world phenomenon.<br />
American Journal of Sociology 105, 493-527.<br />
133
13<br />
15. Dyer, R. J. & Nason, J. D. (2004) Population Graphs: the graph theoretic shape<br />
of genetic structure. Mol. Ecol. 13, 1713-1727.<br />
16. Rozenfeld, A. F., Arnaud-Haond, S., Hernan<strong>de</strong>z-Garcia, E., Eguiluz, V. M.,<br />
Serrao, E. A. & Duarte, C. M. (2007) Spectrum of genetic diversity and<br />
networks of clonal populations. Journal of the Royal Society Interface 4, 1093.<br />
17. Lago-Fernan<strong>de</strong>z, L. F., Huerta, R., Corbacho, F. & Siguenza, J. A. (2000) Fast<br />
response and temporal coherent oscillations in small-world networks. Phys. Rev.<br />
Lett. 84, 2758-2761.<br />
18. Arnaud-Haond, S., Migliaccio, M., Diaz-Almela, E., Teixeira, S., van <strong>de</strong> Vliet,<br />
M. S., Alberto, F., Procaccini, G., Duarte, C. M. & Serrao, E. A. (2007)<br />
Vicariance patterns in the Mediterranean Sea: east-west cleavage and low<br />
dispersal in the en<strong>de</strong>mic seagrass Posidonia oceanica. Journal of Biogeography<br />
34, 963-976.<br />
19. Goldstein, D. B., Linares, A. R., Cavalli-Sforza, L. L. & Feldman, M. W. (1995)<br />
Genetic Absolute Dating Based on Microsatellites and the Origin of Mo<strong>de</strong>rn<br />
Humans. Proc. Natl. Acad. Sci. U. S. A. 92, 6723-6727.<br />
20. Newman, M. E. J. (2002) Assortative mixing in networks. Phys. Rev. Lett. 89,<br />
208701.<br />
21. Watts, D. J. & Strogatz, S. H. (1998) Collective dynamics of 'small-world'<br />
networks. Nature 393, 440-442.<br />
22. Arnaud-Haond, S., Alberto, F., Teixeira, S., Procaccini, G., Serrao, E. A. &<br />
Duarte, C. M. (2005) Assessing genetic diversity in clonal organisms: Low<br />
diversity or low resolution? Combining power and cost efficiency in selecting<br />
markers. J. Hered. 96, 434-440.<br />
23. Grimmett, G. (1999) Percolation (Springer-Verlag, Berlin).<br />
24. Stauffer, D. & Aharony, A. (1994) Introduction to Percolation Theory (Taylor<br />
& Francis, CRC Press, London).<br />
25. Barrat, A. & Pastor-Satorras, R. (2005) Rate equation approach for correlations<br />
in growing network mo<strong>de</strong>ls. Phys. Rev. E 71, 036127.<br />
26. Boguñá, M. & Pastor-Satorras, R. (2003) Class of correlated random networks<br />
with hid<strong>de</strong>n variables. Phys. Rev. E 68, 036112.<br />
27. Maslov, S. & Sneppen, K. (2002) Specificity and stability in topology of protein<br />
networks. Science 296, 910-913.<br />
28. Newman, M. E. J. (2003) Mixing patterns in networks. Phys. Rev. E 67, 026126.<br />
29. Pastor-Satorras, R., Vazquez, A. & Vespignani, A. (2001) Dynamical and<br />
correlation properties of the Internet. Phys. Rev. Lett. 87, 258701.<br />
30. Vazquez, A., Pastor-Satorras, R. & Vespignani, A. (2002) Large-scale<br />
topological and dynamical properties of the Internet. Phys. Rev. E 65, 066130.<br />
31. Lee, S. H., Kim, P. J. & Jeong, H. (2006) Statistical properties of sampled<br />
networks. Phys. Rev. E 73, 016102<br />
32. Freeman, L. C. (1977) Set of Measures of Centrality Based on Betweenness.<br />
Sociometry 40, 35-41.<br />
134
16<br />
Figure 1: The network of Mediterranean meadows in which only links with Goldstein<br />
distances smaller than the percolation distance Dp=91 (see Fig. 5) are present. No<strong>de</strong>s<br />
representing populations are roughly arranged according to their geographic origin. The<br />
precise geographic locations are indicated as diamonds in the background map. One can<br />
i<strong>de</strong>ntify two clusters of meadows, corresponding to the Mediterranean basins (east and<br />
west), separated by the Siculo-Tunisian Strait. The size of each no<strong>de</strong> indicates its<br />
betweenness centrality (i.e. the proportion of all shortests paths getting through the<br />
no<strong>de</strong>).<br />
135
17<br />
Figure 2: The network constructed with the Spanish meadows at “geographic<br />
percolation” state (see Fig. 6). No<strong>de</strong>s are shown at the populations geographic locations.<br />
No<strong>de</strong> sizes characterize their betweenness centrality (i.e. the proportion of all shortests<br />
paths getting through the no<strong>de</strong>).<br />
136
18<br />
Figure 3: Main topological properties found by analysing the structure of the network<br />
of meadows at the Spanish basin scale (Fig. 2). (a) The complementary cumulative<br />
<strong>de</strong>gree distribution P(<strong>de</strong>gree>k), (b) the local clustering C(k), (c) the average <strong>de</strong>gree<br />
in the neighbourhood of a meadow with <strong>de</strong>gree k, and (d) the <strong>de</strong>gree<strong>de</strong>pen<strong>de</strong>nt<br />
betweenness, bc(k), as a function of the connectivity <strong>de</strong>gree k.<br />
137
19<br />
Figure 4: Minimum Spanning Tree based on Goldstein distance among Spanish<br />
meadows. This is the subgraph which connects the populations at the Spanish coast<br />
scale minimizing the total genetic distance along links.<br />
138
20<br />
Figure 5. The average cluster size excluding the largest one, as a function of the<br />
imposed genetic threshold, at the whole Mediterranean scale. This i<strong>de</strong>ntifies Dp=91 as<br />
the percolation threshold.<br />
139
21<br />
Figure 6. The maximal geographic distance connected (at the Spanish coasts scale) as a<br />
function of the imposed distance threshold (thr). Above thr=22 the maximal geographic<br />
distance covered by connected populations nearly duplicates.<br />
140
22<br />
Table 1: Local properties of the whole Mediterranean network for thr=Dp=91.<br />
Information is given for the betweenness centrality (bc) and clustering (C), as well as<br />
clonal diversity estimates (R) for each sample.<br />
REGION Name R bc C REGION Name R Bc C<br />
Addaia 0,67 0,0010 0,980 Cala Jonquet 0,5 0,0031 0,946<br />
Menoría<br />
Fornells 0,1 0,0031 0,946<br />
Port Lligat 0,28 0,0031 0,946<br />
Cala Giverola 0,43 0 0,997<br />
SPANISH BALEARIC ISLANDS<br />
Mallorca<br />
Cabrera<br />
Ibiza<br />
Magaluf 0,68 0,0010 0,981 Punta Fanals 0,68 0,0010 0,981<br />
Porto Colom 0,5 0,0031 0,946 Torre Sal 0,5 0,0010 0,981<br />
Es Castel 0,1 0,0010 0,981 Xilxes 0,35 0,0010 0,981<br />
Es Port 0,1 0,0031 0,946 Las Rotes 0,73 0,0010 0,981<br />
Santa Maria 13 0,56 0,0010 0,981 El Arenal 0,86 0,0031 0,946<br />
Santa Maria 7 0,54 0,0010 0,981 Campomanes 0,7 0,0031 0,946<br />
Playa Cavallets 0,73 0,0031 0,946<br />
SPANISH IBERIAN PENINSULA<br />
LaFossaCalpe 0,77 0,0031 0,946<br />
Calabardina 0,88 0,0003 0,997<br />
Es Pujols 0,67 0,0031 0,946 Carboneras 0,32 0,0010 0,981<br />
(ORDERED FROM NORTH TO SOUTH)<br />
Formentera<br />
EsCalo <strong>de</strong> S’Oli 0,36 0,0010 0,981 Rodalquilar 0,53 0,0010 0,981<br />
Ses Illetes 0,6 0,0031 0,946 Los Genoveces 0,34 0,0010 0,981<br />
Sa Torreta 0,51 0,0031 0,946 Roquetas 0,69 0,0010 0,981<br />
CENTRAL BASIN<br />
Sicily<br />
Tunis 0,85 0 1 Amathous ST3 0,44 0 1<br />
Malta 0,74 0 1 Amathous ST5 0,62 0,0008 0,667<br />
A. AzzuraST3 0,77 0,205 0,897<br />
A. AzzuraST5 0,72 0,0017 0,963<br />
Marzamemi 0,81 0,0003 0,995<br />
EAST BASIN<br />
Cyprus<br />
Greece<br />
Paphos 0,68 0,1579 0,333<br />
A. Nicolaos 0,69 0 1<br />
141
23<br />
Table 2: Local properties of the network constructed with the Spanish meadows.<br />
Information is given for the connectivity <strong>de</strong>gree (k), betweenness centrality (bc) and<br />
clustering (C), as well as clonal diversity estimates (R) for each sample.<br />
REGION Name R k bc C REGION Name R k bc C<br />
SPANISH BALEARIC ISLANDS<br />
Ibiza Cabrera Mallorca Menorca<br />
Formentera<br />
Addaia 0,67 0 0 0<br />
Cala Jonquet 0,5 0 0 0<br />
Port Lligat 0,28 0 0 0<br />
Fornells 0,1 15 0,180 0,32 Cala Giverola 0,43 0 0 0<br />
Magaluf 0,68 8 0 1<br />
Punta Fanals 0,68 1 0 0<br />
Torre Sal 0,5 0 0 0<br />
Porto Colom 0,5 9 0,0046 0,89 Xilxes 0,35 8 0 1<br />
SPANISH IBERIAN PENINSULA<br />
Es Castel 0,1 5 0 1 Las Rotes 0,73 5 0 1<br />
Es Port 0,1 10 0,0075 0,8 El Arenal 0,86 8 0 1<br />
Santa Maria 13 0,56 10 0,0075 0,8 Campomanes 0,7 0 0 0<br />
Santa Maria 7 0,54 10 0,0075 0,8 LaFossaCalpe 0,77 2 0 1<br />
Playa Cavallets 0,73 12 0,0037 0,58 Calabardina 0,88 0 0 0<br />
Es Pujols 0,67 1 0 0 Carboneras 0,32 0 0 0<br />
EsCalo <strong>de</strong> S’Oli 0,36 0 0 0 Rodalquilar 0,53 0 0 0<br />
Ses Illetes 0,6 0 0 0 Los Genoveces 0,34 1 0 0<br />
Sa Torreta 0,51 2 0 1<br />
Roquetas 0,69 1 0 0<br />
(ORDERED FROM NORTH TO SOUTH)<br />
142
Sophie ARNAUD-HAOND - Candidature à une Habilitation à Diriger <strong>de</strong>s Recherches, Février 2008<br />
4. Perspectives et Projets <strong>de</strong> Recherche<br />
IV.<br />
PERSPECTIVES : BIODIVERSITE ET EVOLUTION DES ECOSYSTEMES<br />
PROFONDS<br />
J’ai intégré le Laboratoire Environnement Profond <strong>de</strong> l’Ifremer, dirigé par<br />
Daniel Desbruyères, en janvier 2007. Durant ces <strong>de</strong>rniers mois, je me suis dans le<br />
familiarisée avec l’environnement profond, en m’intégrant à l’équipe et en prenant<br />
<strong>de</strong>s premiers contacts avec la communauté internationale constituée <strong>de</strong> chercheurs<br />
en écologie et en microbiologie spécialisés dans ce domaine.<br />
L’étu<strong>de</strong> <strong>de</strong> la structure génétique en milieu marin et l’adaptation <strong>de</strong> l’analyse<br />
<strong>de</strong> données aux systèmes reproducteurs et à l’état <strong>de</strong> déséquilibre <strong>de</strong>s populations<br />
étudiées seront le fil conducteur qui dirigera ma migration vers les profon<strong>de</strong>urs, et a<br />
déjà été exposé dans cette synthèse. Plus que <strong>de</strong>s projets <strong>de</strong> recherche détaillés, il<br />
s’agit donc ici <strong>de</strong> proposer une brève <strong>de</strong>scription du contexte particulier imposé par<br />
l’Environnement Profond, en particulier pour ce qui concerne l’écologie et les<br />
ressources génétiques, et <strong>de</strong> conclure sur les axes <strong>de</strong> recherche que je souhaite<br />
contribuer à développer à l’ai<strong>de</strong> <strong>de</strong>s approches décrites précé<strong>de</strong>mment.<br />
IV.1 Du milieu terrestre au milieu profond : un abysse <strong>de</strong> recherche et<br />
d’efforts.<br />
Le milieu marin recouvre 70% <strong>de</strong> la surface <strong>de</strong> la terre -le milieu abyssal 90%<br />
<strong>de</strong> son volume- et la quasi-totalité <strong>de</strong>s phylums vivants sont apparus et/ou<br />
représentés dans les océans. Pourtant, seulement 250.000, environ, <strong>de</strong>s 1.8 millions<br />
d’espèces décrites à l’heure actuelle sont marines (Bouchet 2006).<br />
Il ne s’agit pourtant pas du révélateur d’une extrêmement faible diversité, ni<br />
d’un plus faible intérêt du milieu marin par rapport au milieu terrestre. Au contraire, la<br />
plupart <strong>de</strong>s estimations montrent que les sédiments profonds pourraient abriter <strong>de</strong>s<br />
taux <strong>de</strong> diversité spécifiques très élevés (Grassle & Maciolek 1992, Gage 1996). Par<br />
ailleurs, le nombre d’espèces exploitées excè<strong>de</strong> le nombre d’espèces terrestres <strong>de</strong><br />
beaucoup, et ce malgré une domestication récente mais extraordinairement rapi<strong>de</strong><br />
(Duarte et al. 2007), et le grand nombre <strong>de</strong> molécule d’intérêt isolées sur <strong>de</strong>s<br />
organismes marins souligne un fort potentiel en terme <strong>de</strong> biotechnologies (Munro et<br />
al. 1999). L’origine <strong>de</strong> ce contraste pourrait plutôt se résumer en quatre mots : ‘trop<br />
loin, trop petit’. C’est en effet grâce aux progrès technologiques permettant <strong>de</strong><br />
contourner la difficulté d’accès à l’environnement profond (développement <strong>de</strong>s<br />
submersibles habitables et <strong>de</strong>s robots sous marins autonomes -AUV- ou téléopérés<br />
–ROV-) que l’existence d’oasis <strong>de</strong> vie en milieu abyssal a été révélée il y a à peine<br />
plus <strong>de</strong> 30 ans. C’est aussi grâce à l’essor <strong>de</strong> la biologie moléculaire, que les<br />
microorganismes qui dominent la vie –et la production primaire- dans les océans ont<br />
été caractérisés durant la <strong>de</strong>rnière décennie (Duarte 2006).<br />
143
Sophie ARNAUD-HAOND - Candidature à une Habilitation à Diriger <strong>de</strong>s Recherches, Février 2008<br />
4. Perspectives et Projets <strong>de</strong> Recherche<br />
Ces difficultés techniques peuvent partiellement expliquer que les<br />
écosystèmes marins aient fait l’objet <strong>de</strong> moins d’effort <strong>de</strong> recherches que les<br />
écosystèmes terrestres jusqu’aux <strong>de</strong>rnières décennies. Il est toutefois préoccupant<br />
<strong>de</strong> constater que malgré le développement <strong>de</strong>s technologies nécessaires à leur<br />
étu<strong>de</strong>, ce déséquilibre <strong>de</strong> l’effort <strong>de</strong> recherche soit toujours d’actualité et que<br />
seulement 0.1% <strong>de</strong>s mers fasse l’objet <strong>de</strong> mesures <strong>de</strong> protection contre bientôt 10%<br />
du domaine terrestre classé dans le cadre <strong>de</strong> la Convention pour la Diversité<br />
<strong>Biologique</strong> (Hendriks et al. 2006), et ce alors que les écosystèmes clés déclinent<br />
<strong>de</strong>ux à dix fois plus vite dans le milieu marin que dans le milieu terrestre (Lotze et al.<br />
2006). Ce qui est vrai pour le milieu marin l’est a forciuri pour le milieu profond, qui<br />
en terme <strong>de</strong> volume représente 90% <strong>de</strong> la planète et fait pourtant l’objet d’efforts <strong>de</strong><br />
recherche encore moins important que le milieu côtier. De plus l’environnement<br />
profond est confronté à un problème supplémentaire à celui <strong>de</strong> sa difficulté d’accès :<br />
son statut juridique, car la majorité <strong>de</strong>s écosystèmes profonds se trouve hors <strong>de</strong>s<br />
zones <strong>de</strong> juridictions nationales. Au-<strong>de</strong>là <strong>de</strong>s connaissances restant à acquérir, la<br />
mise en place <strong>de</strong> mesures <strong>de</strong> gestion et/ou <strong>de</strong> protection nécessite donc un long<br />
processus <strong>de</strong> négociation internationale pour la mise en place d’une gouvernance<br />
consensuelle (Arnaud-Haond et al. 2007, Fig. 12). Ce processus a été entamé en<br />
2007 à l’ONU, dans le cadre du Processus consultatif non officiel sur les océans et le<br />
droit <strong>de</strong> la mer, dont la VIIIe session a porté sur les ressources génétiques marines<br />
(http://www.un.org/Depts/los/consultative_process/8thmeetingpanel.htm ).<br />
Malgré son éloignement, il apparaît clairement que <strong>de</strong>s menaces sérieuses<br />
pèsent sur l’environnement profond, liées aux activités humaines (Davies et al. 2007)<br />
et aux conséquences potentielles du changement global. On peut citer la<br />
surexploitation <strong>de</strong>s stocks <strong>de</strong> pêche, la <strong>de</strong>struction <strong>de</strong> l’habitat par les activités<br />
halieutiques, l’extraction <strong>de</strong> pétrole, les projets d’activités minières et<br />
d’enfouissement <strong>de</strong> dioxy<strong>de</strong> <strong>de</strong> carbone, l’impact <strong>de</strong> l’acidification <strong>de</strong>s océans et du<br />
réchauffement global sur les cycles biogéochimiques et sur les écosystèmes<br />
sensibles tels que les récifs coralliens profonds (Roberts et al. 2006). Or une métaanalyse<br />
récente suggère que la perte <strong>de</strong> la biodiversité en environnement profond<br />
pourrait avoir un impact exponentiel sur le fonctionnement <strong>de</strong>s écosystèmes<br />
(Danovaro et al. 2008).<br />
Le défi à relever aujourd’hui en ce qui concerne la biodiversité marine consiste<br />
donc à renforcer l’effort <strong>de</strong> recherche pour caractériser le plus rapi<strong>de</strong>ment possible la<br />
biodiversité et comprendre le fonctionnement <strong>de</strong>s écosystèmes principaux. Il s’agit<br />
<strong>de</strong> tirer le meilleur parti <strong>de</strong>s avancées technologiques et moléculaires, non seulement<br />
pour combler les lacunes <strong>de</strong> notre connaissance concernant l’habitat dominant sur<br />
notre planète et pour y découvrir <strong>de</strong> nouvelles richesses à exploiter, mais également<br />
pour anticiper et prévenir la disparition d’une biodiversité et d’un ensemble<br />
d’écosystèmes dont l’importance et le potentiel restent encore à découvrir.<br />
144
Sophie ARNAUD-HAOND - Candidature à une Habilitation à Diriger <strong>de</strong>s Recherches, Février 2008<br />
4. Perspectives et Projets <strong>de</strong> Recherche<br />
Figure 2: Poster présenté au 1er colloque national sur les Aires Marines Protégées, à Boulogne sur<br />
Mer, du 20 au 22 Novembre 2007<br />
145
Sophie ARNAUD-HAOND - Candidature à une Habilitation à Diriger <strong>de</strong>s Recherches, Février 2008<br />
4. Perspectives et Projets <strong>de</strong> Recherche<br />
IV.2 Quelques un <strong>de</strong>s écosystèmes profonds principaux<br />
Les moyens d’exploration <strong>de</strong> l’environnement profond, après les<br />
circumnavigations et les explorations abyssales <strong>de</strong> la fin du XIX e et au début du XX e<br />
siècle, ont mis fin au paradigme, selon lequel le plancher océanique était un désert<br />
homogène sans vie, ou peuplé <strong>de</strong> communautés pauvres dépendant intégralement<br />
<strong>de</strong>s apports <strong>de</strong> matière organique <strong>de</strong>puis la zone photique. C’est une mosaïque<br />
d’écosystèmes divers et riches, sinon tous d’une biodiversité exubérante, du moins<br />
d’une biomasse élevée qui a été mise en évi<strong>de</strong>nce durant les 30 <strong>de</strong>rnières années,<br />
<strong>de</strong>puis la découvertes <strong>de</strong>s sources hydrothermales en 1977 (Encadrés 4 et 5). Le<br />
caractère exceptionnel <strong>de</strong> la découverte <strong>de</strong>s sources hydrothermales, <strong>de</strong>s sources<br />
<strong>de</strong> flui<strong>de</strong>s froids et <strong>de</strong>s écosystèmes temporaires que constituent les bois coulés ou<br />
les cadavres <strong>de</strong> mammifères (Encadré 4) ne rési<strong>de</strong> pas uniquement dans la<br />
découverte <strong>de</strong> l’hétérogénéité et <strong>de</strong> la richesse insoupçonnée <strong>de</strong> l’environnement<br />
profond, mais également dans celle d’une nouvelle voie métabolique <strong>de</strong> production<br />
<strong>de</strong> la matière organique. La chimiosynthèse, décrite quelques années auparavant<br />
chez les bactéries <strong>de</strong>s geysers d’eau chau<strong>de</strong> mais considérée jusqu’alors comme<br />
‘anecdotique’, détrône la photosynthèse comme unique voie métabolique <strong>de</strong><br />
production <strong>de</strong> matière organique et source <strong>de</strong> vie. Les écosystèmes<br />
chimiosynthétiques sont peuplés d’espèces formant <strong>de</strong>s réseaux trophiques<br />
complexes basés sur une production primaire réalisée par <strong>de</strong>s bactéries et <strong>de</strong>s<br />
archae, résultant dans une forte propension à la symbiose dans ces environnements<br />
extrêmes (Van Dover 2000).<br />
Finalement, <strong>de</strong>s écosystèmes profonds associés ou non à ces écosystèmes<br />
chimiosynthétiques, et dont la production primaire reste pour certains à éluci<strong>de</strong>r<br />
(chimiosynthèse ou apport <strong>de</strong> matière organique <strong>de</strong>puis la zone superficielle) ont<br />
également été découverts. On peut citer principalement les monts sous-marins<br />
(structures, souvent d’origine volcanique, qui s’élèvent à environ 1000 mètres ou plus<br />
au <strong>de</strong>ssus du plancher océanique) et les récifs coralliens profonds/froids qui y sont<br />
parfois associés (Encadré 5).<br />
146
Sophie ARNAUD-HAOND - Candidature à une Habilitation à Diriger <strong>de</strong>s Recherches, Février 2008<br />
4. Perspectives et Projets <strong>de</strong> Recherche<br />
147
Sophie ARNAUD-HAOND - Candidature à une Habilitation à Diriger <strong>de</strong>s Recherches, Février 2008<br />
4. Perspectives et Projets <strong>de</strong> Recherche<br />
148
Sophie ARNAUD-HAOND - Candidature à une Habilitation à Diriger <strong>de</strong>s Recherches, Février 2008<br />
4. Perspectives et Projets <strong>de</strong> Recherche<br />
IV.3 Axes <strong>de</strong> Recherche<br />
Taxonomie et biogéographie.<br />
Bien que la controverse sur l’étendue exacte <strong>de</strong> la diversité spécifiquemarine,<br />
en particulier dans les profon<strong>de</strong>urs, gron<strong>de</strong> encore entre les défenseurs du ‘record<br />
absolu’ (Grassle & Maciolek 1992) et ceux du ‘à peine le double <strong>de</strong> ce qui est déjà<br />
connu’ (May 1992), il semble admis que la plus gran<strong>de</strong> part reste encore à découvrir<br />
et à décrire (Bouchet 2006 , voir aussi le site du Census of Marine Life:<br />
http://www.coml.org).<br />
L’inventaire <strong>de</strong> la biodiversité et la biogéographie reposent encore<br />
principalement sur la reconnaissance morphologique <strong>de</strong>s organismes (Etter et al.<br />
1999, Desbruyères et al. 2006). L’utilisation, en complément <strong>de</strong> la taxonomie<br />
morphologique, <strong>de</strong> marqueurs moléculaires dans le cadre d’approches <strong>de</strong> type<br />
‘Barcoding of Life’ (Hebert et al. 2003) permet i) d’une part le positionnement <strong>de</strong>s<br />
espèces dans l’arbre <strong>de</strong> la vie pour une meilleure compréhension <strong>de</strong> leur phylogénie<br />
et <strong>de</strong> leur évolution, et ii) d’autre part <strong>de</strong> détecter l’existence d’espèces cryptiques<br />
non distinguées sur la base <strong>de</strong> critères morphologiques (Etter et al. 1999, Samadi et<br />
al. 2006), ou au contraire d’espèces synonymes (Samadi et al. 2006) décrites<br />
comme <strong>de</strong>s espèces distinctes dans <strong>de</strong>s écosystèmes ou <strong>de</strong>s zones géographiques<br />
différentes.<br />
Cette tâche <strong>de</strong> soutien à la caractérisation <strong>de</strong> nouvelles espèces s’inscrit dans<br />
le cadre plus large <strong>de</strong> la compréhension <strong>de</strong> l’histoire biogéographique <strong>de</strong>s taxons<br />
(voir ci-<strong>de</strong>ssous).<br />
Biogéographie : facteurs influençant la dispersion à différentes échelles, et<br />
influence <strong>de</strong> la symbiose.<br />
La distribution spatiale <strong>de</strong> la biodiversité en environnement profond est<br />
hétérogène, non seulement entre les différents types d’écosystèmes, mais<br />
également au sein d’un même type d’écosystème (Desbruyeres et al. 2000,<br />
Desbruyeres et al. 2001, Olu-Le Roy et al. 2004). La compréhension <strong>de</strong> cette<br />
répartition <strong>de</strong> la biodiversité passe par la <strong>de</strong>scription <strong>de</strong> l’histoire évolutive <strong>de</strong> ces<br />
écosystèmes et <strong>de</strong>s grands évènements qui ont façonné leur distribution<br />
biogéographique (Desbruyeres et al. 2000, Van Dover et al. 2002). L’analyse <strong>de</strong> la<br />
divergence génétique intraspécifique et/ ou intra-générique, et l’utilisation <strong>de</strong><br />
l’horloge moléculaire, peuvent permettent, en complément <strong>de</strong> l’analyse <strong>de</strong> la<br />
distribution spatiale <strong>de</strong>s espèces, d’obtenir <strong>de</strong>s informations sur l’histoire <strong>de</strong> la<br />
colonisation et <strong>de</strong> la divergence <strong>de</strong>s différents écosystèmes et provinces<br />
biogéographiques (Van Dover et al. 2001, Van Dover et al. 2002).<br />
149
Sophie ARNAUD-HAOND - Candidature à une Habilitation à Diriger <strong>de</strong>s Recherches, Février 2008<br />
4. Perspectives et Projets <strong>de</strong> Recherche<br />
Concrètement, plusieurs gran<strong>de</strong>s questions sont posées à différentes échelles<br />
<strong>de</strong> temps, parmi lesquelles ont peut citer, par échelle <strong>de</strong> temps croissante:<br />
1/ l’histoire <strong>de</strong> la colonisation <strong>de</strong>s différents types d’écosystèmes profonds.<br />
L’origine <strong>de</strong>s taxons actuels fait l’objet d’observations aux implications<br />
contradictoires. Par exemple au niveau <strong>de</strong>s sources hydrothermales où plus <strong>de</strong> 80%<br />
<strong>de</strong>s espèces sont endémiques, la morphologie <strong>de</strong> nombreux invertébrés et<br />
l’existence <strong>de</strong> fossiles datant <strong>de</strong> l’ère primaire (250-500 Ma) supportent l’hypothèse<br />
d’une une origine très ancienne <strong>de</strong>s taxons et d’un possible rôle <strong>de</strong> refuge <strong>de</strong>s<br />
sources hydrothermales pendant <strong>de</strong>s gran<strong>de</strong>s vagues d’extinctions dans la zone<br />
photique. Les données moléculaires disponibles jusqu’à présent suggèrent au<br />
contraire <strong>de</strong>s radiations beaucoup plus récentes (secondaire ou tertiaire) pour la<br />
plupart <strong>de</strong>s taxons étudiés (Little & Vrijenhoek 2003), impliquant <strong>de</strong>s évènements<br />
d’extinction et recolonisation <strong>de</strong>puis la surface (Jacobs & Lindberg 1998) ou les<br />
autres écosystèmes chimiosynthétiques. Pour certains taxons comme le genre<br />
Bathymodiolus, le scénario d’une colonisation progressive <strong>de</strong> l’environnement<br />
profond <strong>de</strong>puis la surface avec une acquisition progressive d’endosymbiontes<br />
(Craddock et al. 1995) par le biais d’écosystèmes temporaires comme les bois<br />
coulés ou les cadavres <strong>de</strong> mammifères (Distel et al. 2000) semble supporté par les<br />
données moléculaires. Pour d’autres taxons comme les Alvinellidae par exemple<br />
apparemment endémiques <strong>de</strong>s sources hydrothermales, la question <strong>de</strong> l’origine et <strong>de</strong><br />
l’époque approximative <strong>de</strong> la colonisation reste posée (Van Dover et al. 2002).<br />
2/ L’i<strong>de</strong>ntification et la datation <strong>de</strong>s évènements <strong>de</strong> vicariance et <strong>de</strong> dispersion<br />
passés qui ont façonné les provinces biogéographiques qui peuvent être<br />
différenciées à l’heure actuelle. Au-<strong>de</strong>là <strong>de</strong> la question <strong>de</strong> l’origine <strong>de</strong>s taxons la<br />
question se pose également la façon dont ceux-ci ont évolué et se sont dispersé, et<br />
<strong>de</strong> l’évolution isolée ou ‘concertée’ <strong>de</strong>s écosystèmes profonds. Les sources<br />
hydrothermales par exemple (dont la biogéographie est pour le moment plus étudiée<br />
et mieux connue que celle <strong>de</strong>s sources <strong>de</strong> flui<strong>de</strong>s froids) sont distribuées le long <strong>de</strong><br />
ri<strong>de</strong>s médio océaniques et <strong>de</strong>s bassins d’arrière arcs. Six provinces<br />
biogéographiques principales sont reconnues à l’heure actuelle (Van Dover et al.<br />
2002) sur la base <strong>de</strong> la composition <strong>de</strong>s communautés associées aux sources<br />
hydrothermales. Les évènements <strong>de</strong> vicariance ont probablement joué un rôle<br />
important dans la différentiation <strong>de</strong> ces provinces. Ainsi, les communautés<br />
hydrothermales <strong>de</strong> la faille <strong>de</strong> Juan <strong>de</strong> la Fuca au Nord <strong>de</strong> la Ri<strong>de</strong> Est Pacifique<br />
(EPR) et celles <strong>de</strong> la partie Sud <strong>de</strong> l’EPR et <strong>de</strong>s Galapagos partagent un grand<br />
nombre <strong>de</strong> taxons supérieurs et <strong>de</strong>s conditions physico-chimiques similaires,<br />
suggérant une origine commune et une séparation (Tunnicliffe et al. 1998) qui<br />
pourrait coïnci<strong>de</strong>r avec la scission <strong>de</strong> la ri<strong>de</strong> Est Pacifique il y a environs 30 millions<br />
d’années. Enfin les évènements <strong>de</strong> dispersion passés peuvent également expliquer<br />
la composition actuelle <strong>de</strong>s communautés, comme la forte proximité <strong>de</strong>s<br />
150
Sophie ARNAUD-HAOND - Candidature à une Habilitation à Diriger <strong>de</strong>s Recherches, Février 2008<br />
4. Perspectives et Projets <strong>de</strong> Recherche<br />
communautés <strong>de</strong> la Ri<strong>de</strong> Centre Indienne (CIR) et du bassin d’arrière arc (BAB)<br />
Ouest Pacifique qui suggère une voie <strong>de</strong> dispersion passée dont la localisation<br />
exacte reste à déterminer (Van Dover et al. 2001, Desbruyeres et al. 2006).<br />
3/ L’i<strong>de</strong>ntification <strong>de</strong>s déterminants principaux <strong>de</strong> la divergence intra-spécifique,<br />
c'est-à-dire <strong>de</strong> la dispersion ‘actuelle’ ou ‘récente’. Les patrons <strong>de</strong> structure<br />
génétique observés le long <strong>de</strong>s dorsales océaniques, par exemple, ne suivent pas<br />
les modèles d’isolement par la distance ou <strong>de</strong> stepping-stones qui étaient attendu<br />
étant donnée la fragmentation <strong>de</strong> l’habitat et sa répartition dans un espace à une<br />
dimension. Les étu<strong>de</strong>s portant sur les taxons principalement représentés ont mis en<br />
évi<strong>de</strong>nce ou suggéré l’influence, selon les espèces et les régions biogéographiques,<br />
<strong>de</strong> facteurs tels que le mo<strong>de</strong> <strong>de</strong> dispersion larvaire (Vrijenhoek 1997, Shank &<br />
Halanych 2007), les barrières au flux génique (Vrijenhoek 1997), la sélection<br />
environnementale (Jollivet et al. 1995a, Jollivet et al. 1995b), les processus <strong>de</strong><br />
coévolution... Toutefois, les problèmes d’accès à un échantillonnage suffisant, <strong>de</strong><br />
propriétés (neutralité, polymorphisme) <strong>de</strong>s marqueurs utilisés, et d’écart à l’équilibre<br />
migration-dérive, compliquent la généralisation <strong>de</strong> ces observations. Les progrès <strong>de</strong><br />
la biologie moléculaire et <strong>de</strong>s outils analytiques, conjugué à l’augmentation du<br />
nombre d’échantillons disponibles après plusieurs dizaines d’années <strong>de</strong> campagnes<br />
océanographiques, permettront probablement dans un avenir proche <strong>de</strong> contourner<br />
un certain nombre <strong>de</strong> ces difficultés et <strong>de</strong> comprendre un peu mieux les facteurs qui<br />
affectent la dispersion et la composition génétique <strong>de</strong>s populations d’environnement<br />
profond.<br />
Le premier projet portera sur la phylogéographie et <strong>de</strong> la dynamique <strong>de</strong>s<br />
populations <strong>de</strong> crevettes <strong>de</strong>s genres Alvinocaris distribuées dans les océans<br />
Pacifique et Atlantique et Rimicaris dans l’océan Atlantique. Ce choix a été motivé<br />
par l’intégration <strong>de</strong> ce projet dans le projet ANR ‘DeepOases’ et par la collaboration<br />
avec le laboratoire <strong>de</strong> Microbiologie <strong>de</strong>s Environnements Extrêmes, où l’étu<strong>de</strong> <strong>de</strong>s<br />
bactéries épimbiontes est réalisée (Zbin<strong>de</strong>n & Cambon-Bonavita 2003, Zbin<strong>de</strong>n et al.<br />
2004). Elle permettra l’étu<strong>de</strong> <strong>de</strong>s phylogénies comparées <strong>de</strong>s crevettes et <strong>de</strong><br />
certaines lignées bactériennes associées, afin <strong>de</strong> tester l’existence <strong>de</strong> patrons<br />
caractéristiques <strong>de</strong> processus coévolutifs. De plus, la répartition relativement<br />
étendue <strong>de</strong> ces espèces permettra une étu<strong>de</strong> phylogéographique globale, et <strong>de</strong>s<br />
étu<strong>de</strong>s <strong>de</strong> génétique <strong>de</strong>s populations <strong>de</strong> l’espèce Rimicaris exoculata plusieurs<br />
échelles spatiales.<br />
La phylogéographie <strong>de</strong>s espèces du genre Alvinocaris sera réalisée à l’ai<strong>de</strong><br />
<strong>de</strong> marqueurs mitochondriaux et ITS, car leur distribution étendue permettra <strong>de</strong> tester<br />
certaines hypothèses <strong>de</strong> colonisation <strong>de</strong>s ri<strong>de</strong>s océaniques Pacifique (EPR) et<br />
Atlantique (MAR) ainsi que <strong>de</strong>s échanges actuels et passés entre cold seeps et<br />
151
Sophie ARNAUD-HAOND - Candidature à une Habilitation à Diriger <strong>de</strong>s Recherches, Février 2008<br />
4. Perspectives et Projets <strong>de</strong> Recherche<br />
dorsales. Plus précisément il s’agit d’estimer i) le rôle <strong>de</strong> la fermeture <strong>de</strong> l’isthme <strong>de</strong><br />
Panama dans la divergence entre les espèces, ii) la date <strong>de</strong>s évènements <strong>de</strong><br />
radiation et iii) la possibilité que les sources <strong>de</strong> suintement froid aient joué un rôle <strong>de</strong><br />
‘stepping-stone’ dans la colonisation <strong>de</strong>s sources hydrothermales.<br />
Dans le cas <strong>de</strong> Rimicaris exoculata, il s’agira <strong>de</strong> décrire le patron <strong>de</strong> structure<br />
génétique à différentes échelles spatiales le long <strong>de</strong> la ri<strong>de</strong> Médio Atlantique (à<br />
l’échelle <strong>de</strong> la cheminée, du site, du champ hydrothermal, et entre champs<br />
hydrothermaux) afin d’estimer la distance à partir <strong>de</strong> laquelle <strong>de</strong> la restriction au flux<br />
<strong>de</strong> gènes peut-être mise en évi<strong>de</strong>nce. Cette estimation sera réalisée sur la base<br />
d’échantillons déjà disponibles, et d’échantillons qui seront prélevés lors <strong>de</strong>s<br />
prochaines campagnes, afin d’estimer la stabilité temporelle <strong>de</strong>s patrons <strong>de</strong><br />
structuration observés.<br />
La répartition spatiale fragmentée <strong>de</strong> certains écosystèmes profonds, et<br />
l’instabilité temporelle <strong>de</strong>s écosystèmes chimiosynthétiques (plus modérée pour les<br />
sources <strong>de</strong> flui<strong>de</strong>s froids) suggèrent <strong>de</strong>s évènements récurrents d’extinctionrecolonisation<br />
(Jollivet et al. 1998) et laissent penser que l’équilibre migration-dérive<br />
n’est probablement pas atteint pour la plupart <strong>de</strong>s espèces (Jollivet et al. 1999). Par<br />
ailleurs, les tailles <strong>de</strong> populations varient probablement en fonction <strong>de</strong> l’aire habitable<br />
et du temps écoulé <strong>de</strong>puis la <strong>de</strong>rnière extinction/recolonisation (Vrijenhoek 1997).<br />
Quant aux mouvements migratoires, ils sont vraisemblablement influencés à la fois<br />
par les distances à parcourir, le mo<strong>de</strong> <strong>de</strong> dispersion larvaire et les obstacles ou<br />
courants existants entre ces habitats fragmentés. Ces caractéristiques compliquent<br />
l’analyse <strong>de</strong>s données <strong>de</strong> génétique <strong>de</strong>s populations avec les outils statistiques<br />
classiques (Jollivet et al. 1999). L’un <strong>de</strong>s aspects <strong>de</strong> mon travail consistera donc à<br />
continuer le développement <strong>de</strong> l’utilisation <strong>de</strong> la théorie <strong>de</strong>s réseaux ce type <strong>de</strong><br />
données. Par ailleurs, l’étu<strong>de</strong> simultanée <strong>de</strong>s ‘hôtes’ et <strong>de</strong>s invertébrés ou<br />
microorganismes associés permettra d’utiliser une développement spécifique <strong>de</strong> la<br />
théorie <strong>de</strong>s réseaux : les réseaux bipartites, qui permettent d’étudier l’interaction<br />
entre la connectivité <strong>de</strong> <strong>de</strong>ux types <strong>de</strong> réseaux dont les agents sont associés entre<br />
eux (Watts 2004).<br />
Composante génétique <strong>de</strong> la biodiversité et conservation<br />
Dans le cadre <strong>de</strong> notre partenariat avec la nouvelle Agence <strong>de</strong>s Aires Marines<br />
Protégées, l’un <strong>de</strong> nos objectifs est <strong>de</strong> contribuer à la mise en place d’Aires Marines<br />
Protégées en Environnement Profond, par l’i<strong>de</strong>ntification <strong>de</strong> zones prioritaires à<br />
classer et l’i<strong>de</strong>ntification <strong>de</strong>s critères permettant l’évaluation <strong>de</strong> l’intérêt <strong>de</strong>s zones à<br />
protéger et <strong>de</strong> l’efficacité <strong>de</strong>s mesures mises en place.<br />
152
Sophie ARNAUD-HAOND - Candidature à une Habilitation à Diriger <strong>de</strong>s Recherches, Février 2008<br />
4. Perspectives et Projets <strong>de</strong> Recherche<br />
Un premier chantier concerne les zones <strong>de</strong> canyons et les écosystèmes <strong>de</strong><br />
coraux profonds, afin <strong>de</strong> contribuer aux objectifs <strong>de</strong> Natura 2000 et <strong>de</strong> la Convention<br />
OSPAR. Un projet Européen (CoralFISH, Encadré 6) a été accepté dans le cadre du<br />
FP7, qui apportera à la fois en terme <strong>de</strong> cartographie <strong>de</strong> l’habitat et d’étu<strong>de</strong> d’impact<br />
<strong>de</strong>s éléments d’informations nécessaires à la mise en place d’AMP profon<strong>de</strong>s sur les<br />
écosystèmes coralliens <strong>de</strong> la faça<strong>de</strong> Atlantique.<br />
153
Sophie ARNAUD-HAOND - Candidature à une Habilitation à Diriger <strong>de</strong>s Recherches, Février 2008<br />
4. Perspectives et Projets <strong>de</strong> Recherche<br />
Un projet Life+ (SAME) a été déposé pour valoriser et complémenter les<br />
résultats obtenus dans le cadre <strong>de</strong> CoralFISH.<br />
Intitulé complet du projet : Etu<strong>de</strong> <strong>de</strong>s interactions entre coraux, poissons et<br />
pêcheries, dans le but <strong>de</strong> développer <strong>de</strong>s outils <strong>de</strong> gestion et <strong>de</strong> modélisation<br />
prédictive pour une gestion basée pour les écosystèmes dans les eaux profon<strong>de</strong>s<br />
Européennes, et au-<strong>de</strong>là (Encadré 6).<br />
Il s’agira pour moi (lea<strong>de</strong>r du WP4, Encadré 6) d’étudier la composition clonale<br />
et génétique <strong>de</strong>s populations <strong>de</strong> corail profond <strong>de</strong> l’espèce Lophelia pertusa, et la<br />
structure génétique <strong>de</strong>s populations du polychète associé Eunice norvegica.<br />
Appartenant à la famille <strong>de</strong>s Sclératinaires, L. pertusa est systématiquement<br />
rencontrée en association avec le polychète E. norvegica (Roberts 2005), et il est<br />
proposé que cette association durable soit basée sur l’habitat fourni au polychète par<br />
la structure corallienne, et à la protection <strong>de</strong>s coraux contre l’érosion par les<br />
structures tubulaires du polychète. L. pertusa a été observée <strong>de</strong> part et d’autre <strong>de</strong><br />
l’Océan Atlantique, en Mer Méditerranée, et dans les Océans Indien et Pacifique. La<br />
distribution étendue <strong>de</strong>s récifs <strong>de</strong> Lophelia permet d’envisager une étu<strong>de</strong> <strong>de</strong> la<br />
phylogéographie et <strong>de</strong> la dispersion <strong>de</strong> ces <strong>de</strong>ux espèces à plusieurs échelles<br />
spatiales.<br />
Cette étu<strong>de</strong> sera basée sur <strong>de</strong>s marqueurs microsatellites déjà disponibles<br />
pour L. pertusa (Le Goff-Vitry et al. 2004), et qui seront développés pour E.<br />
norvegica. Elle visera à i) étudier la variabilité géographique et/ou écotypique <strong>de</strong> la<br />
balance entre reproduction sexuée et asexuée chez L. pertusa, et l’impact <strong>de</strong>s<br />
pêcheries profon<strong>de</strong>s sur la variabilité clonale et génétique <strong>de</strong> cette espèce, ii) établir<br />
le patron <strong>de</strong> structure génétique et le schéma <strong>de</strong> dispersion comparés <strong>de</strong>s <strong>de</strong>ux<br />
espèces et estimer le probabilité <strong>de</strong> recolonisation en cas d’extinction locale et iii)<br />
éventuellement <strong>de</strong> recueillir <strong>de</strong>s informations sur le mo<strong>de</strong> <strong>de</strong> transmission et la<br />
possible co-évolution entre les lignées <strong>de</strong> coraux et <strong>de</strong> polychètes.<br />
Finalement, l’étu<strong>de</strong> <strong>de</strong>s organismes clonaux que sont les coraux me permettra<br />
également <strong>de</strong> poursuivre le travail <strong>de</strong> réflexion engagé sur les implications <strong>de</strong> la<br />
clonalité sur l’évolution <strong>de</strong>s populations et <strong>de</strong>s espèces.<br />
154
Sophie ARNAUD-HAOND -Candidature à une Habilitation à Diriger <strong>de</strong>s Recherches, Février 2008<br />
Références<br />
V. RÉFÉRENCES<br />
Albert R, Jeong H, Barabasi AL (1999) Internet - Diameter of the World-Wi<strong>de</strong> Web.<br />
Nature 401:130-131<br />
Arnaud-Haond S, Desbruyeres D, Jarmache E (2007) Loin <strong>de</strong>s yeux: menaces et<br />
protection <strong>de</strong>s écosystèmes profonds. Poster. 1er colloque national sur les<br />
aires marines protégées, Boulogne sur Mer, 20-22 novembre 2007<br />
Avise JC (1989) A Role for Molecular Genetics in the Recognition and Conservation<br />
of Endangered Species. Trends in Ecology & Evolution 4(9):279-281<br />
Avise JC (1994) Molecular markers, natural history, and evolution, Vol, New York<br />
Barabasi AL, Albert R, Jeong H (2000) Scale-free characteristics of random<br />
networks: the topology of the World-Wi<strong>de</strong> Web. Physica A 281:69-77<br />
Bascompte J, Jordano P, Melian CJ, Olesen JM (2003) The nested assembly of<br />
plant-animal mutualistic networks. Proceedings of the National Aca<strong>de</strong>my of<br />
Sciences of the United States of America 100:9383-9387<br />
Bascompte J, Melian CJ, Sala E (2005) Interaction strength combinations and the<br />
overfishing of a marine food web. Proceedings of the National Aca<strong>de</strong>my of<br />
Sciences of the United States of America 102:5443-5447<br />
Beaumont MA, Nichols RA (1996) Evaluating loci for use in the genetic analysis of<br />
population structure. Proceedings of the Royal Society of London B 263:1619-<br />
1626<br />
Benzie JAH, Williams ST (1997) Genetic structure of Giant Clam (Tridacna maxima)<br />
populations in the west pacific is not consistent with dispersal by present-day<br />
ocean currents. Evolution 51(3):768-783<br />
Bouchet P (2006) The Magnitu<strong>de</strong> of Marine Biodiversity. In: Duarte CM (ed) The<br />
Exploration of Marine Biodiversity: Scientific and Technological Challenges.<br />
Fundación BBVA, Bilbao, Spain<br />
Bowen BW, Avise JC (1990) Genetic structure of Atlantic and Gulf Mexico<br />
populations of sea bass, menha<strong>de</strong>n, and sturgeon: influence of zoogeographic<br />
factors and life history patterns. Marine Biology 107:371-381<br />
Cavalli-Sforza LL (1965) Population Structure and Human Evolution. Proc R Soc<br />
Lond Ser B-Biol Sci 164:362-379<br />
Craddock C, Hoeh WR, Lutz RA, Vrijenhoek RC (1995) Extensive gene flow among<br />
mytilid (Bathymodiolus thermophilus) populations from hydrothermal vents of<br />
the eastern Pacific. Marine Biology 124:113-146<br />
Danovaro R, Gambi C, Dell'Anno A, Corinal<strong>de</strong>si C, Fraschetti S, Vanreusel A, Vincx<br />
M, Gooday AJ (2008) Exponential Decline of Deep-Sea Ecosystem<br />
Functioning Linked to Benthic Biodiversity Loss. Current Biology 18:1-8<br />
Davies AJ, Roberts JM, Hall-Spencer J (2007) Preserving <strong>de</strong>ep-sea natural heritage:<br />
Emerging issues in offshore conservation and management. Biological<br />
Conservation 138:299-312<br />
Depaulis F, Veuille M (1998) Neutrality tests based on the distribution of haplotypes<br />
un<strong>de</strong>r an infinite-site mo<strong>de</strong>l. Molecular Biology and Evolution 15:1788-1790<br />
Desbruyeres D, Almeida A, Biscoito M, Comtet T, Khripounoff A, Le Bris N, Sarradin<br />
PM, Segonzac M (2000) A review of the distribution of hydrothermal vent<br />
communities along the northern Mid-Atlantic Ridge: dispersal vs.<br />
environmental controls. Hydrobiologia 440:201-216<br />
Desbruyeres D, Biscoito M, Caprais JC, Colaco A, Comtet T, Crassous P, Fouquet Y,<br />
Khripounoff A, Le Bris N, Olu K, Riso R, Sarradin PM, Segonzac M,<br />
155
Sophie ARNAUD-HAOND -Candidature à une Habilitation à Diriger <strong>de</strong>s Recherches, Février 2008<br />
Références<br />
Vangriesheim A (2001) Variations in <strong>de</strong>ep-sea hydrothermal vent communities<br />
on the Mid-Atlantic Ridge near the Azores plateau. Deep-Sea Research Part I-<br />
Oceanographic Research Papers 48:1325-1346<br />
Desbruyeres D, Hashimoto J, Fabri MC (2006) Composition and Biogeography of<br />
Hydrothermal Vent Communities in Western Pacific Back-Arc Basins. . In: D.<br />
M. Christie CRF, S.-M. Lee and S. Givens (ed) Back-Arc Spreading Systems -<br />
Geological, Biological, Chemical, and Physical Interactions p215-235<br />
Desbruyères D, Segonzac M, Bright M (2006) Handbook of <strong>de</strong>ep-sea hydrothermal<br />
vent fauna, , Vol. Denisia<br />
Distel DL, Baco AR, Chuang E, Morrill W, Cavanaugh C, Smith CR (2000) Marine<br />
ecology - Do mussels take woo<strong>de</strong>n steps to <strong>de</strong>ep-sea vents? Nature 403:725-<br />
726<br />
Duarte CM (2006) The Exploration of Marine Biodiversity: Scientific and<br />
Technological Challenges, Vol. Fundación BBVA, Bilbao, Spain<br />
Duarte CM, Marba N, Holmer M (2007) ECOLOGY: Rapid Domestication of Marine<br />
Species. Science 316:382-383<br />
Edmands S, Moberg PE, Burton RS (1996) Allozyme and mitochondrial DNA<br />
evi<strong>de</strong>nce of population subdivision in the purple sea urchin Strongylocentrus<br />
purpuratus. Marine Biology 126:443-450<br />
Etter RJ, Rex MA, Chase MC, Quattro JM (1999) A genetic dimension to <strong>de</strong>ep sea<br />
biodiversity. Deep-Sea Research Part I-Oceanographic Research Papers<br />
46:1095-1099<br />
Fisher RA (1930) The genetical theory of natural selection., Vol. Clarendon Press,<br />
Oxford<br />
Gage JD (1996) Why are there so many species in <strong>de</strong>ep-sea sediments? Journal of<br />
Experimental Marine Biology and Ecology 200:257-286<br />
Grassle JF, Maciolek NJ (1992) Deep-sea species richness: regional and local<br />
diversity estimates from quantitative bottom samples. American Naturalist<br />
139:313-341<br />
Haldane J (1932) The Causes of Evolution, Vol. Longmans Green, New York<br />
Hebert PDN, Cywinska A, Ball SL, DeWaard JR (2003) Biological i<strong>de</strong>ntifications<br />
through DNA barco<strong>de</strong>s. Proceedings of the Royal Society of London Series B-<br />
Biological Sciences 270:313-321<br />
Hedgecock D (1994) Population Genetics of Marine Organisms. U S Globec News<br />
6:1-11<br />
Hendriks IE, Duarte CM, Heip CHR (2006) Biodiversity Research Still Groun<strong>de</strong>d.<br />
Science 312:1715-<br />
Ingvarsson PK, Whitlock MC (2000) Heterosis increases the effective migration rate.<br />
Proceedings of the Royal Society of London Series B-Biological Sciences<br />
267:1321-1326<br />
Jacobs DK, Lindberg DR (1998) Oxygen and evolutionary patterns in the sea:<br />
Onshore/offshore trends and recent recruitment of <strong>de</strong>ep-sea faunas.<br />
Proceedings of the National Aca<strong>de</strong>my of Sciences of the United States of<br />
America 95:9396-9401<br />
Jarne P, Lagoda PJL (1996) Microsatellites, from molecules to populations and back.<br />
Trends in Ecology & Evolution 11:424-429<br />
Jollivet D, Chevaldonne P, Planque B (1999) Hydrothermal-vent alvinellid polychaete<br />
dispersal in the eastern Pacific. 2. A metapopulation mo<strong>de</strong>l based on habitat<br />
shifts. Evolution 53:1128-1142<br />
156
Sophie ARNAUD-HAOND -Candidature à une Habilitation à Diriger <strong>de</strong>s Recherches, Février 2008<br />
Références<br />
Jollivet D, Desbruyeres D, Bonhomme F, Moraga D (1995a) Genetic differentiation of<br />
<strong>de</strong>ep-sea hydrothermal vent Alvinellid populations (Annelida, Polychaeta)<br />
along the East Pacific Rise. Heredity 74:376-391<br />
Jollivet D, Desbruyeres D, Ladrat C, Laubier L (1995b) Evidnce for differences in the<br />
allozyme thermostability of <strong>de</strong>ep-sea hydrothermal vent polychaetes<br />
(Alvinellidae)-A possible selection by habitat. . Marine Ecology-Progress<br />
Series 123:125-136<br />
Jollivet D, Dixon LRJ, Desbruyeres D, Dixon DR (1998) Ribosomal (rDNA) variation<br />
in a <strong>de</strong>ep sea hydrothermal vent polychaete, Alvinella pompejana, from 13<br />
<strong>de</strong>grees N on the East Pacific Rise. Journal of the Marine Biological<br />
Association of the United Kingdom 78:113-130<br />
Knowlton N, L.A. W, Solorzano LA, Mills DK, Bermingham E (1993) Divergence in<br />
Proteins, Mitochondrial-DNA, and reproductive compatibility across the<br />
Isthmus of Panama. Science 260:1629-1632<br />
Le Goff-Vitry MC, Pybus OG, Rogers AD (2004) Genetic structure of the <strong>de</strong>ep-sea<br />
coral Lophelia pertusa in the northeast Atlantic revealed by microsatellites and<br />
internal transcribed spacer sequences. Molecular Ecology 13:537-549<br />
Lemaire C, Allegrucci G, Naciri M, Barhi-Sfar L, Kara H, Bonhomme F (2000) Do<br />
discrepancies between microsatellites and allozyme variation reveal<br />
differential selection between sea and lagoon in the sea bass (Dicentrarchus<br />
labrax)? Molecular Ecology 9:457-468<br />
Levin DA, Howland GP, Steiner E (1972) Protein Polymorphism and Genic<br />
Heterozygosity in a Population of Permanent Translocation Heterozygote,<br />
Oenothera-Biennis. Proceedings of the National Aca<strong>de</strong>my of Sciences of the<br />
United States of America 69:1475-&<br />
Levitan DR, Sewell MA, Chia F-S (1992) How distribution and abujndance influence<br />
fertilization success in the sea urchin Strongylocentrus franciscanus. Ecology<br />
73:248-254<br />
Little CTS, Vrijenhoek RC (2003) Are hydrothermal vent animals living fossils?<br />
Trends in Ecology & Evolution 18:582-588<br />
Lotze HK, Lenihan HS, Bourque BJ, Bradbury RH, Cooke RG, Kay MC, Kidwell SM,<br />
Kirby MX, Peterson CH, Jackson JBC (2006) Depletion, <strong>de</strong>gradation, and<br />
recovery potential of estuaries and coastal seas. Science 312:1806-1809<br />
Luikart G, England PR, Tallmon D, Jordan S, Taberlet P (2003) The power and<br />
promise of population genomics: From genotyping to genome typing. Nature<br />
Reviews Genetics 4:981-994<br />
Markert C, Moller F ( 1959) Multiple forms of enzymes: tissue ontogenetic and<br />
species specific patterns. Proceedings of the National Aca<strong>de</strong>my of Science,<br />
USA 45:753-763<br />
May RM (1992) Bottom up of the ocean. Nature 357:278-279<br />
May RM (2006) Network structure and the biology of populations. Trends in Ecology<br />
& Evolution 21:394-399<br />
Morin PA, Luikart G, Wayne RK (2004) SNPs in ecology, evolution and conservation.<br />
Trends in Ecology & Evolution 19:208-216<br />
Munro MHG, Blunt JW, Dum<strong>de</strong>i EJ, Hickford SJH, Lill RE, Li SX, Battershill CN,<br />
Duckworth AR (1999) The discovery and <strong>de</strong>velopment of marine compounds<br />
with pharmaceutical potential. Journal of Biotechnology 70:15-25<br />
Olu-Le Roy K, Sibuet M, Fiala-Medioni A, Gofas S, Salas C, Mariotti A, Foucher JP,<br />
Woodsi<strong>de</strong> J (2004) Cold seep communities in the <strong>de</strong>ep eastern Mediterranean<br />
157
Sophie ARNAUD-HAOND -Candidature à une Habilitation à Diriger <strong>de</strong>s Recherches, Février 2008<br />
Références<br />
Sea: composition, symbiosis and spatial distribution on mud volcanoes. Deep-<br />
Sea Research Part I-Oceanographic Research Papers 51:1915-1936<br />
Palumbi SR (1992) Marine Speciation on a Small Planet. TREE 7:114-118<br />
Palumbi SR (1994) Genetic divergence, reproductive isolation, and marine<br />
speciation. Annu Rev Ecol Syst 25:547-572<br />
Parker PG, Sow AA, Schug MD, Booton GC, Fuerst PA (1998) What molecules can<br />
tell us about populations: choosing and using a molecular marker. Ecology<br />
79:361-382<br />
Planes S, Galzin R, Bonhomme F (1996) A genetic metapopulation mo<strong>de</strong>l for reef<br />
fishes in oceanic islands: the case of the surgeonfish, Acanthurus triostegus. J<br />
Evol Biol 9:103-117<br />
Raufaste N, Bonhomme F (soumis) A monoallelic test of <strong>de</strong>parture from neutral<br />
expectation of allele frequencies in a metapopulation.<br />
Roberts JM (2005) Reef-aggregating behaviour by symbiotic eunicid polychaetes<br />
from cold-water corals: do worms assemble reefs? Journal of the Marine<br />
Biological Association of the United Kingdom 85:813-819<br />
Roberts JM, Wheeler AJ, Freiwald A (2006) Reefs of the <strong>de</strong>ep: The biology and<br />
geology of cold-water coral ecosystems. Science 312:543-547<br />
Samadi S, Bottan L, Macpherson E, De Forges BR, Boisselier MC (2006) Seamount<br />
en<strong>de</strong>mism questioned by the geographic distribution and population genetic<br />
structure of marine invertebrates. Marine Biology 149:1463-1475<br />
Saun<strong>de</strong>rs NC, Kessler LG, Avise JC (1986) Genetic variation and geographic<br />
differentiation in mitochondrial DNA of the horseshoe crab, Limulus<br />
polyphemus. Genetics 112<br />
Shank TM, Halanych KM (2007) Toward a mechanistic un<strong>de</strong>rstanding of larval<br />
dispersal: insights from genomic fingerprinting of the <strong>de</strong>ep-sea hydrothermal<br />
vent tubeworm Riftia pachyptila. Mar Ecol-Evol Persp 28:25-35<br />
Sintes T, Marbà N, Duarte CM (2006) Mo<strong>de</strong>ling non-linear seagrass clonal growth:<br />
Assessing the efficiency of space occupation across the seagrass flora.<br />
Estuaries and Coasts 29:72-80<br />
Tunnicliffe V, McArthur AG, McHugh D (1998) A biogeographical perspective of the<br />
<strong>de</strong>ep-sea hydrothermal vent fauna. In: Advances in Marine Biology, Vol 34,<br />
Vol 34, p 353-442<br />
Ueda HR, Hayashi S, Matsuyama S, Yomo T, Hashimoto S, Kay SA, Hogenesch JB,<br />
Iino M (2004) Universality and flexibility in gene expression from bacteria to<br />
human. PNAS 101:3765-3769<br />
Van Dover CJ (2000) The ecology of <strong>de</strong>ep sea hydrothermal vents, Vol, Princeton,<br />
NJ<br />
Van Dover CL, German CR, Speer KG, Parson LM, Vrijenhoek RC (2002) Marine<br />
biology - Evolution and biogeography of <strong>de</strong>ep-sea vent and seep<br />
invertebrates. Science 295:1253-1257<br />
Van Dover CL, Humphris SE, Fornari D, Cavanaugh CM, Collier R, Goffredi SK,<br />
Hashimoto J, Lilley MD, Reysenbach AL, Shank TM, Von Damm KL, Banta A,<br />
Gallant RM, Gotz D, Green D, Hall J, Harmer TL, Hurtado LA, Johnson P,<br />
McKiness ZP, Meredith C, Olson E, Pan IL, Turnipseed M, Won Y, Young CR,<br />
Vrijenhoek RC (2001) Biogeography and ecological setting of Indian Ocean<br />
hydrothermal vents. Science 294:818-823<br />
Vermeij G (1987) The dispersal barrier in the tropical Pacific: implications for<br />
molluscan speciation and extinction. Evolution 41:1046-1058<br />
158
Sophie ARNAUD-HAOND -Candidature à une Habilitation à Diriger <strong>de</strong>s Recherches, Février 2008<br />
Références<br />
Vrijenhoek RC (1997) Gene flow and genetic diversity in naturally fragmented<br />
metapopulations of <strong>de</strong>ep-sea hydrothermal vent animals. Journal of Heredity<br />
88:285-293<br />
Watts DJ (1999) Networks, dynamics, and the small-world phenomenon. American<br />
Journal of Sociology 105:493-527<br />
Watts DJ (2004) The "new" science of networks. Annual Review of Sociology 30:243-<br />
270<br />
Watts DJ, Strogatz SH (1998) Collective dynamics of 'small-world' networks. Nature<br />
393:440-442<br />
Wright S (1931) Evolution in Men<strong>de</strong>lian populations. Genetics 16:97-159<br />
Zbin<strong>de</strong>n M, Cambon-Bonavita MA (2003) Occurrence of Deferribacterales and<br />
Entomoplasmatales in the <strong>de</strong>ep-sea Alvinocarid shrimp Rimicaris exoculata<br />
gut. Fems Microbiology Ecology 46:23-30<br />
Zbin<strong>de</strong>n M, Le Bris N, Gaill F, Compere P (2004) Distribution of bacteria and<br />
associated minerals in the gill chamber of the vent shrimp Rimicaris exoculata<br />
and related biogeochemical processes. Marine Ecology-Progress Series<br />
284:237-251<br />
158