Local Hazard Mitigation Plan.pdf - Sonoma County Water Agency ...
Local Hazard Mitigation Plan.pdf - Sonoma County Water Agency ...
Local Hazard Mitigation Plan.pdf - Sonoma County Water Agency ...

Create successful ePaper yourself
Turn your PDF publications into a flip-book with our unique Google optimized e-Paper software.
TABLE OF CONTENTS<br />
ii<br />
Page<br />
1.0 INTRODUCTION ...............................................................................................................1<br />
1.1 AGENCY PROFILE................................................................................................1<br />
1.2 PURPOSE OF THE PLAN......................................................................................2<br />
1.3 PLAN DEVELOPMENT PROCESS ......................................................................3<br />
1.3.1 <strong>Water</strong> System Reliability Study...................................................................4<br />
1.3.2 Document Review........................................................................................4<br />
1.3.3 Public Involvement ......................................................................................5<br />
1.4 PLAN ADOPTION..................................................................................................6<br />
2.0 SONOMA COUNTY WATER AGENCY FACILITIES ...................................................7<br />
2.1 WATER SUPPLY SYSTEM...................................................................................7<br />
2.2 SANITATION SYSTEM.........................................................................................8<br />
2.3 FLOOD CONTROL SYSTEM................................................................................9<br />
2.4 EMERGENCY POWER........................................................................................10<br />
2.5 ADMINISTRATIVE INFRASTRUCTURE.........................................................10<br />
3.0 HAZARD ASSESSMENT ................................................................................................12<br />
3.1 EARTHQUAKE HAZARD...................................................................................12<br />
3.1.1 Historic Seismicity.....................................................................................12<br />
3.1.2 Surface Fault Rupture <strong>Hazard</strong>....................................................................13<br />
3.1.3 Strong Ground Shaking..............................................................................14<br />
3.1.4 Liquefaction and Lateral Spread................................................................15<br />
3.1.5 Earthquake Induced Landslides .................................................................16<br />
3.2 FLOOD HAZARD.................................................................................................17<br />
3.3 GEO-HAZARDS ...................................................................................................19<br />
3.3.1 Landslides ..................................................................................................19<br />
3.3.2 Corrosive Soils...........................................................................................19<br />
3.4 FIRE HAZARD .....................................................................................................21<br />
3.5 DROUGHT............................................................................................................23<br />
3.6 OTHER HAZARDS ..............................................................................................25<br />
3.6.1 Tornadoes...................................................................................................27<br />
3.6.2 Hurricanes and Other Weather Related <strong>Hazard</strong>s .......................................27<br />
3.7 HAZARDS SUMMARY.......................................................................................28<br />
4.0 VULNERABILITY ASSESSMENT.................................................................................29<br />
4.1 WATER SUPPLY .................................................................................................29<br />
4.1.1 Russian River System ................................................................................30<br />
4.1.2 Diversion Facilities ....................................................................................30<br />
4.1.3 Aqueducts ..................................................................................................31<br />
4.1.4 Storage Facilities........................................................................................32<br />
4.1.5 Booster Pump Facilities .............................................................................33<br />
4.1.6 Treatment Facilities ...................................................................................33<br />
4.1.7 Supplementary <strong>Water</strong> Sources...................................................................34<br />
4.1.8 Emergency Power ......................................................................................34
4.2 SANITATION .......................................................................................................34<br />
4.3 FLOOD PROTECTION ........................................................................................36<br />
4.4 ADMINISTRATIVE INFRASTRUCTURE.........................................................36<br />
5.0 MITIGATION GOALS, OBJECTIVES AND ACTIONS................................................37<br />
6.0 IMPLEMENTATION STRATEGY..................................................................................42<br />
7.0 PLAN MAINTENANCE...................................................................................................45<br />
7.1 MONITORING EVALUATING AND UPDATING THE PLAN .......................45<br />
7.2 CONTINUED PUBLIC INVOLVEMENT...........................................................45<br />
8.0 REFERENCES ..................................................................................................................47<br />
iii
TABLES<br />
Table 1<br />
Table 2<br />
Table 3<br />
Table 4<br />
Table 5<br />
Table 6<br />
Peak Ground Acceleration (g) at the <strong>Agency</strong>’s Facilities<br />
Historic Floods in <strong>Sonoma</strong> <strong>County</strong><br />
Major Historic Fires in <strong>Sonoma</strong> <strong>County</strong><br />
Historic Weather Related <strong>Hazard</strong>s in <strong>Sonoma</strong> <strong>County</strong><br />
Fujita Scale for Tornado Intensity<br />
<strong>Hazard</strong> Summary<br />
FIGURES<br />
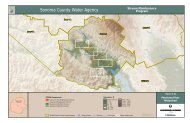
Figure 1 <strong>Water</strong> System Map<br />
Figure 1a <strong>Water</strong> System Map (Wohler-Mirabel Area)<br />
Figure 2 Sanitation District and Zones<br />
Figure 3 Power System<br />
Figure 4 Fault Map<br />
Figure 5 Historic Earthquakes in the Bay Area<br />
Figure 6 Earthquake Probabilities in the Bay Area<br />
Figure 7 Fault Map for the <strong>Agency</strong>’s <strong>Water</strong> Transmission System Service Area<br />
Figure 8 Ground Shaking <strong>Hazard</strong> Map (<strong>Water</strong> Transmission System)<br />
Figure 9 Liquefaction and Lateral Spread <strong>Hazard</strong> (<strong>Water</strong> Transmission System)<br />
Figure 10 Landslide <strong>Hazard</strong> (<strong>Water</strong> Transmission System)<br />
Figure 11 Flood <strong>Hazard</strong> (<strong>Water</strong> Transmission System)<br />
Figure 12 Historic Landslides in <strong>Sonoma</strong> <strong>County</strong> during El Nino Storms of 1997-1998<br />
Figure 13 Debris Flow <strong>Hazard</strong> (<strong>Water</strong> Transmission System)<br />
Figure 14 Concrete Corrosion Potential (<strong>Water</strong> Transmission System)<br />
Figure 15 Steel Corrosion Potential (<strong>Water</strong> Transmission System)<br />
Figure 16 Fire Threat (<strong>Water</strong> Transmission System)<br />
Figure 17 Historic Fires in <strong>Sonoma</strong> <strong>County</strong> (<strong>Water</strong> Transmission System)<br />
Figure 18 Tornado <strong>Hazard</strong> in California<br />
Figure 19 Fault Map for the <strong>Agency</strong>’s Sanitation System Service Area<br />
Figure 20 Ground Shaking <strong>Hazard</strong> Map (Sanitation System)<br />
Figure 21 Liquefaction and Lateral Spread <strong>Hazard</strong> (Sanitation System)<br />
Figure 22 Landslide <strong>Hazard</strong> (Sanitation System)<br />
Figure 23 Flood <strong>Hazard</strong> (Sanitation System)<br />
Figure 24 Debris Flow <strong>Hazard</strong> (Sanitation System)<br />
Figure 25 Concrete Corrosion Potential (Sanitation System)<br />
Figure 26 Steel Corrosion Potential (Sanitation System)<br />
Figure 27 Fire Threat (Sanitation System)<br />
Figure 28 Historic Fires in <strong>Sonoma</strong> <strong>County</strong> (Sanitation System)<br />
iv
1.0 INTRODUCTION<br />
1.1 AGENCY PROFILE<br />
The <strong>Sonoma</strong> <strong>County</strong> <strong>Water</strong> <strong>Agency</strong> (<strong>Agency</strong>) was created as a special district in 1949 by the<br />
California Legislature to provide flood protection and water supply services to portions of<br />
<strong>Sonoma</strong> and Marin counties. Legislation enacted in 1995 added the treatment and disposal of<br />
wastewater to the <strong>Agency</strong>'s responsibilities. Although the <strong>Sonoma</strong> <strong>County</strong> Board of Supervisors<br />
acts as the <strong>Agency</strong>'s Board of Directors, the <strong>Agency</strong> is a separate legal entity created by State<br />
law, having specific limited purposes and powers, and separate sources of funding. The <strong>Agency</strong><br />
is thus different from <strong>County</strong> departments, which are created by the Board of Supervisors for<br />
administrative purposes, but are not separate legal entities.<br />
The <strong>Agency</strong> is a wholesale water supplier to eight primary water contractors, several smaller<br />
communities and water companies, a range of surplus (curtailable) customers and off-peak<br />
customers. The total population served by the <strong>Agency</strong> is approximately 600,000 people in<br />
southern <strong>Sonoma</strong> <strong>County</strong> and Marin <strong>County</strong>. The projected total annual water demand from the<br />
<strong>Agency</strong>’s customers is approximately 74 mgd for 2010 to 96 mgd for 2030.<br />
The <strong>Agency</strong> also provides wastewater collection and treatment, and recycled water distribution<br />
and disposal services to approximately 22,000 residences and businesses and maintains more<br />
than 70 miles of engineered flood control channels and over 80 miles of natural channels<br />
(creeks). As part of flood control works, the <strong>Agency</strong> also maintains levees, and fish ladders, and<br />
embankment protection on the Russian River.<br />
The <strong>Agency</strong>’s eight prime water supply customers include the City of Santa Rosa, North Marin<br />
<strong>Water</strong> District, City of Petaluma, City of Rohnert Park, Valley of the Moon <strong>Water</strong> District, City<br />
of <strong>Sonoma</strong>, City of Cotati and Town of Windsor. Approximately 2% of the <strong>Agency</strong>’s water is<br />
supplied to customers such as California-American <strong>Water</strong> Company (Larkfield District),<br />
Penngrove <strong>Water</strong> Company, Lawndale Mutual, Kenwood Village <strong>Water</strong> Company, Forestville<br />
<strong>Water</strong> District, and various government entities. Depending upon the <strong>Agency</strong>’s transmission<br />
system capacity and the availability of excess water in the Russian River, the <strong>Agency</strong> sells as<br />
much as 12% of its water to the Marin Municipal <strong>Water</strong> District (MMWD). However,<br />
MMWD’s rights to <strong>Agency</strong>’s transmission system capacity are subordinate to the rights of the<br />
<strong>Agency</strong>’s eight prime contractors. Less than 1% of <strong>Agency</strong>’s total water deliveries are provided<br />
to several curtailable (surplus customers) such as local wineries.<br />
Each of the <strong>Agency</strong>’s water contractors is responsible for maintaining their own retail<br />
distribution system, including storage tanks and pumping stations. Most of the <strong>Agency</strong>’s water<br />
1 <strong>Local</strong> <strong>Hazard</strong> <strong>Mitigation</strong> <strong>Plan</strong> 1-18-08.doc
contractors maintain some local source of supply in addition to water purchased from the<br />
<strong>Agency</strong>, but that constitutes a very small percentage of their total water requirements. <strong>Water</strong> to<br />
its various contractors is provided through tie-ins into the <strong>Agency</strong>’s aqueducts. In addition to the<br />
contractor tie-ins into the aqueducts, the transmission system is also tied to about thirty fire<br />
hydrants. However, the primary fire-fighting capability within the <strong>Agency</strong>’s service area is<br />
through fire hydrants within the local distribution systems.<br />
The <strong>Agency</strong> is also responsible for wastewater collection, treatment and disposal services for the<br />
Airport/Larkfield/Wikiup, Geyserville, Penngrove and Sea Ranch <strong>County</strong> Sanitation Zones and<br />
the Occidental, Russian River, <strong>Sonoma</strong> Valley, and South Park <strong>County</strong> Sanitation Districts. For<br />
flood control purposes, the <strong>Agency</strong> has helped build and manage the Warm Springs Dam, Spring<br />
Lake, Coyote Valley Dam, Matanzas Creek Reservoir, Piner Creek Reservoir, Brush Creek<br />
Reservoir.<br />
1.2 PURPOSE OF THE PLAN<br />
<strong>Sonoma</strong> <strong>County</strong> is located in an area impacted by multiple natural hazards. Historically it has<br />
been subjected to many floods, wildfires, landslides and mudflows. Due to its proximity to the<br />
San Andreas Fault System, one of the major active fault systems in the world, <strong>Sonoma</strong> <strong>County</strong><br />
also has a very high earthquake hazard.<br />
The <strong>Agency</strong>’s water, wastewater and flood control systems are distributed over a large<br />
geographical area and traverse zones of varying geology and potential hazards. A<br />
comprehensive <strong>Hazard</strong> <strong>Mitigation</strong> <strong>Plan</strong> (<strong>Plan</strong>) was prepared in recognition of the <strong>Agency</strong>’s<br />
responsibility to the community and its role in preserving the economic vitality of the region. As<br />
stated in the <strong>Sonoma</strong> <strong>County</strong> Emergency Operations <strong>Plan</strong>, the public places trust in the operators<br />
of water systems to provide high quality drinking water, even after a disaster. An uninterrupted<br />
supply of clean drinking water and water for fire fighting is essential for the health and safety of<br />
the community and to minimize the potential for loss of life and property damage following a<br />
major natural disaster.<br />
As has been shown numerous times in the past, natural disasters can result in enormous cost to<br />
the public through loss of life, human suffering, property damage and economic loss. Lack of<br />
preparedness can make recovery a very long and arduous process, which can last for many<br />
months or years and can depress a region for a time long after the physical signs of the disaster<br />
have disappeared. Recognizing this, the Federal Government passed the Disaster <strong>Mitigation</strong> Act<br />
of 2000 (DMA 2000), which encourages and rewards pre-disaster planning at all levels of local,<br />
tribal and State government.<br />
2 <strong>Local</strong> <strong>Hazard</strong> <strong>Mitigation</strong> <strong>Plan</strong> 1-18-08.doc
As an incentive for pre-disaster mitigation planning, the DMA 2000 has established a predisaster<br />
hazard mitigation program and new requirements for the national post-disaster <strong>Hazard</strong><br />
<strong>Mitigation</strong> Grant Program (HMGP). Accordingly, a larger amount of HMGP funds are available<br />
for communities that have developed a comprehensive mitigation plan prior to a disaster. In<br />
addition States, tribes and communities must have an approved mitigation plan in place before<br />
receiving HMGP funds. In addition, the Federal Emergency Management <strong>Agency</strong> (FEMA) has<br />
a Pre-Disaster <strong>Mitigation</strong> (PDM) program that provides funds to states, territories, Indian tribal<br />
governments, communities, and universities for hazard mitigation planning and the<br />
implementation of mitigation projects prior to a disaster event. Funding these plans and projects<br />
reduces overall risks to the population and structures, while also reducing reliance on funding<br />
from actual disaster declarations. PDM grants are awarded on a competitive basis and without<br />
reference to state allocations, quotas, or other formula-based allocation of funds. An approved<br />
<strong>Hazard</strong> <strong>Mitigation</strong> <strong>Plan</strong> is a pre-requisite for applying for a PDM grant.<br />
1.3 PLAN DEVELOPMENT PROCESS<br />
Recognizing its obligation to provide high quality water to the public, the <strong>Agency</strong> on its own<br />
initiative in 2004 embarked on a natural hazard reliability improvement program for its water<br />
supply system. This multi-phase project was initiated by the Department of Engineering and<br />
Resource <strong>Plan</strong>ning, with the <strong>Agency</strong>’s Capital Projects Manager, Mr. Cordel Stillman, as the<br />
Project Manager for the project. Throughout the course of the project Deputy Chief Engineers<br />
from the <strong>Agency</strong>’s Engineering and Resource <strong>Plan</strong>ning Division (Mr. James Jasperse),<br />
Maintenance Division (Mr. Michael Thompson) and Operations Division (Ms. Pamela Jean)<br />
were involved in setting the course of the project, attended meetings and reviewed drafts of the<br />
plan.<br />
The <strong>Agency</strong> contracted the services of MMI Engineering (MMI), a specialty engineering firm<br />
with expertise in the assessment of natural and man-made hazards and their impact on water<br />
system reliability. The MMI team included specialists in structural/earthquake engineering,<br />
geotechnical/foundation engineering, geology and tectonics, engineering seismology, pipeline<br />
performance, hydrology, risk analysis, water resources and economic analysis. To involve the<br />
<strong>Agency</strong>’s staff at all levels and not just management and to obtain their buy-in, a one day<br />
workshop was conducted to discuss the philosophy of the program and its approach and to obtain<br />
feedback. During the course of the work MMI’s engineers interacted with <strong>Agency</strong>’s<br />
maintenance, operations and engineering staff at many levels to obtain intelligence and<br />
operational knowledge of the <strong>Agency</strong>’s system. MMI and <strong>Agency</strong> management staff met with<br />
the <strong>Agency</strong>’s contractors at all significant decision points to receive input.<br />
3 <strong>Local</strong> <strong>Hazard</strong> <strong>Mitigation</strong> <strong>Plan</strong> 1-18-08.doc
1.3.1 <strong>Water</strong> System Reliability Study<br />
The initial phase of the project included identification of all credible natural hazards that could<br />
impact the system. The effects of each hazard (for example, expected ground accelerations in an<br />
earthquake, available fuel for wild fires, flood maps and zones of liquefaction and landslide)<br />
were plotted on a detailed Geographical Information System (GIS) map of the <strong>Agency</strong>’s water<br />
system. This information was used to perform a preliminary assessment of the water system<br />
vulnerabilities to these hazards.<br />
In the preliminary assessment, threats to the system that resulted in the greatest impact in the<br />
<strong>Agency</strong>’s ability to reliably meet its mandate were identified. Since the benefits of hazard<br />
mitigation are a reduction in potential losses, vulnerabilities that could result in greatest losses<br />
were identified with the belief that, if mitigated, they would likely produce the greatest benefits.<br />
The preliminary assessment identified earthquakes and earthquake related hazard as the most<br />
significant hazards to the <strong>Agency</strong>’s infrastructure followed by flood and fire. However, the<br />
vulnerability of <strong>Agency</strong>’s facilities to flood and fire were significantly below the seismic<br />
vulnerability.<br />
Following this preliminary assessment a more comprehensive assessment of <strong>Agency</strong>’s facilities<br />
identified as potentially vulnerable was conducted through detailed structural, geotechnical and<br />
geological analysis including, as needed, subsurface investigations. In this study, which is<br />
nearing completion, the impact of these hazards and system vulnerabilities in terms of water<br />
supply to the <strong>Agency</strong>’s contractors was studied through a detailed hydraulic model of the system.<br />
Based on these assessments a Capital Improvement Program (CIP) has been prepared that<br />
identifies mitigation actions through a combination of pre-hazard planning, system upgrades,<br />
component retrofits and plans for post-hazard repair.<br />
The results of the preliminary and comprehensive assessments were presented to the <strong>Agency</strong> in a<br />
series of reports and technical memoranda. Prior to finalizing, the reports and memoranda were<br />
first submitted to the <strong>Agency</strong> in draft form. [1-7] The draft reports were circulated within the<br />
<strong>Agency</strong> to the Deputy Chief Engineers of the Engineering and Resource <strong>Plan</strong>ning, Maintenance<br />
and Operations Divisions for their comments.<br />
1.3.2 Document Review<br />
This plan has been developed through an extensive review of available information on hazards,<br />
<strong>Agency</strong>’s emergency response plans, [8,9] <strong>Agency</strong>’s urban water management plans, [10]<br />
4 <strong>Local</strong> <strong>Hazard</strong> <strong>Mitigation</strong> <strong>Plan</strong> 1-18-08.doc
engineering drawings and reports for <strong>Agency</strong>’s facilities (Appendix A), historic aerial<br />
photographs and available geotechnical and geologic data both from the <strong>Agency</strong> and outside<br />
sources (for example, California Geological Survey for detailed fault investigation reports,<br />
California Department of Transportation for geotechnical reports).<br />
In addition to the risk assessment of <strong>Agency</strong>’s water supply facilities conducted as part of water<br />
supply reliability improvement program, an overview of the general vulnerabilities of the<br />
<strong>Agency</strong>’s wastewater and flood control facilities is included in the development of this plan.<br />
Other documents such as the FEMA 386 [11-16] series of documents the <strong>Sonoma</strong> <strong>County</strong>’s <strong>County</strong><br />
<strong>Hazard</strong> <strong>Mitigation</strong> <strong>Plan</strong>, [17] and FEMA approved plans for other entities. [18,19]<br />
1.3.3 Public Involvement<br />
Stakeholder involvement during this process included meetings with the <strong>Agency</strong>’s eight primary<br />
water supply contractors to describe the <strong>Agency</strong>’s objectives, solicit input and apprise them of<br />
the findings of the hazard assessments. The <strong>Agency</strong>’s General Manager and Board of Directors<br />
(who are also the <strong>County</strong>’s Board of Supervisors) have also been kept informed of the ongoing<br />
work. To involve the <strong>Agency</strong>’s staff at all levels and not just management and to obtain their<br />
buy-in, a one day workshop was conducted to discuss the philosophy of the program and its<br />
approach and to obtain feedback. During the course of the work MMI’s engineers interacted<br />
with <strong>Agency</strong>’s maintenance, operations and engineering staff at many levels to obtain<br />
intelligence and operational knowledge of the <strong>Agency</strong>’s system.<br />
After completing the preliminary water system reliability study, the <strong>Agency</strong>’s contractors were<br />
briefed in a series of two hour meetings attended by the contractor representatives, MMI Project<br />
Manager and the <strong>Agency</strong>’s Capital Projects Manager and the Deputy Director Engineering and<br />
Resource <strong>Plan</strong>ning. [20-24]<br />
The following additional activities are planned as part of public involvement process:<br />
• The draft hazard mitigation plan posted on the <strong>Agency</strong>’s website on November 6, 2007 for<br />
public review and comment.<br />
• The draft hazard mitigation plan presented to the <strong>Agency</strong>’s <strong>Water</strong> Advisory Committee<br />
(WAC) on November 5, 2007 for review and comment.<br />
• The draft hazard mitigation plan presented to the <strong>Agency</strong>’s Technical Advisory Committee<br />
(TAC) on November 5, 2007 for review and comment.<br />
5 <strong>Local</strong> <strong>Hazard</strong> <strong>Mitigation</strong> <strong>Plan</strong> 1-18-08.doc
• The draft hazard mitigation plan presented to the <strong>Agency</strong>’s contractors for review and<br />
comment as follows:<br />
o City of Santa Rosa, October, 2007<br />
o City of <strong>Sonoma</strong>, October, 2007<br />
o City of Petaluma, October, 2007<br />
o Town of Windsor, October, 2007<br />
o City of Rohnert Park, October, 2007<br />
o City of Cotati, October, 2007<br />
o North Marin <strong>Water</strong> District, October, 2007<br />
o Valley of the Moon <strong>Water</strong> District, October, 2007<br />
• The draft hazard mitigation plan presented to the <strong>Agency</strong>’s Board of Supervisors on January<br />
8, 2008 for review, comment and formal adoption.<br />
No comments on the <strong>Plan</strong> were received from the public. Several minor comments were<br />
received from the <strong>Agency</strong>’s contractors which were incorporated into the <strong>Plan</strong>.<br />
1.4 PLAN ADOPTION<br />
This plan was formally adopted by the <strong>Sonoma</strong> <strong>County</strong> <strong>Water</strong> <strong>Agency</strong> Board of Supervisors on<br />
January 8, 2008. The formal resolution of adoption is included in Appendix B.<br />
6 <strong>Local</strong> <strong>Hazard</strong> <strong>Mitigation</strong> <strong>Plan</strong> 1-18-08.doc
2.0 SONOMA COUNTY WATER AGENCY FACILITIES<br />
2.1 WATER SUPPLY SYSTEM<br />
The <strong>Agency</strong>’s water system is shown in Figure 1 and Figure 1a. The primary source of water for<br />
the <strong>Agency</strong>’s water supply system is a ground water aquifer located in the Mirabel Park area just<br />
north of the town of Forestville. The aquifer is located adjacent to the Russian River and<br />
receives water from the river by natural filtration through an approximately 60 feet thick sand<br />
and gravel riverbed. <strong>Water</strong> from the aquifer is pumped by six Ranney type collector wells and<br />
released into 83 miles of large diameter pipelines (aqueducts) that transmit water throughout the<br />
<strong>Agency</strong>’s service area. Three out of the six collectors are located along the eastern bank of the<br />
river in the Wohler area and are referred to the Wohler collectors, while the remaining three are<br />
located along the western bank of the river in the Mirabel area and are known as the Mirabel<br />
collectors. On the average, the Mirabel and Wohler collectors can provide a sustained flow of<br />
approximately 15 mgd each. In addition to the collector wells, the water supply system has ten<br />
conventional wells (with an average sustained flow of 7 mgd) that supplement the water supply<br />
from the collectors. Seven of these wells are located along the Russian River in the general<br />
vicinity of the collectors, while the remaining three are located in the Laguna De Santa Rosa area<br />
near Sebastopol.<br />
The transmission system has eight booster pump stations that provide the necessary head to<br />
move the water through the system. <strong>Water</strong> storage is provided by 18 steel storage tanks with a<br />
collective storage capacity of 128.8 million gallons. The <strong>Agency</strong> also maintains two major<br />
reservoirs impounded by two large dams (heights of 319 feet and 160 feet), an inflatable rubber<br />
dam, a system of ditches, infiltration ponds and a dike, three water treatment facilities, an electric<br />
power substation, a hydroelectric plant, and several emergency power generators.<br />
The key facilities that constitute <strong>Agency</strong>’s water supply system are summarized below:<br />
• Russian River system – includes the Russian River, the Russian River aquifer and the Warm<br />
Springs and Coyote Valley dams (319 feet high and a 164 feet high earth-fill embankment<br />
dams).<br />
• Diversion system – includes collector wells, inflatable dam, River Diversion Structure<br />
(RDS), Mirabel well field, dikes and diversion channels in the Wohler-Mirabel area and<br />
infiltration ponds.<br />
• Transmission system – includes all of the <strong>Agency</strong>’s aqueducts that transport water from the<br />
<strong>Agency</strong>’s diversion system facilities to storage and to its contractors.<br />
• Storage system – includes 18 storage tanks that provide 128.8 million gallons of storage.<br />
7 <strong>Local</strong> <strong>Hazard</strong> <strong>Mitigation</strong> <strong>Plan</strong> 1-18-08.doc
• Pumping facilities – includes 8 booster stations.<br />
• Treatment facilities – includes three chlorination and corrosion control facilities.<br />
• Power system – includes the electric substation, fixed and portable emergency generators and<br />
the 12kv power line.<br />
• Supplementary facilities – includes Laguna de Santa Rosa wells and the <strong>Agency</strong>’s office and<br />
operations buildings.<br />
• Equipment and non-structural components – Most of the <strong>Agency</strong>’s facilities that include<br />
boosters stations, pump houses at the collectors, chlorination and corrosion control facilities,<br />
wells and office buildings house a range of equipment and non-structural components, which<br />
if unanchored are vulnerable to damage or can either cause injury or damage to an adjacent<br />
critical piece of equipment.<br />
2.2 SANITATION SYSTEM<br />
The <strong>Agency</strong>’s sanitation system includes eight Sanitation Districts and Zones. The service area<br />
for the zones (systems owned by the <strong>Agency</strong>) and districts (independent special districts operated<br />
by the <strong>Agency</strong>) varies from 70 to 4600 acres. Figure 2 shows the location of the 8 sanitation<br />
districts/zones. Each district/zone has its own wastewater collection system that typically<br />
includes gravity flow in pipelines. Out of the eight districts/zones, six have wastewater treatment<br />
plants. The remaining two, the Penngrove Sanitation Zone and the South Park <strong>County</strong> Sanitation<br />
District, collect wastewater and transport it to the City of Petaluma and the City of Santa Rosa<br />
treatment facilities, respectively. The total pipeline length for each district/zone ranges from as<br />
little as one mile for the Occidental <strong>County</strong> Sanitation District to over 100 miles for the <strong>Sonoma</strong><br />
Valley Sanitation District. The <strong>Agency</strong> has 29 lift stations located across these systems. The<br />
wastewater treatment plants treat wastewater to either secondary or tertiary standards and include<br />
a series of aeration basins, settling ponds, clarifiers, holding ponds, chlorination chambers and<br />
dechlorination facilities.<br />
The average dry weather flow for the treatments plants vary from 2000 gallons per day (Sea<br />
Central Sanitation Zone) to 2.8 mgd (<strong>Sonoma</strong> Valley <strong>County</strong> Sanitation District). After<br />
treatment, the wastewater is either used for irrigation or discharged to percolation ponds or<br />
waterways. The Geyserville and Sea Ranch North Sanitation Zone use percolation ponds to<br />
discharge the treated wastewater. Some recycled water from the <strong>Sonoma</strong> Valley <strong>County</strong><br />
Sanitation District is discharged through Shell Slough which ultimately flows into the San Pablo<br />
8 <strong>Local</strong> <strong>Hazard</strong> <strong>Mitigation</strong> <strong>Plan</strong> 1-18-08.doc
Bay. Recycled water from the Russian River <strong>County</strong> Sanitation District and Occidental <strong>County</strong><br />
Sanitation District ultimately flows into the Russian River.<br />
2.3 FLOOD CONTROL SYSTEM<br />
The <strong>Agency</strong>, in cooperation with the United States Army Corps of Engineers (USACE), is<br />
responsible for maintaining specific federal and non-federal flood control improvement projects<br />
on the Russian River. The <strong>Agency</strong>’s flood control works include Lake Mendocino, Lake<br />
<strong>Sonoma</strong>, the Central <strong>Sonoma</strong> <strong>Water</strong>shed Project and the Laguna De Santa Rosa.<br />
Lake Mendocino is located on the East Fork Russian River three miles northeast of Ukiah. It<br />
was formed by the construction of the Coyote Valley Dam by the United States Army Corps of<br />
Engineers (USACE) in 1959. The dam is a 160-foot high rolled earth embankment used for<br />
water storage and flood control purposes. The <strong>Agency</strong> and the Mendocino <strong>County</strong> Russian<br />
River Flood Control and <strong>Water</strong> Conservation Improvement District share permits by the State for<br />
rights to store up to 122,500 acre-feet of water per year in the reservoir. However, the <strong>Agency</strong><br />
has the exclusive right to control the releases of water from the water supply pool in Lake<br />
Mendocino because it was the local sponsor for the dam project. When the water level rises<br />
above the top of the water supply pool and into the flood control pool the USACE assumes<br />
control of releases.<br />
Lake <strong>Sonoma</strong> is located approximately 14 miles northwest of Healdsburg at the confluence of<br />
Warm Springs Creek and Dry Creek. The reservoir was formed by the construction of Warm<br />
Springs Dam, a 319-foot high rolled earth dam, in 1982 by the USACE. Similar to Lake<br />
Mendocino, the <strong>Agency</strong> has exclusive rights to control the rate of release of water from the water<br />
supply pool in Lake <strong>Sonoma</strong>. When the water level in the Lake rises above elevation 451 feet<br />
and goes into the flood control pool, the USACE assumes control of the water release. The<br />
<strong>Agency</strong> has constructed and operates a 2.6 mega watt hydropower plant at the dam.<br />
The Central <strong>Sonoma</strong> <strong>Water</strong>shed Project includes four flood control reservoirs that include the<br />
Santa Rosa Creek Reservoir (Spring Lake), Matanzas Creek Reservoir, Piner Creek Reservoir,<br />
and the Brush Creek Middle Fork Reservoir. Each of these reservoirs are equipped with<br />
appurtenant structures but unlike the Warm Springs and Coyote Valley dams they are not<br />
equipped with flood gates and instead operate passively either as detention basins or bypass<br />
systems. Several waterways have also been shaped and stabilized as part of the Central <strong>Sonoma</strong><br />
<strong>Water</strong>shed Project.<br />
The Laguna de Santa Rosa is a natural overflow basin covering 254 square miles and connects<br />
the Mark West creek and other smaller creeks with the Russian River.<br />
9 <strong>Local</strong> <strong>Hazard</strong> <strong>Mitigation</strong> <strong>Plan</strong> 1-18-08.doc
The <strong>Agency</strong> provides maintenance services for over 150 miles of engineered and natural<br />
channels (creeks) in addition to the maintenance of the Central <strong>Sonoma</strong> <strong>Water</strong>shed reservoirs<br />
and upper Russian River channel and levee maintenance. The <strong>Agency</strong>’s maintenance activities<br />
include debris removal, bank stabilization and protection, maintenance of inlet/outlet structures,<br />
silt removal, vegetation management, levee repair, service road maintenance and dam and<br />
reservoir structure maintenance. The <strong>Agency</strong> also maintains several gauging stations along the<br />
Russian River that provide information on rainfall intensity, river height and discharge that is<br />
essential to flood forecasting.<br />
2.4 EMERGENCY POWER<br />
Electrical power to operate the <strong>Agency</strong>’s booster pumps and equipment is provided by the Power<br />
and <strong>Water</strong> Resources Pooling Authority (PWRPA) and Pacific Gas and Electric Company<br />
(PG&E). Power to the collector wells is provided by an <strong>Agency</strong> owned and operated substation<br />
located at the Wohler Corporation Yard. Power from the substation is supplied to the collectors<br />
at Wohler and Mirabel through a 12-kV power-line that runs along the river and infiltration<br />
ponds as shown in Figure 3.<br />
The <strong>Agency</strong> has provisions to provide emergency electrical power for its main pumps at the<br />
collector wells. Three fixed place emergency generators are located at the Wohler Corporation<br />
Yard. These generators can run any combination of pumps, up to a maximum of six, at both the<br />
Wohler and Mirabel collectors. The Mirabel facility has two fixed place 480 volt, 1100 kW<br />
diesel generators that can operate two of the main pumps at Mirabel. The diesel generators are<br />
fueled by two diesel fuel tanks, a 10,000 and a 25,000 gallon, located at each generator site.<br />
Emergency power to the booster pumping stations and emergency wells can be provided by<br />
portable trailer mounted 480 volt generators. In addition, fixed place diesel generators are also<br />
located at the <strong>Sonoma</strong> No. 2 booster station and the Ely Road booster station.<br />
The Operations and Maintenance Center, Service Center and Administration Buildings at<br />
College Avenue have standby generators that operate automatically when power is lost.<br />
2.5 ADMINISTRATIVE INFRASTRUCTURE<br />
The <strong>Agency</strong> owns two office facilities located on 404 Aviation Boulevard and 2150 West<br />
College Avenue in Santa Rosa. The Aviation Boulevard facility is the Administration Building<br />
and houses a majority of the <strong>Agency</strong>’s engineering, administration, accounting, environmental,<br />
public affairs and executive management staff. The College Avenue facility is occupied by the<br />
operations and maintenance staff, equipment and the supervisory control and data acquisition<br />
10 <strong>Local</strong> <strong>Hazard</strong> <strong>Mitigation</strong> <strong>Plan</strong> 1-18-08.doc
(SCADA) system. The College Avenue facility also has a Service Center where maintenance<br />
and management of <strong>Agency</strong> fleet vehicles and gas-powered equipment is also performed. The<br />
Administration Building is powered by solar photovoltaic panels that have been installed on the<br />
building roof and on ground-mounted power canopy.<br />
11 <strong>Local</strong> <strong>Hazard</strong> <strong>Mitigation</strong> <strong>Plan</strong> 1-18-08.doc
3.1 EARTHQUAKE HAZARD<br />
3.0 HAZARD ASSESSMENT<br />
<strong>Sonoma</strong> <strong>County</strong> is the northernmost of the nine counties that constitute the seismically very<br />
active San Francisco Bay Area. Earthquakes in the Bay Area occur due to a sudden slip on one<br />
of the several major faults of the San Andreas Fault system. The slip releases tremendous<br />
amount of strain energy stored along these faults from the relative movement (approximately 2<br />
inches per year) between the Pacific oceanic plate and the North American continental plate.<br />
When the accumulated strain on the fault reaches the threshold strength of rock in the earth’s<br />
crust, it is released in an earthquake by a sudden rupture of several kilometers along the fault.<br />
Some of the major faults in the San Andreas Fault system include the Hayward, Calaveras, San<br />
Gregorio Fault, Rodgers Creek and Maacama faults. Many of these faults (in particular the San<br />
Andreas and Rodgers Creek Faults) have been seismically active in historical time and have<br />
produced large earthquakes. Figure 4 shows the fault map of the Bay Area.<br />
3.1.1 Historic Seismicity<br />
The Bay Area has experienced at least nineteen earthquakes greater than Magnitude 1 6.0 during<br />
the last 150 years the largest of these has been the April 21, 1906 Great San Francisco<br />
earthquake. [25] The Magnitude 7.8, 1906 earthquake caused extensive damage in the San<br />
Francisco Bay Area including <strong>Sonoma</strong> <strong>County</strong>. Other significant historic earthquakes that<br />
caused substantial damage in the Bay Area include the 1838 earthquake, the 1868 earthquake on<br />
the Hayward Fault and the recent Loma Prieta earthquake in 1989.<br />
For the Bay Area, a plot of moderate to large earthquakes on a time scale (Figure 5) shows that<br />
the seismic activity in the region prior to the 1906 earthquake to be significantly higher than that<br />
following it. Most likely, this is because the 1906 earthquake created a stress shadow by<br />
substantially relaxing stress on all of the Bay Area faults that form the San Andreas Fault<br />
system. [26] As shown in Figure 5 there appears to be an increased earthquake activity in the last<br />
two decades suggesting that the Bay Area might be emerging from the 1906-induced stress<br />
shadow, and that faults that have been quiescent during the past century, may now once again<br />
become more seismically active.<br />
Recent work by the Working Group on California Earthquake Probabilities (WGCEP), a group<br />
of leading scientists, practitioners and academicians has estimated very high probabilities (67%)<br />
1 Magnitude is a quantitative measure of energy released in an earthquake. Due to the logarithmic nature of the magnitude scale, an increase in magnitude by one unit<br />
produces 30 times more energy. A qualitative descriptor of the effects of earthquake on the built environment or those experienced by humans is the Modified<br />
Mercalli Intensity. It ranges from I (not felt) to XII (complete destruction) with intermediate values such as VI described as felt by everyone, many frightened and run<br />
outdoors or IX described as general panic, complete destruction of poorly constructed masonry.<br />
12 <strong>Local</strong> <strong>Hazard</strong> <strong>Mitigation</strong> <strong>Plan</strong> 1-18-08.doc
of a major earthquake in the Bay Area in the next 30 years (Figure 6). The most significant<br />
contributors to this probability are the Hayward and the Rodgers Creek faults, the latter runs<br />
through the <strong>Agency</strong>’s service area and cuts across one of its major pipelines (Figure 7). The<br />
WGCEP has estimated an 18% probability for a major earthquake on the Rodgers Creek fault<br />
and 27% for the Hayward-Rodgers Creek fault system. The probability for these faults is even<br />
higher than the probability of a major earthquake on the San Andreas Fault.<br />
The most recent earthquakes on the Rodgers Creek fault include the October 1, 1969 M 5.6 and<br />
5.7 earthquakes near Santa Rosa. [27-30] The earthquakes occurred within a span of about 2.5<br />
hours and resulted in considerable damage in Santa Rosa including significant damage to water<br />
distribution system including cracks in the Lake Ralphine Dam. Prior to the 1969 events, the<br />
other known earthquake on the fault consists of the 1898 Mare Island event with an estimated<br />
magnitude between 6.2 and 6.7. It is estimated that for the portion of the fault located in the<br />
<strong>Agency</strong>’s service area the average earthquake recurrence interval is on the order of 131-370<br />
years. [31-33]<br />
3.1.2 Surface Fault Rupture <strong>Hazard</strong><br />
In large magnitude earthquakes fault rupture can extend to the ground surface resulting in one<br />
side of the fault moving relative to the other by as much as several feet. Structures located<br />
within the fault rupture zone are subjected to excessive ground deformations. Most structures<br />
are not designed to withstand such large deformations and experience major damage.<br />
From the surface fault rupture hazard viewpoint, the <strong>Agency</strong>’s facilities are most severely<br />
impacted by the Rodgers Creek Fault, which passes through the <strong>Agency</strong>’s service area and cuts<br />
across the Santa Rosa aqueduct near Doyle Park in the City of Santa Rosa. Paleoseismic<br />
observations on the Rodgers Creek fault show the occurrence of three surface-rupturing<br />
earthquakes between about AD 1000 and 1776 with approximately 5.1 to 7.2 m of offset. The<br />
CDMG Special Publication 112, the <strong>Plan</strong>ning Scenario for a major earthquake on the Rodgers<br />
Creek fault prepared by the California Geological Survey [34] considers a Magnitude 7.0<br />
earthquake with an average offset of 3 feet as most likely. Surface displacements on this order of<br />
magnitude are almost certain to rupture the Santa Rosa aqueduct, which is not designed to<br />
withstand such large displacements.<br />
In addition to the Rodgers Creek fault, recent studies by the USGS suggest that the Bennett<br />
Valley Fault, a fault previously considered inactive may be an active structure. This fault is<br />
located in the step over region between Rodgers Creek and Maacama fault and transfers slip<br />
across the two faults (Figure 7). Mapping of the Bennett Valley fault in the Spring Lake area<br />
shows that the fault crosses the <strong>Sonoma</strong> aqueduct and the Oakmont pipeline near the <strong>Sonoma</strong><br />
13 <strong>Local</strong> <strong>Hazard</strong> <strong>Mitigation</strong> <strong>Plan</strong> 1-18-08.doc
ooster stations. The fault is well expressed in this area and crosses beneath the <strong>Sonoma</strong> Booster<br />
Station No. 2. The amount of possible lateral slip and/or vertical offset across the mapped fault<br />
traces is currently unknown but the inferred high slip rate [35] suggests a correspondingly high<br />
potential for surface fault rupture.<br />
3.1.3 Strong Ground Shaking<br />
Seismic waves generated as a result of fault rupture propagate through the earth’s crust from the<br />
rupture front and cause strong shaking of the ground. The intensity of ground shaking at a<br />
particular location is measured in terms of ground acceleration, which generally decreases with<br />
distance from the earthquake source unless modified by local subsurface conditions. The<br />
maximum acceleration recorded at a site is referred to as the peak ground acceleration (PGA)<br />
and is reported as a fraction of earth’s gravitational acceleration (g). The total force experienced<br />
by a structure can be related directly to the level of acceleration it experiences.<br />
The distance of the <strong>Agency</strong>’s facilities from the nearest major Bay Area faults is shown in Table<br />
1. The table also shows the expected PGA at each of the <strong>Agency</strong>’s facilities from a maximum<br />
earthquake on these faults. In addition, the table also lists the PGA values estimated by the<br />
United States Geological Survey (USGS) for a 10% probability of exceedence in 50 years (mean<br />
return period of 475 years). This probability level is typically used in seismic design of<br />
structures and forms the basis of the 1997 Uniform Building Code (UBC). The table shows that<br />
the estimated median PGA values at the <strong>Agency</strong>’s facilities range between 0.3g to 0.8g. Figure 8<br />
shows the <strong>Agency</strong>’s system together with a plot of USGS estimates of PGA contours in <strong>Sonoma</strong><br />
<strong>County</strong>. Because of their proximity to the Rodgers Creek fault, the Kawana and Ralphine tanks<br />
and the <strong>Sonoma</strong> booster station have the highest predicted ground motions.<br />
14 <strong>Local</strong> <strong>Hazard</strong> <strong>Mitigation</strong> <strong>Plan</strong> 1-18-08.doc
Diversion Facilities 10.9 0.29 0.44 0.40<br />
Occidental Road Well 9.8 0.38 0.58 0.42<br />
Sebastopol Road Well 9.8 0.38 0.58 0.42<br />
Todd Road Well 9.1 0.40 0.61 0.42<br />
Ralphine Tanks 3.3 0.67 1.03 0.57<br />
Cotati Tanks 8.8 0.41 0.63 0.46<br />
Forestville Tank 11.4 0.33 0.51 0.40<br />
Annadel No. 1 Tank 6.4 0.51 0.78 0.46<br />
Annadel No. 2 Tank 8.3 0.43 0.66 0.46<br />
Eldridge Tanks 8.5 0.42 0.65 0.41<br />
<strong>Sonoma</strong> Tanks 7.0 0.48 0.74 0.42<br />
Kastania Tank 7.8 0.45 0.69 0.51<br />
Kawana Springs Tank 1.0 0.77 1.19 0.54<br />
Forestville Booster Station 11.4 0.33 0.51 0.40<br />
<strong>Sonoma</strong> Booster Station 4.1 0.63 0.96 0.57<br />
Ely Booster Station 6.8 0.49 0.75 0.53<br />
Eldridge Booster Station 8.5 0.42 0.65 0.41<br />
Wilfred Booster Station 5.5 0.55 0.85 0.51<br />
Kastania Booster Station 7.8 0.45 0.69 0.51<br />
Kawana Booster Station 6.9 0.48 0.75 0.48<br />
River Road Chlorination Facility 11.4 0.33 0.51 0.40<br />
Mirabel Chlorination Facility 12.0 0.32 0.49 0.40<br />
Wohler Chlorination and Corrosion Control Facility 10.0 0.37 0.57 0.40<br />
Note: The peak ground acceleration values are for rock conditions<br />
Deterministic ground motions were computed using the Abrahamson and Silva attenuation relationship [36]<br />
Probabilistic ground motions computed by USGS were based on an average of multiple attenuation equations including the<br />
Abrahamson and Silva<br />
3.1.4 Liquefaction and Lateral Spread<br />
Liquefaction is a phenomenon in which loose granular soils saturated with water lose their ability<br />
to carry load when subjected to strong shaking. The shaking causes an increase in pressure<br />
exerted by the entrapped water within the pores of soil matrix and causes the soil to flow as a<br />
liquid. This subsurface process manifests itself in the form of large ground deformation and sand<br />
volcanoes at the ground surface. When liquefaction occurs near a free face such as a stream or<br />
river bank large horizontal movement of ground can occur as the overlying soil layers slide over<br />
the liquefied layer towards the free face. This phenomenon known as lateral spread is very<br />
detrimental to buried pipelines and pose a much greater hazard to facilities and pipelines than<br />
liquefaction alone [37,38] . Lateral spreads can develop on gentle slopes (less than 3 degrees) and<br />
may produce horizontal displacements of as much as tens of feet. [39]<br />
The potential for liquefaction depends on both the susceptibility of a soil deposit to liquefy as<br />
well as the opportunity for ground motions to exceed a specified threshold level. Given the<br />
proximity of <strong>Sonoma</strong> <strong>County</strong> to the San Andreas and Rodgers Creek faults, virtually all parts of<br />
15 <strong>Local</strong> <strong>Hazard</strong> <strong>Mitigation</strong> <strong>Plan</strong> 1-18-08.doc
the <strong>County</strong> are exposed to long duration peak ground accelerations in excess of 0.15g (Figure 8).<br />
To assess the liquefaction and lateral spread hazard to the <strong>Agency</strong>’s facilities, potentially<br />
liquefiable soils that consist of young alluvial deposits and artificial fill present within the<br />
<strong>Agency</strong>’s service area are overlain on the <strong>Agency</strong>’s water supply system as shown in Figure 9.<br />
The figure also shows locations where the pipelines cross streams and open slope faces. Such<br />
stream crossing locations coupled with high liquefaction potential have a very high likelihood of<br />
lateral spread and resulting pipeline damage.<br />
All of the <strong>Agency</strong> facilities that lie in areas marked as moderate, high and very high will likely<br />
experience liquefaction because the estimated ground acceleration at all <strong>Agency</strong> facilities is<br />
greater than 0.3g, the triggering threshold for a moderate susceptibility rating. As shown in<br />
Figure 9, significant portions of the <strong>Agency</strong>’s system are vulnerable to liquefaction. Areas of<br />
high and very high liquefaction potential exist at collector sites, Mirabel well-field and Ely<br />
booster station. A high susceptibility to liquefaction exists along the transmission lines, the<br />
Wohler Intertie, most of the Santa Rosa aqueduct, significant portions of Petaluma<br />
aqueduct and localized areas of the Cotati and <strong>Sonoma</strong> aqueduct. Creek crossings along<br />
these portions of the transmission lines, as shown in Figure 9, have a very high potential for<br />
damage due to the potential for lateral spread. The main power line from the Wohler<br />
substation to the collectors is also located in an area of very high liquefaction potential.<br />
3.1.5 Earthquake Induced Landslides<br />
Earthquake-induced slope failures or landslides commonly occur over wide areas on hill slopes<br />
during large (magnitude 6.5 or larger) earthquakes and can produce significant damage. The<br />
most common earthquake-induced failures are rockfalls, rock and soil slides, and soil<br />
avalanches, slumps and flows. Rockfalls, avalanches, and flow-type failures are especially<br />
hazardous because they often occur rapidly and travel great distances from the point of initiation.<br />
These types of rapid failures present significant impact to structures sited on slopes or valley<br />
areas downhill from the initiation site, and can distort or break shallow-buried pipelines crossing<br />
the sliding plane of the slope failure.<br />
The opportunity for seismically induced slope failure is dependent on the potential for<br />
appropriately high levels of ground shaking to initiate movement. The susceptibility for failure<br />
is based on conditions that predispose the slope to failure including static stability, local geology,<br />
slope inclination, groundwater conditions, rock strength, and the duration and intensity of<br />
shaking. The potential for landslides is higher during seasonal wet periods when hill slopes are<br />
saturated with water.<br />
16 <strong>Local</strong> <strong>Hazard</strong> <strong>Mitigation</strong> <strong>Plan</strong> 1-18-08.doc
Figure 10 shows the USGS regional landslide hazard mapping for <strong>Sonoma</strong> <strong>County</strong>. Though<br />
various workers have mapped the geology of the study area, most published geologic maps of the<br />
<strong>Agency</strong>’s service area do not delineate active or recently active landslides or slope failures.<br />
Therefore, there is a possibility of small localized landslides that could result in damage to<br />
pipelines especially along the runs that connect to the tanks located on hills.<br />
Figure 10 shows that most of the <strong>Agency</strong>’s water system is located outside of active<br />
landslide areas with only a few locations such as a portion of the Santa Rosa aqueduct near<br />
the collectors, a small potion of the Russian River-Cotati Intertie south of Forestville tanks<br />
and areas near the Kastania, Eldridge, Cotati and Annadel No. 2 tanks may be somewhat<br />
susceptible to landslide hazard. However, more detailed assessments show that the<br />
landslide hazard at these locations is low.<br />
3.2 FLOOD HAZARD<br />
Flooding is defined as the overflow of excess water from a water body onto adjacent floodplain<br />
lands. Flooding typically results from large-scale weather systems generating prolonged rainfall<br />
or on-shore winds. Other causes of flooding include locally intense thunderstorms, snowmelts,<br />
ice jams and dam failures. Floods are capable of undermining buildings and bridges, eroding<br />
shorelines and riverbanks, tearing out trees, washing out access routes, and causing loss of life<br />
and injuries.<br />
Flash floods pose more significant safety risks than other riverine floods because of the rapid<br />
onset, the high velocity of water, the potential for channel scour, debris load and increase in<br />
turbidity of water that can directly impact the <strong>Agency</strong>’s water supply. In addition, more than one<br />
flood crest may result from a series of fast moving storms.<br />
<strong>Sonoma</strong> <strong>County</strong> has had significant flooding in the past and is expected to have floods in the<br />
future. Table 2 shows the highest recorded flood levels between 1955 and 1996 at the Hacienda<br />
Bridge on the Russian River. Flood water getting as high as approximately 15 feet above the<br />
flood level (34 feet) has occurred in the past.<br />
17 <strong>Local</strong> <strong>Hazard</strong> <strong>Mitigation</strong> <strong>Plan</strong> 1-18-08.doc
1 February 18, 1986 48.56<br />
2 January 9-10, 1995 48.01<br />
3 December 23, 1955 46.95<br />
4 December 23, 1964 46.85<br />
5 January 1, 1997 45.10<br />
6 January 5, 1966 42.53<br />
7 March 10, 1995 42.24<br />
8 January 27, 1983 41.63<br />
9 January 24, 1970 41.20<br />
10 February 1, 1963 40.95<br />
Flood level at Hacienda Bridge = 34 feet<br />
Figure 11 shows the flood hazard within the <strong>Agency</strong>’s service area prepared by the Federal<br />
Emergency Management <strong>Agency</strong> (FEMA). These maps use computed or estimated water<br />
surface elevations combined with topographic mapping data to represent the flood hazard. The<br />
100-year flood represents a compromise between minor floods and the greatest flood likely to<br />
occur in a given area. In most cases the 100 year flood is less than the flood of record and has<br />
been widely adopted as the common design and regulatory standard in the US. It was formally<br />
established as a standard for use by Federal agencies in 1977 and later confirmed by FEMA in<br />
1982.<br />
Figure 11 shows the <strong>Agency</strong>’s system overlain on the FEMA flood maps. The figure also shows<br />
the locations where the pipelines cross creeks. These locations together with areas of high flood<br />
hazard are at the highest risk of damage due to channel scour. Debris flow in streams and the<br />
potential for bottom scour and the resulting pipeline damage is also a potential hazard. As<br />
shown in the figure, the <strong>Agency</strong> facilities with the highest risk of flooding include those<br />
located in the Mirabel and Wohler area, Ely booster station, the Sebastopol and Todd<br />
Road wells, significant sections of the Russian River-Cotati Intertie, Forestville aqueduct<br />
and Wohler Intertie and some portions of the Santa Rosa aqueduct. Stream crossing<br />
locations of the transmission lines located in the areas of high flood hazard are most<br />
vulnerable to damage due to flood related scour. In addition, there are three locations<br />
where a pipeline is suspended from a bridge at the stream crossing location. At these<br />
locations, the pipeline is vulnerable to damage by impact from floating debris.<br />
18 <strong>Local</strong> <strong>Hazard</strong> <strong>Mitigation</strong> <strong>Plan</strong> 1-18-08.doc
3.3 GEO-HAZARDS<br />
3.3.1 Landslides<br />
Hillslopes along the <strong>Agency</strong>’s pipeline corridors and their facilities have been modified by mass<br />
wasting processes, including landslides, debris flows, soil creep, gully and stream erosion, and<br />
sheet wash. These processes are episodic, with failures typically occurring during or shortly<br />
after periods of heavy precipitation. Types of slope failure that are usually caused by prolonged<br />
rainfall include rotational slumps, earthflows, and rapidly moving debris flows. Figure 12 shows<br />
historic landslides in <strong>Sonoma</strong> <strong>County</strong> during El Nino storms of 1997-1998.<br />
Most of the landslides present along the <strong>Agency</strong>’s pipeline corridors fall into two primary types:<br />
(1) rotational and translational landslides involving bedrock and colluvium, and (2) debris or<br />
earth flows involving colluvium.<br />
Rotational and translational landslides pose the primary slope stability hazard along the pipeline<br />
corridors. The landslides commonly are distinguished by vegetation changes and characteristic<br />
slope morphology, including undulating, hummocky ground surface. Deep rotational and<br />
translational landslides typically involve underlying bedrock and are mainly associated with<br />
steep slopes greater than 15˚ and showing signs of water seepage. As shown in Figure 10 the<br />
overall landslide hazard within the <strong>Agency</strong>’s water system is low.<br />
Debris and/or earthflows typically occur where colluvium collects in topographic swales on<br />
hillslopes. During heavy rainfall, saturated colluvium may flow rapidly down drainage channels.<br />
Poorly sorted debris within a flow may be deposited where the slope angle decreases or may<br />
increase in volume with distance traveled downslope. The primary potential hazard posed by<br />
debris flows to the pipeline is the relatively rapid movement of soil surrounding the pipeline, and<br />
associated displacement of the pipeline. Pipeline displacement is more likely at the debris-flow<br />
headscarp than in lower parts of a debris flow. Figure 13 shows debris flow hazard in <strong>Sonoma</strong><br />
<strong>County</strong> mapped by the USGS. Because debris flow travels downslope and downstream from the<br />
source area, the hazard associated with debris flow extends beyond the mapped areas. The map<br />
also shows debris-flow sources (represented by black dots on the map) mapped after the major<br />
storms of January 1992.<br />
3.3.2 Corrosive Soils<br />
Potential external corrosion hazards to pipeline systems are dependent in part on the conductivity<br />
of the ground and the corrosive nature of soils in which the pipeline is buried. Corrosivity of<br />
soils is dependent on soil texture, soil pH, moisture content, and geochemical composition of<br />
19 <strong>Local</strong> <strong>Hazard</strong> <strong>Mitigation</strong> <strong>Plan</strong> 1-18-08.doc
fluids within the soil. These factors, in turn, are influenced by the physical and mineralogic<br />
composition of soils. Soil composition often is directly derived from the characteristics of the<br />
underlying geologic deposits on which they develop. Silty and clayey soils tend to have the<br />
highest corrosion potential in contrast with granular soils (sands and gravels). In addition, the<br />
topography of the land, depth to groundwater, and native vegetation all influence the soil<br />
corrosivity potential.<br />
Although soil corrosivity can exist within a broad range of soil conditions, the extent of acidity<br />
or alkalinity of a soil, as expressed by pH, directly influences corrosion susceptibility. Soil with<br />
pH generally less than 9.0 has been found to be among the more corrosive types. Typically soils<br />
with a pH of 0.0 to 4.0 are acidic and, where saturated, can serve as a corrosive electrolyte. Soils<br />
with a near neutral pH of 6.5 to 7.5 and low Redox conditions are optimum for sulfate reduction<br />
by bacteria, which can cause localized corrosion.<br />
Soil resistivity also has a strong influence on the corrosion rate. Generally, the higher the<br />
resistivity of the soil, the lower is its corrosion rate. Soil resistivity arises from a number of<br />
factors, but fine-grained soils (silts and clays) typically have the lowest resistivities and thus the<br />
greatest corrosion susceptibility.<br />
The distribution and type of soils within the <strong>Agency</strong>’s service areas were digitized from<br />
Department of Agriculture Soil Conservation Service (SCS) county soil report. Soils are<br />
generally sampled only to a depth of 5 to 6 feet (most pipelines are buried within this zone);<br />
therefore, soil descriptions are limited to that depth and may not be representative of deeper soil<br />
conditions. Soil surveys typically generalize soil properties and thus soil corrosivity estimates<br />
likely are conservative. In the SCS report, soil unit codes were referenced to the shrink-swell<br />
and corrosivity engineering properties and the corrosion potential as Low, Medium, or High.<br />
Corrosivity values compiled from SCS soil surveys, although unitless, are calculated by the SCS<br />
based on the rate uncoated steel and concrete might corrode when buried in a soil. These index<br />
values are derived from soil texture, drainage, acidity, and electrical conductivity data. Both<br />
sets of values are depicted in the soil corrosion maps for the <strong>Agency</strong>’s service area as shown in<br />
Figure 14 and Figure 15. The figures show that except for the <strong>Sonoma</strong> aqueduct, which has<br />
a limited exposure to corrosive soils, all of the <strong>Agency</strong>’s aqueducts lie in highly corrosive<br />
soils. The <strong>Agency</strong> has an active corrosion control program, and as a result there are no<br />
indications of prevalent corrosion related damage to the transmission system. The<br />
<strong>Agency</strong>’s corrosion control program consists of maintaining cathodic protection systems on<br />
all of its aqueducts. These systems employ either impressed current or sacrificial anodes.<br />
The <strong>Agency</strong> has an anode testing program that ensures that anodes are replaced as they<br />
20 <strong>Local</strong> <strong>Hazard</strong> <strong>Mitigation</strong> <strong>Plan</strong> 1-18-08.doc
are consumed by the system. No mitigation measures were identified in the planning<br />
process due to the <strong>Agency</strong>’s on-going maintenance program.<br />
3.4 FIRE HAZARD<br />
Fire is relevant to the <strong>Agency</strong>’s system from two perspectives: (a) potential damage that fires<br />
may directly cause to the <strong>Agency</strong>’s facilities, and (b) fire fighting demands on the <strong>Agency</strong>’s<br />
system – that is, the emergency water supply needs of fire departments who may be relying on<br />
the <strong>Agency</strong> to supply that water. Both aspects are driven by the fire hazard in <strong>Sonoma</strong> <strong>County</strong>.<br />
Periodic fires are part of the natural environment and consist of four categories that include<br />
wildland fires, urban-wildland interface fires, firestorms and prescribed fires. Wildfires are<br />
fueled by naturally occurring trees, brush and grasses; the urban-wildland interface fires are<br />
fueled by vegetation and built environment; firestorms occur during extreme weather and<br />
generally burn until conditions change or the available fuel is exhausted and; prescribed fires are<br />
controlled burns intentionally set for fire management.<br />
The behavior of wildfires is impacted by three principal factors that include topography, fuel and<br />
weather. Topography is important because the movement of air over the terrain tends to direct a<br />
fire’s course and gulches and canyons can funnel air and act as a chimney. Saddles and<br />
ridgetops tend to offer lower resistance to the passage of air and will draw fires. <strong>Water</strong> tanks,<br />
which are usually located on ridgetops are, therefore, susceptible to fire with south facing slopes<br />
being more susceptible because they receive higher solar radiation. Steeper uphill slopes tend to<br />
increase the rate of spread, whereas downhill slopes tend to slow down the rate of spread.<br />
Fuel for fires is provided by the amount of vegetative material available. Different fuels have<br />
different burn qualities. For example grasses, release little energy but can sustain very high rates<br />
of spread. Moisture and continuity of fuel is also very important for the spread of fire.<br />
Figure 16 shows the fire threat map in <strong>Sonoma</strong> <strong>County</strong> prepared by the California Department of<br />
Forestry. The map shows five threat classes that range from no threat to extreme threat. The<br />
figure shows that most of the <strong>Agency</strong>’s water system is in an area of low fire hazard except for<br />
the facilities in the Wohler and Mirabel area. The figure also shows a high fire threat near the<br />
Annadel No. 2 tank. However, a more detail examination during the site reconnaissance<br />
confirmed a low fire hazard because of a clearing zone around the facilities. The <strong>Agency</strong> has an<br />
active maintenance program to address such issues. Furthermore, since the <strong>Agency</strong> is a<br />
wholesaler it does not have direct responsibility for fire fighting.<br />
21 <strong>Local</strong> <strong>Hazard</strong> <strong>Mitigation</strong> <strong>Plan</strong> 1-18-08.doc
Table 3 shows some of the major fires in <strong>Sonoma</strong> <strong>County</strong> that burned over 1,000 acres. The<br />
burn area of these fires is shown in Figure 17. The figure shows that none of these historic fires<br />
have impacted the <strong>Agency</strong>’s service area.<br />
22 <strong>Local</strong> <strong>Hazard</strong> <strong>Mitigation</strong> <strong>Plan</strong> 1-18-08.doc
Series: Hanly, Mt. George, Nunns Canyon in Napa and <strong>Sonoma</strong> <strong>County</strong> 71,500<br />
Sep-64 Hanly (<strong>Sonoma</strong> <strong>County</strong>) 52,700<br />
Nunns Canyon (<strong>Sonoma</strong> <strong>County</strong>) 10,400<br />
Series of nine fires in Glenn, Napa and <strong>Sonoma</strong> <strong>County</strong> 113,766<br />
Knight's Valley (<strong>Sonoma</strong> <strong>County</strong>) 6,000<br />
Pocket Ranch (<strong>Sonoma</strong> <strong>County</strong>) 4,000<br />
1965<br />
Arrowhead (<strong>Sonoma</strong> <strong>County</strong>) 4,000<br />
Chileno Valley (<strong>Sonoma</strong> <strong>County</strong>) 5,000<br />
Pressley (<strong>Sonoma</strong> <strong>County</strong>) 5,500<br />
Coleman Valley (<strong>Sonoma</strong> <strong>County</strong>) 1,500<br />
Austin Creek (<strong>Sonoma</strong> <strong>County</strong>) 7,000<br />
1972 Bradford 1,760<br />
Aug-78 Creighton Ridge 11,405<br />
Aug-88 Cloverdale 1,833<br />
Sep-88 Geysers 9,000<br />
Aug-96 Cavedale 2,100<br />
Oct-99 Geyser Road 1,300<br />
Jun-00 Berryessa (Napa and <strong>Sonoma</strong>) 5,731<br />
Sep-04 Geysers (<strong>Sonoma</strong> and Lake) 12,525<br />
Because of the wholesale nature of the <strong>Agency</strong>’s transmission system, the <strong>Agency</strong> does not have<br />
a direct responsibility to provide fire water, except for a very limited number of fire hydrants<br />
located along the <strong>Agency</strong>’s aqueducts.<br />
3.5 DROUGHT<br />
Unlike typical natural disasters such as earthquakes, floods or fires, drought occurs gradually<br />
over a multi-year period. One dry year does not normally constitute a drought in California. For<br />
example the driest single year of California's measured hydrologic record was 1977. California's<br />
[40, 41]<br />
most recent multi-year statewide drought was 1987-1992. The <strong>Agency</strong>’s extensive system<br />
of water supply infrastructure -- its reservoirs, groundwater basins, and inter-regional<br />
conveyance facilities -- mitigates the effect of short-term dry periods for most water users in its<br />
service area.<br />
Defining when a drought begins is a function of drought impacts to water users and therefore,<br />
there is no universal definition of when a drought begins or ends. Impacts of drought are<br />
typically felt first by those most reliant on annual rainfall -- ranchers engaged in dryland grazing,<br />
rural residents relying on wells in low-yield rock formations, or small water systems lacking a<br />
reliable source. Drought impacts increase with the length of a drought, as carry-over supplies in<br />
reservoirs are depleted and water levels in groundwater basins decline.<br />
The historical record of California hydrology is brief in comparison to the time period of<br />
geologically modern climatic conditions. As a result, measured hydrologic data for droughts<br />
23 <strong>Local</strong> <strong>Hazard</strong> <strong>Mitigation</strong> <strong>Plan</strong> 1-18-08.doc
prior to 1900 are minimal. Multi-year dry periods in the second half of the 19th century can be<br />
qualitatively identified from the limited records available combined with historical accounts but<br />
the severity of the dry periods cannot be directly quantified. Paleoclimatology data based on tree<br />
ring studies suggest sustained drought throughout much of the continental U.S. during the mid-<br />
1500s that may have lasted as long as 50 years. In addition, some climate researchers describe a<br />
“Medieval Megadrought” to describe a series of long duration droughts in the Western U.S.<br />
during the 900 to 1400 A.D. time period. Researchers identified two epic drought periods from<br />
these remains, one lasting more than two centuries prior to A.D. 1112, and the other lasting more<br />
than 140 years prior to 1350.<br />
Droughts, in California within the recorded history, that span over several years include: 1912-<br />
1913, 1918-1920, 1923-1924, 1929-1934, 1947-1950, 1959-1961, 1976-1977, and 1987-1992.<br />
The criteria commonly used in designing storage capacity and yield of large Northern California<br />
reservoirs was established as a result of the 1929-1934 drought. The 1987-1992 drought was<br />
notable for its six-year duration and the statewide nature of its impacts. However, droughts<br />
exceeding three years are relatively rare in Northern California, the source of much of<br />
California's developed water supply.<br />
In the 1987-1992 drought, water users served by most of the State’s larger suppliers did not<br />
begin to experience shortages until the third or fourth years of the drought. Reservoir storage<br />
provided a buffer against drought impacts during the initial years of the drought. During this<br />
time period groundwater extraction increased substantially and wells or springs serving several<br />
small water systems in the Russian River corridor went dry such that water haulage became<br />
necessary.<br />
Droughts can have a significant impact on society that can include lost jobs and revenues in the<br />
landscaping and nursery industries, unemployment and other socioeconomic impacts in farming<br />
dependent regions, increased risk of wildfire, additional cost for homeowners to replace lawns<br />
and landscaping, loss of forests, decline in fish population, lost revenues to water based<br />
recreation businesses and reduced hydroelectric power generation. Droughts result in a decline<br />
of revenues and an increase in operational costs for water agencies. The former occurs due to<br />
voluntary or mandatory reductions in water use and the later due to additional cost of purchasing<br />
water, deepening wells, or implementing water education and conservation campaigns.<br />
It is not easy to predict droughts because climate is inherently variable and predicting drought<br />
depends on the ability to forecast two fundamental meteorological surface parameters,<br />
precipitation and temperature. Anomalies of precipitation and temperature may last from several<br />
months to several decades and how long they last depends on many factors such as air–sea<br />
interactions, soil moisture and land surface processes. Generally, the immediate cause of<br />
24 <strong>Local</strong> <strong>Hazard</strong> <strong>Mitigation</strong> <strong>Plan</strong> 1-18-08.doc
drought is the predominant sinking motion of air (subsidence) that results in compressional<br />
warming or high pressure, which inhibits cloud formation and results in lower relative humidity<br />
and less precipitation. Much of California enjoys a Mediterranean-like climate with cool, wet<br />
winters and warm, dry summers. An atmospheric high pressure belt results in fair weather for<br />
much of the year, with little precipitation during the summer. The high pressure belt shifts<br />
southward during the winter, placing the State under the influence of Pacific storms bringing rain<br />
and snow. Most of California’s moisture originates in the Pacific Ocean. As moisture-laden air<br />
moves over mountain barriers such as the Sierra Nevada, the air is lifted and cooled, dropping<br />
rain or snow on the western slopes. This orographic precipitation is important for the State’s<br />
water supply. The majority of California’s groundwater production occurs from alluvial<br />
materials in the large basins. Groundwater levels in such basins typically decline during droughts<br />
due to increased extractions.<br />
The fundamental drought impact to water agencies is a reduction in available water supplies. As<br />
a result, historic occurrences of drought have encouraged water agencies to review the reliability<br />
of their water supplies and to initiate planning programs addressing identified needs for<br />
improvement. In addition, public and media interest in droughts fosters heightened awareness of<br />
water supply reliability issues in the Legislature. More than 50 drought-related legislative<br />
proposals were introduced during the severe, but brief 1976-77 drought. About one-third of these<br />
eventually became law. Similar activity on drought-related legislative proposals was observed<br />
during the 1987-92 drought. One of the most significant pieces of legislation was the 1991<br />
amendment to the Urban <strong>Water</strong> Management and <strong>Plan</strong>ning Act, in effect since 1983, which<br />
requires water suppliers to estimate available water supplies at the end of one, two, and three<br />
years, and to develop contingency plans for shortages of up to 50 percent. The <strong>Sonoma</strong> <strong>County</strong><br />
<strong>Water</strong> <strong>Agency</strong>’s 2005 Urban <strong>Water</strong> Management <strong>Plan</strong> (SCWA, 2006) presents water supply to<br />
demand comparisons through 2030. The plan also presents water supply to demand comparisons<br />
for single dry to multiple dry year scenarios. The comparisons show that the <strong>Agency</strong> has<br />
adequate supply through 2030. For dry years, water demands exceed supply starting in 2020 but<br />
the <strong>Agency</strong> has developed plans to work with its contractors to reduce demands.<br />
3.6 OTHER HAZARDS<br />
Table 4 shows major weather related events in <strong>Sonoma</strong> <strong>County</strong>. Description for some of the<br />
most significant weather related hazards is provided in the following sections.<br />
25 <strong>Local</strong> <strong>Hazard</strong> <strong>Mitigation</strong> <strong>Plan</strong> 1-18-08.doc
Blowing Dust<br />
November 2, 1994 5:21 AM N/A 0 0 0 0<br />
November 10, 1994 10:43 PM N/A 0 0 0 0<br />
December 2, 1994 11:22 AM N/A 0 0 0 0<br />
December 3, 1994 1:20 PM N/A 0 0 0 0<br />
Dense Fog<br />
December 8, 1994 12:45 PM N/A 0 0 0 0<br />
December 9, 1994 5:04 PM N/A 0 0 0 0<br />
December 10, 1994 6:18 AM N/A 0 0 0 0<br />
Excessive Heat<br />
August 15, 1996 4:00 PM N/A 4 0 0 0<br />
June 14, 2000 12:00 PM N/A 9 102 0 0<br />
February 4, 1996 10:00 AM N/A 0 0 0 0<br />
February 2, 1998 6:50 PM N/A 0 0 $2.0M 0<br />
February 3, 1998 4:00 AM N/A 0 0 $5.0M 0<br />
February 3, 1998 9:30 AM N/A 0 1 $200K $159K<br />
February 5, 1998 6:00 PM N/A 0 0 0 0<br />
February 6, 1998 12:22 PM N/A 0 0 0 0<br />
February 7, 1998 1:18 PM N/A 0 0 0 0<br />
Flash Flood<br />
February 13, 2000 9:00 PM N/A 0 0 0 0<br />
January 20, 1993 7:15 AM N/A 0 0 $500K 0<br />
March 9, 1995 10:34 AM N/A 0 0 $3.5M $0.5M<br />
December 31, 1996 7:00 PM N/A 1 0 0 0<br />
January 3, 1997 8:00 PM N/A 1 0 0 0<br />
February 13, 2000 10:00 AM N/A 0 0 0 0<br />
January 11, 2001 10:00 AM N/A 0 0 $7.0M 0<br />
December 16, 2002 2:00 AM N/A 0 0 0 0<br />
Hail December 9, 2003 11:15 PM 0.75 in. 0 0 0 0<br />
December 12, 1995 2:45 AM N/A 0 0 0 0<br />
December 29, 1996 12:00 AM N/A 0 0 0 0<br />
Heavy Rain<br />
January 2, 1998 4:00 AM N/A 0 1 0 0<br />
January 1, 2002 3:00 AM N/A 0 0 $200K 0<br />
December 15, 2002 8:00 PM N/A 0 0 0 0<br />
Heavy Snow February 11, 2001 8:00 AM N/A 0 0 0 0<br />
July 16, 1996 3:30 PM 35 kts. 1 0 0 0<br />
November 29, 1998 10:00 PM 75 kts. 0 0 $1.8M 0<br />
February 9, 1999 11:00 AM 60 kts. 0 0 $1.0M 0<br />
April 3, 1999 8:00 AM 85 kts. 1 2 0 0<br />
February 13, 2000 10:00 AM 0 kts. 0 0 $250K 0<br />
March 19, 2000 3:10 PM 72 kts. 0 0 $250K 0<br />
High Wind<br />
October 21, 2000 9:45 PM 97 kts. 0 1 0 0<br />
March 4, 2001 10:54 AM 71 kts. 0 0 $2.7M 0<br />
November 24, 2001 7:00 AM 85 kts. 0 0 $7.1M 0<br />
November 7, 2002 4:00 PM 100 kts. 0 0 $1.0M 0<br />
December 30, 2002 11:21 PM 63 kts. 0 0 $600K 0<br />
December 14, 2003 4:33 AM 61 kts. 0 0 0 0<br />
February 25, 2004 8:29 AM 58 kts. 0 0 0 0<br />
February 4, 1993 9:00 PM 0 kts. 0 0 $500K 0<br />
Lightining January 25, 2001 12:00 PM N/A 0 1 $1.0M 0<br />
Storm Surge February 25, 2004 10:00 AM N/A 0 0 0 0<br />
June 1, 1958 7:55 AM F2 0 0 $25K 0<br />
February 17, 1959 6:45 AM F 0 0 $3K 0<br />
November 10, 1964 3:34 AM F 0 0 $3K 0<br />
February 27, 1983 7:20 AM F1 0 0 $25K 0<br />
Tornado<br />
December 2, 1992 5:00 PM F1 0 0 $25K 0<br />
December 2, 1992 5:00 PM F1 0 0 $25K 0<br />
December 2, 1992 5:00 PM F1 0 0 $250K 0<br />
February 22, 1996 1:00 AM F1 0 0 0 0<br />
December 23, 1996 11:30 AM F0 0 1 $1K 1K<br />
December 5, 1998 6:20 PM F1 0 0 $1.0M 0<br />
February 16, 1994 8:00 PM N/A 0 0 $500K 0<br />
Winter Storm<br />
December 9, 1995 10:00 AM N/A 1 15 $60.0M 5.0M<br />
March 10, 1995 5:09 AM N/A 0 0 0 0<br />
26 <strong>Local</strong> <strong>Hazard</strong> <strong>Mitigation</strong> <strong>Plan</strong> 1-18-08.doc
3.6.1 Tornadoes<br />
While California does have tornadoes, it is relatively low-risk compared to states in the<br />
Midwestern and Southern United States as shown in Figure 18. [42]<br />
Since 1950, 292 tornadoes have occurred in 42 counties in California, resulting in 103 injuries.<br />
However, no deaths have occurred, and none of the California tornadoes since 1950 have been<br />
over F2 on the Fujita Scale (see Table 5). Of these 292 tornadoes, only eight percent reached F2,<br />
whereas 53 percent were at F0, the least severe type and 39 percent reached F1. No major<br />
tornadoes (those of F3-F6) have occurred after 1880 in California. The biggest risks of tornadoes<br />
in California include light to moderate damage to homes, destruction of mobile homes, and<br />
injuries caused by light object projectiles during F2 scale tornadoes. In the 52 years between<br />
1950 and 2002, the average occurrence of an F2 scale tornado has been approximately once<br />
every 2.36 years. [43]<br />
<br />
F0<br />
F1<br />
F2<br />
F3<br />
F4<br />
F5<br />
<br />
<br />
<br />
<br />
: Light damage. Some damage to chimneys; tree brances broken off;<br />
shallow-rooted trees pushed over; sign boards damaged. Average number per year, 1953-1989: 218<br />
(29 percent).<br />
: Moderate damage. The lower limit is the beginning of hurricane wind<br />
speed. Roof surfaces peeled off; mobile homes pushed off foundation or overturned; moving autos<br />
pushed off road. Average number per year, 1953-1989: 301 (40 percent).<br />
: Considerable damage. Roof torn out from houses; mobile homes<br />
demolished; boxcars pushed over; large trees snapped or uprooted; light-object missiles generated.<br />
Average number per year, 1953-1989: 175 (23 percent).<br />
: Severe damage. Roofs and some walls torn off well-constructed<br />
houses; trains overturned; most trees in forest uprooted; heavy cars lifted off ground and thrown.<br />
Average number per year, 1953-1989: 43 (6 percent).<br />
: Devastating damage. Well constructed houses leveled; structures<br />
with weak foundations blown off some distance; cars thrown; large missiles generated. Average<br />
number per year, 1953-1989: 10 (1 percent).<br />
: Incredible damage. Strong frame houses lifted off foundations and<br />
carried considerable distances to disintegrate; automobile-sized missiles fly through the air in excess<br />
of 100 yards; trees debarked. Average number per year, 1953-1989: 1 (0.002 percent).<br />
* Wind speeds in the range are defined by Fujita to be "the fastest 1/4-mile wind"<br />
<br />
3.6.2 Hurricanes and Other Weather Related <strong>Hazard</strong>s<br />
California is also at very low risk of hurricanes, although it is possible for one to threaten the<br />
southern California coast. [44] No hurricanes have hit California in recorded history because<br />
tropical storm winds generally blow from east to west, however, the State is affected by heavy<br />
rain resulting from tropical winds that blow north from Mexico and become colder by the time<br />
they hit California. [45]<br />
27 <strong>Local</strong> <strong>Hazard</strong> <strong>Mitigation</strong> <strong>Plan</strong> 1-18-08.doc
Risk to the <strong>Agency</strong>’s facilities from tornadoes or a hurricane is low compared to<br />
earthquakes and flood because any damage will be localized and not likely to be system<br />
wide. Therefore, it would be possible to respond in a timely manner to repair the damage<br />
with small downtime. The most vulnerable system components to tornados, hurricanes,<br />
high wind and lightning strike will be the power and SCADA systems. The <strong>Agency</strong> has the<br />
ability to operate its system from three locations that include the College Avenue facility,<br />
the <strong>Sonoma</strong> Valley <strong>County</strong> Sanitation District (SVCSD) reclamation plant and the Russian<br />
River <strong>County</strong> Sanitation District (RRCSD) treatment facility. In the event the College<br />
Avenue facility is nonfunctional, radio communications to the other two locations most<br />
likely cannot be maintained. The <strong>Agency</strong> is currently in the early planning stages of setting<br />
up a mobile command center for their SCADA system.<br />
3.7 HAZARDS SUMMARY<br />
Table 6 provides a hazards summary for the <strong>Sonoma</strong> <strong>County</strong> <strong>Water</strong> <strong>Agency</strong>.<br />
<br />
<br />
<br />
Natural <strong>Hazard</strong>s<br />
Avalanche No Low Low No Snow uncommon<br />
Coastal Erosion Yes Low Low No No infrastructure near coast<br />
Coastal Storm Yes Low Low No No infrastructure near coast<br />
Corrosive Soils Yes Medium Medium Yes Active corrosion control program<br />
Dense Fog Yes Low Low Low Limited impact<br />
Earthquake Yes Low High High Included in the plan<br />
Expansive Soils No Low Low Low Uncommon in <strong>Sonoma</strong> <strong>County</strong><br />
Extreme Heat Yes Low Low Low Short duration event<br />
Flood Yes High High High Included in the plan<br />
Hailstorm Yes Low Low Low Limited impact<br />
Hurricane No Low Low Low Limited impact<br />
Land Subsidence Yes Low Low High Part of earthquake hazard<br />
Landslide Yes Medium Medium Low Facilities located outside of hazard area<br />
Severe Winter Storm Yes Medium Medium High Included in the plan as part of flood<br />
Tornado Yes Low Low Low Low hazard, limited impact<br />
Tsunami No Low Low Low Facilities located outside of hazard area<br />
Volcano No Low Low Low No active volcanoes<br />
Wildfire Yes High High Low Facilities located outside of hazard area<br />
Windstorm Yes Low Low Low Limited impact<br />
Agricultural <strong>Hazard</strong>s<br />
Drought Yes Low Low Med. Part of urban water management plan<br />
Freeze Yes Low Low Low Limited impact<br />
Pest Yes Low Low Low No impact to the <strong>Agency</strong><br />
Salmon Fishing Yes Low Low Low Private sector economic loss<br />
Technological <strong>Hazard</strong>s<br />
Dam Failure No Low Low Med. Included in plan<br />
Power Failure Yes Low Low Low Emergency power at critical locations<br />
<strong>Hazard</strong>ous Material Release Yes Medium Low Med. Emergency plans in place<br />
Pandemic Influenza Yes Low Unknown Low Public health issue<br />
Radiological No Low Low Low Limited impact<br />
Terrorism/Bioterrorism No Low Unknown Unk. SVA study performed<br />
28 <strong>Local</strong> <strong>Hazard</strong> <strong>Mitigation</strong> <strong>Plan</strong> 1-18-08.doc
4.0 VULNERABILITY ASSESSMENT<br />
Damage to water supply and wastewater collection systems following a major disaster,<br />
especially an earthquake, can lead to significant disruption. This is based on observations from<br />
several recent earthquakes such as the 1989 Loma Prieta earthquake, the 1994 Northridge<br />
earthquake and the 1995 Kobe, Japan earthquake. In Kobe water pipelines sustained severe<br />
damage with numerous breaks that resulted in lack of service in several communities.<br />
Approximately 29,000 people were without water supply for a month following the<br />
earthquake [46] . Over 100 fires broke out within minutes after the earthquake. <strong>Water</strong> for<br />
firefighting was available for only 2 to 3 hours, and subsequently water was available from<br />
tanker trucks only. For several days after the earthquake there were long lines of people waiting<br />
for water and food. Similarly there was significant disruption of water service following the<br />
Northridge earthquake. There was damage at 15 locations in the three transmission system<br />
pipelines that bring water from Northern California, at 74 locations in large diameter trunk lines<br />
and 1,013 locations in the Los Angeles Department of <strong>Water</strong> and Power’s (LADWP) distribution<br />
pipeline network including damage to tanks and other facilities. <strong>Water</strong> system damage was<br />
distributed over approximately 1,200 square kilometers. [47]<br />
During the 1989 Loma Prieta earthquake 20 million gallons of raw sewage were reportedly<br />
dumped into the Oakland Estuary in a six hour period following the earthquake. Damage to<br />
sewage treatment facilities during the 1994 Kobe and the 2004 Chuetsu, Japan earthquakes<br />
resulted in release of polluted water to flow directly into public bodies of water. Damage<br />
resulted from the lifting of pipes and manholes in zones of liquefaction. Damage to sewage<br />
systems can also create a public health hazard, for through backing up of sewage in homes and<br />
uncontrolled release of untreated water.<br />
4.1 WATER SUPPLY<br />
A vulnerability assessment of the <strong>Agency</strong>’s water supply facilities was performed through a<br />
review of available drawings, site reconnaissance and as needed engineering calculations<br />
(ranging from simplified to detailed). The <strong>Agency</strong>’s water transmission system is shown in<br />
Figures 1 and 1a with the most credible hazards overlain shown in Figures 7 through 18. A<br />
review of the overall system shows that portions of the system lack redundancy and a single pipe<br />
break or loss of a single component such as a key pump station can result in significant<br />
disruption. The portions of the system that are especially vulnerable are those that serve the<br />
<strong>Sonoma</strong> Valley and the Cotati area. The sections below describe the significant vulnerabilities<br />
associated with the identified hazards.<br />
29 <strong>Local</strong> <strong>Hazard</strong> <strong>Mitigation</strong> <strong>Plan</strong> 1-18-08.doc
4.1.1 Russian River System<br />
The primary source of water for the <strong>Agency</strong>’s water system is the Russian River that feeds an<br />
aquifer beneath and adjacent to the river through the overlying gravel by natural filtration. The<br />
most significant vulnerabilities associated with the river consist of possible contamination and<br />
increase in turbidity associated with major floods, wildfires, debris flow and landslides. A<br />
hazardous material spill from an accident can also result in possible contamination. The effect of<br />
such contamination can be minimized, depending upon its extent, by releasing water from the<br />
upstream dams and flushing the contaminants. The <strong>Agency</strong>’s emergency operations plan<br />
addresses such events. During a major earthquake there could be a loss of permeability of the<br />
aquifer due to liquefaction or dynamic densification of the gravel that can result in compression<br />
or dilation of the aquifer. Significant loss of production capacity during a short time following a<br />
major earthquake can occur, but generally the aquifers tend to recover after a period of time.<br />
Such changes have been observed in past earthquakes.<br />
The <strong>Agency</strong>’s Warm Springs and Coyote Valley dams are located within close proximity of<br />
major active faults. The dams were constructed in 1982 and 1959, respectively. The Warm<br />
Springs dam is located 4 kilometers from the Healdsburg fault, a northward extension of the<br />
Rodgers Creek fault, and 10 kilometers from the Maacama, 23 kilometers from the Hayward and<br />
29 kilometers from the San Andreas Fault. The Coyote Valley dam is located 1.4 kilometers<br />
from the Maacama fault, and more than 50 kilometers from the San Andreas, Rodgers Creek and<br />
Healdsburg faults. Both dams are part of the flood control system, and the US Army Corps of<br />
Engineers is responsible for dam safety. As reported by the Army Corps, the safety assessment<br />
of both dams and appurtenant structures to account for the most recent information on seismic<br />
and flood conditions are currently overdue.<br />
4.1.2 Diversion Facilities<br />
The components of the <strong>Agency</strong>’s system that facilitate the diversion of water from the source<br />
(the Russian River aquifer) to the transmission system are referred to as the diversion facilities.<br />
The diversion facilities can be grouped into those that draw water from the aquifer and those that<br />
help recharge it. The former include the six collector wells and the Mirabel well field, while the<br />
latter include the inflatable dam, the RDS (river diversion system) caisson, infiltration ponds,<br />
diversion channels and the main dike.<br />
The earliest of the six collector wells were built in 1958 and the latest in 2005. The general<br />
construction of the collector well includes a large diameter (ranging from 13 to 18 feet inside<br />
diameter and 18 to 33 inch thick walls) concrete caisson that extends from the ground surface<br />
into the aquifer. The caissons range in length from about 108 feet to 123 feet. At the bottom of<br />
30 <strong>Local</strong> <strong>Hazard</strong> <strong>Mitigation</strong> <strong>Plan</strong> 1-18-08.doc
each caisson, perforated pipes (known as laterals) extend radially into the aquifer. Each lateral is<br />
over a 100 feet long and ranges in size from 8 to 10 inch diameter for the older five collectors<br />
and 12 to 18 inches for the newest sixth collector. Each caisson supports a pump house with two<br />
pumps that draw water collected inside the caisson. All of the supporting electrical and<br />
communication systems to operate the pumps remotely are located in the pump house.<br />
The pump houses of each collector well are located well above the maximum flood levels and<br />
have a low likelihood of direct damage from flood or debris impact. The diversion system<br />
facilities are located in an area of very high liquefaction hazard and because of the proximity to a<br />
free face of the river bank the collectors are also subject to a very high lateral spread hazard.<br />
Structural assessment of the collector wells and the RDS show that three of the six<br />
collectors and the RDS have a high likelihood of sustaining major damage. Strong<br />
earthquake shaking can also cause damage to the electrical and communication equipment that is<br />
not adequately anchored.<br />
Other diversion system facilities such as the inflatable dam, the diversion dike, ditches and the<br />
infiltration ponds are also located in an area of high liquefaction and flood hazard. Recently<br />
portions of the dike were severely damaged due to overtopping of flood waters. The seven<br />
conventional wells of the Mirabel well field are susceptible to flood related debris impact. The<br />
overall water quality during floods and wild fires is also a concern.<br />
4.1.3 Aqueducts<br />
The SCWA transmission system consists of 85 miles of aqueducts (pipelines) ranging in size<br />
from 16 inches to 54 inches. The system transports water from the Russian River diversion<br />
facilities, located in the Wohler-Mirabel area, southwards and eastwards to the <strong>Agency</strong>’s service<br />
area. The transmission system consists of 11 pipeline segments that include the Russian River<br />
Cotati Intertie, the Santa Rosa Aqueduct, the <strong>Sonoma</strong> Aqueduct, the Petaluma Aqueduct, the<br />
Oakmont Pipeline, the Wohler-Forestville Pipeline, the Wohler-Mirabel Intertie, the Kawana<br />
Pipeline, the North Marin Aqueduct, the Collector 6 Pipeline and the Eldridge-Madarone<br />
Pipeline. The configuration of the <strong>Agency</strong>’s entire transmission system is shown in Figure 1.<br />
The water transmission system is distributed over a large geographical area and traverses zones<br />
of varying geology and topography, and is subject to a range of natural hazards. The system was<br />
built incrementally over a period of several decades (ranging from 1959 to 2003) and under a<br />
range of evolving design standards and construction techniques. Pipeline construction consists<br />
of predominantly mortar lined and coated steel pipe and some pre-stressed concrete cylinder<br />
pipe. Typical joint types consist of gasket joints, welded bell-and-spigot joints, and welded butt-<br />
31 <strong>Local</strong> <strong>Hazard</strong> <strong>Mitigation</strong> <strong>Plan</strong> 1-18-08.doc
strap joints. Most river and stream crossings include concrete encasement over some or most of<br />
the pipeline between the banks of the river or stream.<br />
Major hazards to the pipeline system include earthquakes, floods and landslides, with the<br />
earthquakes and earthquake induced hazards such as liquefaction, surface fault rupture, lateral<br />
spread and strong ground shaking being the most significant.<br />
In general, buried pipelines, such as the SCWA’s aqueducts, are designed for internal pressure<br />
with limited consideration to large relative displacements of ground along its length. Such<br />
pipelines are typically designed with bell and spigot type connections (also known as segmented<br />
pipelines) and do not perform well when subjected to ground failure resulting from earthquakes,<br />
floods and landslides. In the 1964 Anchorage, Alaska earthquake more than 100 water pipe<br />
breaks were reported. In 1971 San Fernando earthquake, the City of San Fernando temporarily<br />
lost water, gas and sewage services due to liquefaction induced lateral spreading along the<br />
eastern and western shores of Upper Van Norman reservoir. For relatively small ground<br />
displacements associated with earthquake ground shaking, the pipelines perform reasonably well<br />
with certain amounts of random damage that can usually be handled as part of emergency repairs<br />
following an earthquake.<br />
The <strong>Agency</strong>’s pipelines cross many locations where they may be subjected to ground<br />
deformation. The most obvious location is the Rodgers Creek fault crossing of the Santa Rosa<br />
aqueduct. Surface fault rupture displacement of several feet is expected during a major<br />
earthquake on the fault, which the pipeline is not designed for. In addition, the <strong>Agency</strong>’s<br />
<strong>Sonoma</strong> aqueduct and the Oakmont pipelines cross the Bennett Valley fault and will likely fail in<br />
a surface rupturing event on this fault. Other vulnerable locations include the Russian River<br />
crossing of the Russian River Cotati intertie and multiple stream crossings as shown in Figure<br />
xx. Depending upon the geometry of the stream bank and the potential for liquefaction, these<br />
locations could have large lateral spread displacements and consequently the pipelines may fail.<br />
The <strong>Sonoma</strong> aqueduct is also vulnerable to damage from debris impact in a high flood scenario<br />
at three locations where the pipeline is suspended from bridges across creeks.<br />
4.1.4 Storage Facilities<br />
The <strong>Agency</strong> has a total of 17 flat bottom steel tanks located at eight independent sites. Out of the<br />
17 tanks, seven are anchored while the other 10 are unanchored. The tanks range in size from<br />
0.3 M.G. to 18 M.G. Most of the tanks have overconstrained piping connections that are<br />
potentially vulnerable to damage in an earthquake. Such piping connections consist of the pipe<br />
that is rigidly attached to the tank shell and restrained by burial near the tank or connection to an<br />
adjacent nearby tank. As a result, the piping is unable to accommodate movement of the tank as<br />
32 <strong>Local</strong> <strong>Hazard</strong> <strong>Mitigation</strong> <strong>Plan</strong> 1-18-08.doc
it tries to uplift due to seismic overturning moments. Most of the <strong>Agency</strong>’s tanks also have<br />
bottom penetrating inlet/outlet and drain piping. Typically, the steel tank base plate is relatively<br />
thin (typical thickness of ¼ inch) and is vulnerable to tearing if tank uplift occurs at the bottom<br />
penetration piping connection. The <strong>Agency</strong> is currently in the process of mitigating most of<br />
these vulnerabilities.<br />
4.1.5 Booster Pump Facilities<br />
The <strong>Agency</strong> has eight booster stations. Five of the pump stations are single-story buildings<br />
while the other three are open to air. The most significant vulnerabilities include potential<br />
damage to the pump station building and electrical control cabinets. Minor to moderate damage<br />
to the pump station building may not necessarily be a significant hazard since the buildings are<br />
not manned. However, major damage or collapse of the building can result in associated damage<br />
to the pump motor or motor control centers (MCC) by falling debris. A building that is<br />
significantly damaged may also prevent or delay any required manual reset of pump controls<br />
thereby impeding system operations. In terms of the potential for major collapse, the most<br />
vulnerable pump stations are the <strong>Sonoma</strong> Booster Station because the pump stations are situated<br />
within the fault deformation zone of the Bennett Valley fault.<br />
4.1.6 Treatment Facilities<br />
The Russian River aquifer water is naturally filtered and does not require treatment. However, to<br />
maintain regulatory levels of residual chlorine in the transmission system, the <strong>Agency</strong> has three<br />
chlorination facilities. Two of the three chlorination facilities are also corrosion control facilities<br />
to chemically treat the water’s pH to minimize the potential for corrosion. The three facilities<br />
include the Wohler chlorination and corrosion control facility located at the <strong>Agency</strong>’s<br />
corporation yard on Wohler Road, the Mirabel chlorination facility located near the Mirabel<br />
collectors and the River Road chlorination and corrosion control facility located on River Road.<br />
The River Road facility is currently used only for corrosion control.<br />
The Mirabel and the Wohler facilities are single story reinforced masonry buildings that<br />
generally perform adequately in an earthquake provided the buildings have adequate roof to wall<br />
connections. The River Road facility is a two story masonry building with a soft first story and<br />
has been retrofitted by the addition of braces at some of the open bays at the first floor.<br />
Typically buildings with soft first story perform poorly in earthquakes with excessive damage.<br />
The extent of potential damage to this building will depend upon the adequacy of the retrofit<br />
scheme. The most significant hazard at the treatment facilities is the potential for a chlorine<br />
release or damage to the contents and non-structural elements.<br />
33 <strong>Local</strong> <strong>Hazard</strong> <strong>Mitigation</strong> <strong>Plan</strong> 1-18-08.doc
4.1.7 Supplementary <strong>Water</strong> Sources<br />
In addition to the main water source, the Russian River aquifer, the <strong>Agency</strong> has supplementary<br />
sources in three conventional wells located in the Santa Rosa Plain area. The three wells known<br />
as the Occidental Road Well, the Sebastopol Road Well and the Todd Road Well collectively<br />
provide a sustained flow of about 7 mgd. Two of the three wells are located in FEMA flood<br />
zone with the third located close to the boundary of the flood zone. Flooding at the site can<br />
significantly impact water quality and cause damage to the well infrastructure in terms of electric<br />
short circuiting due to inundation and direct physical damage due to debris impact. All of the<br />
wells are located in medium to low liquefaction hazard areas. The most significant hazard from<br />
an earthquake viewpoint is the damage to the above ground infrastructure, communication and<br />
electrical control systems from strong ground shaking.<br />
4.1.8 Emergency Power<br />
The <strong>Agency</strong>’s facilities receive power from PWRPA and PG&E including power to the <strong>Agency</strong><br />
owned substation at Wohler. This substation is a key component of the power network for the<br />
Wohler and Mirabel collectors. Emergency power to all feeders in the substation is provided by<br />
three 2000kW diesel generators, located near the Wohler Chlorination Building. The generators<br />
require manual start and can run for approximately 2.5 days before re-fuelling. Fuel for the<br />
generators is provided by a 25000 gal diesel tank located onsite. In addition, two 1250kW diesel<br />
generators are located near the Mirabel chlorination building. Fuel to these generators is<br />
provided by 10,000 and 25000-gal fuel tanks located onsite. These generators can run for<br />
approximately 5 days without re-fuelling. When all five generators are run at full power, nine<br />
out of ten pumps at the collectors (excluding new Collector #6) can be operated simultaneously.<br />
The chlorination facilities also have emergency generators for operating the chlorine sensors and<br />
scrubber systems. Emergency power to two of the eight booster stations is provided by<br />
generators located at the <strong>Sonoma</strong> Booster Station and the Ely Booster Station site. The <strong>Agency</strong><br />
also has a series of uninterruptible power supply (UPS) units located at essentially all of their<br />
facilities to operate the communication and SCADA systems for a period of three to four hours<br />
after a major power loss.<br />
4.2 SANITATION<br />
Independent vulnerability assessment of <strong>Agency</strong>’s sanitation facilities has not yet been<br />
performed. Considering that these facilities are located in the same geographical region as the<br />
water system facilities, they are also subject to the same types of hazards with similar types of<br />
vulnerabilities. Figures 19 through 27 show the sanitation facilities overlain on maps of<br />
34 <strong>Local</strong> <strong>Hazard</strong> <strong>Mitigation</strong> <strong>Plan</strong> 1-18-08.doc
significant hazards in <strong>Sonoma</strong> <strong>County</strong>. A general overview of the sanitation system<br />
vulnerabilities is as follows:<br />
• Treatment facilities and lift stations within the Sea Ranch Sanitation Zone are located in close<br />
proximity to the San Andreas Fault (Figure 19) and are subject to strong ground shaking<br />
hazard with PGA exceeding 0.5g (Figure 20).<br />
• The lift station for the Airport/Larkfield/Wikiup is located adjacent to the Rodgers Creek fault<br />
(Figure 19) and is subject to strong ground shaking hazard with PGA exceeding 0.6g (Figure<br />
20).<br />
• Sanitation facilities not in immediate proximity to the San Andreas or Rodgers Creek fault are<br />
still located close enough to be subject to signification ground shaking with PGA exceeding<br />
0.4g.<br />
• Figure 21 shows the liquefaction and lateral spread hazard for the sanitation facilities.<br />
Facilities of the Geyserville Sanitation Zone, the treatment plant for the Russian River<br />
Sanitation District and portions of the <strong>Sonoma</strong> Valley Sanitation District are located in high to<br />
very high liquefaction zones. A significant number of the <strong>Agency</strong>’s sanitation facilities are<br />
located in medium liquefaction zones with some in zones of low liquefaction hazard.<br />
Pipelines, especially the pipeline connections to fixed facilities, are most vulnerable to<br />
damage within zones of potential liquefaction hazard.<br />
• Most of the <strong>Agency</strong>’s facilities are located outside the landslide hazard zone, with some<br />
facilities, for example, lift stations of the Occidental <strong>County</strong> Sanitation Zone and the<br />
Airport/Larkfield/Wikiup Sanitation Zone and treatment plants for the Occidental <strong>County</strong><br />
Sanitation Zone and the Russian River <strong>County</strong> Sanitation Zone are located in areas of<br />
potential landslide hazard (Figure 22).<br />
• Figure 23 shows that the potential for flooding hazard is high at the Geyservile Sanitation<br />
Zone, Russian River <strong>County</strong> Sanitation District, and the Forestville <strong>County</strong> Sanitation<br />
District.<br />
• Figure 24 shows that the debris flow hazard at the sanitation facilities is relatively low.<br />
• Figures 24 and 25 show that several facilities are located in areas that have corrosive soils,<br />
however, based on discussions with the <strong>Agency</strong> corrosion is not a predominant hazard.<br />
35 <strong>Local</strong> <strong>Hazard</strong> <strong>Mitigation</strong> <strong>Plan</strong> 1-18-08.doc
• Facilities at the Sea Ranch Sanitation Zone, Occidental <strong>County</strong> Sanitation District, Russian<br />
River <strong>County</strong> Sanitation District and the Airport/Larkfield/Wikiup Sanitation Zone are<br />
located in areas of high fire hazard (Figure 26), with some of the facilities of the Russian<br />
River <strong>County</strong> Sanitation District and the Airport/Larkfield/Wikiup located close to the<br />
boundary of historic fire zones.<br />
• The Airport/Larkfield.Wikiup Sanitation Zone and the Sonomy Valley Sanitation District<br />
have wastewater treatment ponds with high embankments (California Division of Safety of<br />
Dams (DSOD), jurisdictional embankments) that could be subjected to high liquefaction and<br />
ground shaking hazard and therefore, require detailed vulnerability assessment.<br />
A detailed multi-hazard reliability assessment of <strong>Agency</strong>’s sanitation facilities is a primary goal<br />
in this five year hazard mitigation plan. It is anticipated that mitigation of vulnerabilities<br />
identified during this cycle of the plan will be included in the next five year cycle.<br />
4.3 FLOOD PROTECTION<br />
Independent vulnerability assessment of <strong>Agency</strong>’s flood protection facilities has not yet been<br />
performed. Considering that these facilities are located in the same geographical region as the<br />
water system facilities, they are also subject to the same types of hazards with similar types of<br />
vulnerabilities. A detailed multi-hazard reliability assessment of <strong>Agency</strong>’s flood protection<br />
facilities is a primary goal in this five year hazard mitigation plan. However, while the <strong>Agency</strong><br />
is responsible for the management of the large reservoirs (Lake <strong>Sonoma</strong> and Lake Mendocino),<br />
the primary responsibility of the reliability of major components of the infrastructure is with the<br />
U.S. Army Corps of Engineers. During this plan cycle the <strong>Agency</strong> will work with the Corps to<br />
develop a plan to address the identified vulnerabilities in the future cycles of this plan. The<br />
<strong>Agency</strong> is responsible for the reliability of reservoirs associated with the Central <strong>Sonoma</strong><br />
<strong>Water</strong>shed Project.<br />
4.4 ADMINISTRATIVE INFRASTRUCTURE<br />
Independent vulnerability assessment of <strong>Agency</strong>’s administrative infrastructure has not yet been<br />
performed. A detailed vulnerability assessment of <strong>Agency</strong>’s office facilities is a primary goal in<br />
this five year hazard mitigation plan. Upgrade of the identified vulnerabilities will be included in<br />
the future cycles of this plan.<br />
36 <strong>Local</strong> <strong>Hazard</strong> <strong>Mitigation</strong> <strong>Plan</strong> 1-18-08.doc
5.0 MITIGATION GOALS, OBJECTIVES AND ACTIONS<br />
<strong>Sonoma</strong> <strong>County</strong> <strong>Water</strong> <strong>Agency</strong> is directly responsible for providing water to over 600,000<br />
people in the rapidly developing and expanding North Bay Area. The <strong>Agency</strong> is the primary<br />
wholesale provider of water to eight cities and water agencies who maintain their own<br />
distribution networks but very little redundant sources of supply. The <strong>Agency</strong>’s contractors and<br />
in turn the public relies on the water supplied by the <strong>Agency</strong> for domestic water supply and for<br />
both emergency and non-emergency, use such as irrigation and other domestic and industrial<br />
needs.<br />
The <strong>Agency</strong>’s water system and its facilities stretch over an area of multiple natural hazards.<br />
The system has a range of vulnerabilities to these hazards. Hydraulic analysis conducted as part<br />
of the natural hazard vulnerability assessment of the water system show that damage to one or<br />
more such facilities can deplete water storage and cause significant pressure loss at turnouts<br />
serving the contractors within a matter of hours. Loss of supply from the <strong>Agency</strong> will leave the<br />
contractors vulnerable in their ability to provide fire flow and drinking water to the public.<br />
The <strong>Agency</strong> takes this responsibility seriously and has developed this plan to systematically<br />
address the vulnerabilities of its water supply, wastewater collection and flood control systems.<br />
In this capacity, the <strong>Agency</strong>’s goals are in line with the goals of the community as addressed in<br />
the <strong>Sonoma</strong> <strong>County</strong> (<strong>County</strong>) hazard mitigation plan. The <strong>County</strong>’s main goals are to reduce the<br />
vulnerability of people and property exposed to earthquake, landslide, flood, and wild-land fire<br />
hazards. One of the objectives identified by the <strong>County</strong> for meeting these goals is to promote the<br />
implementation of disaster mitigation projects identified as high priority through the SCWA<br />
multi-hazard reliability assessment study and to increase the disaster resistance and reliability of<br />
the SCWA’s transmission system. Keeping in view the desires of the community, as expressed<br />
in the <strong>County</strong>’s plan and the understanding of the <strong>Agency</strong> vulnerabilities through a detailed<br />
multi-hazard reliability assessment of its facilities, the <strong>Agency</strong> has formulated the following<br />
three main goals:<br />
Goal 1: Provide safe and reliable water supply to the public during and after a natural<br />
disaster to reduce the vulnerability of people and property<br />
Goal 2: Provide reliable wastewater collection, treatment and disposal services during<br />
and after a natural disaster to reduce risk to the public’s health and<br />
environmental damage<br />
Goal 3: Maintain reliable flood control works to reduce the vulnerability of people and<br />
property to flood hazard<br />
37 <strong>Local</strong> <strong>Hazard</strong> <strong>Mitigation</strong> <strong>Plan</strong> 1-18-08.doc
Based on the insights obtained from a comprehensive multi-hazard reliability assessment of the<br />
<strong>Agency</strong>’s water system, a series of mitigation goals and actions are included in this plan. In<br />
addition, first tier objectives and actions for the <strong>Agency</strong>’s wastewater collection and flood<br />
control systems are also presented. The <strong>Agency</strong> believes that the upgrades and safe operations of<br />
its systems require an ongoing program in which the most obvious vulnerabilities and those with<br />
the highest probability of occurrence are mitigated first followed systematically by<br />
vulnerabilities with lower probabilities, or newly identified vulnerabilities based on new<br />
information, with a continued improvement in the reliability of the system. This process will be<br />
managed through continuous maintenance of this hazard mitigation plan through a five year<br />
update cycle.<br />
Goal 1: Provide safe and reliable water supply to the public during and after a natural<br />
disaster to reduce the vulnerability of people and property<br />
Objective 1.1: Implement system-wide improvements that reduce the overall system<br />
vulnerability by adding redundancy to the system and by enhancing <strong>Agency</strong>’s response<br />
through better monitoring of its system.<br />
1.1.1 Minimize potential for uncontrolled release of water by providing isolation valves at<br />
strategic locations.<br />
1.1.2 <strong>Plan</strong>, design and add redundant/emergency supply sources to minimize dependence on<br />
the Russian River aquifer as the main source of water supply. Install new emergency<br />
ground water wells located strategically throughout the system.<br />
1.1.3 Provide seismic restraints to electrical and communication equipment at various facilities.<br />
1.1.4 Install flow measuring devices at key turnouts for real time monitoring of flow.<br />
1.1.5 Develop a GPS based system map with real-time monitoring at critical locations. For<br />
example, significant portions of the <strong>Agency</strong>’s aqueducts run through large zones of<br />
undeveloped areas and pipe leaks in such areas are hard to precisely locate.<br />
1.1.6 Procure large diameter flexible hose and its deployment and retrieval system for<br />
emergency use.<br />
1.1.7 Install emergency manifolds at strategic locations to connect emergency hoses.<br />
Objective 1.2:<br />
Perform diversions system improvements<br />
1.2.1 Develop and implement designs to retrofit collectors against liquefaction and lateral<br />
spread hazard.<br />
1.2.2 Develop and implement design strategy to mitigate liquefaction and lateral spread hazard<br />
to the RDS.<br />
38 <strong>Local</strong> <strong>Hazard</strong> <strong>Mitigation</strong> <strong>Plan</strong> 1-18-08.doc
Objective 1.3:<br />
Perform transmission system improvements<br />
1.3.1 Develop and implement a design strategy to mitigate fault rupture hazard to the<br />
aqueducts that cross the Rodgers Creek and the Bennett Valley faults.<br />
1.3.2 Develop and implement a design strategy to mitigate the liquefaction and lateral spread<br />
hazard at the several river and creek crossings identified in the natural hazard reliability<br />
assessment. Some of the most vulnerable include the aqueduct crossings at Russian<br />
River, Petaluma River, Mark West Creek, Santa Rosa Creek and Calabasas Creek.<br />
1.3.3 Develop and implement a design strategy to mitigate the liquefaction, lateral spread and<br />
flood hazard for the <strong>Sonoma</strong> aqueduct suspended at the two pedestrian and one traffic<br />
bridge over <strong>Sonoma</strong> Creek at Lawndale Road, Madrone Road and Verano Avenue.<br />
1.3.4 Develop and implement a design or operational strategy to mitigate lateral spread damage<br />
to the Wohler-Mirabel Intertie.<br />
1.3.5 Develop plans to relocate or parallel the pipeline that crosses beneath the Spring Lake<br />
and the Spring Lake dam.<br />
1.3.6 Develop a design or operational strategy to respond to unexpected pipeline damage<br />
within the Wohler-Mirabel area.<br />
1.3.7 Develop a long term strategy to address lower probability damage to transmission system<br />
pipelines. Due to the non-redundant nature of the transmission system such damage can<br />
be just as disruptive as that due to damage with a high probability of occurrence.<br />
Objective 1.4:<br />
Perform pumping system improvements<br />
1.4.1 Develop and implement a retrofit design for mitigation of liquefaction and lateral spread<br />
hazard at the Ely Booster station.<br />
1.4.2 Develop and implement a seismic retrofit design for the Kastania pump station building.<br />
1.4.3 Develop and implement a seismic retrofit design or replacement of the Wilfred booster<br />
station building.<br />
1.4.4 Develop and implement a design an operational solution, such as procuring large portable<br />
pumps, to mitigate the Bennett Valley fault rupture hazard to the <strong>Sonoma</strong> Booster<br />
Station.<br />
Objective 1.5:<br />
Perform storage system improvements<br />
1.5.1 Perform a piping retrofit by replacing existing rigid piping with piping with flexible<br />
joints at the storage reservoirs.<br />
1.5.2 Implement other retrofits such as removing overconstrained conditions identified in the<br />
natural hazard reliability study.<br />
39 <strong>Local</strong> <strong>Hazard</strong> <strong>Mitigation</strong> <strong>Plan</strong> 1-18-08.doc
Objective 1.6:<br />
Improve the <strong>Agency</strong>’s emergency response capabilities<br />
1.6.1 <strong>Plan</strong> and procure stockpile material for use in emergency.<br />
1.6.2 Conduct first responder training of a broad pool of <strong>Agency</strong>’s personnel to respond in an<br />
emergency.<br />
1.6.3 <strong>Plan</strong> and develop a dedicated Emergency Operations Center such that the operators and<br />
decision makers are in close proximity to each other.<br />
1.6.4 Procure a mobile EOC.<br />
Objective 1.7:<br />
Reliable emergency power systems<br />
1.7.1 Develop and implement design and operations plans to mitigate liquefaction related<br />
damage to electric power lines feeding collectors and pump stations.<br />
1.7.2 Procure and install additional UPS units at each facility to prolong the ability to<br />
communicate with the system beyond the current 4 hour limit.<br />
Objective 1.8:<br />
Reduce supply vulnerability<br />
1.8.1 Assess vulnerability of Russian River upstream of the aquifer to earthquake and nonearthquake<br />
induced landslides that could potentially block the river channel.<br />
1.8.2 Assess vulnerability of Russian River upstream of the aquifer to contamination from<br />
accidents and wildland fire.<br />
1.8.3 Design and implement mitigation schemes for reducing the potential of flood damage to<br />
the well fields in the Mirabel and Laguna de Santa Rosa area.<br />
Objective 1.9:<br />
Minimize life safety risk and reduce operational vulnerability<br />
1.9.1 Conduct a detailed seismic vulnerability assessment of structural and non-structural<br />
elements of the <strong>Agency</strong>’s facilities located at 404 Aviation Boulevard and College<br />
Avenue.<br />
Objective 1.10:<br />
Improve understanding of fault rupture hazard<br />
1.10.1 Work with the United States Geological Survey (USGS) to design and conduct a detailed<br />
geologic study including trenching of Bennett Valley and Rodgers Creek faults to more<br />
accurately define the fault activity and paleoseismic history of the fault, the rupture zone<br />
and the extent of surface rupture.<br />
Objective 1.11:<br />
Minimize economic exposure to the <strong>Agency</strong><br />
1.11.1 Work with the U.S. Army Corps of Engineers to expedite the earthquake safety<br />
assessment of Warm Springs and Coyote Valley dams.<br />
40 <strong>Local</strong> <strong>Hazard</strong> <strong>Mitigation</strong> <strong>Plan</strong> 1-18-08.doc
1.11.2 Conduct a detailed seismic vulnerability assessment of electric power station at the Warm<br />
Springs dam.<br />
1.11.3 Develop project design criteria document for new construction.<br />
Goal 2: Provide reliable wastewater collection, treatment and disposal services during<br />
and after a natural disaster to reduce public health risk and environmental<br />
damage<br />
Objective 2.1: Improve the understanding of the vulnerability of the sanitation systems<br />
under the <strong>Agency</strong>’s control.<br />
2.1.1 Perform a multi-hazard vulnerability assessment of the sanitation systems.<br />
2.1.2 Develop project design criteria document for new construction.<br />
Goal 3: Maintain reliable flood control works to reduce the vulnerability of people and<br />
property to flood hazard<br />
Objective 3.1:<br />
protection works.<br />
Improve the understanding of the vulnerability of the <strong>Agency</strong>’s flood<br />
3.1.1 Perform a vulnerability assessment of the flood control works for multiple flood<br />
recurrence intervals with consideration to potential impacts from global and local climate<br />
change.<br />
3.1.2 Work with the U.S. Army Corps of Engineers to expedite reassessment of Coyote and<br />
Warm Springs dam under the revised PMF (probable maximum flood) conditions as<br />
impacted by the recent PMP (probable maximum precipitation) study results included in<br />
the hydro-meteorological report HMR57 for Pacific Northwest and HMR 58 and HMR59<br />
for California.<br />
3.1.3 Work with the U.S. Army Corps of Engineers to develop and implement a plan for the<br />
assessment of flood control levees within the Upper Russian River area between<br />
Colverdale and Healdsburg.<br />
3.1.4 Develop project design criteria document for new construction.<br />
41 <strong>Local</strong> <strong>Hazard</strong> <strong>Mitigation</strong> <strong>Plan</strong> 1-18-08.doc
6.0 IMPLEMENTATION STRATEGY<br />
For the successful mitigation of hazards identified in this plan and to meet the <strong>Agency</strong>’s goals<br />
within a reasonable time frame, an implementation strategy has been developed. The strategy<br />
includes an identification of the objectives identified in Section 6.0, development of planning<br />
level cost estimates and a time frame for implementation.<br />
The <strong>Agency</strong>’s implementation strategy includes first identifying a set of first tier objectives.<br />
These objectives are considered the highest priority and once implemented will result in<br />
substantial improvement in the overall reliability of the system. The remaining objectives, not<br />
included in the first tier objectives, are considered desirable and will further enhance the system<br />
reliability once the first tier objectives are achieved. In addition, the <strong>Agency</strong>, as part of its<br />
maintenance program, has undertaken some of the objectives identified in Section 5.0. The most<br />
noteworthy of these include; seismically restraining electrical and communication equipment<br />
(Objective 1.1.3), retrofitting overconstrained conditions at storage tanks (Objective 1.5.1 and<br />
1.5.2), procuring some stockpile material (Objective 1.6.1), working towards enhancing the<br />
emergency operations center (Objective 1.6.3) and reducing vulnerability of electric power lines<br />
(Objective 1.7.1).<br />
The <strong>Agency</strong>’s objectives have been prioritized based on the following:<br />
• Impact to the <strong>Agency</strong>’s system from the identified vulnerability. The system impacts were<br />
studied through detailed hydraulic modeling of the system. Factors such as time to significant<br />
loss of pressure or significant loss of storage and the population impacted. For example, a<br />
break at Rodgers Creek fault will result in loss of flow to the entire <strong>Sonoma</strong> Valley and is<br />
considered a high priority<br />
• Overall cost/benefit of the mitigation strategy. For example, anchorage of equipment at the<br />
<strong>Agency</strong>’s facilities is considered a high priority because of very high benefit to cost ratio.<br />
The <strong>Agency</strong>’s first tier objectives include:<br />
1. <strong>Mitigation</strong> Action 1.3.1 (partial) – Develop and implement design strategy to<br />
mitigate fault rupture hazard at Rodgers Creek fault crossing of Santa Rosa<br />
aqueduct<br />
2. <strong>Mitigation</strong> Action 1.1.4 – Install flow measuring devices at key turnouts for real<br />
time monitoring of flow<br />
42 <strong>Local</strong> <strong>Hazard</strong> <strong>Mitigation</strong> <strong>Plan</strong> 1-18-08.doc
3. <strong>Mitigation</strong> Action 1.1.1 – Minimize potential for uncontrolled release of water<br />
by providing isolation valves at strategic locations<br />
4. <strong>Mitigation</strong> Action 1.3.2 (partial) – Develop and implement design strategy to<br />
mitigate the liquefaction and lateral spread hazard at the Russian River crossing<br />
5. <strong>Mitigation</strong> Action 1.3.2 (partial) – Develop and implement design strategy to<br />
mitigate the liquefaction and lateral spread hazard at the Mark West Creek<br />
crossing<br />
6. <strong>Mitigation</strong> Action 1.2.1 (partial) – Develop and implement retrofit design for<br />
Collectors 3 and 5 against liquefaction and lateral spread hazard<br />
7. <strong>Mitigation</strong> Action 1.2.1 (partial) – Develop and implement retrofit design for<br />
Collector 6 against liquefaction and lateral spread hazard<br />
8. <strong>Mitigation</strong> Action 1.1.2 – <strong>Plan</strong>, design and add redundant/emergency supply<br />
sources to minimize dependence on the Russian River aquifer as the main source<br />
of water supply. Install new emergency ground water wells located strategically<br />
throughout the system (assumed three locations)<br />
9. <strong>Mitigation</strong> Action 1.3.2 (partial) – Develop and implement design strategy to<br />
mitigate the liquefaction and lateral spread hazard at the Santa Rosa Creek<br />
crossing<br />
10. <strong>Mitigation</strong> Action 1.2.2 – Develop and implement design strategy to mitigate<br />
liquefaction and lateral spread hazard to the RDS<br />
The implementation strategy has been developed based on the recommended Capital<br />
Improvement Program developed as part of the multi-hazard reliability project. Once these<br />
objectives are achieved, implementation schedule and planning level budget estimates for second<br />
tier objectives can be developed in future revisions to the plan, if so desired by the <strong>Agency</strong>, the<br />
public and the <strong>Agency</strong>’s contractors. The first tier mitigation actions are included in the<br />
<strong>Agency</strong>’s Capital Improvement Program (CIP), which is administered by the Engineering and<br />
Resource <strong>Plan</strong>ning Division with the other division heads involved in the yearly CIP<br />
development cycle.<br />
The <strong>Agency</strong> will actively work towards identifying funding sources for these projects. Some of<br />
these sources include: FEMA’s pre-disaster mitigation program (PDM) and hazard mitigation<br />
43 <strong>Local</strong> <strong>Hazard</strong> <strong>Mitigation</strong> <strong>Plan</strong> 1-18-08.doc
grants program (HMGP), <strong>Agency</strong>’s maintenance budget and a proposed reliability surcharge<br />
within the <strong>Agency</strong>’s rate structure. Since 2003, FEMA has provided close to $540 million in<br />
PDM grants to eligible projects. Additional funding from FEMA is available following a<br />
Federal disaster declaration as part of its HMGP.<br />
Depending on the level of funding available, the <strong>Agency</strong> plans to implement the top six first tier<br />
objectives in 4 to 10 years following the adoption of this plan with the remainder of the first tier<br />
objectives completed within the next 15 to 25 years.<br />
44 <strong>Local</strong> <strong>Hazard</strong> <strong>Mitigation</strong> <strong>Plan</strong> 1-18-08.doc
7.0 PLAN MAINTENANCE<br />
The <strong>Agency</strong>’s commitment to reducing its hazard vulnerability and improving the reliability of<br />
its system is demonstrated by the fact that the <strong>Agency</strong> on its own initiative undertook a<br />
comprehensive multi-hazard reliability improvement program. The <strong>Agency</strong> recognizes that this<br />
commitment can only be met through a dedicated effort. Development of the <strong>Hazard</strong> <strong>Mitigation</strong><br />
<strong>Plan</strong> is part of this effort. In meeting the requirements of the DMA2000, the <strong>Agency</strong> plans to<br />
update the <strong>Hazard</strong> <strong>Mitigation</strong> <strong>Plan</strong> every five years or if new information becomes available,<br />
priorities for implementation change or an actual hazard event occurs that may prompt an update<br />
to the plan sooner than five years.<br />
7.1 MONITORING EVALUATING AND UPDATING THE PLAN<br />
The <strong>Agency</strong> will keep the plan “alive” through constant monitoring of the plan goals and<br />
objectives. The high priority mitigation actions are being included in the <strong>Agency</strong>’s CIP.<br />
Because of the involvement of the <strong>Agency</strong>’s Department heads of <strong>Plan</strong>ning, Operations,<br />
Maintenance and Capital Improvements in the development of the plan, the entire executive<br />
management of the <strong>Agency</strong> is committed to implement the goals and objectives of the plan.<br />
The <strong>Agency</strong> will incorporate the hazard mitigation plan in its yearly CIP planning process to<br />
monitor progress towards the goals of the hazard mitigation plan. To further facilitate this<br />
process, the <strong>Agency</strong>’s Capital Projects Manager has been identified as the person responsible for<br />
monitoring and updating the hazard mitigation plan. As required by DMA2000, this plan will be<br />
updated every five years. The <strong>Agency</strong> will also update the plan if there is a significant change in<br />
the basic assumptions, for example a major hazard event that highlights vulnerabilities in the<br />
system not anticipated at the present time.<br />
7.2 CONTINUED PUBLIC INVOLVEMENT<br />
The <strong>Agency</strong>, with its decision to incorporate the hazard mitigation plan in its yearly CIP<br />
planning process, has ensured continued public involvement in this plan. The CIP approval is an<br />
open public process. As part of the approval process the CIP is presented to the <strong>Agency</strong>’s Board<br />
of Supervisors in an open public meeting and by virtue of this, progress towards achieving<br />
<strong>Agency</strong>’s goals and objectives identified in the hazard mitigation plan will also be open for<br />
public review and comment.<br />
Further, the <strong>Agency</strong> is contractually obligated to meet on a regular basis with two advisory<br />
committees. The <strong>Water</strong> Advisory Committee (WAC) and the Technical Advisory<br />
Committee(TAC) meet quarterly and monthly respectively. The WAC is made up of members<br />
45 <strong>Local</strong> <strong>Hazard</strong> <strong>Mitigation</strong> <strong>Plan</strong> 1-18-08.doc
of the elected Councils and Boards of the <strong>Agency</strong>’s contractors and they discuss the <strong>Agency</strong>’s<br />
programs and budget in an open public forum. They are responsible for making<br />
recommendations on the <strong>Agency</strong>’s budget to the <strong>Agency</strong>’s Board of Directors. The TAC<br />
consists of managers and technical staff of the <strong>Agency</strong>’s contractors. They meet to discuss the<br />
day to day operation of the <strong>Agency</strong>’s system and to discuss the need for capital and mitigation<br />
projects. The <strong>Plan</strong> will be a regular topic of discussion before both of these groups.<br />
46 <strong>Local</strong> <strong>Hazard</strong> <strong>Mitigation</strong> <strong>Plan</strong> 1-18-08.doc
eferences<br />
1 <strong>Sonoma</strong> <strong>County</strong> <strong>Water</strong> <strong>Agency</strong>, Draft Report – Phase I for Natural <strong>Hazard</strong> Reliability<br />
Assessment of <strong>Water</strong> Supply and Transmission System, 2/10/2005, prepared by MMI<br />
Engineering.<br />
2 <strong>Sonoma</strong> <strong>County</strong> <strong>Water</strong> <strong>Agency</strong>, Draft Report – Seismic Assessment of <strong>Water</strong> Storage<br />
Tanks and Rodgers Creek Fault Deformation Zone, 4/15/2005, prepared by MMI<br />
Engineering.<br />
3 <strong>Sonoma</strong> <strong>County</strong> <strong>Water</strong> <strong>Agency</strong>, Draft Technical Memorandum – Seismic Vulnerability<br />
Assessment of Diversion System Caissons, 12/14/2006, prepared by MMI Engineering.<br />
4 <strong>Sonoma</strong> <strong>County</strong> <strong>Water</strong> <strong>Agency</strong>, Addendum I, Draft Technical Memorandum – Seismic<br />
Vulnerability Assessment of Transmission System, 02/6/2007, prepared by MMI<br />
Engineering.<br />
5 <strong>Sonoma</strong> <strong>County</strong> <strong>Water</strong> <strong>Agency</strong>, Draft Technical Memorandum – Seismic Vulnerability<br />
Overview of Contractor Systems, 03/29/2007, prepared by MMI Engineering.<br />
6 <strong>Sonoma</strong> <strong>County</strong> <strong>Water</strong> <strong>Agency</strong>, Technical Memorandum – Power Supply of SCWA<br />
Facilities, 06/05s/2006, prepared by MMI Engineering.<br />
7 <strong>Sonoma</strong> <strong>County</strong> Transmission System Reliability Study, Final Emergency Well Site<br />
Selection Results, 7/23/2007, prepared by HydroMetrics LLC.<br />
8 <strong>Sonoma</strong> <strong>County</strong> <strong>Water</strong> <strong>Agency</strong>, Emergency Operations <strong>Plan</strong>, Revision No. 6, September,<br />
1998, Operations Edition.<br />
9 <strong>Sonoma</strong> <strong>County</strong> <strong>Water</strong> <strong>Agency</strong>, Emergency Operations <strong>Plan</strong>, Revision No. 6, September,<br />
1998, Management Edition.<br />
10 <strong>Sonoma</strong> <strong>County</strong> <strong>Water</strong> <strong>Agency</strong>; 2005 Urban <strong>Water</strong> Management <strong>Plan</strong>, December 2006.<br />
11 FEMA, 386-1 State and <strong>Local</strong> <strong>Mitigation</strong> <strong>Plan</strong>ning, How-To Guide, Getting Started<br />
Building Support for <strong>Mitigation</strong> <strong>Plan</strong>ning, September 2002.<br />
12 FEMA, 386-2 State and <strong>Local</strong> <strong>Mitigation</strong> <strong>Plan</strong>ning, How-To Guide, Understanding Your<br />
Risks, Identifying <strong>Hazard</strong>s and Estimating Losses, August 2001.<br />
13 FEMA, 386-2 State and <strong>Local</strong> <strong>Mitigation</strong> <strong>Plan</strong>ning, How-To Guide, Understanding Your<br />
Risks, Identifying <strong>Hazard</strong>s and Estimating Losses, August 2001.<br />
14 FEMA, 386-3 State and <strong>Local</strong> <strong>Mitigation</strong> <strong>Plan</strong>ning, How-To Guide, Developing the<br />
<strong>Mitigation</strong> <strong>Plan</strong>, Identifying <strong>Mitigation</strong> Actions and Implementation Strategies, April<br />
2003.<br />
15 FEMA, 386-4 State and <strong>Local</strong> <strong>Mitigation</strong> <strong>Plan</strong>ning, How-To Guide, Bringing the <strong>Plan</strong> to<br />
Life, Implementing the <strong>Hazard</strong> <strong>Mitigation</strong> <strong>Plan</strong>, August 2003.<br />
16 FEMA, 386-5 State and <strong>Local</strong> <strong>Mitigation</strong> <strong>Plan</strong>ning, How-To Guide, Using Benefit-Cost<br />
Review in <strong>Mitigation</strong> <strong>Plan</strong>ning, May 2007.<br />
17 <strong>Sonoma</strong> <strong>County</strong> <strong>Hazard</strong> <strong>Mitigation</strong> <strong>Plan</strong>, <strong>Sonoma</strong> <strong>County</strong> Department of Emergency<br />
Services & <strong>Sonoma</strong> <strong>County</strong> Permit and Resource Management Department, Adopted<br />
September 19, 2006.<br />
47 <strong>Local</strong> <strong>Hazard</strong> <strong>Mitigation</strong> <strong>Plan</strong> 1-18-08.doc
18 <strong>Local</strong> <strong>Hazard</strong> <strong>Mitigation</strong> <strong>Plan</strong>ning Guidance, provided by Tennessee Emergency<br />
Management <strong>Agency</strong><br />
19 Orange <strong>County</strong> Regional <strong>Water</strong> and Wastewater Multi-<strong>Hazard</strong> <strong>Mitigation</strong> <strong>Plan</strong>, Orange<br />
<strong>County</strong>, California, Municipal <strong>Water</strong> District of Orange <strong>County</strong>, Final Draft Report,<br />
September 29, 2006.<br />
20 Meeting June 2, 2005, Alder Conference Room, 404 Aviation Boulevard, Santa Rosa:<br />
Attendees: Jay Jasperse (Deputy Chief Engineer, Engineering and Resource <strong>Plan</strong>ning),<br />
Cordel Stillman (Capital Projects Manager) <strong>Sonoma</strong> <strong>County</strong> <strong>Water</strong> <strong>Agency</strong>, Ahmed<br />
Nisar, MMI Engineering, George Roberts, Forestville <strong>Water</strong> District and Richard Burt<br />
(for Matt Mullan), Town of Windsor.<br />
21 Meeting June 2, 2005, Sequoia Conference Room, 404 Aviation Boulevard, Santa Rosa:<br />
Attendees: Jay Jasperse (Deputy Chief Engineer, Engineering and Resource <strong>Plan</strong>ning),<br />
Cordel Stillman (Capital Projects Manager) <strong>Sonoma</strong> <strong>County</strong> <strong>Water</strong> <strong>Agency</strong>, Ahmed<br />
Nisar, MMI Engineering, Darin Jenkins, City of Rohnert Park and Mike Ban, City of<br />
Petaluma.<br />
22 Meeting June 7, 2005, Alder Conference Room, 404 Aviation Boulevard, Santa Rosa:<br />
Attendees: Jay Jasperse (Deputy Chief Engineer, Engineering and Resource <strong>Plan</strong>ning),<br />
Cordel Stillman (Capital Projects Manager) <strong>Sonoma</strong> <strong>County</strong> <strong>Water</strong> <strong>Agency</strong>, Ahmed<br />
Nisar, MMI Engineering, Krishna Kumar, Valley of the Moon <strong>Water</strong> District and Al<br />
Bandur, City of <strong>Sonoma</strong>.<br />
23 Meeting August 26, 2005, 404 Aviation Boulevard, Santa Rosa: Attendees: Jay Jasperse<br />
(Deputy Chief Engineer, Engineering and Resource <strong>Plan</strong>ning), Cordel Stillman (Capital<br />
Projects Manager) <strong>Sonoma</strong> <strong>County</strong> <strong>Water</strong> <strong>Agency</strong>, Ahmed Nisar, MMI Engineering,<br />
Chris DeGabriele, North Marin <strong>Water</strong> District.<br />
24 Meeting September 15, 2005, 404 Aviation Boulevard, Santa Rosa: Attendees: Jay<br />
Jasperse (Deputy Chief Engineer, Engineering and Resource <strong>Plan</strong>ning), Cordel Stillman<br />
(Capital Projects Manager) <strong>Sonoma</strong> <strong>County</strong> <strong>Water</strong> <strong>Agency</strong>, Ahmed Nisar, MMI<br />
Engineering, Miles Ferris, City of Santa Rosa.<br />
25 Earthquake probabilities in the San Francisco Bay region: 2002-2031, a summary of<br />
findings: United States Geological Survey Open File Report 03-214.<br />
http://geopubs.wr.usgs.gov/open-file/of03-214, prepared by WGCEP (Working Group on<br />
California Earthquake Probabilities), 2003.<br />
26 Suppression of large earthquakes by stress shadows: a comparison of Coulomb and rateand-state<br />
failure: Journal of Geophysical Research, v. 103, p. 24,439, by Harris, R.A.,<br />
and Simpson, R.W., 1998.<br />
27 The Santa Rosa Earthquakes of October, 1969, in Mineral Information Service:<br />
California Division of Mines and Geology, v. 23, no. 3, p. 43-63, by Cloud, W.K., Hill,<br />
D.M., Huffman, M.E., Jennings, T.V., McEvily, T.V., Nason, R.D., Steinbrugge, K.V.,<br />
Tocher, D., Unger, J.D., Youd, T.L., 1970.<br />
28 Contemporary seismicity, active faulting and seismic hazards of the Coast Ranges<br />
between San Francisco Bay and Healdsburg, California: Journal of Geophysical<br />
Research, v. 96, no. B12, p.19,891-19,904 by Wong, I.G., 1991.<br />
48 <strong>Local</strong> <strong>Hazard</strong> <strong>Mitigation</strong> <strong>Plan</strong> 1-18-08.doc
29 "Mare Island" earthquake at the southern end of the Rodgers Creek fault, in Borchardt,<br />
G., and others, eds., Proceedings of the Second Conference on Earthquake <strong>Hazard</strong>s in the<br />
Eastern San Francisco Bay Area: California Division of Mines and Geology Special<br />
Publication 113, p. 385-392, by Toppozada, T.R., Bennett, J.H., Hallstrom, C.L., and<br />
Youngs, L.G., 1992, 1898.<br />
30 The Santa Rosa, California Earthquake of October 1, 1969 prepared by K.V. Steinbrugge,<br />
W.K. Cloud and N.H. Scott for U.S. Department of Commerce, Environmental Science<br />
Services Administration, 1970.<br />
31 Slip rate, earthquake recurrence, and seismogenic potential of the Rodgers Creek fault<br />
zone, northern California: Initial Results: Geophysical Research Letters, v. 18, no. 3, p.<br />
447-450, by Budding, K.E., Schwartz, D.P., and Oppenheimer, D.H., 1991.<br />
32 Late Holocene behavior and seismogenic potential of the Rodgers Creek fault zone,<br />
<strong>Sonoma</strong> <strong>County</strong>, California, in Borchardt, G., et al., eds., Proceedings of the Second<br />
Conference on Earthquake <strong>Hazard</strong>s in the Eastern San Francisco Bay Area: California<br />
Division of Mines and Geology Special Publication 113, p. 393-398, by Schwartz, D.P.,<br />
Pantosti, D., Hecker, S., Okumura, K., Budding, K.E., and Powers, T., 1992.<br />
33 The Bay Area Earthquake Cycle: A paleoseismic perspective: Eos (American<br />
Geophysical Union, Transactions), v. 82 (47), p. Abstract S12F-07 by Schwartz, D.P.,<br />
Seitz, G., Lienkaemper, J., Dawson, T., Hecker, S., Lettis, W., and Kelson, K., 2001.<br />
34 Toppozada T. et al., 1994, <strong>Plan</strong>ning Scenario for a Major Earthquake on the Rodgers<br />
Creek Fault in the Northern San Francisco Bay Area, CDMG Special Publication 112.<br />
35 McLaughlin, R.J., and Sarna-Wojcicki, A.M., 2003, Geology of the right stepover region<br />
between the Rodgers Creek, Healdsburg, and Maacama faults, northern San Francisco<br />
Bay region: U.S. Geological Survey Open-File Report 03-502, 23 p.,<br />
http://geopubs.wr.usgs.gov/open-file/of03-502.<br />
36 Empirical Response Spectral Attenuation Relations for Shallow Crustal Earthquakes,<br />
Seismological Research Letters, Vol. 68, No. 1, prepared by N.A. Abrahamson and W.J.<br />
Silva, January/February 1997.<br />
37 "Empirical Analysis of Horizontal Ground Displacement Generated by Liquefaction-<br />
Induced Lateral Spread” Technical Report NCEER-92-0021 by Bartlett, S. F. and Youd,<br />
T. L.1992 for National Center for Earthquake Engineering Research (NCEER).<br />
38 "Revised Multilinear Regression Equations for Prediction of Lateral Spread<br />
Displacements" Journal of Geotechnical Engineering, ASCE, by Bartlett, S. F. and Youd,<br />
T. L., 2002.<br />
39 ‘‘Historic ground failures in northern California triggered by earthquakes.’’ Professional<br />
Paper 993, U.S. Geological Survey, Menlo Park, Calif., 177, by Youd, T. L., and Hoose,<br />
S. N. 1978 .<br />
40 State of California; The Resources <strong>Agency</strong>; Department of <strong>Water</strong> Resources; Preparing<br />
for California’s Next Drought, Changes Since 1987-92, July 2000.<br />
41 State of California; Department of <strong>Water</strong> Resources; Drought Preparedness,<br />
http://watersupplyconditions.water.ca.gov.<br />
42 The Weather Channel http://www.weather.com/encyclopedia/tornado/climo.html.<br />
49 <strong>Local</strong> <strong>Hazard</strong> <strong>Mitigation</strong> <strong>Plan</strong> 1-18-08.doc
43 The Tornado Project http://www.tornadoproject.com.<br />
44 Source: The Weather Channel<br />
http://www.weather.com/encyclopedia/tropical/climo.html.<br />
45 Source: The USA TODAY Weather Book by Jack Williams). (Source: USA Today<br />
website http://www.usatoday.com/weather/whpacg.htm.<br />
46 Preliminary Reports from the Hyogo-ken Nambu Earthquake of January 17, 1995,<br />
prepared by the Multidisciplinary Center for Earthquake Engineering Research<br />
(MCEER).<br />
47 Using GIS to Assess <strong>Water</strong> Supply Damage from the Northridge Earthquake, prepared by<br />
Thomas O’Rourke and Selcuk Toprak for the National Center for Earthquake<br />
Engineering Research (NCEER) Bulletin.<br />
50 <strong>Local</strong> <strong>Hazard</strong> <strong>Mitigation</strong> <strong>Plan</strong> 1-18-08.doc
APPENDIX A<br />
Table A-1<br />
List of Drawings Reviewed<br />
S. No Name of the File Year<br />
1. Russian River Cotati Intertie Project – Pipe Contract No. 1 Contract No 60-4-7#1 1975<br />
2. Russian River Cotati Intertie Project – Pipe Contract No. 2 Contract No 60-4-7#2 1975<br />
3. Russian River Cotati Intertie Project – Pipe Contract No. 3 Contract No 60-4-7# 1975<br />
4.<br />
Special Provisions And Contract Drawings For Construction of Russian River Project – <strong>Sonoma</strong><br />
Aqueduct Pipeline and Appurtenances<br />
1962<br />
5.<br />
Special Provisions And Contract Drawings For Construction of Russian River Project – <strong>Sonoma</strong><br />
Aqueduct Glen Ellen Branch<br />
1964<br />
6. Russian River Project – Aqueduct Number 1 1957<br />
7. Petaluma Aqueduct <strong>Water</strong> Transmission Pipeline 1963<br />
8. Oakmont Pipeline Contract No 60-4-7#5 1988<br />
9. Eldridge Madarone Pipeline Project 2005<br />
10.<br />
Kawana Springs Pipeline East (Petaluma Aqueduct To Kawana Springs Tank No.1) Contract No. 60-<br />
4-7<br />
2001<br />
11.<br />
Pump and Collector Capacity Project – Caisson and Access Road For Wohler Collector No. 6 Contract<br />
No. 60-5-7<br />
2001<br />
12. Pump and Collector Capacity Project Wohler-Forestville Pipeline 2004<br />
A-1 <strong>Local</strong> <strong>Hazard</strong> <strong>Mitigation</strong> <strong>Plan</strong> 1-18-08.doc
S. No Name of the File Year<br />
13.<br />
Special Provisions And Contract Drawings For Construction of Russian River Project – Horizontal<br />
<strong>Water</strong> Collectors Near Mirabel at The Russian River 60-5-7#1<br />
1973<br />
14.<br />
Special Provisions And Contract Drawings For Construction of Mirabel Collector No. 5 Contract No<br />
60-5-7#5<br />
1982<br />
15.<br />
Project Manual Volume 2 For Pump and Collector Capacity Project – Wohler Forestville Pipeline<br />
Contract No 60-4-7#10<br />
2004<br />
16.<br />
Russian River Well Field Development (Equipment) Early Warning System Station No. 1 And Mirabel<br />
Inflatable Dam Fabric Replacement<br />
1995<br />
17.<br />
Specifications and Contract Drawings For Wohler Site Improvements: Standby Generator<br />
Replacement and Temporary Power Delivery System (PDS) For Substation Replacement Contract No<br />
60-6-7#27<br />
2000<br />
18.<br />
<strong>Sonoma</strong> <strong>County</strong> <strong>Water</strong> <strong>Agency</strong>: Wohler/Mirabel 12 KV Underground and Overhead Power Line<br />
Modifications<br />
2006<br />
19.<br />
Project Manual Volume 2 For Pump and Collector Capacity Project Pumphouse and Connecting<br />
Pipeline For Wohler Collector #6 Contract No 60-4&6-7#1<br />
2002<br />
20. Project Manual For Eldridge-Madrone Project Contract No 60-4-7#11 2004<br />
21.<br />
Kawana Springs Pipeline West (Vicinity of Wright Road To Petaluma Aqueduct) And Russian River<br />
Well Field Valve Replacements (Mirabel Area) Contract No 60-4-7#8 & 60-6-7#19<br />
1999<br />
22 Special Provisions and Contract Drawings for Ralphine Reservoir No. 3 Contract No 60-7-7 No.2 1970<br />
23<br />
Special Provisions and Contract Drawings for Grading and Appurtenances For Ralphine Reservoir No.<br />
3 Contract No 60-7-7 No. 1<br />
1970<br />
24<br />
Project Manual And Contract Drawings For Construction OF Anadel reservoir No.2 And Cotati<br />
Reservoir No.3 Contract No 60-7-7 No.23<br />
1992<br />
25<br />
Project Manual And Contract Drawings For Grading Piping and Appurtenances For Anadel reservoir<br />
No.2 , Cotati Reservoir No.3 and Warm Springs Reservoir Contract No 60-7-7 No.21<br />
1985<br />
26<br />
Special Provisions and Contract Drawings for Construction of Russian River Cotati Intertie Project:<br />
Grading and Appurtenances Cotati Reservoir Contract No 60-7-7 No.7<br />
1974<br />
A-2 <strong>Local</strong> <strong>Hazard</strong> <strong>Mitigation</strong> <strong>Plan</strong> 1-18-08.doc
S. No Name of the File Year<br />
27<br />
Special Provisions and Contract Drawings for Construction of Russian River Cotati Intertie Project:<br />
Cotati Reservoir Contract No 60-7-7 No.8<br />
1974<br />
28<br />
Special Provisions and Contract Drawings: Grading and Appurtenances for Ralphine Reservoir No. 4<br />
Contract No 60-7-7 No.5<br />
1973<br />
29<br />
Special Provisions and Contract Drawings for Construction of Russian River Cotati Intertie Project:<br />
Ralphine Reservoir No. 4 Contract No 60-7-7 No.6<br />
1974<br />
30<br />
Specifications and Contract Drawings For Ralphine Tank No.4 Valve Seismic Control System Contract<br />
No 60-7-7 No.51<br />
1999<br />
31<br />
Special Provisions and Contract Drawings Russian River Project For Construction Of Ralphine<br />
Reservoir No.2 For Petaluma Aqueduct<br />
1961<br />
32<br />
Special Provisions and Contract Drawings for Construction of Russian River Cotati Intertie Project:<br />
Grading and Appurtenances Cotati Reservoir No. 2 Contract No 60-7-7 No.10<br />
1980<br />
33<br />
Special Provisions and Contract Drawings for Construction of Russian River Cotati Intertie Cotati<br />
Reservoir No. 2 Contract No 60-7-7 No.11<br />
1980<br />
34 Specifications and Contract Drawings For Kawana Springs Tank No.1 Contract No 60-7-7 No.45 1998<br />
35<br />
Special Provisions and Contract Drawings For Construction Kastania Reservoir Contract No 60-7-7<br />
No.14<br />
1983<br />
36<br />
Specification and Contract Drawings For Seismic Retrofit For Eldridge Reservoir No.1 & Forestville<br />
Reservoirs No. 1 & No.2<br />
1995<br />
37<br />
Special Provisions And Contract Drawings Grading and Appurtenances For Eldridge Reservoir No. 2<br />
Contract No: 60-7-7 #3<br />
1972<br />
38<br />
Specification and Contract Drawings For Seismic Retrofit For Anadel Reservoir No.1 & <strong>Sonoma</strong><br />
Reservoir No. 1 Contract No. 60-7-7 #29<br />
1994<br />
39<br />
Specification and Contract Drawings For Seismic Retrofit for Eldridge Reservoir No.1 & Forestville<br />
Reservoir No.1 & No.2 Contract No. 60-7-7 #37<br />
1995<br />
40<br />
Special Provisions And Contract Drawings For Construction of Grading, Piping and Appurtenances<br />
For Forestville Reservoir No. 2 Contract No: 60-7-7 #16<br />
1989<br />
A-3 <strong>Local</strong> <strong>Hazard</strong> <strong>Mitigation</strong> <strong>Plan</strong> 1-18-08.doc
S. No Name of the File Year<br />
41<br />
Special Provisions And Contract Drawings For Construction of Forestville Reservoir No. 2 Contract<br />
No: 60-7-7 #17<br />
1990<br />
42<br />
Special Provisions And Contract Drawings: Russian River Project For Construction of Forestville<br />
Reservoir No. 1<br />
1961<br />
43<br />
Special Provisions And Contract Drawings For Construction of <strong>Sonoma</strong> Reservoir No. 2 Grading<br />
Piping and Appurtenances Contract No: 60-7-7 #15<br />
1991<br />
44<br />
Special Provisions And Contract Drawings: Russian River Project For Construction of Storage<br />
Reservoirs For <strong>Sonoma</strong> Aqueduct Contract No. 52-7-7#2<br />
1962<br />
A-4 <strong>Local</strong> <strong>Hazard</strong> <strong>Mitigation</strong> <strong>Plan</strong> 1-18-08.doc
Table A-2<br />
List of Facility Geotechnical Reports Reviewed<br />
S. No Title Consultant Date<br />
1<br />
2<br />
Geotechnical Investigation Proposed Seismic<br />
Repair Work Mirabel Collectors NOS. 3 AND 4<br />
<strong>Sonoma</strong> <strong>County</strong>, California For The <strong>Sonoma</strong><br />
<strong>County</strong> <strong>Water</strong> <strong>Agency</strong>.<br />
A Geophysical Survey of the Wohler Aquifer Study<br />
Area Russian River, California<br />
Consulting Engineers 08-13-1985<br />
NORCAL Geophysical Consultants 09-14-1987<br />
3<br />
Hydrogeologic Investigation Wohler Aquifer Study<br />
<strong>Sonoma</strong> <strong>County</strong>, California<br />
Harding Lawson Associates 12-09-1988<br />
4<br />
5<br />
Report of Findings Preliminary Soil and<br />
Groundwater investigation: Wohler Road Pumping<br />
Facility<br />
Report of Hydrogeologic Evaluation Russian River<br />
well Field Investigation (Near Mirabel) <strong>Sonoma</strong><br />
<strong>County</strong>, California<br />
Brunsing Asociates Inc 09-30-1991<br />
Herzog Associates, Inc 12-16-1992<br />
6<br />
Seismic Refraction Survey Russian River Well Field<br />
Investigation <strong>Sonoma</strong> <strong>County</strong>, California.<br />
Harding Lawson Associates 04-30-1993<br />
7<br />
Hydrogeologic Evaluation Kaiser sand and gravel<br />
company property Healdsburg, California.<br />
PES Environmental, Inc 12-17-1998<br />
8<br />
Hydrogeologic Evaluations Westside Farms and<br />
Lazy "W" Ranch Healdsburg, California<br />
PES Environmental, Inc 12-11-1998<br />
9<br />
Seismic Refraction Survey Pump and Collector<br />
Capacity Project <strong>Sonoma</strong> <strong>County</strong>, California<br />
NORCAL Geophysical Consultants 06-07-1999<br />
10<br />
11<br />
Geotechnical Investigation <strong>Sonoma</strong> <strong>County</strong> <strong>Water</strong><br />
<strong>Agency</strong> pH Adjustment/Corrosion Control Facility<br />
9750 Wohler Road, <strong>Sonoma</strong> <strong>County</strong>, California<br />
Geotechnical Investigation <strong>Sonoma</strong> <strong>County</strong> <strong>Water</strong><br />
<strong>Agency</strong> Wohler Substation Replacement 9750<br />
Wohler Road, <strong>Sonoma</strong> <strong>County</strong>, California<br />
Brunsing Associates 02-28-1994<br />
Brunsing Associates 02-15-1999<br />
12<br />
Geotechnical Investigation Wohler Collector 6<br />
Pumphouse <strong>Sonoma</strong> <strong>County</strong>, California<br />
RGH Geotechnical and<br />
Environmental Consultants<br />
04-26-2002<br />
13 Seismic Refraction Survey Wohler Pipeline<br />
RGH Geotechnical and<br />
Environmental Consultants<br />
04-2001<br />
14<br />
Geotechnical Investigation Proposed Seismic<br />
Retrofit Annadel Reservoir No. 1 <strong>Sonoma</strong> <strong>County</strong>,<br />
California<br />
Brunsing Associates 06-25-1995<br />
15<br />
Geotechnical Investigation Collector 6 Pipeline And<br />
Wohler-Forestville Pipeline Projects <strong>Sonoma</strong><br />
<strong>County</strong>, California.<br />
RGH geotechnical and<br />
Environmental Consultants<br />
06-25-1995<br />
A-5 <strong>Local</strong> <strong>Hazard</strong> <strong>Mitigation</strong> <strong>Plan</strong> 1-18-08.doc
S. No Title Consultant Date<br />
16<br />
17<br />
Geotechnical Investigation Report For Seismic<br />
Retrofits of Eldridge Reservoir No.1 AND<br />
Forestville Reservoir NOS. 1 & 2 <strong>Sonoma</strong> <strong>County</strong><br />
California<br />
Structural Evaluation of the <strong>Sonoma</strong> <strong>County</strong> <strong>Water</strong><br />
<strong>Agency</strong> Administration Building and O&M Center<br />
for Seismic Conditions.<br />
Kleinfelder, Inc 03-03-1995<br />
MKM & Associates 06-03-1997<br />
18 Summary of Subsurface Investigations WLA 04-21-2006<br />
19<br />
Geological Investigation For The Proposed Santa<br />
Rosa Creek Dam and Reservoir<br />
Woodward, Clyde, Sherard and<br />
Associates<br />
02-24-59<br />
20<br />
Geology of the Healdsburg Quadrangle, California<br />
Mineralogy of the California Glaucophone Schists,<br />
State of Califonia (Including Maps)<br />
July 1951<br />
21 Geotechnical Assessment of Aqueduct System WLA<br />
October<br />
2006<br />
A-6 <strong>Local</strong> <strong>Hazard</strong> <strong>Mitigation</strong> <strong>Plan</strong> 1-18-08.doc
475 14 th Street<br />
Suite 400<br />
Oakland, CA 94612<br />
Tel: 510 836 3002<br />
Fax: 510 836 3036<br />
APPENDIX B<br />
Board of Supervisors<br />
Resolution for Adoption of<br />
<strong>Sonoma</strong> <strong>County</strong> <strong>Water</strong> <strong>Agency</strong> <strong>Local</strong> <strong>Hazard</strong> <strong>Mitigation</strong> <strong>Plan</strong><br />
<strong>Local</strong> <strong>Hazard</strong> <strong>Mitigation</strong> <strong>Plan</strong> 1-18-08.doc
RUSSIAN R<br />
<br />
<br />
<br />
= Booster Station<br />
!( Chlorination Facility<br />
ED Collector Station<br />
d¾ Corrosion Control Facility<br />
Diversion Structure<br />
^<br />
Thurston Creek<br />
kj Storage Tank<br />
Tannery Creek<br />
Mirabel Well Field<br />
Agua Caliente Creek<br />
V Production Wells<br />
<br />
Arroyo Seco<br />
Gossage Creek<br />
Quaternary & Pre-Quaternary Faults<br />
<br />
Fault Trace<br />
<br />
Concealed<br />
Inferred<br />
Approximate<br />
Sche l Slough<br />
Well Located<br />
* Pipeline route are approximated<br />
from drawings<br />
μ<br />
<br />
Humbug Creek<br />
Mill Creek<br />
Mirabel Wells 1-7<br />
Mirabel Chlorination<br />
Mirabel Collectors<br />
(No. 1 - 3)<br />
!(<br />
River Road Chlorine and<br />
Corrosion Control<br />
EDEDED<br />
Wohler Collectors<br />
#1, #2 & #6<br />
^<br />
EDED<br />
d¾<br />
!(<br />
d¾<br />
!(<br />
= kjkj<br />
Forestville Tanks<br />
(0.3 and 1 MG)<br />
Forestville<br />
Booster Station<br />
<br />
Pool Creek<br />
Hobson Creek<br />
MARK WEST CR<br />
Wohler Chlorination and<br />
Corrosion Control<br />
Van Buren Creek<br />
MARK WEST CR<br />
Occidental<br />
Road Well<br />
V<br />
V<br />
_<br />
Windsor<br />
Weeks Creek<br />
Rincon Creek<br />
V<br />
_<br />
Kawana Springs<br />
Booster Station<br />
=<br />
Sebastopol<br />
Road Well<br />
Larkfield<br />
Ducker Creek<br />
Todd Road<br />
Well<br />
§¨¦ <br />
_<br />
kj<br />
<strong>Sonoma</strong> Booster<br />
Station<br />
(No. 1 and 2)<br />
Smith Creek<br />
Kawana Springs<br />
Tank<br />
(10 MG)<br />
kjkjkjkj<br />
=<br />
Piner Creek<br />
Duvoul Creek<br />
Santa Rosa<br />
Ralphine<br />
Tanks<br />
( 6, 6, 6<br />
and 18 MG)<br />
kj<br />
Annadel Tank 2<br />
(3 MG)<br />
SANTA ROSA CR<br />
kj<br />
MATANZAS CR<br />
GREEN VALLEY CR<br />
Grab Creek<br />
Dutch Bi l Creek<br />
Annadel Tank 1<br />
(2.5 MG)<br />
Lancel Creek<br />
Atascadero Creek<br />
Purrington Creek<br />
Calabazas Creek<br />
§¨¦ <br />
Yulupa Creek<br />
Stuart Creek<br />
=<br />
Wilfred Booster<br />
Station<br />
Wohler Chlorine &<br />
§¨¦ Wohler Collector #1<br />
Corrosion Control<br />
Cotati<br />
kjkjkj _<br />
Cotati Tanks<br />
(6, 12 and 18 MG)<br />
Wohler Collector #2<br />
Pengrove<br />
kjkj<br />
_<br />
_<br />
River Diversion<br />
Ely Booster<br />
= Station<br />
Petaluma<br />
Mirabel Wells<br />
_<br />
§¨¦ <br />
Kastania Tank<br />
kj = Kastania (12 MG)<br />
Station<br />
Booster<br />
§¨¦ <br />
_<br />
Copeland Creek<br />
Eldridge<br />
Booster<br />
Station<br />
= kjkj<br />
Eldridge Tanks<br />
(2 and 6 MG)<br />
Nolan Creek<br />
Porter Creek<br />
Crane Creek<br />
Rohnert Park<br />
SALMON CR<br />
Mill Creek<br />
Ebabias Creek<br />
Lichau Creek<br />
SONOMA CR<br />
Americano Creek<br />
<strong>Sonoma</strong> Tanks<br />
(2 and 8 MG)<br />
Dowdall Creek<br />
<strong>Sonoma</strong><br />
Willow Brook<br />
Nathanson Creek<br />
Carriger Creek<br />
Mirabel Chlorination<br />
Felder Creek<br />
Lewis Creek<br />
Rodgers Creek<br />
PETALUMA R<br />
STEMPLE CR<br />
Fowler Creek<br />
Champlin Creek<br />
Lynch Creek<br />
ADOBE CR<br />
Mirabel Collectors<br />
(No. 1-3)<br />
Wohler Chlorine #6<br />
RUSSIAN R<br />
RUSSIAN R<br />
RUSSIAN R<br />
MARK WEST CR<br />
TOLAY CR<br />
Donahue Slough<br />
Schultz Slough<br />
<br />
Fay Creek<br />
RUSSIAN R<br />
RUSSIAN R<br />
Fife Creek<br />
RUSSIAN R<br />
RUSSIAN R
Blue Jay Creek<br />
Coleman Valley Creek<br />
³<br />
!( !( !(<br />
!( !(<br />
!( !(<br />
<br />
<br />
ROCKPILE CR<br />
Little Creek<br />
Franchini Creek<br />
Porter Creek<br />
Soda Springs Creek<br />
Grasshopper Creek<br />
Fuller Creek<br />
Osser Creek<br />
BUCKEYE CR<br />
Flat Ridge Creek<br />
Galloway Creek<br />
White Creek<br />
Tombs Creek<br />
Rancheria Creek<br />
Strawberry Creek<br />
Brush Creek<br />
Willow Springs Creek<br />
Porterfield Creek<br />
Icaria Creek<br />
DRY CR<br />
Barrelli Creek<br />
Fall Creek<br />
Pena Creek<br />
Dutcher Creek<br />
Crocker Creek<br />
<br />
<br />
!( !(<br />
Gill Creek<br />
Miller Creek<br />
Gird Creek<br />
LITTLE SULPHUR CR<br />
SAUSAL CR<br />
Hot Springs Creek<br />
Burns Creek<br />
BIG SULPHUR CR<br />
McDonnell Creek<br />
Bluegum Creek<br />
Bear Creek<br />
Coon Creek<br />
Briggs Creek<br />
Mill Stream<br />
<br />
<br />
!(<br />
!(<br />
Lift Station<br />
Waste <strong>Water</strong> Treatment <strong>Plan</strong>t<br />
Sanitation District/Zone Boundary<br />
0 1 2 3 Miles<br />
GUALALA R, S FK<br />
Britain Creek<br />
MAACAMA CR<br />
Stewarts Creek<br />
Danfield Creek<br />
House Creek<br />
Cedar Creek<br />
WARM SPRINGS<br />
Fall Creek<br />
Redwood Log Creek<br />
Pena Creek<br />
Chapman Branch<br />
tu <br />
Yellowjacket Creek<br />
<br />
Wine Creek<br />
Pechaco Creek<br />
Kelley Creek<br />
Redwood Creek<br />
Warren Creek<br />
Miller Creek<br />
Marshall Creek<br />
McKenzie Creek<br />
Bearpen Creek<br />
Red Slide Creek<br />
Black Rock Creek<br />
Sulphur Creek<br />
Devil Creek<br />
Woods Creek<br />
Thompson Creek<br />
Gray Creek<br />
Gilliam Creek<br />
Angel Creek<br />
MILL CR<br />
Wallace Creek<br />
Felta Creek<br />
Brooks Creek<br />
Barnes Creek<br />
FRANZ CR<br />
Bidwell Creek<br />
Timber Cove Creek<br />
Turner Canyon<br />
Ward Creek<br />
Russian Gulch<br />
AUSTIN CR<br />
# Hulbert Creek<br />
Mission Creek<br />
RUSSIAN R<br />
Fife Creek<br />
!(<br />
!(<br />
!(<br />
!(<br />
<br />
<br />
!(<br />
!(<br />
Smith Creek<br />
Osborne Creek<br />
RUSSIAN R<br />
Hobson Creek<br />
Press Creek<br />
!(<br />
!(!(<br />
!(<br />
RUSSIAN R<br />
§¨¦ <br />
<br />
<br />
!(<br />
<br />
<br />
Windsor Creek<br />
Pool Creek<br />
!(<br />
Piner Creek<br />
Porter Creek<br />
Mill Creek<br />
Rincon Creek<br />
MARK WEST CR<br />
Ducker Creek<br />
Humbug Creek<br />
Weeks Creek<br />
Van Buren Creek<br />
SANTA ROSA CR<br />
Carson Cr<br />
Schoolhouse Creek<br />
Sheephouse Creek<br />
Orrs Creek<br />
RUSSIAN R<br />
Furlong Gulch<br />
RUSSIAN R<br />
Willow Creek<br />
Dutch Bill Creek<br />
Bohemian Creek<br />
!(<br />
Purrington Creek<br />
!(<br />
!(<br />
!(<br />
<br />
<br />
MATANZAS CR<br />
PACIFIC OCEAN<br />
Rough Creek<br />
Scotty Creek<br />
Finley Creek<br />
Johnson Gulch<br />
Quinlan Gulch<br />
Cheney Gulch<br />
PACIFIC OCEAN<br />
Fay Creek<br />
Tannery Creek<br />
Thurston Creek<br />
Nolan Creek<br />
SALMON CR<br />
!(<br />
<br />
<br />
Ebabias Creek<br />
Atascadero Creek<br />
Americano Creek<br />
tu tu tu <br />
<br />
<br />
Gossage Creek<br />
!(<br />
Copeland Creek<br />
Lichau Creek<br />
Crane Creek<br />
Willow Brook<br />
Yulupa Creek<br />
SONOMA CR<br />
Carriger Creek<br />
!(<br />
!(<br />
!(<br />
Calabazas Creek<br />
Stuart Creek<br />
<br />
<br />
Arroyo Seco<br />
Rodgers Creek<br />
STEMPLE CR<br />
<br />
<br />
!(<br />
PETALUMA R<br />
Lynch Creek<br />
ADOBE CR<br />
Felder Creek<br />
Champlin Creek<br />
!(<br />
tu <br />
tu <br />
Schultz Slough<br />
TOLAY CR
Wohler and Mirabel<br />
Production Facilities<br />
<br />
<br />
<br />
<br />
<br />
<br />
<br />
<br />
<br />
<br />
<br />
<br />
<br />
<br />
<br />
<br />
<br />
<br />
<br />
<br />
<br />
<br />
<br />
<br />
Wohler and Mirabel<br />
Production Facilities
tu 101 §¨¦ 280 §¨¦ 880<br />
!( <br />
§¨¦ 5<br />
HEALDSBURG FAULT<br />
<br />
!(<br />
MAACAMA FAULT<br />
§¨¦ 505<br />
tu 101 tu 101<br />
<br />
Austin Creek State Rec Area<br />
<br />
§¨¦ 80<br />
<br />
<br />
<br />
<br />
§¨¦ 780<br />
Point Reyes Natl Seashore<br />
<br />
Golden Gate National Rec Area<br />
§¨¦ 580 <br />
Mount Tamalpais State Park<br />
tu 101<br />
tu 101 <br />
<br />
§¨¦ 280<br />
SAN ANDREAS FAULT<br />
tu 101 tu 1<br />
RODGERS CREEK FAULT<br />
§¨¦ 380 §¨¦ 980<br />
CONCORD GREEN VALLEY FAULT<br />
HAYWARD FAULT<br />
<br />
Mount Diablo State<br />
<br />
μMiles<br />
0 10 20
Source: USGS – http://quake.wr.usgs.gov/research/seismology/wg02/media.html
Source: USGS – http://quake.wr.usgs.gov/research/seismology/wg02/media.html
Wohler Intertie<br />
<br />
<br />
<br />
<br />
<br />
<br />
<br />
<br />
<br />
<br />
<br />
<br />
<br />
<br />
<br />
<br />
<br />
<br />
<br />
<br />
<br />
<br />
<br />
<br />
<br />
<br />
Cotati 1<br />
Forestville<br />
Aqueduct<br />
<br />
<br />
<br />
<br />
<br />
<br />
<br />
<br />
<br />
<br />
<br />
<br />
Kawana 1<br />
<br />
<br />
<br />
<br />
<br />
Kawana 2<br />
<br />
<br />
Santa Rosa 1<br />
101<br />
<br />
Santa Rosa 2<br />
Santa Rosa 3<br />
<br />
<br />
<br />
Petaluma 1<br />
Kawana 3<br />
Petaluma 2<br />
<br />
<br />
<br />
<br />
<br />
<br />
<br />
<br />
<br />
<strong>Sonoma</strong> 1<br />
<br />
<br />
<br />
<br />
<br />
<br />
<br />
<br />
<br />
Oakmont<br />
<br />
<br />
<br />
<strong>Sonoma</strong> 2<br />
12<br />
Ground Shaking <strong>Hazard</strong><br />
Map<br />
Legend<br />
SCWA Facilities<br />
Facility type<br />
<br />
<br />
<br />
<br />
<br />
<br />
<br />
<br />
<br />
<br />
<br />
<br />
Peak Ground Acceleration<br />
<br />
<br />
<br />
<br />
<br />
<br />
<br />
Rodgers Creek Fault<br />
<br />
<br />
<br />
<br />
<br />
<br />
<br />
<br />
<br />
<br />
1<br />
<br />
Cotati 2<br />
<br />
Cotati 3<br />
<br />
<br />
<br />
Petaluma 3<br />
<br />
<br />
<br />
<br />
<br />
<br />
<br />
<br />
<br />
<br />
<strong>Sonoma</strong> 3<br />
<br />
<br />
<br />
<br />
<br />
<br />
Petaluma 4<br />
<br />
<br />
<br />
Petaluma 5<br />
<br />
<br />
<br />
<br />
<br />
<br />
<br />
<br />
<br />
<br />
<br />
<br />
<br />
121<br />
<br />
Marin Aqueduct<br />
116
Wohler Intertie<br />
<br />
<br />
<br />
<br />
<br />
<br />
<br />
<br />
<br />
<br />
<br />
<br />
<br />
<br />
<br />
<br />
<br />
<br />
<br />
<br />
<br />
<br />
<br />
<br />
<br />
<br />
<br />
Cotati 1<br />
Forestville<br />
Aqueduct<br />
<br />
<br />
<br />
<br />
<br />
<br />
<br />
<br />
<br />
<br />
Kawana 1<br />
<br />
<br />
<br />
<br />
<br />
<br />
Kawana 2<br />
<br />
<br />
Santa Rosa 1<br />
<br />
Santa Rosa 2<br />
Santa Rosa 3<br />
<br />
<br />
<br />
Petaluma 1<br />
Kawana 3<br />
Petaluma 2<br />
<br />
<br />
<br />
<br />
<br />
<br />
<br />
<br />
<br />
<strong>Sonoma</strong> 1<br />
<br />
<br />
<br />
<br />
<br />
<br />
<br />
<br />
<br />
Oakmont<br />
<br />
<br />
<br />
<strong>Sonoma</strong> 2<br />
<br />
Liquefaction and<br />
Lateral Spread <strong>Hazard</strong><br />
Legend<br />
SCWA Facilities<br />
Facility type<br />
<br />
<br />
<br />
<br />
<br />
<br />
<br />
<br />
<br />
<br />
<br />
<br />
<br />
Liquefaction Potential<br />
<br />
<br />
<br />
<br />
<br />
<br />
<br />
Rodgers Creek Fault<br />
<br />
<br />
<br />
<br />
<br />
<br />
<br />
<br />
<br />
<br />
<br />
Cotati 2<br />
<br />
Cotati 3<br />
<br />
<br />
<br />
Petaluma 3<br />
<br />
<br />
<br />
<br />
<br />
<br />
<br />
<br />
<br />
<strong>Sonoma</strong> 3<br />
<br />
<br />
<br />
<br />
<br />
<br />
Petaluma 4<br />
<br />
<br />
<br />
Petaluma 5<br />
<br />
<br />
<br />
<br />
<br />
<br />
<br />
<br />
<br />
<br />
<br />
<br />
<br />
<br />
Marin Aqueduct
Wohler Intertie<br />
<br />
<br />
<br />
<br />
<br />
<br />
<br />
<br />
<br />
<br />
<br />
<br />
<br />
<br />
<br />
<br />
<br />
<br />
<br />
<br />
<br />
<br />
<br />
<br />
<br />
Cotati 1<br />
Forestville<br />
Aqueduct<br />
<br />
<br />
<br />
<br />
<br />
<br />
<br />
<br />
<br />
<br />
<br />
Kawana 1<br />
<br />
<br />
<br />
<br />
<br />
Kawana 2<br />
<br />
<br />
Santa Rosa 1<br />
<br />
Santa Rosa 2<br />
Santa Rosa 3<br />
<br />
<br />
<br />
Petaluma 1<br />
Kawana 3<br />
Petaluma 2<br />
<br />
<br />
<br />
<br />
<br />
<br />
<br />
<br />
<br />
<strong>Sonoma</strong> 1<br />
<br />
<br />
<br />
<br />
<br />
<br />
<br />
<br />
<br />
Oakmont<br />
<br />
<br />
<br />
<strong>Sonoma</strong> 2<br />
<br />
Legend<br />
SCWA Facilities<br />
Facility type<br />
<br />
<br />
<br />
<br />
<br />
<br />
<br />
<br />
<br />
<br />
<br />
Landslide <strong>Hazard</strong><br />
<br />
Landslide <strong>Hazard</strong><br />
<br />
<br />
<br />
<br />
<br />
<br />
<br />
<br />
<br />
<br />
<br />
Cotati 2<br />
<br />
Cotati 3<br />
<br />
<br />
<br />
Petaluma 3<br />
<br />
<br />
<br />
<br />
<br />
<br />
<br />
<br />
<br />
<strong>Sonoma</strong> 3<br />
<br />
<br />
<br />
<br />
<br />
<br />
Petaluma 4<br />
<br />
<br />
<br />
Petaluma 5<br />
<br />
<br />
<br />
<br />
<br />
<br />
<br />
<br />
<br />
<br />
<br />
<br />
<br />
<br />
Marin Aqueduct<br />
<br />
<br />
<br />
<br />
<br />
<br />
0
Wohler Intertie<br />
<br />
<br />
<br />
<br />
<br />
<br />
<br />
<br />
<br />
<br />
<br />
<br />
<br />
<br />
<br />
<br />
<br />
<br />
<br />
<br />
<br />
<br />
<br />
<br />
<br />
<br />
Cotati 1<br />
Forestville<br />
Aqueduct<br />
<br />
<br />
<br />
<br />
<br />
<br />
<br />
<br />
<br />
<br />
Kawana 1<br />
<br />
<br />
<br />
<br />
<br />
<br />
Kawana 2<br />
<br />
<br />
Santa Rosa 1<br />
<br />
Santa Rosa 2<br />
Santa Rosa 3<br />
<br />
<br />
<br />
Petaluma 1<br />
Kawana 3<br />
Petaluma 2<br />
<br />
<br />
<br />
<br />
<br />
<br />
<br />
<br />
<br />
<strong>Sonoma</strong> 1<br />
<br />
<br />
<br />
<br />
<br />
<br />
<br />
<br />
<br />
Oakmont<br />
<br />
<br />
<br />
<strong>Sonoma</strong> 2<br />
<br />
Legend<br />
SCWA Facilities<br />
Facility type<br />
<br />
<br />
<br />
<br />
<br />
<br />
<br />
<br />
<br />
<br />
<br />
<br />
Flood <strong>Hazard</strong><br />
<br />
FEMA Flood Zones<br />
<br />
<br />
<br />
<br />
<br />
<br />
<br />
<br />
<br />
<br />
<br />
Cotati 2<br />
<br />
Cotati 3<br />
<br />
<br />
<br />
Petaluma 3<br />
<br />
<br />
<br />
<br />
<br />
<br />
<br />
<br />
<br />
<strong>Sonoma</strong> 3<br />
<br />
<br />
<br />
<br />
<br />
<br />
Petaluma 4<br />
<br />
<br />
<br />
Petaluma 5<br />
<br />
<br />
<br />
<br />
<br />
<br />
<br />
<br />
<br />
<br />
<br />
<br />
<br />
<br />
Marin Aqueduct
ocatio odamagig ladslide.
Wohler Intertie<br />
<br />
<br />
<br />
<br />
<br />
<br />
<br />
<br />
<br />
<br />
<br />
<br />
<br />
<br />
<br />
<br />
<br />
<br />
<br />
<br />
<br />
<br />
<br />
<br />
<br />
<br />
<br />
<br />
Cotati 1<br />
Forestville<br />
Aqueduct<br />
<br />
<br />
<br />
<br />
<br />
<br />
<br />
<br />
<br />
<br />
<br />
Kawana 1<br />
<br />
<br />
<br />
<br />
<br />
Kawana 2<br />
<br />
<br />
Santa Rosa 1<br />
<br />
Santa Rosa 2<br />
Santa Rosa 3<br />
<br />
<br />
<br />
Petaluma 1<br />
Kawana 3<br />
Petaluma 2<br />
<br />
<br />
<br />
<br />
<br />
<br />
<br />
<br />
<br />
<strong>Sonoma</strong> 1<br />
<br />
<br />
<br />
<br />
<br />
<br />
<br />
<br />
<br />
Oakmont<br />
<br />
<br />
<br />
<strong>Sonoma</strong> 2<br />
<br />
Legend<br />
Debris Flow <strong>Hazard</strong><br />
SCWA Facilities<br />
Facility type<br />
<br />
<br />
<br />
<br />
<br />
<br />
<br />
<br />
<br />
<br />
<br />
<br />
<br />
<br />
<br />
<br />
<br />
<br />
<br />
<br />
<br />
<br />
Cotati 2<br />
<br />
Cotati 3<br />
<br />
<br />
<br />
Petaluma 3<br />
<br />
<br />
<br />
<br />
<br />
<br />
<br />
<br />
<br />
<strong>Sonoma</strong> 3<br />
<br />
<br />
<br />
<br />
<br />
<br />
Petaluma 4<br />
<br />
<br />
<br />
Petaluma 5<br />
<br />
<br />
<br />
<br />
<br />
<br />
<br />
<br />
<br />
<br />
<br />
<br />
<br />
<br />
Marin Aqueduct
Wohler Intertie<br />
<br />
<br />
<br />
<br />
<br />
<br />
<br />
<br />
<br />
<br />
<br />
<br />
<br />
<br />
Cotati 1<br />
Forestville<br />
Aqueduct<br />
<br />
<br />
<br />
<br />
<br />
<br />
<br />
Kawana 1<br />
<br />
<br />
<br />
<br />
<br />
Kawana 2<br />
<br />
<br />
Santa Rosa 1<br />
Santa Rosa 2<br />
Santa Rosa 3<br />
Petaluma 1<br />
Kawana 3<br />
Petaluma 2<br />
<br />
<br />
<br />
<br />
<br />
<br />
<br />
<strong>Sonoma</strong> 1<br />
<br />
<br />
<br />
<br />
<br />
Oakmont<br />
<br />
<br />
<strong>Sonoma</strong> 2<br />
Legend<br />
Concrete Corrosion<br />
Potential<br />
SCWA Facilities<br />
Facility type<br />
<br />
<br />
<br />
<br />
<br />
<br />
<br />
<br />
<br />
<br />
<br />
<br />
Concrete Corrosion Potential<br />
<br />
<br />
<br />
<br />
<br />
<br />
Cotati 2<br />
<br />
<br />
Petaluma 3<br />
<br />
<br />
<br />
<br />
<br />
Cotati 3<br />
<strong>Sonoma</strong> 3<br />
<br />
<br />
Petaluma 4<br />
<br />
<br />
<br />
<br />
Petaluma 5<br />
Marin Aqueduct
Wohler Intertie<br />
<br />
<br />
<br />
<br />
<br />
<br />
<br />
<br />
<br />
<br />
<br />
<br />
<br />
<br />
Cotati 1<br />
Forestville<br />
Aqueduct<br />
<br />
<br />
<br />
<br />
<br />
<br />
<br />
Kawana 1<br />
<br />
<br />
<br />
<br />
<br />
Kawana 2<br />
<br />
<br />
Santa Rosa 1<br />
Santa Rosa 2<br />
Santa Rosa 3<br />
Petaluma 1<br />
Kawana 3<br />
Petaluma 2<br />
<br />
<br />
<br />
<br />
<br />
<br />
<br />
<strong>Sonoma</strong> 1<br />
<br />
<br />
<br />
<br />
<br />
Oakmont<br />
<br />
<br />
<strong>Sonoma</strong> 2<br />
Steel Corrosion Potential<br />
Legend<br />
SCWA Facilities<br />
Facility type<br />
<br />
<br />
<br />
<br />
<br />
<br />
<br />
<br />
<br />
<br />
<br />
<br />
Steel Corrosion Potential<br />
<br />
<br />
<br />
<br />
<br />
<br />
Cotati 2<br />
<br />
<br />
Petaluma 3<br />
<br />
<br />
<br />
<br />
<br />
Cotati 3<br />
<strong>Sonoma</strong> 3<br />
<br />
<br />
Petaluma 4<br />
<br />
<br />
<br />
<br />
Petaluma 5<br />
Marin Aqueduct
Wohler Intertie<br />
<br />
<br />
<br />
<br />
<br />
<br />
<br />
<br />
<br />
<br />
<br />
<br />
<br />
<br />
Cotati 1<br />
Forestville<br />
Aqueduct<br />
<br />
<br />
<br />
<br />
<br />
<br />
<br />
Kawana 1<br />
<br />
<br />
<br />
<br />
<br />
Kawana 2<br />
<br />
<br />
Santa Rosa 1<br />
Santa Rosa 2<br />
Santa Rosa 3<br />
Petaluma 1<br />
Kawana 3<br />
Petaluma 2<br />
<br />
<br />
<br />
<br />
<br />
<br />
<br />
<strong>Sonoma</strong> 1<br />
<br />
<br />
<br />
<br />
<br />
Oakmont<br />
<br />
<br />
<strong>Sonoma</strong> 2<br />
Legend<br />
SCWA Facilities<br />
Facility type<br />
<br />
<br />
<br />
<br />
<br />
<br />
<br />
<br />
<br />
<br />
<br />
<br />
Fire Threat<br />
Fire Threat<br />
<br />
<br />
<br />
<br />
<br />
<br />
<br />
<br />
Cotati 2<br />
<br />
<br />
Petaluma 3<br />
<br />
<br />
<br />
<br />
<br />
Cotati 3<br />
<strong>Sonoma</strong> 3<br />
<br />
<br />
Petaluma 4<br />
<br />
<br />
<br />
<br />
Petaluma 5<br />
Marin Aqueduct
Historic Fires<br />
in <strong>Sonoma</strong> <strong>County</strong><br />
<br />
<br />
<br />
<br />
<br />
<br />
<br />
Legend<br />
<br />
<br />
SCWA Facilities<br />
Facility type<br />
<br />
<br />
<br />
<br />
<br />
<br />
<br />
<br />
<br />
<br />
<br />
<br />
<br />
<br />
<br />
<br />
<br />
<br />
<br />
<br />
<br />
<br />
<br />
<br />
<br />
<br />
<br />
<br />
<br />
<br />
<br />
<br />
<br />
<br />
<br />
<br />
<br />
<br />
<br />
<br />
<br />
<br />
<br />
<br />
<br />
<br />
<br />
<br />
Wohler Intertie<br />
<br />
<br />
<br />
<br />
<br />
<br />
<br />
<br />
<br />
<br />
<br />
<br />
<br />
<br />
Forestville<br />
Aqueduct<br />
<br />
<br />
Cotati 1<br />
<br />
<br />
<br />
<br />
<br />
Kawana 1<br />
<br />
<br />
<br />
<br />
<br />
Kawana 2<br />
Santa Rosa 1<br />
Santa Rosa 2<br />
<br />
<br />
<br />
Santa Rosa 3<br />
<br />
<br />
<br />
<br />
Petaluma 1<br />
<strong>Sonoma</strong> 1<br />
<br />
<br />
<br />
<br />
<br />
<br />
Oakmont<br />
<br />
<br />
<strong>Sonoma</strong> 2<br />
<br />
<br />
<br />
Kawana 3<br />
Petaluma 2<br />
<br />
<br />
Cotati 2<br />
<br />
<br />
Petaluma 3<br />
<br />
<br />
<br />
<br />
<br />
<br />
Cotati 3<br />
<br />
<strong>Sonoma</strong> 3<br />
<br />
<br />
<br />
Petaluma 4<br />
<br />
<br />
<br />
Petaluma 5<br />
<br />
<br />
<br />
<br />
<br />
Marin Aqueduct
Geographic distriutio otoradoes ased o a total umer otorado evets per oe degree olatitude ad logitude: <br />
Source: ederal mergecy aagemet gecy – ultiaard detiicatio ad isk ssessmet
lue ay reek<br />
olemaalley reek<br />
³<br />
!( !( !(<br />
!( !(<br />
<br />
rachii reek<br />
orter reek<br />
Soda Sprigs reek<br />
sser reek<br />
U <br />
lat idge reek<br />
Galloway reek<br />
hite reek<br />
rush reek<br />
orterield reek<br />
caria reek<br />
arrelli reek<br />
rocker reek<br />
Gill reek<br />
SUU <br />
ot Sprigs reek<br />
G SUU <br />
<br />
<br />
!( !(<br />
<br />
<br />
Grasshopper reek<br />
ittle reek<br />
uller reek<br />
oms reek<br />
acheria reek<br />
Strawerry reek<br />
illow Sprigs reek<br />
<br />
all reek<br />
ea reek<br />
<br />
<br />
!( !(<br />
Gird reek<br />
SUS<br />
ear reek<br />
riggs reek<br />
GU S <br />
aield reek<br />
ouse reek<br />
SGS<br />
ea reek<br />
utcher reek<br />
iller reek<br />
urs reek<br />
coell reek<br />
luegum reek<br />
ooreek<br />
ill Stream<br />
<br />
!(<br />
!(<br />
it Statio<br />
aste ater reatmet lat<br />
Saitatio istrict/oe oudary<br />
<br />
<br />
istoric<br />
Stewarts reek<br />
ritaireek<br />
edar reek<br />
all reek<br />
edwood og reek<br />
echaco reek<br />
hapmarach<br />
ie reek<br />
tu <br />
<br />
ellowacket reek<br />
olocee<br />
atequaterary<br />
requaterary<br />
elley reek<br />
edwood reek<br />
uaterary<br />
arrereek<br />
iller reek<br />
arshall reek<br />
ceie reek<br />
earpereek<br />
ed Slide reek<br />
lack ock reek<br />
Sulphur reek<br />
evil reek<br />
oods reek<br />
hompsoreek<br />
Gray reek<br />
Gilliam reek<br />
gel reek<br />
<br />
allace reek<br />
elta reek<br />
rooks reek<br />
<br />
ares reek<br />
<br />
idwell reek<br />
0 2 iles<br />
<br />
<br />
imer ove reek<br />
urer ayo<br />
ard reek<br />
ussiaGulch<br />
US <br />
ulert reek<br />
issioreek<br />
USS <br />
ie reek<br />
!(<br />
!(<br />
!(<br />
!(<br />
<br />
<br />
!(<br />
!(<br />
Smith reek<br />
sore reek<br />
USS <br />
oso reek<br />
ress reek<br />
!(<br />
!(!(<br />
!(<br />
USS <br />
§¨¦ <br />
<br />
<br />
!(<br />
<br />
<br />
idsor reek<br />
ool reek<br />
!(<br />
ier reek<br />
orter reek<br />
ill reek<br />
icoreek<br />
S <br />
ucker reek<br />
umug reek<br />
eeks reek<br />
aurereek<br />
S S <br />
arsor<br />
Schoolhouse reek<br />
Sheephouse reek<br />
rrs reek<br />
USS <br />
urlog Gulch<br />
USS <br />
illow reek<br />
utch ill reek<br />
ohemiareek<br />
!(<br />
urrigtoreek<br />
!(<br />
!(<br />
!(<br />
<br />
<br />
S <br />
<br />
ough reek<br />
Scotty reek<br />
iley reek<br />
ohsoGulch<br />
uila Gulch<br />
heey Gulch<br />
<br />
ay reek<br />
aery reek<br />
hurstoreek<br />
olareek<br />
S <br />
!(<br />
<br />
<br />
aias reek<br />
tascadero reek<br />
mericao reek<br />
<br />
<br />
Gossage reek<br />
!(<br />
opelad reek<br />
tu tu tu <br />
ichau reek<br />
<br />
rae reek<br />
illow rook<br />
ulupa reek<br />
S <br />
arriger reek<br />
!(<br />
!(<br />
!(<br />
alaaas reek<br />
Stuart reek<br />
<br />
<br />
rroyo Seco<br />
odgers reek<br />
S <br />
<br />
<br />
!(<br />
U <br />
ych reek<br />
<br />
elder reek<br />
hamplireek<br />
!(<br />
tu <br />
tu <br />
SchultSlough
lue ay reek<br />
olemaalley reek<br />
³<br />
!( !( !(<br />
!( !(<br />
<br />
rachii reek<br />
orter reek<br />
Soda Sprigs reek<br />
sser reek<br />
U <br />
lat idge reek<br />
Galloway reek<br />
hite reek<br />
rush reek<br />
orterield reek<br />
caria reek<br />
arrelli reek<br />
rocker reek<br />
Gill reek<br />
SUU <br />
ot Sprigs reek<br />
G SUU <br />
<br />
<br />
!( !(<br />
<br />
<br />
ittle reek<br />
GU S <br />
Grasshopper reek<br />
utcher reek<br />
uller reek<br />
oms reek<br />
ritaireek<br />
acheria reek<br />
Strawerry reek<br />
illow Sprigs reek<br />
<br />
all reek<br />
ea reek<br />
<br />
<br />
!( !(<br />
iller reek<br />
Gird reek<br />
SUS <br />
urs reek<br />
coell reek<br />
luegum reek<br />
<br />
ear reek<br />
ooreek<br />
riggs reek<br />
ill Stream<br />
<br />
!(<br />
!(<br />
it Statio<br />
aste ater reatmet lat<br />
Saitatio istrict/oe oudary<br />
<br />
20 g<br />
20 g 0 g<br />
0 g 0 g<br />
ie reek<br />
Stewarts reek<br />
aield reek<br />
ouse reek<br />
edar reek<br />
SGS<br />
all reek<br />
edwood og reek<br />
ea reek<br />
echaco reek<br />
hapmarach<br />
elley reek<br />
tu <br />
edwood reek<br />
ellowacket reek<br />
0 g 0 g<br />
0 g 0 g<br />
0 g 0 g<br />
<br />
arrereek<br />
iller reek<br />
arshall reek<br />
ceie reek<br />
earpereek<br />
ed Slide reek<br />
lack ock reek<br />
Sulphur reek<br />
evil reek<br />
oods reek<br />
hompsoreek<br />
Gray reek<br />
Gilliam reek<br />
gel reek<br />
<br />
allace reek<br />
elta reek<br />
rooks reek<br />
ares reek<br />
<br />
idwell reek<br />
0 g 0 g<br />
0 2 iles<br />
<br />
<br />
imer ove reek<br />
urer ayo<br />
ard reek<br />
ussiaGulch<br />
US <br />
ulert reek<br />
issioreek<br />
USS <br />
ie reek<br />
!(<br />
!(<br />
!(<br />
!(<br />
<br />
<br />
!(<br />
!(<br />
Smith reek<br />
sore reek<br />
USS <br />
oso reek<br />
ress reek<br />
!(<br />
!(!(<br />
!(<br />
USS <br />
§¨¦ <br />
<br />
<br />
!(<br />
<br />
<br />
idsor reek<br />
ool reek<br />
!(<br />
ier reek<br />
orter reek<br />
ill reek<br />
icoreek<br />
S<br />
ucker reek<br />
umug reek<br />
eeks reek<br />
aurereek<br />
S S <br />
arsor<br />
Schoolhouse reek<br />
Sheephouse reek<br />
rrs reek<br />
USS <br />
urlog Gulch<br />
USS <br />
illow reek<br />
utch ill reek<br />
ohemiareek<br />
!(<br />
urrigtoreek<br />
!(<br />
!(<br />
!(<br />
<br />
<br />
S <br />
<br />
ough reek<br />
Scotty reek<br />
iley reek<br />
ohsoGulch<br />
uila Gulch<br />
heey Gulch<br />
<br />
ay reek<br />
aery reek<br />
hursto reek<br />
olareek<br />
S <br />
!(<br />
<br />
<br />
aias reek<br />
tascadero reek<br />
mericao reek<br />
<br />
<br />
Gossage reek<br />
!(<br />
opelad reek<br />
tu tu tu <br />
ichau reek<br />
<br />
rae reek<br />
illow rook<br />
ulupa reek<br />
S <br />
arriger reek<br />
!(<br />
!(<br />
!(<br />
alaaas reek<br />
Stuart reek<br />
<br />
<br />
rroyo Seco<br />
odgers reek<br />
S <br />
<br />
<br />
!(<br />
U <br />
ych reek<br />
<br />
elder reek<br />
hamplireek<br />
!(<br />
tu <br />
tu <br />
SchultSlough
lue ay reek<br />
olemaalley reek<br />
³<br />
!( !( !(<br />
!( !(<br />
<br />
rachii reek<br />
orter reek<br />
Soda Sprigs reek<br />
sser reek<br />
U <br />
lat idge reek<br />
Galloway reek<br />
hite reek<br />
rush reek<br />
orterield reek<br />
caria reek<br />
arrelli reek<br />
rocker reek<br />
Gill reek<br />
SUU <br />
ot Sprigs reek<br />
G SUU <br />
<br />
<br />
utcher reek<br />
!( !(<br />
<br />
<br />
ittle reek<br />
GU S <br />
Grasshopper reek<br />
uller reek<br />
oms reek<br />
ritaireek<br />
acheria reek<br />
Strawerry reek<br />
illow Sprigs reek<br />
<br />
all reek<br />
ea reek<br />
<br />
<br />
!( !(<br />
iller reek<br />
Gird reek<br />
SUS<br />
urs reek<br />
coell reek<br />
luegum reek<br />
ear reek<br />
ooreek<br />
riggs reek<br />
ill Stream<br />
<br />
!(<br />
!(<br />
it Statio<br />
aste ater reatmet lat<br />
Saitatio istrict/oe oudary<br />
<br />
<br />
ery ow<br />
ow<br />
SGS<br />
<br />
ie reek<br />
Stewarts reek<br />
aield reek<br />
ouse reek<br />
edar reek<br />
all reek<br />
edwood og reek<br />
ea reek<br />
echaco reek<br />
hapmarach<br />
elley reek<br />
oot wl reek<br />
tu <br />
edwood reek<br />
ellowacket reek<br />
edium<br />
igh<br />
ery igh<br />
<br />
arrereek<br />
<br />
ildcat reek<br />
iller reek<br />
imer ove reek<br />
arshall reek<br />
ceie reek<br />
arsor<br />
urer ayo<br />
ard reek<br />
ussiaGulch<br />
earpereek<br />
USS <br />
ed Slide reek<br />
Sheephouse reek<br />
urlog Gulch<br />
lack ock reek<br />
illow reek<br />
Sulphur reek<br />
rrs reek<br />
USS <br />
evil reek<br />
US <br />
oods reek<br />
hompsoreek<br />
Gray reek<br />
Gilliam reek<br />
Schoolhouse reek<br />
ulert reek<br />
issioreek<br />
USS <br />
ie reek<br />
!(<br />
!(<br />
!(<br />
!(<br />
gel reek<br />
!(<br />
!(<br />
Smith reek<br />
<br />
<br />
utch ill reek<br />
ohemiareek<br />
sore reek<br />
USS <br />
!(<br />
<br />
allace reek<br />
oso reek<br />
ress reek<br />
!(<br />
elta reek<br />
!(!(<br />
urrigtoreek<br />
!(<br />
<br />
<br />
!(<br />
<br />
<br />
!(<br />
!(<br />
!(<br />
USS <br />
§¨¦ <br />
idsor reek<br />
<br />
<br />
ool reek<br />
rooks reek<br />
ares reek<br />
!(<br />
<br />
ier reek<br />
idwell reek<br />
orter reek<br />
ill reek<br />
icoreek<br />
S <br />
S <br />
ucker reek<br />
umug reek<br />
eeks reek<br />
aurereek<br />
S S <br />
ot apped<br />
ater ody<br />
0 2 iles<br />
<br />
<br />
ough reek<br />
Scotty reek<br />
iley reek<br />
ohsoGulch<br />
uila Gulch<br />
heey Gulch<br />
<br />
ay reek<br />
aery reek<br />
hurstoreek<br />
olareek<br />
S <br />
!(<br />
<br />
<br />
aias reek<br />
tascadero reek<br />
mericao reek<br />
<br />
<br />
Gossage reek<br />
!(<br />
opelad reek<br />
tu tu tu <br />
ichau reek<br />
<br />
rae reek<br />
illow rook<br />
ulupa reek<br />
S <br />
arriger reek<br />
!(<br />
!(<br />
!(<br />
alaaas reek<br />
Stuart reek<br />
<br />
<br />
rroyo Seco<br />
odgers reek<br />
S <br />
<br />
<br />
!(<br />
U <br />
ych reek<br />
<br />
elder reek<br />
hamplireek<br />
!(<br />
tu <br />
tu <br />
SchultSlough
lue ay reek<br />
olemaalley reek<br />
³<br />
!( !( !(<br />
!( !(<br />
!( !(<br />
<br />
<br />
<br />
ittle reek<br />
rachii reek<br />
orter reek<br />
Soda Sprigs reek<br />
Grasshopper reek<br />
uller reek<br />
sser reek<br />
U <br />
lat idge reek<br />
Galloway reek<br />
hite reek<br />
oms reek<br />
acheria reek<br />
Strawerry reek<br />
rush reek<br />
illow Sprigs reek<br />
orterield reek<br />
caria reek<br />
<br />
arrelli reek<br />
all reek<br />
ea reek<br />
utcher reek<br />
rocker reek<br />
<br />
<br />
!( !(<br />
Gill reek<br />
iller reek<br />
Gird reek<br />
SUU <br />
SUS<br />
ot Sprigs reek<br />
urs reek<br />
G SUU <br />
coell reek<br />
luegum reek<br />
ear reek<br />
ooreek<br />
riggs reek<br />
ill Stream<br />
<br />
!(<br />
!(<br />
<br />
it Statio<br />
aste ater reatmet lat<br />
Saitatio istrict/oe oudary<br />
<br />
very ew ladslides<br />
ew ladslides<br />
may ladslides<br />
mostly ladslide<br />
GU S <br />
ritaireek<br />
<br />
Stewarts reek<br />
aield reek<br />
ouse reek<br />
edar reek<br />
SGS<br />
all reek<br />
edwood og reek<br />
ea reek<br />
echaco reek<br />
hapmarach<br />
elley reek<br />
tu <br />
edwood reek<br />
ellowacket reek<br />
0 2 iles<br />
<br />
ie reek<br />
arrereek<br />
iller reek<br />
arshall reek<br />
ceie reek<br />
earpereek<br />
ed Slide reek<br />
lack ock reek<br />
Sulphur reek<br />
evil reek<br />
oods reek<br />
hompsoreek<br />
Gray reek<br />
Gilliam reek<br />
gel reek<br />
<br />
allace reek<br />
elta reek<br />
rooks reek<br />
ares reek<br />
<br />
idwell reek<br />
imer ove reek<br />
urer ayo<br />
ard reek<br />
ussiaGulch<br />
US <br />
ulert reek<br />
issioreek<br />
USS <br />
ie reek<br />
!(<br />
!(<br />
!(<br />
!(<br />
<br />
<br />
!(<br />
!(<br />
Smith reek<br />
sore reek<br />
USS <br />
oso reek<br />
ress reek<br />
!(<br />
!(!(<br />
!(<br />
USS <br />
§¨¦ <br />
<br />
<br />
!(<br />
<br />
<br />
idsor reek<br />
ool reek<br />
!(<br />
ier reek<br />
orter reek<br />
ill reek<br />
icoreek<br />
S <br />
ucker reek<br />
umug reek<br />
eeks reek<br />
aurereek<br />
S S <br />
arsor<br />
Schoolhouse reek<br />
Sheephouse reek<br />
rrs reek<br />
USS <br />
urlog Gulch<br />
USS <br />
illow reek<br />
utch ill reek<br />
ohemiareek<br />
!(<br />
urrigtoreek<br />
!(<br />
!(<br />
!(<br />
<br />
<br />
S <br />
<br />
ough reek<br />
Scotty reek<br />
iley reek<br />
ohsoGulch<br />
uila Gulch<br />
heey Gulch<br />
<br />
ay reek<br />
aery reek<br />
hurstoreek<br />
olareek<br />
S <br />
!(<br />
<br />
<br />
aias reek<br />
tascadero reek<br />
mericao reek<br />
tu tu tu <br />
<br />
<br />
Gossage reek<br />
!(<br />
opelad reek<br />
ichau reek<br />
rae reek<br />
illow rook<br />
ulupa reek<br />
S <br />
arriger reek<br />
!(<br />
!(<br />
!(<br />
alaaas reek<br />
Stuart reek<br />
<br />
<br />
rroyo Seco<br />
odgers reek<br />
S <br />
<br />
<br />
!(<br />
U <br />
ych reek<br />
<br />
elder reek<br />
hamplireek<br />
!(<br />
tu <br />
tu <br />
SchultSlough
lue ay reek<br />
olemaalley reek<br />
³<br />
!( !( !(<br />
!( !(<br />
!( !(<br />
<br />
<br />
<br />
ittle reek<br />
GU S <br />
rachii reek<br />
orter reek<br />
Soda Sprigs reek<br />
Grasshopper reek<br />
uller reek<br />
sser reek<br />
U <br />
lat idge reek<br />
Galloway reek<br />
hite reek<br />
oms reek<br />
ritaireek<br />
acheria reek<br />
Strawerry reek<br />
rush reek<br />
illow Sprigs reek<br />
orterield reek<br />
caria reek<br />
<br />
arrelli reek<br />
all reek<br />
ea reek<br />
utcher reek<br />
rocker reek<br />
<br />
<br />
!( !(<br />
Gill reek<br />
iller reek<br />
Gird reek<br />
SUU <br />
SUS<br />
ot Sprigs reek<br />
urs reek<br />
G SUU <br />
coell reek<br />
luegum reek<br />
ear reek<br />
ooreek<br />
riggs reek<br />
ill Stream<br />
<br />
!(<br />
!(<br />
<br />
it Statio<br />
aste ater reatmet lat<br />
Saitatio istrict/oe oudary<br />
<br />
oe 00 year lood<br />
oe 00 year lood<br />
SGS<br />
<br />
Stewarts reek<br />
aield reek<br />
ouse reek<br />
edar reek<br />
all reek<br />
edwood og reek<br />
ea reek<br />
hapmarach<br />
tu <br />
ellowacket reek<br />
oe area ot icluded<br />
oe udetermied ut possile haard<br />
ie reek<br />
echaco reek<br />
elley reek<br />
edwood reek<br />
0 2 iles<br />
arrereek<br />
iller reek<br />
arshall reek<br />
ceie reek<br />
earpereek<br />
ed Slide reek<br />
lack ock reek<br />
Sulphur reek<br />
evil reek<br />
oods reek<br />
hompsoreek<br />
Gray reek<br />
Gilliam reek<br />
gel reek<br />
<br />
allace reek<br />
elta reek<br />
rooks reek<br />
ares reek<br />
<br />
idwell reek<br />
<br />
imer ove reek<br />
urer ayo<br />
ard reek<br />
ussiaGulch<br />
US <br />
ulert reek<br />
issioreek<br />
USS <br />
ie reek<br />
!(<br />
!(<br />
!(<br />
!(<br />
<br />
<br />
!(<br />
!(<br />
Smith reek<br />
sore reek<br />
USS <br />
oso reek<br />
ress reek<br />
!(<br />
!(!(<br />
!(<br />
USS <br />
§¨¦ <br />
<br />
<br />
!(<br />
<br />
<br />
idsor reek<br />
ool reek<br />
!(<br />
ier reek<br />
orter reek<br />
ill reek<br />
icoreek<br />
S <br />
ucker reek<br />
umug reek<br />
eeks reek<br />
aurereek<br />
S S <br />
arsor<br />
Schoolhouse reek<br />
Sheephouse reek<br />
rrs reek<br />
USS <br />
urlog Gulch<br />
USS <br />
illow reek<br />
utch ill reek<br />
ohemiareek<br />
!(<br />
urrigtoreek<br />
!(<br />
!(<br />
!(<br />
<br />
<br />
S <br />
<br />
ough reek<br />
Scotty reek<br />
iley reek<br />
ohsoGulch<br />
uila Gulch<br />
heey Gulch<br />
<br />
ay reek<br />
aery reek<br />
hurstoreek<br />
olareek<br />
S <br />
!(<br />
<br />
<br />
aias reek<br />
tascadero reek<br />
mericao reek<br />
tu tu tu <br />
<br />
<br />
Gossage reek<br />
!(<br />
opelad reek<br />
ichau reek<br />
rae reek<br />
illow rook<br />
ulupa reek<br />
S <br />
arriger reek<br />
!(<br />
!(<br />
!(<br />
alaaas reek<br />
Stuart reek<br />
<br />
<br />
rroyo Seco<br />
odgers reek<br />
S <br />
<br />
<br />
!(<br />
U <br />
ych reek<br />
<br />
elder reek<br />
hamplireek<br />
!(<br />
tu <br />
tu <br />
SchultSlough
lue ay reek<br />
olemaalley reek<br />
³<br />
!( !( !(<br />
!( !(<br />
!( !(<br />
<br />
<br />
<br />
ittle reek<br />
rachii reek<br />
orter reek<br />
Soda Sprigs reek<br />
Grasshopper reek<br />
uller reek<br />
sser reek<br />
U <br />
lat idge reek<br />
Galloway reek<br />
hite reek<br />
oms reek<br />
acheria reek<br />
Strawerry reek<br />
rush reek<br />
illow Sprigs reek<br />
orterield reek<br />
caria reek<br />
<br />
arrelli reek<br />
all reek<br />
ea reek<br />
utcher reek<br />
rocker reek<br />
<br />
<br />
!( !(<br />
Gill reek<br />
iller reek<br />
Gird reek<br />
SUU <br />
SUS<br />
ot Sprigs reek<br />
urs reek<br />
G SUU <br />
coell reek<br />
luegum reek<br />
ear reek<br />
ooreek<br />
riggs reek<br />
ill Stream<br />
<br />
<br />
!(<br />
!(<br />
it Statio<br />
aste ater reatmet lat<br />
Saitatio istrict/oe oudary<br />
ricipal predicted derislow source areas<br />
limit omappig o2 derislow sources<br />
GU S <br />
Stewarts reek<br />
ritaireek<br />
aield reek<br />
ouse reek<br />
edar reek<br />
SGS<br />
all reek<br />
edwood og reek<br />
ea reek<br />
echaco reek<br />
hapmarach<br />
ie reek<br />
tu <br />
<br />
ellowacket reek<br />
2 derislow sources<br />
0 2 iles<br />
elley reek<br />
edwood reek<br />
<br />
arrereek<br />
iller reek<br />
arshall reek<br />
ceie reek<br />
earpereek<br />
ed Slide reek<br />
lack ock reek<br />
Sulphur reek<br />
evil reek<br />
oods reek<br />
hompsoreek<br />
Gray reek<br />
Gilliam reek<br />
gel reek<br />
<br />
allace reek<br />
elta reek<br />
rooks reek<br />
ares reek<br />
<br />
idwell reek<br />
imer ove reek<br />
urer ayo<br />
ard reek<br />
ussiaGulch<br />
US <br />
ulert reek<br />
issioreek<br />
USS <br />
ie reek<br />
!(<br />
!(<br />
!(<br />
!(<br />
<br />
<br />
!(<br />
!(<br />
Smith reek<br />
sore reek<br />
USS <br />
oso reek<br />
ress reek<br />
!(<br />
!(!(<br />
!(<br />
USS <br />
§¨¦ <br />
<br />
<br />
!(<br />
<br />
<br />
idsor reek<br />
ool reek<br />
!(<br />
ier reek<br />
orter reek<br />
ill reek<br />
icoreek<br />
S <br />
ucker reek<br />
umug reek<br />
eeks reek<br />
aurereek<br />
S S <br />
arsor<br />
Schoolhouse reek<br />
Sheephouse reek<br />
rrs reek<br />
USS <br />
urlog Gulch<br />
USS <br />
illow reek<br />
utch ill reek<br />
ohemiareek<br />
!(<br />
urrigtoreek<br />
!(<br />
!(<br />
!(<br />
<br />
<br />
S <br />
<br />
ough reek<br />
Scotty reek<br />
iley reek<br />
ohsoGulch<br />
uila Gulch<br />
heey Gulch<br />
<br />
ay reek<br />
aery reek<br />
hurstoreek<br />
olareek<br />
S <br />
!(<br />
<br />
<br />
aias reek<br />
tascadero reek<br />
mericao reek<br />
tu tu tu <br />
<br />
<br />
Gossage reek<br />
!(<br />
opelad reek<br />
ichau reek<br />
rae reek<br />
illow rook<br />
ulupa reek<br />
S <br />
arriger reek<br />
!(<br />
!(<br />
!(<br />
alaaas reek<br />
Stuart reek<br />
<br />
<br />
rroyo Seco<br />
odgers reek<br />
S <br />
<br />
<br />
!(<br />
U <br />
ych reek<br />
<br />
elder reek<br />
hamplireek<br />
!(<br />
tu <br />
tu <br />
SchultSlough
³<br />
!( !( !(<br />
!( !(<br />
<br />
!( !(<br />
<br />
<br />
<br />
<br />
!( !(<br />
<br />
!(<br />
!(<br />
<br />
it Statio<br />
aste ater reatmet lat<br />
Saitatio istrict/oe oudary<br />
ittle or o threat<br />
oderate<br />
tu <br />
igh<br />
ery high<br />
treme<br />
0 2 iles<br />
<br />
!(<br />
!(<br />
!(<br />
!(<br />
<br />
<br />
!(<br />
!(<br />
!(<br />
!(!(<br />
tu tu tu <br />
§¨¦ <br />
<br />
<br />
!(<br />
<br />
<br />
!(<br />
!(<br />
!(<br />
!(<br />
!(<br />
<br />
<br />
!(<br />
!(<br />
<br />
<br />
<br />
<br />
!(<br />
!(<br />
!(<br />
!(<br />
<br />
<br />
<br />
<br />
!(<br />
!(<br />
tu <br />
tu
³<br />
!( !( !(<br />
!( !(<br />
<br />
<br />
0 S <br />
<br />
S <br />
GSS S S<br />
GSS <br />
<br />
<br />
<br />
<br />
!( !(<br />
<br />
<br />
G<br />
0 S US <br />
<br />
<br />
!( !(<br />
G 22<br />
<br />
!(<br />
!(<br />
it Statio<br />
aste ater reatmet lat<br />
Saitatio istrict/oe oudary<br />
S GS<br />
2 .<br />
ire erimeter<br />
S S GS<br />
<br />
0 S S <br />
<br />
200 <br />
0 2 iles<br />
S<br />
tu <br />
<br />
<br />
<br />
0<br />
.G. .0<br />
2 S <br />
. S<br />
0 S<br />
. <br />
2 G<br />
<br />
GS<br />
<br />
<br />
S<br />
<br />
S<br />
G<br />
§¨¦ <br />
0 .G. . <br />
<br />
G G<br />
S <br />
!(<br />
!(<br />
!(<br />
!(<br />
<br />
<br />
!(<br />
!(<br />
!(<br />
!(!(<br />
<br />
<br />
!(<br />
<br />
<br />
!(<br />
G 2<br />
.G.. <br />
!(<br />
!(<br />
!(<br />
!(<br />
<br />
<br />
!(<br />
!(<br />
<br />
<br />
.G. .<br />
S <br />
tu tu tu <br />
200 <br />
<br />
<br />
!(<br />
!(<br />
!(<br />
!(<br />
US <br />
G <br />
.G. .<br />
<br />
<br />
0 G <br />
<br />
!(<br />
2 <br />
<br />
<br />
.G.. <br />
!(<br />
<br />
200 U<br />
tu <br />
S<br />
S<br />
tu <br />
S