North Northamptonshire Annual Monitoring Report 2010-11
North Northamptonshire Annual Monitoring Report 2010-11
North Northamptonshire Annual Monitoring Report 2010-11

You also want an ePaper? Increase the reach of your titles
YUMPU automatically turns print PDFs into web optimized ePapers that Google loves.
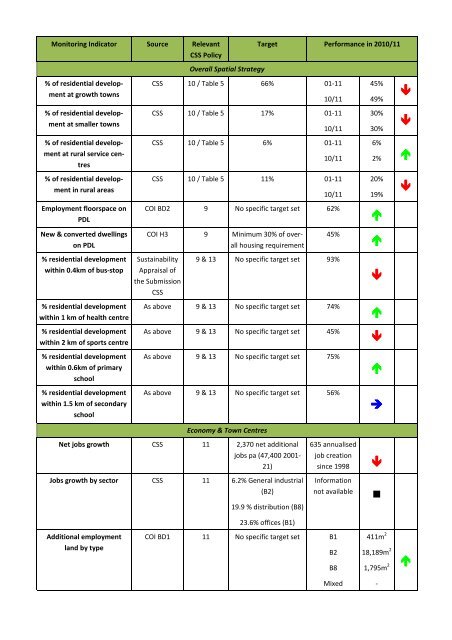
<strong>Monitoring</strong> Indicator Source Relevant Target Performance in <strong>2010</strong>/<strong>11</strong><br />
CSS Policy<br />
Overall Spatial Strategy<br />
% of residential development<br />
at growth towns<br />
CSS 10 / Table 5 66% 01-<strong>11</strong><br />
10/<strong>11</strong><br />
% of residential development<br />
CSS 10 / Table 5 17% 01-<strong>11</strong><br />
at smaller towns<br />
10/<strong>11</strong><br />
% of residential development<br />
CSS 10 / Table 5 6% 01-<strong>11</strong><br />
at rural service cen-<br />
tres<br />
10/<strong>11</strong><br />
% of residential development<br />
CSS 10 / Table 5 <strong>11</strong>% 01-<strong>11</strong><br />
in rural areas<br />
10/<strong>11</strong><br />
Employment floorspace on COI BD2 9 No specific target set 62%<br />
PDL<br />
45%<br />
49%<br />
30%<br />
30%<br />
6%<br />
<br />
<br />
2%<br />
<br />
20%<br />
19%<br />
<br />
<br />
New & converted dwellings<br />
on PDL<br />
% residential development<br />
within 0.4km of bus-stop<br />
% residential development<br />
within 1 km of health centre<br />
% residential development<br />
within 2 km of sports centre<br />
% residential development<br />
within 0.6km of primary<br />
school<br />
% residential development<br />
within 1.5 km of secondary<br />
school<br />
COI H3 9 Minimum 30% of overall<br />
housing requirement<br />
45%<br />
Sustainability 9 & 13 No specific target set 93%<br />
Appraisal of<br />
the Submission<br />
CSS<br />
As above 9 & 13 No specific target set 74%<br />
As above 9 & 13 No specific target set 45%<br />
As above 9 & 13 No specific target set 75%<br />
As above 9 & 13 No specific target set 56%<br />
Economy & Town Centres<br />
<br />
<br />
<br />
<br />
<br />
<br />
Net jobs growth CSS <strong>11</strong> 2,370 net additional<br />
jobs pa (47,400 2001-<br />
21)<br />
Jobs growth by sector CSS <strong>11</strong> 6.2% General industrial<br />
(B2)<br />
19.9 % distribution (B8)<br />
635 annualised<br />
job creation<br />
since 1998<br />
Information<br />
not available<br />
<br />
<br />
23.6% offices (B1)<br />
Additional employment<br />
land by type<br />
COI BD1 <strong>11</strong> No specific target set B1<br />
B2<br />
B8<br />
4<strong>11</strong>m 2<br />
18,189m 2<br />
1,795m 2<br />
<br />
Mixed<br />
-