Bridging the Gaps - IEEE Xplore
Bridging the Gaps - IEEE Xplore
Bridging the Gaps - IEEE Xplore

You also want an ePaper? Increase the reach of your titles
YUMPU automatically turns print PDFs into web optimized ePapers that Google loves.
Visualization Viewpoints<br />
Editor: Theresa-Marie Rhyne<br />
<strong>Bridging</strong> <strong>the</strong> <strong>Gaps</strong> __________________________________<br />
Jarke J. van Wijk<br />
Technische<br />
Universiteit<br />
Eindhoven<br />
Users play a central role in visualization. The ultimate<br />
aim of visualization is to provide insight to<br />
users, not just to produce images. Since <strong>the</strong> late 1980s,<br />
our field has spent much effort on developing new<br />
methods to help users obtain insight, and we’ve made<br />
a lot of progress. Many researchers nowadays use visualization<br />
routinely to understand <strong>the</strong> results of <strong>the</strong>ir<br />
measurements and simulations. 1<br />
However, many problems still exist, and not every<br />
method reaches its intended audience. In recent years,<br />
discussion has focused on <strong>the</strong> position of our field and<br />
which goals to pursue. These discussions have led to two<br />
important reports, which give clear overviews of <strong>the</strong><br />
field and recommendations for future research:<br />
NIH/NSF Visualization Research Challenges by Chris<br />
Johnson et al. 1 and Illuminating <strong>the</strong> Path, edited by Jim<br />
Thomas and Kristin Cook. 2<br />
In both reports, close cooperation with domain<br />
experts is a central issue. If we, as visualization<br />
researchers, want to make a step forward, we should<br />
make sure that we aim for useful results for domain<br />
experts that fit into <strong>the</strong>ir processes. This doesn’t always<br />
happen, and often a gap exists between visualization<br />
research and application domains.<br />
These reports take a high-level view and give recommendations<br />
for policies to stimulate cooperation. In contrast,<br />
in this article, I consider <strong>the</strong> issue from <strong>the</strong><br />
perspective of <strong>the</strong> day-to-day practice of academic visualization<br />
research.<br />
The gaps<br />
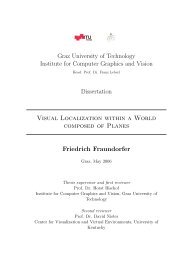
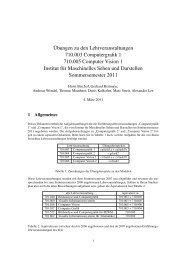
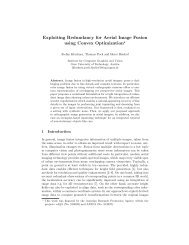
Let’s consider Vivian, a visualization researcher, and<br />
Douglas, a domain expert (see Figure 1), who work<br />
toge<strong>the</strong>r on a visualization research project. This is a simplification,<br />
but in fact most graduate students complete<br />
<strong>the</strong>ir visualization research by cooperating with a small<br />
group of domain experts. I assume that Vivian has <strong>the</strong><br />
typical background of most visualization researchers. By<br />
that, I mean that she studied computer science, followed<br />
courses on graphics and human– computer interaction<br />
(HCI), and she’s a skilled programmer. Vivian sets out to<br />
solve Douglas’s problem using a standard design process<br />
with analysis, design, implementation, evaluation, and<br />
publication as <strong>the</strong> main stages. In this situation <strong>the</strong>re are<br />
two gaps that must be bridged: a knowledge gap and an<br />
interest gap.<br />
We first consider <strong>the</strong> knowledge gap, both persons<br />
have different backgrounds and expertise. The domain<br />
expert—for instance, a researcher from a different<br />
department— has a deep knowledge on some esoteric<br />
topic. Douglas talks about concepts Vivian is unaware<br />
of, and even when he uses familiar words, <strong>the</strong>y can have<br />
a different meaning. Once a visualization colleague told<br />
me that he had a good discussion with a biologist. They<br />
agreed that <strong>the</strong> interface was important, but only after<br />
some time he discovered that <strong>the</strong> biologist meant <strong>the</strong><br />
interphase, which is a phase of <strong>the</strong> cell cycle, and not<br />
<strong>the</strong> human–computer interface.<br />
The visualization researcher has to spend effort to<br />
understand at least <strong>the</strong> basics of <strong>the</strong> o<strong>the</strong>r field, but to<br />
support <strong>the</strong> expert in his search for new knowledge, just<br />
<strong>the</strong> basics is often not enough. If <strong>the</strong> expert is interested<br />
in explorative visualization, <strong>the</strong>n he’s probably aiming<br />
at advancing <strong>the</strong> state of <strong>the</strong> art in his domain. This<br />
also means that he’s not exactly sure and cannot express<br />
what he’s looking for, except that he’s aiming for new<br />
insights. Insight is a difficult issue, as Chris North recently<br />
pointed out very clearly while noting <strong>the</strong> main characteristics<br />
of insight. 3 Insight is complex, deep,<br />
qualitative, unexpected, and relevant. He uses <strong>the</strong>se<br />
characteristics to discuss proper methods for <strong>the</strong> validation<br />
of visualization methods. But, <strong>the</strong>se characteristics<br />
also have an impact on <strong>the</strong> earlier stages of <strong>the</strong><br />
research and development process.<br />
Vivian also uses concepts that are unfamiliar to<br />
Douglas. A domain expert can’t be expected to know <strong>the</strong><br />
ins and outs of (for instance) mesh-reduction algorithms,<br />
color spaces, and transfer functions. In an ideal<br />
world, he wouldn’t need to know; in practice, often he’s<br />
unwilling to take an interest in such things. In terms of<br />
my model for assessing <strong>the</strong> value of a visualization, 4 it’s<br />
best to avoid <strong>the</strong>se costs to increase <strong>the</strong> overall benefit<br />
of <strong>the</strong> visualization.<br />
Next, we consider <strong>the</strong> interest gap. The visualization<br />
researcher aims at publishing in journals and at leading<br />
conferences on visualization, and <strong>the</strong>refore she focuses<br />
on developing new and interesting methods and techniques—that<br />
is, interesting in <strong>the</strong> eyes of her visualization<br />
colleagues.<br />
Our field does have a tradition of accepting and<br />
publishing application papers. Also, usefulness is an<br />
important criterion for acceptance of research papers.<br />
6 November/December 2006 Published by <strong>the</strong> <strong>IEEE</strong> Computer Society 0272-1716/06/$20.00 © 2006 <strong>IEEE</strong>
Reviewers usually require that new methods be used by<br />
real users, and expect at least anecdotal evidence of <strong>the</strong><br />
value of such methods. But still, <strong>the</strong> focus is mostly on<br />
novelty, and not primarily on usability, including downto-earth<br />
issues such as <strong>the</strong> kind of data sources that can<br />
be handled, availability on various platforms, ease of<br />
installation, and ease of use.<br />
These issues, however, are crucial for <strong>the</strong> domain<br />
expert, who’s primarily interested in tools that will help<br />
him do his work faster and better, here and now.<br />
Application papers that compare and evaluate systems<br />
on <strong>the</strong>se issues as well as functionality offered and scalability<br />
are rare—but would be useful—both for domain<br />
and visualization experts.<br />
We can argue that <strong>the</strong>re’s not a real problem here. If<br />
Vivian just produces new methods on her own, <strong>the</strong>y will<br />
be picked up and integrated in time if <strong>the</strong>y’re interesting.<br />
Possibly, but how do we know which methods are interesting?<br />
Also, it’s unclear who’s willing to spend <strong>the</strong> effort<br />
in trying this out, and it seems much more effective to<br />
cooperate from <strong>the</strong> start and directly target methods<br />
and tools that are both new and useful.<br />
Let’s consider different models for cooperation.<br />
Vivian could ei<strong>the</strong>r<br />
■ take a user-centered design approach,<br />
■ just work for Douglas as a toolsmith,<br />
■ just do what she’s good at (as a computer scientist), or<br />
■ she could follow her own interest (curiosity driven).<br />
This list isn’t exhaustive. One o<strong>the</strong>r route, for instance,<br />
is to educate domain experts to define visualizations<br />
<strong>the</strong>mselves. I assume here that <strong>the</strong> visualization expert<br />
has to adapt, but we could also consider that <strong>the</strong> domain<br />
expert could make steps to cross <strong>the</strong> bridge. Also, <strong>the</strong><br />
models sketched are extremes, and don’t exclude each<br />
o<strong>the</strong>r. The practical challenge is to find an optimal mix.<br />
Visualization<br />
researcher<br />
New<br />
method<br />
Aims at<br />
Knowledge gap<br />
Interest gap<br />
Domain<br />
expert<br />
Useful<br />
tool<br />
1 <strong>Gaps</strong> between <strong>the</strong> visualization researcher and<br />
domain expert.<br />
Needs<br />
User-centered design<br />
The royal road is to use a user-centered design<br />
approach. In this approach, <strong>the</strong> needs, wants, and limitations<br />
of <strong>the</strong> end user are given extensive attention at<br />
each stage of <strong>the</strong> design process, and usability is crucial.<br />
Typical usability considerations include who <strong>the</strong> users<br />
are, what <strong>the</strong>y know, and what <strong>the</strong>y want. In <strong>the</strong> context<br />
of explorative visualization <strong>the</strong>se are tough questions.<br />
For instance, in contrast to designing user<br />
interfaces for consumer devices, where <strong>the</strong> tasks of users<br />
can be defined clearly, acquiring insight—<strong>the</strong> main task<br />
here—is much harder to pinpoint. 3<br />
Taking this road, Vivian <strong>the</strong>refore has to spend much<br />
time to understand what Douglas is doing and what he<br />
needs. She has to take classes and read books on his subject,<br />
observe him while doing his work, and ideally participate<br />
in his research activities. This will almost<br />
certainly lead to new insights for Vivian. One example<br />
I once heard was that <strong>the</strong> observed researchers used a<br />
ruler to measure things shown on <strong>the</strong> screen. Indeed,<br />
for visualization people, it’s an eye-opener that domain<br />
experts often want quantitative results, not just pictures.<br />
Close collaboration is important at every stage, and<br />
prototypes play an important role. Users are good at stating<br />
what <strong>the</strong>y do and don’t like, whereas <strong>the</strong> task to<br />
come with new solutions is primarily <strong>the</strong> realm of <strong>the</strong><br />
visualization researcher. Evaluation is important for <strong>the</strong><br />
interface as well as for <strong>the</strong> visualization itself. It’s hard<br />
for visualization researchers to see <strong>the</strong>ir images through<br />
<strong>the</strong> domain experts’ eyes. I’ve given an example where<br />
things went wrong elsewhere. 4 Ano<strong>the</strong>r example concerns<br />
a project I once did in molecular dynamics. I was<br />
disappointed in <strong>the</strong> resulting animations—all <strong>the</strong> ions<br />
just seemed to move randomly without any visible pattern.<br />
Fortunately, <strong>the</strong> physical chemist involved was<br />
glad. He had modeled a steady-state situation, and<br />
hence only a random <strong>the</strong>rmal motion should be visible.<br />
A user-centered approach will probably lead to useful<br />
results for Douglas, but unfortunately, <strong>the</strong>re are some<br />
pitfalls. Vivian and Douglas have to invest much time<br />
and energy. Note that we assume that Vivian has a computer<br />
science background. If she also has some education<br />
in Douglas’s domain, <strong>the</strong>n bridging <strong>the</strong> knowledge<br />
gap will be easier. New multidisciplinary curricula—for<br />
instance, on bioinformatics—are promising in this<br />
respect. Ano<strong>the</strong>r pitfall is that we aren’t certain we really<br />
need new visualization methods to solve Douglas’s<br />
problem; possibly a combination of more traditional<br />
approaches will do, supplemented with an easy-to-use<br />
interface tailored to Douglas’s domain. If so, this could<br />
be considered a useful research result in its own right,<br />
but often it isn’t really satisfying for Vivian.<br />
It’s interesting to note here that novelty is relative.<br />
Tim Peeters, <strong>the</strong>n a master’s student at Eindhoven, cooperated<br />
with a biology group to visualize annotated DNA<br />
sequences. The biologist asked for static images, but we<br />
brought in a number of standard information visualization<br />
concepts, such as multiple linked windows, realtime<br />
interaction, customizable views, and perspective<br />
walls, all of which we considered more or less straightforward.<br />
5,6 The biologists were enthusiastic and claimed<br />
that this was highly innovative and <strong>the</strong> most effective<br />
tool for this purpose <strong>the</strong>y knew.<br />
Again, <strong>the</strong>re’s no guarantee that strong visualization<br />
results will occur, such as generic insights, surprising<br />
new visual representations, or innovative user interface<br />
concepts. An important factor here is whe<strong>the</strong>r Vivian is<br />
capable of keeping <strong>the</strong>se issues on <strong>the</strong> agenda and coming<br />
up with fresh ideas. But Douglas also plays an important<br />
role. Finding a “good” user (or, in some respects, a<br />
good collaborator) is important. Such a user should be<br />
open to new ideas, have time to spend, and also, his<br />
problems should be instances of more generic situations.<br />
<strong>IEEE</strong> Computer Graphics and Applications 7
Visualization Viewpoints<br />
<strong>the</strong> state of <strong>the</strong> art and which are primarily a matter of<br />
engineering.<br />
On <strong>the</strong> o<strong>the</strong>r hand, it can pay off to play <strong>the</strong> role of<br />
toolsmith for some time. Each visualization project<br />
requires some basic operations to be handled (such as<br />
reading data and showing summaries), and it helps to<br />
gain trust from domain experts. Also, basic visualization<br />
solutions can be useful during <strong>the</strong> development of<br />
more innovative approaches, for debugging as well as<br />
for evaluation and comparison purposes.<br />
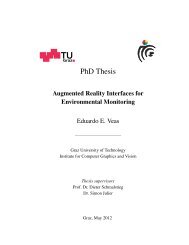
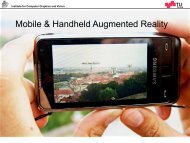
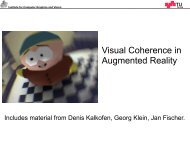
2 Visualization of a hard disk with SequoiaView. Rectangles denote files,<br />
<strong>the</strong> area indicates <strong>the</strong>ir sizes, and colors denote file types.<br />
Toolsmith<br />
Ano<strong>the</strong>r approach is to swallow ambitions with<br />
respect to novelty, and just steer directly toward a useful<br />
tool. This can (and maybe should) be done in combination<br />
with a user-centered approach, but we can also<br />
accomplish this just by letting <strong>the</strong> users specify what<br />
<strong>the</strong>y want and implementing <strong>the</strong> tool. Domain experts<br />
already use tools and are aware of <strong>the</strong>ir limitations. A<br />
typical request is something like “Make something that<br />
takes database X as input, produces images like tool Y,<br />
and is accessible through <strong>the</strong> Web.” Such a request can<br />
be completely valid; however, to satisfy it you do not<br />
need a PhD student—you need a skilled programmer<br />
who acts as a toolsmith, and not a visualization<br />
researcher.<br />
At meetings where plans are made to begin multidisciplinary<br />
cooperation, computer scientists and especially<br />
visualization experts are often warmly welcomed.<br />
However, domain experts sometimes consider computer<br />
scientists just as a bunch of programmers who can<br />
resolve <strong>the</strong>ir practical problems. From a computer science<br />
point of view, it’s important to make it clear in an<br />
early stage which problems require an advancement of<br />
Computer scientist<br />
For effective cooperation, we can also defend that<br />
each cobbler involved should stick to his last. Vivian has<br />
a solid training in computer science—so she’s familiar<br />
with topics such as algorithms, data structures, and<br />
graphics. She can focus on some established visualization<br />
method, ideally implemented in a widely used tool,<br />
and try to improve this.<br />
A typical example is <strong>the</strong> reduction of <strong>the</strong> use of<br />
resources (memory and CPU) for <strong>the</strong> computation of,<br />
for instance, isosurfaces, volume renderings, and graph<br />
layouts. If successful, larger data sets can be shown in<br />
shorter time, and nobody will object. But this also could<br />
lead to some pitfalls. Many have already pursued this<br />
path, and nowadays it’s not easy to achieve significant<br />
improvements. If she performs this optimization in close<br />
cooperation with a commercial vendor, <strong>the</strong>n publishing<br />
<strong>the</strong> new methods can be problematic. Also, this attitude<br />
generally doesn’t lead to visually new methods. A good<br />
performance is often required—if not vital—but <strong>the</strong>re’s<br />
much more to visualization than improving algorithms.<br />
Curiosity driven<br />
I conclude with ano<strong>the</strong>r approach to bridge <strong>the</strong> gap.<br />
I’ve used it successfully in <strong>the</strong> past, but you might consider<br />
it cheating. Academic freedom allows many of us<br />
to select users with interesting problems. Hence, Vivian<br />
can also choose herself as <strong>the</strong> domain expert, and attack<br />
a visualization problem which she already knows a lot<br />
about and where she has a direct interest in solving it. In<br />
o<strong>the</strong>r words, she follows her own curiosity and views<br />
<strong>the</strong> project both as a hobby and a personal challenge.<br />
Our work on visualizing large hierarchies 7 has been<br />
driven by <strong>the</strong> question Why is my disk full? I’m poor at<br />
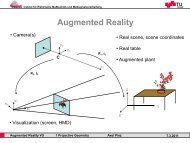
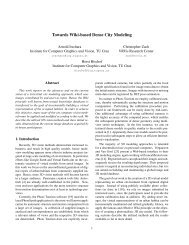
(a) (b) (c)<br />
3 (a) A figure-8 knot. A Seifert surface is an orientable surface bounded by a knot, and in (b) and (c) we see two<br />
views of such a Seifert surface.<br />
8 November/December 2006
managing resources such as disk space, desktop space,<br />
and cabinet space, and only when <strong>the</strong>y are used up do<br />
I reorganize. Hence, I have a strong need for tools that<br />
support me and that give me a good overview of how<br />
I’m using my storage (see Figure 2). An additional benefit<br />
here is that a file structure is a good example in general<br />
of a large and complex hierarchical data set.<br />
A more recent example concerns knot <strong>the</strong>ory (see<br />
Figure 3). My colleague Arjeh Cohen asked me two years<br />
ago if I could visualize a Seifert surface. Upon my obvious<br />
first question, he explained to me that a Seifert surface<br />
is an orientable surface, bounded by a knot. A knot<br />
here is a ma<strong>the</strong>matical knot—that is, a closed curve.<br />
Surprisingly, such surfaces exist for any knot or link. I<br />
was puzzled and intrigued. What do <strong>the</strong>se surfaces look<br />
like? I spent some time trying to understand <strong>the</strong>se, using<br />
hand-drawn drawings, paper, and clay mock-ups.<br />
Finally, I developed methods to generate <strong>the</strong>m automatically,<br />
and implemented <strong>the</strong>m in a tool. 8 With this<br />
tool I could satisfy my curiosity.<br />
Note that my role of user here was that of <strong>the</strong> naive<br />
outsider, similar to a high-school student interested in<br />
higher math. Knot <strong>the</strong>ory is a sophisticated topic, and<br />
<strong>the</strong> average paper in this field isn’t understandable for<br />
me. Also, this tool doesn’t help knot <strong>the</strong>orists develop<br />
more <strong>the</strong>ory. Fortunately, knot <strong>the</strong>orists are also interested<br />
in teaching <strong>the</strong>ir work and showing interesting<br />
images, hence <strong>the</strong>y positively received my work.<br />
This approach might seem outrageous. Focusing on<br />
your own interests seems narrow minded, and <strong>the</strong>re’s<br />
no feedback from <strong>the</strong> real world about whe<strong>the</strong>r it makes<br />
sense. Vivian might get to know enough to satisfy her<br />
own personal curiosity, but not enough to make any difference<br />
o<strong>the</strong>rwise, and this doesn’t address problems<br />
that require deep domain knowledge. Never<strong>the</strong>less, I<br />
think we can learn a lesson from this, if we combine it<br />
with <strong>the</strong> user-centered approach. In <strong>the</strong> ideal case,<br />
Vivian should take Douglas’s problem as her own, personal<br />
challenge, and cooperate side-by-side with him to<br />
solve it. This gives Vivian <strong>the</strong> proper motivation and<br />
direction, which she’ll need if she really wants to come<br />
up with both exciting new results as well as useful tools.<br />
Finally<br />
Cooperation between domain experts and visualization<br />
experts is important, but not without problems. I’ve<br />
tried to identify causes for <strong>the</strong>se, and enumerated a<br />
number of models for cooperation. None of <strong>the</strong>se is<br />
clearly superior; I’m afraid <strong>the</strong>re’s no easy way to bridge<br />
<strong>the</strong> gaps. A user-centered design approach requires<br />
much effort to bridge <strong>the</strong> knowledge gap, without a<br />
guarantee that <strong>the</strong> interest gap is bridged. Just operating<br />
as a toolsmith will often not lead to publishing<br />
papers, and hence <strong>the</strong> interest gap is certainly not<br />
bridged. Acting just as a computer scientist reduces <strong>the</strong><br />
knowledge gap but has a limited scope. And finally, <strong>the</strong><br />
curiosity-driven approach doesn’t help solve problems<br />
requiring deep domain expertise.<br />
Never<strong>the</strong>less, I hope that <strong>the</strong> gaps described and <strong>the</strong><br />
models for cooperation are helpful for Vivian and<br />
Douglas to understand each o<strong>the</strong>r’s interests and positions<br />
better, to discuss various modes for cooperation,<br />
and to obtain useful results for both of <strong>the</strong>m. ■<br />
Acknowledgment<br />
I thank <strong>the</strong> reviewers for <strong>the</strong>ir thorough and inspiring<br />
comments.<br />
References<br />
1. C.R. Johnson et al., eds., NIH-NSF Visualization Research<br />
Challenges Report, <strong>IEEE</strong> Press, 2006.<br />
2. J.J. Thomas and K.A. Cook, eds., Illuminating <strong>the</strong> Path:<br />
Research and Development Agenda for Visual Analytics, <strong>IEEE</strong><br />
Press, 2005.<br />
3. C. North, “Towards Measuring Visualization Insight,” <strong>IEEE</strong><br />
Computer Graphics and Applications, vol. 26, no. 3, 2005,<br />
pp. 6-9.<br />
4. J.J. van Wijk, “The Value of Visualization,” Proc. <strong>IEEE</strong> Visualization,<br />
<strong>IEEE</strong> CS Press, 2005, pp. 79-86.<br />
5. T. Peeters et al., “Case Study: Visualization of Annotated<br />
DNA Sequences,” Proc. Symp. Visualization (VisSym),<br />
Eurographics Press, 2004, pp. 109-114.<br />
6. S.K. Card, J. Mackinlay, and B. Shneiderman, eds., Readings<br />
in Information Visualization: Using Vision to Think,<br />
Morgan Kaufmann, 1999.<br />
7. J.J. van Wijk, F. van Ham, and H.M.M. van de Wetering,<br />
“Rendering Hierarchical Data,” Comm. ACM, vol. 46,<br />
no. 9, 2003, pp. 257-263.<br />
8. J.J. van Wijk and A.M. Cohen, “Visualization of Seifert Surfaces,”<br />
<strong>IEEE</strong> Trans. Visualization and Computer Graphics,<br />
vol. 12, no. 4, 2006, pp. 485-496.<br />
Contact Jarke J. van Wijk at vanwijk@win.tue.nl.<br />
Contact editor Theresa-Marie Rhyne at tmrhyne@<br />
ncsu.edu.<br />
<strong>IEEE</strong> Computer Graphics and Applications 9