Phillips-Perron (PP) Unit Root Tests
Phillips-Perron (PP) Unit Root Tests
Phillips-Perron (PP) Unit Root Tests

You also want an ePaper? Increase the reach of your titles
YUMPU automatically turns print PDFs into web optimized ePapers that Google loves.
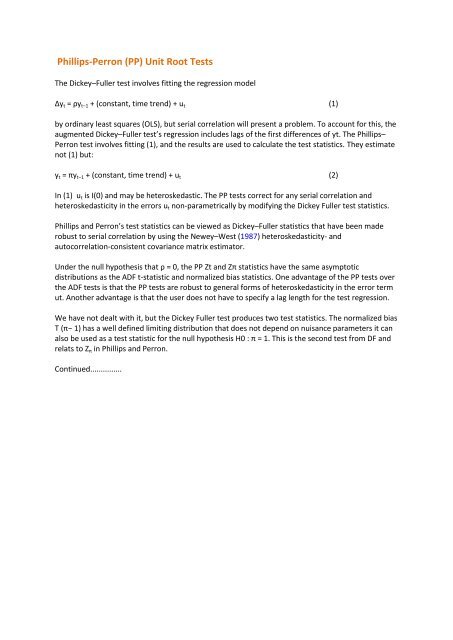
<strong>Phillips</strong>-<strong>Perron</strong> (<strong>PP</strong>) <strong>Unit</strong> <strong>Root</strong> <strong>Tests</strong><br />
The Dickey–Fuller test involves fitting the regression model<br />
Δy t = ρy t−1 + (constant, time trend) + u t (1)<br />
by ordinary least squares (OLS), but serial correlation will present a problem. To account for this, the<br />
augmented Dickey–Fuller test’s regression includes lags of the first differences of yt. The <strong>Phillips</strong>–<br />
<strong>Perron</strong> test involves fitting (1), and the results are used to calculate the test statistics. They estimate<br />
not (1) but:<br />
y t = πy t−1 + (constant, time trend) + u t (2)<br />
In (1) u t is I(0) and may be heteroskedastic. The <strong>PP</strong> tests correct for any serial correlation and<br />
heteroskedasticity in the errors u t non-parametrically by modifying the Dickey Fuller test statistics.<br />
<strong>Phillips</strong> and <strong>Perron</strong>’s test statistics can be viewed as Dickey–Fuller statistics that have been made<br />
robust to serial correlation by using the Newey–West (1987) heteroskedasticity- and<br />
autocorrelation-consistent covariance matrix estimator.<br />
Under the null hypothesis that ρ = 0, the <strong>PP</strong> Zt and Zπ statistics have the same asymptotic<br />
distributions as the ADF t-statistic and normalized bias statistics. One advantage of the <strong>PP</strong> tests over<br />
the ADF tests is that the <strong>PP</strong> tests are robust to general forms of heteroskedasticity in the error term<br />
ut. Another advantage is that the user does not have to specify a lag length for the test regression.<br />
We have not dealt with it, but the Dickey Fuller test produces two test statistics. The normalized bias<br />
T (π− 1) has a well defined limiting distribution that does not depend on nuisance parameters it can<br />
also be used as a test statistic for the null hypothesis H0 : π = 1. This is the second test from DF and<br />
relats to Z π in <strong>Phillips</strong> and <strong>Perron</strong>.<br />
Continued...............
EXTRACT FROM STATA MANUAL<br />
Note the regression is y on lagged y, not differenced y on lagged y.<br />
Z T is the adjusted t statistic as in Dickey Fuller.<br />
is just the equivalent in tthe t stat in the DF test. S 2 n is an unbiased estimator (OLS) of the variance of the<br />
error terms.<br />
when j=0 this is a (maximum likelihood) estimate of the variance of the error terms, when j>0 its an<br />
estimator of the covariance between two error terms j periods apart.<br />
q is the number of lagged covariances looked at. Now when the covariances are zero – i.e. no<br />
autocrrelation between error terms is zero for j>0. Hence the second terms disappears and<br />
. In this case we can replace with in:
In this case = 0 and the second term disappears. = 1 thus reduces to<br />
and<br />
= . This is just the t statistic in the standard Dickey Fuller equation. Hence.when there is no<br />
autocorrelation between error terms this part of the <strong>Phillips</strong>-<strong>Perron</strong> test is equal to the Dickey Fuller albeit<br />
one estimated on (2) rather than (1). This perspective helps us understand that the <strong>PP</strong> test corrects the DF<br />
one for autocrrelation amongst error terms non-parametrically (i.e. outside of a regression framework). The<br />
critical values, have the same distribution as the Dickey–Fuller statistic<br />
Although we have not done it when there is no autocorrelation between error terms, when the covariances<br />
are equal then again the second term in the other <strong>PP</strong> statistic collapses to zero because<br />
In this case<br />
which again is the same as the Dickey Fuller test


![[Luyben] Process Mod.. - Student subdomain for University of Bath](https://img.yumpu.com/26471077/1/171x260/luyben-process-mod-student-subdomain-for-university-of-bath.jpg?quality=85)