Topic Maps Visualization
Topic Maps Visualization
Topic Maps Visualization

You also want an ePaper? Increase the reach of your titles
YUMPU automatically turns print PDFs into web optimized ePapers that Google loves.
<strong>Topic</strong> <strong>Maps</strong> <strong>Visualization</strong><br />
Bénédicte Le Grand, Laboratoire d'Informatique de Paris 6<br />
Introduction<br />
<strong>Topic</strong> maps provide a bridge between the domains of knowledge representation and<br />
information management. <strong>Topic</strong>s and associations build a semantic network above<br />
information resources, which allows users to navigate at a higher level of abstraction.<br />
However, this semantic network may contain millions of topics and associations, and users<br />
may still have problems to find relevant information; therefore, the issue of topic maps<br />
visualization and navigation is essential.<br />
A topic map defines a multidimensional topic space: a topic has one or more names within a<br />
scope; it can also have occurrences and may play a role as a member of zero or more<br />
associations. <strong>Topic</strong>s, associations and occurrence may have a type which is a topic, etc. A<br />
topic map is actually a high-dimensional knowledge base.<br />
This chapter is organized as follows: first we will discuss topic maps visualization<br />
requirements. Then, we will review existing high-dimensional visualization techniques and<br />
study how/if they could be applied to topic maps representation. We will conclude by giving a<br />
few directions that could lead to the “ultimate” topic map visualization tool.<br />
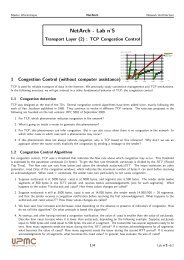
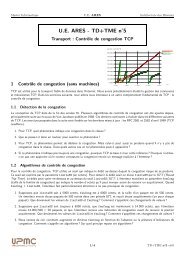
1. <strong>Topic</strong> maps visualization requirements<br />
<strong>Topic</strong> maps are very powerful as they allow to organize information, but they may be very<br />
large. Intuitive visual user interfaces may significantly reduce the cognitive load of the user<br />
when working with these complex structures. <strong>Visualization</strong> is a promising technique for both<br />
enhancing users' perception of structure in large information spaces and providing navigation<br />
facilities. It also enables people to use a natural tool of observation and processing – their eyes<br />
as well as their brain – to extract knowledge more efficiently and find insights [3].<br />
Users needs must be clearly identified in order to design useful visualizations. Before<br />
presenting visualization requirements, we need to study how topic maps are used.<br />
1.1. Different uses of topic maps<br />
We distinguish two kinds of uses of a topic map :<br />
• if the user has a specific question, query languages (such as TMQL [5]) are well<br />
suited. They take the relationships between objects into account, which allows them to<br />
find more accurate answers than traditional search engines – which only consider the<br />
occurrences of words.
• if the user has no precise goal of interest and wants to explore the topic map, she needs<br />
to have an overview of the topic map, so as to know where to start her navigation.<br />
The first type of information retrieval does not require specific visualizations; textual<br />
interfaces may suffice. The second type of information retrieval is more complex as the<br />
subject of interest is not clearly defined. In this case, users may be compared to tourists in a<br />
city they visit for the first time. They need to know what they should see and how to get to<br />
these different places quickly. They may want either to follow a guide or to explore by<br />
themselves.<br />
We can see from this example that there are two kinds of requirements: representation and<br />
navigation. A good representation helps users identify interesting spots whereas an efficient<br />
navigation is essential to access information rapidly.<br />
1.2. <strong>Visualization</strong> requirements<br />
As stated before, both representation and navigation are essential in a good visualization.<br />
According to Schneiderman, "the visual information-seeking mantra is: overview first, zoom<br />
and filter, then details on-demand".<br />
1.2.1. Representation requirements<br />
First of all, we need to provide the user with an overview of the topic map. This overview<br />
must show the main features of the structure in order to allow us to deduce the topic map’s<br />
main characteristics at a glance. Visual representations are particularly fitted to these needs, as<br />
they exploit human abilities to detect patterns.<br />
The first thing we need to know about a topic map is what it deals with, i.e. what its main<br />
concepts are. Once they are identified, we need more structural information, such as the<br />
generality or specificity of the topic map. This kind of information should appear clearly on<br />
the representation so as to help users compare different topic maps quickly and only explore<br />
the most relevant ones in detail. The position of topics on the visual display should reflect<br />
their semantic proximity. These properties can be deduced from the computation of metrics<br />
on the topic map [7].<br />
<strong>Topic</strong> maps are multidimensional knowledge bases. We need to represent topics and the<br />
relationships between these topics: associations. <strong>Topic</strong>s have many characteristics, such as<br />
names, types, occurrences, roles as members of associations, all of which depend on a context<br />
– called scope. All these attributes should appear in the visualization.<br />
The requirements we stated before are not compatible, as it is not possible – neither relevant –<br />
to display simultaneously general information and details. We can compare this with a<br />
geographic map; a map of the world cannot – and should not – be precise. If a user is<br />
interested in details, she must precise her interest, for example choose a specific country. As<br />
in geographical maps, we need to provide different scales in topic maps representations.<br />
Moreover, visualizations should be dynamic to adapt to users' needs in real time;<br />
combinations of time and space can help to ground visual images in one's experience of the<br />
real world and so tap into the users' knowledge base and inherent structures.
To sum up the visual display requirements, we need to represent the whole topic map in order<br />
to help users understand it globally. This overview should reflect the main properties of the<br />
structure. However, users should be able to focus on any part of the topic map and see all the<br />
dimensions they need. Providing these several scales requires the use of different levels of<br />
detail. Finally, the representation should be updated in real time to enable user interaction.<br />
1.2.2. Navigation requirements<br />
A good navigation allows users to explore the topic map and to access information quickly.<br />
Free navigation should be kept for small structures or expert users as the probability of getting<br />
lost is very high. For beginners, predefined navigation paths are preferable until topics of<br />
interest are identified.<br />
Navigation should be intuitive so that it is easy to get from one place to another. Several<br />
metaphors are possible: users may travel by car, by plane, by metro or may simply be<br />
“teleported” – as on the Web - to their destination. The differences lie in what they see during<br />
their journey. From a car, they see details, from a plane they have an overview of the city…<br />
Navigation is essential because it helps users build their own cognitive map – a map-like<br />
cognitive representation of an environment - and increase the rate at which they can assimilate<br />
and understand information.<br />
We have shown that navigation needed to be intuitive and that there should be constraints for<br />
beginner users whereas expert users may explore the structure freely.<br />
In the following section, we will study which visualization techniques meet our requirements<br />
and may be used to represent topic maps.<br />
2. <strong>Visualization</strong> techniques<br />
First we will review current topic maps visualizations; then we will present visualization<br />
techniques used for more general complex structures.<br />
2.1. Current topic maps visualizations<br />
Several topic maps engines provide visualizations of topic maps. Most of them display lists or<br />
indexes from which it is possible to select a topic and see related information. This<br />
representation is very convenient when users' needs are clearly identified. The navigation is<br />
usually the same as on Web sites, i.e. users click on a link to open a new topic or association.<br />
An example of such a visualization is provided by the Ontopia Navigator, as shown on Figure<br />
1.<br />
Apart from these browsed-based navigations, other types of visualizations are currently<br />
available. Empolis K42 displays topic maps as hyperbolic trees (Figure 2); Mondeca’s <strong>Topic</strong><br />
Navigator [9] builds graph representations in real-time, according to what users are allowed or<br />
need to see (Figure 3). Figure 4 is an example of TM4J's [14] topic map dynamic<br />
visualization using TheBrain software [13]. A 3D interactive topic map visualization tool –<br />
UNIVIT (Universal Interactive <strong>Visualization</strong> Tool) - is proposed in [6]. The example shown<br />
on Figure 5 was drawn with UNIVIT, which uses virtual reality techniques such as 3D,<br />
interaction and different levels of detail.
Figure 1. Ontopia Navigator<br />
Figure 2. Empolis K42 TMV Application
Figure 3. Mondeca's <strong>Topic</strong> Navigator<br />
Figure 4. TM4J's topic map visualization with TheBrain software
Figure 5. 3D interactive topic map visualization with UNIVIT<br />
2.2. General visualization techniques<br />
Most of the graphical representations described before are based on graphs or trees.<br />
Advantages and drawbacks of this type of representation will be studied in this section, as<br />
well as other visualization techniques – currently used in other contexts – which may be<br />
adapted to topic maps.<br />
2.2.1. Graphs and trees<br />
<strong>Topic</strong> maps can be seen as a network of topics, so networks/graphs visualizations techniques<br />
may be interesting.<br />
Graphs and trees are suited for representing the global structure of the topic map. However,<br />
trees are better understood by human beings since they are hierarchical. Trees are easy to<br />
interpret. <strong>Topic</strong> maps are not hierarchies and thus may not be – directly – represented as trees.<br />
However, it may be interesting to transform small parts of the topic map into trees. By doing<br />
so on a little part of the topic map ( to avoid clutter), we may benefit from the advantages of<br />
trees.<br />
Techniques such as hyperbolic geometry [10] (Figure 6) allows to display a very large<br />
number of nodes.
Figure 6. Example of graph in a 3D hyperbolic space<br />
Efficient node positioning makes it possible to intuitively derive information from the<br />
distance between nodes. For instance:<br />
• topics linked together by an association may be represented close to each other in the<br />
graph.<br />
• topics of the same type or pointing to the same occurrences may be clustered.<br />
Graphs and trees meet our first requirement since they may represent the whole topic map.<br />
However, the representation may become cluttered rapidly as the number of topics and<br />
associations increases.<br />
Our second requirement, which consists in representing all the different parameters of a topic<br />
map (name, type, scope, etc.), may be really challenging. Figure 7 is a graph obtained with<br />
GraphVisualizer3D (now NV3D) [11]. Different shapes and colors are used to symbolize<br />
various dimensions of nodes and arcs of the graph. This kind of graph may be used to<br />
visualize a topic map; topics would be nodes and associations arcs. However, the number of<br />
different shapes, colors, icons and textures is limited. This representation is not suited for a<br />
topic map containing millions of topics and associations.
Figure 7. GraphVisualizer 3D<br />
Figure 8. MineSet Tree Visualizer<br />
The MineSet Tree Visualizer [12] displays hierarchical data structures in a 3D landscape,<br />
revealing quantitative and multidimensional characteristics of data. Utilizing a fly-through<br />
technique, users view data as visual representations of hierarchical nodes and associations.<br />
Users explore data with any level of detail or summary, from a bird's-eye perspective down to<br />
detailed displays of source data.
2.2.2. <strong>Maps</strong><br />
<strong>Topic</strong> maps are designed to enhance navigation in complex information systems, therefore<br />
representing them as maps seems natural.<br />
NicheWorks [15] provides a schematic representation, which is illustrated on Figure 9.<br />
Figure 9. NicheWorks map of the Chicago Tribune Web site<br />
This visualization may show the global structure of a topic map, but it seems impossible to<br />
display details on such a representation.<br />
ET-<strong>Maps</strong> [2] (Figure 10) are used for Internet homepage categorization and search. They<br />
illustrate the relative importance of each page according to the size of the corresponding zone<br />
on the map. They may be used to represent topics and associations instead of Web pages.
Figure 10. ET-Map<br />
Finding structures in vast multidimensional data sets, be they measurement data, statistics, or<br />
textual documents, is difficult and time-consuming. Interesting, novel relations between the<br />
data items may be hidden in the data. The self-organizing map (SOM) [4] algorithm of<br />
Kohonen can be used to aid the exploration: the structures in the data sets can be illustrated on<br />
special map displays. When applied to the mapping of documents, this algorithm<br />
automatically organizes the documents onto a two-dimensional grid so that related documents<br />
appear close to each other, as shown on Figure 11. This representation is suited to reflect the<br />
structure through an efficient node positioning but fails at displaying associations and topic<br />
maps multiple dimensions.<br />
Figure 11. Self-organizing map
ThemeScape [1] provides different types of maps. They look like topographical maps with<br />
mountains and valleys, as shown on Figure 12. The concept of the layout is simple:<br />
documents with similar content are placed closer together, and peaks appear where there is a<br />
concentration of closely related documents.<br />
Peaks represent concentrations of documents about a similar topic. Higher numbers of<br />
documents create higher peaks. The valleys between peaks can be interesting because they<br />
contain fewer documents and more unique content.<br />
<strong>Topic</strong> Labels reflect the major two or three topics represented in a given area of the map,<br />
providing a quick indication of what the documents are about. Additional labels often appear<br />
when we zoom into the map for greater detail. We can zoom to different levels of<br />
magnification to declutter the map and reveal additional documents and labels.<br />
Figure 12. ThemeScape map<br />
This visualization is very interesting since it combines different representations in several<br />
windows. Users may choose one of them according to the type of information selected.<br />
2.2.3. Virtual worlds and multi-dimensional representations<br />
Visual data mining tools depict original data or resulting models using 3D visualizations,<br />
enabling users to interactively explore data and quickly discover meaningful new patterns,<br />
trends, and relationships.<br />
Visual tools may utilize animated 3D landscapes that take advantage of a human's ability to<br />
navigate in three-dimensional space, recognize patterns, track movement, and compare<br />
objects of different sizes and colors. Users may have complete control over the data's<br />
appearance.
The concept of Populated Information Terrains (PITS) [8] aims at extending database<br />
technology with key ideas from the new fields of Virtual Reality (VR) and Computer<br />
Supported Cooperative Work (CSCW [8]). A PIT is defined as a virtual data space that may<br />
be inhabited by multiple users. The underlying philosophy of PITS is that they should support<br />
people in working together within data as opposed to merely with data. PITS may be seen<br />
both as a means of improving the way in which users browse and interact with data and also<br />
as a means of actively supporting cooperative sharing. Users may appear on the visualization;<br />
their representations are called avatars, as shown on Figure 13.<br />
Figure 13. Virtual world featuring several avatars<br />
Figure 14. Software City<br />
Figure 14 [16] illustrates the use of a spatial metaphor. <strong>Topic</strong> maps may be represented as<br />
cities in which topics would be buildings and associations streets, bridges etc. <strong>Topic</strong>s and
associations related to the same scope could belong to the same district. The multiple<br />
dimensions of a topic map can be represented with this metaphor.<br />
Figure 15. Virtual city and 2D map<br />
One representation of topic maps as virtual cities [7] is shown on Figure 15. <strong>Topic</strong>s are<br />
represented as buildings which coordinates are computed from a matrix of similarities<br />
between topics. Users may navigate freely or follow a guided tour through the city ; they may<br />
also choose to walk or fly. The properties of topics are symbolized by the characteristics of<br />
the corresponding buildings, such as name, color, height, width, depth, etc. Occurrences and<br />
associated topics are displayed in two windows at the bottom of the screen. As human beings<br />
are used to 2D, a traditional 2D map is also provided and the two views – the map and the<br />
virtual city – are always consistent.<br />
Representing topic maps as populated virtual worlds may help users work collectively. Virtual<br />
reality techniques include interactivity and the use of different levels of detail (LOD).<br />
Immersion in virtual worlds makes users feel more involved in the visualization. They may<br />
explore the world and interact with data. However, they may get lost in the virtual world. In<br />
order to avoid these problems, predefined navigation paths should be proposed. The LOD<br />
makes it possible to display many scales: details appear only when the user is close to the<br />
subject of interest.
Conclusion<br />
In this chapter, we reviewed several types of information visualization. Some may represent<br />
efficiently the global structure while others are better at displaying details or providing<br />
interaction with data. It seems that the ultimate topic map visualization tool should benefit<br />
from all these advantages by combining several techniques. This can be done by displaying<br />
several windows or by selecting the most appropriate representation at a given level of detail.<br />
One visualization tool is usually adapted to display a certain amount of data. If only one tool<br />
is to be used for visualization, the topic map may be clustered to reach the scale at which the<br />
tool is useful.<br />
References<br />
[1] Cartia Inc., ThemeScape Product Suite, http://www.cartia.com/products/index.html<br />
[2] Chen, H., Schuffels, C., Orwig, R., Internet Categorization and Search: A Self-Organizing<br />
Approach, Journal of Visual Communication and Image Representation, Special Issue on Digital<br />
Libraries, Volume 7, Number 1, pp 88-102, 1996.<br />
[3] Gershon, N., Eick, S.G., <strong>Visualization</strong>'s New Tack: Making Sense of Information, IEEE Spectrum,<br />
Nov. 1995, pp. 38-56.<br />
[4] Kaski, S., Honkela, T., Lagus, K., Kohonen, T., WEBSOM – self_organizing maps of document<br />
collections, Neurocomputing, volume 21, pp 101-117, 1998.<br />
[5] Ksiezyk, R., Answer is just a question [of matching <strong>Topic</strong> <strong>Maps</strong>], XML Europe 2000, Paris, France,<br />
June 2000.<br />
[6] Le Grand, B., Soto, M., Information management – <strong>Topic</strong> maps visualization, XML Europe 2000,<br />
Paris, France, June 2000.<br />
[7] Le Grand, B., Soto, M., <strong>Topic</strong> <strong>Maps</strong> Metrics, Knowledge Technologies 2001, Austin, Texas, March<br />
2001.<br />
[8] Mariani, J., Benford, S., Populated Information Terrains: Virtual Environments for Data Sharing<br />
and <strong>Visualization</strong>, CSCW, 1994.<br />
[9] Mondeca, <strong>Topic</strong> Navigator, http://www.mondeca.com/site/products/products.html<br />
[10] Munzner, T., H3: Laying Out Large Directed Graphs in 3D Hyperbolic Space, IEEE Symposium on<br />
Information <strong>Visualization</strong>, 1997.<br />
[11] Nvision Software Systems Inc., NV3D Technical Capabilities Overview,<br />
http://www.nv3d.com/html/tco.pdf<br />
[12] Silicon Graphics Inc., Mineset 3.0 Datasheet, http://www.sgi.com/software/mineset/Mineset3.0.pdf,<br />
1999.<br />
[13] TheBrain Technologies Corp., http://www.thebrain.com<br />
[14] TM4J, A <strong>Topic</strong> Map Engine For Java, http://www.techquila.com<br />
[15] Wills, G. J., NicheWorks – Interactive <strong>Visualization</strong> of Very Large Graphs, GD'97, Rome, Italy,<br />
September 1997.<br />
[16] Young, P., 3D Software <strong>Visualization</strong> – <strong>Visualization</strong>s and Representations, Internal Report,<br />
<strong>Visualization</strong> Research Group, University of Durham, 1997.