2012 Corporate Capabilities - Spectroscopy
2012 Corporate Capabilities - Spectroscopy
2012 Corporate Capabilities - Spectroscopy

You also want an ePaper? Increase the reach of your titles
YUMPU automatically turns print PDFs into web optimized ePapers that Google loves.
Volume 26 Number 12 SPECTROSCOPY CORPORATE CAPABILITIES ISSUE December 2011<br />
December 2011 Volume 26 Number 12<br />
®<br />
www.spectroscopyonline.com<br />
<strong>2012</strong> <strong>Corporate</strong><br />
<strong>Capabilities</strong><br />
Online FT-IR <strong>Spectroscopy</strong><br />
for Characterizing Chemical<br />
Process Streams<br />
2011 Editorial Index<br />
Application Notes ♦ See page 93
You are<br />
confident<br />
In business and in the research lab, your confidence depends on accurate<br />
analysis from versatile, innovative instruments that improve productivity<br />
and enhance your knowledge. Thermo Scientific spectroscopy integrates<br />
proven technology with robust, simplified operation and software that<br />
removes ambiguity, making the technique more valuable than ever<br />
before. Whatever the future holds, you are confident.<br />
in every<br />
spectroscopic analysis<br />
• www.thermoscientific.com/confident<br />
Nicolet 6700 FT-IR Spectrometer<br />
Combines flexibility and certainty<br />
in FT-IR<br />
DXR Raman Microscope<br />
Gives actionable answers quickly<br />
and precisely<br />
© 2011 Thermo Fisher Scientific Inc. All rights reserved.<br />
Antaris II FT-NIR Analyzer<br />
Delivers laboratory performance on<br />
the production floor<br />
NanoDrop 2000 UV-Visible<br />
Fast and easy micro-volume<br />
measurements
Is AA dead?<br />
Are ICP/MIPS the future for QAQC analysis?<br />
ON-DEMAND WEBCAST:<br />
Register free at www.spectroscopyonline.com/AA<br />
EVENT OVERVIEW:<br />
Atomic Absorption (AA) has been a routine trace elemental<br />
analytical technique for over 50 years, and it<br />
is used extensively throughout the world. With the<br />
appearance of microwave induced plasma spectroscopy<br />
(MIPS) and lower priced optical inductively<br />
coupled plasma spectrometers (ICP-OES), has the day<br />
come when AA is ready to be replaced by faster analysis<br />
techniques?<br />
Key Learning Objectives:<br />
n Understand the cost base and<br />
comparative capabilities of AA, ICP, and<br />
Microwave Induced Plasma <strong>Spectroscopy</strong><br />
(MIPS)<br />
n Get insight into the future prospects for AA<br />
n Gain a greater degree of clarity about<br />
the analytical roadmap available for your<br />
laboratory following the introduction of<br />
MIPS into the market<br />
The web seminar will compare these three technique<br />
options in terms of their costs and their ability to<br />
address different types of samples. Thoughts on the<br />
future of trace elemental analysis in the short term<br />
(1-3 years) and beyond will also be presented. We will<br />
answer the big question: “What is the analysis roadmap<br />
for your laboratory?”<br />
Who Should Attend:<br />
n Current AA users<br />
n Laboratory personnel conducting trace<br />
elemental analysis<br />
n Laboratory managers with future<br />
requirements to do trace elemental<br />
analysis<br />
n Regulatory compliant enforcers<br />
n QA/QC analysts<br />
n Anyone interested in AA, ICP and MIPS<br />
Presented by<br />
Presenter:<br />
Adrian Holley<br />
Marketing Director,<br />
Trace Elemental Analysis<br />
Thermo Fisher Scientific<br />
Moderator:<br />
Laura Bush<br />
Editorial Director<br />
<strong>Spectroscopy</strong><br />
Sponsored by<br />
For questions contact Jamie Carpenter at jcarpenter@advanstar.com
te<br />
4 <strong>Spectroscopy</strong> 26(12) December 2011<br />
www.spectroscopyonline.com<br />
®<br />
®<br />
PUBLISHING & SALES<br />
485F US Highway One South, Suite 100, Iselin, NJ 08830<br />
(732) 596-0276, Fax: (732) 647-1235<br />
MANUSCRIPTS: To discuss possible article topics or obtain manuscript preparation<br />
guidelines, contact the editorial director at: (732) 346-3020, e-mail: lbush@advanstar.com.<br />
Publishers assume no responsibility for safety of artwork, photographs, or manuscripts.<br />
Every caution is taken to ensure accuracy, but publishers cannot accept responsibility for the<br />
information supplied herein or for any opinion expressed.<br />
SUBSCRIPTIONS: For subscription information: <strong>Spectroscopy</strong>, P.O. Box 6196, Duluth, MN<br />
55806-6196; (877) 527-7008, 7:00 a.m. to 6:00 p.m. CST. Outside the U.S., +1-218-740-6477.<br />
Delivery of <strong>Spectroscopy</strong> outside the U.S. is 3–14 days after printing. Single-copy price:<br />
U.S., $10.00 + $7.00 postage and handling ($17.00 total); Canada and Mexico, $12.00 + $7.00<br />
postage and handling ($19.00 total); Other international, $15.00 + $7.00 postage and handling<br />
($22.00 total).<br />
CHANGE OF ADDRESS: Send change of address to <strong>Spectroscopy</strong>, P.O. Box 6196, Duluth, MN<br />
55806-6196; provide old mailing label as well as new address; include ZIP or postal code.<br />
Allow 4–6 weeks for change. Alternately, go to the following URL for address changes or<br />
subscription renewal: https://advanstar.replycentral.com/?PID=581<br />
RETURN ALL UNDELIVERABLE CANADIAN ADDRESSES TO: Pitney Bowes, P.O. Box<br />
25542, London, ON N6C 6B2, CANADA. PUBLICATIONS MAIL AGREEMENT No.40612608.<br />
REPRINTS: Reprints of all articles in this issue and past issues are available<br />
(500 minimum). Call 800-290-5460, x100 or e-mail AdvanstarReprints@theYGSgroup.com.<br />
DIRECT LIST RENTAL: Contact Tamara Phillips, (440) 891-2773; e-mail: tphillips@<br />
advanstar.com<br />
INTERNATIONAL LICENSING: Maureen Cannon, (440) 891-2742,<br />
fax: (440) 891-2650; e-mail: mcannon@advanstar.com.<br />
Michael J. Tessalone<br />
Science Group Publisher, mtessalone@advanstar.com<br />
Edward Fantuzzi<br />
Publisher, efantuzzi@advanstar.com<br />
Stephanie Shaffer<br />
East Coast Sales Manager, sshaffer@advanstar.com<br />
(508) 481-5885<br />
EDITORIAL<br />
Laura Bush<br />
Editorial Director, lbush@advanstar.com<br />
Megan Evans<br />
Managing Editor, mevans@advanstar.com<br />
Stephen A. Brown<br />
Group Technical Editor, sbrown@advanstar.com<br />
Cindy Delonas<br />
Associate Editor, cdelonas@advanstar.com<br />
Dan Ward<br />
Art Director, dward@media.advanstar.com<br />
MARKETING<br />
Anne Young<br />
Marketing Manager, ayoung@advanstar.com<br />
MARKET DEvELOPMENT<br />
Tamara Phillips<br />
Direct List Rentals, tphillips@advanstar.com<br />
YGS Group<br />
Reprints, advanstarreprints@theYGSgroup.com<br />
Maureen Cannon<br />
Permissions, mcannon@advanstar.com<br />
50% Recycled Paper<br />
s10-20% Post Consumer Wa<br />
PRODUCTION AND AUDIENCE DEvELOPMENT<br />
David Erickson<br />
Production Manager, derickson@media.advanstar.com<br />
Peggy Olson<br />
Audience Development Manager, polson@advanstar.com<br />
Gail Mantay<br />
Audience Development Assistant Manager, gmantay@advanstar.com<br />
©2011 Advanstar Communications Inc. All rights reserved. No part of this publication may<br />
be reproduced or transmitted in any form or by any means, electronic or mechanical including<br />
by photocopy, recording, or information storage and retrieval without permission in writing<br />
from the publisher. Authorization to photocopy items for internal/educational or personal use,<br />
or the internal/educational or personal use of specific clients is granted by Advanstar Communications<br />
Inc. for libraries and other users registered with the Copyright Clearance Center, 222<br />
Rosewood Dr. Danvers, MA 01923, 978-750-8400 fax 978-646-8700 or visit http://www.<br />
copyright.com online. For uses beyond those listed above, please direct your written request<br />
to Permission Dept. fax 440-756-5255 or email: mcannon@advanstar.com.<br />
Advanstar Communications Inc. provides certain customer contact data (such as customers’<br />
names, addresses, phone numbers, and e-mail addresses) to third parties who wish to promote<br />
relevant products, services, and other opportunities that may be of interest to you. If you do not<br />
want Advanstar Communications Inc. to make your contact information available to third parties<br />
for marketing purposes, simply call toll-free 866-529-2922 between the hours of 7:30 a.m. and<br />
5 p.m. CST and a customer service representative will assist you in removing your name from<br />
Advanstar’s lists. Outside the U.S., please phone 218-740-6477.<br />
<strong>Spectroscopy</strong> does not verify any claims or other information appearing in any of the advertisements<br />
contained in the publication, and cannot take responsibility for any losses or other<br />
damages incurred by readers in reliance of such content.<br />
<strong>Spectroscopy</strong> welcomes unsolicited articles, manuscripts, photographs, illustrations and<br />
other materials but cannot be held responsible for their safekeeping or return.<br />
To subscribe, call toll-free 877-527-7008. Outside the U.S. call 218-740-6477.<br />
Advanstar Communications Inc. (www.advanstar.com) is a leading worldwide media company<br />
providing integrated marketing solutions for the Fashion, Life Sciences and Powersports<br />
industries. Advanstar serves business professionals and consumers in these industries with its<br />
portfolio of 91 events, 67 publications and directories, 150 electronic publications and Web<br />
sites, as well as educational and direct marketing products and services. Market leading brands<br />
and a commitment to delivering innovative, quality products and services enables Advanstar<br />
to “Connect Our Customers With Theirs.” Advanstar has approximately 1000 employees and<br />
currently operates from multiple offices in North America and Europe.<br />
Joseph Loggia<br />
President, Chief Executive Officer<br />
Theodore S. Alpert<br />
Executive Vice-President, Finance & Chief Financial Officer<br />
Tony Calanca<br />
Executive Vice-President, Exhibitions<br />
Georgiann DeCenzo<br />
Executive Vice-President, Licensing, Market Development & Europe<br />
Chris DeMoulin<br />
Executive Vice-President, Fashion & President MAGIC International<br />
Thomas Ehardt<br />
Executive Vice-President, Chief Administrative Officer<br />
Eric I. Lisman<br />
Executive Vice-President, <strong>Corporate</strong> Development<br />
Daniel Phillips<br />
Executive Vice-President, Powersports, Dental & Veterinary<br />
Andrew Pollard<br />
Executive Vice-President, Fashion & President, PROJECT<br />
Steve Sturm<br />
Executive Vice-President, Chief Marketing Officer<br />
Ron Wall<br />
Executive Vice-President, Pharmaceutical/Science & CBI<br />
Francis Heid<br />
Vice-President, Media Operations<br />
J vaughn<br />
Vice-President, Information Technology<br />
Mike Alic<br />
Vice-President, Electronic Media Group<br />
Nancy Nugent<br />
Vice-President, Human Resources<br />
Ward D. Hewins<br />
Vice-President, General Counsel<br />
David C. Esola<br />
Vice-President, General Manager<br />
Peter Houston<br />
Director of Content
DISTINCTLY<br />
BETTER<br />
MOLECULAR SPEC<br />
Agilent’s Cary portfolio is the molecular spectroscopy leader.<br />
Highest precision. Fastest performance. Best results. All thanks to a portfolio<br />
of UV-Vis-NIR, FTIR, and Fluorescence instruments that deliver reliable, precise,<br />
and reproducible results—fast. Our proven record of optical design excellence<br />
and innovation ensures you get the right answer every time. That’s leadership<br />
you can count on. That’s Distinctly Better.<br />
© Agilent Technologies, Inc. 2011<br />
To learn more about Agilent’s Cary Molecular <strong>Spectroscopy</strong> portfolio, visit<br />
www.agilent.com/chem/molecular
6 <strong>Spectroscopy</strong> 26(12) December 2011<br />
®<br />
CONTENTS<br />
Columns<br />
www.spectroscopyonline.com<br />
Volume 26 Number 12<br />
DECEMBER 2011<br />
December 2011<br />
Volume 26 Number 12<br />
THE BASELINE 10<br />
Maxwell’s Equations, Part IV<br />
A discussion of magnetism, leading into Maxwell’s second equation<br />
David W. Ball<br />
FOCUS ON QUALITY 14<br />
USP and the GAMP Guide on Laboratory<br />
Computerized Systems — Is Integration Possible?<br />
Here’s what needs to be done to harmonize these two documents.<br />
R.D. McDowall and C. Burgess<br />
Articles<br />
Temporary Online FT-IR <strong>Spectroscopy</strong> for Process 21<br />
Characterization in the Chemical Industry<br />
Case studies involving fouling and product quality illustrate the effective use of this method.<br />
Serena Stephenson, Lamar Dewald, Esteban Baquero, Wendy Flory, Liane Mikolajczyk, and J.D. Tate<br />
Cover image courtesy of<br />
Frederic Cirou/Getty Images.<br />
2011 Editorial Index 26<br />
<strong>Spectroscopy</strong> presents its annual index of authors and articles.<br />
ON THE WEB<br />
FREE WEB SEMINARS<br />
Is AA Dead? Or Is ICP/MIPS the Future<br />
for QA–QC Analysis?<br />
Adrian Holley, Thermo Fisher Scientific<br />
Raman <strong>Spectroscopy</strong> for<br />
Pharmaceutical Product Development<br />
and Manufacturing<br />
Dimuthu Jayawickrama, Senior Research<br />
Investigator, Bristol-Myers Squibb<br />
Raman <strong>Spectroscopy</strong> and Imaging<br />
in Biomedical Research<br />
Igor Chourpa, Professor of Analytical<br />
Chemistry, University of Tours (France)<br />
RF-GD-OES for Depth Profile Analysis:<br />
A Complementary Technique to SIMS<br />
Fuhe Li, Air Liquide–Balazs NanoAnalysis<br />
spectroscopyonline.com/webseminars<br />
INTERVIEW: MID-IR IMAGING<br />
In a new interview, Rohit Bhargava of the<br />
University of Illinois explains the theory of<br />
resolution in mid-IR imaging.<br />
spectroscopyonline.com/imagingtheory<br />
Join the<br />
<strong>Spectroscopy</strong> Group<br />
on LinkedIn<br />
Application Notes: Mass Spectrometry<br />
Simultaneous Qualitative and Quantitative Analysis of Buspirone 93<br />
and Its Metabolites with the Agilent 6550 iFunnel Q-TOF LC–MS System<br />
Yuqin Dai, Michael Flanagan, and Keith Waddell, Agilent Technologies, Inc.<br />
Application Notes: Molecular <strong>Spectroscopy</strong><br />
Long-Wavelength Dispersive 1064 nm Raman: 94<br />
In-Line Pharmaceutical Compound Identification<br />
Clare Dentinger, Steven Pullins, and Eric Bergles, BaySpec, Inc.<br />
Determination of Low Concentration Methanol in Alcohol by 95<br />
an Affordable High Sensitivity Raman Instrument<br />
Duyen Nguyen and Eric Wu, Enwave Optronics, Inc.<br />
Optical Compensation in Variable Angle Transmission 96<br />
Measurements of Thick Samples<br />
S. L. Berets, Harrick Scientific Products, and M. Milosevic, MeV Consulting<br />
Near Infrared <strong>Spectroscopy</strong> Is a Useful Tool 97<br />
in Photovoltaics Panel Development<br />
Rob Morris and Andrew Tatsch, Ocean Optics<br />
Mid-Infrared Reflectivity Measurements of Diffuse Materials 98<br />
Jenni L. Briggs, PIKE Technologies<br />
<strong>Spectroscopy</strong> (ISSN 0887-6703 [print], ISSN 1939-1900 [digital]) is published monthly by Advanstar Communications, Inc.,<br />
131 West First Street, Duluth, MN 55802-2065. <strong>Spectroscopy</strong> is distributed free of charge to users and specifiers of spectroscopic<br />
equipment in the United States. <strong>Spectroscopy</strong> is available on a paid subscription basis to nonqualified readers at the rate of:<br />
U.S. and possessions: 1 year (12 issues), $74.95; 2 years (24 issues), $134.50. Canada/Mexico: 1 year, $95; 2 years, $150. International:<br />
1 year (12 issues), $140; 2 years (24 issues), $250. Periodicals postage paid at Duluth, MN 55806 and at additional mailing<br />
offices. POSTMASTER: Send address changes to <strong>Spectroscopy</strong>, P.O. Box 6196, Duluth, MN 55806-6196. PUBLICATIONS MAIL<br />
AGREEMENT NO. 40612608, Return Undeliverable Canadian Addresses to: Pitney Bowes, P. O. Box 25542, London, ON N6C<br />
6B2, CANADA. Canadian GST number: R-124213133RT001. Printed in the U.S.A.
www.spectroscopyonline.com December 2011 26(12) <strong>Spectroscopy</strong> 7<br />
December 2011 Volume 26 Number 12<br />
<strong>2012</strong> <strong>Corporate</strong> <strong>Capabilities</strong><br />
36 1st Detect Corp.<br />
37 Agilent Technologies, Inc.<br />
38 ABB Analytical Measurements<br />
40 Amptek, Inc.<br />
42 Andor Technology<br />
43 Applied Photophysics<br />
44 Avantes, Inc.<br />
45 B&W Tek, Inc.<br />
46 Bruker Daltonics<br />
48 Bruker Corporation<br />
49 CVI Melles Griot<br />
50 EDAX, Inc.<br />
52 Edinburgh Instruments<br />
53 Energetiq Technology, Inc.<br />
54 Enwave Optronics, Inc.<br />
55 Hamamatsu Corporation<br />
56 Glass Expansion<br />
58 Harrick Scientific Products, Inc.<br />
59 Hellma USA, Inc.<br />
60 HORIBA Scientific<br />
61 International Centre for<br />
Diffraction Data<br />
62 Iridian Spectral Technologies Ltd.<br />
64 International Crystal<br />
Laboratories<br />
65 Meinhard<br />
66 Moxtek, Inc.<br />
68 Milestone Inc.<br />
69 Nippon Instruments<br />
North America<br />
70 Ocean Optics<br />
72 OI Analytical<br />
73 OptiGrate Corp.<br />
74 Optometrics Corporation<br />
75 Oriel Instruments<br />
76 Parker Hannifin Corporation<br />
Filtration and Separation Division<br />
77 Photonis USA<br />
78 PerkinElmer, Inc.<br />
80 PerkinElmer, Inc.<br />
82 PIKE Technologies<br />
84 Polymicro Technologies,<br />
A subsidiary of Molex Incorporated<br />
85 Rigaku Corporation<br />
86 Shimadzu Scientific Instruments<br />
88 SPEX CertiPrep<br />
89 Teledyne Leeman Labs<br />
90 Thermo Fisher Scientific<br />
91 Waters Corporation<br />
92 WITec GmbH
8 <strong>Spectroscopy</strong> 26(12) December 2011<br />
www.spectroscopyonline.com<br />
Editorial Advisory Board<br />
Ramon M. Barnes University of Massachusetts<br />
Paul N. Bourassa Unity Home Medical<br />
Deborah Bradshaw Consultant<br />
Kenneth L. Busch Wyvern Associates<br />
Ashok L. Cholli University of Massachusetts at Lowell<br />
David M. Coleman Wayne State University<br />
Bruce Hudson Syracuse University<br />
David Lankin University of Illinois at Chicago, College of Pharmacy<br />
Barbara S. Larsen DuPont Central Research and Development<br />
Ian R. Lewis Kaiser Optical Systems<br />
Jeffrey Hirsch Thermo Fisher Scientific<br />
Howard Mark Mark Electronics<br />
R.D. McDowall McDowall Consulting<br />
Gary McGeorge Bristol-Myers Squibb<br />
Linda Baine McGown Rensselaer Polytechnic Institute<br />
Robert G. Messerschmidt Rare Light, Inc.<br />
Francis M. Mirabella Jr. Mirabella Practical Consulting Solutions, Inc.<br />
John Monti Montgomery College<br />
Thomas M. Niemczyk University of New Mexico<br />
Anthony J. Nip CambridgeSoft Corp.<br />
John W. Olesik The Ohio State University<br />
Richard J. Saykally University of California, Berkeley<br />
Jerome Workman Jr. Unity Scientific<br />
Contributing Editors:<br />
Fran Adar Horiba Jobin Yvon<br />
David W. Ball Cleveland State University<br />
Kenneth L. Busch Wyvern Associates<br />
Howard Mark Mark Electronics<br />
Volker Thomsen Consultant<br />
Jerome Workman Jr. Unity Scientific<br />
Process Analysis Advisory Panel:<br />
James M. Brown Exxon Research and Engineering Company<br />
Bruce Buchanan Sensors-2-Information<br />
Lloyd W. Burgess CPAC, University of Washington<br />
James Rydzak Glaxo SmithKline<br />
Robert E. Sherman CIRCOR Instrumentation Technologies<br />
John Steichen DuPont Central Research and Development<br />
D. Warren Vidrine Vidrine Consulting<br />
European Regional Editors:<br />
John M. Chalmers VSConsulting, United Kingdom<br />
David A.C. Compton Industrial Chemicals Ltd.<br />
<strong>Spectroscopy</strong>’s Editorial Advisory Board is a group of distinguished individuals<br />
assembled to help the publication fulfill its editorial mission to promote the effective<br />
use of spectroscopic technology as a practical research and measurement tool.<br />
With recognized expertise in a wide range of technique and application areas, board<br />
members perform a range of functions, such as reviewing manuscripts, suggesting<br />
authors and topics for coverage, and providing the editor with general direction and<br />
feedback. We are indebted to these scientists for their contributions to the publication<br />
and to the spectroscopy community as a whole.<br />
Digital processors for<br />
X-ray & Nuclear <strong>Spectroscopy</strong><br />
Solving problems in:<br />
s X -ray analysis<br />
s N uclear Physics<br />
s N uclear Medicine<br />
s Synchrotron research<br />
s<br />
C ompatible with<br />
most detector types<br />
Optimized algorithms for<br />
* Single & Multi -channel <strong>Spectroscopy</strong><br />
* Timing-coincidence<br />
* Pulse shape analysis<br />
* Mapping<br />
* High counting rates<br />
X I A L L C<br />
31057 G enstar R d,<br />
H ayward, C A 94544<br />
T el: 510-401-5760<br />
www. xia.com sales@ xia.com
www.spectroscopyonline.com<br />
News Spectrum<br />
New Website for PIKE<br />
PIKE Technologies (Madison, Wisconsin) debuted a new<br />
company website, www.piketech.com in October. The company,<br />
which manufacturers sampling accessories for Fourier-transform<br />
infrared (FT-IR), near infrared, and ultraviolet–visible (UV–vis)<br />
spectrometers, offers a list of all PIKE products, information<br />
about spectroscopy theory and sampling techniques, multiple<br />
application notes, and other technology and industry-related<br />
details on its website.<br />
The PIKE home page provides an interactive infrared<br />
crystal properties chart and an FT-IR calculator for wavelength<br />
conversions, sample thickness, and average true range<br />
calculations. The website’s search function generates product<br />
information, and there is an online form available for order<br />
placement and quote requests.<br />
Sabine Becker Wins the <strong>2012</strong><br />
Winter Conference Award in<br />
Plasma Spectrochemistry<br />
J. Sabine Becker, the head of trace and ultratrace analysis in<br />
the Central Division of Analytical Chemistry at the Research<br />
Center Juelich, in Juelich, Germany, has won the <strong>2012</strong> Winter<br />
Conference Award in Plasma Spectrochemistry, sponsored by<br />
Thermo Fisher Scientific (San Jose, California). Thermo Fisher will<br />
present the award and a check for $5000 to Becker during the<br />
<strong>2012</strong> Winter Conference on Plasma Spectrochemistry, to be held<br />
in Tucson, Arizona, January 9–14, <strong>2012</strong>.<br />
December 2011 <strong>Spectroscopy</strong> 26(12) 9<br />
Becker’s career in analytical chemistry has focused<br />
on long-lived radionuclides, ultratrace and high-purity<br />
materials analysis, isotope ratio measurements, and<br />
micro- and nanolocal elemental and trace analyses.<br />
Recently she established BrainMet, an Analytical Center<br />
of Excellence at the Research Centre Juelich for brain<br />
research imaging. Based on laser ablation inductively<br />
coupled plasma mass spectrometry (LA-ICP-MS),<br />
BrainMet has introduced novel imaging techniques for<br />
metals, metalloids, and nonmetals in biological tissues.<br />
The approach provides quantitative mapping of essential<br />
and toxic elements in thin sections of diseased and<br />
healthy medical and biological tissue sections.<br />
The Winter Conference Award in Plasma Spectrochemistry,<br />
established in 2009, recognizes scientists who have<br />
made noteworthy contributions over time or through a<br />
single, significant breakthrough. The award acknowledges<br />
achievements in the conceptualization and development<br />
of novel instrumentation as well as the elucidation of<br />
fundamental events or processes involved in plasma<br />
spectrochemistry. Winners include authors of significant<br />
research papers or books that influence new advancements<br />
or pioneers of outstanding new applications that benefit the<br />
field of plasma spectrochemistry.<br />
Applications for the next Winter Plasma Award in 2014 may<br />
be submitted until December 31, <strong>2012</strong>. Further information is<br />
available at www.thermoscientific.com/wpcaward. ◾<br />
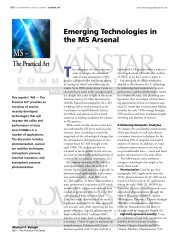
Market Profile: Microvolume UV–vis <strong>Spectroscopy</strong><br />
Microvolume UV–vis is a relatively new segment of<br />
the UV–vis spectroscopy market that has seen very<br />
rapid development. There are a variety of purpose-built<br />
microvolume instruments as well as adaptor accessories<br />
now on the market, most of which are designed for<br />
bioanalysis applications. Several major instrument<br />
vendors compete in the market, although Thermo<br />
Scientific still dominates.<br />
Microvolume UV–vis<br />
spectrophotometers can analyze<br />
sample sizes of under 5 μL, and<br />
in some cases, as small as 0.5<br />
μL. There are now a variety of<br />
microvolume UV–vis instruments<br />
on the market that are specifically<br />
designed for the analysis of such<br />
volumes. Vendors have also<br />
2011 microvolume UV–vis vendor share.<br />
developed a wide range of sampling accessories to allow<br />
for microvolume analysis using conventional UV–vis<br />
instruments. Microvolume spectroscopy was developed<br />
largely to address the needs of those performing<br />
bioanalysis, including the quantitation of DNA, RNA, and<br />
proteins. The conservation of samples is often a major<br />
issue for these end-users.<br />
7% 10% Shimadzu<br />
12%<br />
71%<br />
GE Life Sciences<br />
Other<br />
The market for microvolume UV–vis is expected to<br />
be near $80 million for 2011. Despite broad economic<br />
headwinds coming in <strong>2012</strong>, demand for microvolume<br />
UV–vis should continue to grow due to the expansion of<br />
the biotechnology and clinical analysis industries, as well as<br />
the continued adoption of the technique. Thermo Scientific,<br />
which acquired the first major developer of microvolume<br />
spectrophotometers, Nanodrop,<br />
is the strong leader in the market.<br />
Thermo Scientific<br />
Shimadzu and GE Healthcare are the<br />
other two major competitors. Several<br />
smaller vendors have since developed<br />
their own versions of dedicated<br />
microvolume instruments.<br />
The foregoing data were based<br />
on SDi’s market analysis and<br />
perspectives report entitled Global<br />
Assessment Report, 11th Edition: The Laboratory Life<br />
Science and Analytical Instrument Industry, October<br />
2010. For more information, contact Stuart Press, Vice<br />
President — Strategic Analysis, Strategic Directions<br />
International, Inc., 6242 Westchester Parkway, Suite 100,<br />
Los Angeles, CA 90045, (310) 641-4982, fax: (310)<br />
641-8851, www.strategic-directions.com.
10 <strong>Spectroscopy</strong> 26(12) December 2011 www.spectroscopyonline.com<br />
The Baseline<br />
Maxwell’s Equations, Part IV<br />
The fourth part of this series continues our explanation of Maxwell’s equations, the seminal classical<br />
explanation of electricity and magnetism (and, ultimately, light). For those of you new to the<br />
series, consider reading the last few appearances of this column to get caught up. Alternately, you<br />
can find past columns on our website: www.spectroscopyonline.com/The+Baseline+Column. Words<br />
of warning: For my own reasons, the figures are being numbered sequentially through this series,<br />
which is why the first figure in this column is Figure 26. Also, we’re going to get a bit mathematical.<br />
Unfortunately, that’s par for the course.<br />
David W. Ball<br />
Amagnet is any object that produces a magnetic<br />
field. That’s a rather circular definition (and<br />
saying such is a bit of a pun, when you understand<br />
Maxwell’s equations), but it is a functional one:<br />
A magnet is most simply defined by how it functions.<br />
Technically speaking, all matter is affected by magnets.<br />
It’s just that some objects are affected more than<br />
others and we tend to define magnetism in terms of<br />
the more obvious behavior. An object is magnetic if it<br />
attracts certain metals such as iron, nickel, or cobalt<br />
and if it attracts and repels (depending on its orientation)<br />
other magnets. The earliest magnets occurred<br />
naturally and were called lodestones, a name that<br />
apparently comes from the Middle English “leading<br />
stone,” suggesting an early recognition of the rock’s<br />
ability to point in a certain direction when suspended<br />
freely. By the way, lodestone is simply a magnetic<br />
form of magnetite, an ore whose name comes from<br />
the Magnesia region of Greece, which is itself a part of<br />
Thessaly in central eastern Greece bordering the Aegean<br />
Sea. Magnetite’s chemical formula is Fe 3<br />
O 4<br />
, and<br />
it is actually a mixed FeO–Fe 2<br />
O 3<br />
mineral. Magnetite<br />
itself is not uncommon, although the permanently<br />
magnetized form is, and how it becomes permanently<br />
magnetized is still an open question. (The chemists<br />
among us also recognize Magnesia as giving its name<br />
to the element magnesium. Ironically, the magnetic<br />
properties of Mg are about 1/5000 that of Fe.)<br />
Magnets work by setting up a magnetic field. What<br />
actually is a magnetic field? To be honest, I’m not<br />
sure I can really say, but its effects can be measured<br />
all around the magnet. It turns out that these effects<br />
exert forces that have magnitude and direction: That<br />
is, the magnetic field is a vector field. These forces are<br />
most easily demonstrated by objects that either have a<br />
magnetic field themselves or have an electrical charge<br />
on them, as the exerted force accelerates (changes<br />
the magnitude and direction of the velocity of) the<br />
charge. The magnetic field of a magnet is represented<br />
as B and, again, is a vector field. (The symbol H is also<br />
used to represent a magnetic field, although in some<br />
circumstances there are some subtle differences between<br />
the definition of the B field and the definition<br />
of the H field. Here, we will use B.)<br />
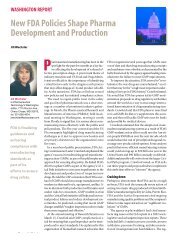
Faraday’s Lines of Force<br />
When Michael Faraday was investigating magnets<br />
starting in the early 1830s, he invented a description<br />
that was used to visualize magnets’ actions: lines of<br />
force. There is some disagreement whether Faraday<br />
thought of these lines as caused by the emanation<br />
of discrete particles or not, but no matter. The lines
www.spectroscopyonline.com<br />
December 2011 <strong>Spectroscopy</strong> 26(12) 11<br />
of force are those things that are<br />
visualized when fine iron filings<br />
are sprinkled over a sheet of paper<br />
that is placed over a bar magnet,<br />
as shown in Figure 26. The filings<br />
show some distinct “lines”<br />
in which the iron pieces collect,<br />
although this is more of a physical<br />
effect than a representation of<br />
a magnetic field. There are several<br />
things that can be noted from the<br />
positions of the iron filings in<br />
Figure 26. First, the field seems to<br />
emanate from two points in the<br />
figure, where the iron filings are<br />
most concentrated. These points<br />
represent poles of the magnet. Second,<br />
the field lines exist not only<br />
between the poles, but arc above<br />
and below the poles in the plane of<br />
the figure. If this figure extended<br />
to infinity in any direction, you<br />
would still see evidence — albeit<br />
less and less as you proceed farther<br />
away from the magnet — of<br />
the magnetic field. Third, the<br />
strength of the field is indicated<br />
by the density of lines in any given<br />
space — the field is stronger near<br />
the poles and directly between the<br />
poles, and the field is weaker farther<br />
away from the poles. Finally,<br />
we note that the magnetic field is<br />
three-dimensional. Although most<br />
of the figure shows iron filings on a<br />
flat plane, around the two poles the<br />
iron filings are definitely out of the<br />
plane of the figure, pointing up.<br />
(The force of gravity is keeping the<br />
filings from piling too high, but the<br />
visual effect is obvious.) For the<br />
sake of convention, the lines are<br />
thought of as “coming out” of the<br />
north pole of a magnet and “going<br />
into” the south pole of the magnet,<br />
although in Figure 26 the poles are<br />
not labeled.<br />
Faraday was able to use the concept<br />
of lines of force to explain<br />
attraction and repulsion by two<br />
different magnets. He argued that<br />
when the lines of force from opposite<br />
poles of two magnets interacted,<br />
they joined together in<br />
such a way as to try to force the<br />
poles together, accounting for the<br />
attraction of opposites (Figure<br />
Figure 26: Photographic representation of magnetic lines of force. Here, a magnetic stir bar was<br />
placed under a sheet of paper and fine iron filings were carefully sprinkled onto the paper. While<br />
the concept of lines of force is a useful one, magnetic fields are continuous and are not broken<br />
down into discrete lines like pictured here. (Photo by author, with assistance from Dr. Royce W.<br />
Beal, Mr. Randy G. Ramsden, and Dr. James Rohrbough of the US Air Force Academy Department<br />
of Chemistry).<br />
(a)<br />
Figure 27: Faraday used the concept of magnetic lines of force to describe attraction and<br />
repulsion. (a) When opposite poles of two magnets interact, the lines of force combine to force<br />
the two poles together, causing attraction. (b) When like poles of two magnets interact, the lines<br />
of force resist each other, causing repulsion.<br />
27a). However, if lines of force<br />
from similar poles of two magnets<br />
interacted, they interfered with<br />
each other in such a way as to<br />
repel (Figure 27b). Thus, the lines<br />
of force were useful constructs to<br />
describe the known behavior of<br />
magnets.<br />
Faraday also could use the lines<br />
of force concept to explain why<br />
some materials were attracted by<br />
(b)<br />
magnets (paramagnetic materials<br />
or in their extreme form called<br />
ferromagnetic materials) or repelled<br />
by magnets (diamagnetic<br />
materials). Figure 28 illustrates<br />
that materials attracted by a magnetic<br />
field concentrate the lines<br />
of force inside the material, while<br />
materials repelled by a magnetic<br />
field exclude the lines of force<br />
from the material.
12 <strong>Spectroscopy</strong> 26(12) December 2011 www.spectroscopyonline.com<br />
(a)<br />
(b)<br />
(c)<br />
Magnetic lines<br />
of force<br />
Figure 28: Faraday used the lines of force concept to explain how<br />
objects behave in a magnetic field. (a) Most substances (like glass,<br />
water, or elemental bismuth) actually slightly repel a magnetic field;<br />
Faraday explained that they excluded the magnetic lines of force from<br />
themselves. (b) Some substances (like aluminum) are slightly attracted<br />
to a magnetic field; Faraday suggested that they include magnetic lines of<br />
force into themselves. (c) Some substances (like iron) are very strongly<br />
attracted to a magnetic field, including (according to Faraday) a large<br />
density of lines of force. Such materials can be turned into magnets<br />
themselves under the proper conditions.<br />
N<br />
Magnet<br />
Hypothetical “line of force”<br />
Figure 29: Hypothetical line of force about a magnet. Compare this to<br />
the photo in Figure 26.<br />
As useful as these descriptions were, Faraday was<br />
not a theorist. He was a very phenomenological scientist<br />
who mastered experiments, but had little mathematical<br />
training with which to model his results.<br />
Other scientists were able to do that, some of whom<br />
were based in Germany and France — but the important<br />
contributions came from other scientists in Faraday’s<br />
own Great Britain.<br />
S<br />
Maxwell’s Second Equation<br />
Two British scientists contributed to a better theoretical<br />
understanding of magnetism: William Thomson<br />
(also known as Lord Kelvin) and James Clerk Maxwell.<br />
However, it was Maxwell who did the more<br />
complete job.<br />
Maxwell was apparently impressed with the concept<br />
of Faraday’s lines of force. In fact, the series of four papers<br />
in which he described what later became Maxwell’s<br />
equations was titled “On Physical Lines of Force.” Maxwell<br />
was a very geometry-oriented person; he felt that<br />
the behavior of the natural universe could, at the very<br />
least, be represented by a drawing or picture.<br />
Let’s consider the lines of force pictured in Figure<br />
26. Figure 29 shows one ideal line of force for a<br />
bar magnet in two dimensions. Remember that this<br />
is a thought experiment — a magnetic field is not<br />
composed of individual lines; rather, it is a continuous<br />
vector field. And within a vector field, the field<br />
lines have some direction as well as magnitude. By<br />
convention, the magnetic field vectors are thought of<br />
as emerging from the north pole of the magnet and<br />
entering the south pole of the magnet. This vector<br />
scheme allows us to apply the right-hand rule when<br />
describing the effects of the magnetic field on other<br />
objects, like charged particles and other magnetic<br />
phenomena.<br />
Consider any box around the line of force. In Figure<br />
29, the box is shown by the dotted rectangle. What is<br />
the net change of the magnetic field through the box?<br />
By focusing on the single line of force drawn, we can<br />
conclude that the net change is zero: There is one line<br />
entering the box on its left side, and one line leaving<br />
the box on its right side. This is easily seen in Figure<br />
29 for one line of force and in two dimensions, but<br />
now let’s expand our mental picture to include all<br />
lines of force and all three dimensions. There will always<br />
be the same number of lines of force going into<br />
any arbitrary volume about the magnet as there are<br />
coming out. There is no net change in the magnetic<br />
field in any given volume. This concept holds no matter<br />
how strong the magnetic field and no matter what<br />
size the volume considered.<br />
How do we express this mathematically? Why, using<br />
vector calculus, of course. In the previous discussion<br />
of Maxwell’s first law, we introduced the divergence of<br />
a vector function F as<br />
divergence of F<br />
F y<br />
F x F z<br />
where F Fx i F y j F z k [1]<br />
x y z<br />
Note what the divergence really is; it is the change in<br />
the x-dimensional value of the function F across the x<br />
dimension, the change in the y-dimensional value of<br />
the function F across the y dimension, and the change<br />
in the z-dimensional value of the function F across<br />
the z dimension. However, we have already presented<br />
the argument from our lines of force illustration that<br />
the magnetic field coming in a volume equals the<br />
magnetic field going out of the volume, so that there<br />
is no net change. Thus, using B to represent our magnetic<br />
field:
www.spectroscopyonline.com<br />
December 2011 <strong>Spectroscopy</strong> 26(12) 13<br />
B x<br />
B y B z<br />
0<br />
[2]<br />
x y z<br />
That means that the divergence of<br />
B can be written as<br />
No<br />
S<br />
N<br />
div B<br />
B x<br />
B y B z<br />
0<br />
[3]<br />
x y z<br />
S<br />
N<br />
or simply<br />
Yes<br />
div B = 0 [4]<br />
S<br />
N<br />
S<br />
N<br />
This is Maxwell’s second equation<br />
of electromagnetism. It is sometimes<br />
called Gauss’s law for magnetism.<br />
Because we can also write the<br />
divergence as the dot product of<br />
the del operator (∇) with the vector<br />
field, Maxwell’s second equation<br />
becomes<br />
∇•B = 0 [5]<br />
What does Maxwell’s second<br />
equation mean? Because the divergence<br />
is an indicator of the<br />
presence of a source (a generator)<br />
or a sink (a destroyer) of a vector<br />
field, it implies that a magnetic<br />
field has no separate generator or<br />
destroyer points in any definable<br />
volume. Contrast this with an electric<br />
field. Electric fields are generated<br />
by two different particles,<br />
positively charged particles and<br />
negatively charged particles. By<br />
convention, electric fields begin at<br />
positive charges and end at negative<br />
charges. Because electric fields<br />
have explicit generators (positively<br />
charged particles) and destroyers<br />
(negatively charged particles), the<br />
divergence of an electric field is<br />
nonzero. Indeed, by Maxwell’s first<br />
equation, the divergence of an electric<br />
field E is<br />
E [6]<br />
which is zero only if the charge density,<br />
ρ, is zero — and if the charge<br />
density is not zero, then the divergence<br />
of the electric field also is not<br />
zero. Furthermore, the divergence<br />
can be positive or negative depending<br />
on whether the charge density is<br />
a source or a sink.<br />
Figure 30: If you break a magnet, you don’t get two separate magnetic poles (“monopoles,” top),<br />
but instead you get two magnets, each having north and south poles (bottom). This is consistent<br />
with Maxwell’s second law of electromagnetism.<br />
For magnetic fields, however, the<br />
divergence is exactly zero, which<br />
implies that there is no discrete<br />
source (“positive” magnetic particle)<br />
or sink (“negative” magnetic<br />
particle). One implication of that is<br />
that magnetic field sources are always<br />
dipoles; there is no such thing<br />
as a magnetic “monopole.” This<br />
mirrors our experience when we<br />
break a magnet in half, as shown in<br />
Figure 30. We don’t get two separated<br />
poles of the original magnet.<br />
Rather, we get two separate<br />
magnets, complete with north and<br />
south poles.<br />
In the next installment, we will<br />
continue our discussion of Maxwell’s<br />
equations and see how E and<br />
B are related to each other. The<br />
first two equations deal with E and<br />
B separately; we will see, however,<br />
that they are anything but separate.<br />
References<br />
(1) B. Baigrie, Electricity and Magnetism<br />
(Greenwood Press, Westport, Connecticut,<br />
2007).<br />
(2) O. Darrigol, Electrodynamics from<br />
Ampere to Einstein (Oxford University<br />
Press, 2000).<br />
(3) D. Halliday, R. Resnick, and J. Walker,<br />
Fundamentals of Physics 6th Ed. (John<br />
Wiley and Sons, New York, New York,<br />
2001).<br />
(4) E. Hecht, Physics (Brooks-Cole Publishing<br />
Co, Pacific Grove, California,<br />
1994).<br />
(5) J.E. Marsden and A.J. Tromba, Vector<br />
Calculus 2nd Ed. (W.H. Freeman and<br />
Company, 1981).<br />
(6) J.R. Reitz, F.J. Milford, and R.W.<br />
Christy, Foundations of Electromagnetic<br />
Theory (Addison-Wesley<br />
Publishing Company, Reading, Massachusetts,<br />
1979).<br />
(7) H.M. Schey, Div., Grad., Curl.,<br />
and All That: An Informal Text on<br />
Vector Calculus 4th Ed. (W.W.<br />
Norton and Company, New York,<br />
New York, 2005).<br />
David W. Ball is normally<br />
a professor of chemistry<br />
at Cleveland State<br />
University in Ohio. For a<br />
while, though, things will<br />
not be normal: starting<br />
in July 2011 and for the<br />
commencing academic<br />
year, David will be serving as Distinguished<br />
Visiting Professor at the United States Air<br />
Force Academy in Colorado Springs, Colorado,<br />
where he will be teaching chemistry to<br />
Air Force cadets. He still, however, has two<br />
books on spectroscopy available through<br />
SPIE Press, and just recently published two<br />
new textbooks with Flat World Knowledge.<br />
Despite his relocation, he still can be contacted<br />
at d.ball@csuohio.edu. And finally,<br />
while at USAFA he will still be working on<br />
this series, destined to become another<br />
book at an SPIE Press web page near you.<br />
For more information on<br />
this topic, please visit:<br />
www.spectroscopyonline.com/ball
14 <strong>Spectroscopy</strong> 26(12) December 2011 www.spectroscopyonline.com<br />
Focus on Quality<br />
USP and the<br />
GAMP Guide on Laboratory<br />
Computerized Systems — Is<br />
Integration Possible?<br />
The United States Pharmacopeia general chapter on analytical instrument qualification (USP<br />
) and the ISPE’s Good Automated Manufacturing Practice (GAMP) Good Practice Guide<br />
on laboratory computerized systems are the two main sources of guidance for qualifying analytical<br />
instruments and validating computerized systems used in the laboratory. This column<br />
explains the discrepancies between the two documents as well as changes now being made to<br />
both in an attempt to enable an integrated approach to qualification and validation of laboratory<br />
instruments and systems.<br />
R.D. McDowall and C. Burgess<br />
There are many sources of advice on computerized<br />
system validation and analytical instrument qualification<br />
for the laboratory, including regulatory<br />
agencies, such as the United States Food and Drug Administration<br />
(FDA) (1,2); regulatory associations such as<br />
the Pharmaceutical Inspection Convention/Co-operation<br />
Scheme (PIC/S) (3,4); the Official Medicines Control<br />
Laboratories (OMCL) in Europe (5); and pharmacopeias<br />
such as the United States Pharmacopeia (USP) (6). Information<br />
also can be obtained from scientific societies or<br />
associations such as the American Association of Pharmaceutical<br />
Scientists (AAPS) (7), the Parenteral Drug<br />
Association (PDA) (8), the Drug Information Association<br />
(DIA) (9), and the International Society of Pharmaceutical<br />
Engineering (ISPE) (10). All of these organizations<br />
have published guidance on instrument qualification or<br />
computer validation either for a general regulated audience<br />
or specifically for a regulated laboratory.<br />
There are two main sources, however, of regulatory<br />
guidance and advice for qualification of analytical instruments<br />
and validation of computerized systems used in<br />
the laboratory. The first is USP general chapter on<br />
analytical instrument qualification (AIQ) (6), which was<br />
derived from an AAPS meeting on analytical instrument<br />
validation held in 2003. One decision that came from that<br />
conference was that the terminology being used at the time<br />
was incorrect, because the conference name itself should<br />
have referred to analytical instrument qualification. The<br />
white paper published by AAPS in 2004 (7) was the major<br />
input to USP , which became effective in 2008.
www.spectroscopyonline.com<br />
December 2011 <strong>Spectroscopy</strong> 26(12) 15<br />
The second source for guidance in a<br />
regulated laboratory comes from ISPE’s<br />
Good Automated Manufacturing Practice<br />
(GAMP) Guide, which is seen by<br />
many as a standard for computerized<br />
system validation. After the publication<br />
of version 4 of this guide in 2001 (11),<br />
ISPE published several “good practice<br />
guides” (GPGs) on specific topics that<br />
were intended to take the principles of<br />
the version 4 guide and tailor them for<br />
a particular subject or focus area. The<br />
GAMP Good Practice Guide on the<br />
Validation of Laboratory Computerized<br />
Systems is one such guide that was published<br />
in 2005 (12).<br />
The major problem with analytical<br />
instruments that are used in a regulated<br />
laboratory is their great variety, complexity,<br />
and variations in intended use.<br />
Furthermore, the software associated<br />
with an instrument can vary from firmware<br />
in basic instruments to servers and<br />
workstations for multiuser networked<br />
data systems.<br />
Writing guidance for the qualification<br />
of this wide range of instrumentation<br />
and software is not easy, as<br />
qualification needs also depend on<br />
the intended use of the instrument<br />
or system. However, as we have both<br />
maintained for a number of years, only<br />
an integrated approach to instrument<br />
qualification and computer validation<br />
— focusing on the key elements that<br />
must be controlled in a single combined<br />
process — is efficient and effective<br />
(13–16). An integrated approach is not<br />
only beneficial from a regulatory and<br />
auditable context, but it also is cost effective<br />
for the business. This approach<br />
is in contrast to conducting an initial<br />
qualification of the instrument and<br />
a separate validation of the software,<br />
which is inefficient and may duplicate<br />
some work. Furthermore, because of<br />
organizational structures, instrument<br />
qualification may be carried out by<br />
the vendor and considerable time may<br />
elapse before the computer validation<br />
is conducted and the system is released<br />
into operational use.<br />
It would be highly advantageous if<br />
the regulations and guidance could all<br />
say similar things and avoid duplicate<br />
tasks. However, with the way the current<br />
versions of USP (6) and the<br />
GAMP 5 & GPG<br />
software-driven<br />
approach<br />
Continuum of<br />
computerized<br />
laboratory<br />
systems<br />
USP <br />
instrument-driven<br />
approach<br />
Apparatus<br />
Group<br />
A<br />
1. Instruments<br />
with<br />
firmware<br />
2. Instruments<br />
with<br />
integral<br />
calculations<br />
Group<br />
B<br />
Figure 1: Mapping USP and GAMP software categories.<br />
GAMP laboratory systems GPG (12) are<br />
written, this is not possible, as we will<br />
illustrate now.<br />
Critique of the GAMP GPG<br />
Laboratory Guide<br />
In 2006, comments were made this column<br />
on the disconnection of the first<br />
edition of the GAMP GPG for validation<br />
of laboratory computerized systems<br />
from the rest of the regulated organization<br />
(13). The version of the GPG at that<br />
time had, from our perspective, the following<br />
issues:<br />
• The guide had an unnecessarily complex<br />
classification of laboratory computerized<br />
systems (13) that did not<br />
match the software-based classification<br />
in the main GAMP guide (17,18).<br />
• According to the GAMP GPG, everything<br />
required validation; there<br />
was no consideration of instrument<br />
qualification.<br />
• There was no linkage with USP<br />
on AIQ.<br />
• There was no reference to the seminal<br />
instrument qualification papers, such<br />
as the discussion of modular and holistic<br />
qualification approaches by Furman<br />
and colleagues (19).<br />
To be fair, the GAMP GPG embraced<br />
a simplified life cycle model that was<br />
a great advance compared to the traditional<br />
V model shown in GAMP 4.<br />
In 2008, GAMP 5 was released (10)<br />
and was an improvement to the previous<br />
version of the guide (11). The new<br />
GAMP 5 was more risk-based and<br />
introduced several life cycle models<br />
depending on the software category.<br />
However, the major problem with this<br />
new version of the GAMP guide was the<br />
removal of category 2 (firmware) from<br />
the categorization of software (17,18).<br />
Category<br />
3<br />
3. Instruments<br />
with<br />
user-defined<br />
programs<br />
4. Instruments<br />
with<br />
commercial<br />
non-config<br />
SW<br />
Group<br />
C<br />
5. Instruments<br />
with<br />
commercial<br />
config SW<br />
Category<br />
4<br />
6. Instruments<br />
with<br />
commercial<br />
config SW+<br />
macros<br />
Category<br />
5<br />
While understandable from a software<br />
system perspective, it is in direct conflict<br />
with USP , in which group B<br />
instruments are firmware-based (6).<br />
Critique of USP <br />
Two earlier “Focus on Quality” columns<br />
commented on USP (13,16). The<br />
classification of analytical equipment<br />
into one of three groups (A, B, and C)<br />
is a simple risk assessment, which is a<br />
good approach, but conflicts with the<br />
more complex GAMP laboratory GPG.<br />
Some of the other problems of <br />
are<br />
• It makes the vendor, rather than the<br />
user, responsible for design qualification<br />
and defining the intended purpose<br />
for a specific laboratory. This is<br />
wrong. Only users can be responsible<br />
for defining their requirements and<br />
selecting the instrument or system<br />
that is appropriate to meet their scientific,<br />
regulatory, and business needs.<br />
The role of a vendor’s specification is<br />
to sell instruments.<br />
• The true role of the vendor is missing<br />
from the data quality triangle in<br />
(16).<br />
• There are subcategories within group<br />
B (instruments) and group C (systems)<br />
that are not covered in the current<br />
version of . This can lead to<br />
noncompliance with 21 CFR 211.68(b)<br />
with regard to checking calculations<br />
embedded in some group B instruments<br />
(16).<br />
• There is no control or guidance in<br />
group B instruments for users to program<br />
routines.<br />
• There is poor software validation<br />
guidance for group C systems that<br />
could result in regulatory observations<br />
for a laboratory.
16 <strong>Spectroscopy</strong> 26(12) December 2011 www.spectroscopyonline.com<br />
No GXP<br />
impact<br />
Group A<br />
apparatus<br />
No qualification or<br />
validation impact<br />
However, qualification is<br />
good analytical science<br />
No qualification or<br />
validation impact<br />
So, where do we go from here?<br />
The next steps will take place on two<br />
fronts: first, a stimulus to the revision<br />
process paper for the update of USP<br />
(20); and second, the drafting of<br />
the second edition of the GAMP GPG<br />
on the validation of laboratory computerized<br />
systems (21), both of which<br />
are planned for publication in the first<br />
quarter of <strong>2012</strong>.<br />
Proposed<br />
risk<br />
assessment<br />
Group B<br />
instruments<br />
Group C<br />
systems<br />
I. Qualification<br />
II. Qualification<br />
and verification<br />
of calculations<br />
III. Qualification<br />
and control of<br />
user-defined<br />
programs<br />
I. Full validation<br />
no instrument<br />
qualification<br />
II. Reduced<br />
validation<br />
no instrument<br />
qualification<br />
III. Full validation<br />
and instrument<br />
qualification<br />
IV. Reduced<br />
validation<br />
and instrument<br />
qualification<br />
Figure 2: Classification of laboratory items under the proposed risk assessment.<br />
USP Stimulus to the<br />
Revision Process<br />
During the AAPS annual meeting in<br />
November 2010, we suggested to the<br />
USP that we write a stimulus to the revision<br />
process paper on . Our proposal<br />
was accepted and we began working<br />
on a draft of the paper, scheduled for<br />
publication in Pharmacopeial Forum in<br />
the January–February <strong>2012</strong> issue (20).<br />
The main aspects of our paper are described<br />
below.<br />
Software Is Important in Analytical<br />
Instrument Qualification<br />
Two key points are necessary for effective<br />
and efficient AIQ. The first is defining<br />
the intended purpose of an item<br />
of laboratory equipment. The second<br />
is identifying the software used in that<br />
equipment. Typically, this software is<br />
either firmware inside an instrument<br />
or on a separate PC running a software<br />
application for controlling the instrument,<br />
as well as acquiring, interpreting,<br />
reporting, and storing the data. Neither<br />
of these software elements is adequately<br />
covered in the current version of<br />
(16).<br />
• The reference to the FDA’s guidance<br />
General Principles of Software Validation<br />
(1) is inappropriate because the<br />
FDA guidance does not consider the<br />
software configuration that is common<br />
with laboratory computerized<br />
systems.<br />
Readers should note that all USP<br />
analytical general chapters will be undergoing<br />
revision between now and<br />
2015, with updates being published in<br />
Pharmacopeial Forum; this revision will<br />
be combined with efforts to harmonize<br />
with chapter with both the Japanese and<br />
European pharmacopeias. New general<br />
chapters will be published in pairs: The<br />
legal requirements will be in chapters<br />
numbered between and and<br />
the corresponding best practice will be<br />
in a general chapter numbered between<br />
and .<br />
AIQ and Computerized System<br />
Validation: Where Are We Now?<br />
With the current versions of USP<br />
and the GAMP GPG on laboratory<br />
computerized systems, if we ask the<br />
question, “Is integration possible?” the<br />
answer is a resounding no. Specifically,<br />
there is no effective and efficient link<br />
between USP , and the GAMP 5,<br />
or indeed the GAMP laboratory GPG.<br />
Mapping USP to GAMP 5<br />
Software Categories<br />
One of the first considerations for revising<br />
should be to close the gap in<br />
the approaches of GAMP 5 and <br />
to reach a unified approach to qualification<br />
and validation, which is shown in<br />
Figure 1. This figure shows our mapping<br />
of the current GAMP software categories<br />
against groups A, B, and<br />
C. Our contention is that there are subcategories<br />
within groups B and C that<br />
are not covered by the current version<br />
of but that should be there to<br />
ensure comprehensive regulatory guidance<br />
(16). It is important to realize that
www.spectroscopyonline.com<br />
December 2011 <strong>Spectroscopy</strong> 26(12) 17<br />
USP is driven by an instrument<br />
or hardware approach (classification<br />
into Groups A, B, and C). In contrast,<br />
the GAMP approach is software driven.<br />
When developing laboratory guidance,<br />
we have to consider both sides of the<br />
equation: hardware and software.<br />
Dropping GAMP software category<br />
2 requires category 3 to accommodate<br />
items ranging from simple analytical<br />
instruments with firmware to laboratory<br />
computerized systems with nonconfigurable<br />
commercial software.<br />
Potentially, we would require validating<br />
all group B instruments under<br />
GAMP rather than qualify them under<br />
. Because group A items do not<br />
contain software, there is no comparable<br />
mapping possible with GAMP<br />
5, but we have included this group in<br />
Figure 1 for completeness. We also<br />
have added GAMP software category<br />
5 under category 4 with it offset to<br />
the right in Figure 1 to show that with<br />
some category 4 systems it is possible<br />
to write user-defined macros.<br />
Comprehensive Risk<br />
Assessment Process<br />
The basic risk assessment model in<br />
is the classification of all laboratory<br />
items into one of the groups (A, B,<br />
or C) based on a definition of intended<br />
use. This approach is generally sound,<br />
because apparatus (group A), instruments<br />
(B), and systems (C) are easily<br />
classified. However, there is a weakness<br />
in that the level of granularity offered<br />
is insufficient to classify the variety of<br />
instruments (B) and systems (C) used<br />
in combination with software in the<br />
laboratory today. Figure 1 illustrates<br />
this point by depicting three subtypes<br />
within group B instruments (that is,<br />
firmware, firmware with calculations,<br />
and firmware with the ability for users<br />
to define programs).<br />
Therefore, our basic proposal in the<br />
stimulus to the revision process paper<br />
(20) is to provide better means of<br />
• unambiguously differentiating<br />
between apparatus (group A) and<br />
instruments (group B) based on functionality<br />
• linking the software elements with the<br />
various types of instrument (group B)<br />
and systems (group C), because current<br />
instrumentation is more complex<br />
that the simplistic use of groups A, B,<br />
and C. This will identify subgroups<br />
within groups B and C.<br />
• identifying items used in a regulated<br />
laboratory that are not GXP relevant,<br />
to exclude them from the qualification<br />
and validation process.<br />
We see this risk assessment as essential<br />
for determining the proper business<br />
and regulatory extent of qualification<br />
and validation for a specific instrument<br />
or system with a defined intended use. It<br />
also is a necessary requirement for complying<br />
with US good manufacturing<br />
practice (GMP) regulations, specifically<br />
21 CFR 21.68(b), which requires that<br />
calculations be checked if the instrument<br />
or system has calculations upon<br />
which the user relies (22). This requirement<br />
is not mentioned in the current<br />
version of .<br />
The risk assessment we propose is<br />
based on asking up to 16 closed questions<br />
(with only yes or no answers) that<br />
can classify an item in one of the four<br />
groups listed below and shown diagrammatically<br />
in Figure 2:<br />
1. No GXP impact of the instrument<br />
or system<br />
2. Group A (apparatus) — no formal<br />
qualification impact, only observation<br />
3. Group B (instruments)<br />
• Instrument only: qualification<br />
required (subcategory I)<br />
• Instrument with software:<br />
qualification required and<br />
calculations verified (subcategory<br />
II)<br />
• Instrument with software:<br />
qualification required plus<br />
control of user-defined<br />
programs (subcategory III)<br />
4. Group C (systems)<br />
• Full validation required but<br />
without instrument qualification<br />
(subcategory I)<br />
• Reduced validation required but<br />
without instrument qualification<br />
(subcategory II)<br />
• Full validation and instrument<br />
qualification required<br />
(subcategory III)<br />
• Reduced validation and instrument<br />
qualification required<br />
(subcategory IV).<br />
SAMPLE PREPARATION<br />
FOR ANALYTICAL<br />
EXCELLENCE!<br />
Jaw Crusher<br />
BB 200<br />
If you are looking for a<br />
complete line of products<br />
for sample preparation,<br />
look no further than RETSCH.<br />
Q Mills for all sample types<br />
Q Fast, reproducible results<br />
every time<br />
Q Wide variety of grinding tools<br />
Q German engineered for many<br />
years of reliable service<br />
Q Easy to use, clean and maintain<br />
Vibratory Disc Mill<br />
RS 200<br />
Planetary Ball Mill<br />
PM 100<br />
Pellet Press<br />
PP 40<br />
1-866-4-RETSCH
18 <strong>Spectroscopy</strong> 26(12) December 2011 www.spectroscopyonline.com<br />
Terminology Is Important<br />
You will notice that we talk in terms of<br />
apparatus, instruments, and systems for<br />
groups A, B, and C, respectively. This is<br />
deliberate and is based on the current<br />
definitions in , and also more accurately<br />
reflects the items found in these<br />
three groups rather than using the allencompassing<br />
term of analytical instruments.<br />
We also recommend that the use<br />
of the ambiguous term equipment be<br />
discontinued in the current context.<br />
4Qs Model Is Replaced by Risk-Based<br />
Qualification and Validation<br />
The 4Qs model of instrument qualification<br />
is confusing because there are two<br />
4Qs models, which we discuss in the<br />
stimulus to the revision process paper:<br />
one for instruments, outlined in ;<br />
and the second for computerized system<br />
validation (CSV), outlined in PDA<br />
Technical Report 32 (8). Also, the FDA<br />
does not use the terms installation qualification<br />
(IQ), operational qualification<br />
(OQ), or performance qualification (PQ)<br />
in the General Principles of Software<br />
Validation (1), as they explain in section<br />
3.1.3 of that document:<br />
While IQ/OQ/PQ terminology has served<br />
its purpose well and is one of many legitimate<br />
ways to organize software validation<br />
tasks at the user site, this terminology<br />
may not be well understood among many<br />
software professionals, and it is not used<br />
elsewhere in this document.<br />
Qualification terminology is also<br />
not well understood in the analytical<br />
laboratory because readers have to be<br />
aware of the context in which a specific<br />
term (qualification or validation)<br />
is used and although we use the same<br />
terms (IQ, OQ, and PQ) they mean<br />
different things depending on whether<br />
we are talking about qualification or<br />
validation (20).<br />
In contrast, both GAMP 5 (10) and<br />
the second edition of the laboratory<br />
GPG (21) use the term verification,<br />
which was adopted from the American<br />
Society for Testing and Materials<br />
(ASTM) Standard E2500 (23), which<br />
includes both the terms qualification<br />
and validation as well as the evergreen<br />
phrase “fit for intended use” throughout.<br />
ASTM E2500 defines verification<br />
as a systematic approach to verify that<br />
manufacturing systems, acting singly or<br />
in combination, are fit for intended use,<br />
have been properly installed, and are<br />
operating correctly. This is an umbrella<br />
term that encompasses all types of approaches<br />
to ensure that systems are fit<br />
for use in qualification, commissioning,<br />
and qualification, verification, system<br />
validation, or others (23).<br />
This definition can be compared to<br />
the one in ANSI –IEEE standard 610.1990<br />
(24), which defines verification as:<br />
1) The process of evaluating a system or<br />
component to determine whether the<br />
products of a given development phase<br />
satisfy the conditions imposed at the start<br />
of that phase; or (2) Formal proof of program<br />
correctness<br />
This Institute of Electrical and Electronics<br />
Engineers (IEEE) standard has<br />
been adopted as an American National<br />
Standards Institute (ANSI) standard.<br />
Therefore, use of the term is mandatory<br />
for all US government departments including<br />
the FDA. If we focus only on the<br />
first IEEE definition, this can be considered<br />
a subset of the ASTM definition<br />
of verification as follows: In software<br />
engineering, which is the context of<br />
IEEE 610, the deliverable or product of a<br />
lifecycle phase, say a functional specification,<br />
is verified against the input to it<br />
(for example, user requirements specification)<br />
to ensure that all requirements<br />
have been developed into software<br />
functions. This is a degree of rigor that<br />
is missing in many laboratory validation<br />
projects.<br />
GAMP Lab Systems Guide:<br />
Second Edition<br />
Since the release of version 5 of the<br />
GAMP guide (10), the 2005 version of<br />
the laboratory GPG has been out of step<br />
with the risk-based approach taken by<br />
the former publication. The GAMP<br />
forum made a decision to revise the<br />
document and publish a second edition<br />
of the GPG (21). A team led by Lorrie<br />
Schuessler of GlaxoSmithKline (GSK,<br />
King of Prussia, Pennsylvania), started<br />
the revision process of the GPG.<br />
Scope of the GPG Second Edition<br />
The remit of the GPG team was to revise,<br />
not reinvent, the document. One<br />
of the key areas was to align the second<br />
edition of the GPG with the terms and<br />
principles of GAMP 5. In doing this,<br />
there was a move from discrete laboratory<br />
computerized system categories<br />
to a risk-based approach, within which<br />
there was an increased emphasis on leveraging<br />
assessments and other services<br />
provided by instrument suppliers. The<br />
team also was tasked with providing<br />
ideas for efficiency in validation activities<br />
and harmonize with USP ,<br />
which was omitted from the first edition<br />
of the GPG.<br />
A draft of the proposed GPG was issued<br />
for public comment in March 2011<br />
and those comments were incorporated<br />
into the revision process. When the<br />
GPG team learned of our planned update<br />
to USP they proposed a collaboration<br />
to align and integrate the two<br />
approaches. We were happy to agree.<br />
We worked closely and openly with a<br />
core team, including Lorrie Schuessler,<br />
Mark Newton, and Paul Smith, to help<br />
draft, review, and revise appendixes to<br />
integrate as much as possible the GAMP<br />
GPG with our proposed update of<br />
(20,21).<br />
Changes in the Second Edition of<br />
the Laboratory Systems GPG<br />
A major change to the laboratory systems<br />
GPG will be the removal of the<br />
categories of laboratory computerized<br />
systems. Depending on your perspective<br />
they were either loved (what?!) or hated<br />
(we’re in this camp). In practice, however,<br />
both the wide range of instruments<br />
and systems as well as the great number<br />
of business processes supported made<br />
use of categories problematic. The same<br />
item could be in several different categories<br />
depending on how it was used in<br />
a particular laboratory — for example, a<br />
sonic bath used for dissolving solutions,<br />
for delivering quantitative sonic energy<br />
or temperature, or in a robot system.<br />
Thus, the wide ranges of use made<br />
single categories misleading and failed<br />
to effectively use the resources needed<br />
for validation. So, now the categories of<br />
laboratory computerized systems have<br />
been replaced with the relative terms<br />
simple, medium, and complex.<br />
The second edition of the GPG is<br />
nearly twice the size of the first edition,<br />
and the majority of the new content is
www.spectroscopyonline.com<br />
December 2011 <strong>Spectroscopy</strong> 26(12) 19<br />
contained in the appendixes (21). The<br />
first edition had only three appendixes,<br />
whereas the second edition has 12 appendixes<br />
to describe items in more<br />
detail. Furthermore, where a topic has<br />
been covered in sufficient detail in the<br />
main GAMP guide, the reader is referred<br />
to it.<br />
New Appendixes<br />
The appendixes of the second edition<br />
GPG are listed below:<br />
1. Comparison of USP and<br />
GAMP GPG<br />
2. Categories of Software<br />
3. System Description<br />
4. Application of EU Annex 11 to<br />
Computerized Lab Systems<br />
5. Data Integrity<br />
6. Definition of Electronic Records<br />
and Raw Data<br />
7. Activities for Simple Systems<br />
8. Activities for Medium Systems<br />
9. Networked Chromatography Data<br />
System with Automated HPLC<br />
Dissolution<br />
10. Instrument Interfacing Systems<br />
including LIMS and Electronic<br />
Notebooks<br />
11. Robotics Systems<br />
12. Supplier Documentation and<br />
Services<br />
From our point of view, Appendix 1<br />
is the most important because it brings<br />
together the two approaches in a single<br />
discussion. A good inclusion in the GPG<br />
are discussions on the latest regulatory<br />
requirements: Appendixes 4 and 6 address<br />
the impact of the new EU GMP<br />
regulations of Annex 11 (25) and Chapter<br />
4 (26), respectively. The increased<br />
emphasis by the regulatory agencies on<br />
data integrity also has been addressed,<br />
in Appendix 5, which helps laboratories<br />
meet the challenge of data integrity<br />
in an electronic environment. Validation<br />
activities for simple, medium, and<br />
complex systems are discussed in four<br />
of the appendixes. Finally, there also is<br />
a discussion of supplier documentation<br />
and services and how to leverage and<br />
use them.<br />
AIQ and CSV. Where Will We Be in<br />
the First Quarter of <strong>2012</strong>?<br />
The title of this column asked if integration<br />
of USP and the GAMP<br />
GPG for validation of laboratory computerized<br />
systems was possible. With<br />
the current versions of the two documents,<br />
this is not possible, because of<br />
the divergent approaches explained<br />
earlier.<br />
However, the first quarter of <strong>2012</strong><br />
brings the promise of integration,<br />
because both two publications will be<br />
updated at that time. Our stimulus<br />
to the revision process paper for USP<br />
will be published in Pharmacopeial<br />
Forum and will detail the risk<br />
assessment and the subdivision of<br />
Groups 1, 2, and 3 (20). The second<br />
edition of the GAMP GPG for the<br />
validation of laboratory computerized<br />
systems also will be published (21). In<br />
it, the categories will be eliminated<br />
and replaced with the GAMP software<br />
categories. Both documents have<br />
common elements and approaches,<br />
because the teams have collaborated<br />
to achieve this.<br />
So, back to the question posed in<br />
the title: Is integration possible between<br />
and the GAMP GPG?<br />
Yes, it is, and with the updates of<br />
these two documents, we are moving<br />
toward that ideal. However, life is not<br />
perfect, at least not yet. GAMP software<br />
category 2 needs to be reinstated<br />
for full alignment with Group<br />
B instruments and to allow more<br />
explicit flexibility in the laboratory<br />
computerized systems GPG. Qualification<br />
of laboratory instrumentation<br />
is not a term that is recognized by<br />
GAMP because they have decided to<br />
use verification instead, yet ISPE provides<br />
guidance documents on facility<br />
commissioning and qualification (27)<br />
— so where is the problem? The revision<br />
of USP also uses the term<br />
validation, which is avoided in the<br />
GPG. However, these differences are<br />
easily surmountable with intelligent<br />
interpretation and implementation of<br />
an integrated approach to AIQ and<br />
CSV in your analytical laboratory.<br />
In the future, we hope that we will<br />
have USP providing the regulatory<br />
overview of analytical instrument<br />
qualification and linking to the relevant<br />
requirement chapters of USP that contain<br />
the specific instrument parameters<br />
to qualify. The GAMP laboratory GPG<br />
could then provide guidance on how<br />
to achieve this as well as the validation<br />
of the software elements (from a single<br />
embedded calculation to the whole application<br />
or system) — a unified and<br />
integrated approach.<br />
If this occurs, then the pharmaceutical<br />
industry can meet the existing<br />
approach that ISO 17025 (28) states in<br />
section 5.5.2:<br />
Equipment and its software used for<br />
testing, calibration and sampling shall<br />
be capable of achieving the accuracy<br />
required…<br />
This implies an integrated approach<br />
to ensure that the analytical instrument<br />
and the associated software work,<br />
as specified for the intended purpose.<br />
Nothing more and nothing less.<br />
Acknowledgments<br />
The authors would like to thank the<br />
following parties for their contribution<br />
to developing the stimulus to the revision<br />
process, the second edition of the<br />
GAMP Laboratory GPG, and review of<br />
this column:<br />
• Horatio Pappa, USP<br />
• Members of the GAMP GPG for<br />
Validation of Laboratory Computerized<br />
Systems were Lorrie Schuessler<br />
(GlaxoSmithKline), Mark Newton<br />
(Eli Lilly & Co.), Paul Smith (Agilent<br />
Technologies), Carol Lee (JRF<br />
America), Christopher H. White<br />
(Eisai Inc.), Craig Johnson (Amgen<br />
Inc.), David Dube (Aveo Pharmaceuticals<br />
Inc.), Judy Samardelis<br />
(Qiagen), Karen Evans and Kiet<br />
Luong (GlaxoSmithKline), Markus<br />
Zeitz (Novartis Pharma AG), Peter<br />
Brandstetter (Acondis) Rachel Adler<br />
(Janssen Pharmaceutical), and<br />
Shelly Gutt (Covance Inc.).<br />
• Mark Newton, Paul Smith, Lorrie<br />
Schuessler, and Horatio Pappa for<br />
providing comments on the draft of<br />
this column.<br />
References<br />
(1) Guidance for Industry, General<br />
Principles of Software Validation,<br />
FDA (2002).<br />
(2) Guidance for Industry, Computerized<br />
Systems in Clinical Investigations,<br />
FDA (2007).
20 <strong>Spectroscopy</strong> 26(12) December 2011 www.spectroscopyonline.com<br />
(3) Pharmaceutical Inspection Convention and Co-operation<br />
Scheme (PIC/S), PIC/S PI-011 Computerized Systems<br />
in GXP Environments (2004).<br />
(4) http://www.edqm.eu/en/General-European-OMCL-<br />
Network-46.html. A document for HPLC qualification<br />
was updated in 2011: http://www.edqm.eu/medias/<br />
fichiers/UPDATED_Annex_1_Qualification_of_HPLC_<br />
Equipment.pdf.<br />
(5) Pharmaceutical Inspection Convention and Co-operation<br />
Scheme (PIC/S), Recommendations on Validation Master<br />
Plan, Installation and Operational Qualification, Non-<br />
Sterile Process Validation and Cleaning Validation, PI-<br />
006 (2001).<br />
(6) United States Pharmacopoeia (USP) Analytical<br />
Instrument Qualification.<br />
(7) American Association of Pharmaceutical Scientists<br />
(AAPS) Analytical Instrument Qualification white paper<br />
(2004).<br />
(8) Validation of Computer Related Systems, Technical Report<br />
18, Parenteral Drug Association (PDA) (1994).<br />
(9) Computerized Systems used in Non-Clinical Safety Assessment<br />
— Current Concepts in Validation and Compliance,<br />
Drug Information Association (2008).<br />
(10) Good Automated Manufacturing Practice (GAMP)<br />
Guideline Version 4, ISPE (2001).<br />
(11) Good Automated Manufacturing Practice (GAMP)<br />
Guideline Version 5, ISPE (2008).<br />
(12) GAMP Good Practice Guide on the Validation of Laboratory<br />
Computerized Systems, First Edition, ISPE (2005).<br />
(13) R.D. McDowall, <strong>Spectroscopy</strong> 21(4), 14–30 (2006).<br />
(14) R.D. McDowall, <strong>Spectroscopy</strong> 21(11), 18–23 (2006).<br />
(15) R.D. McDowall, <strong>Spectroscopy</strong> 21(11), 90–95 (2006).<br />
(16) R.D. McDowall, <strong>Spectroscopy</strong> 25(11), 24–29 (2010).<br />
(17) R.D. McDowall, <strong>Spectroscopy</strong> 24(6), 22–31 (2009).<br />
(18) R.D. McDowall, <strong>Spectroscopy</strong> 25(4), 22–31 (2010).<br />
(19) W. Furman, R. Tetzlaff, and T. Layloff, JOAC Int. 77,<br />
1314–1317 (1994).<br />
(20) C. Burgess and R.D. McDowall, Pharmaceutical Forum,<br />
scheduled for Jan-Feb issue in press <strong>2012</strong>.<br />
(21) GAMP Good Practice Guide on the Validation of Laboratory<br />
Computerised Systems, Second Edition, ISPE, in press,<br />
scheduled for publication Q1 <strong>2012</strong>.<br />
(22) US GMP 21 CFR 211.68(b).<br />
(23) ASTM Standard 2500, Standard Guide for Specification,<br />
Design, and Verification of Pharmaceutical and Biopharmaceutical<br />
Manufacturing Systems and Equipment,<br />
American Society for Testing and Materials (2007).<br />
(24) IEEE Standard 610.1990 and American National Standard,<br />
Glossary of Software Engineering Terminology,<br />
IEEE Piscataway (1990).<br />
(25) EU GMP Annex 11 on Computerized Systems (2011)<br />
(26) EU GMP Chapter 4 Documentation (2011).<br />
(27) ISPE Good Practice Guide: Applied Risk Management for<br />
Commissioning and Qualification, ISPE (2011).<br />
(28) ISO 17025, General Requirements for the Competence<br />
of Testing and Calibration Laboratories, ISO, Geneva<br />
(2005).<br />
Chris Burgess has more than 36 years<br />
of experience in the pharmaceutical industry,<br />
primarily with Glaxo in quality assurance<br />
and analytical R&D. He is a qualified<br />
person under EU GMP and a member<br />
of the United States Pharmacopoeia’s<br />
Council of Experts 2010–2015. He also<br />
is a visiting professor of the University<br />
of Strathclyde’s School of Pharmacy and<br />
Biomedical Sciences in Glasgow, Scotland.<br />
R.D. McDowall is the principal of<br />
McDowall Consulting and director of R.D.<br />
McDowall Limited, and the editor of<br />
the “Questions of Quality” column for<br />
LCGC Europe, <strong>Spectroscopy</strong>’s sister magazine.<br />
Direct correspondence to: spectroscopyedit@advanstar.com<br />
For more information on this topic, please visit:<br />
www.spectroscopyonline.com/mcdowall
www.spectroscopyonline.com<br />
December 2011 <strong>Spectroscopy</strong> 26(12) 21<br />
Temporary Online FT-IR<br />
<strong>Spectroscopy</strong> for Process<br />
Characterization in the<br />
Chemical Industry<br />
The focus of this paper will be on the use of temporary online Fourier-transform infrared<br />
(FT-IR) spectroscopy in the chemical industry including two case-study applications involving<br />
fouling and product quality. These case studies will be followed by a discussion of the use of<br />
temporary online FT-IR analysis enabling process optimization.<br />
Serena Stephenson, Lamar Dewald, Esteban Baquero, Wendy Flory, Liane Mikolajczyk,<br />
and J.D. Tate<br />
The Dow Chemical Company (Midland, Michigan)<br />
is the world’s largest integrated chemical company<br />
utilizing a wide variety of unique chemistries in<br />
the production of both basic and specialty chemicals.<br />
The diversity of chemical processes and the interrelationships<br />
of production facilities in the integrated chemical<br />
complex provide significant opportunities for process<br />
optimization. Fouling, corrosion, plugging, or out-ofspecification<br />
product occurrences in one manufacturing<br />
plant can have negative effects on the operation of one<br />
or more downstream facilities. Accurate and representative<br />
data for process characterization is a key factor in<br />
making informed decisions regarding the resolution of<br />
process problems. The information-rich nature of optical<br />
spectroscopy and, in particular, Fourier-transform infrared<br />
(FT-IR) spectroscopy is uniquely suited for rapid and<br />
continuous online process characterization.<br />
Sometimes grab samples of the process that are analyzed<br />
in the laboratory provide sufficient data for process<br />
characterization. However, the nature of a process<br />
stream frequently makes collecting representative grab<br />
samples difficult. Gas-phase samples, reactive samples,<br />
and samples under elevated (or depressed) temperature<br />
or pressure are a few examples of samples that are particularly<br />
difficult to collect and analyze by laboratory<br />
analysis. Streams where trace (for example, low parts per<br />
million) levels of water or carbon dioxide are the analytes<br />
of interest are also a particular challenge for grab<br />
sample laboratory analysis because concentration levels<br />
are easily influenced by atmospheric composition. Safety<br />
issues must also be considered when collecting samples<br />
of highly toxic or explosive materials such as phosgene,<br />
acrylates, ethylene oxide, hydrogen chloride, or isocyanates.<br />
Depending on the duration and extent of required<br />
toxic material analyses, properly designed continuous<br />
online analysis can help mitigate associated safety issues.<br />
Additionally, when the process event of interest is<br />
transient occurring over a short time-frame, occurring<br />
at unknown intervals, or if the process is not at steadystate,<br />
a continuous online analysis of a representative<br />
sample provides a richness of insight into the process<br />
that would not be achievable by the infrequent glimpses<br />
into the process that is attainable by grab sample analysis.<br />
Lastly, continuous analyses are an invaluable tool<br />
during new process development and process scale-up<br />
due to the ability to thoroughly characterize the process.<br />
Of the available analytical tools for temporary online<br />
process characterization, FT-IR is among the most powerful.<br />
FT-IR is a fast technique providing fundamental<br />
vibrational information for the components in the stream<br />
and allowing the capture and retention of informationrich<br />
spectra. The raw data obtained from FT-IR are often
22 <strong>Spectroscopy</strong> 26(12) December 2011 www.spectroscopyonline.com<br />
Figure 1: Temporary setup of FT-IR analyzer<br />
for analysis of the ethylene stream in case<br />
study 1 for use with attended operation only.<br />
Figure 2: Temporary setup of FT-IR analyzer<br />
in case study 2 for continuous 24/7 data<br />
collection.<br />
referred to as “traceable” because<br />
analysts can refer to primary and<br />
secondary standards corresponding<br />
to the spectral information from<br />
the process sample. Analysts may<br />
also examine the raw spectral data<br />
for interferences that have not been<br />
present previously or do not match<br />
the anticipated stream composition.<br />
A variety of chemometric modeling<br />
techniques (1) are available to obtain<br />
quantitative information, trending<br />
information, or simple qualitative<br />
stream composition analysis from<br />
the raw spectra depending on the<br />
purpose and requirements of the<br />
particular application.<br />
The insights and data obtained<br />
from continuous online FT-IR can be<br />
applied to optimize process control<br />
models, validate the consistency of<br />
production quality, or inform development<br />
of robust and reliable permanent<br />
process analyzer applications.<br />
The following case studies focus on<br />
process control optimization and<br />
product quality.<br />
Experimental<br />
Before discussing case studies it will<br />
be useful to highlight a few basic<br />
considerations for installing a FT-IR<br />
system in a process environment. Of<br />
course, spectrometer setup, operation,<br />
and data processing must be<br />
appropriately specified for a given<br />
application, but unless the sample is<br />
reliably and safely delivered to the<br />
spectrometer the analysis details are<br />
mute. Process analyzer installation<br />
and methods can be complex (2), but<br />
two major design considerations for<br />
temporary analysis are safety and<br />
sample system design. The first to<br />
consider is safety. Although some<br />
safety concerns associated with handling<br />
samples for laboratory analysis<br />
are mitigated by using a process<br />
analyzer and eliminating routine<br />
grab sampling, a distinct set of other<br />
safety related hazards must be addressed.<br />
Of primary concern is assuring<br />
area classifications are met to<br />
mitigate explosion or exposure risks.<br />
In the first case study, the stream was<br />
comprised mostly of ethylene and the<br />
area classification issue was of critical<br />
importance. Because the FT-IR<br />
system that was used was not classified<br />
for a Class 1 Division 2 area,<br />
operating procedures were developed<br />
designating attended operation with<br />
appropriate area lower explosion<br />
limit (LEL) monitoring and emergency<br />
shutdown plans should the<br />
LEL monitor indicate the presence<br />
of a flammable atmosphere. A picture<br />
of the field setup of the analyzer<br />
is shown in Figure 1. On days when<br />
there was a threat of rain, a canopy<br />
was placed over the whole system.<br />
The preferred option would have<br />
been to package the spectrometer in<br />
a z-purged analyzer enclosure. Cost<br />
and timing constraints prevented the<br />
preferred path of C1D2 packaging for<br />
the analyzer in the ethylene analysis<br />
case study. Figure 2 shows the analyzer<br />
packaged for the product quality<br />
case study where the analyzer was<br />
installed in the field and operating<br />
under nonattended operation 24/7.<br />
In the product quality case study, the<br />
location was a nonclassified area, but<br />
the stream composition was highly<br />
toxic and corrosive. The analyzer<br />
enclosure was exposed to the elements<br />
and vortex coolers were used<br />
to control the temperature inside<br />
the enclosure.<br />
The second set of design considerations<br />
revolve around sample systems<br />
and sample handling panels.<br />
Having a continuous online analysis<br />
is not useful if the analyzer is not<br />
provided with a consistent and representative<br />
process sample for analysis.<br />
Sample systems are an integral<br />
part of the success or failure of a process<br />
analytical system (3). FT-IR and<br />
spectroscopic techniques in general<br />
demand much simpler sample systems<br />
than required by typical process<br />
gas chromatography systems,<br />
but fundamentals such as flow and<br />
pressure as well as avoiding condensation,<br />
particulates, and plugging<br />
are still essential. Key methods for<br />
liquid- and gas-phase sample systems<br />
for FT-IR implementation are different.<br />
Here, the focus is on gas-phase<br />
FT-IR as this technique has repeatedly<br />
been demonstrated to meet the<br />
temporary online stream characterization<br />
requirements in a variety of<br />
Dow processes. When it comes to liquid-phase<br />
analysis, attenuated total<br />
reflectance (ATR) FT-IR techniques<br />
are occasionally used, but probe<br />
fouling and lack of ability to monitor<br />
trace levels can be limiting and<br />
the use of a near-infrared or Raman<br />
system may be preferable. For gasphase<br />
process streams, long-pathlength<br />
FT-IR analysis is a workhorse<br />
for stream characterization. The<br />
two systems that were used in the<br />
case studies discussed below are the<br />
MKS 2032 MultiGas FT-IR system<br />
(MKS Instruments, Andover, Massachusetts)<br />
and the Gasmet DX4000
www.spectroscopyonline.com<br />
December 2011 <strong>Spectroscopy</strong> 26(12) 23<br />
FT-IR system (Gasmet Technologies<br />
Oy, Finland). Other FT-IR systems<br />
could also be utilized, but portability<br />
and 24/7 continuous data acquisition<br />
are key requirements.<br />
Case Study — Fouling<br />
The first case study is an application<br />
in a plant trying to solve<br />
plugging and fouling events that<br />
have been occurring regularly<br />
over multiple years. The stream<br />
was primarily ethylene with other<br />
C 2<br />
–C 8<br />
hydrocarbons and unknown<br />
low levels of acrylic acid monomer,<br />
water, and other small organics<br />
thought to be present in concentrations<br />
less than 1 mol%. It was<br />
known that the substance plugging<br />
the equipment at the facility was<br />
polyacrylic acid polymer and that<br />
minimizing the presence of acrylic<br />
acid and water in the stream would<br />
minimize the fouling. Several process<br />
control changes had been tried<br />
throughout the years, based purely<br />
on Aspen process models (Aspen<br />
Abs Arb<br />
(a)<br />
2<br />
0<br />
(b)<br />
2<br />
(c)<br />
0<br />
2<br />
0<br />
(d)<br />
2<br />
0<br />
4000<br />
3000<br />
Technology, Inc., Burlington, Massachusetts),<br />
but the plugging issues<br />
persisted. The unknown was how<br />
various process operating conditions<br />
in surrounding portions of the<br />
Wavenumber (cm -1 )<br />
2000<br />
Figure 3: Spectra of (a) 100% ethylene, (b) 500 ppm water, and (c) 932 ppm acrylic acid, and<br />
(d) a process spectrum at 150 °C and 1 atm with a 5.11-m pathlength at 0.5-cm -1 resolution and<br />
a 1-min collection time.<br />
plant impacted the residual levels of<br />
acrylic acid and water in the region<br />
where fouling occurred. Attempts<br />
to validate the assumptions used for<br />
the process models using aluminum
24 <strong>Spectroscopy</strong> 26(12) December 2011 www.spectroscopyonline.com<br />
Concentration (ppm)<br />
Arbitrary units<br />
-0.00<br />
2500<br />
4500<br />
4000<br />
3500<br />
3000<br />
2500<br />
2000<br />
1500<br />
1000<br />
500<br />
0<br />
Acrylic acid trial A<br />
Acrylic acid trial B<br />
Water trial A<br />
Water trial B<br />
CO<br />
2500 2400 2300 2200 2100 2000 1900<br />
oxide moisture measurements failed<br />
because the aluminum oxide moisture<br />
analyses used were infrequent,<br />
slow to equilibrate, suffered from<br />
calibration drift because of stream<br />
components fouling the sensor, and<br />
were not reproducible. Additionally,<br />
the aluminum oxide sensor only<br />
provided data on the moisture component,<br />
not the acrylic acid concentration<br />
or any of the other hydrocarbons<br />
or organics that were suspected<br />
to be present.<br />
Time--><br />
Figure 4: Acrylic acid and water trends during two different process trials showing significant<br />
impact on the water concentrations between the two sets of process conditions.<br />
Wavenumber (cm -1 )<br />
DCI<br />
2400 2300 2200 2100 2000 1900<br />
Figure 5: Process spectra containing DCl and some CO 2<br />
compared to reference spectra of CO at<br />
both 8-cm -1 and 1-cm -1 resolution.<br />
To achieve a fast response, quantitative<br />
results, low detection limits,<br />
and multicomponent analysis, a<br />
long-path FT-IR was installed at the<br />
process location with a sample line<br />
comprising 50 ft of ¼-in. diameter<br />
heat traced tubing to minimize condensation<br />
or changes in the sample<br />
between the process pipe and the<br />
analyzer. The process sample was<br />
returned to the plant’s vacuum vent<br />
line. This process drop allowed<br />
for continuous flow at the rate of<br />
~2–3 L/min and a constant pressure<br />
in the FT-IR sample cell. The sample<br />
cell pathlength was 5.11 m and 0.5<br />
cm -1 spectral resolution was used.<br />
Figure 3 shows an example spectrum<br />
of 100% ethylene as well as<br />
water and acrylic acid in the concentration<br />
range of interest. Figure<br />
3 also provides a process spectrum<br />
clearly indicating that both water<br />
and acrylic acid are present in the<br />
process ethylene. A total of six components<br />
were monitored in the ethylene<br />
process stream, including the<br />
water and acrylic acid.<br />
A spectral data point was collected<br />
every minute to capture process fluctuations.<br />
A designed set of experiments<br />
was implemented that systematically<br />
changed the plant’s operating<br />
conditions within acceptable ranges<br />
while levels of acrylic acid and water,<br />
among other components, were monitored.<br />
Figure 4 includes process<br />
trend comparisons between just two<br />
of the process condition experiments<br />
showing a better than threefold difference<br />
in water concentration while<br />
having negligible effects on acrylic<br />
acid levels. The fluctuations within<br />
each of the given trials also correlated<br />
with specific process parameters<br />
and provided insight into process<br />
stability. Other tested process<br />
conditions demonstrated decreases<br />
in residual acrylic acid.<br />
The key information learned from<br />
continuous FT-IR data of acrylic acid<br />
and water, as well as the other components,<br />
in comparison with known<br />
process control parameters was identification<br />
of specific process parameters<br />
that enabled reduction in acrylic<br />
acid and water without adversely affecting<br />
quality or other process operations.<br />
The analytical results were<br />
used to optimize the process control<br />
model based on Aspen simulations.<br />
The new process model was implemented<br />
in the plant for control. Before<br />
implementation of the model,<br />
fouling occurred every 1–2 months<br />
causing 2–3 days of downtime per incident.<br />
Since implementation of the<br />
model more than 1 year ago there has<br />
not been a shutdown caused by the<br />
fouling problem. This case study is
www.spectroscopyonline.com<br />
December 2011 <strong>Spectroscopy</strong> 26(12) 25<br />
an excellent example of FT-IR spectroscopy<br />
being used for continuous<br />
online analysis to improve process<br />
operation by providing real-time<br />
data for process correlation. The<br />
plant’s issue was solved without investment<br />
in installation and maintenance<br />
of a permanent FT-IR (or any<br />
other) process analyzer.<br />
Case Study — Product Quality<br />
A second case study, in which gas<br />
phase FT-IR was applied to characterize<br />
a process, was for the purpose<br />
of product quality optimization.<br />
In this case, the goal was product<br />
purity. The stream was very simple<br />
with a single component being<br />
greater than 99.99% pure with contaminants<br />
of interest for continuous<br />
analysis, carbon monoxide (CO) and<br />
carbon dioxide (CO 2<br />
), being present<br />
at levels below 1 ppm under normal<br />
conditions. The major challenge with<br />
analyzing CO 2<br />
by grab sample and<br />
laboratory analysis is atmospheric<br />
contamination of the sample. By<br />
using a continuous online sample<br />
system that is free of leaks, a more<br />
representative sample is achieved. In<br />
this particular case study, the plant<br />
was interested in increasing the purity<br />
of its hydrochloric acid (HCl)<br />
product. The FT-IR data were used to<br />
validate process improvements with<br />
regard to minimizing the CO 2<br />
and<br />
CO content of the product.<br />
Two different FT-IR systems were<br />
applied for the sub-part-per-million<br />
analysis of CO and CO 2<br />
in HCl because<br />
of changing equipment availability.<br />
Both used a 5-m pathlength<br />
multipass cell, a 1-min collection<br />
time, and a 60 °C cell temperature,<br />
and both operated with sample pressures<br />
slightly below atmospheric pressure.<br />
The primary difference between<br />
the two FT-IR systems was spectral<br />
resolution. One system was operated<br />
at 0.5-cm -1 resolution and the other<br />
at 8 cm -1 . Both used modified classical<br />
least squares (CLS) algorithms<br />
for quantitative concentration determination.<br />
There were advantages and<br />
disadvantages of operating under the<br />
different resolutions (5), but both demonstrated<br />
capability for the analysis.<br />
The lower-resolution system required<br />
greater attention to the CLS<br />
model prediction because of spectral<br />
overlap between deuterium chloride<br />
(DCl) and CO. The ro-vibrational<br />
spectra of HCl is well known to have<br />
rotational structure from both the<br />
H 35 Cl and H 37 Cl isotopes. With the<br />
natural abundance of deuterium<br />
being 156 ppm, the spectrum of anhydrous<br />
HCl also contains rotational<br />
structure from the υ=1←0 band of<br />
D 35 Cl and D 37 Cl centered at 2145.163<br />
cm -1 (7) and overlaps the fundamental<br />
CO stretch region. Figure 5<br />
shows the overlap of DCl and CO at<br />
0.5 cm -1 and 8 cm -1 resolution. With<br />
the spectrometer system at 0.5 cm -1<br />
resolution, the best quantitative solution<br />
was to rely on CO transitions<br />
located in the DCl Q-branch gap.<br />
Specifically, the three CO transitions<br />
at 2094.8 (P(12)), 2090.6 (P(13)), and<br />
2086.3 cm -1 (P(14)) were used for the<br />
CO analysis on the 0.5 cm -1 resolution<br />
spectrometer. A modified CLS<br />
method based off of peak areas was<br />
used for quantitative prediction with<br />
the 0.5-cm -1 system. At 8-cm -1 resolution,<br />
a CLS method was developed<br />
and validated assuming a constant<br />
deuterium concentration of 0.0156%<br />
of the HCl concentration and incorporating<br />
HCl concentrations into the<br />
model. This approach also allowed<br />
small pressure and temperature fluctuations<br />
to be accounted for within<br />
the model.<br />
Conclusions<br />
Continuous at-line and online FT-IR<br />
implementation has proven to be effective<br />
for characterizing process<br />
streams that prove challenging from<br />
the perspective of traditional grab<br />
sampling and laboratory analysis.<br />
Care must be taken in sample handling<br />
and implementation to assure<br />
that a representative sample is delivered<br />
to the analyzer.<br />
The value of FT-IR spectroscopy<br />
for process characterization is the information-rich<br />
nature of the data obtained<br />
and how that information is applied<br />
to optimize or troubleshoot the<br />
process. In many cases, a temporary<br />
online setup that provides a few weeks<br />
to a couple of months of stream data is<br />
all that is required for improvements<br />
to be chosen, implemented, and validated.<br />
However, in other cases the information<br />
collected by the temporary<br />
online FT-IR spectrometer indicates<br />
the need for a permanent online analysis<br />
to be used for closed-loop control<br />
or routine monitoring. In these situations,<br />
the stream composition data<br />
from the FT-IR analysis are used to<br />
specify the most robust, reliable, and<br />
economical solution for a permanent<br />
online analysis. In a few cases this<br />
might be a FT-IR system, but more<br />
commonly the permanent solution<br />
is an alternative spectroscopic-based<br />
solution, such as a filter photometer<br />
or tunable diode laser system. Use of<br />
full-spectrum FT-IR stream composition<br />
information while specifying a<br />
permanent analyzer system increases<br />
the success rate of the new application<br />
development and installations of process<br />
analysis technologies.<br />
References<br />
(1) K.R. Beebe, R.J. Pell, and M.B. Seasholtz,<br />
Chemometrics A Practical<br />
Guide (John Wiley & Sons, Inc., New<br />
York, 1998), Chapter 5.<br />
(2) K.J. Clevett, Process Analyzer Technology<br />
(John Wiley & Sons, Inc. New<br />
York, 1986), Chapter 21.<br />
(3) R.E. Sherman, Process Analyzer Sample-<br />
Conditioning System Technology (John<br />
Wiley & Sons, Inc, New York, 2002).<br />
(4) P. Jaakkola, J.D. Tate, M. Paakkunainen,<br />
and P. Saarinen, Appl. Spectrosc.<br />
51, 1159–1169 (1997).<br />
(5) K. P. Huber and G. Herzberg, Molecular<br />
Spectra and Molecular Structure IV.<br />
Constants of Diatomic Molecules (Van<br />
Nostrand-Reinhold, New York, 1979).<br />
Serena Stephenson,<br />
Lamar Dewald, Esteban<br />
Baquero, Wendy Flory, Liane<br />
Mikolajczyk, and J.D. Tate are with<br />
The Dow Chemical Company. Direct correspondence<br />
to: SStephenson@dow.com ◾<br />
For more information on this topic,<br />
please visit our homepage at:<br />
www.spectroscopyonline.com
26 <strong>Spectroscopy</strong> 26(12) December 2011 www.spectroscopyonline.com<br />
Volume 26, 2011<br />
2011 Editorial Index<br />
AUTHORS<br />
A<br />
Acosta, Tayro E. See Misra, Anupam K.<br />
Adar, Fran. “Analytical Vibrational <strong>Spectroscopy</strong> — NIR, IR,<br />
and Raman,” in Molecular <strong>Spectroscopy</strong> Workbench. October,<br />
p. 14.<br />
Adar, Fran. “Entering Raman’s Realm,” in Molecular <strong>Spectroscopy</strong><br />
Workbench. March, p. 22.<br />
Adar, Fran. “Graphene: Why the Nobel Prize and Why Raman?”<br />
in Molecular <strong>Spectroscopy</strong> Workbench. February, p. 16.<br />
Ahmed, Selver; Wunder, Stephanie L.; and Nickolov, Zhorro S.<br />
Raman <strong>Spectroscopy</strong> of Supported Lipid Bilayer Nanoparticles.<br />
Raman Technology for Today’s Spectroscopists, June, p. 8.<br />
Almirall, Jose; and Miziolek, Andrzej. Review of the Third North<br />
American Symposium on Laser-Induced Breakdown <strong>Spectroscopy</strong><br />
(NASLIBS) 2011 Conference. October, p. 48.<br />
Alonso, David E.; Binkley, Joe; and Siek, Kevin. Comprehensive<br />
Analysis of Persistent Organic Pollutants in Complex Matrices<br />
Using GC with High-Performance TOF-MS. Current<br />
Trends in Mass Spectrometry, July, p. 48.<br />
Andrews, Darren. See Matousek, Pavel.<br />
Angel, S. Michael. See Gomer, Nathaniel R.<br />
Artaev, Viatcheslav. See Patrick, Jeffrey S.<br />
Asara, John M. Mass Spectrometry Advances Fossilomics. Current<br />
Trends in Mass Spectrometry, March, p. 18.<br />
Assi, Sulaf; Watt, Robert; and Moffat, Tony. Comparison of<br />
Laboratory and Handheld Raman Instruments for the Identification<br />
of Counterfeit Medicines. Raman Technology for<br />
Today’s Spectroscopists, June, p. 36.<br />
Atkins, P.; Ernyei, L.; Driscoll, W.; Obenauf, R.; and Thomas, R.<br />
Analysis of Toxic Trace Metals in Pet Foods Using Cryogenic<br />
Grinding and Quantitation by ICP-MS, Part I. January, p. 46.<br />
Atkins, P.; Ernyei, L.; Driscoll, W.; Obenauf, R.; and Thomas,<br />
R. Analysis of Toxic Trace Metals in Pet Foods Using<br />
Cryogenic Grinding and Quantitation by ICP-MS, Part<br />
II. February, p. 42.<br />
B<br />
Ball, David W. “Little Points of Light,” in The Baseline. January,<br />
p. 20.<br />
Ball, David W. “Maxwell’s Equations, Part I: History,” in The<br />
Baseline. April, p. 16.<br />
Ball, David W. “Maxwell’s Equations, Part II,” in The Baseline.<br />
June, p. 14.<br />
Ball, David W. “Maxwell’s Equations, Part III,” in The Baseline.<br />
September, p. 18.<br />
Ball, David W. “Maxwell’s Equations, Part IV,” in The Baseline.<br />
December, p. 10.<br />
Balogh, Michael. The Nature and Utility of Mass Spectra. February,<br />
p. 60.<br />
Baquero, Esteban. See Stephenson, Serena.<br />
Bartsch, G. See Pallua, J.D.<br />
Bates, David E. See Misra, Anupam K.<br />
Baumgartner, C. See Pallua, J.D.<br />
Beechem, Thomas E.; and Serrano, Justin R. Raman Thermometry<br />
of Microdevices: Choosing a Method to Minimize Error.<br />
November, p. 36.<br />
Begley, Benjamin; and Koleto, Michael. Single Multipoint Calibration<br />
Curve for Discovery Bioanalysis. Current Trends in<br />
Mass Spectrometry, May, p. 8.<br />
Binkley, Joe. See Alonso, David E.<br />
Binkley, Joe. See Patrick, Jeffrey S.<br />
Bittner, L.K. See Pallua, J.D.<br />
Blank, Thomas B. See Ford, Alan R.<br />
Bloomfield, Matthew. See Matousek, Pavel.<br />
Boeker, Peter. See Haas, Torsten.<br />
Bonn, G.K. See Pallua, J.D.<br />
Brill, Laurence M. Responding to Data Analysis and Evaluation<br />
Challenges in Mass Spectrometry–Based Methods for High-<br />
Throughput Proteomics. Current Trends in Mass Spectrometry,<br />
March, p. 36.<br />
Brouillette, Carl. See Donahue, Michael.<br />
Brueggemeyer, Thomas. See Lanzarotta, Adam.<br />
Burgess, Chris. See McDowall, R.D.
www.spectroscopyonline.com<br />
December 2011 <strong>Spectroscopy</strong> 26(12) 27<br />
Burns, William A. See Osborn, Tabetha.<br />
Burrows, Richard; Wilbur, Steve; and<br />
Clinkscales, Richard. “Analysis of<br />
Flue Gas Desulfurization Wastewaters<br />
by ICP-MS,” in Atomic Perspectives.<br />
November, p. 30.<br />
Busch, Kenneth L. “Consequences of Finite<br />
Ion Lifetimes in Mass Spectrometry,”<br />
in Mass Spectrometry Forum.<br />
September, p. 12.<br />
Busch, Kenneth L. “Detecting Ions in<br />
Mass Spectrometers with the Faraday<br />
Cup,” in Mass Spectrometry Forum.<br />
November, p. 12.<br />
Busch, Kenneth L. “Hybrid Mass Spectrometers,”<br />
in Mass Spectrometry<br />
Forum. March, p. 16.<br />
Busch, Kenneth L. “Mass Spectrometry<br />
for First Responders,” in Mass Spectrometry<br />
Forum. July, p. 12.<br />
Busch, Kenneth L. “Underwater Mass<br />
Spectrometry,” in Mass Spectrometry<br />
Forum. January, p. 30.<br />
Bush, Laura. The Dynamic World of<br />
X-ray Fluorescence. July, p. 40.<br />
Bush, Laura. ICP-MS for Forensic Applications.<br />
October, p. 57.<br />
Bush, Laura. “LIBS in Forensics,” in Lasers<br />
and Optics Interface. April, p. 34<br />
C<br />
Caldwell, Brittany. See Mahadevan-Jansen,<br />
Anita.<br />
Carrasco-Pancorbo, Alegria. See Cuadros-Rodriguez,<br />
Luis.<br />
Carson, William W.; and Zhou, Ming.<br />
GPC-IR Hyphenated Technology to<br />
Characterize Copolymers and to Deformulate<br />
Complex Polymer Mixtures<br />
in Polymer-Related Industries. FT-IR<br />
Technology for Today’s Spectroscopists,<br />
August, p. 28.<br />
Carter, J. Chance. See Gomer, Nathaniel<br />
R.<br />
Cassup, Matthew. “Using ICP-MS and<br />
ICP-OES to Measure Trace Elemental<br />
Impurities in Pharmaceuticals in<br />
Compliance with Proposed Pharmacopeia<br />
Chapters,” in Atomic Perspectives.<br />
March, p. 26.<br />
Castro-Suarez, John R. See Hernández-<br />
Rivera, Samuel P.<br />
Chang, Da Hu. See Zhang, Zhen Long.<br />
Chaurand, Pierre. Imaging Mass Spectrometry:<br />
Current Performance and<br />
Upcoming Challenges. Current Trends<br />
in Mass Spectrometry, July, p. 30.<br />
Chen, Ping. See Matousek, Pavel.<br />
Chen, Xiaojing; Wu, Di; and He, Yong. An<br />
Integration of Modified Uninformative<br />
Variable Elimination and Wavelet<br />
Packet Transform for Variable Selection.<br />
April, p. 42.<br />
Chipara, Alin Cristian. See Chipara, Dorina<br />
Magdalena.<br />
Chipara, Dorina Magdalena; Chipara, Alin<br />
Cristian; and Chipara, Mircea. Raman<br />
<strong>Spectroscopy</strong> of Carbonaceous Materials:<br />
A Concise Review. October, p. 42.<br />
Chipara, Mircea. See Chipara, Dorina<br />
Magdalena.<br />
Christesen, Steve D. See Ford, Alan R.<br />
Clinkscales, Richard. See Burrows, Richard.<br />
Cole, Alun. See Haas, Torsten.<br />
Coulier, Leon; Tas, Albert; and Thissen,<br />
Uwe. Food Metabolomics: Fact or<br />
Fiction? Current Trends in Mass Spectrometry,<br />
May, p. 34.<br />
Countryman, Sky. See Li, Shuguang.<br />
Coutinho, Carlos Augusto; and Thomsen,<br />
Volker. Spectrometers for Elemental<br />
Spectrochemical Analysis, Part IV:<br />
Inductively Coupled Plasma Optical<br />
Emission Spectrometers. September,<br />
p. 44.<br />
Cowin, James P. See Yu, Xiao-Ying.<br />
Cuadros-Rodriguez, Luis; Carrasco-<br />
Pancorbo, Alegria; and Iglesias, Natalia<br />
Navas. Mass Spectrometry in Analytical<br />
Lipidomics. Current Trends in<br />
Mass Spectrometry, July, p. 8.<br />
D<br />
David, Frank; Sandra, Pat; and Hancock,<br />
Peter. Determining High-Molecular-<br />
Weight Phthalates in Sediments Using<br />
GC–APCI-TOF-MS. Current Trends in<br />
Mass Spectrometry, May, p. 42.<br />
Deschaines, Timothy O. See Hirsch, Jeffrey.<br />
Dewald, Lamar. See Stephenson, Serena.<br />
Diem, Max. See Hernández-Rivera, Samuel<br />
P.<br />
Donahue, Michael; Huang, Hermes;<br />
Brouillette, Carl; Smith, Wayne; and<br />
Farquharson, Stuart. Detecting Explosives<br />
by Portable Raman Analyzers: A<br />
Comparison of 785-, 976-, 1064-, and<br />
1550-nm (Retina-Safe) Laser Excitation.<br />
Defense and Homeland Security,<br />
April, p. 24.<br />
Dottery, Edwin L. See Ford, Alan R.<br />
Driscoll, W. See Atkins, P.<br />
E<br />
Enders, Jeffrey R.; Goodwin, Cody R.; Marasco,<br />
Christina C.; Seale, Kevin T.; Wikswo,<br />
John P.; and McLean, John A. Advanced<br />
Structural Mass Spectrometry<br />
for Systems Biology: Pulling the Needles<br />
from Haystacks. Current Trends in Mass<br />
Spectrometry, July, p. 18.<br />
Ernyei, L. See Atkins, P.<br />
Evans, Megan. Developing a Career in FT-<br />
IR. April, p. 58.<br />
Evans, Megan. 2011 Salary Survey: The<br />
Upside of Science. March, p. 30.<br />
Evans, Megan. Review of the 59th Annual<br />
ASMS Conference. Current Trends in<br />
Mass Spectrometry, July, p. 54.<br />
F<br />
Farquharson, Stuart. See Donahue, Michael.<br />
Fischer, Steve. See Sana, Theodore.<br />
Fisher, Eric W. Advances in <strong>Spectroscopy</strong><br />
for Detection and Identification of Potential<br />
Bioterror Agents. Defense and<br />
Homeland Security, April, p. 29.<br />
Flory, Wendy. See Stephenson, Serena.<br />
Ford, Alan R.; Waterbury, Robert D.;<br />
Vunck, Darius M.; Rose, Jeremy B.;<br />
Blank, Thomas B.; Pohl, Ken R.;<br />
McVay, Troy A.; Dottery, Edwin L.;<br />
Hankus, Mikella E.; Holthoff, Ellen L.;<br />
Pellegrino, Paul M.; Christesen, Steve<br />
D.; and Fountain III, Augustus W. Explosives<br />
Sensing Using Multiple Optical<br />
Techniques in a Standoff Regime<br />
with a Common Platform. Defense and<br />
Homeland Security, April, p. 6.<br />
Fountain III, Augustus W. See Ford, Alan<br />
R.<br />
G<br />
Gao, Yue. See Yu, Kate.<br />
Gendron, Colleen M. See Smith-Goettler,<br />
Brandye.<br />
Gomer, Nathaniel R.; Gordon, Christopher<br />
M.; Lucey, Paul; Sharma, Shiv<br />
K.; Carter, J. Chance; and Angel, S.<br />
Michael. Raman <strong>Spectroscopy</strong> Using<br />
a Fixed-Grating Spatial Heterodyne<br />
Interferometer. Raman Technology for<br />
Today’s Spectroscopists, June, p. 22.<br />
Goodwin, Cody R. See Enders, Jeffrey R.<br />
Gordon, Christopher M. See Gomer, Nathaniel<br />
R.<br />
Gorla, Srinivasa. See Roy, Arindam.<br />
Granja, Nara de Matos. See Mahadevan-<br />
Jansen, Anita.
28 <strong>Spectroscopy</strong> 26(12) December 2011 www.spectroscopyonline.com<br />
Gratz, Samuel. See Lanzarotta, Adam.<br />
Green, Joshua. See Osborn, Tabetha.<br />
H<br />
Haas, Torsten; Boeker, Peter; Cole, Alun;<br />
and Horner, Gerhard. High-Definition<br />
Screening for Boar Taint in Fatback<br />
Samples Using GC–MS. Current<br />
Trends in Mass Spectrometry, July, p.<br />
38.<br />
Hancock, Peter. See David, Frank.<br />
Handler, M. See Pallua, J.D.<br />
Hankus, Mikella E. See Ford, Alan R.<br />
Hargreaves, Michael. See Matousek,<br />
Pavel.<br />
He, Yong. See Chen, Xiaojing.<br />
Heinle, Lance; and Jenkins, Gary. Creating<br />
a High-Throughput LC–MS-MS<br />
System Using Common Components.<br />
Current Trends in Mass Spectrometry,<br />
October, p. 16.<br />
Hernández-Rivera, Samuel P.; Castro-<br />
Suarez, John R.; Pacheco-Londoño,<br />
Leonardo C.; Primera-Pedrozo, Oliva<br />
M.; Rey-Villamizar, Nicolas; Vélez-<br />
Reyes, Miguel; and Diem, Max. Mid-<br />
Infrared Vibrational <strong>Spectroscopy</strong><br />
Standoff Detection of Highly Energetic<br />
Materials: New Developments. Defense<br />
and Homeland Security, April, Digital<br />
Edition.<br />
Herrmann, Otto. See Switzer, Teresa.<br />
Hirsch, Jeffrey; Deschaines, Timothy<br />
O.; and Strother, Todd. Improved<br />
Principal Component Discrimination<br />
of Commercial Inks Using Surface-Enhanced<br />
Resonant Raman<br />
Scattering. October, p. 32.<br />
Hodkiewicz, Joe. “The Importance of<br />
Tight Laser Power Control When<br />
Working with Carbon Nanomaterials,”<br />
in Lasers and Optics Interface.<br />
July, p. 22.<br />
Holthoff, Ellen L. See Ford, Alan R.<br />
Horner, Gerhard. See Haas, Torsten.<br />
Howard, James W. See Kay, Richard G.<br />
Huang, Hermes. See Donahue, Michael.<br />
Huck-Pezzei, V. See Pallua, J.D.<br />
Huck, C.W. See Pallua, J.D.<br />
Hussain, Samina; Liba, Amir; and<br />
McCurdy, Ed. Validating ICP-<br />
MS for the Analysis of Elemental<br />
Impurities According to Draft<br />
USP General Chapters and<br />
. Applications of ICP & ICP-<br />
MS Techniques for Today’s Spectroscopists,<br />
November, p. 14.<br />
I<br />
Iedema, Martin J. See Yu, Xiao-Ying.<br />
Iglesias, Natalia Navas. See Cuadros-Rodriguez,<br />
Luis.<br />
Ilic, Darko. See Switzer, Teresa.<br />
Infantino, Gabe. See Nam, Kwan H.<br />
Isensee, Robert. See Nam, Kwan H.<br />
J<br />
Jakubowski, Jr., Edward M. See McGuire,<br />
Jeffrey M.<br />
Jarvis, Michael J.Y. See Taylor, Adrian M.<br />
Jenkins, Gary. See Heinle, Lance.<br />
Johnson, David W. Application of Raman<br />
<strong>Spectroscopy</strong> to Lubricants, Lubricated<br />
Surfaces, and Lubrication Phenomena.<br />
July, p. 46.<br />
K<br />
Kang, Liping. See Yu, Kate.<br />
Kay, Richard G.; Howard, James W.; and<br />
Pleasance, Steve. Time-Resolved SRM<br />
Analysis and Highly Multiplexed LC–<br />
MS-MS for Quantifying Tryptically<br />
Digested Proteins. Current Trends in<br />
Mass Spectrometry, March, p. 24.<br />
Keller, Matthew D. See Mahadevan-Jansen,<br />
Anita.<br />
Kelley, Mark C. See Mahadevan-Jansen,<br />
Anita.<br />
Kim, Youngjae; and Salhany, Joseph.<br />
“Multiphoton <strong>Spectroscopy</strong>,” in Lasers<br />
and Optics Interface. January, p. 24.<br />
Klocker, H. See Pallua, J.D.<br />
Koerner, Phil; and McGinley, Michael.<br />
25-Hydroxyvitamin D 2<br />
/D 3<br />
Analysis<br />
in Human Plasma Using LC–MS.<br />
Current Trends in Mass Spectrometry,<br />
March, p. 8.<br />
Koleto, Michael. See Begley, Benjamin.<br />
Kremser, L. See Pallua, J.D.<br />
L<br />
Lanzarotta, Adam; Gratz, Samuel;<br />
Brueggemeyer, Thomas; and Witkowski,<br />
Mark. A Targeted Approach to<br />
Detect Controlled Substances in Suspect<br />
Tablets Using Attenuated Total<br />
Internal Reflection Fourier-Transform<br />
Infrared Spectroscopic Imaging. February,<br />
p. 34.<br />
Layne, Jeff. See Li, Shuguang.<br />
Li, Li; and Schug, Kevin. On- and Off-<br />
Line Coupling of Separation Techniques<br />
to Ambient Ionization Mass<br />
Spectrometry. Current Trends in Mass<br />
Spectrometry, October, p. 8.<br />
Li, Qingbo. See Zhang, Qianxuan.<br />
Li, Shuguang; Layne, Jeff; Countryman,<br />
Sky; and McGinley, Michael. A Sensitive,<br />
Specific, Accurate, and Fast LC–<br />
MS-MS Method for Measurement of<br />
Ethyl Glucuronide and Ethyl Sulfate in<br />
Human Urine. Current Trends in Mass<br />
Spectrometry, July, p. 42.<br />
Liba, Amir. See Hussain, Samina.<br />
Lindner, H. See Pallua, J.D.<br />
Loeffen, Paul. See Matousek, Pavel.<br />
Lowry, Steve. Optimizing FT-IR Sampling<br />
for a Method to Determine the Chemical<br />
Composition of Microbial Materials.<br />
June, p. 30.<br />
Lowry, Steve; and Weesner, Forrest. Using<br />
Real-Time FT-IR to Characterize UV<br />
Curable Optical Adhesives. FT-IR<br />
Technology for Today’s Spectroscopists,<br />
August, p. 40.<br />
Lucey, Paul. See Gomer, Nathaniel R.<br />
M<br />
Ma, Baiping. See Yu, Kate.<br />
MacPhail, Neil. See Smith-Goettler, Brandye.<br />
Mahadevan-Jansen, Anita; Keller, Matthew<br />
D.; Vargis, Elizabeth; Caldwell,<br />
Brittany; Nguyen, The-Quyen; Granja,<br />
Nara de Matos; Sanders, Melinda; and<br />
Kelley, Mark C. Looking Below the<br />
Surface of Breast Tissue During Surgery.<br />
Raman Technology for Today’s<br />
Spectroscopists, June, p. 48.<br />
Marasco, Christina C. See Enders,<br />
Jeffrey R.<br />
Mark, Howard. Pittcon 2011 New Product<br />
Review. May, p. 32.<br />
Mark, Howard; and Workman, Jr., Jerome.<br />
“Classical Least Squares, Part<br />
IV: Spectroscopic Theory Continued,”<br />
in Chemometrics in <strong>Spectroscopy</strong>.<br />
February, p. 26.<br />
Mark, Howard; and Workman, Jr., Jero<br />
me. “Classical Least Squares, Part V:<br />
Experimental Results,” in Chemometrics<br />
in <strong>Spectroscopy</strong>. May, p. 12.<br />
Mark, Howard; and Workman, Jr., Jerome.<br />
“Classical Least Squares, Part<br />
VI: Spectral Results,” in Chemometrics<br />
in <strong>Spectroscopy</strong>. June, p. 22.<br />
Mark, Howard; and Workman, Jr., Jerome.<br />
“Classical Least Squares, Part<br />
VII: Spectral Reconstruction of Mixtures,”<br />
in Chemometrics in <strong>Spectroscopy</strong>.<br />
October, p. 24.<br />
Mason, Michael. See Patrick, Jeffrey S.
www.spectroscopyonline.com<br />
December 2011 <strong>Spectroscopy</strong> 26(12) 29<br />
Matousek, Pavel; Thorley, Fiona; Chen,<br />
Ping; Hargreaves, Michael; Tombling,<br />
Craig; Loeffen, Paul; Bloomfield, Matthew;<br />
and Andrews, Darren. Emerging<br />
Raman Techniques for Rapid Noninvasive<br />
Characterization of Pharmaceutical<br />
Samples and Containers. March, p. 44.<br />
McCurdy, Ed. See Hussain, Samina.<br />
McDowall, R.D. “Is GMP Annex 11 Europe’s<br />
Answer to 21 CFR 11?” in Focus<br />
on Quality. April, p. 24.<br />
McDowall, R.D. “Periodic Reviews of<br />
Computerized Systems, Part I,” in<br />
Focus on Quality. September, p. 28.<br />
McDowall, R.D. “Periodic Reviews of<br />
Computerized Systems, Part II,” in<br />
Focus on Quality. November, p. 20.<br />
McDowall, R.D.; and Burgess, Chris.<br />
“USP and the GAMP Guide<br />
on Laboratory Computerized Systems<br />
— Is Integration Possible?” in Focus on<br />
Quality. December, p. 14.<br />
McGinley, Michael. See Koerner, Phil.<br />
McGinley, Michael. See Li, Shuguang.<br />
McGuire, Jeffrey M.; Jakubowski, Jr., Edward<br />
M.; and Thomson, Sandra A.<br />
Monitoring of Biological Matrices by<br />
GC–MS-MS for Chemical Warfare<br />
Nerve Agent Detection. Defense and<br />
Homeland Security, April, p. 12.<br />
McLean, John A. See Enders, Jeffrey R.<br />
McSheehy-Ducos, Shona. Overcoming<br />
the Challenges Associated with the<br />
Direct Analysis of Trace Metals in Seawater<br />
Using ICP-MS. Applications of<br />
ICP & ICP-MS Techniques for Today’s<br />
Spectroscopists, November, p. 22.<br />
McVay, Troy A. See Ford, Alan R.<br />
Meding, S. See Pallua, J.D.<br />
Meyer, Robert F. See Smith-Goettler,<br />
Brandye.<br />
Mikolajczyk, Liane. See Stephenson, Serena.<br />
Millar, Alan. See Yu, Kate.<br />
Misra, Anupam K.; Sharma, Shiv K.;<br />
Acosta, Tayro E.; and Bates, David E.<br />
Detection of Chemicals with Standoff<br />
Raman <strong>Spectroscopy</strong>. Defense and<br />
Homeland Security, April, p. 18.<br />
Miziolek, Andrzej. See Almirall, Jose.<br />
Mo, Yu Jun. See Zhang, Zhen Long.<br />
Moffat, Tony. See Assi, Sulaf.<br />
N<br />
Nam, Kwan H.; Isensee, Robert; Infantino,<br />
Gabe; Putyera, Karol; and Wang,<br />
Xinwei. Microwave-Induced Combustion<br />
for ICP-MS: A Generic Approach<br />
to Trace Elemental Analyses of Pharmaceutical<br />
Products. April, p. 36.<br />
Netzer, M. See Pallua, J.D.<br />
Neubauer, Kenneth; and Thompson,<br />
Laura. “Close Enough: The Value of<br />
Semiquantitative Analysis,” in Atomic<br />
Perspectives. May, p. 24.<br />
Nguyen, The-Quyen. See Mahadevan-<br />
Jansen, Anita.<br />
Nickolov, Zhorro S. See Ahmed, Selver.<br />
O<br />
Obenauf, R. See Atkins, P.<br />
Osborn, Tabetha; Burns, William A.;<br />
Green, Joshua; and Reeve, Scott W. An<br />
Optical Nose Approach to Explosive<br />
Detection: One Strategy for Optically<br />
Based Sensing. January, p. 34.<br />
Osl, M. See Pallua, J.D.<br />
P<br />
Pacheco-Londoño, Leonardo C. See<br />
Hernández-Rivera, Samuel P.<br />
Pallua, J.D.; Schaefer, G.; Bittner, L.K.; Pezzei,<br />
C.; Huck-Pezzei, V.; Schoenbichler,<br />
S.A.; Meding, S.; Rauser, S.; Walch, A.;<br />
Handler, M.; Netzer, M.; Osl, M.; Seger,<br />
M.; Pfeifer, B.; Baumgartner, C.; Lindner,<br />
H.; Kremser, L.; Sarg, B.; Klocker,<br />
H.; Bartsch, G.; Bonn, G.K.; and Huck,<br />
C.W. Matrix-Assisted Laser Desorption–Ionization<br />
Imaging Mass Spectrometry<br />
for Direct Tissue Analysis.<br />
Current Trends in Mass Spectrometry,<br />
October, p. 21.<br />
Patrick, Jeffrey S.; Siek, Kevin; Binkley,<br />
Joe; Artaev, Viatcheslav; and Mason,<br />
Michael. A New Path to High-Resolution<br />
HPLC–TOF-MS — Survey,<br />
Targeted, and Trace Analysis Applications<br />
of TOF-MS in the Analysis<br />
of Complex Biochemical Matrices.<br />
Current Trends in Mass Spectrometry,<br />
May, p. 18.<br />
Pellegrino, Paul M. See Ford, Alan R.<br />
Pezzei, C. See Pallua, J.D.<br />
Pfeifer, B. See Pallua, J.D.<br />
Pfeil, David. “Measurement Techniques<br />
for Mercury: Which Approach Is Right<br />
for You?” in Atomic Perspectives. September,<br />
p. 40.<br />
Phillips, Joseph X. See Smith-Goettler,<br />
Brandye.<br />
Pleasance, Steve. See Kay, Richard G.<br />
Pohl, Ken R. See Ford, Alan R.<br />
Prest, Harry. See Wells, Greg.<br />
Primera-Pedrozo, Oliva M. See Hernández-Rivera,<br />
Samuel P.<br />
Putyera, Karol. See Nam, Kwan H.<br />
R<br />
Rauser, S. See Pallua, J.D.<br />
Reeve, Scott W. See Osborn, Tabetha.<br />
Rey-Villamizar, Nicolas. See Hernández-<br />
Rivera, Samuel P.<br />
Rose, Jeremy B. See Ford, Alan R.<br />
Roy, Arindam; and Gorla, Srinivasa. Analytical<br />
Strategies in the Development<br />
of Generic Drug Products: The Role of<br />
Chromatography and Mass Spectrometry.<br />
Current Trends in Mass Spectrometry,<br />
October, p. 29.<br />
Russ IV, Charles William. See Wells, Greg.<br />
Ryan, Andrew; and Thomas, Robert. Ensuring<br />
the Safety and Quality of Foodstuffs<br />
Produced in China: The Role of<br />
ICP-MS. Applications of ICP & ICP-MS<br />
Techniques for Today’s Spectroscopists,<br />
November, p. 28.<br />
S<br />
Salhany, Joseph. See Kim, Youngjae.<br />
Sana, Theodore; Fischer, Steve; and Tichy,<br />
Shane E. Metabolomics Workflows:<br />
Combining Untargeted Discovery-<br />
Based and Targeted Confirmation<br />
Approaches for Mining Metabolomics<br />
Data. Current Trends in Mass<br />
Spectrometry, March, p. 12.<br />
Sanders, Melinda. See Mahadevan-Jansen,<br />
Anita.<br />
Sandra, Pat. See David, Frank.<br />
Sarg, B. See Pallua, J.D.<br />
Schaefer, G. See Pallua, J.D.<br />
Schmid, Lawrence S. The Demand for<br />
<strong>Spectroscopy</strong> Instrumentation Continues<br />
Unabated. August, p. 12.<br />
Schmid, Lawrence S. The <strong>Spectroscopy</strong><br />
Market Hits Its Stride. March, p. 36.<br />
Schoenbichler, S.A. See Pallua, J.D.<br />
Schug, Kevin. See Li, Li.<br />
Seale, Kevin T. See Enders, Jeffrey R.<br />
Seger, M. See Pallua, J.D.<br />
Serrano, Justin R. See Beechem, Thomas<br />
E.<br />
Sharma, Shiv K. See Gomer, Nathaniel R.<br />
Sharma, Shiv K. See Misra, Anupam K.<br />
Siek, Kevin. See Alonso, David E.<br />
Siek, Kevin. See Patrick, Jeffrey S.<br />
Smith-Goettler, Brandye; Gendron, Colleen<br />
M.; MacPhail, Neil; Meyer, Robert<br />
F.; and Phillips, Joseph X. NIR<br />
Monitoring of a Hot-Melt Extrusion
30 <strong>Spectroscopy</strong> 26(12) December 2011 www.spectroscopyonline.com<br />
Process. FT-IR Technology for Today’s<br />
Spectroscopists, August, p. 8.<br />
Smith, Wayne. See Donahue, Michael.<br />
Spencer, Jerald L. See Thomsen, Volker<br />
B.E.<br />
Spragg, Richard. Contact and Orientation<br />
Effects in FT-IR ATR Spectra. FT-IR<br />
Technology for Today’s Spectroscopists,<br />
August, p. 18.<br />
Stephenson, Serena; Dewald, Lamar;<br />
Baquero, Esteban; Flory, Wendy;<br />
Mikolajczyk, Liane; and Tate, J.D.<br />
Temporary Online FT-IR <strong>Spectroscopy</strong><br />
for Process Characterization in<br />
the Chemical Industry. December,<br />
p. 21.<br />
Strother, Todd. See Hirsch, Jeffrey.<br />
Switzer, Teresa; Herrmann, Otto; and Ilic,<br />
Darko. The Determination of 226 Ra in<br />
Nontypical Soil Samples by ICP-MS.<br />
Applications of ICP & ICP-MS Techniques<br />
for Today’s Spectroscopists, November,<br />
p. 6.<br />
T<br />
Tas, Albert. See Coulier, Leon.<br />
Tate, J.D. See Stephenson, Serena.<br />
Taylor, Adrian M.; and Jarvis, Michael J.Y.<br />
High-Throughput Quantitative Analysis<br />
of Vitamin D Using a Multiple Parallel<br />
LC–MS System Combined with Integrated<br />
On-Line SPE. Current Trends<br />
in Mass Spectrometry, May, p. 12.<br />
Thissen, Uwe. See Coulier, Leon.<br />
Thomas, R. See Atkins, P.<br />
Thomas, Robert. See Ryan, Andrew.<br />
Thompson, Laura. See Neubauer, Kenneth.<br />
Thomsen, Volker B.E.; and Spencer, Jerald<br />
L. “R&D Opportunities in Arc/Spark<br />
Optical Emission Spectrometry,” in<br />
Atomic Perspectives. July, p. 18.<br />
Thomsen, Volker. See Coutinho, Carlos<br />
Augusto.<br />
Thomson, Sandra A. See McGuire, Jeffrey<br />
M.<br />
Thorley, Fiona. See Matousek, Pavel.<br />
Tichy, Shane E. See Sana, Theodore.<br />
Tombling, Craig. See Matousek, Pavel.<br />
V<br />
Vargis, Elizabeth. See Mahadevan-Jansen,<br />
Anita.<br />
Vélez-Reyes, Miguel. See Hernández-<br />
Rivera, Samuel P.<br />
Veryovkin, Igor. See Zinovev, Alexander.<br />
Vunck, Darius M. See Ford, Alan R.<br />
W<br />
Walch, A. See Pallua, J.D.<br />
Wang, Xinwei. See Nam, Kwan H.<br />
Waterbury, Robert D. See Ford, Alan R.<br />
Watt, Robert. See Assi, Sulaf.<br />
Weesner, Forrest. See Lowry, Steve.<br />
Wells, Greg; Prest, Harry; and Russ IV,<br />
Charles William. Why Use Signal-<br />
To-Noise As a Measure of MS Performance<br />
When It Is Often Meaningless?<br />
Current Trends in Mass Spectrometry,<br />
May, p. 28.<br />
Wikswo, John P. See Enders, Jeffrey R.<br />
Wilbur, Steve. See Burrows, Richard.<br />
Witkowski, Mark. See Lanzarotta, Adam.<br />
Workman, Jr., Jerome. See Mark, Howard.<br />
Wu, Di. See Chen, Xiaojing.<br />
Wunder, Stephanie L. See Ahmed, Selver.<br />
Y<br />
Yang, Li. See Yu, Xiao-Ying.<br />
Yu, HeShui. See Yu, Kate.<br />
Yu, Kate; Ma, Baiping; Yu, HeShui; Kang,<br />
Liping; Zhang, Jie; Gao, Yue; and Millar,<br />
Alan. Comparison of Extracts<br />
from Dry and Alcohol-Steamed Root<br />
of Polygonatum kingianum (Huang<br />
Jing) by Sub-2-µm-LC–TOF-MS.<br />
Current Trends in Mass Spectrometry,<br />
March, p. 30.<br />
Yu, Xiao-Ying; Yang, Li; Zhu, Zihua;<br />
Cowin, James P.; and Iedema, Martin<br />
J. Probing Aqueous Surfaces by TOF-<br />
SIMS. Current Trends in Mass Spectrometry,<br />
October, p. 34.<br />
Z<br />
Zhang, Guangjun. See Zhang, Qianxuan.<br />
Zhang, Jie. See Yu, Kate.<br />
Zhang, Qianxuan; Li, Qingbo; and<br />
Zhang, Guangjun. Scattering Impact<br />
Analysis and Correction for<br />
Leaf Biochemical Parameter Estimation<br />
Using Vis-NIR <strong>Spectroscopy</strong>.<br />
July, p. 28.<br />
Zhang, Zhen Long; Chang, Da Hu; and<br />
Mo, Yu Jun. The pH Dependence of<br />
the SERS Spectra of Methyl Yellow in<br />
Silver Colloid. June, p. 38.<br />
Zhou, Ming. See Carson, William W.<br />
Zhu, Zihua. See Yu, Xiao-Ying.<br />
Zinovev, Alexander; and Veryovkin, Igor.<br />
Mass Spectrometry of Organic Molecules<br />
and Laser-Induced Acoustic Desorption:<br />
Applications, Mechanisms,<br />
and Perspectives. Current Trends in<br />
Mass Spectrometry, July, p. 24.<br />
SUBJECTS<br />
ATOMIC EMISSION SPECTROSCOPY<br />
“Close Enough: The Value of Semiquantitative<br />
Analysis,” in Atomic Perspectives.<br />
Kenneth Neubauer and Laura<br />
Thompson. May, p. 24.<br />
“R&D Opportunities in Arc/Spark Optical<br />
Emission Spectrometry,” in<br />
Atomic Perspectives. Volker B.E.<br />
Thomsen and Jerald L. Spencer.<br />
July, p. 18.<br />
Spectrometers for Elemental Spectrochemical<br />
Analysis, Part IV: Inductively<br />
Coupled Plasma Optical Emission<br />
Spectrometers. Carlos Augusto<br />
Coutinho and Volker Thomsen. September,<br />
p. 44.<br />
“Using ICP-MS and ICP-OES to Measure<br />
Trace Elemental Impurities in<br />
Pharmaceuticals in Compliance with<br />
Proposed Pharmacopeia Chapters,” in<br />
Atomic Perspectives. Matthew Cassup.<br />
March, p. 26.<br />
ATOMIC PERSPECTIVES COLUMN<br />
“Analysis of Flue Gas Desulfurization<br />
Wastewaters by ICP-MS,” in Atomic<br />
Perspectives. Richard Burrows, Steve<br />
Wilbur, and Richard Clinkscales. November,<br />
p. 30.<br />
“Close Enough: The Value of Semiquantitative<br />
Analysis,” in Atomic Perspectives.<br />
Kenneth Neubauer and Laura<br />
Thompson. May, p. 24.<br />
“Measurement Techniques for Mercury:<br />
Which Approach Is Right for You?”<br />
in Atomic Perspectives. David Pfeil.<br />
September, p. 40.<br />
“R&D Opportunities in Arc/Spark Optical<br />
Emission Spectrometry,” in Atomic<br />
Perspectives. Volker B.E. Thomsen<br />
and Jerald L. Spencer. July, p. 18.<br />
“Using ICP-MS and ICP-OES to Measure<br />
Trace Elemental Impurities in Pharmaceuticals<br />
in Compliance with Proposed<br />
Pharmacopeia Chapters,” in Atomic<br />
Perspectives. Matthew Cassup. March,<br />
p. 26.<br />
ATOMIC SPECTROSCOPY<br />
“Analysis of Flue Gas Desulfurization<br />
Wastewaters by ICP-MS,” in Atomic<br />
Perspectives. Richard Burrows, Steve<br />
Wilbur, and Richard Clinkscales. November,<br />
p. 30.<br />
Analysis of Toxic Trace Metals in Pet
www.spectroscopyonline.com<br />
December 2011 <strong>Spectroscopy</strong> 26(12) 31<br />
Foods Using Cryogenic Grinding and<br />
Quantitation by ICP-MS, Part I. P. Atkins,<br />
L. Ernyei, W. Driscoll, R. Obenauf,<br />
and R. Thomas. January, p. 46.<br />
Analysis of Toxic Trace Metals in Pet<br />
Foods Using Cryogenic Grinding and<br />
Quantitation by ICP-MS, Part II. P.<br />
Atkins, L. Ernyei, W. Driscoll, R. Obenauf,<br />
and R. Thomas. February, p. 42.<br />
“Close Enough: The Value of Semiquantitative<br />
Analysis,” in Atomic Perspectives.<br />
Kenneth Neubauer and Laura<br />
Thompson. May, p. 24.<br />
The Dynamic World of X-ray Fluorescence.<br />
Laura Bush. July, p. 40.<br />
“LIBS in Forensics,” in Lasers and Optics<br />
Interface. Laura Bush. April, p. 34.<br />
“Measurement Techniques for Mercury:<br />
Which Approach Is Right for You?”<br />
in Atomic Perspectives. David Pfeil.<br />
September, p. 40.<br />
Microwave-Induced Combustion for ICP-<br />
MS: A Generic Approach to Trace Elemental<br />
Analyses of Pharmaceutical<br />
Products. Kwan H. Nam, Robert Isensee,<br />
Gabe Infantino, Karol Putyera,<br />
and Xinwei Wang. April, p. 36.<br />
“R&D Opportunities in Arc/Spark Optical<br />
Emission Spectrometry,” in Atomic<br />
Perspectives. Volker B.E. Thomsen<br />
and Jerald L. Spencer. July, p. 18.<br />
Spectrometers for Elemental Spectrochemical<br />
Analysis, Part IV: Inductively<br />
Coupled Plasma Optical Emission<br />
Spectrometers. Carlos Augusto<br />
Coutinho and Volker Thomsen. September,<br />
p. 44.<br />
“Using ICP-MS and ICP-OES to Measure<br />
Trace Elemental Impurities in<br />
Pharmaceuticals in Compliance with<br />
Proposed Pharmacopeia Chapters,” in<br />
Atomic Perspectives. Matthew Cassup.<br />
March, p. 26.<br />
BASELINE COLUMN<br />
“Little Points of Light,” in The Baseline.<br />
David W. Ball. January, p. 20.<br />
“Maxwell’s Equations, Part I: History,” in<br />
The Baseline. David W. Ball. April, p.<br />
16.<br />
“Maxwell’s Equations, Part II,” in The<br />
Baseline. David W. Ball. June, p. 14.<br />
“Maxwell’s Equations, Part III,” in The Baseline.<br />
David W. Ball. September, p. 18.<br />
“Maxwell’s Equations, Part IV,” in The<br />
Baseline. David W. Ball. December,<br />
p. 10.<br />
BIOLOGICAL AND MEDICAL<br />
ANALYSIS<br />
Optimizing FT-IR Sampling for a Method<br />
to Determine the Chemical Composition<br />
of Microbial Materials. Steve<br />
Lowry. June, p. 30.<br />
Scattering Impact Analysis and Correction<br />
for Leaf Biochemical Parameter<br />
Estimation Using Vis-NIR <strong>Spectroscopy</strong>.<br />
Qianxuan Zhang, Qingbo Li,<br />
and Guangjun Zhang. July, p. 28.<br />
CHEMOMETRICS IN<br />
SPECTROSCOPY COLUMN<br />
“Classical Least Squares, Part IV: Spectroscopic<br />
Theory Continued,” in Chemometrics<br />
in <strong>Spectroscopy</strong>. Howard<br />
Mark and Jerome Workman, Jr. February,<br />
p. 26.<br />
“Classical Least Squares, Part V: Experimental<br />
Results,” in Chemometrics in<br />
<strong>Spectroscopy</strong>. Howard Mark and Jerome<br />
Workman, Jr. May, p. 12.<br />
“Classical Least Squares, Part VI: Spectral<br />
Results,” in Chemometrics in <strong>Spectroscopy</strong>.<br />
Howard Mark and Jerome<br />
Workman, Jr. June, p. 22.<br />
“Classical Least Squares, Part VII: Spectral<br />
Reconstruction of Mixtures,”<br />
in Chemometrics in <strong>Spectroscopy</strong>.<br />
Howard Mark and Jerome Workman,<br />
Jr. October, p. 24.<br />
CHEMOMETRICS<br />
“Classical Least Squares, Part IV: Spectroscopic<br />
Theory Continued,” in Chemometrics<br />
in <strong>Spectroscopy</strong>. Howard<br />
Mark and Jerome Workman, Jr. February,<br />
p. 26.<br />
“Classical Least Squares, Part V: Experimental<br />
Results,” in Chemometrics in<br />
<strong>Spectroscopy</strong>. Howard Mark and Jerome<br />
Workman, Jr. May, p. 12.<br />
“Classical Least Squares, Part VI: Spectral<br />
Results,” in Chemometrics in <strong>Spectroscopy</strong>.<br />
Howard Mark and Jerome<br />
Workman, Jr. June, p. 22.<br />
“Classical Least Squares, Part VII: Spectral<br />
Reconstruction of Mixtures,”<br />
in Chemometrics in <strong>Spectroscopy</strong>.<br />
Howard Mark and Jerome Workman,<br />
Jr. October, p. 24.<br />
An Integration of Modified Uninformative<br />
Variable Elimination and Wavelet<br />
Packet Transform for Variable Selection.<br />
Xiaojing Chen, Di Wu, and Yong<br />
He. April, p. 42.<br />
ENVIRONMENTAL ANALYSIS<br />
“Analysis of Flue Gas Desulfurization<br />
Wastewaters by ICP-MS,” in Atomic<br />
Perspectives. Richard Burrows, Steve<br />
Wilbur, and Richard Clinkscales. November,<br />
p. 30.<br />
“Underwater Mass Spectrometry,” in<br />
Mass Spectrometry Forum. Kenneth<br />
L. Busch. January, p. 30.<br />
EXPLOSIVES<br />
An Optical Nose Approach to Explosive<br />
Detection: One Strategy for Optically<br />
Based Sensing. Tabetha Osborn, William<br />
A. Burns, Joshua Green, and Scott<br />
W. Reeve. January, p. 34.<br />
FOCUS ON QUALITY COLUMN<br />
“Is GMP Annex 11 Europe’s Answer to<br />
21 CFR 11?” in Focus on Quality. R.D.<br />
McDowall. April, p. 24.<br />
“Periodic Reviews of Computerized Systems,<br />
Part I,” in Focus on Quality. R.D.<br />
McDowall. September, p. 28.<br />
“Periodic Reviews of Computerized Systems,<br />
Part II,” in Focus on Quality.<br />
R.D. McDowall. November, p. 20.<br />
“USP and the GAMP Guide on<br />
Laboratory Computerized Systems —<br />
Is Integration Possible?” in Focus on<br />
Quality. R.D. McDowall and Chris<br />
Burgess. December, p. 14.<br />
FOOD AND BEVERAGE ANALYSIS<br />
Analysis of Toxic Trace Metals in Pet<br />
Foods Using Cryogenic Grinding and<br />
Quantitation by ICP-MS, Part I. P. Atkins,<br />
L. Ernyei, W. Driscoll, R. Obenauf,<br />
and R. Thomas. January, p. 46.<br />
Analysis of Toxic Trace Metals in Pet<br />
Foods Using Cryogenic Grinding<br />
and Quantitation by ICP-MS, Part II.<br />
P. Atkins, L. Ernyei, W. Driscoll, R.<br />
Obenauf, and R. Thomas. February,<br />
p. 42.<br />
FORENSIC APPLICATIONS<br />
ICP-MS for Forensic Applications. Laura<br />
Bush. October, p. 57.<br />
“LIBS in Forensics,” in Lasers and Optics<br />
Interface. Laura Bush. April, p. 34.<br />
FUELS<br />
Optimizing FT-IR Sampling for a Method<br />
to Determine the Chemical Composition<br />
of Microbial Materials. Steve<br />
Lowry. June, p. 30.
32 <strong>Spectroscopy</strong> 26(12) December 2011 www.spectroscopyonline.com<br />
HISTORY<br />
“Maxwell’s Equations, Part I: History,” in<br />
The Baseline. David W. Ball. April, p. 16.<br />
ICP AND ICP-MS<br />
“Analysis of Flue Gas Desulfurization<br />
Wastewaters by ICP-MS,” in Atomic<br />
Perspectives. Richard Burrows, Steve<br />
Wilbur, and Richard Clinkscales. November,<br />
p. 30.<br />
Analysis of Toxic Trace Metals in Pet<br />
Foods Using Cryogenic Grinding and<br />
Quantitation by ICP-MS, Part I. P. Atkins,<br />
L. Ernyei, W. Driscoll, R. Obenauf,<br />
and R. Thomas. January, p. 46.<br />
Analysis of Toxic Trace Metals in Pet<br />
Foods Using Cryogenic Grinding<br />
and Quantitation by ICP-MS, Part II.<br />
P. Atkins, L. Ernyei, W. Driscoll, R.<br />
Obenauf, and R. Thomas. February,<br />
p. 42.<br />
“Close Enough: The Value of Semiquantitative<br />
Analysis,” in Atomic Perspectives.<br />
Kenneth Neubauer and Laura<br />
Thompson. May, p. 24.<br />
ICP-MS for Forensic Applications. Laura<br />
Bush. October, p. 57.<br />
Microwave-Induced Combustion for ICP-<br />
MS: A Generic Approach to Trace Elemental<br />
Analyses of Pharmaceutical<br />
Products. Kwan H. Nam, Robert Isensee,<br />
Gabe Infantino, Karol Putyera,<br />
and Xinwei Wang. April, p. 36.<br />
Spectrometers for Elemental Spectrochemical<br />
Analysis, Part IV: Inductively<br />
Coupled Plasma Optical Emission<br />
Spectrometers. Carlos Augusto<br />
Coutinho and Volker Thomsen. September,<br />
p. 44.<br />
“Using ICP-MS and ICP-OES to Measure<br />
Trace Elemental Impurities in<br />
Pharmaceuticals in Compliance with<br />
Proposed Pharmacopeia Chapters,” in<br />
Atomic Perspectives. Matthew Cassup.<br />
March, p. 26.<br />
IMAGING AND MICROSCOPY<br />
A Targeted Approach to Detect Controlled<br />
Substances in Suspect Tablets Using Attenuated<br />
Total Internal Reflection Fourier-Transform<br />
Infrared Spectroscopic<br />
Imaging. Adam Lanzarotta, Samuel<br />
Gratz, Thomas Brueggemeyer, and<br />
Mark Witkowski. February, p. 34.<br />
INFRARED SPECTROSCOPY<br />
“Analytical Vibrational <strong>Spectroscopy</strong> —<br />
NIR, IR, and Raman,” in Molecular<br />
<strong>Spectroscopy</strong> Workbench. Fran Adar.<br />
October, p. 14.<br />
An Optical Nose Approach to Explosive<br />
Detection: One Strategy for Optically<br />
Based Sensing. Tabetha Osborn, William<br />
A. Burns, Joshua Green, and Scott<br />
W. Reeve. January, p. 34.<br />
Developing a Career in FT-IR. Megan<br />
Evans. April, p. 58.<br />
Optimizing FT-IR Sampling for a Method<br />
to Determine the Chemical Composition<br />
of Microbial Materials. Steve<br />
Lowry. June, p. 30.<br />
Scattering Impact Analysis and Correction<br />
for Leaf Biochemical Parameter<br />
Estimation Using Vis-NIR <strong>Spectroscopy</strong>.<br />
Qianxuan Zhang, Qingbo Li,<br />
and Guangjun Zhang. July, p. 28.<br />
A Targeted Approach to Detect Controlled<br />
Substances in Suspect Tablets<br />
Using Attenuated Total Internal Reflection<br />
Fourier-Transform Infrared<br />
Spectroscopic Imaging. Adam<br />
Lanzarotta, Samuel Gratz, Thomas<br />
Brueggemeyer, and Mark Witkowski.<br />
February, p. 34.<br />
Temporary Online FT-IR <strong>Spectroscopy</strong><br />
for Process Characterization in<br />
the Chemical Industry. Serena Stephenson,<br />
Lamar Dewald, Esteban<br />
Baquero, Wendy Flory, Liane Mikolajczyk,<br />
and J.D. Tate. December,<br />
p. 21.<br />
INTERVIEWS<br />
Developing a Career in FT-IR. Megan<br />
Evans. April, p. 58.<br />
ICP-MS for Forensic Applications. Laura<br />
Bush. October, p. 57.<br />
LASERS AND OPTICS INTERFACE<br />
COLUMN<br />
“The Importance of Tight Laser Power<br />
Control When Working with Carbon<br />
Nanomaterials,” in Lasers and Optics<br />
Interface. Joe Hodkiewicz. July, p. 22.<br />
“LIBS in Forensics,” in Lasers and Optics<br />
Interface. Laura Bush. April,<br />
p. 34.<br />
“Multiphoton <strong>Spectroscopy</strong>,” in Lasers<br />
and Optics Interface. Youngjae Kim<br />
and Joseph Salhany. January, p. 24.<br />
LASERS<br />
ICP-MS for Forensic Applications. Laura<br />
Bush. October, p. 57.<br />
“The Importance of Tight Laser Power<br />
Control When Working with Carbon<br />
Nanomaterials,” in Lasers and Optics<br />
Interface. Joe Hodkiewicz. July, p. 22.<br />
“LIBS in Forensics,” in Lasers and Optics<br />
Interface. Laura Bush. April, p. 34.<br />
“Multiphoton <strong>Spectroscopy</strong>,” in Lasers<br />
and Optics Interface. Youngjae Kim<br />
and Joseph Salhany. January, p. 24.<br />
Review of the Third North American<br />
Symposium on Laser-Induced Breakdown<br />
<strong>Spectroscopy</strong> (NASLIBS) 2011<br />
Conference. Jose Almirall and Andrzej<br />
Miziolek. October, p. 48.<br />
LIBS<br />
ICP-MS for Forensic Applications. Laura<br />
Bush. October, p. 57.<br />
“LIBS in Forensics,” in Lasers and Optics<br />
Interface. Laura Bush. April, p. 34.<br />
Review of the Third North American<br />
Symposium on Laser-Induced Breakdown<br />
<strong>Spectroscopy</strong> (NASLIBS) 2011<br />
Conference. Jose Almirall and Andrzej<br />
Miziolek. October, p. 48.<br />
MARKET ANALYSIS<br />
The Demand for <strong>Spectroscopy</strong> Instrumentation<br />
Continues Unabated. Lawrence<br />
S. Schmid. August, p. 12.<br />
The <strong>Spectroscopy</strong> Market Hits Its Stride.<br />
Lawrence S. Schmid. March, p. 36.<br />
2011 Salary Survey: The Upside of Science.<br />
Megan Evans. March, p. 30.<br />
MASS SPECTROMETRY FORUM<br />
COLUMN<br />
“Consequences of Finite Ion Lifetimes in<br />
Mass Spectrometry,” in Mass Spectrometry<br />
Forum. Kenneth L. Busch.<br />
September, p. 12.<br />
“Detecting Ions in Mass Spectrometers<br />
with the Faraday Cup,” in Mass Spectrometry<br />
Forum. Kenneth L. Busch.<br />
November, p. 12.<br />
“Hybrid Mass Spectrometers,” in Mass<br />
Spectrometry Forum. Kenneth L.<br />
Busch. March, p. 16.<br />
“Mass Spectrometry for First Responders,”<br />
in Mass Spectrometry Forum.<br />
Kenneth L. Busch. July, p. 12.<br />
“Underwater Mass Spectrometry,” in<br />
Mass Spectrometry Forum. Kenneth<br />
L. Busch. January, p. 30.<br />
MASS SPECTROMETRY<br />
Analysis of Toxic Trace Metals in Pet
www.spectroscopyonline.com<br />
December 2011 <strong>Spectroscopy</strong> 26(12) 33<br />
Foods Using Cryogenic Grinding<br />
and Quantitation by ICP-MS, Part<br />
I. P. Atkins, L. Ernyei, W. Driscoll,<br />
R. Obenauf, and R. Thomas. January,<br />
p. 46.<br />
Analysis of Toxic Trace Metals in Pet<br />
Foods Using Cryogenic Grinding<br />
and Quantitation by ICP-MS, Part<br />
II. P. Atkins, L. Ernyei, W. Driscoll,<br />
R. Obenauf, and R. Thomas. February,<br />
p. 42.<br />
“Close Enough: The Value of Semiquantitative<br />
Analysis,” in Atomic<br />
Perspectives. Kenneth Neubauer<br />
and Laura Thompson. May, p. 24.<br />
“Consequences of Finite Ion Lifetimes<br />
in Mass Spectrometry,” in Mass<br />
Spectrometry Forum. Kenneth L.<br />
Busch. September, p. 12.<br />
“Detecting Ions in Mass Spectrometers<br />
with the Faraday Cup,” in Mass<br />
Spectrometry Forum. Kenneth L.<br />
Busch. November, p. 12.<br />
“Hybrid Mass Spectrometers,” in Mass<br />
Spectrometry Forum. Kenneth L.<br />
Busch. March, p. 16.<br />
“Mass Spectrometry for First Responders,”<br />
in Mass Spectrometry Forum.<br />
Kenneth L. Busch. July, p. 12.<br />
The Nature and Utility of Mass Spectra.<br />
Michael Balogh. February, p. 60.<br />
A Targeted Approach to Detect Controlled<br />
Substances in Suspect Tablets<br />
Using Attenuated Total Internal<br />
Reflection Fourier-Transform<br />
Infrared Spectroscopic Imaging.<br />
Adam Lanzarotta, Samuel Gratz,<br />
Thomas Brueggemeyer, and Mark<br />
Witkowski. February, p. 34.<br />
“Underwater Mass Spectrometry,” in<br />
Mass Spectrometry Forum. Kenneth<br />
L. Busch. January, p. 30.<br />
“Using ICP-MS and ICP-OES to Measure<br />
Trace Elemental Impurities<br />
in Pharmaceuticals in Compliance<br />
with Proposed Pharmacopeia Chapters,”<br />
in Atomic Perspectives. Matthew<br />
Cassup. March, p. 26.<br />
MEETING REPORTS<br />
Pittcon 2011 New Product Review. Howard<br />
Mark. May, p. 32.<br />
Review of the Third North American<br />
Symposium on Laser-Induced Breakdown<br />
<strong>Spectroscopy</strong> (NASLIBS) 2011<br />
Conference. Jose Almirall and Andrzej<br />
Miziolek. October, p. 48.<br />
MOLECULAR SPECTROSCOPY<br />
WORKBENCH COLUMN<br />
“Analytical Vibrational <strong>Spectroscopy</strong> —<br />
NIR, IR, and Raman,” in Molecular<br />
<strong>Spectroscopy</strong> Workbench. Fran Adar.<br />
October, p. 14.<br />
“Entering Raman’s Realm,” in Molecular<br />
<strong>Spectroscopy</strong> Workbench. Fran Adar.<br />
March, p. 22.<br />
“Graphene: Why the Nobel Prize and<br />
Why Raman?” in Molecular <strong>Spectroscopy</strong><br />
Workbench. Fran Adar. February,<br />
p. 16.<br />
NEAR-IR SPECTROSCOPY<br />
“Analytical Vibrational <strong>Spectroscopy</strong> —<br />
NIR, IR, and Raman,” in Molecular<br />
<strong>Spectroscopy</strong> Workbench. Fran Adar.<br />
October, p. 14.<br />
“Classical Least Squares, Part V: Experimental<br />
Results,” in Chemometrics in<br />
<strong>Spectroscopy</strong>. Howard Mark and Jerome<br />
Workman, Jr. May, p. 12.<br />
“Classical Least Squares, Part VI: Spectral<br />
Results,” in Chemometrics in <strong>Spectroscopy</strong>.<br />
Howard Mark and Jerome<br />
Workman, Jr. June, p. 22.<br />
“Classical Least Squares, Part VII: Spectral<br />
Reconstruction of Mixtures,”<br />
in Chemometrics in <strong>Spectroscopy</strong>.<br />
Howard Mark and Jerome Workman,<br />
Jr. October, p. 24.<br />
Developing a Career in FT-IR. Megan<br />
Evans. April, p. 58.<br />
An Integration of Modified Uninformative<br />
Variable Elimination and Wavelet<br />
Packet Transform for Variable Selection.<br />
Xiaojing Chen, Di Wu, and Yong<br />
He. April, p. 42.<br />
Scattering Impact Analysis and Correction<br />
for Leaf Biochemical Parameter<br />
Estimation Using Vis-NIR <strong>Spectroscopy</strong>.<br />
Qianxuan Zhang, Qingbo Li,<br />
and Guangjun Zhang. July, p. 28.<br />
OPTICS<br />
An Optical Nose Approach to Explosive<br />
Detection: One Strategy for Optically<br />
Based Sensing. Tabetha Osborn, William<br />
A. Burns, Joshua Green, and Scott<br />
W. Reeve. January, p. 34.<br />
PHARMACEUTICAL APPLICATIONS<br />
Emerging Raman Techniques for Rapid<br />
Noninvasive Characterization of Pharmaceutical<br />
Samples and Containers.<br />
Pavel Matousek, Fiona Thorley, Ping<br />
Chen, Michael Hargreaves, Craig<br />
Tombling, Paul Loeffen, Matthew<br />
Bloomfield, and Darren Andrews.<br />
March, p. 44.<br />
“Is GMP Annex 11 Europe’s Answer to<br />
21 CFR 11?” in Focus on Quality. R.D.<br />
McDowall. April, p. 24.<br />
Microwave-Induced Combustion for ICP-<br />
MS: A Generic Approach to Trace Elemental<br />
Analyses of Pharmaceutical<br />
Products. Kwan H. Nam, Robert Isensee,<br />
Gabe Infantino, Karol Putyera,<br />
and Xinwei Wang. April, p. 36.<br />
A Targeted Approach to Detect Controlled<br />
Substances in Suspect Tablets<br />
Using Attenuated Total Internal Reflection<br />
Fourier-Transform Infrared<br />
Spectroscopic Imaging. Adam<br />
Lanzarotta, Samuel Gratz, Thomas<br />
Brueggemeyer, and Mark Witkowski.<br />
February, p. 34.<br />
“Using ICP-MS and ICP-OES to Measure<br />
Trace Elemental Impurities in<br />
Pharmaceuticals in Compliance with<br />
Proposed Pharmacopeia Chapters,” in<br />
Atomic Perspectives. Matthew Cassup.<br />
March, p. 26.<br />
“USP and the GAMP Guide on<br />
Laboratory Computerized Systems —<br />
Is Integration Possible?” in Focus on<br />
Quality. R.D. McDowall and Chris<br />
Burgess. December, p. 14.<br />
PROCESS CONTROL AND ANALYSIS<br />
Temporary Online FT-IR <strong>Spectroscopy</strong><br />
for Process Characterization in<br />
the Chemical Industry. Serena Stephenson,<br />
Lamar Dewald, Esteban<br />
Baquero, Wendy Flory, Liane Mikolajczyk,<br />
and J.D. Tate. December,<br />
p. 21.<br />
RAMAN SPECTROSCOPY<br />
“Analytical Vibrational <strong>Spectroscopy</strong> —<br />
NIR, IR, and Raman,” in Molecular<br />
<strong>Spectroscopy</strong> Workbench. Fran Adar.<br />
October, p. 14.<br />
Application of Raman <strong>Spectroscopy</strong> to<br />
Lubricants, Lubricated Surfaces, and<br />
Lubrication Phenomena. David W.<br />
Johnson. July, p. 46.<br />
Emerging Raman Techniques for Rapid<br />
Noninvasive Characterization of Pharmaceutical<br />
Samples and Containers.<br />
Pavel Matousek, Fiona Thorley, Ping<br />
Chen, Michael Hargreaves, Craig<br />
Tombling, Paul Loeffen, Matthew
34 <strong>Spectroscopy</strong> 26(12) December 2011 www.spectroscopyonline.com<br />
Bloomfield, and Darren Andrews.<br />
March, p. 44.<br />
“Entering Raman’s Realm,” in Molecular<br />
<strong>Spectroscopy</strong> Workbench. Fran Adar.<br />
March, p. 22.<br />
“Graphene: Why the Nobel Prize and<br />
Why Raman?” in Molecular <strong>Spectroscopy</strong><br />
Workbench. Fran Adar. February,<br />
p. 16.<br />
Improved Principal Component Discrimination<br />
of Commercial Inks Using<br />
Surface-Enhanced Resonant Raman<br />
Scattering. Jeffrey Hirsch, Timothy O.<br />
Deschaines, and Todd Strother. October,<br />
p. 32.<br />
“Multiphoton <strong>Spectroscopy</strong>,” in Lasers<br />
and Optics Interface. Youngjae Kim<br />
and Joseph Salhany. January, p. 24.<br />
The pH Dependence of the SERS Spectra<br />
of Methyl Yellow in Silver Colloid.<br />
Zhen Long Zhang, Da Hu Chang, and<br />
Yu Jun Mo. June, p. 38.<br />
Raman <strong>Spectroscopy</strong> of Carbonaceous<br />
Materials: A Concise Review. Dorina<br />
Magdalena Chipara, Alin Cristian<br />
Chipara, and Mircea Chipara. October,<br />
p. 42.<br />
Raman Thermometry of Microdevices:<br />
Choosing a Method to Minimize<br />
Error. Thomas E. Beechem, and Justin<br />
R. Serrano. November, p. 36.<br />
REGULATORY ISSUES<br />
“Is GMP Annex 11 Europe’s Answer to<br />
21 CFR 11?” in Focus on Quality. R.D.<br />
McDowall. April, p. 24.<br />
“Periodic Reviews of Computerized Systems,<br />
Part I,” in Focus on Quality. R.D.<br />
McDowall. September, p. 28.<br />
“Periodic Reviews of Computerized Systems,<br />
Part II,” in Focus on Quality.<br />
R.D. McDowall. November, p. 20.<br />
“USP and the GAMP Guide on<br />
Laboratory Computerized Systems —<br />
Is Integration Possible?” in Focus on<br />
Quality. R.D. McDowall and Chris<br />
Burgess. December, p. 14.<br />
SAMPLE PREPARATION AND<br />
INTRODUCTION<br />
Analysis of Toxic Trace Metals in Pet<br />
Foods Using Cryogenic Grinding and<br />
Quantitation by ICP-MS, Part I. P. Atkins,<br />
L. Ernyei, W. Driscoll, R. Obenauf,<br />
and R. Thomas. January, p. 46.<br />
Analysis of Toxic Trace Metals in Pet<br />
Foods Using Cryogenic Grinding<br />
and Quantitation by ICP-MS, Part II.<br />
P. Atkins, L. Ernyei, W. Driscoll, R.<br />
Obenauf, and R. Thomas. February,<br />
p. 42.<br />
Microwave-Induced Combustion for ICP-<br />
MS: A Generic Approach to Trace Elemental<br />
Analyses of Pharmaceutical<br />
Products. Kwan H. Nam, Robert Infantino<br />
, Gabe Isensee, Karol Putyera,<br />
and Xinwei Wang. April, p. 36.<br />
SPECTROSCOPIC THEORY<br />
“Classical Least Squares, Part IV: Spectroscopic<br />
Theory Continued,” in Chemometrics<br />
in <strong>Spectroscopy</strong>. Howard<br />
Mark and Jerome Workman, Jr. February,<br />
p. 26.<br />
“Little Points of Light,” in The Baseline.<br />
David W. Ball. January, p. 20.<br />
“Maxwell’s Equations, Part I: History,” in<br />
The Baseline. David W. Ball. April, p.<br />
16.<br />
“Maxwell’s Equations, Part II,” in The<br />
Baseline. David W. Ball. June, p. 14.<br />
“Maxwell’s Equations, Part III,” in The<br />
Baseline. David W. Ball. September,<br />
p. 18.<br />
“Maxwell’s Equations, Part IV,” in The<br />
Baseline. David W. Ball. December,<br />
p. 10.<br />
Raman <strong>Spectroscopy</strong> of Carbonaceous<br />
Materials: A Concise Review. Dorina<br />
Magdalena Chipara, Alin Cristian<br />
Chipara, and Mircea Chipara. October,<br />
p. 42.<br />
SUPPLEMENT: APPLICATIONS OF<br />
ICP & ICP-MS TECHNIQUES FOR<br />
TODAY’S SPECTROSCOPISTS<br />
The Determination of 226 Ra in Nontypical<br />
Soil Samples by ICP-MS. Teresa Switzer,<br />
Otto Herrmann, and Darko Ilic.<br />
November, p. 6.<br />
Ensuring the Safety and Quality of Foodstuffs<br />
Produced in China: The Role of<br />
ICP-MS. Andrew Ryan and Robert<br />
Thomas. November, p. 28.<br />
Overcoming the Challenges Associated<br />
with the Direct Analysis of Trace Metals<br />
in Seawater Using ICP-MS. Shona<br />
McSheehy-Ducos. November, p. 22.<br />
Validating ICP-MS for the Analysis of<br />
Elemental Impurities According to<br />
Draft USP General Chapters <br />
and . Samina Hussain, Amir<br />
Liba, and Ed McCurdy. November,<br />
p. 14.<br />
SUPPLEMENT: CURRENT TRENDS<br />
IN MASS SPECTROMETRY<br />
Advanced Structural Mass Spectrometry<br />
for Systems Biology: Pulling the<br />
Needles from Haystacks. Jeffrey R.<br />
Enders, Cody R. Goodwin, Christina<br />
C. Marasco, Kevin T. Seale, John P.<br />
Wikswo, and John A. McLean. July,<br />
p. 18.<br />
Analytical Strategies in the Development<br />
of Generic Drug Products: The Role<br />
of Chromatography and Mass Spectrometry.<br />
Arindam Roy and Srinivasa<br />
Gorla. October, p. 29.<br />
Comparison of Extracts from Dry and<br />
Alcohol-Steamed Root of Polygonatum<br />
kingianum (Huang Jing) by<br />
Sub-2-µm-LC–TOF-MS. Kate Yu,<br />
Baiping Ma, HeShui Yu, Liping Kang,<br />
Jie Zhang, Yue Gao, and Alan Millar.<br />
March, p. 30.<br />
Comprehensive Analysis of Persistent Organic<br />
Pollutants in Complex Matrices<br />
Using GC with High-Performance<br />
TOF-MS. David E. Alonso, Joe Binkley,<br />
and Kevin Siek. July, p. 48.<br />
Creating a High-Throughput LC–MS-MS<br />
System Using Common Components.<br />
Lance Heinle and Gary Jenkins. October,<br />
p. 16.<br />
Determining High-Molecular-Weight<br />
Phthalates in Sediments Using GC–<br />
APCI-TOF-MS. Frank David, Pat Sandra,<br />
and Peter Hancock. May, p. 42.<br />
Food Metabolomics: Fact or Fiction? Leon<br />
Coulier, Albert Tas, and Uwe Thissen.<br />
May, p. 34.<br />
High-Definition Screening for Boar Taint<br />
in Fatback Samples Using GC–MS.<br />
Torsten Haas, Peter Boeker, Alun Cole,<br />
and Gerhard Horner. July, p. 38.<br />
High-Throughput Quantitative Analysis<br />
of Vitamin D Using a Multiple Parallel<br />
LC–MS System Combined with Integrated<br />
On-Line SPE. Adrian M. Taylor<br />
and Michael J.Y. Jarvis. May, p. 12.<br />
25-Hydroxyvitamin D 2<br />
/D 3<br />
Analysis in<br />
Human Plasma Using LC–MS. Phil<br />
Koerner and Michael McGinley.<br />
March, p. 8.<br />
Imaging Mass Spectrometry: Current<br />
Performance and Upcoming Challenges.<br />
Pierre Chaurand. July, p. 30.<br />
Mass Spectrometry Advances Fossilomics.<br />
John M. Asara. March, p. 18.<br />
Mass Spectrometry in Analytical Lipidomics.<br />
Luis Cuadros-Rodriguez,
www.spectroscopyonline.com<br />
December 2011 <strong>Spectroscopy</strong> 26(12) 35<br />
Alegria Carrasco-Pancorbo, and<br />
Natalia Navas Iglesias. July, p. 8.<br />
Mass Spectrometry of Organic Molecules<br />
and Laser-Induced Acoustic<br />
Desorption: Applications, Mechanisms,<br />
and Perspectives. Alexander<br />
Zinovev and Igor Veryovkin. July, p.<br />
24.<br />
Matrix-Assisted Laser Desorption-<br />
Ionization Imaging Mass Spectrometry<br />
for Direct Tissue Analysis.<br />
J.D. Pallua, G. Schaefer, L.K.<br />
Bittner, C. Pezzei, V. Huck-Pezzei,<br />
S.A. Schoenbichler, S. Meding, S.<br />
Rauser, A. Walch, M. Handler, M.<br />
Netzer, M. Osl, M. Seger, B. Pfeifer,<br />
C. Baumgartner, H. Lindner, L.<br />
Kremser, B. Sarg, H. Klocker, G.<br />
Bartsch, G.K. Bonn, and C.W. Huck.<br />
October, p. 21.<br />
Metabolomics Workflows: Combining<br />
Untargeted Discovery-Based and<br />
Targeted Confirmation Approaches<br />
for Mining Metabolomics Data. Theodore<br />
Sana, Steve Fischer, and Shane<br />
E. Tichy. March, p. 12.<br />
A New Path to High-Resolution HPLC–<br />
TOF-MS — Survey, Targeted, and<br />
Trace Analysis Applications of TOF-<br />
MS in the Analysis of Complex Biochemical<br />
Matrices. Jeffrey S. Patrick,<br />
Kevin Siek, Joe Binkley, Viatcheslav<br />
Artaev, and Michael Mason. May, p.<br />
18.<br />
On- and Off-Line Coupling of Separation<br />
Techniques to Ambient Ionization<br />
Mass Spectrometry. Li Li and<br />
Kevin Schug. October, p. 8.<br />
Probing Aqueous Surfaces by TOF-<br />
SIMS. Xiao-Ying Yu, Li Yang, Zihua<br />
Zhu, James P. Cowin, and Martin J.<br />
Iedema. October, p. 34.<br />
Responding to Data Analysis and Evaluation<br />
Challenges in Mass Spectrometry–Based<br />
Methods for High-<br />
Throughput Proteomics. Laurence<br />
M. Brill. March, p. 36.<br />
Review of the 59th Annual ASMS Conference.<br />
Megan Evans. July, p. 54.<br />
A Sensitive, Specific, Accurate, and Fast<br />
LC–MS-MS Method for Measurement<br />
of Ethyl Glucuronide and Ethyl<br />
Sulfate in Human Urine. Shuguang<br />
Li, Jeff Layne, Sky Countryman, and<br />
Michael McGinley. July, p. 42.<br />
Single Multipoint Calibration Curve<br />
for Discovery Bioanalysis. Benjamin<br />
Begley and Michael Koleto.<br />
May, p. 8.<br />
Time-Resolved SRM Analysis and<br />
Highly Multiplexed LC–MS-MS for<br />
Quantifying Tryptically Digested<br />
Proteins. Richard G. Kay, James W.<br />
Howard, and Steve Pleasance. March,<br />
p. 24.<br />
Why Use Signal-To-Noise As a Measure<br />
of MS Performance When It Is Often<br />
Meaningless? Greg Wells, Harry<br />
Prest, and Charles William Russ IV.<br />
May, p. 28.<br />
SUPPLEMENT: DEFENSE AND<br />
HOMELAND SECURITY<br />
Advances in <strong>Spectroscopy</strong> for Detection<br />
and Identification of Potential Bioterror<br />
Agents. Eric W. Fisher. April, p.<br />
29.<br />
Detecting Explosives by Portable<br />
Raman Analyzers: A Comparison<br />
of 785-, 976-, 1064-, and 1550-nm<br />
(Retina-Safe) Laser Excitation. Michael<br />
Donahue, Hermes Huang, Carl<br />
Brouillette, Wayne Smith, and Stuart<br />
Farquharson. April, p. 24.<br />
Detection of Chemicals with Standoff<br />
Raman <strong>Spectroscopy</strong>. Anupam K.<br />
Misra, Shiv K. Sharma, Tayro E.<br />
Acosta, and David E. Bates. April,<br />
p. 18.<br />
Explosives Sensing Using Multiple<br />
Optical Techniques in a Standoff<br />
Regime with a Common Platform.<br />
Alan R. Ford, Robert D. Waterbury,<br />
Darius M. Vunck, Jeremy B. Rose,<br />
Thomas B. Blank, Ken R. Pohl,<br />
Troy A. McVay, Edwin L. Dottery,<br />
Mikella E. Hankus, Ellen L.<br />
Holthoff, Paul M. Pellegrino, Steve<br />
D. Christesen, and Augustus W.<br />
Fountain III. April, p. 6.<br />
Mid-Infrared Vibrational <strong>Spectroscopy</strong><br />
Standoff Detection of Highly Energetic<br />
Materials: New Developments.<br />
Samuel P. Hernández-Rivera, John R.<br />
Castro-Suarez, Leonardo C. Pacheco-<br />
Londoño, Oliva M. Primera-Pedrozo,<br />
Nicolas Rey-Villamizar, Miguel<br />
Vélez-Reyes, and Max Diem. April,<br />
Digital Edition.<br />
Monitoring of Biological Matrices by<br />
GC–MS-MS for Chemical Warfare<br />
Nerve Agent Detection. Jeffrey M.<br />
McGuire, Jr., Edward M. Jakubowski,<br />
and Sandra A. Thomson. April, p. 12.<br />
SUPPLEMENT: FT-IR TECHNOLOGY<br />
FOR TODAY’S SPECTROSCOPISTS<br />
Contact and Orientation Effects in<br />
FT-IR ATR Spectra. Richard Spragg.<br />
August, p. 18.<br />
GPC-IR Hyphenated Technology to<br />
Characterize Copolymers and to<br />
Deformulate Complex Polymer Mixtures<br />
in Polymer-Related Industries.<br />
William W. Carson and Ming Zhou.<br />
August, p. 28.<br />
NIR Monitoring of a Hot-Melt Extrusion<br />
Process. Brandye Smith-Goettler,<br />
Colleen M. Gendron, Neil MacPhail,<br />
Robert F. Meyer, and Joseph X. Phillips.<br />
August, p. 8.<br />
Using Real-Time FT-IR to Characterize<br />
UV Curable Optical Adhesives. Steve<br />
Lowry and Forrest Weesner. August,<br />
p. 40.<br />
SUPPLEMENT: RAMAN<br />
TECHNOLOGY FOR TODAY’S<br />
SPECTROSCOPISTS<br />
Comparison of Laboratory and Handheld<br />
Raman Instruments for the Identification<br />
of Counterfeit Medicines. Sulaf<br />
Assi, Robert Watt, and Tony Moffat.<br />
June, p. 36.<br />
Looking Below the Surface of Breast<br />
Tissue During Surgery. Anita Mahadevan-Jansen,<br />
Matthew D. Keller,<br />
Elizabeth Vargis, Brittany Caldwell,<br />
The-Quyen Nguyen, Nara de Matos<br />
Granja, Melinda Sanders, and Mark<br />
C. Kelley. June, p. 48.<br />
Raman <strong>Spectroscopy</strong> of Supported Lipid<br />
Bilayer Nanoparticles. Selver Ahmed,<br />
Stephanie L. Wunder, and Zhorro S.<br />
Nickolov. June, p. 8.<br />
Raman <strong>Spectroscopy</strong> Using a Fixed-Grating<br />
Spatial Heterodyne Interferometer.<br />
Nathaniel R. Gomer, Christopher M.<br />
Gordon, Paul Lucey, Shiv K. Sharma, J.<br />
Chance Carter, and S. Michael Angel.<br />
June, p. 22.<br />
X-RAY SPECTROSCOPY<br />
The Dynamic World of X-ray Fluorescence.<br />
Laura Bush. July, p. 40. ◾<br />
For more information on this topic,<br />
please visit our homepage at:<br />
www.spectroscopyonline.com
36 SpectroScopy corporAte cApABILItIeS DECEMBER 2011<br />
1st Detect Corp<br />
www.spectroscopyonline.com<br />
Company Description<br />
1st Detect Corp, a division of Astrotech Corp., is leveraging advances in chemical detection technology<br />
from the space program to offer highly advanced, next generation chemical detection and analysis<br />
instrumentation.<br />
Chief Spectroscopic Techniques Supported<br />
⦁ Miniature mass spectrometry<br />
1st Detect Corp<br />
907 Gemini Ave<br />
Houston TX 77058<br />
Telephone<br />
(972) 617-9939<br />
FAx<br />
(713) 558-5963<br />
e-mAIl<br />
info@1stdetect.com<br />
Web sITe<br />
www.1stdetect.com<br />
usA employees:<br />
16<br />
Markets Served<br />
⦁ Security, Defense<br />
⦁ Industrial process control<br />
⦁ Petrochemical<br />
⦁ Pharmceutical<br />
⦁ Environmetal<br />
Major Products/Services<br />
The Miniature Chemical Detector from 1st Detect is an ion-trap mass spectrometer designed for<br />
field-portable and benchtop applications such as industrial process control, security and defense,<br />
first response and critical infrastructure monitoring, and medical diagnostics and analysis. The instrument<br />
has a weight of 15 lb, a mass range of 10–450 amu, and a resolution of less than 1 amu.<br />
It provides ppb level analysis in less than 2 s, with ppt analysis in 30 s with the optional preconcentrator.<br />
The instrument can be operated with power supplies including 120/240 V AC, 24 V DC, or<br />
supplied batteries.<br />
employees ouTsIDe usA:<br />
2<br />
yeAr FounDeD<br />
2007
www.spectroscopyonline.com<br />
Agilent Technologies, Inc.<br />
DECEMBER 2011 SpectroScopy corporAte cApABILItIeS 37<br />
Agilent Technologies, Inc.<br />
5301 Stevens Creek Blvd<br />
Santa Clara, CA 95052<br />
Telephone<br />
(800) 227-9770<br />
FAx<br />
(302) 633-8901<br />
e-mAIl<br />
cag_sales-na@agilent.com<br />
Web sITe<br />
www.agilent.com<br />
number oF us employees<br />
6000<br />
employees ouTsIDe usA<br />
12,500<br />
yeAr FounDeD<br />
1999<br />
Company Description<br />
Agilent Technologies, Inc. (NYSE:A) is a global leader of measurement<br />
technology for life sciences, chemical analysis, communciations,<br />
and electronics. The company’s 18,500<br />
employees serve customers in more than 110 countries. In<br />
fiscal 2010, Agilent had net revenues of $5.4 billion USD.<br />
Agilent’s life sciences group and chemical analysis group are<br />
leading global providers of instrumentation, consumables,<br />
software, and services to analytical chemistry and life science<br />
research laboratories.<br />
Chief Spectroscopic Techniques Supported<br />
⦁ GC<br />
⦁ GC–MS<br />
⦁ LC<br />
⦁ LC–MS<br />
⦁ SFC<br />
⦁ Capillary electrophoresis<br />
Markets Served<br />
⦁ Food safety and quality<br />
⦁ Environmental testing<br />
⦁ Energy/petrochemical<br />
⦁ Forensics<br />
⦁ Pharmaceutical<br />
⦁ Materials science<br />
⦁ Drug discovery<br />
⦁ Genomics<br />
⦁ Proteomics<br />
⦁ Metabolomics<br />
⦁ Emerging life sciences<br />
⦁ Integrated biology<br />
Major Products/Services<br />
1200 Infinity LC systems (including 1290<br />
UHPLC); 7890A GC; 5975C GC–MS; 7000<br />
Series Triple Quadrupole GC–MS; 6100<br />
Series Single Quadrupole LC–MS; 6200<br />
Series Accurate Mass Mass TOF LC–MS;<br />
6400 Series Triple Quadrupole LC–MS;<br />
6500 Series Accruate Mass Q-TOF LC–MS;<br />
7500 Series ICP-MS; OpenLAB chromatography<br />
data systems; OpenLAB ELN electronic<br />
lab notebook; OpenLAB Enterprise<br />
Content Management System; Automation<br />
systems for life sciences; Genomic microarrays,<br />
target enrichment and reagents;<br />
GeneSpring bioinformatics; qPCR; NMR<br />
and MRI systems; Services and support;<br />
Vacuum systems.<br />
Facility<br />
Major facilities in Santa Clara, California;<br />
Wilmington, Delaware; Waldbronn,<br />
Germany; Tokyo, Japan; and Shanghai,<br />
China.
38 SpectroScopy corporAte cApABILItIeS DECEMBER 2011 www.spectroscopyonline.com<br />
ABB Analytical Measurements<br />
Markets Served<br />
⦁ Laboratory and academic<br />
⦁ Life sciences<br />
⦁ Pharmaceutical<br />
⦁ Fine chemicals, specialty chemicals,<br />
and commodity chemicals<br />
⦁ Refining and petrochemicals<br />
⦁ Metallurgical<br />
⦁ Semiconductor<br />
⦁ Original equipment manufacturer<br />
(OEM)<br />
⦁ Remote sensing and aerospace<br />
Abb Analytical<br />
measurements<br />
585 boul. Charest E.<br />
Suite 300<br />
Quebec, QC G1K 9H4<br />
Canada<br />
Telephone<br />
(418) 877-2944<br />
FAx<br />
(418) 877-2834<br />
e-mAIl<br />
ftir@ca.abb.com<br />
Web sITe<br />
www.abb.com/analytical<br />
number oF employees<br />
200<br />
yeAr FounDeD<br />
1973<br />
Company Description<br />
ABB Analytical Measurements enables scientists around the<br />
world to perform through excellence in infrared spectroscopy.<br />
ABB is a market leader in Fourier transform infrared (FT-IR and<br />
FT-NIR) in terms of reliability and reproducibility. ABB Analytical<br />
designs, manufactures, and markets high-performance, affordable<br />
spectrometers as well as turnkey analytical solutions and<br />
spectroradiometers for remote sensing. ABB Analytical<br />
capabilities encompass one of the largest portfolios in the world<br />
for laboratory, at-line, and process FT-IR analyzers. They perform<br />
real-time analysis of the chemical composition and/or physical<br />
properties of a process sample stream.<br />
Chief Spectroscopic Techniques Supported<br />
⦁ FT-IR<br />
⦁ FT-NIR<br />
⦁ Spectroradiometry and remote sensing<br />
⦁ Dedicated team of engineers offering simple and<br />
dependable solutions with reliable instruments<br />
⦁ Local point of contact for field service and technical<br />
support in most countries around the world with<br />
inventories for parts on all continents<br />
Major Products/Services<br />
ABB’s advanced solutions combine<br />
analyzers, advanced process control, data<br />
management, and process and application<br />
knowledge to improve the operational<br />
performance, productivity, capacity,<br />
and safety of industrial processes for<br />
customers. For all laboratory or process<br />
needs, ABB can be your partner and single-source<br />
provider of simple, low-cost,<br />
high performance, general-purpose FT-IR<br />
and FT-NIR spectrometers. The company<br />
also markets analyzers for hydrogen and<br />
inclusion measurement in liquid<br />
aluminum.<br />
Facility<br />
Our manufacturing facility located in<br />
Quebec City, Canada, employs more than<br />
200 people, including R&D, manufacturing,<br />
marketing, sales, and administrative groups.<br />
The ABB Group of companies operates in<br />
around 100 countries and employs about<br />
130,000 people.
FT-NIR QA software with intuitive workflow<br />
and superior ease of use?<br />
Absolutely.<br />
Intuitive workflow with integrated MB3600 instrument and accessory control<br />
make running QA applications simple for your operators and reliable for you.<br />
From collecting reference data and designing your QA applications to deployment<br />
of turnkey QA methods Horizon MB QA will guide you every step of the way.<br />
Support for customized messages in any language makes your operators feel<br />
right at home from day one.<br />
Horizon MB QA brings intuitive workflows and superior ease of use<br />
to QA method development and deployment.<br />
Discover how ABB helps its customers overcome their technical challenges:<br />
www.abb.com/analytical<br />
ABB Analytical Measurement<br />
Phone: +1 418-877-2944<br />
1 800 858-3847 (North America)<br />
Email: ftir@ca.abb.com
40 SpectroScopy corporAte cApABILItIeS DECEMBER 2011 www.spectroscopyonline.com<br />
Amptek, Inc.<br />
Completing Amptek’s XRF portable<br />
solutions for exact measurements are the<br />
USB controlled Mini-X X-ray tube and the<br />
XRF-FP Quantitative Analysis Software.<br />
Please visit our web site for complete<br />
specifications.<br />
Amptek, Inc.<br />
14 DeAngelo Drive<br />
Bedford, MA 01730<br />
Telephone<br />
( 781) 275-2242<br />
FAx<br />
( 781) 275-3470<br />
e-mAIl<br />
sales@amptek.com<br />
Web sITe<br />
www.amptek.com<br />
number oF employees<br />
47<br />
yeAr FounDeD<br />
1977<br />
Company Description<br />
Amptek, Inc. is a recognized world leader in the design<br />
and manufacture of state-of-the-art X-ray and gamma ray<br />
detectors, preamplifiers, instrumentation, and components<br />
for portable instruments, laboratories, satellites, and analytical<br />
purposes. These products provide the user with high<br />
performance and high reliability together with small size<br />
and low power.<br />
Chief Spectroscopic Techniques Supported<br />
X-ray fluorescence (EDXRF), direct spectral measurements,<br />
SEM, PIXE, and TXRF.<br />
Markets Served<br />
Amptek serves wherever X-ray detection is used; for example,<br />
hand-held and table-top XRF analyzers produced by OEMs;<br />
research facilities in universities, commercial enterprises<br />
and the military; nuclear medicine; space; museums;<br />
environmental monitoring; and geological analysis of soils<br />
and minerals.<br />
Major Products/Services<br />
Models Super XR-100SDD and XR-100CR are high<br />
performance X-ray detector systems featuring a wide range of<br />
detection areas and efficiency; resolution of 125 eV FWHM;<br />
and solid-state design. Power and shaping are provided by<br />
the PX5 Digital Pulse Processor. The XR-100 successfully analyzed<br />
the rocks and soil on Mars.<br />
The X-123 is a complete X-ray detector system in one<br />
small box that fits in your hand. The X-123 incorporates<br />
either the Amptek Si-Pin Diode Detector or Super Silicon<br />
Drift Detector; Charge Sensitive Preamplifier; the Amptek<br />
DP5 Digital Pulse Processor and MCA; and the Amptek PC5<br />
Power Supply. This small, low power, easy to operate, highperformance<br />
instrument is ideal for both the laboratory and<br />
OEM industries.<br />
Applications<br />
⦁ X-Ray fluorescence<br />
⦁ Process control<br />
⦁ OEM instrumentation<br />
⦁ RoHS/WEEE compliance testing<br />
⦁ Nondestructive analysis with XRF<br />
⦁ Restricted metals detection<br />
⦁ Environmental monitoring<br />
⦁ Medical and nuclear electronics<br />
⦁ Heavy metals in plastics<br />
⦁ Lead detectors<br />
⦁ Toxic dump site monitoring<br />
⦁ Semiconductor processing<br />
⦁ Nuclear safeguards verification<br />
⦁ Plastic & metal separation<br />
⦁ Coal & mining operations<br />
⦁ Sulfur in oil and coal detection<br />
⦁ Smoke stack analysis<br />
⦁ Plating thickness<br />
⦁ Oil logging<br />
⦁ Electro-optical systems<br />
⦁ Research experiments & teaching<br />
⦁ Art and archaeology<br />
⦁ Jewelry analysis
X-Ray Detectors<br />
t4PMJE4UBUF%FTJHO t64#$POUSPMMFE<br />
t-PX$PTUt&BTZUP6TF<br />
The PERFORMANCE You Need<br />
NEW SUPER SDD<br />
125 eV FWHM<br />
5.9<br />
LF7<br />
55<br />
Fe<br />
Si-PIN<br />
5.9<br />
LF7<br />
55<br />
Fe<br />
NN 2 YN<br />
TQFBLJOHUJNF<br />
1#3BUJP<br />
$PVOUT<br />
145 eV FWHM<br />
NN 2 YN<br />
TQFBLJOHUJNF<br />
1#3BUJP<br />
&OFSHZ LF7<br />
&OFSHZ LF7<br />
Complete XRF System<br />
The CONFIGURATION You Want<br />
OEM Components for XRF<br />
Complete<br />
X-Ray Spectrometer<br />
Our OEM Technology<br />
Your Products<br />
tTable-top XRF Analyzers<br />
tHand-held XRF Analyzers<br />
APPLICATIONS<br />
t0&.<br />
t93BZ'MVPSFTDFODF<br />
t1SPDFTT$POUSPM t3P)48&&&$PNQMJBODF5FTUJOH<br />
t-FBE%FUFDUPST t3FTUSJDUFE.FUBMT%FUFDUJPO<br />
t+FXFMSZ"OBMZTJT t)FBWZ.FUBMTJO1MBTUJD<br />
t1MBUJOH5IJDLOFTT t"SU"SDIBFPMPHZ<br />
AMPTEK Inc.<br />
www.amptek.com
42 SpectroScopy corporAte cApABILItIeS DECEMBER 2011 www.spectroscopyonline.com<br />
Andor Technology<br />
Andor Technology<br />
7 Millennium Way<br />
Springvale Business Park<br />
Belfast BT12 7AL<br />
United Kingdom<br />
Telephone<br />
(800) 296-1579<br />
e-mAIl<br />
marketing@andor.com<br />
Web sITe<br />
www.andor.com<br />
number oF employees<br />
321<br />
employees ouTsIDe usA<br />
270<br />
yeAr FounDeD<br />
1989<br />
Company Description<br />
Andor Technology is a world leader in the manufacturing of<br />
high performance VUV to SWIR modular spectroscopy<br />
detection solutions. Based around best-in-class, researchgrade<br />
CCDs, exclusive electron multiplying CCDs and<br />
intensified CCD detectors, as well as seamlessly configurable<br />
spectrographs and dedicated spectroscopy software, Andor’s<br />
robust detection solutions offer a unique combination of sensitivity,<br />
speed, and ease of use. Andor’s core technology<br />
Ultravac TM combines with the latest cutting-edge technology<br />
in the fields of sensors, electronics, optic, and software to<br />
deliver world-class, market-leading scientific spectroscopy<br />
detection systems to academics and industrial integrators.<br />
Chief Spectroscopic Techniques Supported<br />
⦁ Absorption – transmission – reflection (UV-NIR and SWIR)<br />
⦁ Raman (244 to 1064 nm)<br />
⦁ Fluorescence – luminescence (UV-NIR and SWIR)<br />
⦁ Micro-Raman and Micro-fluorescence<br />
⦁ Photon counting<br />
⦁ Single molecule spectroscopy<br />
⦁ Plasma studies<br />
⦁ Laser induced breakdown spectroscopy (LIBS)<br />
Markets Served<br />
In the analytical and life sciences markets, Andor products<br />
are particularly suited to fundamental research in the field of<br />
biology, nanotechnology, material characterization (polymers,<br />
semi-conductors), chemical analysis, and astronomy, as well<br />
as industrial applications such as food and safety, process<br />
control, drug screening, forensic, environment/water monitoring,<br />
and solar panel inspection.<br />
Major Products/Services<br />
Andor’s spectroscopy range features a high<br />
performance CCD platform (Newton) with<br />
dedicated spectroscopy EMCCD for rapid,<br />
light-starved applications. Andor’s most<br />
popular CCD/InGaAs platform is the iDus,<br />
for all general spectroscopy applications,<br />
alongside the market leading ICCD<br />
camera, iStar, for ns gated applications.<br />
The Shamrock family is Andor’s versatile<br />
spectrograph platform, with USB<br />
connectivity and seamless configuration<br />
with a wide range of accessories, including<br />
fiber optics bundles, and interface to<br />
microscopes. Solis software boasts a<br />
dedicated interface, integrating data<br />
acquisition and cameras/spectrometers<br />
simultaneous control. Andor’s X-Ray<br />
detector range features a wide range of<br />
direct/indirect detection options on the<br />
Newton and iKon platform.<br />
Facility<br />
Andor’s purpose-built 4650 m 2<br />
(50,000-square-foot) headquarters is<br />
based in Belfast, Northern Ireland. It<br />
hosts state-of-the-art 3000-square-foot<br />
Class 1000 and 100 clean rooms, and<br />
also provides a unique, 6-Sigma driven<br />
environment for streamlining of products<br />
design, manufacturing, and thorough QC<br />
testing of each system prior to shipment.
www.spectroscopyonline.com DECEMBER 2011 SpectroScopy corporAte cApABILItIeS 43<br />
Applied Photophysics<br />
Applied photophysics<br />
21 Mole Business Park<br />
Leatherhead, Surrey<br />
KT22 7BA<br />
United Kingdom<br />
Telephone<br />
+44 (0) 1372 386537<br />
Toll-free (from USA only)<br />
(800) 543-4130<br />
e-mAIl<br />
Sales Department:<br />
sales@ photophysics.com<br />
Technical Support:<br />
support@ photophysics.com<br />
Web sITe<br />
www.photophysics.com<br />
yeAr FounDeD<br />
1971<br />
Company Description<br />
Applied Photophysics (APL) has firmly established itself as a<br />
global developer and manufacturer of high quality, high performance,<br />
modern spectrometers by providing cutting-edge solutions<br />
and world-class support for bioscience and biopharmaceutical<br />
research both in academia and industry. From research through<br />
development to production, our scientific expertise and innovative<br />
solutions help life science researchers to understand complex biological<br />
systems, allowing them to be at the forefront of discovery.<br />
Chief Spectroscopic Techniques Supported<br />
⦁ Circular dichroism (CD) spectroscopy<br />
⦁ Stopped-flow spectroscopy<br />
⦁ Laser-flash spectroscopy<br />
Markets Served<br />
APL offers precision spectrometers to academic and industrial<br />
markets. The Chirascan range of CD spectrometers are now the<br />
instruments of choice for use in drug development, formulation<br />
testing, and quality control. The SX20 and LKS80 spectrometers<br />
are established leaders for stopped-flow and laser-flash research,<br />
addressing applications in protein structure, folding, and conformation,<br />
together with biomolecular reaction kinetics and the study<br />
of chemical reaction mechanisms.<br />
Major Products/Services<br />
Chirascan and Chirascan-plus (CD) spectrometers<br />
Outstanding sensitivity, novel detection technology, powerful<br />
software combine to make these CD spectrometers the world’s<br />
most advanced.<br />
NEW Chirascan-plus ACD spectrometer<br />
The world’s first and only ultra-sensitive,<br />
high-speed, automated CD spectrometer.<br />
This unique instrument significantly extends<br />
the scope and range of CD applications and<br />
delivers a minimum 50-fold increase in<br />
operator productivity.<br />
SX20 stopped-flow spectrometer<br />
The SX20 is the market-leading stopped-flow<br />
reaction analyzer capable of measuring fast<br />
reactions with a minimum of material.<br />
LKS80 nanosecond laser-flash<br />
photolysis spectrometer<br />
The new LKS80 offers even higher<br />
sensitivity than earlier models for studying<br />
by direct measurement the reactions of transient<br />
species such as radicals, excited states<br />
or ions, in chemical and biological systems.<br />
RX2000 rapid-mixing stopped-flow unit<br />
Adds stopped-flow rapid reaction kinetics to<br />
any UV-visible spectrometer or fluorometer.<br />
Pro-Data software<br />
All our products use a common software<br />
suite giving cross-platform compatibility.<br />
Accessories<br />
Maximize the capabilities and take full<br />
advantage of the potential built into your<br />
instrument with a wide range of accessories.<br />
Customer Support<br />
Support is provided for the lifetime of the<br />
product and every instrument comes with a<br />
warranty of at least 12 months that can be<br />
easily extended. A world-class service team is<br />
on hand for support and applications advice.<br />
Facilities<br />
Headquartered close to London, United<br />
Kingdom. APL has recently opened offices<br />
in China and the United States. See<br />
www.appliedphotophysics.com/company/authorized-agents<br />
for our worldwide<br />
distribution network.
44 SpectroScopy corporAte cApABILItIeS DECEMBER 2011 www.spectroscopyonline.com<br />
Avantes, Inc.<br />
developing research and teaching opportunities.<br />
Our OEM program is designed to work with<br />
our customers to identify needs and customize<br />
an Avantes’ spectroscopy solution based our<br />
customer’s needs and Avantes technical know<br />
experience. Avantes’ continued growth is based<br />
upon a commitment to providing exceptional<br />
technology and superb customer satisfaction.<br />
Avantes, Inc.<br />
9769 W. 119th Ave., Suite 4<br />
Broomfield, CO 80021<br />
Telephone<br />
(303) 410-8668<br />
FAx<br />
(303) 410-8669<br />
e-mAIl<br />
infoUSA@avantes.com<br />
Web sITe<br />
www.avantes.com<br />
number oF employees<br />
50<br />
yeAr FounDeD<br />
1993<br />
Company Description<br />
Avantes is a leading innovator in the development and<br />
application of miniatures pectrometers. Avantes continues<br />
to develop and introduce new instruments for fiber optic<br />
spectroscopy to meet our customer’s application needs.<br />
Avantes instruments and accessories are also deployed<br />
into a variety of OEM applications in a variety of industries<br />
in markets throughout the world. With more than 15 years<br />
of experience in fiber optic spectroscopy and thousands<br />
of instruments in the field, Avantes is eager to help our<br />
customers find their Solutions in <strong>Spectroscopy</strong> ® .<br />
Principal Spectroscopic Techniques Supported<br />
⦁ UV–vis/NIR spectroscopy<br />
⦁ Process control<br />
⦁ Absorbance/transmittance/reflectance<br />
⦁ Laser-induced breakdown spectroscopy<br />
⦁ CIE color spectroscopy<br />
⦁ Portable spectrometers<br />
⦁ Fluorescence spectroscopy<br />
⦁ Custom applications<br />
⦁ Irradiance<br />
⦁ Raman spectroscopy<br />
⦁ OEM application development<br />
Markets Served<br />
Avantes works with customers in a variety of markets, including<br />
chemical, biomedical, aerospace, semiconductor, gemological, paper,<br />
pharmaceutical, and food processing technology. Additionally,<br />
Avantes works with research organizations and universities, aiding in<br />
Major Products/Services<br />
Low-cost, high-resolution, miniature<br />
fiber optic spectrometers:<br />
System solutions and OEM instruments<br />
for applications from 185 nm to 2500<br />
nm. Detector choices: PDA, CMOS, CCD,<br />
back-thinned CCD, and InGaAs. Optical<br />
benches with focal lengths of 45, 50 or 75<br />
mm; revolutionary new ultra-low straylight<br />
optimized optical bench (ULS) and a new<br />
high sensitivity optical bench. Other features:<br />
14 and 16 bit A/D converters, TE cooling,<br />
multi-channel instrument configurations<br />
enabling simultaneous signal acquisition,<br />
USB2 communication, support for multiple<br />
instruments from a single computer, and 14<br />
programmable digital I/O ports.<br />
Standard application solutions:<br />
Irradiance and LED measurements,<br />
gemology, hemometric analysis, thin-film<br />
measurement, color, fluorescence, laserinduced<br />
breakdown spectroscopy, Raman<br />
spectroscopy, and process control.<br />
Light sources:<br />
Tungsten-halogen, Deuterium, LED, and<br />
Xenon calibration sources for wavelength<br />
and irradiance.<br />
Facility<br />
Avantes engineering, manufacturing,<br />
sales, and service headquarters is in the<br />
Netherlands. The company also operates<br />
direct offices in China and North America. In<br />
addition, Avantes has a growing worldwide<br />
distribution network of more than 35<br />
qualified distributors to meet our customer’s<br />
needs worldwide.
www.spectroscopyonline.com<br />
B&W Tek, Inc.<br />
DECEMBER 2011 SpectroScopy corporAte cApABILItIeS 45<br />
Major Products/Services<br />
⦁ Fiber coupled spectrometer modules<br />
⦁ Diode and DPSS Lasers<br />
⦁ Laboratory, portable, and handheld<br />
Raman spectrometers<br />
⦁ Customized design and development<br />
services<br />
⦁ Customized photonic instrumentation<br />
manufacturing<br />
Facilities<br />
B&W Tek boasts three United States facilities<br />
in Delaware (2) and New Jersey (1), a sales<br />
office in Lubeck, Germany, two facilities in<br />
Shanghai, China, and another office in<br />
Saitama, Japan. Most of our engineering,<br />
design, and manufacturing takes place in our<br />
Newark, Delaware headquarters location.<br />
b&W Tek, Inc.<br />
19 Shea Way<br />
Newark, DE 19713<br />
Telephone<br />
(302) 368-7824<br />
FAx<br />
(302) 368-7830<br />
e-mAIl<br />
sales@bwtek.com<br />
Web sITe<br />
www.bwtek.com<br />
number oF employees<br />
USA: 80<br />
Elsewhere: 100<br />
yeAr FounDeD<br />
1997<br />
Company Description<br />
B&W Tek is an advanced instrumentation company producing<br />
optical spectroscopy, laser instrumentation, and portable/lab<br />
grade Raman systems. B&W Tek provides spectroscopy and<br />
laser solutions for the pharmaceutical, biomedical, physical,<br />
chemical, LED lighting, and research communities. Our commitment<br />
to innovating solutions has made B&W Tek a leader<br />
in Raman spectroscopy solutions worldwide. With a strong<br />
vertical integration capability, B&W Tek, Inc. also provides<br />
custom product development, design, and manufacturing. In<br />
addition, B&W Tek has recently introduced the NanoRam TM ,<br />
the most sensitive and repeatable handheld Raman<br />
spectrometer ever designed for identifying harmful, nonconforming<br />
materials before they reach production.<br />
Chief Spectroscopic Techniques Supported<br />
⦁ UV<br />
⦁ Visible<br />
⦁ NIR<br />
⦁ Raman<br />
⦁ Microscopy<br />
Markets Served<br />
B&W Tek provides solutions for analytical, industrial, medical,<br />
biophotonic, and diagnostic applications. Our products are used<br />
in markets such as semiconductor, solar, pharmaceuticals, LED<br />
lighting, specialty chemicals, academic labs, government labs, and<br />
medical and biomedical development and manufacturing.
46 SpectroScopy corporAte cApABILItIeS DECEMBER 2011 www.spectroscopyonline.com<br />
Bruker Daltonics<br />
Markets Served<br />
Bruker Daltonics’ mass spectrometers are<br />
a powerful tool for a wide variety of<br />
applications with different analytical<br />
challenges.<br />
Our analytical systems combine high<br />
performance mass spectrometers,<br />
software, and accessories to deliver<br />
answers for a broad range of areas<br />
including:<br />
⦁ Proteomics and protein analysis<br />
⦁ Clinical diagnostics<br />
⦁ Drug metabolism studies<br />
⦁ Food/environmental applications<br />
⦁ Chemistry support and chemical analysis<br />
⦁ Petroleomics<br />
⦁ Forensics<br />
bruker Daltonics<br />
40 Manning Road<br />
Billerica, MA 01821<br />
Telephone<br />
(978) 663-3660<br />
FAx<br />
(978) 667-5993<br />
e-mAIl<br />
ms-sales@bdal.com<br />
Web sITe<br />
www.bruker.com/ms<br />
Company Description<br />
Bruker Daltonics provides a variety of innovative mass<br />
spectrometry systems. Our powerful, yet easy to implement,<br />
products are specifically designed to meet the rapidly<br />
growing needs of customers in the academic, pharmaceutical,<br />
industrial, and clinical areas.<br />
Consistently and expertly supported, our turn-key system<br />
solutions and complete workflows offer integrated instrument<br />
and software tools which enhance the productivity and<br />
capabilities of any analytical operation.<br />
Bruker Daltonics product lines include platforms representing<br />
many types of separation technologies and mass<br />
spectrometry including:<br />
⦁ Matrix assisted laser desorption ionization time-of-flight<br />
mass spectrometer (MALDI-TOF and MALDI-TOF/TOF)<br />
⦁ Electrospray ionization (ESI), ion trap mass spectrometer<br />
⦁ ESI-TOF, and ESI-quadrupole TOF (qTOF) mass spectrometers<br />
⦁ Ultra high resolution TOF (UHR-TOF) mass spectrometer<br />
⦁ Fourier transform mass spectrometer (FTMS)<br />
⦁ Inductively coupled plasma mass spectrometer (ICP-MS)<br />
⦁ Gas chromatograph with single and triple quadrupole mass<br />
spectrometer (GC–MS)<br />
⦁ Gas chromatograph (GC)<br />
⦁ Nano-LC<br />
Facilities<br />
Bruker Daltonics is headquartered in<br />
Billerica, Massachusetts with a sales,<br />
service, and applications facility in<br />
Fremont, California, as well as major<br />
facilities in Germany (Bremen and Leipzig)<br />
and the United Kingdom. A global network<br />
of demonstration, sales, and service sites<br />
provides complete worldwide support for<br />
all our products and services.
Setting the Benchmark<br />
in ICP-MS: aurora m90<br />
Bruker continues to find new and novel ways to meet your changing<br />
needs. As a leader in elemental analysis you can be assured that when<br />
you buy a Bruker ICP-MS, you’re buying more than just an instrument.<br />
You’re buying a relationship with one of the most respected and<br />
experienced instrument companies in the world.<br />
Contact us today at ms-sales@bdal.com or visit us on the web at<br />
www.bruker.com/ms<br />
Innovation with Integrity<br />
ICP-MS
48 SpectroScopy corporAte cApABILItIeS DECEMBER 2011 www.spectroscopyonline.com<br />
Bruker Corporation<br />
⦁ Nuclear magnetic resonance (NMR)<br />
⦁ Electron paramagnetic resonance<br />
(EPR)<br />
⦁ Magnetic resonance imaging (MRI)<br />
⦁ Low resolution benchtop NMR<br />
analyzers<br />
⦁ X-ray crystallography (SC-XRD)<br />
⦁ X-ray diffraction (XRD)<br />
⦁ X-ray fluorescence (XRF)<br />
⦁ Handheld X-ray (XRF) spectrometers<br />
⦁ X-ray microanalysis (EDS, EBSD)<br />
⦁ Optical emission spectroscopy (OES)<br />
⦁ CS/ONH-Analysis<br />
⦁ Atomic force microscopy (AFM)<br />
⦁ Scanning probe microscopy (SPM)<br />
⦁ Stylus and optical metrology<br />
bruker Corporation<br />
40 Manning Road<br />
Billerica, MA 01821<br />
Telephone<br />
(978) 663-3660<br />
FAx<br />
(978) 667-5993<br />
e-mAIl<br />
info@bruker.com<br />
Web sITe<br />
www.bruker.com<br />
Company Description<br />
The Bruker name has become synonymous with the excellence,<br />
innovation, and quality that characterizes our comprehensive<br />
range of scientific instrumentation. Our solutions<br />
encompass a wide number of analytical techniques ranging<br />
from magnetic resonance to mass spectrometry, to optical<br />
and X-ray spectroscopy.<br />
These market- and technology-leading products are driving<br />
and facilitating many key application areas such as life<br />
science research, pharmaceutical analysis, applied analytical<br />
chemistry applications, materials research and nanotechnology,<br />
clinical research, molecular diagnostics, and homeland<br />
defense.<br />
Visit our website to discover more about our technologies<br />
and solutions.<br />
Bruker — Innovation with Integrity!<br />
Chief Spectroscopic Techniques Supported<br />
⦁ FT-infrared spectroscopy and microscopy (FT-IR)<br />
⦁ FT-near infrared spectroscopy (FT-NIR)<br />
⦁ Raman spectroscopy and microscopy<br />
⦁ Terahertz spectroscopy and imaging<br />
⦁ Liquid chromatography–mass spectrometry (LC–MS)<br />
⦁ FT-mass spectrometry (FTMS)<br />
⦁ MALDI-TOF (/TOF) mass spectrometry<br />
⦁ Inductively coupled plasma mass spectrometry (ICP-MS)<br />
⦁ Gas chromatography–mass spectrometry (GC–MS)<br />
⦁ Ion mobility spectrometry (IMS)
www.spectroscopyonline.com<br />
CVI melles Griot lasers<br />
2051 Palomar Airport Road, 200<br />
Carlsbad, CA 92011<br />
Telephone<br />
(760) 438-2131<br />
e-mAIl<br />
lasers@cvimellesgriot.com<br />
CVI melles Griot<br />
optics & Assemblies:<br />
200 Dorado Place SE<br />
Albuquerque, NM 87123<br />
Telephone<br />
(505) 296-9541<br />
e-mAIl<br />
optics@cvimellesgriot.com<br />
Web sITe<br />
www.cvimellesgriot.com<br />
AsIA<br />
+81 3 3407-3614<br />
europe<br />
+31 316 333 041<br />
CVI Melles Griot<br />
Company Description<br />
CVI Melles Griot is a leading global supplier of OEM and fast<br />
turn catalog photonics products including lasers at over 38<br />
wavelengths, optics, coatings covering the deep ultraviolet<br />
to the infrared, opto-mechanics, and positioning equipment.<br />
The company’s unique breadth of manufacturing and design<br />
expertise in electronics, lasers, optics, coatings, and thermal<br />
management is evident in everything from simple components<br />
to precision integrated electro-optic assemblies.<br />
Chief Spectroscopic Techniques Supported<br />
⦁ <strong>Spectroscopy</strong>; Microscopy<br />
⦁ Capillary electrophoresis<br />
⦁ Biotech/Medical<br />
⦁ Laser-induced fluorescence<br />
⦁ Pharmaceutical<br />
⦁ Particle characterization<br />
⦁ Semiconductor<br />
⦁ Non-contact inspection<br />
⦁ Industrial<br />
⦁ Interferometry<br />
⦁ Environmental<br />
⦁ Velocimetry<br />
⦁ Government/Military<br />
Markets Served<br />
⦁ Design, development, and manufacturing on 3 continents<br />
⦁ Lasers, optics, thin films, mechanics, drive electronics<br />
⦁ Over 39 years of volume production<br />
⦁ Over 2.9 million lasers and 120 million optics shipped<br />
⦁
50 SpectroScopy corporAte cApABILItIeS DECEMBER 2011 www.spectroscopyonline.com<br />
EDAX, Inc.<br />
eDAx, Inc.<br />
91 McKee Drive<br />
Mahwah, NJ 07430<br />
Telephone<br />
(201) 529-4880<br />
FAx<br />
(201) 529-3156<br />
e-mAIl<br />
info@amtek.com<br />
Web sITe<br />
www.edax.com<br />
yeAr FounDeD<br />
1962<br />
Company Description<br />
EDAX, Inc. is an ISO-9001 certified manufacturer with over 50<br />
years of experience building instrumentation for the elemental<br />
and structural analysis of materials. EDAX’s founding technology<br />
was the detection and measurement of fluorescent X-rays for<br />
qualitative and quantitative elemental analysis — for example,<br />
elemental analysis on electron beam microscopes. Since that<br />
time, EDAX has sought to expand our product offering through<br />
new technologies and complementary techniques to provide our<br />
customers with the latest analytical instrumentation available.<br />
EDAX continues to be a world leader in materials analysis<br />
providing both stand-alone micro-XRF systems and microscopemounted<br />
tools.<br />
Chief Spectroscopic Techniques Supported<br />
⦁ Energy dispersive spectroscopy<br />
⦁ Energy dispersive X-ray fluorescence<br />
⦁ Electron back scatter diffraction<br />
⦁ Wavelength dispersive spectroscopy<br />
Markets Served<br />
EDAX instrumentation for elemental and structural analysis is<br />
found in a broad spectrum of industrial, academic, and government<br />
applications from the field or warehouse to the most<br />
advanced research and development laboratory. Typical markets<br />
served include semiconductor and microelectronics, academic,<br />
and industrial R&D laboratories, ROHS/WEEE, renewable energy,<br />
pharmaceuticals, mining, security, forensics, catalysts,<br />
petrochemicals, metallurgy, and manufacturing operations.<br />
Major Products/Services<br />
⦁ Energy dispersive X-ray fluorescence:<br />
EDAX manufactures micro XRF<br />
analyzers for the laboratory.<br />
⦁ Electron backscatter diffraction: EDAX<br />
supplies instrumentation for materials<br />
structural analysis on SEM electronbeam<br />
microscopes.<br />
⦁ Energy dispersive spectroscopy: EDAX<br />
provides a full range of EDS products<br />
for elemental analysis on SEM and TEM<br />
electron-beam microscopes.<br />
⦁ Wavelength dispersive spectroscopy:<br />
EDAX offers parallel beam WDS products<br />
for elemental analysis on SEM<br />
electron-beam microscopes.<br />
⦁ Fluorescent X-ray detectors: EDAX<br />
supplies Si(Li) detectors and silicon drift<br />
detectors, which are capable of handling<br />
count rates of over 1,000,000 cps<br />
and parallel beam wavelength<br />
dispersive spectrometers.<br />
Facilities<br />
EDAX headquarters is located in Mahwah,<br />
New Jersey, housing sales, technical<br />
support, and manufacturing operations.<br />
EDAX is committed to providing the best<br />
possible support for our customers worldwide<br />
with sales, service, and applications<br />
support offices located in Japan, China,<br />
Singapore, The Netherlands, Germany, the<br />
United Kingdom, and the United States.
is Puts a New Spin on<br />
Micro XRF Analysis Versatility<br />
on-Destructive<br />
Micro to Millimeter<br />
Spot Elemental Analysis<br />
Using Primary Beam<br />
Filters on a Wide Range<br />
of Sample Types<br />
Forensics<br />
Trace Evidence, Solids, Residues,<br />
Powders, Liquids<br />
Industrial<br />
RoHS-WEEE, Quality Control, Failure Analysis,<br />
Coating Thickness/Composition<br />
Antiquities/Museum<br />
Artifact Authentication, Gemstones, Documents
52 SpectroScopy corporAte cApABILItIeS DECEMBER 2011<br />
Edinburgh Instruments<br />
www.spectroscopyonline.com<br />
⦁ Fluorescence spectrometers (lifetime,<br />
phosphorescence only)<br />
⦁ Laser flash photolysis spectrometers<br />
⦁ CO and CO 2<br />
lasers<br />
⦁ Pulsed gas lasers<br />
⦁ Optically pumped lasers<br />
⦁ Picosecond light sources<br />
Facilities<br />
Edinburgh Instruments (EI) is now located<br />
in purpose built 12,800-square-foot facilities<br />
just outside Edinburgh, United Kingdom,<br />
where it employs over 70 people.<br />
The company is involved in the development,<br />
manufacture, and sale of a wide<br />
range of high technology products for the<br />
scientific research and industrial markets.<br />
edinburgh Instruments<br />
2 Bain Square<br />
Kirkton Campus<br />
Livingston EH547DQ<br />
UK<br />
Telephone<br />
44(0) 1506425300<br />
FAx<br />
44(0) 1506425320<br />
e-mAIl<br />
sales@edinst.com<br />
Web sITe<br />
www.edinburghphotonics.com<br />
number oF employees<br />
70<br />
yeAr FounDeD<br />
1971<br />
Company Description<br />
Edinburgh Instruments Ltd. is a global provider of sophisticated<br />
luminescence and fluorescence instrumentation and lasers.<br />
Our products are suitable for a wide range of applications these<br />
include scientific R&D, commercial research, process industries,<br />
environmental monitoring, and other applications. Combined<br />
with our reputation for delivering trustworthy, high-quality, high<br />
performance products our service excellence has helped<br />
establish Edinburgh Instruments as an innovative leading light in<br />
the marketplace. Edinburgh Instruments has a global reputation<br />
for excellence. Excellence in product. Excellence in service.<br />
Excellence in expertise.<br />
Chief Spectroscopic Techniques Supported<br />
⦁ Fluorescence spectrometers — steady state, lifetime, and<br />
phosphorescence<br />
⦁ Laser flash photolysis<br />
Markets Served<br />
⦁ Scientific research and industrial markets<br />
⦁ Photophysics<br />
⦁ Photochemistry<br />
⦁ Biophysics<br />
⦁ Biochemistry<br />
⦁ Semiconductor physics<br />
Major Products/Services<br />
⦁ Fluorescence spectrometers (steady state, lifetime,<br />
phosphorescence)<br />
⦁ Fluorescence spectrometers (lifetime only)
www.spectroscopyonline.com<br />
Energetiq Technology, Inc.<br />
DECEMBER 2011 SpectroScopy corporAte cApABILItIeS 53<br />
energetiq Technology, Inc.<br />
7 Constitution Way<br />
Woburn, MA 01801<br />
Telephone<br />
(781) 939-0763<br />
FAx<br />
(781) 939-0769<br />
e-mAIl<br />
info@energetiq.com<br />
Web sITe<br />
www.energetiq.com<br />
yeAr FounDeD<br />
2004<br />
Company Description<br />
Energetiq Technology is a developer and manufacturer of<br />
ultrahigh-brightness light sources that enable the manufacture<br />
and analysis of nano-scale structures and products. Used<br />
in complex scientific and engineering applications such as<br />
analytical instrumentation and leading edge semiconductor<br />
manufacture, Energetiq’s light products are based on new<br />
technology that features broadband output from 170 nm in<br />
the deep UV, through visible and into the near infrared.<br />
Energetiq was founded in 2004 by an experienced<br />
technology development team with deep understanding of<br />
the high power plasma physics needed for high performance<br />
light products. This expertise enables Energetiq to provide<br />
light sources with the highest levels of brightness,<br />
performance, and reliability, as well as long operating life.<br />
Chief Spectroscopic Techniques Supported<br />
⦁ UV–vis spectrometry<br />
⦁ Hyperspectral imaging<br />
⦁ Circular dichroism spectroscopy<br />
⦁ Photoemission electron spectroscopy<br />
Markets Served<br />
Energetiq’s light sources are used for analytical spectroscopy,<br />
microscopy, and biological imaging in<br />
the life-sciences; lithography, metrology,<br />
inspection, resist and thin-film processing<br />
of semiconductors, displays and storage<br />
devices; soft X-ray microscopy; and a<br />
variety of R&D applications where<br />
traditional arc-lamps and synchrotron<br />
radiation have commonly been used.<br />
Major Products<br />
UV–vis-NIR, Broadband<br />
⦁ Ultra-high brightness, long-life, LDLS TM<br />
laser-driven light sources:<br />
• EQ-99 (compact, economical,<br />
high brightness)<br />
• EQ-99FC (compact, high brightness,<br />
fiber-coupled output)<br />
• EQ-1000 (high power, high<br />
brightness)<br />
• EQ-1500/1510 (ultra-high<br />
brightness)<br />
• All models feature lifetimes<br />
10× traditional lamps<br />
Facilities<br />
Energetiq Technology provides sales and<br />
service support through its technical staff<br />
in the Woburn, Massachusetts<br />
headquarters and through its network<br />
of representatives and distributors in the<br />
United States, Asia, and Europe, ensuring<br />
quick turnaround for customers. In addition,<br />
the Massachusetts location has a<br />
clean manufacturing facility that provides<br />
Class 1000 assembly capability for optics<br />
assembly and manufacturing for LDLS<br />
products.
54 SpectroScopy corporAte cApABILItIeS DECEMBER 2011 www.spectroscopyonline.com<br />
Enwave Optronics, Inc.<br />
Major Products/Services<br />
⦁ EZRaman Series for laboratory and field<br />
Raman applications<br />
⦁ ProRaman Series for laboratory, on-line<br />
process monitoring, and other applications<br />
requiring high sensitivity<br />
⦁ MicroSense Series for Raman microscopy<br />
applications<br />
⦁ Frequency-stabilized lasers<br />
⦁ Customized Raman solutions<br />
⦁ OEM products<br />
Facilities<br />
Enwave’s engineering, sales, manufacturing,<br />
and services office is located in<br />
Irvine, California. We also have partners<br />
and distributors in North America, Europe,<br />
Asia, Latin America, and Australia<br />
to meet the needs of our international<br />
customers.<br />
enwave optronics, Inc.<br />
18200 W. McDurmott Street,<br />
Suite A<br />
Irvine, CA 92614<br />
Telephone<br />
(949) 955-0258<br />
FAx<br />
(949) 955-0259<br />
e-mAIl<br />
info@enwaveopt.com<br />
Web sITe<br />
www.enwaveopt.com<br />
number oF employees<br />
US: 8<br />
Outside the US: 15<br />
yeAr FounDeD<br />
2003<br />
Company Description<br />
Enwave Optronics, Inc. is an innovative leader in high performance<br />
and affordable Raman spectroscopy solutions.<br />
The Enwave engineering team has extensive knowledge<br />
in diode laser optical systems and Raman spectroscopy<br />
instrumentation. We specialize in providing solutions for<br />
Raman applications that other vendors are unable to solve.<br />
We provide full design, prototyping, R&D, manufacturing,<br />
and technical support. We are committed to assisting you<br />
resolve your most challenging application needs and to<br />
providing you with the best performance and quality solutions<br />
at the most affordable prices.<br />
Chief Spectroscopic Techniques Supported<br />
⦁ Raman spectroscopy<br />
Markets Served<br />
Enwave’s instruments can be found and utilized for a wide<br />
range of applications and in a variety of industries such<br />
as: education, research, environmental, semiconductor,<br />
pharmaceutical, forensics, chemical, paper and pulp, food<br />
and beverage, biotechnology and life sciences, gemology/<br />
mineralogy, and much more!
www.spectroscopyonline.com DECEMBER 2011 SpectroScopy corporAte cApABILItIeS 55<br />
Hamamatsu Corporation<br />
Major Products/Services<br />
⦁ Detectors: photomultiplier tubes,<br />
infrared detectors, photodiodes, and<br />
microchannel plates<br />
⦁ Image sensors: NMOS, CMOS, InGaAs<br />
photodiode arrays, and CCD<br />
⦁ Miniature spectrometers: UV–vis, NIR,<br />
and Raman<br />
⦁ Light sources: xenon lamps, xenon flash<br />
lamps, deuterium lamps, laser diodes,<br />
and quantum cascade lasers<br />
Company Description<br />
Hamamatsu Corporation is the North American subsidiary of<br />
Hamamatsu Photonics K.K. (Japan), a leading manufacturer of<br />
devices for the generation and measurement of infrared,<br />
visible, and ultraviolet light. These devices include<br />
photodiodes, photomultiplier tubes, scientific light sources, infrared<br />
detectors, photoconductive detectors, and image<br />
sensors. The parent company is dedicated to the advancement<br />
of photonics through extensive research. This corporate<br />
philosophy results in state-of-the-art products that are used<br />
throughout the world in scientific, industrial, and commercial<br />
applications.<br />
Facility<br />
Hamamatsu Corporation is a wholly<br />
owned subsidiary of Hamamatsu<br />
Photonics K.K. (Japan). Hamamatsu<br />
Corporation’s headquarters is located in<br />
Bridgewater, New Jersey. In addition, we<br />
have engineers located throughout the<br />
United States to provide you with<br />
technical and sales support.<br />
Hamamatsu Corporation<br />
360 Foothill Road<br />
Bridgewater, NJ 08807<br />
TelepHone<br />
(908) 231-0960<br />
Fax<br />
(908) 231-1539<br />
e-mail<br />
usa@hamamatsu.com<br />
Web siTe<br />
sales.hamamatsu.com<br />
Chief Spectroscopic Techniques Supported<br />
⦁ UV–visible spectroscopy<br />
⦁ IR spectroscopy<br />
⦁ Raman spectroscopy<br />
⦁ Mass spectroscopy<br />
⦁ Atomic absorption spectroscopy<br />
Markets Served<br />
Hamamatsu provides high performance devices for<br />
analytical instruments. These include detectors and light<br />
sources for use in UV–vis, NIR, Raman, TOF-MS, and other<br />
spectrometers. We also provide miniature spectrometers<br />
for medical and biological research, environmental<br />
monitoring, production and process control, semiconductor<br />
inspection, chromatography, food analysis, water content<br />
measurement, and other industries.
56 SpectroScopy corporAte cApABILItIeS DECEMBER 2011 www.spectroscopyonline.com<br />
Glass Expansion<br />
Major Products/Services<br />
Nebulizers<br />
⦁ SeaSpray — High dissolved solids nebulizer<br />
⦁ MicroMist — Low uptake nebulizer for<br />
all ICPs<br />
⦁ Conikal — An industry standard<br />
⦁ Slurry — For slurries andsSuspensions<br />
⦁ DuraMist — Routine high-precision HF<br />
analyses<br />
⦁ OpalMist — Ideal for geochemistry and<br />
semiconductor industry<br />
⦁ VeeSpray — Handles high particle and<br />
TDS loads best<br />
Glass expansion<br />
4 Barlows Landing Road<br />
Unit #2A<br />
Pocasset, MA 02559<br />
TelepHone<br />
(508) 563-1800<br />
(800) 208-0097<br />
Fax<br />
(508) 563-1802<br />
e-mail<br />
geusa@geicp.com<br />
Web siTe<br />
www.geicp.com<br />
YeaR Founded<br />
1985<br />
Company Description<br />
Glass Expansion has been manufacturing sample introduction<br />
components for ICP emission and mass spectrometers since<br />
the early 1980s. Today we support both new and old instruments<br />
for 16 different manufacturers, representing sample<br />
introduction systems for over 50 different ICP-AES and ICP-MS<br />
models. Glass Expansion has developed unique and proprietary<br />
manufacturing methods, which have resulted in the<br />
production of components of high mechanical strength and<br />
micron-level dimensional accuracy to satisfy the narrowest of<br />
analytical specifications, each and every time. Our products<br />
are recognized worldwide for their excellent precision,<br />
cost-effectiveness, and reproducibility of results.<br />
Chief Spectroscopic Techniques Supported<br />
⦁ ICP-AES<br />
⦁ ICP-MS<br />
Markets Served<br />
Glass Expansion’s products are used widely in private and<br />
government analytical laboratories within agricultural,<br />
environmental, food, forensic, geological, metallurgical,<br />
petrochemical, and pharmaceutical industries. We support<br />
leading ICP models including Thermo Fisher, PerkinElmer,<br />
Teledyne Leeman, Agilent, SPECTRO Ametek, and Horiba<br />
J-Y. Whether you need just a nebulizer, a complete sample<br />
introduction system, or the answer for a tricky sample, we<br />
have the innovative, high-quality products and applications<br />
expertise to assist.<br />
Spray Chambers<br />
⦁ Tracey Cyclonic — An industry standard<br />
⦁ Twister Cyclonic — Reduces solvent<br />
load<br />
⦁ Cinnabar Cyclonic — Low-volume spray<br />
⦁ IsoMist programmable temperature<br />
spray chamber<br />
Torches<br />
⦁ Fully Demountable D-Torches<br />
⦁ Semi-Demountable Torches<br />
⦁ Fixed Quartz Torches<br />
RF Coils<br />
Replacement RF Coils with optional silver<br />
or gold coating.<br />
Accessories<br />
⦁ Niagara Plus and Assist – Enhanced<br />
productivity accessories<br />
⦁ Capricorn – Argon humidifier<br />
⦁ TruFlo – sample uptake monitor<br />
Facilities<br />
Today, Glass Expansion has two global<br />
offices located in Australia and the<br />
United States. Between our two offices<br />
and network of distributors, we service<br />
every region of the globe, 24 hours a<br />
day. This ensures you receive a rapid<br />
response and timely order deliveries<br />
each and every time.
What makes<br />
Glass Expansion<br />
different?<br />
We are the world leader in the design of ICP<br />
sample introduction systems. The ICP that<br />
you are using now almost certainly incorporates<br />
sample introduction components based on<br />
original Glass Expansion designs.<br />
We provide a unique no-risk guarantee.<br />
If you find one of our products unsuitable in<br />
any way, you can return it for a credit or refund.<br />
We have a full staff of technical people to<br />
assist you. We have our own laboratory with<br />
four ICP spectrometers (ICP-OES and ICP-MS)<br />
and you can count on expert advice on your<br />
application from our experienced technical staff.<br />
We provide rapid delivery. Most items are held<br />
in stock and we ship immediately after receiving<br />
your order.<br />
To request a copy of our catalog, or sign up for our newsletter, please vist our website:<br />
Glass Expansion<br />
4 Barlows Landing Road<br />
Unit 2A • Pocasset • MA 0255 , USA<br />
Toll Free Phone: 800 208 00 7<br />
Telephone: 508 563 1800<br />
Facsimile: 508 563 1802<br />
Email: geusa@geicp.com<br />
Web: www.geicp.com
58 SPECTROSCOPY CORPORATE CAPABILITIES DECEMBER 2011 www.spectroscopyonline.com<br />
Harrick Scientific Products, Inc.<br />
Major Products/Services<br />
Harrick Scientific offers the most complete<br />
line of spectroscopy sampling products,<br />
including:<br />
⦁ Video MVP — a diamond micro ATR<br />
accessory with built-in camera<br />
⦁ MVP Pro Star — an affordable<br />
monolithic diamond ATR accessory<br />
⦁ Praying Mantis — a diffuse reflectance<br />
accessory available with environmental<br />
chambers/reaction cells<br />
⦁ Seagull — a variable angle specular<br />
reflection and ATR accessory<br />
⦁ VariGATR — a variable angle grazing<br />
angle ATR accessory for monolayers on<br />
Gold and Silicon substrates<br />
⦁ FiberMate 2 — an interface between spectrometers<br />
and fiberoptic applications<br />
⦁ MultiLoop, Omni-Diff, and<br />
Omni-Spec — fiberoptic probes for ATR,<br />
diffuse reflection, and specular<br />
reflection<br />
⦁ A variety of liquid and gas transmission<br />
cells<br />
⦁ Custom design development<br />
Harrick Scientific<br />
Products, Inc.<br />
141 Tompkins Ave,<br />
2nd Floor<br />
Pleasantville, NY 10570<br />
TELEPHONE<br />
(800) 248-3847<br />
FAX<br />
(914) 747-7209<br />
E-MAIL<br />
info@harricksci.com<br />
WEB SITE<br />
www.harricksci.com<br />
NUMBER OF EMPLOYEES<br />
25<br />
YEAR FOUNDED<br />
1969<br />
Company Description<br />
Harrick Scientific Products specializes in designing and manufacturing<br />
instruments for optical spectroscopy. Since being established<br />
in 1969, Harrick Scientific has advanced the frontiers of<br />
optical spectroscopy through its innovations in all spectroscopic<br />
techniques. The founder of the company, Dr. N.J. Harrick, pioneered<br />
ATR (attenuated total reflection) spectroscopy and became<br />
the principal developer of this technique. Harrick Scientific<br />
offers a complete selection of sampling accessories, including<br />
both standard and custom designs, as well as an extensive line of<br />
optical elements.<br />
Chief Spectroscopic Techniques Supported<br />
⦁ Transmission<br />
⦁ Specular reflection<br />
⦁ Diffuse reflection<br />
⦁ ATR<br />
⦁ Fiberoptics<br />
Markets Served<br />
Harrick Scientific serves analytical markets worldwide. Harrick’s<br />
customers typically are from research or quality control laboratories<br />
of industrial, governmental, research, and academic institutions<br />
throughout the world. Industries served include chemical,<br />
electronic, pharmaceutical, forensics, and biomedical.<br />
Facilities<br />
Harrick Scientific Products is located 30<br />
miles north of New York City in Pleasantville,<br />
New York. Our products are also<br />
available through FT-IR and UV-Vis spectrometer<br />
manufacturers, as well as distributors<br />
in the United States and throughout<br />
the world.
www.spectroscopyonline.com<br />
Hellma USA, Inc.<br />
DECEMBER 2011 SPECTROSCOPY CORPORATE CAPABILITIES 59<br />
Hellma USA, Inc.<br />
80 Skyline Drive<br />
Plainview, NY 11803<br />
TELEPHONE<br />
(516) 939-0888<br />
WEB SITE<br />
www.hellmausa.com<br />
Mini process probe.<br />
Company Description<br />
Hellma GmbH & Co., founded<br />
in 1922, is the world market<br />
leader in cells, fiber optic<br />
probes, and optical components<br />
made of glass or quartz<br />
which are used for modern<br />
optical analysis. Hellma<br />
Analytics products are available<br />
worldwide through a network<br />
of Hellma Analytics sister companies<br />
and additional<br />
distribution agents.<br />
Major Products/Services<br />
Complete traceability and excellent reliability of measurement<br />
results — with UV–vis calibration standards<br />
from the accredited DKD calibration laboratory of<br />
Hellma<br />
With the accreditation according to DIN EN ISO 17025, Hellma<br />
Analytics is one of the leading accredited calibration laboratories<br />
that produce and certify liquid and glass calibration filters made<br />
for testing spectrophotometers. Increased security and quality<br />
demands among laboratories require an improved traceability<br />
of measurement results to an internationally approved standard.<br />
An accreditation according to DIN EN ISO 17025 ensures the<br />
traceability of calibrations carried out to references of the NIST, by<br />
which an international correlation of measurement results is<br />
assured. Thus, procedures in laboratories gain greater transparency<br />
and improved protection of their measurement results.<br />
Fiber–optical systems<br />
The development of fiber-optical systems has caused a small<br />
revolution in chemical analysis. This technology makes it possible<br />
to carry out photometric measurements not only under<br />
laboratory conditions with cells, but also outside the lab.<br />
Through the development of fiber-optic probes, analysis has<br />
moved directly to the process for measurements with continuous<br />
measurements possible without sampling. This allows for<br />
better control of ongoing processes with much less effort.<br />
TrayCell — Micro Volume Analysis for sample volume<br />
of 0.5 µL to 10 µL<br />
Even in classical analysis the specialists at Hellma Analytics are always<br />
setting new standards. One of the most recent examples: the<br />
fiber-optic ultra-micro measuring cell “TrayCell,” which allows accurate<br />
analysis of DNA, RNA, or proteins in sample volumes of as<br />
low as 0.5 μL. The dimensions of the TrayCell are equivalent to a<br />
standard cell in order to work in all common spectrophotometers.<br />
Features:<br />
⦁ Unique fiber optic ultra-micro measuring cell<br />
⦁ Works with 0.5 μL to 10 μL sample volume<br />
⦁ A single drop measuring sample is<br />
sufficient<br />
⦁ High precision and reproducibility<br />
⦁ Dilution is not necessary<br />
Modern Flow Cytometry requires<br />
highest standards<br />
The heart of every flow cytometer is a<br />
small quartz glass flow channel providing<br />
reliable stability of the fluidic system and<br />
precise optical analysis of single cells. Due<br />
to sophisticated technologies Hellma is<br />
able to manufacture customer specified<br />
channel dimensions down to 50 μm ×<br />
50 μm with any outside dimension and<br />
highly polished surfaces.<br />
Custom Designed Products<br />
In addition to the large range of standard<br />
products, Hellma Analytics also manufactures<br />
special cells and other precision optical<br />
parts according to customer’s specifications.<br />
Hellma Analytics has more than 90 years<br />
experience in the field of glass machining<br />
and fabrication. Our specialists can carry out<br />
complex tasks and give full and competent<br />
advice regarding design ideas and any<br />
alternative possibilities.<br />
Analysis in space — processing at<br />
the cutting edge of technology<br />
A close collaboration with research institutes,<br />
universities, and scientific institutions is<br />
important for Hellma Analytics’ outstanding<br />
engineering competence. Based on this<br />
extensive know-how in processing<br />
techniques, Hellma Analytics is able to find<br />
unique solutions. Excellent examples of<br />
achievements are the individually designed,<br />
custom-made cells being used in the<br />
International Space Station (ISS) or those<br />
which were used in physics research that led<br />
to the winning of the Nobel Prize in 1997<br />
and 2001.
60 SPECTROSCOPY CORPORATE CAPABILITIES DECEMBER 2011 www.spectroscopyonline.com<br />
HORIBA Scientific<br />
Markets Served<br />
⦁ Academia<br />
⦁ Bio<br />
⦁ Chemicals<br />
⦁ Environmental<br />
⦁ Forensic science<br />
⦁ Life sciences<br />
⦁ Medical<br />
⦁ Metals<br />
⦁ Nanotechnology<br />
⦁ OEM<br />
⦁ Optoelectronics<br />
⦁ Paint/Pigments<br />
⦁ Petroleum<br />
⦁ Pharmaceuticals<br />
⦁ Photovoltaics<br />
⦁ Plastics, polymers, etc.<br />
⦁ Semiconductors<br />
⦁ WEEE/RoHS<br />
HORIBA Scientific<br />
3880 Park Avenue<br />
Edison, NJ 08820<br />
TELEPHONE<br />
(732) 494-8660<br />
FAX<br />
(732) 494-5125<br />
E-MAIL<br />
info.sci@horiba.com<br />
WEB SITE<br />
www.horiba.com/scientific<br />
NUMBER OF EMPLOYEES<br />
USA: 700<br />
Elsewhere: 5000<br />
YEAR FOUNDED<br />
1819<br />
Company Description<br />
HORIBA Scientific is the world-leading manufacturer of high performance<br />
optical spectroscopy instrumentation and components.<br />
Our spectrometers offer unsurpassed sensitivity, precision, performance<br />
and features as a consequence of our 194 years of history<br />
and expertise. HORIBA Scientific offers our customers the highest<br />
quality products and solutions, supported by a global network of<br />
scientists, engineers, technicians and customer service professionals.<br />
We are ready to be your partner whether you require components,<br />
custom solutions, OEM solutions and analytical, process or<br />
research spectrometers.<br />
HORIBA Scientific is part of the HORIBA Group, which employs<br />
over 5000 people worldwide, with annual sales in excess of $1.5<br />
billion. Some of our well-known and respected brand names include<br />
HORIBA Jobin Yvon, Sofie, Dilor, Spex ® , and IBH.<br />
Chief Spectroscopic Techniques Supported<br />
⦁ Molecular fluorescence spectroscopy<br />
⦁ Optical spectroscopy<br />
⦁ Raman spectroscopy and microscopy<br />
⦁ Ellipsometry and thin film analysis<br />
⦁ Atomic emission spectroscopy<br />
⦁ Fluorescence<br />
⦁ Forensic science<br />
Major Products/Services<br />
⦁ <strong>Spectroscopy</strong> and analysis<br />
⦁ Elemental analyzers<br />
⦁ Ellipsometers<br />
⦁ End-point detectors<br />
⦁ Fluorescence<br />
⦁ Gratings<br />
⦁ ICP & GD spectrometers<br />
⦁ Lifetime fluorescence<br />
⦁ Microscopy<br />
⦁ OEM components<br />
⦁ Particle size analyzers<br />
⦁ Process control<br />
⦁ Raman & FT-IR<br />
⦁ Spectrographs<br />
⦁ Spectrometers and CCDs<br />
⦁ TCSPC<br />
⦁ VUV equipment<br />
⦁ X-Ray fluorescence<br />
⦁ Surface Plasmon Resonance Imaging<br />
(SPRi)<br />
Facilities<br />
HORIBA Scientific manufactures quality<br />
instruments in Edison, New Jersey, as well<br />
as in France and Japan.<br />
Sales, service, and applications facilities<br />
are located around the world. We are an<br />
ISO 9001:2008-certified company.
www.spectroscopyonline.com DECEMBER 2011 SpectroScopy corporAte cApABILItIeS 61<br />
International Centre for Diffraction Data<br />
international Centre for<br />
diffraction data<br />
12 Campus Boulevard<br />
Newtown Square, PA 19073<br />
TelepHone<br />
(610) 325-9814<br />
Fax<br />
(610) 325-9823<br />
e-mail<br />
infox@icdd.com<br />
Web siTe<br />
www.icdd.com<br />
YeaR Founded<br />
1941<br />
Company Description<br />
ICDD is a non-profit scientific organization dedicated to collecting,<br />
editing, publishing, and distributing powder diffraction<br />
data for the identification of crystalline materials. Our mission<br />
is to continue to be the world center for quality diffraction<br />
and related data to meet the needs of the technical community.<br />
We promote the application of materials characterization<br />
methods in science and technology by providing forums<br />
for the exchange of ideas and information. We sponsor the<br />
Pharmaceutical Powder X-ray Diffraction Symposium (PPXRD),<br />
Denver X-ray Conference; its proceedings, Advances in X-ray<br />
Analysis and the journal, Powder Diffraction. ICDD and its<br />
members conduct workshops and clinics on materials characterization<br />
at our headquarters in Newtown Square, Pennsylvania<br />
and at X-ray analysis conferences around the world.<br />
Chief Spectroscopic Techniques Supported<br />
⦁ X-ray Diffraction<br />
⦁ Electron Diffraction<br />
⦁ Electron Backscatter Diffraction<br />
Markets Served<br />
The Powder Diffraction File is designed for materials identification<br />
and characterization. ICDD databases are used worldwide<br />
by scientists in academia, government, and industry who<br />
are actively engaged in the field of X-ray powder diffraction<br />
and related disciplines.<br />
Major Products/Services<br />
PDF-4+ 2011 is our advanced database<br />
with comprehensive material coverage<br />
for inorganic materials. The database is a<br />
powerful tool for phase identification using<br />
physical, chemical, and crystallographic<br />
data. It contains numerous features such<br />
as 316,291 data sets, digitized patterns,<br />
molecular graphics and atomic parameters.<br />
Many new features have been<br />
incorporated into PDF-4+ to enhance the<br />
ability to do quantitative analysis by any<br />
of three methods: Rietveld Analysis, Reference<br />
Intensity Ratio (RIR) method, or Total<br />
Pattern Analysis. PDF-4+ also offers a<br />
suite of electron diffraction tools including<br />
electron diffraction powder pattern simulations,<br />
an interactive spot pattern simulation,<br />
and an electron diffraction backscatter<br />
pattern simulation module.
62 SpectroScopy corporAte cApABILItIeS DECEMBER 2011 www.spectroscopyonline.com<br />
Iridian Spectral Technologies Ltd.<br />
Company Description<br />
Leader in optical filter solutions, Iridian, is a coating company that works with you in finding cost effective<br />
solutions to your problems. We are one of the leading companies for Raman, confocal fluorescence and<br />
flow cytometry filters. Our coatings reach from UV to LWIR of the optical spectrum. Our dielectric thin-films<br />
provide long term durability and reliability with industry leading optical performance. We provide filters from<br />
small prototype volumes to large volume productions. We are a reliable partner, with high quality standards<br />
and excellent customer service. Our product is state-of-the-art and we set high value on innovation.<br />
Chief Spectroscopic Techniques Supported<br />
⦁ Raman spectroscopy<br />
⦁ Confocal fluorescence microscopy<br />
⦁ Flow cytometry<br />
Markets Served<br />
We are a global supplier who addresses the worldwide need of optical filters for OEMs and individual end<br />
users through direct sales support offered and sales through local distribution channels in Europe and Asia.<br />
Iridian provides optical filters and coating services to a wide variety of industrial and research sectors. We are<br />
a global supplier for applications in telecommunications, spectroscopy (Raman, fluorescence, flow cytometry)<br />
and the entertainment industry (filter wheels, glasses for 3D cinema).<br />
iridian spectral<br />
Technologies ltd.<br />
1200 Montreal Rd.<br />
Bldg. M50<br />
Ottawa, Ontario, Canada<br />
TelepHone<br />
(613) 741-4513<br />
Major Products/Services<br />
We offer optical filters and coatings, for UV, visible, and IR applications. Our dielectric thin-film filters provide<br />
long term durability and reliability with industry leading optical performance. Get more signal with less<br />
background with our optical filters for Raman spectroscopy. We provide pass band transmittances of >90%,<br />
exceptional edge steepness, and blocking of >OD6. Capture better images with our single or multi-band<br />
filters for fluorescence spectroscopy and microscopy and flow cytometry. Our filters have high transmission<br />
with sharp cutoffs and excellent isolation providing brighter imaging and improved image contrast.<br />
Facility<br />
Iridian’s operations are located in Canada’s capital: Ottawa, Ontario. Our offices/headquarters and our<br />
manufacturing plant occupy a total space of 40,778 ft 2 out of which: 27,328 square feet is manufacturing<br />
area. We are a Canadian manufacturer.<br />
Fax<br />
(613) 741-9986<br />
e-mail<br />
inquiries@iridian.ca<br />
Web siTe<br />
www.iridian.ca<br />
numbeR oF emploYees<br />
ouTsiTe usa: 124<br />
YeaR Founded<br />
1998
64 SpectroScopy corporAte cApABILItIeS DECEMBER 2011 www.spectroscopyonline.com<br />
International Crystal Laboratories<br />
optics; KBr powder; liquid and gas transmission<br />
cells; cuvettes for UV–vis, NIR, and<br />
fluorescence spectroscopy; solid sampling<br />
accessories such as mills, mortars and<br />
pestles, lab presses, and dies for making<br />
KBr pellets for IR spectroscopy; and briquets<br />
for XRF spectroscopy.<br />
Facility<br />
ICL provides customer support at our state<br />
of the art manufacturing plant in Garfield,<br />
New Jersey. We maintain several FT-IR and<br />
UV–vis spectrophotometers for product<br />
quality control. Our plant is now serviced<br />
by a 150 KWH backup generator which<br />
guarantees that we are able to be productive<br />
at all times.<br />
international Crystal<br />
laboratories<br />
11 Erie Street<br />
Garfield, NJ 07026<br />
TelepHone<br />
(973) 478-8944<br />
Fax<br />
(973) 478-4201<br />
e-mail<br />
iclmail@optonline.net<br />
Web siTe<br />
www.internationalcrystal.net<br />
numbeR oF emploYees<br />
25<br />
YeaR Founded<br />
1962<br />
Company Description<br />
ICL is a fully integrated materials technology company that<br />
manufactures IR crystal optics and spectroscopy accessories.<br />
It is the only US manufacturer of KBr, NaCl, and KCl crystals.<br />
KBr beam splitters are an essential component of all FT-IR<br />
spectrophotometers. ICL is a highly regarded vendor to instrument<br />
manufacturers and has received numerous honors such<br />
as “Vendor of the Year” from instrument manufacturers for<br />
on time, defect free product deliveries. ICL is engaged in R&D<br />
projects with major research laboratories, including ongoing<br />
projects with Brookhaven National Laboratory.<br />
Chief Spectroscopic Techniques Supported<br />
⦁ IR<br />
⦁ FT-IR<br />
⦁ UV–vis<br />
⦁ Fluorescence<br />
⦁ XRF<br />
Markets Served<br />
ICL supplies a broad range of optics, supplies, and accessories<br />
for spectroscopy to end-users, dealers, catalog vendors, and<br />
instrument manufacturers worldwide. Customers can access<br />
ICL’s products on-line, through extensive catalogs and a network<br />
of more than 75 dealers who service customers in most<br />
markets throughout the world.<br />
Major Products/Services<br />
ICL products enable spectroscopists to make the most out of<br />
modern spectroscopic instruments. Products include IR crystal
www.spectroscopyonline.com<br />
Meinhard<br />
DECEMBER 2011 SPECTROSCOPY CORPORATE CAPABILITIES 65<br />
Meinhard<br />
700 <strong>Corporate</strong> Circle, Suite L<br />
Golden, Colorado 80401<br />
TELEPHONE<br />
(800) 634-6427<br />
FAX<br />
(303) 279-5156<br />
E-MAIL<br />
sales@meinhard.com<br />
WEB SITE<br />
www.meinhard.com<br />
NUMBER OF EMPLOYEES<br />
25<br />
YEAR FOUNDED<br />
1974<br />
Company Description<br />
Sample introduction components and accessories for ICP-OES<br />
and ICP-MS. Since 1974, Meinhard is the leading manufacturer<br />
of concentric nebulizers in borosilicate glass and quartz. The topperforming<br />
microconcentric High Efficiency Nebulizer operates at<br />
5 to 300 µL/min and 90, 120, 150, or 170 psi for 1 L/min carrier.<br />
A new sample collection device, the ALPXS, is an aerosol-to-liquid<br />
particle extraction system which puts atmospheric particulates directly<br />
into suspension for ICP analysis. As a division of Elemental<br />
Scientific, Meinhard products are available through a worldwide<br />
network of distributors.<br />
Chief Spectroscopic Techniques Supported<br />
⦁ ICP-OES<br />
⦁ ICP-MS<br />
Markets Served<br />
⦁ Agricultural<br />
⦁ Environmental<br />
⦁ Manufacturing<br />
⦁ Materials<br />
⦁ Metals<br />
⦁ Mining<br />
⦁ Petroleum<br />
⦁ Pharmaceuticals<br />
⦁ R & D<br />
Major Products/Services<br />
Nebulizers:<br />
⦁ HEN – highest sensitivity available, and<br />
low liquid flow<br />
⦁ Plus Series – combine the high sensitivity<br />
A-type nozzle with low dead volume for<br />
fast stabilization and rinse-out<br />
⦁ A-type – highest sensitivity in a conventional<br />
nebulizer<br />
⦁ C-type – high solids tolerance<br />
⦁ K-type – high solids tolerance with reduced<br />
carrier flow<br />
Spray Chambers:<br />
⦁ For all ICP instruments, with custom<br />
designs available<br />
Torches:<br />
⦁ For all ICP instruments, with custom designs<br />
available<br />
Accessories:<br />
⦁ ALPXS self-contained, portable air sampler<br />
⦁ Peristaltic pump tubing<br />
Facility<br />
Precision manufacturing of quartz and<br />
glass consumables for ICP-OES and<br />
ICP-MS.
66 SpectroScopy corporAte cApABILItIeS DECEMBER 2011 www.spectroscopyonline.com<br />
Moxtek, Inc.<br />
Major Products/Services<br />
⦁ ProFlux Wiregrid Polarizers — High<br />
transmission and contrast inorganic<br />
polarizers for UV, visible, and IR<br />
applications.<br />
⦁ MAGNUM Miniature X-ray Sources —<br />
The leading X-ray source technology for<br />
handheld and bench top X-ray analysis<br />
applications.<br />
⦁ XPIN Detectors — The latest generation<br />
of affordable Si-PIN detectors for X-ray<br />
fluorescence spectrometry.<br />
⦁ AP3 and ProLINE Windows — Ultrathin<br />
polymer windows for energy and<br />
wavelength dispersive spectroscopy.<br />
⦁ DuraBeryllium Windows — The most<br />
rugged and reliable beryllium windows<br />
available for X-ray applications.<br />
⦁ MX Series JFET — The lowest noise JFET<br />
available for X-ray detection systems.<br />
Moxtek, inc.<br />
452 W 1260 N<br />
Orem, UT 84057<br />
Telephone<br />
(801) 225-0930<br />
Fax<br />
(801) 221-1121<br />
e-Mail<br />
moxtek@moxtek.com<br />
Web siTe<br />
www.moxtek.com<br />
nuMber oF eMployees<br />
142<br />
year Founded<br />
1986<br />
Company Description<br />
We are a leading supplier of X-ray and optical components<br />
for analytical instrumentation and display electronics.<br />
Products include the new XPIN high-performance Si-<br />
PIN X-ray detectors; MAGNUM ® miniature low-power<br />
X-ray sources; AP3 and DuraBeryllium ® X-ray windows<br />
for EDS; ProLINE windows for WDS; and ProFlux ® wiregrid<br />
polarizers and beam splitters for UV, visible, and<br />
IR spectroscopy. Moxtek is well known for advanced<br />
technology, innovative solutions, and excellent<br />
customer service.<br />
Chief Spectroscopic Techniques Supported<br />
⦁ Energy dispersive X-ray spectroscopy<br />
⦁ Wavelength dispersive X-ray spectroscopy<br />
⦁ X-ray diffraction<br />
⦁ Microanalysis<br />
⦁ UV, visible, IR spectrometry<br />
Markets Served<br />
Moxtek, Inc. serves the analytical instrumentation and<br />
projection display markets.<br />
Wiregrid polarizer
68 SPECTROSCOPY CORPORATE CAPABILITIES DECEMBER 2011 www.spectroscopyonline.com<br />
Milestone Inc.<br />
⦁ Commercial testing<br />
⦁ Petrochemical<br />
⦁ Environmental<br />
⦁ Academic<br />
Major Products/Services<br />
⦁ Ethos EZ — the most advanced closed<br />
vessel microwave digestion system<br />
⦁ UltraWAVE — single reaction chamber microwave<br />
digestion in a benchtop package<br />
⦁ UltraCLAVE — single reaction chamber microwave<br />
digestion — ultimate throughput<br />
⦁ DMA-80 — direct mercury analysis with<br />
results in 6 min<br />
⦁ DuoPUR — on demand acid purification<br />
⦁ TraceCLEAN — automated acid reflux<br />
cleaning system<br />
⦁ PYRO — fast, microwave ashing<br />
Milestone Inc.<br />
25 Controls Drive<br />
Shelton, CT 06484<br />
TELEPHONE<br />
(886) 995-5100<br />
FAX<br />
(203) 925-4241<br />
E-MAIL<br />
mwave@milestonesci.com<br />
WEB SITE<br />
www.milestonesci.com<br />
www.milestonesrl.com<br />
NUMBER OF EMPLOYEES<br />
30 (in the US)<br />
100 (outside the US)<br />
YEAR FOUNDED<br />
1988<br />
Company Description<br />
Today’s laboratories are challenged to process more samples at<br />
lower detection levels with fewer available resources. Often the<br />
limitations of the existing sample preparation approach creates a<br />
“bottleneck” in productivity. At Milestone our full suite of<br />
microwave sample prep productivity tools are backed by over<br />
50 patents and 20 years of industry expertise to break these<br />
bottlenecks by providing safe, reliable, and flexible platforms to<br />
enhance your productivity. The key to Milestone’s technological<br />
leadership lies in bringing together individuals from diverse<br />
scientific and engineering disciplines to solve real world problems<br />
with innovative microwave instrumentation. This philosophy has<br />
enabled Milestone to develop an extraordinary range of products<br />
from an unmatched portfolio of over 30 patents.<br />
Over 15,000 customers worldwide look to Milestone to improve<br />
their metals digestions, organic extractions, mercury analysis, and<br />
synthetic chemistry processes. We partner with our customers to<br />
meet their challenges now, and well into the future.<br />
Chief Spectroscopic Techniques Supported<br />
⦁ ICP mass spectrometry (ICP-MS)<br />
⦁ Inductively coupled plasma (ICP-OES)<br />
⦁ Atomic absorption ( AA)<br />
⦁ Mercury analysis<br />
Markets Served<br />
⦁ Pharmaceutical<br />
⦁ Clinical<br />
⦁ Food testing<br />
Facility<br />
Milestone’s Global HQ is based in Bergamo,<br />
Italy with manufacturing and R&D facilities<br />
in Germany and Switzerland. We support<br />
our global customers through direct offices<br />
in China, Japan, Korea, as well as distributor<br />
networks in 70 countries.<br />
Milestone’s North American Headquarters<br />
are located in Shelton, Connecticut to provide<br />
applications, technical, and customer<br />
service support to our clients. Our stocking<br />
facilities are managed for immediate<br />
turn around for consumables, accessories,<br />
and service parts. Our applications lab is<br />
equipped with a full range of productivity<br />
tools and a team of application chemists to<br />
provide customer demonstrations as well<br />
as method development. With a service and<br />
support team to complement our field sales<br />
team, Milestone can look after customer<br />
needs locally.
www.spectroscopyonline.com DECEMBER 2011 SpectroScopy corporAte cApABILItIeS 69<br />
Nippon Instruments North America<br />
requirements. These analyzers provide<br />
simple, highly effective results for such<br />
methods as EPA 245.1.<br />
⦁ Model RA-3420 Mercury Analyzer:<br />
A unique analyzer that performs the<br />
typical EPA Method 245.1 analysis in<br />
a fully automatic sequence, including<br />
sample preparation.<br />
⦁ Model PE-1000 Mercury Analyzer:<br />
A specifically designed mercury analyzer<br />
for direct, automated analysis of<br />
mercury in liquid and gaseous hydrocarbons.<br />
nippon instruments<br />
north america<br />
1511 Texas Ave S #270<br />
College Station, TX 77840<br />
Telephone<br />
(979) 774-3800<br />
Fax<br />
(979) 774-3807<br />
e-Mail<br />
sales@hg-nic.us<br />
Web siTe<br />
www.hg-nic.us<br />
nuMber oF eMployees<br />
19<br />
year Founded<br />
2003<br />
Company Description<br />
Nippon Instruments North America is the regional office for<br />
Nippon Instruments Corporation-Japan. Nippon Instruments<br />
has over 30 years of experience in the design and manufacture<br />
of high-quality mercury analyzers. With an absolute focus<br />
on mercury analyzers, Nippon Instruments offers mercury<br />
analyzers for just about every application. From systems for<br />
most EPA methods to direct mercury analyzers to online<br />
monitoring systems to specially designed systems for the petrochem<br />
industry, Nippon Instruments has a mercury analyzer<br />
for your laboratory.<br />
Chief Spectroscopic Techniques Supported<br />
⦁ Atomic absorption spectroscopy<br />
⦁ Atomic fluorescence spectroscopy<br />
Markets Served<br />
Nippon Instruments provides mercury analyzers for EPA compliance<br />
monitoring in the environmental, government, and<br />
industrial markets. We provide highly versatile systems for the<br />
research and education markets, as well as mercury analyzers<br />
that are specifically designed for the unique tasks of the industrial<br />
and petrochem markets.<br />
Major Products/Services<br />
⦁ Model MA-2000 Mercury Analyzer: A direct mercury<br />
analyzer that allows for mercury analysis of just about any<br />
matrix without the need for sample preparation.<br />
⦁ Model RA-3000 Series Mercury Analyzers: Mercury analyzers<br />
with several configurations available to fit various budget<br />
Facilities<br />
Nippon Instruments North America is in<br />
the final stages of building a new office in<br />
College Station, Texas, in order to continue<br />
to expand our capabilities. Nippon Instruments<br />
Corporation currently maintains offices<br />
in Osaka and Tokyo, Japan, as well as<br />
an additional office in Singapore.
70 SpectroScopy corporAte cApABILItIeS DECEMBER 2011 www.spectroscopyonline.com<br />
Ocean Optics<br />
students’ learning experience. You can find<br />
Ocean Optics products in virtually any application<br />
from food safety to forensics and<br />
from semiconductors to marine biology.<br />
ocean optics<br />
830 Douglas Ave.<br />
Dunedin, FL 34698<br />
Telephone<br />
(727) 733-2447<br />
Fax<br />
(727) 733-3962<br />
e-Mail<br />
info@oceanoptics.com<br />
Web siTe<br />
www.oceanoptics.com<br />
nuMber oF eMployees<br />
250<br />
year Founded<br />
1989<br />
Company Description<br />
Ocean Optics is the inventor of the world’s first miniature<br />
spectrometer and has specified and delivered nearly 200,000<br />
of them over the past 20 years. The company provides solutions<br />
for diverse applications of optical sensing in medical<br />
and biological research, environmental regulation, science<br />
education, production and process control. Ocean Optics also<br />
provides a comprehensive range of complementary technologies,<br />
including chemical sensors, metrology instrumentation,<br />
optical fibers, probes, filters and many more spectroscopic<br />
peripherals and accessories. Our spectrometers and sensors<br />
also are ideal for OEM applications — with modular options<br />
that meet virtually any application requirement.<br />
Chief Spectroscopic Techniques Supported<br />
Absorbance, transmission, reflectance, irradiance, fluorescence,<br />
Raman, UV-vis, NIR, spectroradiometry, color spectroscopy,<br />
laser-induced breakdown spectroscopy (LIBS), fiber<br />
optic chemical sensing, flow injection analysis, elemental<br />
analysis, end-point detection, headspace monitoring, laser<br />
characterization, nondestructive testing, multispectral imaging.<br />
Markets Served<br />
Ocean Optics’ technologies can be found in a diverse range of<br />
industries and disciplines. Our products are used by innovators,<br />
researchers, scientists, OEMs, medical and health care<br />
professionals and manufacturing facilities in every country on<br />
the planet. Military and security concerns have incorporated<br />
Ocean Optics technologies into their equipment and science<br />
educators have made our equipment an integral part of their<br />
Major Products/Services<br />
Spectrometers: UV-vis/NIR, high-resolution,<br />
time-gated fluorescence, spectrofluorometers,<br />
absorbance, laser-induced<br />
breakdown, LED measurement, reflectometer,<br />
Raman, remote sensing, field<br />
measurement<br />
OEM offerings: Spectrometers, sensors,<br />
fibers, and sub-assemblies for embedding<br />
into OEM applications<br />
Optical sensors: Oxygen sensors, pH sensors,<br />
temperature sensing, and transducing<br />
materials<br />
Sampling accessories: Collimating<br />
lenses, cuvettes and holders, standards,<br />
filters and holders, flow cells, cosine correctors,<br />
integrating spheres<br />
Light sources: Deuterium, tungsten halogen,<br />
LED, calibration sources, excitation<br />
sources, lasers<br />
Optical fiber and probes: Premiumgrade<br />
assemblies, bare fiber, custom<br />
options, reflection, transmission and temperature<br />
probes, vacuum feedthroughs,<br />
complete fiber kits<br />
Facility<br />
Ocean Optics is headquartered in<br />
Dunedin, Florida, and has full-service<br />
locations in Europe, Latin America and the<br />
People’s Republic of China. Ocean Optics<br />
is part of Halma, p.l.c., a safety and<br />
environmental technology group<br />
domiciled in the United Kingdom.
72 SpectroScopy corporAte cApABILItIeS DECEMBER 2011 www.spectroscopyonline.com<br />
OI Analytical<br />
Major Products/Services<br />
OI Analytical provides instruments for<br />
spectroscopic analysis including:<br />
⦁ iTOC-CRDS Isotopic Carbon Analyzer<br />
⦁ IonCam Mass Spectrometer<br />
⦁ IonCam 2020 Transportable GC–MS<br />
⦁ IonCCD Array Detector<br />
⦁ DA 3500 Discrete Analyzer<br />
⦁ FS 3100 Automated Chemistry Analyzer<br />
Facilities<br />
OI Analytical operates research and manufacturing<br />
sites in College Station, Texas<br />
and Birmingham, Alabama occupying<br />
88,000 square feet.<br />
oi analytical<br />
151 Graham Road<br />
P.O. Box 9010<br />
College Station, TX 77842<br />
Telephone<br />
(979) 690-1711<br />
(800) 653-1711<br />
Fax<br />
(979) 690-0440<br />
e-Mail<br />
oimail@oico.com<br />
Web siTe<br />
www.oico.com<br />
nuMber oF eMployees<br />
135<br />
year Founded<br />
1969<br />
Company Description<br />
OI Analytical designs, manufactures, markets, and supports<br />
analytical instruments used for sample preparation, detection,<br />
and measurement of chemical compounds and elements. OI<br />
Analytical is based in College Station, Texas, with a second<br />
facility in Birmingham, Alabama.<br />
Chief Spectroscopic Techniques Supported<br />
⦁ Total organic carbon-cavity ring down spectroscopy (TOC-<br />
CRDS)<br />
⦁ Mass spectrometry<br />
⦁ Gas chromatography–mass spectrometry (GC–MS)<br />
⦁ Discrete analysis<br />
⦁ Flow injection analysis (FIA)<br />
⦁ Segmented flow analysis (SFA)<br />
Markets Served<br />
Principal markets/industries served include environmental<br />
testing, drinking and wastewater treatment, chemicals and<br />
petrochemicals, pharmaceuticals, food and beverage, homeland<br />
security, and chemical weapons demilitarization.
www.spectroscopyonline.com<br />
OptiGrate Corp.<br />
DECEMBER 2011 SPECTROSCOPY CORPORATE CAPABILITIES 73<br />
OptiGrate Corp.<br />
3267 Progress Drive<br />
Orlando, FL 32826<br />
TELEPHONE<br />
(407) 381-4115<br />
FAX<br />
(407) 384-5995<br />
E-MAIL<br />
info@optigrate.com<br />
WEB SITE<br />
www.optigrate.com<br />
NUMBER OF EMPLOYEES<br />
30<br />
YEAR FOUNDED<br />
1999<br />
Company Description<br />
OptiGrate Corp designs and manufactures ultra-narrow band<br />
optical filters based on volume Bragg grating (VBG) technologies<br />
in proprietary photo-thermo-refractive glass. Filters with<br />
bandwidth as low as 30 pm are formed by holographic techniques<br />
in the bulk of glass material, and demonstrate superior<br />
optical quality, outstanding durability, environmental stability,<br />
and high optical damage threshold. OptiGrate is a pioneer<br />
and world leader in VBG technologies and, for over 10 years,<br />
OptiGrate has delivered holographic optical elements (HOE) to<br />
a large number of government contractors and OEMs in optoelectronics,<br />
analytical, medical, defense, and other industries.<br />
Markets<br />
OptiGrate supplied ultra narrow band filters to hundreds of<br />
customers on 5 continents. These filters are used for: Raman<br />
spectroscopy and microscopy; semiconductor, solid state,<br />
and fiber lasers; hyperspectral and Raman imaging systems;<br />
ultrafast laser systems; optical recording and storage; medical<br />
diagnostics and treatment; etc.<br />
Optical Density<br />
760 770 780 790 800 810<br />
1E+00<br />
1E+01<br />
1E+02<br />
1E+03<br />
1E+04<br />
1E+05<br />
1E+06<br />
1E+07<br />
1E+08<br />
Wavelength [nm]<br />
TFF Notch<br />
2x BNF<br />
Main Product Lines<br />
⦁ Ultra-narrow band optical notch and<br />
bandpass filters with linewidth less than<br />
10 cm -1<br />
⦁ Laser resonator mode selection filters/<br />
mirrors for spectral narrowing and thermal<br />
stabilization of lasers<br />
⦁ Deflectors — transmitting volume Bragg<br />
gratings for angular filtering and deflection<br />
of laser light<br />
⦁ Chirped volume Bragg gratings for compact<br />
and robust stretchers and compressors<br />
of ultra-short laser pulses<br />
⦁ Spectral beam combiner — angular<br />
and spectral filters for high-power laser<br />
spectral beam combining<br />
Facilities<br />
OptiGrate designs, develops, and makes<br />
all products in Orlando, Florida. The<br />
volume Bragg grating filters are manufactured<br />
in a unique, vertically integrated<br />
facility that includes photosensitive glass<br />
production facility, holographic facility,<br />
and laser development facility. Opti-<br />
Grate’s internal capability to develop,<br />
fine-tune, and mass produce photosensitive<br />
glass, the core of VBG technology,<br />
provides better process control and<br />
stability and also enables fabrication of<br />
filters with record characteristics.<br />
Ultra-narrow band BragGrate optical filters enable Raman shift measurements to 5 cm -1<br />
Optical Density<br />
784.5 784.75 785 785.25 785.5<br />
1E+00<br />
1E+02<br />
1E+04<br />
1E+06<br />
1E+08<br />
Wavelength [nm]
74 SpectroScopy corporAte cApABILItIeS DECEMBER 2011<br />
Optometrics Corporation<br />
www.spectroscopyonline.com<br />
optometrics Corporation<br />
8 Nemco Way<br />
Ayer, MA 01432<br />
Telephone<br />
(978) 772-1700<br />
Fax<br />
(978) 772-0017<br />
e-Mail<br />
sales@optometrics.com<br />
Web siTe<br />
www.optometrics.com<br />
nuMber oF eMployees<br />
45<br />
year Founded<br />
1969<br />
Company Description<br />
Optometrics has a distinguished 40 year history of manufacturing<br />
and providing optical components, in particular diffraction<br />
gratings and interference filters, for a wide range of spectroscopic<br />
and laser applications. Optometrics’ goal is to provide advanced<br />
optical components and systems for use in wavelength selection<br />
applications. Products include diffraction gratings, interference<br />
filters, components for military and civilian sighting and ranging<br />
equipment, monochromators, and ruled and holographic wire<br />
grid polarizers and beamsplitters. Optometrics caters, in particular,<br />
to the needs of its OEM customers by offering special services<br />
such as kanban stocking, bar coding capabilities, custom packaging<br />
programs, and higher level pre-aligned optical assemblies.<br />
Chief Spectroscopic Techniques Supported<br />
⦁ UV, Visible, IR spectrometry<br />
⦁ Infrared (including FT-IR)<br />
⦁ Fluorescence<br />
⦁ Raman spectroscopy<br />
⦁ Laser<br />
⦁ Liquid chromatography–mass spectrometry<br />
⦁ High performance liquid chromatography<br />
⦁ Color spectroscopy<br />
Markets Served<br />
⦁ Life sciences<br />
⦁ Scientific & analytical instrumentation<br />
⦁ FT-IR accessories<br />
⦁ Environmental & process monitoring<br />
⦁ Homeland security<br />
⦁ Scientific research<br />
⦁ Military<br />
⦁ Laser manufacturers<br />
Major Products/Services<br />
⦁ Diffraction gratings, ruled & holographic,<br />
originals or replicated, reflection and<br />
transmission<br />
⦁ Interference filters from 334–1650 nm<br />
⦁ Ruled & holographic wire grid<br />
polarizers<br />
⦁ Laser gratings<br />
⦁ Monochromators<br />
⦁ Tunable light sources<br />
⦁ Light sources, sample compartments,<br />
stepper motor controllers<br />
⦁ Components for military and civilian<br />
sighting and ranging equipment<br />
⦁ Beamsplitters<br />
⦁ Steep edge laser line longpass filters<br />
⦁ Laser safety eyewear coatings<br />
Facilities<br />
Optometrics’ facility in Ayer, Massachusetts<br />
contains space for offices, engineering,<br />
R&D, and production. Equipment that supports<br />
our broad range of capabilities include<br />
four metal vacuum coating systems,<br />
three filter vacuum systems, two ionassisted<br />
hard coat vacuum systems, three<br />
grating ruling engines, two holographic<br />
laboratories, full replication and lamination<br />
facilities as well as full assembly,<br />
alignment, and test facilities.<br />
A Dynasil Company
www.spectroscopyonline.com<br />
Oriel ® Instruments<br />
DECEMBER 2011 SpectroScopy corporAte cApABILItIeS 75<br />
Major Products/Services<br />
⦁ Light sources from low to high power<br />
and UV to IR<br />
⦁ Monochromators<br />
⦁ Light detection systems (single point<br />
and array based)<br />
⦁ Spectrographs<br />
⦁ Spectrometers<br />
⦁ Photovoltaic metrology devices<br />
⦁ Solar simulators<br />
⦁ Various components designed to make,<br />
manage, and measure light.<br />
Facility<br />
Located in Stratford, Connecticut, including<br />
dedicated engineering, sales,<br />
and manufacturing.<br />
oriel instruments<br />
150 Long Beach Blvd.<br />
Stratford, CT 06615<br />
Telephone<br />
(203) 377-8282<br />
Fax<br />
(203) 378-2457<br />
e-Mail<br />
oriel.sales@newport.com<br />
Web siTe<br />
www.newport.com/Oriel<br />
nuMber oF eMployees<br />
65 (Stratford, CT facility)<br />
nuMber oF WorldWide<br />
2500<br />
year Founded<br />
1965<br />
Company Description<br />
Oriel Instruments, a Newport Corporation brand, was founded<br />
in 1965 and delevoped a reputation as an innovative supplier<br />
of products for the making and measuring of light. Today, the<br />
Oriel brand provides sophisticated broad band light sources<br />
covering the range from UV to IR, pulsed or continuous, and<br />
low to high power. Oriel also offers monochromators,<br />
spectrographs, and a flexible modular FT-IR spectrometer, for<br />
users across many industries with diverse applications. Oriel is<br />
a leader in photovoltaics metrology products with its<br />
offering of solar simulators and quantum efficiency<br />
measurement tools. Oriel brings innovative products and solutions<br />
to Newport Corporation customers around the world.<br />
Chief Spectroscopic Techniques Supported<br />
⦁ UV–vis spectroscopy<br />
⦁ NIR spectroscopy<br />
⦁ FT-IR spectroscopy<br />
Markets Served<br />
⦁ Research<br />
⦁ Industrial manufacturing<br />
⦁ Pharmaceuticals<br />
⦁ Food sciences<br />
⦁ Life and health sciences<br />
⦁ Microelectronics<br />
⦁ Aerospace<br />
⦁ Defense
76 SPECTROSCOPY CORPORATE CAPABILITIES DECEMBER 2011<br />
Parker Hannifin Corporation<br />
Filtration and Separation Division<br />
www.spectroscopyonline.com<br />
Parker Hannifin<br />
Corporation<br />
Filtration and Separation<br />
Division<br />
242 Neck Road<br />
Haverhill, MA 01835<br />
TELEPHONE<br />
(978) 858-0505<br />
FAX<br />
(978) 556-7501<br />
WEB SITE<br />
www.labgasgenerators.com<br />
NUMBER OF EMPLOYEES<br />
55,000<br />
YEAR FOUNDED<br />
1924<br />
Company Description<br />
Safety: Parker Balston gas generators completely eliminate the<br />
safety hazards involved with handling high-pressure gas cylinders.<br />
Enjoy hassle-free automation with no tanks to change<br />
and no downtime.<br />
Reliability: Thousands of laboratories worldwide have Parker<br />
Balston gas generators in routine use. Parker Balston gas generators<br />
are recommended and used by major instrument manufacturers.<br />
We offer the best technology at an affordable price from<br />
the brand you trust.<br />
Quality: Each Parker Balston gas generator is manufactured<br />
under a strict total quality management program. We have a<br />
world-class ISO 9001-certified manufacturing facility in the United<br />
States. All Parker Balston gas generators are backed by a complete<br />
satisfaction guarantee. Parker offers preventative maintenance,<br />
extended warranties, and field repair programs for all laboratory<br />
gas generators, as well as a network of highly specialized sales,<br />
aplication, and technical support people.<br />
Parker offers preventative maintenance, extended warranties and<br />
Products: Hydrogen gas generators produce 99.99999% pure<br />
hydrogen for gas chromatographs. Zero air generators produce<br />
zero grade air for gas chromatographs. UHP nitrogen generators<br />
produce 99.9999% pure nitrogen for GCs or ICP spectrometers.<br />
FT-IR gas generators produce dry, CO 2<br />
-free purge gas for FT-IR<br />
spectrometers. Pure air and nitrogen generators produce dry,<br />
ultrapure compressed gas for laboratory instruments, including<br />
LC–MS instruments.<br />
Chief Spectroscopic Techniques<br />
Supported<br />
⦁ Optical<br />
⦁ Atomic<br />
⦁ Infrared<br />
⦁ Mass universal<br />
⦁ Hyphenated techniques<br />
Markets Served<br />
⦁ Agriculture<br />
⦁ Biotechnology<br />
⦁ Chemicals<br />
⦁ Chemical and explosives detection<br />
⦁ Energy<br />
⦁ Environmental<br />
⦁ Inorganic chemicals<br />
⦁ Instrument development<br />
⦁ Life science<br />
⦁ Organic chemicals<br />
⦁ Paints and coatings<br />
⦁ Petrochemicals<br />
⦁ Pharmaceuticals<br />
⦁ Plastics<br />
Major Products/Services<br />
Gas generators for the following analytical<br />
instruments:<br />
⦁ Gas chromatographs<br />
⦁ LC–MS<br />
⦁ FT-IR spectrometers<br />
⦁ ICP emission spectrometers<br />
⦁ TOC analyzers<br />
⦁ Atomic absorption spectrophotometers<br />
⦁ Nuclear magnetic resonance (NMR)<br />
⦁ Rheometers/thermal analyzers<br />
⦁ Sample evaporators/concentrators<br />
Facilities<br />
Parker Hannifin manufactures all gas generator<br />
products in Haverhill, Massachusetts.<br />
Distribution points stretch across the United<br />
States and worldwide, including Canada, the<br />
UK, China, India, Germany, France, Japan, and<br />
Singapore. Parker is pleased to announce<br />
that the Filtration & Separation Division,<br />
Balston Operation has been recommended<br />
for ISO4001:2004 certification by DNV.
www.spectroscopyonline.com<br />
DECEMBER 2011 SPECTROSCOPY CORPORATE CAPABILITIES 77<br />
PHOTONIS USA<br />
PHOTONIS USA<br />
Sturbridge Business Park<br />
660 Main Street<br />
Sturbridge, MA 01566<br />
TELEPHONE<br />
(508) 347-4000<br />
(800) 648-1800<br />
FAX<br />
(508) 347-3849<br />
E-MAIL<br />
sales@usa.photonis.com<br />
WEB SITE<br />
www.photonis.com<br />
NUMBER OF EMPLOYEES<br />
USA: 150<br />
Elsewhere: 900<br />
YEAR FOUNDED<br />
1937<br />
Company Description<br />
PHOTONIS is a leading developer,<br />
manufacturer, and<br />
supplier of scientific detector<br />
products and components<br />
for scientific and analytical<br />
instrumentation systems. We<br />
specialize in ion, electron,<br />
and photon detection with<br />
unrivaled expertise in designing<br />
and delivering standard<br />
and custom products to<br />
meet the most demanding<br />
applications.<br />
Our engineering and<br />
manufacturing expertise<br />
delivers solutions for virtually<br />
every detection application.<br />
With the PHOTONIS<br />
worldwide manufacturing<br />
capability and support network, we can both design and<br />
manufacture your most challenging detection needs.<br />
Chief Spectroscopic Techniques Supported<br />
⦁ Mass spectrometry<br />
⦁ Time of flight MS<br />
⦁ Raman spectroscopy<br />
⦁ Nuclear spectroscopy<br />
⦁ UV and X-ray spectroscopy<br />
⦁ Charged particle imaging<br />
⦁ Electron microscopy<br />
⦁ Residual gas analysis/leak detection<br />
⦁ E-beam/X-ray lithography<br />
⦁ Luminescence<br />
⦁ Fluorescence<br />
⦁ Atomic absorption<br />
⦁ Deep UV/X-ray optics<br />
Markets Served<br />
PHOTONIS detection products are found in most of today’s<br />
high technology-based markets, including scientific and<br />
analytical instrumentation, medical diagnostics, chemistry,<br />
scientific research, life sciences, space and geophysical<br />
exploration, environmental and process monitoring, homeland<br />
security, control, and communications.<br />
Major Products/Services<br />
⦁ Micro pore optics<br />
⦁ Channeltron ® electron multipliers<br />
⦁ MAGNUM ® electron multipliers<br />
⦁ Long-Life microchannel plates<br />
⦁ Time-of-flight MCP detectors<br />
⦁ MCP detector assemblies<br />
⦁ FieldMaster ion guides and<br />
drift tubes<br />
⦁ Glass capillary arrays<br />
⦁ Resistive glass products<br />
⦁ Electron generator arrays<br />
⦁ MCP-based pmts<br />
⦁ Image intensifier tubes<br />
⦁ Intensified camera units<br />
⦁ Hybrid photo detectors<br />
⦁ Streak tubes<br />
⦁ High voltage power supplies<br />
⦁ Power tubes<br />
⦁ Neutron and gamma detectors<br />
⦁ Glass-coated wire<br />
⦁ Flexible fiber optics<br />
Facilities<br />
PHOTONIS in Sturbridge, Massachusetts<br />
manufactures Channeltron ® electron<br />
multipliers, microchannel plates, MCP<br />
detectors, ion guides, prototype detectors,<br />
and other custom glass products.<br />
The Lancaster, Pennsylvania facility<br />
manufactures power tubes and other<br />
related products. PHOTONIS in Roden,<br />
Netherlands manufactures image intensifier<br />
tubes, intensified camera units,<br />
and hybrid photo detectors. PHOTONIS<br />
in Brive, France manufactures image intensifier<br />
tubes and related products.
78 SpectroScopy corporAte cApABILItIeS DECEMBER 2011 www.spectroscopyonline.com<br />
PerkinElmer, Inc.<br />
⦁ Mass spectrometry: ICP-MS, GC–MS,<br />
LC–MS<br />
⦁ Molecular spectroscopy: FT-IR and<br />
FT-NIR, UV–vis and UV–vis–NIR, Raman<br />
spectroscopy, fluorescence spectroscopy<br />
⦁ Thermal analysis: DSC, TGA, STA, DMA<br />
⦁ Organic elemental analysis: CHN/O,<br />
CHNS/O<br />
⦁ Consumables: Atomic spectroscopy,<br />
chromatography, molecular spectroscopy,<br />
thermal analysis, elemental<br />
analysis<br />
⦁ OneSource ® Laboratory Services<br />
Major Products/Services<br />
PerkinElmer, Inc. offers a wide breadth<br />
of instrumentation and solutions to meet<br />
your analytical measurement needs.<br />
Company Description<br />
PerkinElmer is a global scientific leader providing an extensive<br />
range of technology solutions and services to address the<br />
most critical issues facing humanity. From critical research and<br />
prenatal screening to environmental testing and industrial<br />
monitoring, we’re actively engaged in improving health and<br />
enhancing quality of life all around the world.<br />
Facility<br />
PerkinElmer, Inc. operates globally in 150<br />
countries.<br />
perkinelmer, inc.<br />
940 Winter Street<br />
Waltham, MA 02451<br />
Telephone<br />
(203) 925-4602<br />
Fax<br />
(203) 944-4904<br />
e-Mail<br />
as.info@perkinelmer.com<br />
Web siTe<br />
www.perkinelmer.com<br />
nuMber oF eMployees<br />
3400 (in the US)<br />
3600 (outside the US)<br />
year Founded<br />
1937<br />
Chief Spectroscopic Techniques Supported<br />
⦁ Atomic absorption<br />
⦁ Inductively coupled plasma (ICP-OES and ICP-AES)<br />
⦁ ICP mass spectrometry (ICP-MS)<br />
⦁ Infrared (FT-IR and FT-NIR) spectroscopy<br />
⦁ UV–vis and UV–vis–NIR<br />
⦁ Raman spectroscopy<br />
Markets Served<br />
PerkinElmer is a leading provider of precision instrumentation,<br />
reagents and chemistries, software, and services for a<br />
wide range of scientific and industrial laboratory applications,<br />
including environmental monitoring, food and beverage quality/safety,<br />
and chemical analysis, as well as genetic screening,<br />
drug discovery, and development.<br />
⦁ Atomic spectroscopy: AA, ICP-OES, ICP-MS<br />
⦁ Chromatography: GC and GC custom solutions, GC–MS,<br />
HPLC and UHPLC, LC–MS<br />
⦁ Hyphenated techniques: HPLC–ICP-MS, GC–ICP-MS, HS-<br />
GC, HS-GC–MS, TD-GC, TD-GC–MS, TG-IR, TG-MS, TG-GC–<br />
MS, DSC-Raman
©2011 PerkinElmer, Inc. 400222_02. All rights reserved. PerkinElmer ® is a registered trademark of PerkinElmer, Inc. All other trademarks are the property of their respective owners.<br />
NexION 300 ICP-MS<br />
The NexION 300 ICP-MS: Three Modes Of Operation. One High-Performance Instrument. Nothing keeps<br />
your laboratory moving forward like the revolutionary NexION® 300 ICP-MS. With three modes of operation (Standard,<br />
Collision and Reaction), it’s the only instrument of its kind that can adapt as your samples, analytical needs or data<br />
requirements change. Experience unparalleled flexibility. Enjoy unsurpassed stability. Optimize your detection limits<br />
and analysis times. The NexION 300 ICP-MS. Choose the simplest, most<br />
cost-efficient path from sample to results.<br />
See the NexION at PerkinElmer's Gateway—www.perkinelmer.com/gateway
80 SpectroScopy corporAte cApABILItIeS DECEMBER 2011<br />
PerkinElmer, Inc.<br />
www.spectroscopyonline.com<br />
perkinelmer, inc.<br />
940 Winter Street<br />
Waltham, MA 02451<br />
Telephone<br />
(203) 925-4602<br />
Fax<br />
(203) 944-4904<br />
e-Mail<br />
as.info@perkinelmer.com<br />
Web siTe<br />
www.perkinelmer.com<br />
nuMber oF eMployees<br />
3100 (in the US)<br />
3800 (outside the US)<br />
year Founded<br />
1937<br />
Company Description<br />
PerkinElmer is a global scientific leader providing an extensive<br />
range of technology solutions and services to address the<br />
most critical issues facing humanity. From critical research and<br />
prenatal screening to environmental testing and industrial<br />
monitoring, we’re actively engaged in improving health and<br />
enhancing quality of life all around the world.<br />
Chief Spectroscopic Techniques Supported<br />
⦁ Atomic absorption<br />
⦁ Inductively coupled plasma (ICP-OES and ICP-AES)<br />
⦁ ICP mass spectrometry (ICP-MS)<br />
⦁ Infrared (FT-IR & FT-NIR) spectroscopy<br />
⦁ UV-vis & UV-vis-NIR<br />
⦁ Raman spectroscopy<br />
Markets Served<br />
PerkinElmer is a leading provider of precision instrumentation,<br />
reagents and chemistries, software, and services for a<br />
wide range of scientific and industrial laboratory applications,<br />
including environmental monitoring, food and beverage quality/safety,<br />
and chemical analysis, as well as genetic screening,<br />
drug discovery, and development.<br />
Major Products/Services<br />
PerkinElmer, Inc. offers a wide breadth<br />
of instrumentation and solutions to meet<br />
your analytical measurement needs:<br />
⦁ Atomic spectroscopy: AA, ICP-OES,<br />
ICP-MS<br />
⦁ Chromatography: GC & GC Custom Solutions,<br />
GC–MS, HPLC & UHPLC<br />
⦁ Hyphenated techniques: HPLC–ICP-MS,<br />
GC–ICP-MS, HS-GC, HS-GC–MS, TD-GC,<br />
TD-GC–MS, TG-IR, TG-MS, TG-GC–MS,<br />
DSC-Raman<br />
⦁ Mass spectrometry: ICP-MS, GC–MS,<br />
LC–MS<br />
⦁ Molecular spectroscopy: FT-IR & FT-NIR,<br />
UV–vis & UV–vis–NIR, Raman spectroscopy,<br />
fluorescence spectroscopy<br />
⦁ Thermal analysis: DSC, TGA, STA, DMA<br />
⦁ Organic elemental analysis: CHN/O,<br />
CHNS/O<br />
⦁ Consumables: Atomic spectroscopy,<br />
chromatography, molecular spectroscopy,<br />
thermal analysis, elemental<br />
analysis<br />
⦁ OneSource ® Laboratory Services<br />
Facilities<br />
PerkinElmer, Inc. operates globally in 150<br />
countries.
© 2010 PerkinElmer, Inc. 400219_01. All trademarks or registered trademarks are the property of PerkinElmer, Inc. and/or its subsidiaries.<br />
IR READY<br />
TO GO<br />
IR spectrometry just got easier. With Spectrum Two, you<br />
can perform fast analyses anytime, anywhere. Bringing<br />
laboratory performance to non-laboratory environments,<br />
Spectrum Two assures the quality of your materials across multiple applications.<br />
Easy to use, powerful, compact and robust, it’s ideally suited to everyday<br />
measurements. Rely on 65 years of spectroscopy experience to help you protect<br />
www.perkinelmer.com/spectrumtwo
82 SpectroScopy corporAte cApABILItIeS DECEMBER 2011 www.spectroscopyonline.com<br />
PIKE Technologies<br />
⦁ Automation and temperature control<br />
are available for many of our spectroscopy<br />
accessories to speed sampling and<br />
to provide precise thermal analysis.<br />
Markets Served<br />
PIKE products are designed for molecular spectrometers<br />
in the petrochemical, food, forensic,<br />
biochemical, pharmaceutical, semiconductor,<br />
agriculture, and material science industries. In<br />
addition, PIKE specializes in custom design of<br />
products for specific applications. PIKE products<br />
are designed and built with craftsmanship and<br />
care to exceed customer expectations. Visit our<br />
new website and take advantage of our unique<br />
and interactive Crystal Properties Chart and FT-<br />
IR Calculators.<br />
piKe Technologies<br />
6125 Cottonwood Drive<br />
Madison, WI 53719<br />
Telephone<br />
(608) 274-2721<br />
Fax<br />
(608) 274-0103<br />
e-Mail<br />
sales@piketech.com<br />
Web siTe<br />
www.piketech.com<br />
nuMber oF eMployees<br />
42<br />
year Founded<br />
1989<br />
Company Description<br />
PIKE Technologies was established in the summer of 1989, specializing<br />
in the development and manufacture of accessories and<br />
optical systems that enhance the performance of commercial<br />
spectrometers. PIKE concentrates on making the life of laboratory<br />
personnel easier. This is achieved through replacing traditional,<br />
tedious sampling routines with a range of innovative products<br />
and techniques.<br />
Chief Spectroscopic Techniques Supported<br />
PIKE products are designed to work with FT-IR and molecular<br />
spectometers and are based upon the principles of transmission<br />
and reflection spectroscopy measurements. The sampling techniques<br />
offered can be divided into seven major groups:<br />
⦁ Attenuated total reflectance (ATR), for analysis of liquids,<br />
pastes, and soft solid materials.<br />
⦁ Diffuse reflectance (DRIFTS), used in sampling of powders and<br />
solids.<br />
⦁ Specular reflectance, useful in thin film composition and thickness<br />
measurements.<br />
⦁ Microsampling products, FT-IR microscope and beam condensers<br />
to analyze microsamples.<br />
⦁ Integrating spheres, NIR, and Mid-IR versions for FT-IR<br />
spectrometers.<br />
⦁ Transmission supplies, including IR optics, and windows of all<br />
sizes and designs.<br />
Major Products/Services<br />
⦁ MIRacle TM Patented “universal”<br />
sampling accessory - Diamond, ZnSe,<br />
Ge, Si, and AMTIR crystals<br />
⦁ GladiATR TM and GladiATR Vision TM -<br />
Highest performance diamond ATR<br />
⦁ VeeMax TM patented variable angle<br />
specular reflection<br />
⦁ ATR Max TM used for variable depth of<br />
penetration experiments and studies.<br />
⦁ A wide range of fully automated FT-IR<br />
and NIR products with easy to integrate<br />
AutoPRO TM software<br />
⦁ Valu-Line TM Kits combining the most<br />
often used sampling accessories and<br />
transmission kits containing sampling<br />
holders, cells, and optics<br />
⦁ Long Path Gas Cells — 2.4 to 20 m,<br />
heating available.<br />
Facility<br />
PIKE Technologies is located in Madison,<br />
Wisconsin. We distribute direct to our customers<br />
worldwide and OEM worldwide for<br />
packaging with spectrometers of all manufacturers.<br />
Please call or visit our website for<br />
additional contact and product information.
<strong>Spectroscopy</strong> Sampling Solutions<br />
Whether your samples are precious or ordinary, large or small,<br />
hard or soft, liquid or solid, pure or contaminated, PIKE<br />
accessories provide ways and means for their analysis.<br />
We specialize in ATR, diffuse and specular reflectance,<br />
micro sampling, temperature control and sampling<br />
automation. We also provide custom solutions.<br />
Contact us to order the PIKE catalog (or get it on line)<br />
for the complete picture…<br />
FTIR, NIR and UV-Vis sampling made easier<br />
www.piketech.com<br />
sales@piketech.com<br />
tel: 608-274-2721
84 SPECTROSCOPY CORPORATE CAPABILITIES DECEMBER 2011 www.spectroscopyonline.com<br />
Polymicro Technologies,<br />
A subsidiary of Molex Incorporated<br />
Major Products/Services<br />
Polymicro manufactures multimode,<br />
step-index fused silica optical fiber with<br />
polyimide, silicone, acrylate, and other<br />
buffers/coatings; hard clad optical fiber;<br />
dual clad optical fiber; highly stable deep<br />
UV optical fiber; broad spectrum optical<br />
fiber; fiber optic cables and assemblies;<br />
high-strength, high-temperature flexible<br />
fused-silica capillary tubing; light-guiding<br />
capillary; flow cells; square capillary<br />
tubing; windowed capillary tubes; UV<br />
transparent capillary; precision silica and<br />
quartz rods and “cleaved to length” tubing<br />
pieces; multilumen tubing; and microcomponents<br />
such as laser machined<br />
fiber tips, ferrules, sleeves, and laser cut<br />
rods or tubing.<br />
Polymicro Technologies,<br />
A subsidiary of Molex<br />
Incorporated<br />
18019 North 25th Avenue<br />
Phoenix, AZ 85023<br />
TELEPHONE<br />
(602) 375-4100<br />
FAX<br />
(602) 375-4110<br />
E-MAIL<br />
polymicrosales@molex.com<br />
WEB SITE<br />
www.polymicro.com<br />
NUMBER OF EMPLOYEES<br />
115<br />
YEAR FOUNDED<br />
1984<br />
Company Description<br />
For over a quarter century, (since 1984), Polymicro Technologies<br />
delivers CREATIVE . . . INNOVATIVE . . . SOLUTIONS<br />
for the aerospace, analytical, astronomy, automotive, biodefense,<br />
biotechnology, communications, energy, manufacturing,<br />
medical, military, and pharmaceutical industries.<br />
Polymicro is the leader in providing specialty optical fibers<br />
and capillary tubing world wide.<br />
Chief Spectroscopic Techniques Supported<br />
⦁ <strong>Spectroscopy</strong>, UV to mid-IR<br />
⦁ Sensors<br />
⦁ Analytical detectors<br />
⦁ Laser light delivery<br />
⦁ Remote illumination<br />
⦁ Astronomy spectral analysis<br />
Markets Served<br />
Polymicro’s optical fiber, capillary tubing, fiber optic assemblies,<br />
and fiber and tubing arrays are commonly used in academic<br />
labs, national labs, and industry. Polymicro products<br />
find use in aerospace, analytical, astronomy, automotive, biodefense,<br />
biotechnology, communications, energy, manufacturing,<br />
medical, military, and pharmaceutical. Typical applications<br />
include spectroscopy, sensing, analytical detection and analysis,<br />
laser light delivery, remote illumination, process and quality<br />
monitoring and control, in addition to unique applications<br />
from astronomy and aerospace to your laboratory bench.<br />
Facilities<br />
Polymicro has 50,000 sq. ft. of facility<br />
located in the North Phoenix area. At our<br />
location we have several draw towers<br />
that produce a large portion of capillary<br />
tubing and multimode step-index fibers<br />
used throughout the world. Polymicro<br />
has its own glass laboratory, assembly<br />
department, laser machining department,<br />
and sophisticated testing equipment to<br />
meet our customers’ needs for the highest<br />
quality products and service.<br />
To get your copy of our handbook or<br />
inquire about our products, simply e-mail<br />
our technical sales department at<br />
polymicrosales@molex.com. Or you can<br />
fax us at (602) 375-4110.
www.spectroscopyonline.com DECEMBER 2011 SpectroScopy corporAte cApABILItIeS 85<br />
Rigaku Corporation<br />
rigaku Corporation<br />
4-14-4, Sendagaya<br />
Tokyo 151-0051, JAPAN<br />
Telephone<br />
+1(281) 362-2300<br />
Fax<br />
+1(281) 364-3628<br />
e-Mail<br />
info@Rigaku.com<br />
Web siTe<br />
www.Rigaku.com<br />
nuMber oF eMployees<br />
US: 400<br />
Outside US: 700<br />
year Founded<br />
1951<br />
Company Description<br />
Since its inception in 1951, Rigaku has been at the forefront<br />
of analytical and industrial instrumentation technology. Today,<br />
with hundreds of major innovations to their credit, the Rigaku<br />
Group of Companies are world leaders in the fields of protein<br />
and small molecule X-ray crystallography, general X-ray diffraction<br />
(XRD and PXRD), X-ray spectrometry (EDXRF and WDXRF),<br />
X-ray optics, semiconductor metrology, Raman spectroscopy,<br />
automation, computed tomography, nondestructive testing,<br />
and thermal analysis.<br />
Chief Spectroscopic Techniques Supported<br />
⦁ X-ray spectrometry<br />
⦁ Raman spectroscopy<br />
⦁ Energy dispersive X-ray fluorescence (EDXRF)<br />
⦁ Wavelength dispersive X-ray fluorescence (WDXRF)<br />
⦁ Related: X-ray diffraction (XRD)<br />
⦁ Related: X-ray reflectometry (XRR)<br />
Markets Served<br />
Cement, petroleum, mining, refining, pulp and paper, wood<br />
treating, chemicals, pharmaceuticals, biotechnology, forensics,<br />
homeland security, defense, aerospace, energy, metals &<br />
alloys, life sciences, polymers and plastics, inks and dyes,<br />
cosmetics, nanomaterials, photovoltaics, semiconductors, chemistry,<br />
geology and minerals, physics, teaching, and academy.<br />
Major Products/Services<br />
⦁ NEX CG — Cartesian geometry EDXRF<br />
spectrometer<br />
⦁ NEX QC — low cost benchtop EDXRF<br />
analyzer<br />
⦁ Supermini — benchtop WDXRF<br />
spectrometer<br />
⦁ ZSX Primus — 4 kW sequential WDXRF<br />
spectrometer<br />
⦁ ZSX Primus II — 4 kW tube-above<br />
sequential WDXRF<br />
⦁ Simultix 14 — 3 kW (or optional 4 kW)<br />
simultaneous WDXRF spectrometer<br />
⦁ ZSX 400 — large sample sequential<br />
WDXRF spectrometer<br />
⦁ NANOHUNTER — benchtop total reflection<br />
XRF (TXRF)<br />
⦁ MiniFlex II — benchtop X-ray diffractometer<br />
(XRD)<br />
⦁ Xantus — family of portable Raman<br />
spectrometers<br />
⦁ FirstGuard — family of handheld Raman<br />
spectrometers<br />
Facility<br />
Based in Tokyo, Japan, Rigaku is a global<br />
organization with offices, laboratories, and<br />
production facilities around the world.<br />
Major production facilities are located in<br />
Auburn Hills, Michigan; Austin, Texas;<br />
Boston, Massachusetts; Carlsbad, California;<br />
Osaka, Japan; Prague, Czech Republic;<br />
Tokyo, Japan; Tucson, Arizona; The Woodlands,<br />
Texas, and Yamanashi, Japan.
86 SpectroScopy corporAte cApABILItIeS DECEMBER 2011 www.spectroscopyonline.com<br />
Shimadzu Scientific Instruments<br />
⦁ Compact, high-resolution UV-1800<br />
⦁ Easy-to-use UVmini-1240<br />
⦁ Bioscience-oriented BioSpec-mini<br />
⦁ Micro-volume (1 μL to 2 μL samples)<br />
BioSpec-nano<br />
⦁ Single monochromator UV-2600 with<br />
measurement capabilities to 1400 nm<br />
⦁ Double monochromator UV-2700 with<br />
absorbance level to 8 Abs<br />
⦁ Three-detector UV-3600 UV-VIS-NIR<br />
⦁ SolidSpec-3700 UV-VIS-NIR<br />
Shimadzu Scientific<br />
Instruments<br />
7102 Riverwood Drive<br />
Columbia, MD 21046<br />
Telephone<br />
(800) 477-1227<br />
(410) 381-1227<br />
Fax<br />
(410) 381-1222<br />
e-maIl<br />
webmaster@shimadzu.com<br />
Web SITe<br />
www.ssi.shimadzu.com<br />
number oF employeeS<br />
USA: 335<br />
Worldwide: 9600<br />
year Founded<br />
Shimadzu Scientific<br />
Instruments: 1975<br />
Shimadzu Corporation: 1875<br />
Company Description<br />
Shimadzu Scientific Instruments (SSI) is the North American<br />
subsidiary of Shimadzu Corp., headquartered in Kyoto, Japan.<br />
SSI was established in 1975 to provide analytical solutions to a<br />
wide range of laboratories in the Americas. With a vast installed<br />
base and preferred vendor status at many institutions, SSI’s<br />
instruments are used by top researchers across the globe, customers<br />
who can count on the stability, experience, and support<br />
only Shimadzu offers.<br />
Chief Spectroscopic Techniques Supported<br />
⦁ UV–vis<br />
⦁ FT-IR<br />
⦁ Fluorescence<br />
⦁ Atomic (AA/ICP)<br />
⦁ X-Ray (EDX/XRD/XRF)<br />
⦁ GC–MS<br />
⦁ LC–MS-MS<br />
Markets Served<br />
Shimadzu offers more spectroscopy instrumentation, with<br />
more software and accessory options, than any other company.<br />
This flexibility enables spectroscopists in virtually any<br />
laboratory, from biotechnology, pharmaceutical, and industrial<br />
to academic, forensic, and environmental, to select the instrument<br />
best suited to their application. Shimadzu provides free<br />
technical support for the life of the instruments and encourages<br />
customer alliances to further product development.<br />
Major Products/Services<br />
Shimadzu meets your needs for ruggedness, ease of<br />
use, validation, and applications with a variety of UV–vis<br />
spectrophotometers.<br />
FT-IR: Our robust, yet stable, FT-IR spectrophotometers<br />
deliver optimum performance,<br />
sensitivity, and reliability at an exceptional<br />
price, and we offer more of the<br />
sampling accessories you need, including<br />
an automated microscope.<br />
Fluorescence: High-performance spectrofluorophotometer<br />
handles a range of<br />
applications from routine analysis to high<br />
level R&D.<br />
AA/ICP: Simultaneous ICP and our series<br />
of high-quality AA spectrometers offer superior<br />
reliability, precision, sensitivity, and<br />
throughput to deliver maximum performance<br />
and value.<br />
X-ray: Our EDX/XRF/XRD systems are<br />
packed with powerful features to provide<br />
users with versatile, easy-to-use solutions.<br />
Facility<br />
Shimadzu’s U.S. headquarters includes<br />
customer service and technical support,<br />
as well as a customer training and education<br />
center. Ten regional facilities, strategically<br />
located around the U.S., provide<br />
customers with local sales, service, and<br />
technical support.
www.ssi.shimadzu.com<br />
Elevating Excellence in UV-Vis Analyses<br />
From Performance to Price, New Compact, Research-Grade<br />
UV-Vis Spectrophotometers Outclass the Competition<br />
With advanced optical systems engineered to<br />
substantially reduce stray light, Shimadzu’s<br />
new ultra-compact single-monochromator UV-<br />
2600 and double monochromator UV-2700<br />
spectrophotometers offer a number of highperformance<br />
and productivity-enhancing features<br />
to enable confident and convenient use for<br />
routine analysis as well as demanding research<br />
applications. At prices that can’t be beat.<br />
Shimadzu’s UV-2600/2700<br />
spectrophotometers feature:<br />
n<br />
n<br />
n<br />
n<br />
n<br />
n<br />
n<br />
High absorbance level to 8 Abs<br />
Wide measurement range to 1400 nm<br />
Ultra low stray light (0.00005 %T at 220 nm)<br />
Smallest footprint in their class<br />
USB connection<br />
Wide range of accessories and<br />
software packages available<br />
Unbelievable performance/price ratio<br />
For pharmaceutical and<br />
other applications requiring<br />
that hardware be validated,<br />
the UV-2600/2700 Series<br />
provides validation software<br />
as standard.<br />
You have demands. Shimadzu delivers.<br />
Learn more about Shimadzu’s UV-2600/2700.<br />
Call (800) 477-1227 or visit us online at<br />
www.ssi.shimadzu.com/262700<br />
SHIMADZU UV-2600/UV-2700<br />
Order consumables and accessories on-line at http://store.shimadzu.com<br />
Shimadzu Scientific Instruments Inc., 7102 Riverwood Dr., Columbia, MD 21046, USA
88 SpectroScopy corporAte cApABILItIeS DECEMBER 2011<br />
SPEX CertiPrep<br />
www.spectroscopyonline.com<br />
Spex Certiprep<br />
203 Norcross Ave.<br />
Metuchen, NJ 08840<br />
Telephone<br />
(800) 522-7739<br />
Fax<br />
(732) 603-9647<br />
e-maIl<br />
CRMSales@spexcsp.com<br />
Web SITe<br />
www.spexcertiprep.com<br />
year Founded<br />
1954<br />
Company Description<br />
SPEX CertiPrep is a leading manufacturer of Certified Reference<br />
Materials (CRMs) and calibration standards for analytical<br />
spectroscopy and chromatography. We offer a full range of<br />
inorganic CRMs for ICP, ICP-MS, and AA. We are certified by<br />
UL-DQS for ISO 9001:2008 and are proud to be accredited<br />
by A2LA under ISO 17025:2005 and ISO Guide 34-2009. The<br />
scope of our accreditation is the most comprehensive in the industry<br />
and encompasses all of our manufactured products. We<br />
also offer laboratories the option to create their own custom<br />
standards with quick turnaround times, at no additional cost.<br />
Chief Spectroscopic Techniques Supported<br />
⦁ ICP<br />
⦁ ICP-MS<br />
⦁ IC<br />
⦁ AA<br />
⦁ ISE<br />
⦁ XRF<br />
⦁ XRD<br />
Markets Served<br />
SPEX CertiPrep supplies inorganic Certified Reference<br />
Materials to laboratories worldwide in the following markets:<br />
research and development laboratories, environmental<br />
laboratories, wastewater treatment facilities, government<br />
agencies, industrial laboratories, clinical laboratories,<br />
pharmaceutical manufacturers, colleges and universities,<br />
public utilities, oil refineries, nuclear plants, and wineries,<br />
among others.<br />
Major Products/Services<br />
SPEX CertiPrep’s products include aqueous<br />
and organometallic Certified Reference<br />
Materials for ICP-MS, ICP, and AA; ion<br />
chromatography and ion selective electrode<br />
standards; and inorganic and organic<br />
quality control samples. We also manufacture<br />
a line of contamination control<br />
products including sub-boiling acid stills,<br />
a pipette washer, and OdorEroder odor<br />
control products. Our newest product offering<br />
is a line of consumer safety compliance<br />
standards, which includes standards<br />
for use with USP 232, a RoHS/WEEE check<br />
standard, and extractable metals in plastic<br />
toys standards. Our services include shipment<br />
of stock items within 24–48 h from<br />
our Metuchen, New Jersey facility. Technical<br />
customer service is available Monday<br />
through Friday 8:00 a.m. – 5:30 p.m. EST.<br />
Live chat, along with our complete product<br />
catalog and a technical knowledge base is<br />
also available on our website:<br />
www.spexcertiprep.com.<br />
Facility<br />
Our US headquarters is located in<br />
Metuchen, New Jersey. All of our products<br />
are manufactured and shipped from this<br />
facility. SPEX CertiPrep, Ltd. is the<br />
European subsidiary of SPEX CertiPrep,<br />
Inc. and is located in Middlesex, England.<br />
Distributors located throughout the world<br />
extend SPEX CertiPrep’s global reach.
www.spectroscopyonline.com<br />
Teledyne Leeman Labs<br />
DECEMBER 2011 SpectroScopy corporAte cApABILItIeS 89<br />
Teledyne leeman labs<br />
6 Wentworth Drive<br />
Hudson, NH 03051<br />
Telephone<br />
(603) 886-8400<br />
Fax<br />
(603) 886-9141<br />
e-maIl<br />
leemanlabsinfo@teledyne.com<br />
Web SITe<br />
www.teledyneleemanlabs.com<br />
number oF employeeS<br />
60<br />
year Founded<br />
1981<br />
Company Description<br />
Since its founding in 1981,<br />
Teledyne Leeman Labs has<br />
been an innovator in atomic<br />
spectroscopy and introduced<br />
many concepts that are now<br />
considered industry standards.<br />
Among these was the first use<br />
of an Echelle spectrometer<br />
and the first fully automated<br />
mercury analyzer.<br />
As a leading supplier of<br />
instruments for elemental<br />
analysis, we take great pride<br />
in the quality and value of our products and the depth of our<br />
commitment to our customers.<br />
Key <strong>Spectroscopy</strong> Techniques Offered<br />
⦁ Inductively coupled plasma (ICP) spectrometers<br />
⦁ DC Arc spectrometers<br />
⦁ Mercury analysis of liquids, solids and semi solids via cold<br />
vapor atomic absorption or atomic fluorescence<br />
Markets Served<br />
Leeman Lab’s products are used in applications essential to<br />
QA/QC, environmental analysis, research and development<br />
and commercial production. They are used in many industries<br />
including: aerospace, agriculture, automotive, beverage, biofuels,<br />
electronics, energy, environmental/contract labs, gas, food/food<br />
processing, forensics, geological, metals production, mining,<br />
nuclear, petrochemical, petroleum, pharmaceutical, wastewater<br />
and wear metals/oils.<br />
Major Products/Services<br />
Inductively Coupled Plasma Spectrometers (ICP)<br />
Prodigy is our most powerful and versatile ICP spectrometer.<br />
It brings together a state of the art large format, programmable<br />
array detector (L-PAD) with an advanced high dispersion Echelle<br />
spectrometer to provide exceptional analytical performance.<br />
Prism delivers performance and high sample throughput<br />
efficiency via a simultaneous array detector especially suitable<br />
for QA/QC and environmental analysis applications. Our<br />
Profile Plus<br />
ICP is an excellent step up from atomic absorption<br />
spectrometers and a highly cost effective solution for labs with<br />
moderate sample load.<br />
Mercury Analysis<br />
The Hydra II family of automated mercury analyzers operate<br />
on the principle of cold vapor atomic absorption (CVAAS)<br />
spectrometry or atomic fluorescence<br />
(CVAFS). The Hydra II analyzers can be<br />
configured to perform low (ppb to ppt) to<br />
ultra trace (
90 SpectroScopy corporAte cApABILItIeS DECEMBER 2011 www.spectroscopyonline.com<br />
Thermo Fisher Scientific<br />
Markets Served<br />
Our growing portfolio of products includes<br />
innovative technologies for a multitude<br />
of markets including food safety,<br />
environmental testing, materials science,<br />
and pharmaceutical.<br />
Major Products/Services<br />
Thermo Scientific spectroscopy instruments<br />
are ideal for investigative analysis<br />
or quality control applications.<br />
<strong>Spectroscopy</strong> systems are used to determine<br />
the molecular or elemental composition<br />
of a wide range of complex samples,<br />
including liquids, solids, and gases. We offer<br />
an expansive range of techniques, such<br />
as FT-IR, FT-NIR, infrared microsampling,<br />
Raman spectroscopy, AA, ICP, ICP-MS and<br />
ARL OES, XRD and XRF spectrometers.<br />
Thermo Fisher Scientific<br />
Instruments<br />
5225 Verona Road<br />
Madison, WI 53711<br />
Telephone<br />
(800) 532-4752<br />
Fax<br />
(608) 273-5046<br />
e-maIl<br />
analyze@thermofisher.com<br />
Web SITe<br />
www.thermoscientific.com<br />
Company Description<br />
Thermo Fisher Scientific is the world leader in serving science,<br />
enabling our customers to make the world healthier,<br />
cleaner, and safer. Our goal is to make our customers more<br />
productive and to enable them to solve their analytical challenges,<br />
from routine testing to complex research and discovery.<br />
We offer a wide range of products including analytical<br />
instruments, equipment, reagents and consumables, software,<br />
and services for research, analysis, discovery, and diagnostics.<br />
Our manufacturing sites in the United States and<br />
Europe provide products for customers within pharmaceutical<br />
and biotech companies, hospitals and clinical diagnostic<br />
labs, universities, research institutions, and government and<br />
environmental industries.<br />
Chief Spectroscopic Techniques Supported<br />
⦁ AA<br />
⦁ ICP<br />
⦁ ICP-MS<br />
⦁ Combustion analyzers<br />
⦁ FT-IR<br />
⦁ FT-NIR<br />
⦁ UV–vis<br />
⦁ Raman<br />
⦁ EDS/WDS/EBSD<br />
⦁ OES<br />
⦁ XRD<br />
⦁ XRF
www.spectroscopyonline.com<br />
DECEMBER 2011 SpectroScopy corporAte cApABILItIeS 91<br />
Waters<br />
Waters Corporation<br />
34 Maple Street<br />
Milford, MA 01757<br />
Telephone<br />
(508) 478-2000<br />
(800) 252-4752<br />
Fax<br />
(508) 872-1990<br />
Web SITe<br />
www.waters.com<br />
number oF employeeS<br />
USA: 2290<br />
Worldwide: 5200<br />
year Founded<br />
1958<br />
Company Description<br />
Waters Corporation, the premium<br />
brand in the analytical instruments<br />
industry since 1958, creates business<br />
advantages for laboratory-dependent<br />
organizations by delivering practical<br />
and sustainable scientific innovation<br />
to enable significant advancements<br />
in such areas as: healthcare delivery,<br />
environmental management, food<br />
safety, and water quality worldwide.<br />
Waters helps customers make profound<br />
discoveries, optimize laboratory<br />
operations, deliver product<br />
performance, and ensure regulatory<br />
compliance by providing a connected<br />
portfolio of separations and analytical<br />
science, laboratory informatics, mass<br />
spectrometry, as well as thermal analysis products.<br />
Chief Spectroscopic Techniques Supported<br />
⦁ UPLC ® –MS<br />
⦁ UPSFC<br />
⦁ LC–MS<br />
⦁ Mass spectrometry<br />
⦁ Informatics<br />
⦁ Supercritical fluid chromatography (SFC)<br />
⦁ Supercritical fluid extraction (SFE)<br />
⦁ Preparative LC<br />
⦁ Purification solutions<br />
⦁ Thermal analysis<br />
⦁ GC–MS<br />
⦁ Rheology<br />
⦁ Microcalorimetry<br />
⦁ Mycotoxin testing<br />
⦁ Proficiency testing<br />
Markets Served<br />
Waters drives decision-making and improves laboratory effectiveness<br />
within the life sciences, pharmaceutical, environmental,<br />
food and beverage, agriculture, clinical, and chemical industries<br />
by providing the tools to improve the quality of today’s science<br />
and explore the infinite possibilities of tomorrow’s.<br />
Major Products/Services<br />
Instruments<br />
⦁ ACQUITY UPLC ® systems<br />
⦁ ACQUITY UPLC ® H-Class systems<br />
⦁ ACQUITY UPLC ® I-Class systems<br />
⦁ nanoACQUITY UPLC ® with HDX technology<br />
⦁ Alliance ® HPLC systems<br />
⦁ Xevo ® mass spectrometers<br />
⦁ SYNAPT ® mass spectrometers<br />
⦁ PATROL UPLC ® Process Analyzer<br />
⦁ MassTrak Clinical Solutions<br />
⦁ MassTrak Forensic Solutions<br />
⦁ TRIZAIC UPLC ® systems<br />
Chemistries<br />
⦁ ACQUITY UPLC ® columns<br />
⦁ ACQUITY UPLC ® BEH Glycan columns<br />
⦁ ACQUITY UPLC ® CSH columns<br />
⦁ XSelect columns<br />
⦁ Viridis ® SFC columns<br />
⦁ XTerra ® columns<br />
⦁ XBridge columns<br />
⦁ Symmetry ® columns<br />
⦁ TRIZAIC UPLC nanoTile Technology<br />
⦁ Atlantis ® columns<br />
⦁ SunFire columns<br />
⦁ DisQuE sample extraction products<br />
⦁ Oasis ® sample extraction products<br />
⦁ Ostro sample preparation products<br />
⦁ TruView LCMS Certified Vials<br />
Informatics<br />
⦁ Empower chromatography software<br />
(21 CFR Part 11 compliant-ready)<br />
⦁ MassLynx MS software<br />
⦁ NuGenesis ® SDMS software<br />
Services and Support<br />
⦁ Empower -Driven Services<br />
⦁ Compliance Services (IQ,OQ,PQ)<br />
⦁ Waters Quality Parts ®<br />
⦁ Waters Global Services<br />
⦁ Educational Services<br />
Facilities<br />
Waters operates cGMP, ISO 13485: 2003,<br />
and ISO 9001-2008-certified manufacturing<br />
plants in Milford, Massachusetts<br />
(instruments and parts); Manchester, UK<br />
(mass spectrometers); Taunton,<br />
Massachusetts (chemistries); Wexford,<br />
Ireland (chemistries and mass spectrometers);<br />
Waters Milford facility is also<br />
approved for Part 1, Canadian Medical Device<br />
Regulations (CMDR). The company’s<br />
subsidiary, TA Instruments, Inc., is located<br />
in New Castle, Delaware.
92 SpectroScopy corporAte cApABILItIeS DECEMBER 2011 www.spectroscopyonline.com<br />
WITec GmbH<br />
Major Products/Services<br />
WITec alpha300 Confocal Raman<br />
Microscope: The alpha300 R is a Raman<br />
imaging system focusing on high-resolution<br />
as well as high-speed spectra and image<br />
acquisition. The acquisition time for a single<br />
Raman spectrum is in the range of 1 ms or<br />
even below; thus, a complete Raman image<br />
consisting of tens of thousands of spectra<br />
can be obtained in 1 min or less. Differences<br />
in chemical composition, although completely<br />
invisible in the optical image, will be<br />
apparent in the Raman image and can be<br />
analyzed with a resolution down to 200 nm.<br />
WITec Gmbh<br />
Main Address:<br />
Lise-Meitner-Str. 6, 89081<br />
Ulm, Germany<br />
WITec Instruments Corp.<br />
122 McCammon Ave.<br />
Maryville, TN 37804<br />
Telephone<br />
+49 (0) 731 140 700<br />
USA: (865) 984-4445<br />
Fax<br />
+49 (0) 731 140 7020<br />
USA: (865) 984-4441<br />
e-maIl<br />
info@witec.de<br />
Web SITe<br />
www.witec.de<br />
number oF employeeS<br />
35<br />
year Founded<br />
1997<br />
Company Description<br />
WITec is a manufacturer of high-resolution optical and scanning<br />
probe microscopy solutions for scientific and industrial<br />
applications. A modular product line allows the combination<br />
of different microscopy techniques such as Raman, NSOM, or<br />
AFM in one instrument. The company’s product line features<br />
a near-field scanning optical microscope, using unique cantilever<br />
technology, a confocal Raman microscope designed<br />
for highest sensitivity and resolution, and an AFM for material<br />
research and nanotechnology. Focusing on innovations and<br />
constantly introducing new technologies, WITec is the leading<br />
expert for a wide variety of optical, structural, and chemical<br />
imaging tasks.<br />
Chief Spectroscopic Techniques Supported<br />
⦁ Raman spectroscopy<br />
⦁ Confocal Raman imaging<br />
⦁ Ultrafast confocal Raman imaging<br />
⦁ Confocal and near-field fluorescence spectroscopy<br />
⦁ Upgradeable with atomic force and near-field microscopy<br />
capabilities<br />
Markets Served<br />
WITec products are delivered worldwide to academic and<br />
industrial research labs focusing on high-resolution chemical<br />
imaging and materials characterization. Areas of application<br />
for WITec’s confocal Raman imaging systems include polymer<br />
sciences, pharmaceutics, life science, geoscience, thin films<br />
and coating analysis, semiconductors, and nanotechnology.<br />
WITec alpha500 Automated Confocal<br />
Raman & Atomic Force Microscope: The<br />
alpha500 is an automated confocal Raman<br />
and atomic force microscopy system<br />
incorporating a motorized sample stage<br />
for large samples and customized multiarea/multi-point<br />
measurements. It allows<br />
nondestructive chemical imaging with<br />
confocal Raman microscopy as well as<br />
high-resolution topography imaging with<br />
AFM using the integrated piezo scan-stage.<br />
Both modes can be run fully automatically,<br />
guaranteeing the most comprehensive<br />
surface inspection possibilities for systematic<br />
and routine research tasks or highlevel<br />
quality control.<br />
Facilities<br />
WITec Headquarters is located in Ulm,<br />
Germany, and includes the R&D department,<br />
production, sales & marketing, and<br />
administration. WITec Instruments Corp.<br />
in Maryville, Tennessee, is responsible for<br />
North American sales and service activities.
APPLICATION NOTES – DECEMBER 2011 Mass Spectrometry 93<br />
Simultaneous Qualitative and<br />
Quantitative Analysis of<br />
Buspirone and Its Metabolites<br />
with the Agilent 6550 iFunnel<br />
Q-TOF LC–MS System<br />
Yuqin Dai, Michael Flanagan, and Keith Waddell,<br />
Agilent Technologies, Inc.<br />
Timely and rapid assessment of metabolic stability, metabolite<br />
identification, and metabolite profiling is critical for accelerating<br />
lead optimization and enhancing the success rate of drug<br />
candidates entering into development. Traditionally, qualitative<br />
and quantitative analyses are often performed on different types<br />
of LC–MS instruments and in multiple runs. Te ability to obtain<br />
quantitation and identification (qual/quan) in a single analysis<br />
makes metabolic stability, metabolite identification, and metabolite<br />
profiling studies much more efficient. Tis note describes an<br />
integrated qual/quan workflow that is enabled by the sensitivity<br />
enhancement of iFunnel technology implementation on a quadrupole<br />
time-of-flight (Q-TOF) instrument. It demonstrates how Agilent<br />
6550 iFunnel Q-TOF permits high sensitivity, simultaneous<br />
determination of metabolic stability, metabolite identification, and<br />
metabolite profiling in an in vitro buspirone (1 μM) metabolism<br />
study in rat liver microsomes.<br />
An Integrated Qualitative/Quantitative Workflow<br />
Te qual/quan workflow starts with the LC–MS injection of a biological<br />
sample. Using the Agilent 6550 iFunnel Q-TOF LC–MS<br />
system, data acquisition includes a full MS scan followed by three<br />
data dependent auto MS-MS scans. Metabolite identification and<br />
structure elucidation are facilitated by MassHunter Metabolite ID<br />
software. Metabolic stability and metabolite profiling are established<br />
from the same set of data, which are processed in batch<br />
mode by MassHunter Quantitative Analysis software.<br />
Qual/Quan Analysis<br />
Figure 1 illustrates the metabolic stability of buspirone and the<br />
profiles of its metabolites, illustrating broad coverage of the high<br />
and low abundance metabolites across the entire 60-min time<br />
course.<br />
Figure 2 demonstrates the MS and MS-MS spectra of a buspirone<br />
monohydroxyl metabolite from a 10-min incubation<br />
sample. Te sub-ppm mass accuracy of the precursor and fragment<br />
ions, along with the excellent isotopic fidelity (overall score<br />
>99%), provided highly confident metabolite identification and<br />
structure elucidation.<br />
Normalized peak area (%)<br />
100 Buspirone (parent)<br />
90<br />
80<br />
70<br />
60<br />
50<br />
40<br />
30<br />
20<br />
10<br />
dihydroxy<br />
N-oxide<br />
N, N’-desethyl + O<br />
Incubation time (min)<br />
monohydroxy<br />
trihydroxy<br />
N, N’-desethyl<br />
1-Pyrimidinlypiperazine<br />
0<br />
0 10 20 30 40 50 60<br />
Figure 1: Metabolic stability of buspirone and its metabolite<br />
profiles.<br />
x10 5<br />
2.2 123.0918<br />
2<br />
1.8<br />
1.6<br />
1.4<br />
1.2<br />
1<br />
0.8<br />
0.6<br />
0.4<br />
0.2<br />
0<br />
x10 4 122.0713<br />
C6 H8 N3<br />
4<br />
3.5<br />
3<br />
2.5<br />
2<br />
1.5<br />
1<br />
0.5<br />
0<br />
0.07 ppm<br />
155.1539<br />
O<br />
224.1280<br />
150.1023<br />
C8 H12 N3 178.1212 238.1439 281.1859<br />
-2.01 ppm<br />
C9 H14 N4 C13 H20 N O3 C15 H25 N2 O3<br />
-0.39ppm 0.68 ppm -0.41 ppm<br />
Counts vs. Mass-to-Charge (m/z)<br />
MS spectrum<br />
MS/MS spectrum<br />
402.2499<br />
C21 H32 N5 O3<br />
402.2499<br />
120 140 160 180 200 220 240 260 280 300 320 340 360 380 400 420<br />
Figure 2: Excellent mass accuracy in both MS and MS-MS spectra<br />
and isotopic fidelity.<br />
Conclusions<br />
An efficient qual/quan workflow has been developed using the<br />
Agilent 6550 iFunnel Q-TOF LC–MS system combined with two<br />
powerful software tools: MassHunter Metabolite ID and Quantitative<br />
Analysis. Te 6550 iFunnel Q-TOF LC–MS system enables<br />
the simultaneous quantitation and metabolite identification from<br />
1 μM buspirone incubations with sufficient sensitivity, throughput<br />
(run time of 3.5 min), and high analytical confidence. Tis single<br />
analytical platform also allows rapid generic LC–MS method development<br />
and eliminates the time-consuming MRM optimization<br />
for each analyte that is required on a triple quadrupole instrument.<br />
Agilent Technologies Inc.<br />
2315 Stevens Creek Blvd., Santa Clara, CA 95052<br />
tel. (800) 227-9770; Fax (302) 633-8901<br />
Website: www.agilent.com
94 Molecular <strong>Spectroscopy</strong> APPLICATION NOTES – DECEMBER 2011<br />
Long-Wavelength Dispersive<br />
1064 nm Raman: In-Line<br />
Pharmaceutical Compound<br />
Identification<br />
Clare Dentinger, Steven Pullins, and Eric Bergles,<br />
BaySpec, Inc.<br />
Increased capability for in-line pharmaceutical compound<br />
identification is achieved by using dispersive<br />
1064 nm Raman instruments.<br />
Current practice for in-line monitoring of pharmaceuticals<br />
requires that the identity of the raw material be confirmed.<br />
Tis confirmation is, usually, done in industry by removing a<br />
sample of the raw material and doing off-site analysis. In-line<br />
spectroscopy devices, such as Raman instruments, have the<br />
potential to make identifying pharmaceutical raw materials<br />
faster and easier.<br />
Raman spectroscopy is a powerful technique for compound<br />
identification. Te nondestructive Raman analysis produces<br />
compound specific spectra and enables accurate identification.<br />
However, many pharmaceutical materials show significant fluorescence<br />
when Raman spectrometers with 532 nm or 785 nm<br />
excitation are used (1). Tis fluorescence reduces the signal to<br />
the background noise ratio, can significantly increase the acquisition<br />
time, and reduces the number of peaks available for<br />
compound identification.<br />
New laser, optics, and detector technology originally<br />
developed for the telecommunications industry has allowed<br />
BaySpec, Inc. to develop multiple bench-top Raman instruments<br />
including systems with 1064 nm excitation. Te long<br />
excitation wavelength enables significant reduction in fluorescence<br />
while the deep-cooled detectors and dispersive grating,<br />
with no moving parts, while improving reliability for on-site<br />
compound identification.<br />
Figure 1 shows a picture of BaySpec’s 1064 nm RamSpec<br />
Raman instrument designed for high resolution low signal<br />
sensitivity. Te 1064 nm RamSpec can even measure compounds<br />
in containers that are opaque at visible wavelengths and can be<br />
identified without removing a sample from the container. Figure<br />
2 shows the spectra collected from a drug sample at both<br />
1064 nm excitation and 785 nm excitation. With the 785 nm<br />
excitation a large fluorescence band is seen which obscures all<br />
but the strongest Raman bands. However, when the 1064 nm<br />
excitation was used very clear Raman bands are seen and these<br />
bands would allow for definitive identification of the drug.<br />
Figure 1: BaySpec’s RamSpec 1064 nm instrument.<br />
200 700 1200 1700<br />
Raman shift (cm -1 )<br />
1064<br />
Figure 2: Raman spectra of drug measured with 785 nm excitation<br />
and 1064 nm excitation wavelengths.<br />
Long-wavelength dispersive 1064 nm Raman instruments<br />
are now available from BaySpec. For more information on these<br />
and our complete line of spectroscopic instruments contact:<br />
info@bayspec.com.<br />
785<br />
Reference<br />
(1) M. Mathlouthi and D.V. Luu, Carbohyd. Res. 78, 225 (1980).<br />
BaySpec, Inc.<br />
1101 McKay Drive, San Jose, CA 95131<br />
tel. (408) 512-5928<br />
Website: www.bayspec.com<br />
Email: info@bayspec.com
APPLICATION NOTES – DECEMBER 2011 Molecular <strong>Spectroscopy</strong> 95<br />
60000<br />
Various methanol concentrations in 40% ethanol<br />
Determination of Low<br />
Concentration Methanol in<br />
Alcohol by an Affordable<br />
High Sensitivity Raman<br />
Instrument<br />
50000<br />
40000<br />
30000<br />
20000<br />
10000<br />
0ppm<br />
50ppm<br />
0.05 %<br />
0.25 %<br />
1.25 %<br />
2.5 %<br />
Duyen Nguyen and Eric Wu, Enwave Optronics, Inc.<br />
0<br />
250 450 650 850 1050 1250<br />
Raman Shift (cm -1 )<br />
1450 1650 1850<br />
Low concentration natural methanol exists in most alcoholic<br />
beverages and usually causes no immediate health threat.<br />
Nevertheless, it is possible to have natural occurring methanol<br />
in beverages with concentration as high as 18 g/L of ethanol;<br />
or equivalent to 0.72% methanol in 40% ethanol, in alcohol<br />
(1). Current EU regulation limits naturally occurring methanol<br />
to below 10 g/L of ethanol; or equivalent to 0.4% methanol in<br />
40% ethanol.<br />
Raman spectroscopy has been shown to be an efiective tool<br />
in compositions analysis as well as adulteration identiTcations in<br />
foods (2). In the alcoholic beverage industry, the standard composition<br />
analysis method were more expensive and time-consuming<br />
gas chromatography (3). Here, we present a Raman spectroscopy<br />
method for a quick and lower cost alternative to verify the<br />
existence of low concentration methanol in alcohol.<br />
Experiment<br />
40% ethanol/water solution was prepared using 200-proof<br />
ethanol and distilled water. HPLC grade methanol was added<br />
into the 40% ethanol solution to make samples with methanol<br />
concentration ranging from 50 ppm to 2.5%. An Enwave<br />
Optronics’ ProRaman instrument with laser excitation at 785<br />
nm was used for the measurements. The sample solutions<br />
were measured in quartz cuvette in a sample holder. Figure 1<br />
depicts the results of the measured spectra in the fingerprint<br />
region of the Raman spectra.<br />
Partial least square (PLS) regression method was used for calibration<br />
and prediction model for methanol. ffe spectral region<br />
from 950–1200 cm -1 was chosen for developing the calibration<br />
model. ffe actual vs. predicted concentration value of methanol<br />
is shown in Figure 2. It is shown that the measured data and PLS<br />
prediction match very well with correlation coeflcient R 2 @ 0.997.<br />
Conclusion<br />
An afiordable, high sensitivity ProRaman instrument was used<br />
with PLS method to successfully analyze low concentration methanol<br />
in 40% alcohol. Based on our Tndings, the detection limit<br />
for methanol in 40% of ethanol is much better than 50 ppm and<br />
Figure 1: The fingerprint range spectra of the various solutions.<br />
Predicted value (ppm)<br />
24800<br />
19800<br />
14800<br />
9800<br />
4800<br />
-200<br />
reliable quantitative determination using PLS prediction could<br />
reach 50 ppm of methanol in 40% alcohol.<br />
References<br />
(1) F. Bindler, E. Voges, and P. Laugel, Food Addit. Contam. 5, 343–351<br />
(1988).<br />
Actual vs. Predicted concentrations of methanol in 40% ethanol<br />
(2) W.M. Mackenzie and R.I. Aylott, The Analyst 129, 607–612 (2004).<br />
(3) L.M. Reid, C.P. O’Donnell, and G. Downey, Trends in Food Science &<br />
Technology 17, 344–353 (2006).<br />
y = x + 0.0369<br />
R 2 = 0.997<br />
0 5000 10000 15000<br />
Actual concentration (ppm)<br />
20000 25000<br />
Figure 2: Actual and predicted methanol concentrations using<br />
PLS regression model.<br />
Enwave Optronics, Inc.<br />
18200 McDurmott St., Suite B, Irvine, CA 92614<br />
tel. (949) 955-0258; fax (949) 955-0259<br />
Website: www.enwaveopt.com
96 Molecular <strong>Spectroscopy</strong> APPLICATION NOTES – DECEMBER 2011<br />
Optical Compensation in<br />
Variable Angle Transmission<br />
Measurements of Thick<br />
Samples<br />
(a)<br />
(b)<br />
S. L. Berets 1 and M. Milosevic 2 , 1 Harrick Scientific Products,<br />
Inc., and 2 MeV Consulting<br />
Variable angle transmission spectroscopy is used to extract Tlm<br />
thicknesses and refractive index data. fie sample is placed in<br />
the spectrometer at a known incident angle for analysis. fie infrared<br />
or UV–vis beam refracts through the sample in accordance to Snell’s<br />
Law. Consider two samples (n = 1.5), 1-mm and 10-mm thick. Radiation<br />
passing through these samples at a 45° incident angle will be<br />
offset roughly 0.5 mm and 5 mm, respectively. fiis offset radiation<br />
will be misaligned on the detector, reducing the measured transmittance<br />
regardless of sample absorption.<br />
fiis applications note illustrates this problem and presents the use<br />
of a second thickness-matched sample to refract the beam back so it is<br />
properly centered on the detector.<br />
Experimental<br />
fie sample investigated consisted of two pieces of 13.8-mm thick<br />
Plexiglas cut from the same sheet.<br />
fie measurements were carried out using Harrick’s Variable Angle<br />
Transmission Accessory in a UV–vis spectrometer with a nominally<br />
collimated beam. Spectra were collected from 190 nm to 900 nm<br />
with a full aperture and a 1-nm scan interval. Data were collected<br />
with either one or two samples positioned in the beam path at 0° and<br />
60° incident angles. fie double-transmission spectra were adjusted<br />
for comparison to the single-transmission data.<br />
Results and Discussion<br />
fie results are presented in Figure 2. At normal (0°) incidence, there<br />
is little refraction of the beam, so the measurements with and without<br />
compensation should simply show differences in reflectance losses.<br />
Assuming the samples are plane parallel, the reflectance losses on two<br />
plates should be roughly double that of a single plate at normal incidence.<br />
Here, the transmittances are nearly identical indicating that<br />
the surfaces are not plane parallel, so some radiation is defected away<br />
from the detector.<br />
At 60°, the transmittance of single sample shows very little radiation<br />
reaching the detector. A visual comparison of the white light<br />
beam intensity before and after the sample shows a more intense<br />
transmitted beam than expected for
APPLICATION NOTES – DECEMBER 2011 Molecular <strong>Spectroscopy</strong> 97<br />
Near Infrared <strong>Spectroscopy</strong> Is<br />
a Useful Tool in Photovoltaics<br />
Panel Development<br />
90<br />
80<br />
70<br />
Sample 1<br />
Sample 2<br />
Sample 3<br />
Sample 4<br />
Sample 5<br />
% Reflection: Samples with Film Side Up<br />
60<br />
Rob Morris and Andrew Tatsch, Ocean Optics<br />
With their modest cost, compact size and great<br />
fiexibility, UV-VIS-NIR miniature fiber optic spectro<br />
meters are attractive analytical tools for photovoltaic<br />
materials research and quality control. Typical<br />
applications include analysis of the optical properties<br />
of solar cell materials, spectroradiometric measurement<br />
of solar simulators used in panel testing and<br />
quality control in panel production.<br />
We evaluated NIR spectroscopy as a method to measure the<br />
refiection of photovoltaic panel materials. A manufacturer<br />
of thin fflm photovoltaic panels requested NIR refiectivity analysis<br />
of several coated glass samples. Measurements were conducted<br />
from 1200–2100 nm under ambient lab lighting conditions.<br />
Because the absorbance of photovoltaic panels is so critical,<br />
determining the refiectivity at panel edges and elsewhere is a<br />
good indicator of the light loss at those areas. Te use of antirefiective<br />
coatings and glass dopants are among the approaches<br />
manufacturers may evaluate in improving panel eflciency.<br />
Experimental Conditions<br />
Five coated glass samples were analyzed with an Ocean Optics<br />
NIRQuest256-2.1 Spectrometer conffgured with a 100 µm slit<br />
and optimized for the range from 1200–2100 nm. Te sampling<br />
setup comprised a tungsten halogen light source, 400 µm refiection<br />
probe and an optical stage. A specular refiection standard was<br />
used as a reference. SpectraSuite spectrometer operating software<br />
completed the setup.<br />
Te glass samples were placed on the sample holder uncoated<br />
side down, to ensure that the probe measured the refiection from<br />
the coating through the glass. Te optical stage helped to position<br />
the probe at 90° to measure specular refiectance.<br />
Measurements were taken under overhead lighting conditions.<br />
Te high-powered (20 W) tungsten halogen light source provided<br />
continuous illumination from 360–2000 nm. Te distance from<br />
the tip of the refiection probe to the surface of the sample was measured<br />
at ~7 cm for each sample, to simulate production conditions.<br />
Ocean Optics NIR Spectrometers use a high-performance<br />
InGaAs-array detector in a compact optical bench with thermoelectric<br />
cooler and low-noise electronics. Te NIRQuest256-2.1 is<br />
suited to applications involving higher wavelengths (peak responsivity<br />
is ~1900 nm). Te spectrometer’s rapid integration times —<br />
% Reflection (relative)<br />
50<br />
40<br />
30<br />
20<br />
10<br />
0<br />
1250 1350 1450 1550 1650<br />
Wavelength (nm)<br />
1750 1850 1950 2050<br />
Figure 1: NIR specular refiection of photovoltaic materials (coated<br />
glass samples).<br />
spectral acquisition of 1 ms is possible — makes it viable for high<br />
volume production environments.<br />
Results<br />
Te measurements showed good stability with no averaging and<br />
boxcar smoothing. Te refiection spectra for the samples (Figure 1)<br />
demonstrated that refiection values increased as a function of wavelength<br />
comparably across all ffve samples, peaking at about 2000 nm.<br />
Also, the gap between the least refiective and most refiective samples<br />
was relatively narrow at the lower and upper ranges of the wavelength<br />
range, with the greatest variation observed near 1700 nm.<br />
Refiectance intensity of the coated samples ranged from ~25%<br />
at the lower wavelengths to as much as 80% at the higher wavelengths.<br />
Tese values are relative to the response of the specular<br />
refiectance standard, which has nearly “fiat” refiectivity across all<br />
NIR wavelengths.<br />
Conclusions<br />
As developers of photovoltaic materials seek improvement in cell<br />
eflciency, the need for convenient analytical tools to evaluate glass<br />
coatings, dopants and other materials is great. Optical sensing systems<br />
such as NIR spectrometers, thin fflm measurement systems and solar<br />
simulator testing units are easily conffgured for both research lab and<br />
process line applications.<br />
NIR spectroscopy can be used to determine the specular refiectivity<br />
of coated glass samples relative to each other and to known refiectance<br />
standards. As a result, the solar light capturing eflciency of<br />
the ffve sample coatings now can be inferred with the utilized Ocean<br />
Optics spectrometer and accessories.<br />
Ocean Optics, Inc.<br />
830 Douglas Ave., Dunedin, FL 34698<br />
tel. (727) 733-2447; Fax (727) 733-3962<br />
Website: www.oceanoptics.com; Email: info@oceanoptics.com
98 Molecular <strong>Spectroscopy</strong> APPLICATION NOTES – DECEMBER 2011<br />
Mid-Infrared Refiectivity Measurements of<br />
Diffuse Materials<br />
Jenni L. Briggs, PIKE Technologies<br />
The approach to infrared measurements of diffusely<br />
scattering materials often is dictated by the objective<br />
of the analysis. Spectral data from three different<br />
mid-infrared refiectance sampling accessories are<br />
contrasted.<br />
100<br />
95<br />
90<br />
85<br />
80<br />
75<br />
70<br />
Infrared analysis of highly scattering or textured samples is often<br />
accomplished via diffuse refiectance sampling accessories.<br />
Among two of the most popular diffuse refiectance accessories<br />
are the confocal ellipsoidal mirror design, which results in only a<br />
fraction of the refiected light being collected, and the integrating<br />
sphere design (1). Te speciflc accessory used for the measurement<br />
will be determined by the information desired. Te aim of<br />
this application note is to compare mid-infrared spectral data of<br />
a diffuse sample obtained by using various refiection accessories.<br />
Experimental Conditions<br />
A powdered coated metal panel was analyzed using the PIKE<br />
UpIR , a diffuse refiection accessory with an ellipsoidal collection<br />
mirror, or the PIKE mid-infrared IntegratIR , a<br />
gold-coated integrating sphere equipped with a liquid nitrogen<br />
cooled MCT detector. Te sampling surface of the UpIR<br />
is positioned above the FT-IR making it ideal for analyzing<br />
large samples. Additionally, a spectrum was collected using a<br />
10 o specular refiection accessory. Te background and sample<br />
collection time was 20 s, and the resolution was set to 4 cm -1 .<br />
Results<br />
All spectra are shown in Figure 1. Te spectrum of the powdered<br />
coated sample collected with the 10° specular refiection<br />
accessory resulted in refiectivity values near 1% and minimal<br />
chemical information is discernable due to the diffuse characteristic<br />
of this sample. Only the specular component refiecting at<br />
the angle equivalent to the angle of incidence, 10° in this case,<br />
is collected. Specular refiection accessories are appropriate for<br />
specular samples such as mirrors, optical windows, and coatings<br />
on refiective surfaces.<br />
Chemical information from a high quality spectrum is obtained<br />
from the ellipsoidal collection mirror (UpIR) and the integrating<br />
sphere accessory. Terefore, either accessory is suitable for<br />
this purpose. Te refiectivity measurements were different; at 4000<br />
cm -1 65% refiectivity was measured using the integrating sphere<br />
while the refiectivity of the sample collected using the UpIR was<br />
93%. However, only the integrating sphere accessory produces re-<br />
% Reflectance<br />
65<br />
60<br />
55<br />
50<br />
45<br />
40<br />
35<br />
30<br />
25<br />
20<br />
15<br />
10<br />
5<br />
0<br />
4000 3500 3000 2500 2000 1500 1000 500<br />
Wavenumber (cm -1 )<br />
Figure 1: Spectrum of painted panel obtained using an elliptical<br />
collection type accessory (shown in purple), an integrating<br />
sphere ( shown in blue), and a 10 o specular refiection accessory<br />
(shown in red).<br />
liable refiectivity data because it is able to collect close to the entire<br />
available hemispherical (2π steradians) scattered photons.<br />
Te integrating sphere has a highly refiective, close to a Lambertian<br />
surface, such that the light enters the sphere, bounces<br />
around the highly refiective diffuse surface of the sphere wall,<br />
and flnally impinges upon the detector. In addition to refiectivity<br />
measurements as described here, the PIKE IntegratIR may be<br />
used for diffuse transmission measurements. Despite the 100 year<br />
history of the sphere, new applications are continually developed.<br />
Conclusions<br />
For refiectivity measurements of diffuse samples, using an integrating<br />
sphere is preferred, whereas for obtaining only chemical<br />
information a ellipsoidal mirror design diffuse refiection<br />
accessory is adequate.<br />
References<br />
(1) L.M. Hanssen and K.A. Snail, Handbook of Vibrational <strong>Spectroscopy</strong>, Chalmers<br />
and Griffiths, Eds. (2002).<br />
PIKE Technologies<br />
6125 Cottonwood Drive, Madison, WI 53719<br />
tel. (608) 274-2721; fax (608) 274-0103<br />
Website: www.PIKEtech.com
<strong>Spectroscopy</strong>’s<br />
Global Digital Edition<br />
Subscribe to the first global digital magazine for spectroscopists<br />
<strong>Spectroscopy</strong>’s Global Digital Edition provides practitioners of spectroscopic techniques<br />
from around the world access to the same objective, peer-reviewed, nuts-and-bolts<br />
technical information found in the monthly print edition. The digital edition is delivered<br />
to professionals in the U.S., Europe, Asia, and elsewhere, as <strong>Spectroscopy</strong> continues to<br />
recognize the global scale of the issues faced by spectroscopists in labs worldwide.<br />
Created specifically for on-the-go professionals, <strong>Spectroscopy</strong>’s Global Digital Edition is:<br />
❯ Convenient - Delivered directly to your inbox and easily accessible with a click of the mouse<br />
❯ International - Available to all spectroscopic professionals, anywhere in the world<br />
❯ Timely - The most up-to-date technical, application-oriented articles and features<br />
at your fingertips in the spectroscopy industry providing up to date news,<br />
interactive web seminars, podcasts, archived articles and opinion surveys.<br />
SUBSCRIBE FREE<br />
www.spectroscopyonline.com/digitalsubscribe