Making plots using StatTools
Making plots using StatTools
Making plots using StatTools

Create successful ePaper yourself
Turn your PDF publications into a flip-book with our unique Google optimized e-Paper software.
<strong>Making</strong> <strong>plots</strong> <strong>using</strong> <strong>StatTools</strong><br />
Plots for numerical variables: The variables in my example are: Gender and Speed.<br />
First open up your data set in <strong>StatTools</strong>. To make a histogram or Box and whisker plot, go through the<br />
following pull down menus: <strong>StatTools</strong> Summary Graphs your choice of graph<br />
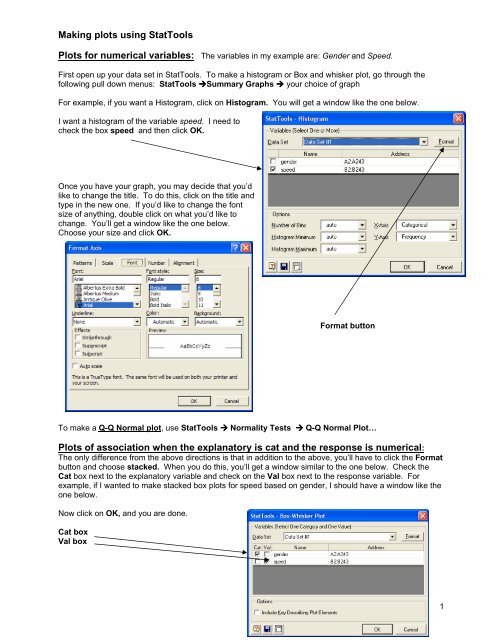
For example, if you want a Histogram, click on Histogram. You will get a window like the one below.<br />
I want a histogram of the variable speed. I need to<br />
check the box speed and then click OK.<br />
Once you have your graph, you may decide that you’d<br />
like to change the title. To do this, click on the title and<br />
type in the new one. If you’d like to change the font<br />
size of anything, double click on what you’d like to<br />
change. You’ll get a window like the one below.<br />
Choose your size and click OK.<br />
Format button<br />
To make a Q-Q Normal plot, use <strong>StatTools</strong> Normality Tests Q-Q Normal Plot…<br />
Plots of association when the explanatory is cat and the response is numerical:<br />
The only difference from the above directions is that in addition to the above, you’ll have to click the Format<br />
button and choose stacked. When you do this, you’ll get a window similar to the one below. Check the<br />
Cat box next to the explanatory variable and check on the Val box next to the response variable. For<br />
example, if I wanted to make stacked box <strong>plots</strong> for speed based on gender, I should have a window like the<br />
one below.<br />
Now click on OK, and you are done.<br />
Cat box<br />
Val box<br />
1
Plots for categorical variables:<br />
Single categorical variable: Before starting, you must make a pivot chart with just that variable. For my<br />
example, I’m going to use the Smoking and Lung Cancer data set. I will use Lung Cancer as my single<br />
variable. First I must highlight the pivot table as follows:<br />
Click once on the charts icon. Now you will have a bar chart. If this is the plot you want, then go to the<br />
next page to see how you can make it pretty and readable. If you want another type of chart, click on the<br />
icon again. When you do so, you’ll get the window below. Choose the type of plot you want, click Next,<br />
type in the Chart title of your choice and click Finish.<br />
This may give you a nice chart, but most likely, you’ll<br />
have to change the font. Please see the next page for<br />
directions on how to make your chart pretty.<br />
2
To change your chart from something unreadable like the chart below left to a readable chart like below<br />
right, you need to double click on the numbers and text and change the font size. There are precise<br />
directions on pages 6 and 7. Usually a font of 24 works well. To get rid of those annoying pivot chart field<br />
buttons, right click on a pivot chart button on the <strong>plots</strong> and choose Hide PivotChart Field Button.<br />
These are pivot chart buttons<br />
Count of Lung cancer<br />
Total<br />
Total number of counts<br />
No Cancer<br />
No Cancer<br />
Lung cancer<br />
Total<br />
Cancer<br />
Cancer<br />
0 5 10 15 20 25 30 35<br />
0 10 20 30 40<br />
Two categorical variables:<br />
There are various different possible charts and graphs. Most of them require that you do a Chi-Square<br />
Statistical test first, which requires a pivot table. Below is my pivot table.<br />
Once you have the pivot table, go through the<br />
sequence of drop-down menus<br />
<strong>StatTools</strong> Statistical Inference <br />
Chi-square Independence Test …<br />
You will get a window like the one to the left. It<br />
may or may not have the Contingency Table<br />
Range already filled in. But you need to make<br />
sure that you only include all Row and Column<br />
headers and the counts. None of the totals<br />
should be included in the range.<br />
Range of contingency table<br />
3
After putting in the range and clicking OK, you will get a table of charts like the one below.<br />
You are now ready to make your <strong>plots</strong>. To make a side-byside<br />
bar chart, click the Charts icon and highlight the type of<br />
chart you want, which in this case is the one already<br />
highlighted in black to the right. Click Next.<br />
4
The next window, shown right, asks for the Data Range.<br />
For the side-by-side bar chart, you want the Percentage<br />
of Rows chart. See below the part of the chart I chose.<br />
It is important that you NOT include the Totals. The way<br />
to select the part of the graph you want is to left click on<br />
a cell (usually a corner cell) and keeping the left button<br />
depressed, move the mouse around until the correct part<br />
of the chart has been selected.<br />
Percentage of Rows diabetes no diabetes<br />
female 54.00% 46.00%<br />
male 24.00% 76.00%<br />
Once you’ve selected the Data range, you will get the<br />
window directly below.<br />
Note that there are these annoying grid lines.<br />
You can get rid of these in the next step. To get<br />
to the next step, click Next.<br />
You will get the window below. To get rid of the gird lines, go to the Gridlines tab and unclick Major grid<br />
lines for the Y axis. You can also add a title, data labels, etc now. When done, click Next.<br />
5
The last window you will get is the one below asking you where you want your chart put. Pick one and click<br />
Finish.<br />
You’ll get a plot like the one to the right. Now, you can change the<br />
font size.<br />
80.00%<br />
70.00%<br />
60.00%<br />
50.00%<br />
To make the font size larger, right click on a word you’d like bigger.<br />
You’ll get a window asking if you want Format Axis or to Clear.<br />
Select Format Axis. You’ll get the box below.<br />
40.00%<br />
30.00%<br />
20.00%<br />
10.00%<br />
female<br />
male<br />
Select the Font tab and then the font size you want. You can also<br />
put boxes around things, add tick marks, etc. End by clicking ok.<br />
0.00%<br />
diabetes<br />
no diabetes<br />
6
<strong>Making</strong> a scatter plot:<br />
The data set I’ll be <strong>using</strong> is comprised of data taken from premature infants at birth. The variables are:<br />
head circumference, length, gestational age (number of weeks mom was pregnant), birth weight and mom’s<br />
age. The variables of interest are gestational age and mom’s age. Mom’s age is the explanatory variable<br />
(plotted on X axis) and gestational age is the response (plotted on the Y axis).<br />
It is easiest to go through the pull down menu sequence: StatTool -> Summary Graphs -> Scatter<strong>plots</strong>.<br />
Click the variables you wanted to be plotted as shown to the right. Then click OK.<br />
You will get something like the below.<br />
Scatterplot of gestational age vs mom age of Data Set #1<br />
40<br />
35<br />
gestational age / Data Set #1<br />
30<br />
25<br />
20<br />
15<br />
10<br />
5<br />
0<br />
0 5 10 15 20 25 30 35 40 45<br />
mom age / Data Set #1<br />
To change the font size of an axis, right click on<br />
one the numbers on that axis and choose Format<br />
Axis… Next click the Font button. Now choose the font you want ( 12 or 14 works well).<br />
To change the title or label of any axis, left click on it and type in the new title. Now right click on this,<br />
choose Format Axis Title… and choose an appropriate font size.<br />
To add a regression line, right click on any data point and<br />
choose Add Trendline…. You will get a pop up like the one to<br />
the right. Click on Linear box and then OK.<br />
To get R 2 or the estimated equation, click on the options tab of<br />
the Add Trendline dialogue box, and select "Display equation<br />
on chart" and "Display R-squared value on chart."<br />
7
Finally, you might want to change the range plotted on the X axis. To change the range of the X axis<br />
values, right click on the X axis line and choose Format Axis… You will get a pop up like the one below.<br />
Click on the Scale button.<br />
Now, type in the minimum and maximum<br />
values you want for the X axis in the<br />
appropriate boxes.<br />
An improved chart would look like that<br />
shown below.<br />
Scatterplot of gestational age vs<br />
mom's age<br />
Gestational Age<br />
40<br />
35<br />
30<br />
25<br />
20<br />
15<br />
10<br />
5<br />
0<br />
y = 0.1126x + 25.768<br />
R 2 = 0.0707<br />
10 20 30 40<br />
Mother's age<br />
8