comprehensive annual financial report - City of St. Petersburg
comprehensive annual financial report - City of St. Petersburg
comprehensive annual financial report - City of St. Petersburg

Create successful ePaper yourself
Turn your PDF publications into a flip-book with our unique Google optimized e-Paper software.
<strong>City</strong> <strong>of</strong> <strong>St</strong>. <strong>Petersburg</strong>, FL<br />
Management’s Discussion and Analysis<br />
For the Year Ended September 30, 2010<br />
Unaudited<br />
Other Information<br />
In addition to the basic <strong>financial</strong> statements and accompanying notes, this <strong>report</strong> also presents<br />
certain required supplementary information related to funding pension obligations. The required<br />
supplementary information can be found beginning on page E-1.<br />
The combining statements referred to earlier in connection with non-major governmental funds,<br />
enterprise funds and internal service funds are presented immediately following the required<br />
supplementary information on pensions. Combining and individual fund statements and<br />
schedules can be found on pages F-4 through F-29.<br />
GOVERNMENT-WIDE FINANCIAL ANALYSIS<br />
The <strong>City</strong> <strong>of</strong> <strong>St</strong>. <strong>Petersburg</strong> as a Whole<br />
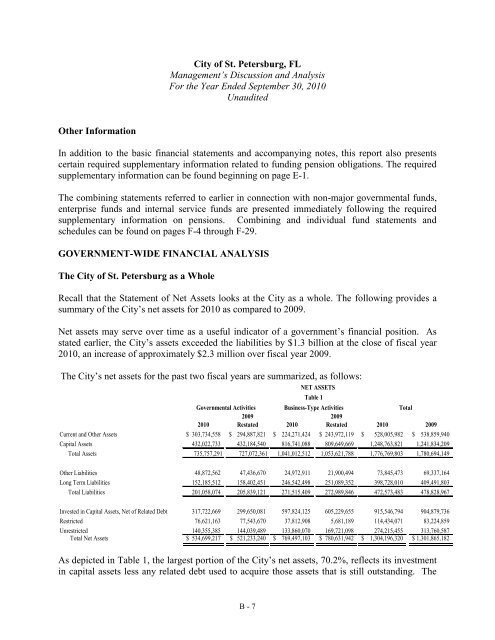
Recall that the <strong>St</strong>atement <strong>of</strong> Net Assets looks at the <strong>City</strong> as a whole. The following provides a<br />
summary <strong>of</strong> the <strong>City</strong>’s net assets for 2010 as compared to 2009.<br />
Net assets may serve over time as a useful indicator <strong>of</strong> a government’s <strong>financial</strong> position. As<br />
stated earlier, the <strong>City</strong>’s assets exceeded the liabilities by $1.3 billion at the close <strong>of</strong> fiscal year<br />
2010, an increase <strong>of</strong> approximately $2.3 million over fiscal year 2009.<br />
The <strong>City</strong>’s net assets for the past two fiscal years are summarized, as follows:<br />
NET ASSETS<br />
Governmental Activities Business-Type Activities Total<br />
2009 2009<br />
2010 Restated 2010 Restated 2010 2009<br />
Current and Other Assets $ 303,734,558 $ 294,887,821 $ 224,271,424 $ 243,972,119 $ 528,005,982 $ 538,859,940<br />
Capital Assets 432,022,733 432,184,540 816,741,088 809,649,669 1,248,763,821 1,241,834,209<br />
Total Assets 735,757,291 727,072,361 1,041,012,512 1,053,621,788 1,776,769,803 1,780,694,149<br />
Other Liabilities 48,872,562 47,436,670 24,972,911 21,900,494 73,845,473 69,337,164<br />
Long Term Liabilities 152,185,512 158,402,451 246,542,498 251,089,352 398,728,010 409,491,803<br />
Total Liabilities 201,058,074 205,839,121 271,515,409 272,989,846 472,573,483 478,828,967<br />
Table 1<br />
Invested in Capital Assets, Net <strong>of</strong> Related Debt 317,722,669 299,650,081 597,824,125 605,229,655 915,546,794 904,879,736<br />
Restricted 76,621,163 77,543,670 37,812,908 5,681,189 114,434,071 83,224,859<br />
Unrestricted 140,355,385 144,039,489 133,860,070 169,721,098 274,215,455 313,760,587<br />
Total Net Assets $ 534,699,217$ $ 521,233,240 $ 769,497,103$ $ 780,631,942 $ 1,304,196,320 $ 1,301,865,182<br />
As depicted in Table 1, the largest portion <strong>of</strong> the <strong>City</strong>’s net assets, 70.2%, reflects its investment<br />
in capital assets less any related debt used to acquire those assets that is still outstanding. The<br />
B - 7