Molecular characterisation of SGCE-associated myoclonus-dystonia ...
Molecular characterisation of SGCE-associated myoclonus-dystonia ...
Molecular characterisation of SGCE-associated myoclonus-dystonia ...
You also want an ePaper? Increase the reach of your titles
YUMPU automatically turns print PDFs into web optimized ePapers that Google loves.
List <strong>of</strong> figures<br />
V<br />
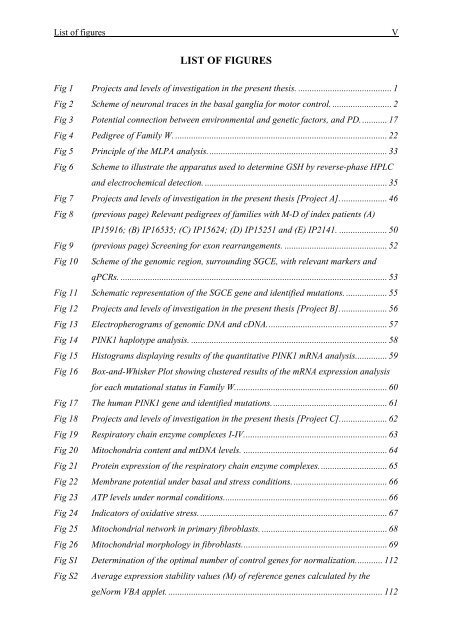
LIST OF FIGURES<br />
Fig 1 Projects and levels <strong>of</strong> investigation in the present thesis. ......................................... 1<br />
Fig 2 Scheme <strong>of</strong> neuronal traces in the basal ganglia for motor control. .......................... 2<br />
Fig 3 Potential connection between environmental and genetic factors, and PD............ 17<br />
Fig 4 Pedigree <strong>of</strong> Family W. ............................................................................................. 22<br />
Fig 5 Principle <strong>of</strong> the MLPA analysis............................................................................... 33<br />
Fig 6 Scheme to illustrate the apparatus used to determine GSH by reverse-phase HPLC<br />
and electrochemical detection. ................................................................................ 35<br />
Fig 7 Projects and levels <strong>of</strong> investigation in the present thesis [Project A]..................... 46<br />
Fig 8 (previous page) Relevant pedigrees <strong>of</strong> families with M-D <strong>of</strong> index patients (A)<br />
IP15916; (B) IP16535; (C) IP15624; (D) IP15251 and (E) IP2141. ..................... 50<br />
Fig 9 (previous page) Screening for exon rearrangements. ............................................. 52<br />
Fig 10 Scheme <strong>of</strong> the genomic region, surrounding <strong>SGCE</strong>, with relevant markers and<br />
qPCRs. ..................................................................................................................... 53<br />
Fig 11 Schematic representation <strong>of</strong> the <strong>SGCE</strong> gene and identified mutations. .................. 55<br />
Fig 12 Projects and levels <strong>of</strong> investigation in the present thesis [Project B]..................... 56<br />
Fig 13 Electropherograms <strong>of</strong> genomic DNA and cDNA..................................................... 57<br />
Fig 14 PINK1 haplotype analysis. ...................................................................................... 58<br />
Fig 15 Histograms displaying results <strong>of</strong> the quantitative PINK1 mRNA analysis.............. 59<br />
Fig 16 Box-and-Whisker Plot showing clustered results <strong>of</strong> the mRNA expression analysis<br />
for each mutational status in Family W................................................................... 60<br />
Fig 17 The human PINK1 gene and identified mutations................................................... 61<br />
Fig 18 Projects and levels <strong>of</strong> investigation in the present thesis [Project C]..................... 62<br />
Fig 19 Respiratory chain enzyme complexes I-IV............................................................... 63<br />
Fig 20 Mitochondria content and mtDNA levels. ............................................................... 64<br />
Fig 21 Protein expression <strong>of</strong> the respiratory chain enzyme complexes.............................. 65<br />
Fig 22 Membrane potential under basal and stress conditions.......................................... 66<br />
Fig 23 ATP levels under normal conditions........................................................................ 66<br />
Fig 24 Indicators <strong>of</strong> oxidative stress................................................................................... 67<br />
Fig 25 Mitochondrial network in primary fibroblasts. ....................................................... 68<br />
Fig 26 Mitochondrial morphology in fibroblasts................................................................ 69<br />
Fig S1 Determination <strong>of</strong> the optimal number <strong>of</strong> control genes for normalization............ 112<br />
Fig S2 Average expression stability values (M) <strong>of</strong> reference genes calculated by the<br />
geNorm VBA applet. .............................................................................................. 112


