UK National Marine Monitoring Programme - Second ... - JNCC - Defra
UK National Marine Monitoring Programme - Second ... - JNCC - Defra
UK National Marine Monitoring Programme - Second ... - JNCC - Defra

You also want an ePaper? Increase the reach of your titles
YUMPU automatically turns print PDFs into web optimized ePapers that Google loves.
<strong>UK</strong> <strong>National</strong> <strong>Marine</strong><br />
<strong>Monitoring</strong> <strong>Programme</strong><br />
- <strong>Second</strong> Report<br />
(1999-2001)<br />
<strong>Marine</strong> Environment<br />
<strong>Monitoring</strong> Group<br />
2004
The Centre for Environment, Fisheries & Aquaculture Science<br />
Lowestoft Laboratory, Pakefield Road<br />
Lowestoft, Suffolk NR33 0HT <strong>UK</strong><br />
Tel: +44(0) 1502 562244<br />
Fax: +44(0) 1502 513865<br />
www.cefas.co.uk<br />
<strong>UK</strong> <strong>National</strong> <strong>Marine</strong> <strong>Monitoring</strong> <strong>Programme</strong> - <strong>Second</strong> Report (1999-2001)<br />
ISBN 0 907545 20 3<br />
Front cover satellite image is reproduced by permission of the Science Photo Library
<strong>UK</strong> <strong>National</strong> <strong>Marine</strong> <strong>Monitoring</strong> <strong>Programme</strong><br />
- <strong>Second</strong> Report (1999-2001)<br />
<strong>Marine</strong> Environment <strong>Monitoring</strong> Group<br />
2004<br />
1
This report was produced by the <strong>National</strong> <strong>Marine</strong> <strong>Monitoring</strong> <strong>Programme</strong> Working Group on behalf of the<br />
<strong>Marine</strong> Environment <strong>Monitoring</strong> Group.<br />
© Crown copyright, 2004<br />
Requests for reproduction of material contained within this report should be addressed to CEFAS<br />
2
Contents<br />
Page<br />
EXECUTIVE SUMMARY .............................................................................................................................5<br />
1. Introduction ......................................................................................................................................7<br />
2. Methods ...........................................................................................................................................8<br />
2.1 Components of the NMMP ..........................................................................................................8<br />
2.2 Contaminant <strong>Monitoring</strong> .............................................................................................................8<br />
2.2.1 Waters ...........................................................................................................................8<br />
2.2.2 Sediments ........................................................................................................................8<br />
2.2.3 Biota ................................................................................................................................9<br />
2.3 <strong>Monitoring</strong> of biological effects .................................................................................................10<br />
2.3.1 Benthic macrofauna .......................................................................................................10<br />
2.3.2 Oyster embryo bioassay ..................................................................................................10<br />
2.3.3 Fish disease studies .........................................................................................................10<br />
2.3.4 Imposex studies ..............................................................................................................10<br />
2.3.5 The mixed function oxidase test (EROD) ..........................................................................10<br />
2.3.6 Metallothionein ..............................................................................................................10<br />
2.3.7 DNA adducts ..................................................................................................................10<br />
2.4 Indicators ..................................................................................................................................10<br />
2.4.1 Indicators of chemical quality .........................................................................................10<br />
2.4.2 Indicators of biological quality ........................................................................................11<br />
2.5 Framework for indicators ...........................................................................................................11<br />
3. Quality control and data assessment ............................................................................................12<br />
3.1 Chemistry ..................................................................................................................................12<br />
3.2 Biology ......................................................................................................................................13<br />
3.2.1 Targets and standards .....................................................................................................14<br />
3.3 Ecotoxicology ............................................................................................................................14<br />
3.4 Data assessment ........................................................................................................................14<br />
4. Results .............................................................................................................................................15<br />
4.1 Waters ......................................................................................................................................15<br />
4.1.1 Nutrients ........................................................................................................................15<br />
4.1.2 Contaminant concentrations ..........................................................................................19<br />
4.1.3 Biological effects in waters - oyster embryo bioassay ......................................................21<br />
4.2 Sediments .................................................................................................................................24<br />
4.2.1 Contaminants in sediments ............................................................................................24<br />
4.2.2 Biological effects of contaminants in sediments ..............................................................32<br />
4.3 Shellfish .....................................................................................................................................38<br />
4.3.1 TBT-specific biological effects .........................................................................................43<br />
4.4 Fish ...........................................................................................................................................43<br />
4.5 Trend detection .........................................................................................................................52<br />
5. Conclusions and recommendations ...............................................................................................54<br />
6. References .......................................................................................................................................56<br />
continued:/<br />
3
<strong>UK</strong> Case studies .......................................................................................................................................59<br />
1. <strong>Marine</strong> litter .....................................................................................................................................61<br />
2. Continuous nutrient monitoring at the NMMP buoy in the north western Irish Sea ..........................63<br />
3. Trends in phytoplankton in <strong>UK</strong> coastal waters from analysis of continuous plankton<br />
recorder (CPR) data .........................................................................................................................64<br />
4. Assessment of eutrophication in the Solway Firth .............................................................................67<br />
5. Metals in seaweed ...........................................................................................................................72<br />
6. <strong>Monitoring</strong> of heavy metals in the Humber estuary using Fucus vesiculosis .......................................74<br />
7. Long term trends in mercury, cadmium and lead in the Forth estuary ...............................................78<br />
8. Trends in the biological effect of TBT in Sullom Voe .........................................................................83<br />
9. Polycyclic aromatic hydrocarbon (PAH) concentration and composition in farmed blue mussels<br />
(Mytilus edulis), other biota and sediment from Loch Leven. ............................................................85<br />
10. <strong>Monitoring</strong> the biological effects of polynuclear aromatic hydrocarbons (PAH) on flatfish in<br />
the Forth and Clyde estuaries ...........................................................................................................89<br />
11. Trends in organochlorine residues in mussels (Mytilus edulis) from the Mersey estuary .....................92<br />
12. Spatial survey of brominated flame retardants .................................................................................95<br />
13. Vitellogenin expression in estuarine male flounder (Platichthys flesus) ..............................................97<br />
14. Meiofauna studies in marine monitoring programmes .....................................................................99<br />
15. Holy Loch, Scotland: An assessment of the contamination and toxicity of marine sediments .........102<br />
16. The NMMP and monitoring Special Areas of Conservation .............................................................107<br />
17. The Sea Empress oil spill ................................................................................................................110<br />
18. Long term trends in the Tyne estuary .............................................................................................114<br />
19. Long term trends in the Tees estuary .............................................................................................117<br />
20. Recovery of the Thames estuary .....................................................................................................122<br />
21. Long term trends in Belfast Lough .................................................................................................125<br />
22. <strong>Monitoring</strong> <strong>UK</strong> marine dredged material disposal sites ...................................................................129<br />
Appendix 1. Membership of the NMMP Working Group ................................................................133<br />
Appendix 2. <strong>Marine</strong> Environment <strong>Monitoring</strong> Group ......................................................................135<br />
4
EXECUTIVE SUMMARY<br />
The <strong>National</strong> <strong>Marine</strong> <strong>Monitoring</strong> <strong>Programme</strong> (NMMP) was initiated by the <strong>Marine</strong> Environment <strong>Monitoring</strong><br />
Group (MEMG), formerly known as the <strong>Marine</strong> Pollution <strong>Monitoring</strong> Management Group (MPMMG), in the<br />
late 1980s to co-ordinate marine monitoring in the <strong>UK</strong>. The programme was designed to fulfil the <strong>UK</strong>’s<br />
mandatory monitoring requirements under the OSPAR Joint Assessment and <strong>Monitoring</strong> <strong>Programme</strong> (JAMP)<br />
and it also provides data in support of EC Directives.<br />
In recent years the policy underpinning marine monitoring has changed considerably with new and emerging<br />
requirements from both OSPAR and EC Directives such as the Water Framework Directive (2000/60/EC).<br />
At the same time, the creation of the Department for Environment, Food and Rural Affairs (<strong>Defra</strong>) in 2001<br />
brought together a number of Government Departments with interests in marine science, providing an<br />
opportunity to maximise and co-ordinate Government funded marine science. The Department produced its<br />
first <strong>Marine</strong> Stewardship Report, ‘Safeguarding Our Seas’ (<strong>Defra</strong>, 2002), which recognised the importance<br />
of an ecosystem-based approach to management of the marine environment in delivering its vision of clean<br />
healthy seas. The report sets out a framework to deliver this vision through improved co-ordination of <strong>UK</strong><br />
marine monitoring, with the aim of supporting more integrated and coherent assessments of the state of the<br />
<strong>UK</strong> marine environment at regular intervals. The first integrated assessment, in the form of a State of the Seas<br />
Report, will be produced in 2004.<br />
As part of a review undertaken by the MEMG on behalf of <strong>Defra</strong>, a strategy for a harmonised and integrated<br />
programme of marine environmental monitoring has been set out (MEMG, 2003). This document<br />
summarises the key findings and conclusions from the review and presents a number of recommendations<br />
which will be implemented by the NMMP Working Group, particularly as it works towards up-dating its<br />
operational handbook (the NMMP Green Book). This second report on the <strong>National</strong> <strong>Marine</strong> <strong>Monitoring</strong><br />
<strong>Programme</strong> is therefore very timely.<br />
Data collected in the first phase of the programme (1992-1995) were reported in 1998 (MPMMG, 1998). Part<br />
1 of this report presents data collected in the second phase (1999-2001). Part 2 of the report presents data<br />
collected under a number of other marine monitoring programmes, as case studies. These provide a wider<br />
view of trends and distributions of contaminants in the marine environment, presenting a more complete<br />
picture of the quality of <strong>UK</strong> waters.<br />
The second phase of the NMMP initiated long term trend monitoring at selected sites and was modified<br />
following the recommendations of the spatial survey (Phase 1):<br />
• The number of replicate samples was optimised to enable trends to be detected without incurring<br />
excessive costs;<br />
• Eutrophication monitoring requirements were maintained at levels consistent with the OSPAR Nutrients<br />
<strong>Monitoring</strong> <strong>Programme</strong> pending the outcome of the application of the OSPAR Comprehensive<br />
(eutrophication assessment) Procedure in <strong>UK</strong> marine waters;<br />
• The programme was expanded to include measures of biological effects at selected sites;<br />
• The analysis of polycyclic aromatic hydrocarbons (PAH) in sediments and mussels was introduced on a<br />
routine basis;<br />
• Contaminant monitoring in water was limited to the provision of data from the reference sites monitored<br />
for the Dangerous Substances Directive.<br />
Procedures for screening chemical and benthic data were developed to ensure acceptable quality of data<br />
submitted to the NMMP. An Ecotoxicological Analytical Quality Control group was established to manage<br />
quality control for the expanded range of biological effects techniques included in this second phase of the<br />
NMMP.<br />
The 'Driving Force, Pressure, State, Impact and Response' (DPSIR) model has been used as far as possible<br />
to structure this report. Trends in inputs of contaminants to <strong>UK</strong> marine waters as estimated by the OSPAR<br />
Riverine Inputs and Direct Discharges (RID) programme are presented to indicate the pressures. Contaminant<br />
5
data are assessed against national and international criteria to describe the state of the marine environment.<br />
Biological effects measured on individual organisms and by modification of benthic community structure<br />
indicate the impacts of contaminants. Notably, this is the first <strong>UK</strong> NMMP report that uses tentative<br />
Background Reference Concentrations (BRCs) and Ecotoxicological Assessment Criteria (EACs) to evaluate<br />
present levels of contamination against pristine conditions. The results must be treated with a great deal of<br />
caution because BRC values do not yet reflect regional differences in geochemistry and EAC values have been<br />
extrapolated from limited datasets.<br />
The results show that:<br />
• Water borne loads (direct and riverine inputs) of measured contaminants to coastal waters have decreased<br />
since 1990;<br />
• Riverine inputs of nitrogen appear to be increasing. However, these nitrogen inputs are strongly correlated<br />
with riverine flow and, since 1997, flows have been significantly above the long-term average. When this<br />
skewed distribution in flow rates is taken into account, there would appear to be no underlying change in<br />
the riverine inputs of nitrogen;<br />
• The highest nitrate concentrations inevitably occur in coastal waters subject to most dilution by nutrient<br />
rich river waters, such as the eastern Irish Sea where the size of the river inputs and restricted circulation<br />
combine to reduce dilution;<br />
• Contaminant concentrations in waters vary in relation to tidal state and changes in discharges.<br />
Concentrations are generally low and not toxic to sensitive test organisms. Higher concentrations are<br />
recorded where there are known inputs and impacts are measured occasionally on sensitive test organisms<br />
at some sites;<br />
• Historical inputs of contaminants to estuaries still lead to elevated concentrations of mercury, cadmium,<br />
Polychlorinated Biphenyls (PCBs) and PAHs in some estuarine sediments. Concentrations are lower<br />
at coastal sites. Benthic community structure was determined more by environmental factors than<br />
contaminant concentrations. However, localised areas of contaminated sediments in industrialised<br />
estuaries were found to be toxic to test organisms;<br />
• Highest concentrations of contaminants in biota continue to be found in industrialised estuaries and those<br />
adjacent coastal areas with a known history of contaminant input. Biological effects, such as induction<br />
of increased enzyme activity (e.g. EROD), were found in some fish populations from these areas. Imposex<br />
in dogwhelks, induced by exposure to tributyl tin (TBT), remains widespread, but reproduction was only<br />
impaired significantly in the vicinity of harbours and marinas;<br />
• The data collected to date show that the power of the present programme to detect trends is variable<br />
between contaminant and matrix. This information will be used to refine the programme so that, for<br />
example, sampling may be increased at 'key' monitoring stations to maximise returns on sampling effort.<br />
In the light of these results, the following amendments to the programme are proposed:<br />
• The programme will be adapted to fulfil future monitoring requirements arising from changes to the JAMP<br />
programme and the new EC Water Framework Directive;<br />
• The nutrient monitoring programme will be revised to align more closely with the OSPAR criteria;<br />
• Where contaminant concentrations in sediment exceed assessment criteria levels, sediment bioassays will<br />
be used to assess any impact on biota;<br />
• The biological effect of metals and other contaminants on mussels will be assessed through the<br />
measurement of metallothionein and scope for growth;<br />
• The programme will be redesigned to target effort at identified ‘key’ monitoring sites.<br />
6
1. INTRODUCTION<br />
The <strong>National</strong> <strong>Marine</strong> <strong>Monitoring</strong> <strong>Programme</strong><br />
(NMMP) was initiated in the late 1980s to<br />
provide an overview of the quality of the marine<br />
environment of the United Kingdom. It was devised<br />
by the <strong>Marine</strong> Environment <strong>Monitoring</strong> Group<br />
(MEMG) (Table 1) and is fulfilled by collaboration<br />
between fisheries organisations and environment<br />
protection agencies.<br />
The general aims of the NMMP (NMMPWG, 2001)<br />
are to:<br />
• Detect long-term trends in physical, biological<br />
and chemical variables at selected estuarine and<br />
coastal sites<br />
• Report the spatial and temporal distributions of<br />
these variables and their inter-relationships<br />
• Support and ensure consistent standards<br />
in national and international monitoring<br />
programmes for marine environmental quality<br />
• Make recommendations to MEMG as to<br />
how new analyses and techniques are best<br />
implemented in the United Kingdom<br />
• Co-ordinate, make optimum use of, and gain<br />
maximum information from marine monitoring<br />
in the United Kingdom<br />
• Provide and maintain a high quality dataset<br />
for key chemical and biological variables in the<br />
marine environment of the United Kingdom,<br />
which is available for national and international<br />
fora such as the International Council for<br />
the Exploration of the Sea and the European<br />
Environment Agency.<br />
In particular, the NMMP is designed to:<br />
• meet international marine monitoring<br />
requirements such as the Oslo and Paris<br />
Commission (OSPAR) Joint Assessment and<br />
<strong>Monitoring</strong> <strong>Programme</strong> (JAMP) and Nutrients<br />
<strong>Monitoring</strong> <strong>Programme</strong> (NEUT)<br />
• collate relevant data gathered for EC Dangerous<br />
Substances Directive (76/464/EEC), Shellfish<br />
Waters Directive (79/923/EEC), Shellfish Hygiene<br />
Directive (91/492/EEC), Urban Waste Water<br />
Treatment Directive (91/271/EEC) and Nitrates<br />
Directive (91/676/EEC)<br />
• present national data of a consistent quality<br />
assured by rigorous Analytical Quality Control<br />
(AQC)<br />
The first phase of the NMMP focussed on known<br />
impacted estuaries and showed the distribution<br />
of contaminants and their effects on sediment<br />
dwelling organisms and fish in <strong>UK</strong> marine waters<br />
(MPMMG, 1998).<br />
The second phase began in 1999 and is designed to<br />
investigate<br />
• temporal trends in contaminants in estuarine<br />
and coastal sites<br />
• the spatial distribution of new contaminants<br />
• the further development of the biological effects<br />
programme<br />
Part 1 of this report summarises the results of the<br />
first 3 years of temporal monitoring (1999-2001).<br />
Although trends are unlikely to be seen after<br />
only three years, the data allow an assessment<br />
Table 1. Members of the <strong>Marine</strong> Environment <strong>Monitoring</strong> Group<br />
Department/Devolved<br />
Administration<br />
Fisheries/<strong>Marine</strong> Environment<br />
Organisations<br />
Environment<br />
Protection Agencies<br />
Conservation<br />
Others<br />
MEMG<br />
Corresponding<br />
members<br />
• Department for Environment, Food and Rural Affairs (<strong>Defra</strong>)<br />
• <strong>National</strong> Assembly for Wales (NAW)<br />
• Scottish Executive Environment and Rural Affairs Department (SEERAD)<br />
• Centre for Environment, Fisheries and Aquaculture Science (CEFAS)<br />
• Fisheries Research Services (FRS)<br />
• Department of Agriculture and Rural Development for Northern Ireland (DARD)<br />
• Environment Agency (EA)<br />
• Scottish Environment Protection Agency (SEPA)<br />
• Environment and Heritage Service (EHS)<br />
• Joint Nature Conservation Committee (<strong>JNCC</strong>)<br />
• Inter Agency Committee on <strong>Marine</strong> Science and Technology (IACMST)<br />
• Sir Alistair Hardy Foundation for Ocean Sciences (SAHFOS)<br />
• Department of Health (DoH)<br />
• Department of Trade and Industry (DTI)<br />
• Maritime and Coastguard Agency (MCA)<br />
• Natural Environment Research Council (NERC)<br />
• Water Research Centre (WRC)<br />
• Some water companies in England and Wales<br />
7
of current contaminant levels and indicate the<br />
likely performance of the programme in detecting<br />
trends in the future. The report is timely since the<br />
NMMP is being updated to account for changes in<br />
monitoring requirements such as the introduction of<br />
a new JAMP and the implementation of the Water<br />
Framework Directive (2000/60/EC). The results will<br />
be used to ensure that any revisions to the NMMP<br />
make best use of the available resources.<br />
Part 2 of this report presents a series of case<br />
studies that, where possible, provide integrated<br />
assessments relating environmental change to<br />
changes in human activities. Some of the studies<br />
include data collected before 1999 in order to<br />
examine long-term trends. Others describe spatial<br />
surveys of new determinands that might be added<br />
to the temporal monitoring programme in response<br />
to changing legislation and chemical usage.<br />
2. METHODS<br />
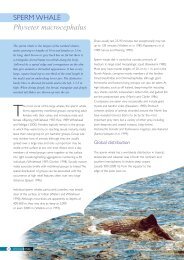
The full sample plan and detailed methods are<br />
outlined in an operational manual (NMMPWG,<br />
2001). <strong>Monitoring</strong> requirements are summarised in<br />
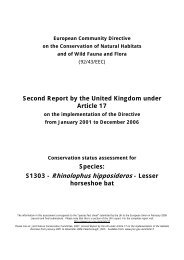
Table 2.1 and sampling sites are shown in Figure 2.1.<br />
2.1 Components of the NMMP<br />
The NMMP seeks to co-ordinate monitoring of<br />
chemical contaminants with biological effects and<br />
provide an integrated assessment of the quality<br />
of the marine environment, leading to improved<br />
environmental management.<br />
2.2 Contaminant monitoring<br />
Contaminants are measured where relevant<br />
in waters, sediments and biota to assess their<br />
distribution and fate in the environment.<br />
2.2.1 Waters<br />
The main drivers for monitoring seawater are the<br />
EC Dangerous Substances Directive and the OSPAR<br />
Nutrient <strong>Monitoring</strong> programme. Samples were<br />
collected quarterly to comply with Dangerous<br />
Substances Directive requirements and nutrient<br />
samples were collected during winter months<br />
(December -March) to establish maximum<br />
concentrations.<br />
Seawater monitoring provides a ‘snap-shot’ of<br />
environmental quality that depends on tidal<br />
movements, inputs and rate of removal. Increasing<br />
the number of samples provides a better picture of<br />
environmental quality but is not always practicable.<br />
In situ instrumentation is being used to collect<br />
continuous nutrient information at two sites in the<br />
Irish and North Sea.<br />
2.2.2 Sediments<br />
When particles carried by rivers meet saline<br />
conditions, their surface charge changes and they<br />
drop on to the sediment. Estuarine sediments<br />
therefore act as sinks for contaminants.<br />
Five replicate samples were collected at each site<br />
for analysis of trace metals and organic compounds.<br />
Table 2.1 <strong>Monitoring</strong> required<br />
Determinand sediments shellfish fish<br />
tissue<br />
fish liver<br />
filtered<br />
water<br />
unfiltered<br />
water<br />
Chemical contaminants<br />
Nutrients<br />
√<br />
Metals √ √ √ √ √<br />
PCBs √ √ √<br />
Organochlorine pesticides √ √<br />
PAH √ √<br />
Biological effects<br />
benthic macrofauna<br />
√<br />
Imposex (TBT)<br />
√<br />
EROD<br />
√<br />
Oyster Embryo Bioassay<br />
Fish disease √ √<br />
Metallothionein<br />
√<br />
DNA adducts<br />
√<br />
√<br />
8
85<br />
95<br />
105<br />
76<br />
125<br />
115<br />
205 206<br />
55<br />
175<br />
65 207<br />
45<br />
200<br />
70<br />
875 35<br />
865<br />
820<br />
880<br />
845<br />
605<br />
825<br />
809<br />
815 806<br />
807<br />
808<br />
796<br />
776 715 775<br />
706<br />
690<br />
646<br />
805 795 767 785<br />
766<br />
648<br />
665 647<br />
655<br />
656<br />
555<br />
565 576<br />
585<br />
25<br />
768<br />
765<br />
705<br />
755<br />
625<br />
645 635<br />
615<br />
537<br />
536<br />
535<br />
210<br />
220<br />
244<br />
235 225<br />
245<br />
270 275<br />
265 295<br />
305 325<br />
315<br />
567<br />
566<br />
165<br />
505<br />
515<br />
495<br />
358<br />
357<br />
377<br />
385<br />
388<br />
389<br />
286<br />
344<br />
330<br />
356<br />
375<br />
376<br />
385<br />
386<br />
285<br />
395<br />
475<br />
390<br />
435 455 466<br />
465<br />
527 526<br />
485<br />
486<br />
346<br />
345<br />
Figure 2.1<br />
Location of sampling sites<br />
Five replicate samples were also collected for<br />
benthic community structure analysis at the same<br />
time (Section 2.3). Samples were collected annually<br />
between February and June. Where possible, the<br />
fine fraction (
2.3 <strong>Monitoring</strong> of biological effects<br />
Biological effects measure the response of<br />
organisms to contaminants, rather than the levels<br />
of the contaminants themselves. Biological effects<br />
monitoring thus might give a clearer picture of the<br />
health and quality of the marine environment. Some<br />
techniques are pollutant specific (e.g. imposex in<br />
dogwhelks due to tributyl tin (TBT) pollution), and<br />
some are more general measures (e.g. fish disease<br />
studies).<br />
2.3.1 Benthic macrofauna<br />
Benthic macrofauna are the animals living within<br />
(infauna) or on (epifauna) the surface of the<br />
sediments. Benthic organisms are effectively sessile<br />
so act as integrators of the effects of environmental<br />
stresses, whether natural, like salinity changes, or<br />
anthropogenic. Benthic communities have long<br />
been studied as a measure of environmental quality<br />
(Holme and McIntyre, 1971).<br />
2.3.2 Oyster embryo bioassay<br />
Young oysters undergo intense cellular activity<br />
during the early stages of development. The<br />
presence of contaminants in the surrounding<br />
environment adversely affects development of<br />
their normal shape. Embryos are exposed to<br />
environmental and clean water samples and their<br />
development is compared. The difference gives a<br />
measure of overall water quality.<br />
2.3.3 Fish disease studies<br />
Sampling and disease reporting followed protocols<br />
set up by the International Council for the Exploration<br />
of the Seas (ICES) (Bucke et al., 1996). Target fish<br />
species are dab (L. limanda) and cod (Gadus morhua)<br />
for offshore locations and the European flounder (P.<br />
flesus) for inshore or estuarine stations. Fish were<br />
examined for both externally visible diseases and<br />
internal diseases. Internal lesions indicating exposure<br />
to contaminants include foci of cellular alteration<br />
(FCA), and benign and malignant tumours.<br />
2.3.4 Imposex studies<br />
The imposex condition has been strongly linked<br />
with the presence of organotins in the environment<br />
(Gibbs et al., 1987). Imposex is an abnormality<br />
in gastropod molluscs in which male sexual<br />
characteristics are imposed on the genital systems<br />
of females. The female develops a penis and a vas<br />
deferens, which may block the genital opening<br />
so that egg capsules cannot be laid. Affected<br />
populations gradually decline and may become<br />
eliminated.<br />
2.3.5 The mixed function oxidase test<br />
(EROD)<br />
EROD or Ethoxyresorufin-O-deethylase activity<br />
provides an indication of the presence of a range of<br />
organic contaminants in fish. When absorbed, these<br />
contaminants induce synthesis of enzymes known<br />
as the cytochrome P450 group. Cytochrome<br />
P4501A1 (CYP1A1) is the terminal component and<br />
EROD activity is CYP1A1 dependent.<br />
2.3.6 Metallothionein<br />
<strong>Marine</strong> organisms produce metallothioneins (MT)<br />
to convert the toxic forms of some metals into less<br />
toxic, bound forms. The bound forms can then be<br />
safely stored and may be excreted. The presence of<br />
MT indicates exposure to these metals, rather than<br />
any impact of exposure on the well-being of the<br />
animal. MT is usually measured in the liver of fish<br />
(and related organs in invertebrates), as the liver<br />
normally contains the highest concentrations of<br />
inducing metals.<br />
2.3.7 DNA adducts<br />
DNA adducts are formed when reactive chemicals<br />
bind to DNA. The presence of DNA adducts<br />
is linked to PAH exposure and the presence of<br />
cancerous growths in fish liver.<br />
2.4 Indicators<br />
Indicators summarise complex information or raw<br />
data and can be used to assess the effectiveness of<br />
alternative policy options and keep policy makers<br />
and the public better informed. Under the NMMP,<br />
the MEMG has been developing indicators for<br />
hazardous substances, eutrophication and litter,<br />
as part of a wider initiative to develop a suite of<br />
marine indicators to report on the state of the<br />
<strong>UK</strong> marine environment and to measure changes.<br />
Some of these indicators have been used for the<br />
first time in this report.<br />
2.4.1 Indicators of chemical quality<br />
• Concentrations of hazardous substances<br />
compared to Environmental Quality<br />
Standards (EQSs)<br />
EQSs are concentrations below which a substance is<br />
not believed to be detrimental to aquatic life. These<br />
were originally developed for the EC Dangerous<br />
Substances Directive (76/464/EEC). The concept<br />
is now well established and is incorporated into<br />
the Water Framework Directive (2000/60/EC).<br />
EQSs are derived using acute toxicity tests on<br />
organisms at different trophic levels. To provide a<br />
safety factor, the EQS is set substantially below the<br />
concentration observed to have a toxic effect on<br />
10
the test organisms. EQSs vary for each substance<br />
and can be different for fresh, estuarine or coastal<br />
waters. EQSs for the most toxic substances (List<br />
1 EC Dangerous Substances Directive or Annex 1<br />
substances in the EC Water Framework Directive)<br />
are set at a European level. The EQSs for less toxic<br />
substances are set nationally.<br />
EQSs for water have been used in this report,<br />
however it should be noted that these are currently<br />
under review, for 33 substances, under the Water<br />
Framework Directive. EQSs have not yet been<br />
developed for sediments and biota where the<br />
‘EQS’ is simply a standstill clause (i.e. no upward<br />
trends in concentrations). This presents a difficulty<br />
when interpreting data in sediments and biota<br />
and is recognised as an area that needs further<br />
development.<br />
• Concentrations of hazardous substances<br />
compared to Background Reference<br />
Concentrations (BRCs)<br />
BRCs were adopted by OSPAR in 1997 for<br />
contaminants in seawater, sediment and biota,<br />
as assessment tools for use in Quality Status<br />
Reports. BRCs were developed by examining<br />
typical concentrations of both naturally occurring<br />
and man-made contaminants in remote parts of<br />
the OSPAR maritime area. In general, man-made<br />
substances are expected to have a background<br />
concentration of zero. However, due to their<br />
persistence and long-range transport, many<br />
substances are detected in remote areas. For<br />
naturally occurring substances, the BRC is the<br />
range of concentrations that would be anticipated<br />
in the absence of any human activity.<br />
Assessments made against the current<br />
OSPAR BRCs should be treated with caution.<br />
Reservations have been expressed over<br />
the current BRCs, due to the difficulties in<br />
deriving and applying such assessment criteria<br />
over wide geographical areas. In particular,<br />
BRC values need to take account of natural<br />
variability, for example, in the source rocks<br />
for coastal sediments. OSPAR has recognised<br />
that the current values require revision and a<br />
review is underway at present<br />
• Concentrations of hazardous substances<br />
compared to Ecotoxicological Assessment<br />
Criteria (EACs)<br />
EACs were also adopted by OSPAR in 1997. EACs<br />
are the concentrations of substances above which<br />
there may be impacts on biota. They are used<br />
to identify potential areas of concern and to<br />
prioritise substances for attention. The concepts<br />
behind EACs and EQSs are similar, however EACs<br />
exist for a number of substances in sediments and<br />
biota.<br />
As with BRCs, assessments made against current<br />
EACs should be treated with extreme caution.<br />
Concentrations of a contaminant below the EAC<br />
for that contaminant do not guarantee a safe<br />
situation. On the other hand, it is not compelling<br />
that biological effects occur where an EAC is<br />
exceeded. This can only be established through<br />
biological investigations in the field. Current<br />
EACs are being reviewed along with BRCs. It<br />
seems likely that existing EACs will no longer<br />
be endorsed, being replaced by new criteria<br />
developed using the improved methodologies<br />
now available for effects assessment.<br />
2.4.2 Indicators of biological quality<br />
Benthic community data are summarised using the<br />
following:<br />
• Univariate Indicators<br />
These summarise the fauna composition. Examples<br />
are the number of taxa (T), abundance of taxa<br />
(A), evenness of taxa distribution (J’), and diversity<br />
measured by the Shannon-Wiener index (H’).<br />
• Multivariate Indicators<br />
Multivariate statistics examine the similarity<br />
between different sites in terms of species<br />
composition. These similarities can then be<br />
examined against environmental variables to link<br />
changes in species composition with pollution.<br />
• Biotic Indices<br />
These summarise the way the fauna functions. Two<br />
biotic indices are used in this report: the <strong>UK</strong> Infaunal<br />
Trophic Index (ITI) and the AZTI <strong>Marine</strong> Biotic Index<br />
(AMBI). The ITI was developed to distinguish the<br />
impact of organic deposits from municipal sewage<br />
discharges on infauna in fully marine environments.<br />
Biological effects indicators are being developed.<br />
A recent workshop examined the JAMP suite of<br />
biological effects techniques, the data sets available<br />
and their suitability for indicator reporting. It<br />
concluded that imposex in dogwhelks, fish disease,<br />
EROD, oyster embryo bioassay and sediment<br />
bioassays were suitable for immediate development<br />
for indicator reporting, but that bile metabolites and<br />
metallothionein still require substantial development.<br />
2.5 Framework for indicators<br />
The framework adopted for the development of<br />
marine indicators is the DPSIR model, currently<br />
used by the European Environment Agency (EEA).<br />
The framework assumes cause-effect relationships<br />
between interacting components of social,<br />
economic, and environmental systems, which are<br />
• Driving forces of environmental change (e.g.<br />
industrial production)<br />
11
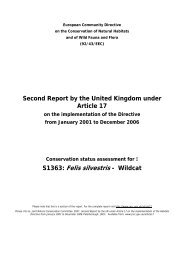
Driving force Pressure State Impact Response<br />
Shipping/transport<br />
Industry (including offshore)<br />
Agriculture<br />
Horticulture<br />
Inputs from point (dredged material/<br />
paint or effluent disposal)<br />
and diffuse sources (movement of<br />
ships)<br />
Concentrations in<br />
sediment or biota<br />
Species effects (imposex)<br />
and<br />
Population effects<br />
reduction at/of<br />
sources<br />
• Pressures on the environment (e.g. discharges of<br />
waste water)<br />
• State of the environment (e.g. water quality in<br />
estuarine and coastal waters)<br />
• Impacts on population, economy, ecosystems<br />
(e.g. reduction in benthic diversity)<br />
• Response of the society (e.g. improved<br />
environmental protection)<br />
The DPSIR model has been used to link the driving<br />
forces and pressures with observations in the<br />
marine environment. Some case studies in Part II of<br />
this report have used the model.<br />
The aim of such an approach is:<br />
• to provide information on all of the different<br />
elements in the DPSIR chain<br />
• to demonstrate how these elements are<br />
interconnected &<br />
• to measure/estimate the effectiveness of<br />
management responses.<br />
An example of how the DPSIR model can be used<br />
in relation to the problem of TBT pollution from<br />
antifouling applications from ships is given above.<br />
The development of marine indicators in the <strong>UK</strong><br />
is still in its early stages. Before formal adoption,<br />
further testing and evaluation is required for some<br />
of the proposed indicators and further research and<br />
development for others.<br />
It is anticipated that more indicators will be<br />
introduced into future NMMP reports and other<br />
reports on the state of the <strong>UK</strong> marine environment.<br />
3. QUALITY CONTROL AND<br />
DATA ASSESSMENT<br />
3.1 Chemistry<br />
The remit of the NMCAQC group is to provide<br />
quality assurance (QA) for all marine chemistry data<br />
submitted as part of the NMMP programme. The<br />
group maintains and, where necessary, takes steps<br />
to improve the current level of QA. This is achieved<br />
through a combination of external and internal<br />
AQC programmes. The group objectively evaluates<br />
laboratories’ performance, and ensures that where<br />
necessary, appropriate measures such as workshops<br />
are put in place to enable laboratories to improve<br />
their performance. The group also ensures that QA<br />
is in place for new determinands introduced to the<br />
NMMP (e.g. TBT in sediments, chlorophyll).<br />
Laboratories have subscribed to the QUASIMEME<br />
inter-laboratory proficiency-testing (PT) scheme<br />
since it became available in 1996.<br />
QUASIMEME provides:<br />
• PT samples twice annually for all current NMMP<br />
determinands<br />
• development exercises for new determinands<br />
• workshops to help laboratories identify and<br />
resolve analytical problems<br />
NMCAQC:<br />
• collates the PT results<br />
• promotes in-house AQC<br />
• Sets accuracy and precision targets<br />
• Ensures all NMMP determinands are covered by<br />
QUASIMEME<br />
• Assesses the quality of data submitted to NMMP<br />
through application of a data filter.<br />
In the data filter, aspects of external and internal<br />
AQC are set as criteria to be met, and these are<br />
awarded points (Table 3.1) that are summed to<br />
produce a total score. Acceptable scores were set<br />
for each determinand matrix combination according<br />
to the complexity of the analyses.<br />
Table 3.2 shows the percentages of data for<br />
each determinand/matrix combination that met<br />
the data filter criteria for the years 1999-2001,<br />
for the combined three-year period. The data<br />
acceptance rate was greater than 80%, except for<br />
organochlorine substances and PAHs in shellfish.<br />
NMCAQC is planning workshops hosted by expert<br />
laboratories to try to improve performance for these<br />
determinands and has asked laboratories to submit<br />
improvement plans.<br />
Due to the lack of in-house AQC information,<br />
the data filter could not be used for metals and<br />
organics in seawater. The acceptance of data for<br />
12
Table 3.1. Data Filter Criteria<br />
Data Filter Criterion Score %<br />
Is the laboratory accredited for the specified determinand - is the lab. well organised? 5<br />
Is the Limit of Detection achieved consistent with NMMP requirements? (1) 5<br />
Control charts - are charts plotted for the determinand in question? – a key element of routine QC 15<br />
Comparison of control chart expected value with control chart mean value – an indicator of bias.(1) 15<br />
Number of measurements made on control chart reference material during period of interest – indicator of the power of<br />
chart to detect anomalies (2)<br />
15<br />
Control chart reference material standard deviation (s.d.)– a measure analytical precision (1) 10<br />
Number of measurements used to establish s.d.td devn for control chart limits – reliability of s.d. estimate and of control<br />
limits<br />
5<br />
Number of breaches of warning limits during period for which limits apply (used to assess validity of control limits) (3) -5 or 0<br />
Proficiency testing (4) 30<br />
Total 100<br />
Table 3.2. Percentage of data accepted into the NMMP database<br />
Determinand Group Percentage of data accepted<br />
1999 2000 2001<br />
Nutrients 93 93 93<br />
Metals in sediments 100 100 100<br />
PCBs in sediments 95 95 94<br />
PAH in sediments 82 83 93<br />
Metals in shellfish 95 93 95<br />
PCBs in shellfish 100 99 98<br />
OCs in shellfish 30 29 31<br />
PAH in shellfish 60 59 62<br />
Metals and PCBs in fish 96 100 97<br />
Metals in waters 93 93 93<br />
Organics in waters 95 95 95<br />
these determinands was based on proficiency test<br />
performance. Data was accepted if 50% of the<br />
PT samples were within the accepted range (i.e.<br />
a Z score
3.2.1 Targets and standards<br />
Benthic Fauna<br />
Data quality is assessed by comparing the percent<br />
similarity of the Own Sample as measured by the<br />
lab and the auditor using the Bray-Curtis Similarity<br />
Index (BCSI). A five-tier system is applied (see Table<br />
3.3). Samples not reaching the required standards<br />
are flagged, along with the remaining replicates<br />
from the same NMMP site. Labs are encouraged<br />
to reanalyse flagged samples to produce data of<br />
acceptable quality, which can be submitted to the<br />
NMMP database.<br />
Particle Size Analysis<br />
Data is assessed on the basis of z-scores for each<br />
lab compared to the means of all labs, after removal<br />
of statistical outliers.<br />
Table 3.3. Data quality assessment criteria<br />
BCSI (%)<br />
3.3 Ecotoxicology<br />
Description of Results and Actions<br />
100 Excellent<br />
95-
4. RESULTS<br />
As outlined above, the NMMP is designed to<br />
contribute to the <strong>UK</strong>’s national and international<br />
monitoring requirements. These satisfy EC<br />
Directives and the OSPAR Joint Assessment and<br />
<strong>Monitoring</strong> <strong>Programme</strong> (JAMP). JAMP questions<br />
relevant to the monitoring are highlighted in the<br />
text. Results are discussed according to their matrix<br />
(waters, sediments, shellfish and fish). In each<br />
matrix, contaminant concentrations are presented<br />
followed by biological effects.<br />
4.1 Waters<br />
This section includes results from the OSPAR<br />
Riverine Inputs and Direct Discharge (RID)<br />
monitoring programme, which quantifies inputs to<br />
marine waters from rivers and effluents. Nutrient,<br />
trace metal and trace organic concentrations in<br />
waters are presented. The biological effects of<br />
nutrients have not been measured for the current<br />
programme but general water quality has been<br />
determined by the oyster embryo bioassay test.<br />
4.1.1 Nutrients<br />
Nutrient monitoring is required by the EC Urban<br />
Waste Water Treatment Directive (UWWTD)<br />
(91/271/EEC), the Nitrates Directive (91/676/EEC)<br />
and the OSPAR Strategy to Combat Eutrophication.<br />
The aim is to determine whether waters show<br />
signs of eutrophication: defined as ‘an undesirable<br />
disturbance to the balance of organisms present<br />
and to the quality of the water concerned, which<br />
results from the accelerated growth of algae<br />
and higher plant forms caused by anthropogenic<br />
sources of nutrients’ (91/271/EEC). Both the EC and<br />
OSPAR measures require action to reduce inputs<br />
when there are reasonable grounds for concern<br />
that eutrophication already affects waters or may<br />
occur in currently unaffected waters. The UWWTD<br />
requires treatment of point source discharges so<br />
as to reduce their nutrient content, the Nitrates<br />
Directive requires reduction of diffuse inputs of<br />
nutrients and OSPAR seeks to reduce all nutrient<br />
inputs to marine waters.<br />
This section addresses JAMP Issue 2.1: “Are<br />
agreed measures effective at reducing nutrient<br />
inputs?”. Winter nutrient concentrations in <strong>UK</strong><br />
marine waters are also presented because they are<br />
one of a suite of criteria to assess eutrophication.<br />
There are no agreed BRCs or EACs for nutrients;<br />
however suggested draft common assessment<br />
criteria for <strong>UK</strong> waters subject to the OSPAR Common<br />
Assessment Procedure for eutrophication are shown in<br />
Table 4.1.<br />
Waterborne loads of nutrients entering marine<br />
waters via rivers (Riverine inputs) and directly from<br />
wastewater discharges on <strong>UK</strong> coasts and estuaries<br />
(Direct inputs) are estimated from spot measurements<br />
of concentration and flow. Riverine inputs include<br />
wastewater discharges upstream of the sampling point<br />
used to calculate river inputs. <strong>Monitoring</strong> of annual<br />
inputs of nutrients to <strong>UK</strong> tidal waters from riverine<br />
and direct sources was initiated in 1990 as part of<br />
the OSPAR RID reporting programme. Estimates<br />
of nitrogen and phosphorus inputs for 1985 were<br />
reported to the North Sea Conference as a baseline<br />
for the reduction programme.<br />
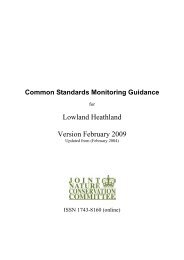
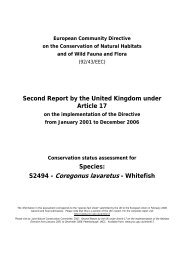
Figures 4.1 and 4.2 show that, since 1985, inputs of<br />
total phosphorus fell by about 40-50%, but there<br />
was no reduction in nitrogen inputs. Closer scrutiny<br />
shows that, since 1990, direct inputs of phosphorus<br />
and nitrogen have decreased by some 30-40%.<br />
This reflects the effectiveness of measures taken<br />
to control point source discharges direct to marine<br />
waters. Over the same period, riverine inputs of<br />
both nutrients have increased but varied significantly<br />
in relation to river flow. Flows (Figure 4.1) have<br />
varied widely over the period and have been<br />
particularly high in recent years. Since 1990, mean<br />
flows have been above the long-term average and<br />
generally exhibit an upward trend. Nitrogen inputs<br />
have closely followed the pattern in river flows.<br />
Elevated nutrient concentrations are part of a<br />
suite of indicators used to assess eutrophication.<br />
Conventionally, monitoring is restricted to winter<br />
months (Dec-Feb) to estimate the maximum nutrient<br />
concentration and thus, depending upon retention,<br />
to indicate nutrients in the body of water available<br />
Table 4.1. Draft Common Assessment Criteria for the Comprehensive procedure<br />
Dissolved Inorganic<br />
Nitrogen (salinity<br />
related and/or region<br />
specific) background<br />
concentration<br />
Elevated winter<br />
Dissolved Inorganic<br />
Nitrogen levels<br />
(roughly set at<br />
>50% above salinity<br />
related and/or region<br />
specific background<br />
concentration)<br />
Dissolved Inorganic<br />
Phosphorus (salinity<br />
related and/or region<br />
specific) background<br />
concentration<br />
Elevated winter<br />
Dissolved Inorganic<br />
Phosphorus levels<br />
(roughly set at<br />
>50% above salinity<br />
related and/or region<br />
specific background<br />
concentration)<br />
Offshore North Sea 10 µmol l -1 >15 µmol l -1 0.6 µmol l -1 >0.8 µmol l -1<br />
Channel 9 µmol l -1 >15 µmol l -1 0.4 µmol l -1 >0.8 µmol l -1<br />
Irish Sea (saline waters) 12 µmol l -1 >18 µmol l -1 0.8 µmol l -1 >1.25 µmol l -1<br />
15
Total N (kg yr -1 )<br />
450<br />
400<br />
350<br />
300<br />
250<br />
X<br />
X<br />
200<br />
Direct Inputs<br />
150<br />
Riverine Inputs<br />
100<br />
Riv+Dir Inputs<br />
50<br />
x Riverine Flows<br />
0<br />
1985 1987 1989 1991 1993 1995 1997 1999 2001<br />
Figure 4.1. Trends in direct and riverine inputs of Total N<br />
(kt/yr) to <strong>UK</strong> coastal waters compared with<br />
riverine flows (10 4 l/sec)<br />
Phosph o rus (kg yr -1 )<br />
Figure 4.2.<br />
X<br />
to support algal growth. In practice, continuous<br />
monitoring has revealed that concentrations<br />
continue to rise until conditions are suitable for algal<br />
growth (Figure 4.3). For this reason, data collected<br />
in early March were accepted from some offshore<br />
sites.<br />
Winter nutrient samples were collected for 37 sites<br />
around the <strong>UK</strong> during 1999-2001. This is a small<br />
proportion of the total sampling effort in <strong>UK</strong> coastal<br />
waters, with more intensive sampling carried out<br />
in many areas. Most NMMP sites were sampled<br />
annually, but some coastal sites were only sampled<br />
in 1999 and 2001. Measurements were excluded<br />
micro mol N<br />
70<br />
60<br />
50<br />
40<br />
30<br />
20<br />
10<br />
0<br />
1985 1987 1989 1991 1993 1995 1997 1999 2001<br />
10<br />
12<br />
8<br />
6<br />
0 24<br />
1995<br />
X<br />
Inputs of phosphate phosphorus (kt/yr) to <strong>UK</strong><br />
coastal waters 1990-2000<br />
1996<br />
total<br />
direct<br />
riverine<br />
1997<br />
1998<br />
Figure 4.3. Continuous Total Oxidised Nitrogen (nitrite +<br />
nitrate) data from the DARD moored sampler<br />
in the Irish Sea<br />
X<br />
1999<br />
X<br />
X<br />
2000<br />
X<br />
X<br />
2001<br />
X<br />
X<br />
2002<br />
X<br />
from sites where the salinity was less than 30, as<br />
concentrations at low salinity sites are high because<br />
of riverine inputs and the draft OSPAR assessment<br />
criteria are related to waters with a salinity of 34 or<br />
higher.<br />
Nutrient concentrations<br />
Ammonia<br />
Ammonia is a reduced form of nitrogen, readily<br />
oxidised to nitrate. The main sources are<br />
wastewater discharges, and benthic inputs in<br />
turbid estuaries (Balls, 1992). Direct discharges of<br />
sewage contributed over half of the total input to<br />
<strong>UK</strong> coastal waters in 2000. Highest concentrations<br />
in the initial spatial survey occurred in low salinity<br />
waters in the Mersey, Tees, Tyne and Wear<br />
estuaries. Data from these sites were excluded from<br />
this survey on the basis of salinity and there are no<br />
data for coastal waters in England and Wales, so the<br />
only data available is from Scotland and Northern<br />
Ireland. Concentrations were highest at Clyde and<br />
Belfast Lough stations and low at offshore sites.<br />
The median concentration of ammonia ranged from<br />
0.2-10 µM.<br />
Total Oxidised Nitrogen (TOxN)<br />
TOxN is a combination of nitrite and nitrate.<br />
Nitrate is the fully oxidised and most stable form of<br />
nitrogen in oxygenated waters. Nitrite is a reduced<br />
form of nitrogen, intermediate between nitrate and<br />
ammonia. Concentrations of nitrite are generally<br />
low (34, with the exception of the Eastern Irish Sea and<br />
Celtic Deep. Nutrient concentrations in nearshore<br />
waters of the Eastern Irish Sea are high as a result<br />
of large inputs to an area with restricted dilution<br />
and dispersion. Long term trend studies off the<br />
southwest coast of the Isle of Man show that<br />
nitrogen concentrations increased from the 1950s<br />
to the 1970s then stablilised (Gowen et al., 2002).<br />
Evans et al (2001) detected a recent decrease<br />
in nitrate concentrations at this location and in<br />
the Menai Straits. High variability in the limited<br />
data resulted in the 95 percent confidence limit<br />
exceeding the criteria in the Celtic Deep.<br />
16
(a)<br />
(b)<br />
0.40 µM<br />
0.80 µ M<br />
1.25 µ M<br />
7 µM<br />
15 µM<br />
30 µM<br />
(c)<br />
2 µM<br />
5 µ M<br />
10 µ M<br />
Figure 4.4.<br />
Nutrient concentrations : (a) phosphate,<br />
(b) TOxN and (c) silicate<br />
17
Phosphate<br />
Direct and riverine inputs of phosphate are a<br />
similar magnitude; however, direct inputs have<br />
decreased as riverine inputs have increased (Figure<br />
4.2). Riverine inputs are a combination of waste<br />
water discharges and run off from the land. They<br />
are modified in turbid estuaries by adsorption onto<br />
particulate matter at low salinities and release from<br />
particulate matter at higher salinities (Balls, 1992).<br />
In coastal waters, concentrations decrease with<br />
salinity. The median concentration of phosphate<br />
ranged from 0.4-1.9 µM and exceeded OSPAR<br />
assessment criteria in inshore waters in Belfast<br />
Lough, the Thames, Liverpool Bay, Clyde , Humber,<br />
Forth and Cardigan Bay (Figure 4.4). One offshore<br />
site in the North Sea exceeded the assessment<br />
criteria due to variability in the data.<br />
Silicate<br />
Silica is required for the growth of diatoms, which<br />
have a siliceous cell wall and are the dominant algae<br />
in the Spring plankton ‘bloom’. The concentration<br />
of silicate in rivers largely depends on the local<br />
geology, with some anthropogenic input. Rivers<br />
draining catchments rich in aluminosilicate rocks are<br />
high in silicate and anthropogenic inputs arise from<br />
its use in detergents. OSPAR have not proposed<br />
assessment criteria for silicate. Median silicate<br />
concentrations ranged from 2.7-15.4 µM, with high<br />
concentrations in the Wash, Thames, Liverpool Bay<br />
and Clyde compared to other sites (Figure 4.4).<br />
Nutrient Ratios<br />
Algae are assumed to take up nutrients according<br />
to the Redfield ratio of 106C:16N:1P:16Si. Deviation<br />
from this ratio may indicate an excess of one<br />
nutrient, leading to limitation of algal growth by<br />
the other. Although nitrogen is assumed to be<br />
the limiting nutrient in coastal waters, it was in<br />
excess compared to phosphate at 17 of the 37 sites<br />
sampled and at almost all sites compared to silicate<br />
(Figure 4.5). The N:P ratio was greater than 25:1 at<br />
6 sites in the Wash, Selsey Bill, Cardigan Bay, Celtic<br />
Deep and at South Varne, off the Thames. The N:<br />
Si ratio was greater than 2:1 at 13 sites and greater<br />
than 3:1 at the Wash and Selsey Bill sites. The<br />
Wash and Selsey Bill exhibited the greatest excess of<br />
nitrogen.<br />
Summary<br />
Since 1985, <strong>UK</strong> inputs of phosphorus have reduced,<br />
but nitrogen inputs have not diminished. Inputs<br />
of nitrogen were influenced by the exceptionally<br />
high riverine flows of 1998-2001. The recent<br />
significant extension of Nitrate Vulnerable Zone<br />
designations under the Nitrate Directive and<br />
phosphate stripping at inland sewage treatment<br />
works (STWs) is expected to reduce diffuse inputs<br />
(a)<br />
(b)<br />
10<br />
25 elevated<br />
40<br />
1<br />
2<br />
3<br />
Figure 4.5. Nutrient ratios (a) TOxN:P, (b) TOxN:S<br />
18
of nitrogen and direct inputs of phosphate to rivers.<br />
Currently, the <strong>UK</strong> is raising standards at many<br />
coastal and estuarine STWs, so as to accord with<br />
UWWT Directive standards of secondary or tertiary<br />
treatment. The STW improvements are, and should<br />
continue to be, reflected in reduced direct inputs of<br />
nitrogen and phosphorus to coastal waters.<br />
Inputs of ammonia are oxidised to nitrate, which<br />
is the main form of inorganic nitrogen present in<br />
coastal waters. Riverine inputs of nitrogen are<br />
diluted by seawater in estuaries, whereas inputs<br />
of phosphate are similarly diluted by seawater, but<br />
modified by interaction with particulate matter in<br />
turbid estuaries. The concentrations of nutrients in<br />
coastal waters depend upon the size of the input<br />
and the available dilution. A review of nutrient<br />
inputs to estuaries showed relatively high loads<br />
of TOxN to the Severn, Mersey, Clyde, Humber,<br />
Thames and Solent estuaries, whilst loads to<br />
west Wales and northern Scottish estuaries were<br />
particularly low (Nedwell et al., 2002). Nitrate<br />
concentrations were below OSPAR assessment<br />
criteria in most offshore sites except in the Eastern<br />
Irish Sea and Celtic Deep. Assessment criteria were<br />
also exceeded close to large riverine inputs at the<br />
mouths of estuaries.<br />
Nutrient uptake by phytoplankton begins when<br />
conditions are suitable for growth, usually in early<br />
Spring. Continuous monitoring has shown the<br />
short-term variability in nutrient concentrations<br />
and highlighted the limitations of spot samples<br />
in evaluating the winter nutrient maximum.<br />
Continuous measurements of nutrients at the<br />
NMMP site in the Irish Sea are described in more<br />
detail in the Case Study section of this report.<br />
The effect of nutrients on algal growth is quantified<br />
by the measurement of chlorophyll. Chlorophyll<br />
measurements for the second phase of the NMMP<br />
were limited and are not reported. Temporal trends<br />
in phytoplankton in coastal waters are summarised<br />
in the Case Study section, using data collected by<br />
the Sir Alister Hardy Foundation for Ocean Science<br />
continuous plankton recorder. These data show<br />
that large scale variations in phytoplankton are<br />
associated with interannual variations in climate.<br />
Future monitoring for the NMMP should include<br />
all OSPAR assessment criteria for eutrophication,<br />
including routine measurements of chlorophyll a<br />
as an indicator of phytoplankton growth and an<br />
assessment of species composition to establish<br />
imbalance in the system.<br />
4.1.2 Contaminant concentrations<br />
Contaminants in the marine environment are<br />
derived from industrial and sewage effluents,<br />
rivers and atmospheric inputs. Inputs have been<br />
monitored at the tidal limit of rivers and in direct<br />
discharges since 1990. Figure 4.6 shows total<br />
inputs of mercury, cadmium, lead, copper, zinc and<br />
lindane from rivers, sewage and industrial effluents<br />
to <strong>UK</strong> waters for the period 1990-2001. Inputs are<br />
calculated by multiplying the concentration by the<br />
flow, to give the ‘load’. In some cases the measured<br />
concentration is below the limit of detection. The<br />
actual concentration is unknown and lies between<br />
zero and the limit of detection. These values are<br />
used to calculate lower and upper estimates for the<br />
load, which is reported as a range.<br />
There was a reduction of about 70% in the<br />
mercury load during 1990-2001, due to controls<br />
on discharges from chlor-alkali plants and other<br />
industries. Cadmium loads fell by about 75%<br />
over the same period. The <strong>UK</strong> input of lead<br />
shows no trend over the past decade following<br />
the 60% reduction in inputs between 1985 and<br />
1990 as reported by the <strong>UK</strong> to the Fifth North Sea<br />
Conference. This decrease correlated closely with<br />
the steep fall in emissions to air, due to the phasing<br />
out of lead in petrol. The loads of copper and zinc<br />
to estuarine and coastal waters fluctuated during<br />
the 1990s with an overall downward trend for both<br />
metals.<br />
Lindane or gamma-hexachlorocyclohexane<br />
(gamma-HCH) was used widely as an insecticide<br />
and preservative until 2002 when it was banned<br />
as an agricultural pesticide in the EU. Its sale and<br />
supply were also banned in the <strong>UK</strong>. Inputs of<br />
lindane declined by 60-80% between 1990 and<br />
2001.<br />
Metals and organics in water<br />
Concentrations of contaminants in marine<br />
waters are compared with the Environmental<br />
Quality Standards (EQSs) set in response to the<br />
EC Dangerous Substances Directive (76/464/<br />
EEC). Under the Directive, discharges containing<br />
dangerous substances and their receiving waters<br />
are monitored. Results are presented here for the<br />
national background reference or ‘control’ sites for<br />
each estuary, which form part of the NMMP, and<br />
not for sites close to discharges.<br />
19
80<br />
60<br />
Cadmium<br />
1000<br />
800<br />
Copper<br />
Tonnes<br />
40<br />
20<br />
0<br />
1990 1992 1994 1996 1998 2000<br />
Tonnes<br />
600<br />
400<br />
200<br />
0<br />
1990 1992 1994 1996 1998 2000<br />
15<br />
Mercury<br />
5000<br />
4000<br />
Zinc<br />
Tonnes<br />
10<br />
5<br />
Tonnes<br />
3000<br />
2000<br />
1000<br />
0<br />
1990 1992 1994 1996 1998 2000<br />
0<br />
1990 1992 1994 1996 1998 2000<br />
800<br />
600<br />
Lead<br />
1000<br />
800<br />
Gamma-HCH<br />
Tonnes<br />
400<br />
200<br />
0<br />
1990 1992 1994 1996 1998 2000<br />
kg<br />
600<br />
400<br />
200<br />
0<br />
1990 1992 1994 1996 1998 2000<br />
Figure 4.6. <strong>UK</strong> inputs to the sea, 1990 to 2001<br />
Although compliance with EQSs is assessed by<br />
comparison with annual average concentrations,<br />
the results reported here are presented as median<br />
concentrations for consistency with the other<br />
contaminant groups. Where there were fewer<br />
than six results for a substance at any site over the<br />
three-year period these were excluded from the final<br />
assessment. Some subjective comparisons are also<br />
made with survey results for 1993 to 1995, presented<br />
in the first NMMP report (MPMMG, 1998).<br />
Estuarine concentrations of contaminants are<br />
dominated by riverine and direct (industrial and<br />
sewage effluent) inputs. Atmospheric deposition of<br />
contaminants is less significant and is not discussed<br />
here, although it is of major importance to the<br />
North East Atlantic as a whole (OSPAR Commission,<br />
2000a). Salinity is an important variable as<br />
concentrations of metals, such as cadmium and<br />
copper, tend to decrease with increasing salinity<br />
as they are diluted in outer estuaries and offshore<br />
waters (OSPAR Commission, 2000c). However,<br />
since data are only reported here for the national<br />
background reference (‘control’) site in most<br />
estuaries, these gradients are not shown by the<br />
present data set.<br />
Metals<br />
Median metals concentrations were below the EQSs<br />
at all sites (Table 4.2). However the upper 90%<br />
confidence limits exceeded the EQS for copper at<br />
one site in the Thames estuary and for zinc in the<br />
Tyne estuary and in the Wash.<br />
Mercury concentrations were below detection<br />
(10 ng l -1 or lower) in most samples. The sources<br />
of mercury include industrial effluents and use in<br />
products such as dental fillings, batteries, lighting<br />
20
Table 4.2 Summary of metals concentrations in filtered waters, 1999 to 2001<br />
Metal BRC, µg l -1 EQS, µg l -1 Range of median Sites assessed 1<br />
concentrations across<br />
sites, µg l -1<br />
arsenic - 25 1.1 - 3.0 9<br />
boron - 7,000 700 - 4,086 8<br />
cadmium 0.004 - 0.025 2.5 0.012 - 0.25 17<br />
chromium 0.09 - 0.12 15 0.157 - 1.5 8<br />
copper 0.05 - 0.36 5 0.738 - 4.73 18<br />
lead 0.005 - 0.02 25 0.086 - 5.98 17<br />
mercury 0.0001 - 0.0005 0.3 0.003 -0.011 12<br />
nickel 0.16 - 0.26 30 0.345 - 3.05 18<br />
zinc 0.03 - 0.45 40 1.26 - 26.2 20<br />
1<br />
Sites with adequate monitoring data<br />
and medical instruments, although the release of<br />
mercury from historically contaminated dredged<br />
material may now be the largest source in the <strong>UK</strong><br />
(OSPAR Commission, 2000e).<br />
Cadmium concentrations in the Severn Estuary<br />
declined from nearly 0.4 µg l -1 in 1995 to about<br />
0.09 µg l -1 in 2001, well below the EQS but still<br />
about four times higher than the upper BRC.<br />
Historical contamination of the Severn was caused<br />
by metal smelting in Avonmouth and south Wales.<br />
Elsewhere, concentrations were similar to BRCs.<br />
Cadmium in discharges from the non-ferrous metals<br />
and fertiliser industries has been reduced and<br />
further action on cadmium in waste, phosphate<br />
fertilisers and releases from metal industries has<br />
been recommended (OSPAR Commission, 2002).<br />
Although lead is widely used in the manufacture of<br />
plastics and batteries, its use has declined in recent<br />
years. Estuarine concentrations of dissolved lead<br />
should be low, due to the tendency of this metal<br />
to bind to particulate matter. Concentrations were<br />
below EQS at all sites, but high compared to the<br />
upper BRC in the Tyne and Tees estuaries, with<br />
median concentrations up to 6 µg l -1 .<br />
Dissolved copper concentrations in 2001 were<br />
similar to those in 1995, reflecting the lack<br />
of reduction in inputs from rivers, industrial<br />
and sewage effluents to estuaries. Median<br />
concentrations were below the EQS but greater<br />
than twice the upper BRC.<br />
Zinc inputs also showed little change since 1995<br />
and concentrations in estuaries were typically an<br />
order of magnitude above BRCs, except in the Tyne<br />
where concentrations were close to the EQS.<br />
Organic compounds<br />
Where results for organic compounds in waters<br />
were reported, concentrations were extremely low,<br />
as organic compounds are not very soluble in water.<br />
Many results were below detection limits and<br />
only total hexachlorocyclohexane (HCH) generally<br />
exceeded the limit of detection and approached the<br />
EQS (Table 4.2). No BRCs have been derived for<br />
organics in water.<br />
The highest median concentrations of total HCH<br />
were measured in the Wash and the Thames<br />
Estuary. Concentrations were lower in other<br />
southern English estuaries (Figure 4.7). A strong<br />
Table 4.3<br />
Summary of concentrations of organic substances in unfiltered waters<br />
Substance EQS, ng l -1 Range of medians, ng l -1 Sites assessed 1<br />
total HCH 20 4.8 - 16.7 8<br />
ppDDT 10 0.5 - 5 2 10<br />
dieldrin 10 0.2 2 – 5.0 2 12<br />
hexachlorobenzene 30 0.2 2 – 2.9 2 12<br />
hexachlorobutadiene 100 1.7 2 – 4.2 2 7<br />
pentachlorophenol 2,000 15 2 – 334 2 10<br />
trifluralin 100 10 2 – 11.4 2 7<br />
1<br />
Sites with adequate monitoring data<br />
2<br />
Median is based on results recorded as the limit of detection, which varied both between and within sites<br />
21
(PNR), the net abnormality in the sample relative to<br />
the ‘background’ response in a control exposure to<br />
artificially prepared seawater.<br />
5 ng l -1<br />
10 ng l -1<br />
20 ng l -1<br />
EQS<br />
Results<br />
England and Wales (Figures 4.8 and 4.9)<br />
At all 17 sites there was at, one time or another,<br />
toxicity (positive PNR). In the majority of estuaries<br />
the toxicity was occasional, showed no trend,<br />
and does not indicate a sustained deterioration in<br />
biological water quality.<br />
Time series from 1999 to 2001 from the Tyne and<br />
Wear estuaries each displayed significant toxicity<br />
(PNR >20%) on one occasion but little or no effect<br />
on other occasions. The Tees estuary (Phillips<br />
Buoy) showed significant effects in 1999, but none<br />
thereafter.<br />
No significant effects were observed in samples<br />
taken from the Humber estuary at Spurn Head.<br />
Figure 4.7<br />
Median concentrations of total HCH relative<br />
to the EQS. The median concentrations were<br />
all below the EQS with 90% confidence<br />
gradient in concentrations in offshore waters has<br />
been reported ranging from about 0.3 ng l -1 off<br />
North West Scotland to between 1 and 2 ng l -1<br />
in the southern North Sea and English Channel<br />
(OSPAR Commission, 2000a).<br />
4.1.3 Biological effects in waters -<br />
oyster embryo bioassay<br />
Seventeen estuarine NMMP sites around the English<br />
and Welsh coasts were monitored routinely in<br />
1999-2001 for oyster embryo toxicity, covering all<br />
major estuaries in England and Wales. Temporal<br />
detail is varied but all sites were sampled on more<br />
than one occasion. A small study produced data for<br />
the Clyde estuary.<br />
Oyster embryos were exposed for 24 hours to<br />
estuarine water from each site at various intervals<br />
throughout the year. The exposure period, though<br />
short, embraces intense cellular activity in which<br />
a number of critical physiological and biochemical<br />
processes may be impaired, causing abnormal<br />
growth or development of embryos. Water of low<br />
salinity was modified to bring it within the optimal<br />
range for oyster development (salinity 22-35).<br />
Results are expressed as Percentage Net Response<br />
Effects were recorded at Mucking in the Thames<br />
estuary throughout 1999 and 2000, but only<br />
one survey showed a significant PNR value (May<br />
2000), whereas all samples in 2001 showed little<br />
effect. Low toxicity was found in the Medway and<br />
Southampton Water, with the exception of one<br />
sample from Sun Pier on the Medway in Feb 2001<br />
(PNR 39%). Other sites on the Medway (Burham)<br />
and in Southampton Water (East site 515, Brambles)<br />
were only surveyed during 2000.<br />
There were low PNR values in South West and<br />
Welsh estuaries, especially Poole Harbour South<br />
Deep, few of these results exceeded 10%, and<br />
none indicated serious deterioration in water quality<br />
(PNR > 20%).<br />
At the five sites in the North West of England,<br />
results from 2001 revealed no significant toxicity in<br />
the Mersey or Ribble estuaries, or from coastal sites.<br />
Scotland<br />
The Clyde was surveyed three times from May<br />
to August in 1999 along a 30 km transect from<br />
the tidal weir in Glasgow. Water quality was<br />
investigated at 1, 3, 4, 6 and 9 metres, to reflect the<br />
stratified nature of the estuary. This was spatially<br />
a more detailed study than the English ones, but<br />
covers a considerably shorter time period.<br />
There was no toxicity in the first surveys in May and<br />
early August, but the third survey in mid-August<br />
showed significant toxicity (PNR >20%) at the Kelvin<br />
confluence (2 mile station, 6 m depth), and at<br />
Rothesay Dock (6 mile station, 2 m and 6 m depth).<br />
22
30<br />
25<br />
20<br />
15<br />
10<br />
5<br />
0<br />
8/99<br />
8/99<br />
Thames at Muckling (455)<br />
2/00<br />
5/00<br />
5/00<br />
8/00<br />
11/00<br />
11/00<br />
5/01<br />
5/01<br />
9/01<br />
9/01<br />
40<br />
35<br />
30<br />
25<br />
20<br />
15<br />
10<br />
5<br />
0<br />
Medway at Sun Pier (527)<br />
2/00<br />
5/00<br />
5/00<br />
8/00<br />
2/01<br />
5/01<br />
5/01<br />
8/01<br />
8/01<br />
30<br />
25<br />
20<br />
15<br />
10<br />
5<br />
0<br />
3/00<br />
5/00<br />
Severn at Peterstone (645)<br />
5/00<br />
7/00<br />
7/00<br />
3/01<br />
3/01<br />
5/01<br />
10/01<br />
10/01<br />
30<br />
25<br />
20<br />
15<br />
10<br />
5<br />
0<br />
2/00<br />
Burnham (526)<br />
5/00<br />
8/00<br />
8/00<br />
30<br />
25<br />
20<br />
15<br />
10<br />
5<br />
0<br />
10/00<br />
10/00<br />
Tamar at Hamoaze (565)<br />
12/00<br />
3/01<br />
3/01<br />
6/01<br />
6/01<br />
9/01<br />
12/01<br />
12/01<br />
30<br />
25<br />
20<br />
15<br />
10<br />
5<br />
0<br />
Southampton Water at East Brambles Buoy (515)<br />
2/00<br />
5/00<br />
5/00<br />
30<br />
25<br />
20<br />
15<br />
10<br />
5<br />
0<br />
Poole Harbour at Upper South Deep (566)<br />
11/00<br />
11/00<br />
12/00<br />
12/00<br />
3/01<br />
3/01<br />
6/01<br />
6/01<br />
10/01<br />
12/01<br />
12/01<br />
Dockhead (505)<br />
Figure 4.8. Oyster embryo larval development results: Southern England and Wales, 1999-2001<br />
30<br />
25<br />
20<br />
15<br />
10<br />
5<br />
0<br />
2/00<br />
5/00<br />
5/00<br />
3/01<br />
6/01<br />
6/01<br />
8/01<br />
8/01<br />
30<br />
25<br />
20<br />
15<br />
10<br />
5<br />
0<br />
Cumbria Coast at St. Bees (768)<br />
4/00<br />
5/01<br />
5/01<br />
7/01<br />
30<br />
25<br />
20<br />
15<br />
10<br />
5<br />
0<br />
7/99<br />
7/99<br />
Tyne at Hebburn (225)<br />
8/99<br />
11/99<br />
5/00<br />
7/00<br />
9/01<br />
9/01<br />
11/01<br />
11/01<br />
12/01<br />
30<br />
25<br />
20<br />
15<br />
10<br />
5<br />
0<br />
Morecambe Bay at North Bay (767)<br />
4/00<br />
5/01<br />
5/01<br />
7/01<br />
7/01<br />
30<br />
25<br />
20<br />
15<br />
10<br />
5<br />
0<br />
3/99<br />
4/99<br />
Wear at Sandy Point (275)<br />
7/99<br />
7/99<br />
11/99<br />
5/00<br />
7/00<br />
10/00<br />
10/00<br />
4/01<br />
9/01<br />
30<br />
25<br />
20<br />
15<br />
10<br />
5<br />
0<br />
8/01<br />
Ribble at 11th milepost (766)<br />
8/01<br />
10/01<br />
10/01<br />
30<br />
25<br />
20<br />
15<br />
10<br />
5<br />
0<br />
9/99<br />
Tees at Phillips Buoy (325)<br />
9/99<br />
11/99<br />
12/00<br />
3/01<br />
3/01<br />
30<br />
25<br />
20<br />
15<br />
10<br />
5<br />
0<br />
4/00<br />
Mersey at Channel C1 Buoy (765)<br />
7/01<br />
7/01<br />
30<br />
25<br />
20<br />
15<br />
10<br />
5<br />
0<br />
Humber inside Spurn Head (356)<br />
7/99<br />
7/99<br />
7/00<br />
7/00<br />
9/00<br />
5/01<br />
5/01<br />
7/01<br />
7/01<br />
9/01<br />
10/01<br />
10/01<br />
30<br />
25<br />
20<br />
15<br />
10<br />
5<br />
0<br />
8/01<br />
Mersey at Seacombe Ferry (755)<br />
8/01<br />
10/01<br />
10/01<br />
Figure 4.9. Oyster embryo larval development results: Northern England, 1999-2001 Summary<br />
23
Summary<br />
In <strong>UK</strong> estuaries the concentrations of metals and<br />
organic substances rarely exceeded the standards set<br />
under the Dangerous Substances Directive. No median<br />
values exceeded any EQS for the period 1999 to 2001.<br />
Despite reductions in direct and riverine inputs of<br />
cadmium, mercury, zinc and lindane, concentrations<br />
of these substances remain higher in industrialised<br />
<strong>UK</strong> estuaries than in more remote areas. Metals<br />
concentrations are typically several times BRCs, with<br />
the highest concentrations in English estuaries. The<br />
lack of clear correspondence between trends in<br />
loads and estuarine concentrations over time may<br />
partly be explained by the low precision with which<br />
both are estimated (OSPAR Commission, 2000b).<br />
Some contaminants in the water column, such as<br />
cadmium, remain in the dissolved phase, while<br />
others such as mercury and lead are adsorbed onto<br />
particulate material and deposited as sediments or<br />
transported out of the estuary.<br />
<strong>UK</strong> estuarine biological water quality measured by<br />
toxicity to oyster embryo-larval development was<br />
generally very good. The oyster embryo larval test is<br />
a robust measure of the biological water quality of<br />
discrete water samples. However, because samples<br />
were collected quarterly at a limited number of sites<br />
in each estuary, it is difficult to draw conclusions on<br />
biological water quality of an entire estuary, or on<br />
temporal trends. The surveys in English and Welsh<br />
estuaries carried out according to NMMP Green<br />
Book guidance meet only the minimum requirement<br />
for estuarine monitoring, especially with regard to<br />
spatial coverage within estuaries.<br />
The surveys on the Clyde highlight the variability<br />
of biological water quality with location, time and<br />
depth, and the need for detailed spatial surveys<br />
of each estuary prior to developing a longer-term<br />
temporal trend, monitoring programme.<br />
4.2 Sediments<br />
The extent to which trace metals and trace organic<br />
compounds discharged to the marine environment<br />
are deposited into the sediments depends on their<br />
solubility. Trace organic compounds in particular<br />
are not generally soluble in water and are more<br />
likely to be detected in sediments. The impact<br />
of these contaminants on sediment dwelling<br />
organisms is assessed by examination of the benthic<br />
community structure and sediment bioassay tests.<br />
4.2.1 Contaminants in sediments<br />
This section addresses two JAMP questions:<br />
JAMP Issue 1.2: What are the concentrations<br />
and fluxes of mercury, cadmium and lead in<br />
sediment and biota?<br />
and<br />
JAMP Issue 1.7. Do high concentrations of PCBs<br />
pose a risk to the marine ecosystem?<br />
In order to show a more complete picture, the<br />
distribution of all monitored metals is discussed.<br />
Metals<br />
Trace metals in marine sediments are associated<br />
with the fine-grained aluminosilicates, a major<br />
constituent of which is aluminium. The abundance<br />
of aluminium in marine sediments is related to the<br />
geology of the sediment and is not regarded as<br />
a contaminant. The relative abundance of other<br />
metals to aluminium are expressed as metal/<br />
aluminium ratios. These are used to compare<br />
sediments from different geographical areas having<br />
different geologies and to indicate enrichment due<br />
to inputs of metals as a result of man’s activities.<br />
Sediment metals concentrations were assessed in<br />
relation to BRCs, and EACs. The sediment BRCs<br />
are the ranges of metal/aluminium ratios in fine<br />
sediments or the fine fraction of sediments from<br />
uncontaminated areas. EACs are expressed as<br />
ranges of absolute metals concentrations, and<br />
were developed to identify potential areas of<br />
concern and to indicate which substances may<br />
cause harm to biota. OSPAR consider EACs for<br />
metals in sediments as having ‘provisional’ status,<br />
and recommend that they should not be regarded<br />
as firm standards or as triggers for remedial<br />
action. OSPAR also states that caution should be<br />
exercised in their use, since they do not take into<br />
account specific long-term biological effects such<br />
as carcinogenicity, genotoxicity or reproductive<br />
disruption due to hormone imbalances, or<br />
combined toxic effects.<br />
The OSPAR BRCs and EACs for metals in finegrained<br />
marine sediments (OSPAR Commission,<br />
2000d) are shown in Table 4.4. The sediment<br />
concentrations of these metals are compared to the<br />
BRCs as metal/aluminium ratios in Figure 4.10.<br />
Median mercury/aluminium ratios were elevated to<br />
more than twice the upper BRC at most sites and<br />
were much higher at some sites. For example, the<br />
median ratios were 51, 52 and 76 times higher than<br />
the upper BRC in the Tees, Mersey and Thames<br />
estuaries.<br />
Median cadmium/aluminium ratios were below<br />
twice the upper BRC at a number of sites.<br />
However, several estuaries showed ratios elevated<br />
above twice the upper BRC, and some to more than<br />
five times the upper BRC. The largest median ratios<br />
were 15, 18 and 30 times the upper BRC in the<br />
Tyne, Thames and Ribble estuaries.<br />
24
Table 4.4. BRCs and EACs for metals in fine-grained marine sediments<br />
Metal<br />
Sediment BRCs as<br />
metal/aluminium ratios<br />
(multiply by 10 -4 )<br />
EACs<br />
(mg kg -1 dry weight)<br />
Mercury 0.0034–0.0066 0.05–0.5<br />
Cadmium 0.007–0.03 0.1–1<br />
Lead 1.8–4.0 5–50<br />
Arsenic 2.0 – 4.5 1 –10<br />
Copper 2.2 – 5.7 5 – 50<br />
Chromium 9.0 - 20 10 – 100<br />
Nickel 4.4 – 9.1 5 – 50<br />
Zinc 8.8 - 18 50 – 500<br />
Median lead/aluminium ratios were also elevated<br />
to more than twice the upper BRC at most sites<br />
(Figure 4.10). Median values were 11, 20 and 27<br />
times higher than the upper BRC in the Tyne, Tees<br />
and Wear estuaries.<br />
For arsenic, chromium and nickel the median<br />
sediment metal/aluminium ratios exceeded twice<br />
the upper BRC thresholds at only a few sites.<br />
However, there was evidence of more widespread<br />
contamination by copper and zinc. The highest<br />
median copper/aluminium ratios were all about 5<br />
times higher than the upper BRC and these were<br />
found at two sites in the Tamar and one in the<br />
Thames. The highest median zinc/aluminium ratios<br />
were found in the Tyne, the Wear and the Mersey,<br />
with enrichment factors of 5 to 6 times the upper<br />
BRC threshold.<br />
The median metal concentrations for sediments for<br />
1999-2001 were compared to the OSPAR EACs as<br />
absolute concentrations (Figure 4.11).<br />
The median mercury concentrations exceeded the<br />
upper EAC at several sites and were more than five<br />
times higher than this value in the Thames and Tees<br />
estuaries.<br />
Median cadmium concentrations were above the<br />
upper EAC at several sites, and above three times<br />
the upper EAC in the Thames.<br />
Median lead concentrations were above the upper<br />
EAC at about half of the NMMP sites and higher<br />
than five times the upper EAC in the Tyne, Wear,<br />
and Tees estuaries.<br />
Median arsenic concentrations were above the<br />
upper EAC at most sites. At two sites in the Tamar,<br />
the concentrations were more than 15 and 8 times<br />
higher than the upper EAC. This is a result of the<br />
local mineralization; a century ago, half of the<br />
world’s arsenic was produced in the area. Arsenic<br />
inputs remain high, due to drainage from disused<br />
mines.<br />
Sediment chromium, nickel and copper<br />
concentrations were above the upper EAC at a<br />
number of sites. Sediment zinc concentrations were<br />
below the upper EAC at most sites.<br />
Organics<br />
Commercial formulations of polychlorinated<br />
biphenyls (PCBs), such as Aroclors, have been widely<br />
used in transformers, capacitors, hydraulic fluids and<br />
as plasticisers in paints, plastics and sealants. The<br />
inputs of PCBs to the marine environment include<br />
energy production, combustion industry, production<br />
processes and waste (landfill, incineration, waste<br />
treatment and disposal). Due to concerns about the<br />
environmental impact of PCBs, production in the <strong>UK</strong><br />
ceased in the 1970s. Authorisation for use in closed<br />
systems continued until 1986 when sales of PCB<br />
formulations finally stopped in the <strong>UK</strong>. However,<br />
PCBs still enter the marine environment following<br />
the destruction and disposal of industrial plants and<br />
equipment, or from emissions from old electrical<br />
equipment and landfill sites.<br />
PCBs are persistent and have the potential for<br />
long-range atmospheric transportation and are,<br />
therefore, ubiquitous in the marine environment.<br />
Due to their low solubility and hydrophobic nature,<br />
PCBs tend to associate with particulate material.<br />
Accumulation of hydrophobic compounds, such as<br />
PCBs, in sediments is dependent on type; sediments<br />
with a high organic carbon content and a smaller<br />
particle size (larger surface:volume ratio) have a<br />
25
(a)<br />
(b)<br />
0.007 x 10 -4<br />
-4<br />
(lower BRC)<br />
0.0066 x 10<br />
0.030 x 10 -4<br />
(upper BRC)<br />
-4<br />
(upper BRC)<br />
0.0112 x 10<br />
-4<br />
0.060 x 10<br />
(close to background)<br />
(close to background)<br />
0.1000 x 10 -4 0.300 x 10 -4<br />
(c)<br />
(d)<br />
2.0<br />
4 x 10 -4<br />
(upper BRC)<br />
-4<br />
8 x 10<br />
(close to background)<br />
40 x 10 -4<br />
x 10 -4<br />
(lower BRC)<br />
4.5 x 10 -4<br />
(upper BRC)<br />
-4<br />
9.0 x 10<br />
(close to background)<br />
Figure 4.10 Median metal/aluminium ratios in sediment for (a) mercury, (b) cadmium, (c) lead and (d) arsenic in<br />
relation to their BRCs<br />
26
(e)<br />
(f)<br />
9 x 10 -4<br />
lower BRC<br />
20 x 10 -4<br />
(upper BRC)<br />
40 x 10 -4<br />
(close to background)<br />
4.4 x 10 -4<br />
lower BRC<br />
9.1 x 10 -4<br />
(upper BRC)<br />
18.2 x 10 -4<br />
(close to background)<br />
(g)<br />
(h)<br />
2.2 x 10 -4<br />
lower BRC<br />
5.7 x 10 -4<br />
(upper BRC)<br />
11.4 x 10 -4<br />
(close to background)<br />
8.8 x 10 -4<br />
lower BRC<br />
18.0 x 10 -4<br />
(upper BRC)<br />
36.0 x 10 -4<br />
(close to background)<br />
Figure 4.10 continued: Median metal/aluminium ratios in sediment for (e) chromium, (f) nickel, (g) copper and (h) zinc<br />
in relation to their BRCs<br />
27
(a)<br />
(b)<br />
-1<br />
0.005 mg kg dw<br />
-1<br />
0.05 mg kg dw<br />
(lower EAC) -1<br />
0.5 mg kg dw<br />
(upper EAC)<br />
-1<br />
0.01 mg kg dw<br />
-1<br />
0.10 mg kg dw<br />
(lower EAC)<br />
-1<br />
1 mg kg dw<br />
(upper EAC)<br />
(c)<br />
-1<br />
5 mg kg dw<br />
(lower EAC)<br />
-1<br />
50 mg kg dw<br />
(upper EAC)<br />
-1<br />
5400 mg kg dw<br />
(d)<br />
-1<br />
1 mg kg dw<br />
(lower EAC)<br />
-1<br />
10 mg kg dw<br />
(upper EAC)<br />
-1<br />
100 mg kg dw<br />
Figure 4.11. Median concentrations of (a) mercury, (b) cadmium, (c) lead and (d) arsenic in sediments, relative to their<br />
provisional EACs<br />
28
(e)<br />
(f)<br />
-1<br />
10 mg kg dw<br />
(lower EAC)<br />
-1<br />
100 mg kg dw<br />
(upper EAC)<br />
-1<br />
200 mg kg dw<br />
-1<br />
5 mg kg dw<br />
(lower EAC)<br />
-1<br />
50 mg kg dw<br />
(upper EAC)<br />
(g)<br />
-1<br />
5 mg kg dw<br />
(lower EAC)<br />
-1<br />
50 mg kg dw<br />
(upper EAC)<br />
-1<br />
150 mg kg dw<br />
(h)<br />
-1<br />
50 mg kg dw<br />
(lower EAC)<br />
-1<br />
500 mg kg dw<br />
(upper EAC)<br />
Figure 4.11. continued: Median concentrations of (e) chromium, (f) nickel, (g) copper and (h) zinc in sediments, relative to<br />
their EACs<br />
29
greater potential to accumulate PCBs compared to<br />
coarser, sandy sediments. In addition, due to their<br />
persistence and lipophilic nature, PCBs have the<br />
potential to bioaccumulate, particularly in lipid rich<br />
tissue such as fish liver.<br />
There are 209 PCB congeners of which the ICES<br />
7 (CBs 28, 52, 101, 118, 153, 138, 180) were<br />
selected for measurement due to their relatively<br />
high concentrations in technical mixtures, wide<br />
chlorination range and persistence. Where all ICES<br />
7 CBs are not measured, CB 153 can be used as<br />
representative of all other CBs. CB 153 occurs in<br />
all technical formulations and lies in the middle of<br />
the range of physical parameters such as solubility *<br />
and molecular size. It is not easily metabolised<br />
and, therefore, is often the dominant CB in biota<br />
samples.<br />
Sediment CB concentrations were reported at 56<br />
sites. However, CB 180 concentrations were not<br />
available for some sites. The sum of the ICES 7<br />
CBs and CB 153 concentrations are summarised in<br />
Table 4.5. In the initial 1992-1995 spatial survey,<br />
concentrations of the Σ7CBs in the sediments from<br />
offshore sites in England and Wales were all less<br />
than 5 µg kg -1 (CEFAS 1998) and the work was not<br />
repeated in 1999-2001.<br />
The lowest concentrations were found at the Tay/<br />
Forth offshore site and highest at Woolwich in the<br />
Thames. In general, the lowest concentrations for<br />
all of the ICES 7 CBs were found at the Scottish<br />
offshore sites, and the highest in southeast England.<br />
The Scottish offshore sites showed a predominately<br />
atmospheric input of CBs with the lower chlorinated<br />
CBs (CB 52 and 101) dominating the profiles. Most<br />
estuarine sites contained a higher proportion of the<br />
more highly chlorinated CBs, with the hexa-CBs<br />
dominating (CB 138 and 153).<br />
Currently there are no BRCs for CBs in sediment in<br />
<strong>UK</strong> waters. The EAC for the sum of the ICES 7 CBs<br />
is provisional and ranges from 1 to 10 µg kg -1 dry<br />
weight. Only six sites had median concentrations<br />
below 1 µg kg -1 dry weight (Figure 4.12). Three<br />
were Scottish offshore sites (Minches, Moray Firth,<br />
Forth/Tay) two were in Northern Ireland (North<br />
Channel, North Antrim coast) and one in Wales<br />
(Severn). The median concentration was above<br />
1 µg kg dw<br />
(lower EAC)<br />
-1<br />
10 µ g kg dw<br />
(upper EAC)<br />
-1<br />
100 µ g kg dw<br />
Figure 4.12. Median concentrations of the sum of the ICES<br />
7 CBs in sediment (ug/kg dry weight) and their<br />
relationship to provisional EACs<br />
the upper EAC at seven sites, one in Scotland<br />
(Clyde), two in Wales (Severn) and four in the south<br />
of England (Thames and Medway). At one site<br />
(Thames), the median concentration was above 50<br />
µg kg -1 dry weight. The upper 90% confidence<br />
limit was above the upper EAC at 6 additional sites.<br />
In the initial 1992-1995 spatial survey CB 153<br />
concentrations were reported in sediment from 67<br />
sites. However, few results were above detection<br />
limits. Highest concentrations were found in<br />
the Severn with concentrations up to 25 µg kg -1<br />
(Table 4.5). In the 1999-2001 survey, the highest<br />
concentrations were found in the Thames (24.6 µg<br />
kg -1 dry weight) and the Mersey (15.4 µg kg -1 dry).<br />
Lower concentrations were found in the Severn (4.7<br />
and 4.2 µg kg -1 dry weight).<br />
-1<br />
* Described by the octanol/water partition coefficient (log K ow<br />
)<br />
30
Table 4.5.<br />
Summary of PCB data for sediments<br />
CB CB 153 Sum of ICES 7 PCBs<br />
EAC µg kg -1 dry weight (provisional) 1 -10<br />
Median concentration range 1999-2001, µg kg -1 dry weight 0.02 – 24.6 0.42 – 184.2<br />
No. of sites assessed 56 37<br />
Sites with median concentration > upper EAC 7<br />
Sites with upper 90% confidence limit > upper EAC 13<br />
Concentration range 1992-1995 µg kg -1 dry weight 10,000 µg kg -1<br />
(approximately the sum of the upper EAC values)<br />
at a number of sites: the Tyne at Hebburn, Wear<br />
at Alexandra Bridge, Tees at Bamlett’s Bight, Tees<br />
at no. 23 buoy, Thames at Woolwich, Medway at<br />
Burnham, and the Bann estuary in Northern Ireland.<br />
These high concentrations indicate potential for<br />
harm to sediment dwelling animals at these sites.<br />
Table 4.6 indicates that there are a number<br />
of sites at which the upper EAC for individual<br />
PAH were exceeded. On the Medway at Sun<br />
Pier, concentrations greater than 5 times the<br />
upper, provisional EAC were recorded in 1999<br />
for benz[a]anthracene and benzo[a]pyrene but<br />
the concentrations had decreased to below the<br />
upper EAC in 2000 and 2001. Exceedance of<br />
the EAC generally tended to be higher for larger<br />
PAH compounds, which suggested that the major<br />
contribution derived from combustion sources.<br />
The distribution of pyrene in sediments is shown<br />
in Figure 4.13. Concentrations above the upper,<br />
provisional EAC were generally found at locations<br />
close to combustion sources.<br />
Table 4.6. EAC values (µg/kg dw) for PAH (OSPAR)<br />
PAH lower EAC upper EAC median<br />
concentration ><br />
upper EAC<br />
Naphthalene 1 50 500 1 3<br />
Phenanthrene 1 100 1,000 4 10<br />
Anthracene 1 50 500 1 6<br />
Fluoranthene 2 500 5,000 0 2<br />
Pyrene 2 50 500 11 18<br />
benz[a]anthracene 2 100 1,000 1 7<br />
Chrysene 2 100 1,000 2 9<br />
benzo[a]pyrene 2 100 1,000 3 8<br />
Note : 1 indicates that the EAC for this compound is firm<br />
2<br />
indicates that the EAC for this compound is provisional<br />
Upper 90%<br />
confidence limit ><br />
upper EAC<br />
31
4.2.2 Biological effects of<br />
contaminants in sediments<br />
Benthic Community Structure<br />
The benthos comprises those animals that live in<br />
marine sediments. Community structure depends<br />
heavily on salinity and on sediment structure and<br />
may also be affected by contamination. In this<br />
report, 28 estuarine and 31 coastal sites have<br />
been analysed, focusing on spatial data from all<br />
sites for 2000 and temporal trends at only two<br />
sites from 1997 to 2001. Relationships have been<br />
investigated between the benthic communities<br />
and environmental parameters of water depth,<br />
sediment type and the sedimentary concentration<br />
of contaminants.<br />
-1<br />
5 µg kg dw<br />
-1<br />
50 µg kg dw<br />
(lower EAC)<br />
-1<br />
500 µg kg dw<br />
(upper EAC)<br />
Spatial Analysis Results - 2000<br />
Tables 4.7 and 4.8 present univariate statistics (as<br />
mean values per site surely sample) for coastal<br />
and estuarine sites for 2000 as follows: number<br />
of species (S); abundance of all specimens (A);<br />
evenness (J’- allocation of abundance values<br />
across the species); and Shannon Wiener index<br />
(H’ - a measure of diversity). Low evenness or<br />
Shannon Wiener diversity values were associated<br />
with samples dominated numerically by few<br />
species and may indicate a naturally stressed or<br />
anthropogenically impacted community.<br />
The status of the benthic fauna was also assessed<br />
using functional indices such as the <strong>UK</strong> infaunal<br />
trophic index (ITI, Codling and Ashley, 1992) and<br />
the AZTI marine biotic index (AMBI, Borja et. al.,<br />
2000). The ITI classifies the fauna into different<br />
groups according to their mode of feeding, while<br />
the AMBI classifies the fauna according to their<br />
sensitivity to pollution. The ITI values range from<br />
0 to 100. Values of 60 or above are regarded<br />
as ‘normal’, between 60 and 30 as ‘changed’,<br />
and below 30 as ‘degraded’. The AMBI scores<br />
range from 0 to 7, with low scores indicating an<br />
unstressed healthy benthic community, and high<br />
scores indicating stressed or polluted sites.<br />
Coastal Sites<br />
The maximum number of species was 94 at<br />
Strangford Lough, while the minimum was only<br />
3 at the Ribble. These sites also represented the<br />
maximum and minimum abundance of individuals,<br />
2876 and 11 respectively. Other sites with low<br />
species numbers and abundance included the<br />
Irish Sea Buoy, Dundrum Bay and the North<br />
Antrim Coast. The fauna at Strangford Lough was<br />
dominated by the porcelain crab Pisidia longicornis,<br />
associated with extensive beds of horse mussel,<br />
Modiolus modiolus. The dominant species at the<br />
Ribble site was a crustacean, Haustorius arenarius,<br />
which prefers mobile sand.<br />
Figure 4.13. Median pyrene concentrations in sediment<br />
Macrofaunal community data were standardised<br />
by the exclusion of: colonial or epifaunal species<br />
such as hydroids or barnacles; nematode worms;<br />
juvenile fauna unassigned to a species; and species<br />
represented by only a single specimen in a sample.<br />
The Shannon Wiener diversity index ranged from<br />
0.93 at the Ribble to 3.11 at Cloch in the Clyde, a<br />
deepwater site with mixed sediment. The highest<br />
evenness, 0.95, was at Dundrum Bay. The lowest<br />
evenness of 0.45 off Humber/Wash related to the<br />
dominance of the brittle star, Amphiura filiformis,<br />
accounting for 75% of the total abundance, but this<br />
site also had the highest ITI of 88.69, suggesting<br />
that it was not degraded. The lowest ITI, 7.5,<br />
was recorded at an intertidal site, Budle Bay,<br />
where sub-surface deposit feeders (‘opportunist<br />
species’) dominated, including the annelid<br />
32
worms Capitella species and Tubificoides species<br />
- indicating a degraded community impacted by<br />
organic enrichment. This site had the highest AZTI<br />
biotic index (5.68) because of the presence of these<br />
pollution tolerant species.<br />
Multivariate methods of data analysis may provide a<br />
more sensitive measure of community change than<br />
univariate methods (Warwick and Clarke, 1991).<br />
Group average cluster analysis was first used<br />
to produce a Bray Curtis similarity dendrogram<br />
so as to identify groups of similar stations.<br />
Multidimensional scaling (MDS) was then used to<br />
create an ordination plot. The MDS ordination<br />
plot arranges sites according to the similarity of<br />
their faunal composition, the most similar sites<br />
appearing closest together.<br />
Table 4.7. NMMP coastal data collected in 2000.<br />
Number of species (S), abundance (A), Peilou evenness (J’), Shannon Wiener diversity (H’),<br />
infaunal trophic index (ITI), and AZTI marine biotic index (AMBI).<br />
Mean value per 0.1m 2 (based on 5 replicates unless otherwise stated)<br />
Site Site Name S A J’ H’ ITI AMBI<br />
45 Clyde – Off Cumbrae 10 18 0.9 2.02 57.20 2.38<br />
55 Clyde – Cloch Point 48 263 0.8 3.11 60.30 1.67<br />
70 Clyde – Irvine Bay 20 97 0.76 2.25 74.11 0.90<br />
76 Loch Linnhe 12 68 0.65 1.6 61.51 2.41<br />
175 Forth – Kingston Hudds 40 303 0.66 2.44 78.96 0.67<br />
220* Northumberland - Budle Bay 7 534 0.77 1.46 7.50 5.68<br />
245 Off the Tyne 20 76 0.84 2.49 58.56 2.80<br />
270 Durham - Off Seaham 24 105 0.81 2.56 72.64 0.64<br />
345 Off Humber/Wash 15 102 0.45 1.2 88.69 0.29<br />
388 Wash – off Boston 14 165 0.7 1.82 41.38 2.55<br />
389 Wash – Cork Hole 12 74 0.71 1.74 65.59 3.11<br />
475** Thames – Gabbard ** 21 114 0.61 1.88 63.46 2.45<br />
536 Lyme Bay 44 558 0.58 2.21 52.36 0.95<br />
576 Off Tamar 53 1,165 0.63 2.49 51.92 2.42<br />
646 Milford Haven 34 586 0.57 2.05 39.63 2.65<br />
655 Cardigan Bay 19 61 0.84 2.46 61.10 2.34<br />
715 Liverpool Bay 37 196 0.67 2.43 60.41 1.53<br />
765 Mersey C1 Buoy 11 89 0.74 1.76 48.84 0.77<br />
766 Ribble 3 11 0.78 0.93 77.58 0.25<br />
767 Morecambe Bay 7 17 0.9 1.74 71.77 0.65<br />
768 Cumbria Coast – St Bees 33 575 0.53 1.84 65.49 0.73<br />
805 SE Isle of Man 32 202 0.67 2.33 74.48 0.85<br />
807 Irish Sea NMP5 7 16 0.87 1.69 26.32 1.79<br />
808 Irish Sea Buoy 8 13 0.94 1.92 49.19 2.01<br />
809 Strangford Lough 94 2,876 0.52 2.34 77.17 1.24<br />
815 Dundrum Bay 8 12 0.95 1.96 55.56 2.19<br />
815 Dundrum Bay 8 13 0.91 1.84 45.62 2.52<br />
825 Belfast Lough – Outer 21 97 0.77 2.34 67.91 0.47<br />
845 Belfast Lough – Inner 48 996 0.68 2.61 65.47 1.39<br />
865 North Channel NC2 30 105 0.8 2.66 82.67 1.15<br />
875 North Antrim Coast 8 13 0.91 1.69 58.86 2.78<br />
Mean 24 307 0.74 2.06 60.07 1.75<br />
Median 20 102 0.76 2.02 61.10 1.67<br />
Maximum 94 2,876 0.95 3.11 88.69 5.68<br />
Minimum 3 11 0.45 0.93 7.50 0.25<br />
Standard deviation 19 558 0.13 0.47 16.76 1.13<br />
*extrapolated to 0.1 m 2 from 0.01 m 2 cores, ** mean of three replicates only<br />
33
Table 4.8. NMMP estuarine data collected in 2000.<br />
Number of species (S), abundance (A), Peilou evenness (J’), Shannon Wiener diversity (H’),<br />
infaunal trophic index (ITI), and AZTI marine biotic index (AMBI).<br />
Mean value per 0.1m 2<br />
Site Site Name S A J’ H’ ITI AMBI<br />
208 Forth estuary 43 1,418 0.55 2.07 78.51 0.67<br />
210 Tweed - Yarrow Slake 11 65,175 0.35 0.83 2.55 5.86<br />
225 Tyne – Hebburn 24 39,874 0.44 1.41 1.94 5.48<br />
235 Tyne - Ferry Crossing 21 50,086 0.55 1.68 4.20 5.12<br />
275 Wear- Sandy Point 27 9,340 0.57 1.87 17.93 4.44<br />
305 Tees – Bamlett’s Bight 12 622 0.60 1.50 12.22 5.41<br />
315 Tees – No 23 Bouy 30 5,792 0.52 1.79 5.54 4.15<br />
325 Tees Estuary – Phillips buoy 28 2,828 0.60 1.99 50.06 1.32<br />
356 Humber – Spurn Head 29 6,048 0.43 1.44 38.49 4.72<br />
357 Humber – Grimsby Roads 36 33,242 0.22 0.80 60.25 4.30<br />
358 Humber – Sunk Island 8 68 0.56 1.16 37.51 0.15<br />
435 Thames - Woolwich 13 1,442 0.40 1.03 1.31 1.33<br />
455 Thames – Mucking 14 7,322 0.56 1.48 30.59 3.37<br />
526 Medway – Burham 9 30,920 0.72 1.59 0.46 2.35<br />
527 Medway – Sun Pier 23 5,092 0.46 1.45 57.00 2.69<br />
555 Tamar – Warren Point 47 9,086 0.58 2.22 40.17 3.85<br />
565 Tamar – Hamoaze 68 74,322 0.25 1.04 64.86 2.26<br />
566 Poole Harbour – South Deep 93 81,204 0.45 2.06 41.45 3.74<br />
567 Poole Harbour – Wytch 12 185,100 0.27 0.66 14.56 5.22<br />
625 Severn – Purton 2 710 0.05 0.03 100.00 0.03<br />
635 Severn – Bedwin 13 5,550 0.53 1.36 55.71 1.97<br />
645 Severn – Peterstone 12 2,488 0.15 0.39 3.60 5.59<br />
647 Dovey – Ynys-Hir 10 3,510 0.50 1.15 68.98 2.98<br />
648 Mawddach – Bontddu 13 3,400 0.60 1.54 62.51 3.04<br />
690 Dee – Mostyn Bank 19 912 0.51 1.50 85.62 0.10<br />
755 Mersey – Seacombe Ferry 9 68 1.90 0.78 62.75 1.79<br />
820 Bann 6 8,322 0.62 1.11 56.73 3.93<br />
880 Lough Foyle 23 2,710 0.65 2.03 48.47 3.21<br />
Mean 23 22,738 0.52 1.36 39.43 3.18<br />
Median 17 5,671 0.53 1.44 40.81 3.29<br />
Maximum 93 185,100 1.90 2.22 100.00 5.86<br />
Minimum 2 68 0.05 0.03 0.46 0.03<br />
Standard deviation 20 39,806 0.31 0.54 29.03 1.78<br />
The cluster analysis identified four main coastal<br />
groups, clearly discernible in the MDS plot (Figure<br />
4.14). Group A relates to sites with a low number<br />
of species and abundance, in coarse sediment with<br />
a low proportion of fine material. Group B contains<br />
high salinity sites dominated by opportunist species.<br />
Group C sites have very high silt and clay content,<br />
above 97%. Group D contains the remaining sites,<br />
with high diversities and heterogeneous substrates<br />
offering a wide range of habitats for colonisation.<br />
76<br />
808<br />
807 815<br />
815<br />
809<br />
845<br />
646 865<br />
875<br />
576<br />
55 175 715<br />
536<br />
245<br />
825<br />
768<br />
805270<br />
70<br />
475<br />
45<br />
655 345<br />
765<br />
388<br />
389<br />
767<br />
766<br />
Which environmental factors best explain the<br />
macrofaunal community patterns? Spearman rank<br />
correlation analysis showed a statistically significant<br />
correlation between community patterns and water<br />
depth or sediment characteristics, but no significant<br />
correlation with contaminant levels. The influence<br />
of sediment type on the macrofaunal community is<br />
220<br />
Group A Group B Group C Group D<br />
Figure 4.14 MDS plot of the NMMP 2000 coastal<br />
macrobenthic dataset showing groups<br />
identified by cluster analysis<br />
34
clearly shown by superimposition of the percentage<br />
silt/clay content on the MDS plot in Figure 4.15<br />
Muddy sites with high silt/clay content separated<br />
clearly from those with predominantly coarser<br />
sediments.<br />
76<br />
807<br />
808<br />
815<br />
815<br />
809<br />
845<br />
865<br />
576<br />
646<br />
55 175<br />
825<br />
768270<br />
70<br />
45<br />
765<br />
388<br />
389<br />
220*<br />
875<br />
767<br />
766<br />
Figure 4.15 MDS plot of the NMMP 2000 coastal<br />
macrobenthic dataset and relative percentage<br />
silt/clay content of sediment. (Circle size<br />
indicates silt/clay content)<br />
Estuarine Sites<br />
The number of species varied from 2 at Purton to<br />
over 60 at Tamar and Poole Harbour. The highest<br />
abundance at Poole Harbour was over 100,000<br />
invertebrates per 0.1 m 2 . Abundance exceeded<br />
10,000 individuals per 0.1 m 2 at sites in the Tweed,<br />
Tyne, Humber, Medway and Tamar estuaries. The<br />
macrofaunal communities at these sites were<br />
dominated by annelid worms including oligochaetes<br />
and the polychaetes Capitella species, Manayunkia<br />
aestuarina and Aphelochaeta marioni. These taxa<br />
indicate highly stressed estuarine environments with<br />
low salinities and some organic enrichment.<br />
Diversity and evenness indices ranged from 0.03<br />
at Purton in the Severn to 2.22 at Warren Point in<br />
the Tamar and from 0.05 at Purton to 1.90 in the<br />
Mersey respectively. Low diversity and evenness<br />
at Purton related to the dominance of crustacean<br />
Bathyporeia species, 99.4% of the population.<br />
Comparatively high ITI and low AMBI at this site<br />
suggest that, despite the dominance of Bathyporeia,<br />
this community is natural rather than impacted.<br />
Although both estuarine and coastal sites exhibited<br />
a wide range of AMBI, estuarine sites generally had<br />
higher AMBI, suggesting more stress either natural<br />
from salinity change or from contaminants or both.<br />
Cluster analysis identified six groups, shown on<br />
the MDS plot (Figure 4.16). An excluded Group<br />
A contains a single site, (Severn, Purton) with very<br />
low diversity and only two species, one of which<br />
is extremely dominant. Group B represents the<br />
Mersey site, a well balanced but impoverished<br />
community. Group C contains sites with low<br />
diversity dominated by one or two species. Group<br />
D represents sites with moderate diversity and a<br />
heterogeneous sediment environment. Group<br />
E represents the Thames at Woolwich, with low<br />
diversity and dominated by two oligochaete worm<br />
species. Group F contains sites with low diversity<br />
but very high abundances (>8000 individuals per<br />
0.1 m 2 ).<br />
Spearman Rank correlation analysis found<br />
significant correlations between the estuarine<br />
macrofauna data and sediment parameters but<br />
none with contaminant levels.<br />
526<br />
566<br />
565<br />
235<br />
567 305<br />
210 225<br />
315<br />
820<br />
555<br />
647 648<br />
455 357<br />
527 880<br />
635<br />
435<br />
690<br />
356<br />
645<br />
275<br />
325<br />
208<br />
358<br />
755<br />
Group B Group C Group D Group E Group F<br />
Figure 4.16 Results from multidimensional scaling<br />
(MDS) analysis of the NMMP2000 estuarine<br />
macrobenthic dataset. (An outlying site 625 is<br />
omitted)<br />
Temporal Analysis (1997–2001)<br />
Coastal sites in the inner and outer Belfast Lough<br />
were analysed for temporal trends because five<br />
years data (1997 – 2001) were available (Table 4.9).<br />
In the inner lough there were declining trends<br />
in the number of species, abundance, Shannon<br />
Wiener diversity, and AMBI scores. However, the<br />
evenness and ITI values showed little change. No<br />
trend was apparent in the outer lough. The high<br />
faunal abundances in 1997/8 were attributable<br />
to dominance by the annelid worms, Cirratulus<br />
cirratus, Cirriformia tentaculata, and Mediomastus<br />
fragilis, as well as the amphipod crustaceans,<br />
Ampelisca diadema and Photis longicaudata. The<br />
presence of these annelids suggested quite high<br />
35
Table 4.9. NMMP data 1997-2001<br />
Number of Species (S), abundance (A),<br />
Pielou evenness (J’), Shannon Wiener diversity (H’),<br />
trophic index (ITI) and biotic index (AMBI) for Site<br />
845, Belfast Lough. Mean value per 0.1m 2<br />
Year S A J’ H’ ITI AMBI<br />
Inner Lough<br />
1997 59.00 3,302.00 0.67 2.71 63.67 2.56<br />
1998 66.80 3,921.80 0.65 2.72 64.82 1.92<br />
1999 61.40 1,804.80 0.62 2.53 58.93 1.75<br />
2000 48.40 994.80 0.68 2.64 65.51 1.40<br />
2001 30.00 420.00 0.68 2.30 56.09 1.21<br />
Outer Lough<br />
1997 20.20 95.80 0.78 2.29 56.06 0.68<br />
1998 20.00 96.40 0.84 2.46 65.36 0.82<br />
1999 30.60 183.20 0.76 2.58 71.56 0.71<br />
2000 19.60 93.60 0.77 2.26 68.03 0.46<br />
2001 12.40 34.00 0.87 2.18 70.64 0.61<br />
nutrient input, although the ITI value did not reflect<br />
this. Populations of these species had diminished<br />
considerably by 2001.<br />
Cluster analysis of inner lough data identified five<br />
distinct groups, coinciding with the five sampling<br />
years (Figure 4.17). Within any one sampling year<br />
the 5 replicates were similar, but over the five year<br />
period there was a consistent trend as depicted by<br />
the arrow.<br />
Spearman rank correlation analysis revealed significant<br />
correlations between changes in the macrofauna and<br />
the sedimentary concentrations of organic nitrogen<br />
and organic carbon from 1999 to 2001.<br />
Major human changes in 1997 to 2002 include the<br />
cessation of sewage sludge disposal in 1998, with<br />
consequent changes at Belfast sewage treatment<br />
works, reduction of major discharges from a<br />
fertiliser plant, increased dredging activities, and<br />
expansion of sea-bed mussel culture. Although<br />
trends were not evident in the outer lough, the<br />
benthic trends seen in the inner lough might<br />
therefore be related to a general decrease in its<br />
nutrient loading. The Belfast Lough case study puts<br />
these changes into a wider context.<br />
Corophium/Arenicola sediment bioassay<br />
Sediment bioassays measure the acute toxicity of<br />
pore water or contaminants bound to sediment,<br />
to sediment dwelling organisms. Two have been<br />
developed for this purpose using the ploychaete<br />
Arenicola marina and the crustacean Corophium<br />
volutator (Thain and Bifield, 2002 and Roddie and<br />
Thain, 2002). Both animals live in the sediment: A.<br />
marina ingests sediment and C. volutator grazes on<br />
sediment particles. In the bioassays the animals are<br />
exposed under controlled conditions to collected<br />
sediments. In both bioassays, mortality is measured<br />
after 10 days, and feeding behaviour is also<br />
measured for A. marina.<br />
Eighty-four sediment samples were collected from<br />
four estuaries Mersey (19), Southampton Water<br />
(21), Tyne (22) and Tees(22). Twenty-one samples<br />
exhibited C. volutator mortality in excess of 20%,<br />
twelve of which occurred in samples from the Tees<br />
estuary (Figure 4.18). C. volutator mortalities of<br />
100% were recorded at three locations, one on<br />
Southampton Water and two on the Tees. Four<br />
sediments exhibited mortality to A. marina in excess<br />
of 20%, all from the Tees estuary, one of which<br />
was 100%. At several sites sediment toxicity was<br />
confined to one bioassay, as at Seal Sands using A.<br />
marina. This emphasises the value of carrying out<br />
joint bioassays.<br />
This work establishes a baseline for further<br />
monitoring in these estuaries and will help design<br />
surveys elsewhere. Where persistent toxicity<br />
is found, complementary sediment chemical<br />
contaminant analysis will be necessary.<br />
Summary<br />
2001 B<br />
2001C 2001E<br />
2001D 2001A<br />
2000A<br />
2000D<br />
2000E<br />
2000C<br />
2000B<br />
1999A<br />
1999B<br />
1999D<br />
1999E 1999C<br />
1997E<br />
1997B<br />
1997C<br />
1997D<br />
1997A<br />
1998A<br />
1998E<br />
1998D 1998C<br />
1998B<br />
Figure 4.17 Results of multidimensional scaling (MDS)<br />
analysis of the temporal data for 1997-2001 at<br />
the inner Belfast Lough<br />
Sediment metal/aluminium ratios were highest in<br />
industrialised estuaries. Mercury and lead were<br />
above background levels at most sites, whereas<br />
arsenic, chromium and nickel were close to<br />
background levels at most sites. A similar pattern<br />
was observed when absolute concentrations were<br />
compared to provisional EACs, except in the case<br />
of arsenic. Although As/Al ratios were mostly less<br />
than twice the BRC, absolute concentrations of<br />
arsenic were above the EAC range. This is because<br />
arsenic occurs naturally in rocks in the <strong>UK</strong> and is<br />
particularly high in ironstone deposits such as occur<br />
in the Tamar estuary.<br />
36
% Mortality<br />
100<br />
90<br />
80<br />
70<br />
60<br />
50<br />
40<br />
30<br />
20<br />
10<br />
0<br />
KEY<br />
BBC = Billingham Beck Confluence<br />
BB = Bramlett’s Bight<br />
TB = Transporter Bridge<br />
TP = Teesport<br />
DG = Dabholm Gut<br />
ST = Seaton-on-Tees Channel<br />
BBC 1<br />
BBC 2<br />
BBC 3<br />
BBC 4<br />
BBC 5<br />
BB 1<br />
BB 2<br />
BB 3<br />
BB 4<br />
BB 5<br />
TB<br />
PT<br />
DG 1<br />
DG 2<br />
DG 3<br />
DG 4<br />
DG 5<br />
ST 1<br />
ST 2<br />
ST 3<br />
ST 4<br />
ST 5<br />
Figure 4.18 C. Volutator mortality in sediment samples from the Tees<br />
Although point source inputs of metals have shown<br />
significant reductions with time, sediment metals<br />
concentrations will take longer to change, due<br />
to retention by strong metal-sulphide and metalorganic<br />
binding mechanisms. These historically<br />
contaminated sediments will be covered by recent<br />
deposits of less contaminated particulate material.<br />
CB concentrations were lowest in sediments at<br />
the Scottish sites. A higher proportion of lower<br />
chlorinated CBs was observed at these sites and is<br />
consistent with atmospheric transportation being<br />
the main input route. Inshore sites contained a high<br />
proportion of the more chlorinated CBs consistent<br />
with a particulate bound, waterborne source.<br />
Sediments from most sites, including five offshore<br />
sites, had median CB concentrations above the<br />
provisional lower EAC indicating a potential impact<br />
on sediment dwelling animals.<br />
Wide spatial differences in sediment concentrations<br />
of PAHs were observed, with the highest<br />
concentrations in industrialised estuaries and<br />
close to large urban conurbations, consistent with<br />
the fact that these compounds are derived from<br />
combustion sources.<br />
The 2000 benthic community data showed clearly<br />
the differences between estuarine and coastal<br />
sites. Estuarine sites had larger populations but<br />
lower diversity. The sieving of coastal samples<br />
with a 1 mm mesh and of estuarine samples<br />
with 0.5 mm mesh may account, in part, for the<br />
higher abundances seen in estuarine samples.<br />
Estuarine sites had lower ITI results than coastal<br />
ones, suggesting a community bias towards<br />
surface deposit feeders in estuaries and a larger<br />
proportion of surface-detrital or water column<br />
feeders at coastal sites. However, although the ITI<br />
was developed to distinguish the impact of organic<br />
sewage deposits on fully marine fauna, high riverine<br />
organic input to estuaries depresses ITI values<br />
naturally. Lower estuarine ITI values therefore do<br />
not necessarily indicate degraded communities.<br />
Detailed examination of the coastal benthic<br />
community data showed that univariate measures<br />
varied widely. Sites with low diversity tended<br />
to occur in areas of coarse sediment such as<br />
Morecambe Bay and off the Humber/Wash, or<br />
in very fine homogeneous sediment such as the<br />
north-western Irish Sea and Loch Linnhe. The<br />
lack of correlation between macrofaunal patterns<br />
and sediment contaminants reflects the relatively<br />
uncontaminated character of the coastal sites.<br />
The estuarine benthic community data suggested<br />
that sites with greater diversity, evenness and ITI<br />
were in areas with small salinity gradients, low<br />
sediment mobility and low organic enrichment.<br />
In contrast, high biotic index scores at sites with<br />
high abundance of opportunist species indicated<br />
modified or heavily modified benthic communities.<br />
Spearman rank correlation showed that sediment<br />
particle size characteristics exerted more<br />
influence on the macrofaunal communities than<br />
contaminants.<br />
A spatial survey of sediment toxicity in 4 estuaries<br />
showed localised toxicity at all sites.<br />
37
4.3 Shellfish<br />
Contaminants were measured in mussels to address<br />
the following JAMP issues.<br />
JAMP issue 1.2: What are the concentrations<br />
and fluxes of mercury, cadmium and lead in<br />
sediment and biota?<br />
JAMP issue 1.7: Do high concentrations of<br />
PCBs pose a risk to the marine ecosystem?<br />
and<br />
JAMP issue 1.11: Do PAHs affect fish and<br />
shellfish ?<br />
The effect of TBT on dogwhelks was the only<br />
biological effect measured in shellfish .<br />
Metals<br />
Nine metals (mercury, cadmium, lead, copper, zinc,<br />
nickel, chromium, arsenic and silver) were measured<br />
in mussels. Concentrations were compared to BRCs<br />
(see Table 4.10). There are no EACs or EQS for<br />
metals in mussels. A conclusion from the spatial<br />
NMMP survey in 1993-95 was that efforts should<br />
be made to close significant gaps in the mussel data<br />
available for some estuaries (MPMMG, 1998). This<br />
has been achieved in the temporal trend-monitoring<br />
phase, with 22 sites sampled.<br />
Table 4.10. BRCs for metals in mussels<br />
Metal<br />
BRC range<br />
(mg kg -1 wet weight)<br />
Mercury 0.005-0.010<br />
Cadmium 0.070-0.110<br />
Lead 0.010-0.190<br />
Copper 0.76-1.10<br />
Zinc 11.6-30<br />
Figure 4.19 shows the median mussel<br />
concentrations for mercury, cadmium and lead<br />
and copper and zinc for 1999-2001. However, no<br />
data were submitted for mussels from the Severn<br />
estuary, where the highest cadmium levels were<br />
reported in 1993-95 (MPMMG, 1998). Bryan et<br />
al. (1985) reported that mussels are ‘unreliable’<br />
indicator species for copper, zinc, arsenic and silver,<br />
and have ‘moderate’ usefulness for nickel. Mussel<br />
body burdens of these metals should therefore be<br />
interpreted carefully.<br />
Median mercury, cadmium and lead concentrations<br />
exceeded the BRCs at most sites. However, median<br />
copper and zinc concentrations were generally<br />
below the BRCs (see Figure 4.19).<br />
The lowest mercury concentration reported was<br />
slightly above the upper BRC at 14.7 µg kg -1 wet<br />
weight, in Belfast Lough. All other sites were above<br />
background concentrations. Median concentrations<br />
above 50 µg kg -1 wet weight were observed on the<br />
Northumberland Coast, in the Blackwater estuary,<br />
in the Thames estuary, in Morecambe Bay and at<br />
St. Bees Head in Cumbria, with the highest median<br />
concentration of 126 µg kg -1 wet weight in the<br />
Medway estuary.<br />
The lowest cadmium median concentration was<br />
observed in the Wash, at 102 µg kg-1 wet weight,<br />
and low median concentrations were also recorded<br />
in the Forth and Tay estuaries, in the Firth of Clyde<br />
and in Poole Harbour. Median concentrations<br />
were close to background at 9 sites. Median<br />
concentrations above 500 µg kg -1 wet weight were<br />
recorded in the Humber and Thames estuaries, with<br />
the highest median concentration of 1,178 µg kg -1<br />
wet weight in the Medway estuary.<br />
The lowest median lead concentration was<br />
within the BRC range, at 135 µg kg -1 wet weight<br />
in Lough Foyle. Median concentrations were<br />
close to background at only two sites. Median<br />
concentrations were above 1,000 µg kg -1 wet<br />
weight in the Clyde and Forth estuaries, on the<br />
Northumberland Coast, in the Tamar estuary<br />
and in Morecambe Bay, with the highest median<br />
concentration of 2,217 µg kg -1 wet weight in the<br />
Medway estuary.<br />
Median concentrations for copper and zinc were<br />
low, except in the Blackwater, Tamar and Medway<br />
for copper, and in the Medway for zinc.<br />
The minimum and maximum median concentrations<br />
reported for arsenic, chromium, nickel and silver<br />
in mussels for 1999-2001 are listed in Table 4.11.<br />
There are currently no BRCs, EACs or EQSs available<br />
for these metals in mussels.<br />
The high chromium concentrations in the Clyde<br />
estuary are consistent with previous results (Burt et<br />
al., 1992; Miller, 1986). The elevated silver levels<br />
in Belfast Lough may be due to photographic<br />
processing waste.<br />
Chlorinated Biphenyls (CBs)<br />
CB concentrations in mussels collected between<br />
1999 and 2001 were reported for twenty-one<br />
inshore and estuarine sites, on a wet weight basis.<br />
Data were not reported for all ICES 7 CBs at all<br />
sites. The results are summarised in Table 4.12 and<br />
shown in Figure 4.20 for CB 153 and in Figure<br />
4.21 for the sum of the ICES 7 CBs. The lowest<br />
concentration for the sum of the ICES 7 CBs was<br />
found at St. Bees on the Cumbrian coast and the<br />
highest at Sun Pier, Medway, in the south east of<br />
38
(a)<br />
(b)<br />
-1<br />
10 µg kg ww<br />
(upper BRC)<br />
-1<br />
20 µ g kg ww<br />
(close to background)<br />
-1<br />
50 µ g kg ww<br />
-1<br />
110 µ g kg ww<br />
(upper BRC)<br />
-1<br />
220 µ g kg ww<br />
(close to background)<br />
-1<br />
500 µ g kg ww<br />
(c)<br />
(d)<br />
-1<br />
190 µg kg ww<br />
(upper BRC)<br />
-1<br />
380 µ g kg ww<br />
(close to background)<br />
-1<br />
1000 µ g kg ww<br />
-1<br />
0.76 mg kg ww<br />
(lower BRC)<br />
-1<br />
1.10 mg kg ww<br />
(upper BRC)<br />
-1<br />
2.20 mg kg ww<br />
(close to background)<br />
Figure 4.19. Median (a) mercury, (b) cadmium, (c) lead and (d) copper concentrations in mussels, relative to their BRCs.<br />
39
(e)<br />
-1<br />
11.6 mg kg ww<br />
(lower BRC)<br />
-1<br />
30.0 mg kg ww<br />
(upper BRC)<br />
-1<br />
60.0 mg kg ww<br />
(close to background)<br />
-1<br />
0.5 µg kg ww<br />
(upper BRC)<br />
-1<br />
1.0 µg kg ww<br />
(close to background)<br />
-1<br />
4.0 µg kg ww<br />
Figure 4.19. continued: Median (e) zinc concentrations in<br />
mussels, relative to their BRCs<br />
Figure 4.20. Median concentrations of CB 153 in mussels<br />
(µg kg -1 wet weight) and their relationship to<br />
BRCs<br />
Table 4.11. Mussel concentrations for arsenic, chromium, nickel, and silver<br />
Metal<br />
Minimum median<br />
Concentration<br />
(µg kg -1 wet weight)<br />
Site<br />
Maximum median<br />
Concentration<br />
(µg kg -1 wet weight)<br />
Site<br />
Arsenic 945 Poole Harbour 7,470 Medway<br />
Chromium 111 The Wash 2,835 Clyde Estuary<br />
Nickel 174 Morecambe Bay 2,478 Medway<br />
Silver upper EAC NR 1 7<br />
Sites with upper 90% confidence limit on median concentration > upper EAC NR 1 11<br />
Concentration range 1993-1998 µg kg -1 wet weight 0.006 – 12.8<br />
Note 1 NR = not relevant as there is no EAC for CB 153 in mussels<br />
40
England. CB 153 was reported at nineteen sites<br />
with the lowest concentration again found on the<br />
Cumbrian coast and the highest at Warren Point on<br />
the Tamar (Table 4.12).<br />
The CB profiles were similar at most sites with the<br />
penta- and hexa-CBs (CB101, CB118, 138 and 153)<br />
dominating. In general the proportion of higher<br />
chlorinated CBs (>5 chlorines) increases through the<br />
food web as they are less volatile, more lipophilic<br />
and more resistant to metabolic and microbial<br />
degradation.<br />
OSPAR BRCs have been established for CB 153<br />
and the sum of the ICES 7 CBs in mussels (Table<br />
4.12). At most sites the median concentrations of<br />
CB 153 (Figure 4.20) and the sum of the ICES 7 CBs<br />
were above twice the upper BRCs. Median CB 153<br />
concentrations were above 3 µg kg -1 wet weight at<br />
3 sites (Warren Point in the Tamar, Sun Pier in the<br />
Medway, and Port Glasgow in the Clyde). These<br />
sites also had the highest median concentrations for<br />
the sum of the ICES 7 CBs, with values above 10 µg<br />
kg -1 wet weight.<br />
EACs have been established for the sum of the ICES<br />
7 CBs for mussels, with a range of 5–50 µg kg -1 dry<br />
weight. For comparison, this range (Table 4.12) was<br />
converted to a wet weight basis using a conversion<br />
factor of 0.15 (based on the median water content<br />
of mussels of 85%). The median concentrations<br />
for the sum of the ICES 7 CBs were estimated to be<br />
below the upper EAC with 90% confidence at only<br />
five sites (Figure 4.21).<br />
Polycyclic Aromatic Hydrocarbons (PAH)<br />
The PAH determined were: naphthalene,<br />
phenanthrene, anthracene, fluoranthene, pyrene,<br />
benz[a]anthracene, chrysene, benzo[a]pyrene,<br />
benzo[ghi]perylene and indeno[1,2,3-cd]pyrene.<br />
Mussel data were available from 19 sites.<br />
Flouranthene was the only PAH found above the limit<br />
of detection at all sites. The determination of PAH in<br />
biota has recently been introduced to the programme<br />
so relatively few data are available and this limits<br />
comparison between sites. Maximum concentrations<br />
for individual PAH are given in Table 4.13.<br />
For all PAH determined, the concentrations were<br />
below the upper provisional OSPAR EAC (Table 4.14).<br />
A few anthracene and one pyrene value exceeded<br />
the lower provisional EAC. These data suggested<br />
that toxic effects were unlikely in the areas sampled.<br />
The concentrations of pyrene found in mussels is<br />
shown in Figure 4.22 (See note to Table 4.13).<br />
-1<br />
1.7 µg kg ww<br />
(upper BRC)<br />
-1<br />
3.4 µ g kg ww<br />
(close to background)<br />
-1<br />
7.5 µ g kg ww<br />
(upper EAC)<br />
-1<br />
5 µg kg ww<br />
-1<br />
15 µg kg ww<br />
-1<br />
25 µg kg ww<br />
Figure 4.21. ICES 7 CBs relative to BRC and EACs<br />
Figure 4.22 Pyrene in mussels<br />
41
Table 4.13. Maximum PAH concentrations in mussels (µg/kg wet weight)<br />
PAH compound<br />
Maximum<br />
Site<br />
concentration<br />
Naphthalene 69 55 (Clyde)<br />
Phenanthrene 94 325 (Tees)<br />
Anthracene 3 220 (NE coast)<br />
Fluoranthene 133 65 (Clyde)<br />
Pyrene 197 65 (Clyde) 1<br />
benz[a]anthracene 5 357 (Humber)<br />
chrysene/triphenylene 309 65 (Clyde)<br />
Benzo[a]pyrene 5 357 (Humber)<br />
Benzo[ghi]perylene 59 65 (Clyde)<br />
indeno[1,2,3-cd]pyrene 10 220 (NE coast)<br />
Note 1 only one year of data was available for this site so the data were excluded from Figure 4.22.<br />
Table 4.14. Provisional EACs for mussels set by OSPAR (µg/kg dry weight and as a wet weight estimate)<br />
PAH compound Lower EAC Upper EAC<br />
µg kg -1 dry weight µg kg -1 wet weight µg kg -1 dry weight µg kg -1 wet weight<br />
naphthalene 500 75 5,000 750<br />
phenanthrene 5,000 750 50,000 7,500<br />
anthracene 5 0.75 50 7.5<br />
fluoranthene 1,000 150 10,000 1,500<br />
pyrene 1,000 150 10,000 1,500<br />
benzo[a]pyrene 5,000 750 50,000 7,500<br />
The mussel data were assessed as ‘total PAH’ using<br />
summed PAH concentrations as determined, and<br />
as benzo[a]pyrene equivalents (BaPEs). Total PAH<br />
concentrations ranged from 10 to 682 µg kg -1 wet<br />
weight, with the highest concentration at Port<br />
Glasgow in the Clyde estuary. The equivalency<br />
approach is a technique for assessing the risk posed<br />
by a number of different compounds present in<br />
a single exposure source (Bolger et al., 1996).<br />
Instead of calculating individual risks for each<br />
component, one compound with a known level<br />
of toxicity (benzo[a]pyrene in this case) is used<br />
as a standard. The concentrations of each of the<br />
other compounds are adjusted on the basis of their<br />
estimated, comparative levels of toxicity to calculate<br />
equivalent concentrations as benzo[a]pyrene.<br />
Summation of the equivalent concentrations<br />
produces a single number from which the risk<br />
can be estimated. This approach allows the<br />
assessment of PAH concentrations in relation to<br />
their carcinogenic potential, which is a longer-term<br />
risk than that indicated by the EACs. Only six of the<br />
compounds determined under the NMMP currently<br />
have toxic equivalency factors (TEFs) assigned<br />
(Law et al., 2002). Both the highest summed<br />
PAH concentrations (682 µg kg -1 wet weight) and<br />
the highest TEFs (0.02 to 32 µg kg -1 wet weight<br />
benzo[a]pyrene equivalents) occurred in the Clyde<br />
estuary at Port Glasgow in 2001, indicating this to<br />
be a contaminated site.<br />
It would be easier to determine if PAH<br />
contamination at each site is due to oil or<br />
combustion sources if a large suite of PAH<br />
were determined within the NMMP in the<br />
future, including alkylated PAH. Alkylated PAH<br />
predominate in oils, whereas the parent PAH<br />
compounds do so for combustion sources.<br />
Summary<br />
Concentrations for several metals were elevated in<br />
mussels, mainly in industrialised estuaries including<br />
the Tyne, Tees, Thames, Mersey, Clyde and Belfast<br />
Lough. The Medway estuary is a significant ‘hotspot’<br />
for mercury, cadmium, lead, arsenic, nickel and zinc<br />
due to inputs from local industry at Rochester and<br />
Gillingham, and naval activity at Chatham docks.<br />
The BRC range was exceeded at all sites indicating<br />
that concentrations are above background levels. In<br />
addition, median CB concentrations in mussels were<br />
above the lower EAC at all sites indicating potential<br />
cause for concern.<br />
42
Although PAH concentrations in sediments were<br />
high and exceeded the upper EACs at several sites,<br />
concentrations of PAH were below the relevant<br />
EACs in mussels, indicating that mussels may not be<br />
affected by the high concentrations in sediments.<br />
4.3.1 TBT-specific biological effects<br />
This section deals with JAMP issue 1.3: to what<br />
extent do biological effects occur in the<br />
vicinity of major shipping routes, offshore<br />
installations, marinas and shipyards?<br />
The main marine inputs of tributyltin (TBT)<br />
compounds come from biocides in antifouling<br />
paints on ships. TBT leaches slowly from the<br />
paint into the water. In recent years, it has only<br />
been used on vessels more than 25 m long, but<br />
historically it was widely used on smaller vessels,<br />
yachts and fish farm equipment.<br />
Females of the common dog whelk, Nucella<br />
lapillus, respond to TBT by developing male sexual<br />
characteristics, principally a penis and vas deferens<br />
- a condition known as imposex. In severe cases, it<br />
leads to sterility and death and subsequent decline<br />
in dog whelk populations. The development of<br />
imposex is a very sensitive biomarker of exposure to<br />
TBT.<br />
The degree of imposex in adult females is normally<br />
expressed as the relative penis size index (RPSI,<br />
%), in comparison to adult males in the same<br />
population, and as the vas deferens sequence index<br />
(VDSI), the average extent of the development of a<br />
vas deferens by a group of females. Vas deferens<br />
development has been divided into a sequence of<br />
stages from 0 to 6. A VDSI greater than 4 indicates<br />
that some of the mature females cannot reproduce.<br />
In 1997, imposex was surveyed using OSPAR<br />
Guidelines (OSPAR, 1998) along the west coast<br />
of Great Britain and the east coast of Ireland.<br />
Away from likely TBT inputs, RPSI and VDSI in<br />
open coastal sites were low and gave no concern<br />
for the health of the populations or individuals.<br />
More detailed surveys in and around ports and<br />
marinas showed the degree of imposex to differ<br />
considerably. In general, the VDSI declined away<br />
from ports and exceeded 4 only within a few<br />
hundred metres of the input.<br />
In 1998–99, imposex was surveyed around North<br />
Sea coasts and 23 sites were sampled on the east<br />
and south coasts. All populations showed some<br />
imposex and all females were usually affected, with<br />
small numbers of sterile females at 8 sites. At most<br />
sites, intensity of imposex had declined between<br />
1992 and 1998.<br />
Summary<br />
Recent decisions within the International Maritime<br />
Organisation (IMO) prohibit application of new<br />
TBT-based coatings to ships after 2003 and require<br />
removal of existing TBT coatings by 2008. It is<br />
likely that imposex conditions around harbours<br />
and shipping lanes will improve further, with<br />
deterioration at open coastal sites now being<br />
unlikely.<br />
4.4 Fish<br />
Contaminants were measured in fish to address the<br />
following JAMP issues.<br />
JAMP Issue 1.2: What are the concentrations<br />
and fluxes of mercury, cadmium and lead in<br />
sediment and biota?<br />
JAMP Issue 1.7. Do high concentrations of PCBs<br />
pose a risk to the marine ecosystem?<br />
and<br />
JAMP 1.11 Do PAH affect fish and shellfish ?<br />
Mercury and arsenic were measured in fish flesh<br />
and cadmium, lead and PCBs were measured in fish<br />
liver. Metallothionein was determined in fish livers<br />
as an indicator of exposure to metals. Finfish do not<br />
accumulate PAH as they are rapidly transformed and<br />
excreted via the bile. Exposure of finfish to PAH<br />
was assessed by determination of EROD activity in<br />
liver. DNA adducts and fish disease were measured<br />
as indicators of exposure to both PCBs and PAH.<br />
Metals<br />
Mercury was measured in fish flesh, and cadmium<br />
and lead in fish liver. Arsenic was reported for fish<br />
muscle only where data were required for the EC<br />
Fisheries Product Directive.<br />
Most reported data were for dab at offshore sites<br />
and flounder in estuaries. Data were also reported<br />
for plaice at offshore sites around Scotland and in<br />
Morecambe Bay, and in whiting at St. Bees on the<br />
Cumbrian coast. At most sites similar size fish were<br />
analysed each year.<br />
Mercury in fish flesh<br />
The BRCs for mercury in the flesh of flat fish,<br />
including dab, flounder and plaice, are 30-70 µg<br />
kg -1 wet weight. Figure 4.23 shows the median<br />
mercury concentrations for 1999-2001.<br />
The pattern of results was similar to that reported<br />
in the spatial NMMP survey of 1993-95 (MPMMG,<br />
1998). The highest median concentrations were<br />
43
-1<br />
30 µ g kg ww<br />
(lower BRC)<br />
-1<br />
70 µ g kg ww<br />
(upper BRC)<br />
-1<br />
140 µ g kg ww<br />
(close to background)<br />
found in the Mersey estuary (374 and 188 µg kg -1<br />
wet weight), Liverpool Bay (221 and 187 µg kg -1<br />
wet weight) and Morecambe Bay (178 and 108 µg<br />
kg -1 wet weight). Median concentrations were also<br />
high at sites in the Thames estuary (227 and 212<br />
µg kg -1 wet weight). Median concentrations were<br />
close to background at 24 of the 39 sites.<br />
Cadmium and lead in fish liver<br />
There are no BRCs or EACs for cadmium or lead<br />
in fish liver. Median concentrations of cadmium in<br />
fish liver (see Figure 4.24) were generally below 150<br />
µg/kg wet weight, consistent with results reported<br />
by CEFAS (1998) for a spatial survey around England<br />
and Wales in 1995-96. Higher median cadmium<br />
concentrations were measured in the Thames,<br />
Moray Firth, Dogger Central, Inner Cardigan Bay<br />
and West Dogger (166, 178, 196, 334, 439 µg kg -1<br />
wet weight respectively).<br />
Figure 4.23. Median mercury concentrations in fish flesh<br />
Median lead concentrations were below 200 µg<br />
kg -1 wet weight at most sites. Higher median<br />
concentrations, in the range 200-700 µg kg -1<br />
wet weight, were observed in flounder from sites<br />
in the Tyne, the Wear, and in dab and flounder<br />
(a)<br />
-1<br />
20 µg kg ww<br />
-1<br />
75 µ g kg ww<br />
-1<br />
200 µ g kg ww<br />
(b)<br />
-1<br />
20 µ g kg ww<br />
-1<br />
200 µ g kg ww<br />
-1<br />
2000 µ g kg ww<br />
Figure 4.24 Median concentrations of (a) cadmium and (b) lead in fish liver<br />
44
from sites in the Mersey and Ribble. Median lead<br />
concentrations were also in this range at sites off<br />
Humber, Cardigan Bay and North Antrim coast. The<br />
highest median concentration was 2.79 mg kg -1 wet<br />
weight in flounder from the inner Mersey estuary.<br />
-1<br />
100 µg kg ww<br />
-1<br />
1000 µ g kg ww<br />
-1<br />
10000 µ g kg ww<br />
Arsenic in fish flesh<br />
There are no BRCs, EACs or EQSs for arsenic in<br />
fish flesh. The results showed no clear pattern<br />
(Figure 4.25), as in the spatial survey of 1993-95<br />
(MPMMG, 1998). The highest concentrations were<br />
in plaice from the offshore site in the Moray Firth,<br />
suggesting that the levels reflect inputs from both<br />
anthropogenic and non-anthropogenic sources.<br />
Metal-specific biological effects in fish<br />
<strong>Marine</strong> organisms have developed a range of<br />
strategies to cope with different concentrations of<br />
essential or toxic metals. In general, detoxification<br />
depends on the conversion of toxic - often inorganic<br />
and ionic - forms into less toxic bound forms.<br />
The bound forms such as intracellular phosphatic<br />
granules may be stored safely and subsequently<br />
excreted.<br />
One detoxification mechanism is the induction of<br />
metallothioneins (MT). Metallothionein synthesis<br />
may be particularly stimulated by exposure via food<br />
or water to mercury, copper, cadmium and zinc.<br />
Some animals may also hold essential elements<br />
such as copper and zinc in other forms such as<br />
metalloenzymes, but excess levels are normally<br />
sequestered by MT.<br />
Formation of MT is a natural response to exposure<br />
to certain metals and provides protection against<br />
their possible toxicity. The presence of MT is an<br />
indication of exposure to these metals, rather than<br />
a measure of subsequent health. MT is usually<br />
measured in the liver of fish, as this normally<br />
contains the highest concentrations of inducing<br />
metals.<br />
Measurement of MT, within the NMMP started<br />
in 2001. Initial surveys measured MT in five male<br />
and five female dab (Limanda limanda) livers at<br />
16 offshore sites. The livers were assayed by<br />
a standard radio-Cd saturation assay. Results<br />
are expressed as ng MT/mg protein in liver<br />
homogenate.<br />
There was high variability at each site with factors<br />
of 10 or more between the maxima and minima,<br />
making statistical comparisons difficult (Figure<br />
4.26). Nevertheless, concentrations tended to be<br />
higher in females (median 511 ng MT/mg protein,<br />
interquartile range 369–712 ng MT/mg protein)<br />
than in males (median 306 ng MT/mg protein,<br />
interquartile range 221–421 ng MT/mg protein).<br />
Figure 4.25. Median arsenic concentrations in fish flesh<br />
There was no correlation between the median<br />
concentrations of MT in males and females at each<br />
site.<br />
The livers were also analysed for copper, cadmium,<br />
lead, zinc and mercury content. Overall the<br />
relationship between metal concentration and<br />
metallothionein was not strong; however significant<br />
positive correlations were found between<br />
metallothionein and the concentration of zinc and<br />
log transformed copper, mercury and cadmium in<br />
females. The concentration of metallothionein in<br />
males was significantly positively correlated with log<br />
transformed copper and lead.<br />
Summary<br />
The fish data showed results consistent with<br />
previous reports, with greater than background<br />
mercury concentrations in the Mersey estuary,<br />
Liverpool Bay and Morecambe Bay, as a result of<br />
historical discharges of mercury from the chlor-alkali<br />
industry. Cadmium and lead concentrations in fish<br />
liver were generally low, with higher concentrations,<br />
typically in industrialised estuaries. Relatively high<br />
concentrations of cadmium were also measured at<br />
Dogger Bank in the North Sea.<br />
45
Male Fish<br />
ng MT/mg protein<br />
900<br />
800<br />
700<br />
600<br />
500<br />
400<br />
300<br />
200<br />
100<br />
0<br />
Amble<br />
West Dogger<br />
Central Dogger<br />
NE Dogger<br />
Tees Bay<br />
Off Flamborough<br />
Off Humber<br />
Humber<br />
Outer Gabbard<br />
Site<br />
Rye Bay<br />
Inner Cardigan Bay<br />
Burbo Bay<br />
Liverpool Bay<br />
Off Morecombe Bay<br />
Red Wharf Bay<br />
Female Fish<br />
ng MT/mg protein<br />
1800<br />
1600<br />
1400<br />
1200<br />
1000<br />
800<br />
600<br />
400<br />
200<br />
0<br />
Amble<br />
West Dogger<br />
Central Dogger<br />
NE Dogger<br />
Tees Bay<br />
Off Flamborough<br />
Off Humber<br />
Humber<br />
Outer Gabbard<br />
Site<br />
Rye Bay<br />
Inner Cardigan Bay<br />
Burbo Bay<br />
Liverpool Bay<br />
Off Morecombe Bay<br />
Red Wharf Bay<br />
Figure 4.26. Concentrations (median and range) metallothionien in dab livers<br />
Metallothionein concentrations in fish were highly<br />
variable, but positively correlated with copper in<br />
both males and females.<br />
CBs<br />
CB data were reported in fish liver at 27 sites. At<br />
most sites, dab, flounder or plaice were collected.<br />
CB data in fish are normally reported on a lipid<br />
weight basis. Data from three sites were excluded,<br />
as supporting lipid data were unavailable.<br />
Figure 4.27 shows the median concentrations for<br />
the sum of the ICES 7 CBs, normalised to lipid,<br />
Median concentrations ranged from 219 µg kg -1<br />
lipid weight (Minches) to 4100 µg kg -1 lipid weight<br />
(Thames Mucking). The highest concentrations<br />
were found in the Thames, Mersey, Medway, Tamar<br />
(Warren Point) and Liverpool Bay.<br />
Fish liver from Scottish sites contained the highest<br />
proportion of lower chlorinated CBs, with CB 52<br />
and 101 dominating the profiles. This suggests a<br />
predominately atmospheric input. Most estuarine<br />
sites contained a higher proportion of the more<br />
highly chlorinated CBs, with the hexa-CBs<br />
dominating (CB 138 and 153). In coastal areas<br />
particulate bound waterborne sources dominate<br />
-1<br />
10 µg kg lipid weight<br />
-1<br />
100 µ g kg lipid weight<br />
-1<br />
1000 µ g kg lipid weight<br />
Figure 4.27 Median concentrations of the sum of the ICES<br />
7 CBs in fish liver (µg kg -1 lipid weight)<br />
46
and therefore there is a higher proportion of the<br />
more hydrophobic, highly chlorinated CBs. In the<br />
open sea, atmospheric deposition is more important<br />
and therefore the less chlorinated CBs tend to<br />
dominate the profiles.<br />
Currently there are no BRCs for CBs in fish liver. The<br />
EAC for ICES 7 CBs for fish (whole) is 1 – 10 µg kg -1<br />
wet weight, however there is no firm EAC available<br />
for fish liver.<br />
Results for the 1993 to 1995 spatial survey were<br />
reported on a wet weight basis, for CB 153 only,<br />
at 78 sites. In this survey concentrations of CB<br />
153 were greater than 20 µg kg -1 wet weight<br />
at more than half of the sites. The two highest<br />
concentrations were recorded in fish liver from<br />
Liverpool Bay (160 and 170 µg kg -1 wet weight).<br />
Similarly high concentrations were found in samples<br />
collected during the 1999-2001 survey, with median<br />
CB 153 concentrations in fish liver from 11 of the 27<br />
sites being greater than 20 µg kg -1 wet weight. The<br />
median concentration at Liverpool Bay was 74 µg<br />
kg -1 wet weight.<br />
1601-1850<br />
1201-1600<br />
801-1200<br />
401-800<br />
40-400<br />
Figure 4.28. Mean EROD activity (pM/min/mg protein) in<br />
dab in 1999<br />
EROD analysis<br />
This section deals with JAMP issue 1.11: do PAHs<br />
affect fish and shellfish?<br />
Fish detoxify a number of organic contaminants,<br />
specifically polycyclic aromatic hydrocarbons (PAH)<br />
and some polychlorinated biphenyls (PCB), by a<br />
metabolic pathway - the mixed function oxygenase<br />
(MFO) enzyme system – that is induced by exposure<br />
to such compounds. Induction of the MFO system<br />
may be deleterious via its transformation of parent<br />
carcinogenic and genotoxic compounds into active<br />
forms. The activity of ethoxyresorufin-O-deethylase<br />
(EROD) in fish liver is a measure (expressed as pM/<br />
min/mg protein) of such exposure.<br />
Dab at coastal and offshore sites off England and<br />
Wales were obtained by 3-m beam or Granton<br />
trawl. The ICES standard assay was used (Stagg<br />
and McIntosh, 1998). Scottish estuarine data are<br />
reported in the Forth and Clyde EROD case study<br />
(Part 2 of this report)<br />
Mean EROD activities were calculated for each<br />
site for each year (male and female values<br />
amalgamated) and are presented in Figures 4.28 to<br />
4.30.<br />
1999<br />
Fish were collected from 17 sites in May. EROD<br />
levels were higher in males than females at all<br />
sites, 6-7 times higher at some sites (Off Tees,<br />
Flamborough and NW Dogger). The highest male:<br />
female EROD ratios were recorded in the North Sea.<br />
1601-1850<br />
1201-1600<br />
801-1200<br />
401-800<br />
40-400<br />
Figure 4.29. Mean EROD activity (pM/min/mg protein) in<br />
dab in 2000<br />
1601-1850<br />
1201-1600<br />
801-1200<br />
401-800<br />
40-400<br />
Figure 4.30. Mean EROD activity (pM/min/mg protein) in<br />
dab in 2001<br />
These inter-sex differences in EROD relate to<br />
sampling in early May, close to the end of the<br />
spawning period. The reproductive cycle of North<br />
Sea dab is: pre-spawning (Sept-Dec), spawning<br />
(Jan-April), post-spawning (May) and resting<br />
(June-August) (Kirby et al., 1999) with some year<br />
47
to year variability. Male levels are highest during<br />
the spawning period and lowest during the postspawning/resting<br />
phase (May to August); females<br />
do not show as strong a trend (Lange et al., 1999).<br />
In male fish, high levels were found off Morecambe,<br />
St Bees Head and Outer Cardigan Bay (1854, 1617<br />
and 1574 pM/min/mg protein respectively) (Figure<br />
4.28). High values were also found in females at<br />
the Liverpool Bay and Irish Sea stations, but were<br />
low in the North Sea.<br />
2000<br />
Dab were sampled at 19 sites in June. The<br />
data were similar for both sexes, reflecting the<br />
reproductive state of the fish at the time, so were<br />
combined.<br />
The highest mean values on the East Coast were off<br />
Tees, off Flamborough, West Dogger, off Humber<br />
and in the Firth of Forth, with 1570, 1253, 1147,<br />
1047 and 1014 pM/min/mg protein respectively<br />
(Figure 4.29). Highest values on the West Coast<br />
were at near-shore sites in Liverpool Bay (Off<br />
Morecambe and Burbo Bight) and Dundrum Bay,<br />
east coast of Ireland. Low mean values were found<br />
at the South of Humber (46 pM/min/mg protein)<br />
and Rye Bay (134 pM/min/mg protein) sites.<br />
The 2000 data generally relate to known areas of<br />
organic contamination although correlations of size<br />
and reproductive parameters with EROD suggest<br />
that the recorded activities may also have been<br />
influenced by non-contaminant sources.<br />
2001<br />
Dab were sampled from 19 sites in June/July. The<br />
data showed, overall, slightly reduced EROD values<br />
(Figure 4.30). No site showed a mean value above<br />
1000 pM/min/mg protein and the highest values<br />
(≥800 pM/min/mg protein) were found in the east<br />
and northeast. A mean value of 858 pM/min/mg<br />
protein at Dundrum Bay, although similar to that<br />
recorded in 2000, should be treated with caution as<br />
it derived from only 5 fish. Low values were again<br />
recorded in samples from Rye Bay and Cardigan<br />
Bay.<br />
DNA Adducts<br />
In fish, the detoxification of some PAHs (e.g.<br />
benzo[a]pyrene and benzo[a]anthracene) produces<br />
highly reactive metabolites, termed DNA adducts,<br />
capable of binding to DNA. Such chemical<br />
modification of the DNA is considered to be one<br />
of the initial steps of chemical carcinogenesis. A<br />
causal link between sediment PAH contamination,<br />
DNA adduct formation and liver pathology<br />
in benthic fish species has previously been<br />
demonstrated. An association between PAH<br />
exposure, DNA adduct formation and cancerous<br />
lesion development in fish has also been revealed<br />
by a number of field and laboratory studies in<br />
both Europe and North America. Analysis of<br />
DNA adducts in liver therefore provides a sensitive<br />
biomarker of PAH exposure.<br />
Flatfish (dab, Limanda limanda, and flounder,<br />
Platichthys flesus) greater than 15 cm long were<br />
collected and their livers were immediately<br />
removed and stored in liquid nitrogen. Samples<br />
were analysed by 32P-postlabelling assay for DNA<br />
adducts (Randerath et al., 1981). The DNA adduct<br />
levels are shown in Table 4.15.<br />
Dab collected from coastal and offshore NMMP<br />
sites<br />
Adducts were detected at all sites apart from outer<br />
Cardigan Bay (1996 and 1998) and off the Tyne<br />
(1998). The DNA adduct profiles indicated exposure<br />
to complex mixtures of genotoxins and the levels<br />
varied both spatially and temporally. For example,<br />
dab caught in outer Cardigan Bay during 1999 and<br />
2000 contained profiles characteristic of exposure to<br />
complex mixtures of carcinogenic metabolites.<br />
It is clear that coastal dab are exposed at some<br />
times and in some places to sufficient genotoxins<br />
to induce detectable levels of DNA adducts. Dab<br />
migrate through unpolluted and polluted waters,<br />
so it is not possible to link specific sites to the<br />
induction of DNA adducts.<br />
Flounder collected from the Alde, Tyne, Tees<br />
and Mersey<br />
Significantly higher levels of adducts were detected<br />
in the contaminated Tyne estuary compared with<br />
fish from the reference Alde site during both spring<br />
and autumn. PAH bile metabolite analysis of<br />
flounder caught in May and October confirmed that<br />
fish were exposed to higher levels of PAH compared<br />
with those in the Alde. Differences between<br />
adduct levels in the Mersey and Tees during the<br />
autumn were not statistically significant but were<br />
elevated over those in the Alde.<br />
DNA adduct data are likely to reflect local<br />
contamination because flounder are usually found<br />
in their home estuaries for up to 8 months of the<br />
year. Fish from the Tyne in spring and autumn<br />
revealed aromatic or hydrophobic DNA adducts in<br />
the liver, typical of exposure to a complex mixture<br />
of PAH. This supports previous work (Lyons et al.,<br />
1999) showing that Tyne fish stocks are exposed<br />
to high levels of sediment-associated PAH and<br />
that a proportion of the bioavailable PAH was<br />
being metabolised to carcinogenic metabolites.<br />
Significantly, Tyne flounder show more precancerous<br />
lesions, specifically hepatocellular foci<br />
of cellular alteration, compared with fish from<br />
unpolluted sites (DETR, 2001).<br />
48
Table 4.15.<br />
Levels of hepatic DNA adducts (DNA adducts per 108 undamaged nucleotides) in dab and flounder from <strong>UK</strong><br />
coastal waters<br />
Date Station NMMP DNA adducts per 10 8<br />
undamaged nucleotides<br />
Dab (offshore/coastal)<br />
6/2000 c Offshore Forth/Tay 165 3.2 ± 0.8 a (7) b<br />
6/2000 Amble 244 7.6 ± 2.0 (10)<br />
6/1999 Amble 244 2.3 ± 1.0 (10)<br />
6/2000 West Dogger 285 5.4 ± 1.0 (10)<br />
6/1996 West Dogger 285 5.6 ± 2.3 (4)*<br />
6/2000 Flamborough 344 2.0 ± 0.5 (10)<br />
6/2000 Off Humber 345 4.3 ± 1.1 (10)<br />
6/1996 Off Humber 345 7.6 ± 1.0 (4)*<br />
6/1999 Rye Bay 486 2.1 ± 0.4 (10)<br />
6/2000 Celtic deep 605 10.6 ± 2.1 (10)<br />
6/2000 Outer Cardigan Bay 665 6.0 ± 1.3 (10)<br />
6/1999 Outer Cardigan Bay 665 10.0 ± 1.9 (9)<br />
6/1998 Outer Cardigan Bay 665 0.0 ± 0.0 (5)*<br />
6/1996 Outer Cardigan Bay 665 0.0 ± 0.0 (5)*<br />
6/2000 Burbo Bight 705 2.3 ± 1.3 (10)<br />
6/1999 Burbo Bight 705 6.1 ± 1.4 (10)<br />
6/1998 Burbo Bight 705 5.6 ± 2.2 (10)<br />
6/1996 Burbo Bight 705 16.2 ± 9.4 (4) *<br />
6/2000 Liverpool Bay 715 7.5 ± 1.2 (10)<br />
6/2000 Red Wharf Bay 776 8.2 ± 1.9 (10)<br />
6/1999 Red Wharf Bay 776 12.7 ± 2.2 (10)<br />
6/1998 Off Tyne 0.0 ± 0.0 (5)*<br />
6/1996 Off Tyne 4.0 ± 2.6 (5)*<br />
Flounder (Estuaries)<br />
5/2000 Tyne / 7.4 ± 3.1 (6)<br />
10/2000 Tyne / 14.1 ± 2.7 (6)<br />
10/2000 Tees / 5.0 ± 1.5 (6)<br />
10/2000 Mersey / 7.4 ± 3.1 (5)<br />
5/2000 Alde / 1.7 ± 0.4 (6)<br />
10/2000 Alde / 3.0 ± 0.9 (6)<br />
a<br />
Mean adduct levels ± SE<br />
b<br />
Numbers in parentheses represent number of individual liver samples analysed<br />
c<br />
Sample date<br />
* Number in parentheses represents number of pooled samples analysed (3 fish per pool)<br />
Fish pathology and disease biomarkers<br />
Fish diseases and pathological changes in the liver<br />
have long been used as indicators of environmental<br />
stress on fish populations. The International Council<br />
for the Exploration of the Sea (ICES) has contributed<br />
to standardised methodologies. Externally,<br />
conditions used for monitoring include acute<br />
and healing ulcerations, lymphocystis, epidermal<br />
hyperplasia/papilloma and hyperpigmentation.<br />
Internally, liver lesions comprising nodules and<br />
larger tumours have become routine to monitor<br />
the health of offshore fish species, such as the<br />
dab (Limanda limanda). Although the aetiology of<br />
certain diseases is known - for example an iridovirus<br />
is known to cause lymphocystis - that of others<br />
remains uncertain. However, measurement of these<br />
diverse conditions in individual fish helps monitor<br />
the overall health of a population.<br />
Sampling and disease reporting protocols<br />
followed those recommended by ICES (Bucke et<br />
al., 1996). Dab (L. limanda) were examined for<br />
externally visible diseases. Fish greater than 20<br />
cm long were dissected and, where macroscopic<br />
liver nodules were present, they were removed<br />
and preserved in 10% neutral buffered formalin<br />
(NBF) before examination to see if they were<br />
malignant. Standard sections of liver tissue from<br />
up to 50 dab were also collected and examined for<br />
histopathology. Although the range of possible<br />
49
lesions in flatfish is large, the categories here<br />
have been restricted to those that are indicative<br />
of contaminant exposure. Grade 1 indicates ‘no<br />
abnormalities detected’, Grade 2 ‘foci of cellular<br />
alteration (FCA)’, Grade 3 ‘benign tumours’<br />
(adenoma, cholangioma, hemangioma) and Grade<br />
4 ‘malignant tumours’ (carcinoma).<br />
Table 4.16 summarises the prevalence of externally<br />
visible diseases (lymphocystis, ulceration, epidermal<br />
hyperplasia/papilloma, hyperpigmentation) and of<br />
liver nodules greater than 2 mm in diameter.<br />
Liver nodules were most prevalent at the sites in<br />
Liverpool Bay, Flamborough and West Dogger<br />
and relatively high at other sites on the Dogger<br />
(including North and East Dogger and the Hospital<br />
Ground). The high prevalence at inner Cardigan<br />
Bay was based on a limited number of fish and<br />
greater confidence would require larger sample<br />
sizes. In 2000, liver nodules were found in seven<br />
fish from the Firth of Forth during the only visit to<br />
that location and were not detected at any other<br />
Scottish sites visited between 1999 and 2001.<br />
Data on the prevalence of the four grades of liver<br />
pathology from Rye Bay, West Dogger, Burbo<br />
Bight (Liverpool Bay) and Cardigan Bay are given<br />
in Figures 4.31 to 4.34 respectively. A greater<br />
proportion of livers appeared normal (Grade 1)<br />
at Rye Bay (the reference site) compared to other<br />
sites, particularly in 1999, but gross liver pathology<br />
(liver nodules) and a very low proportion of Grade<br />
4 pathology were detected in 2001. Histological<br />
examination of liver from fish captured at this site<br />
revealed Grade 2 and 3 pathology in all three years.<br />
In contrast, the proportion of dab sampled from the<br />
West Dogger and Burbo Bight sites exhibiting Grade<br />
4 pathology was considerably higher. At West<br />
Dogger, the prevalence of gross liver nodules was<br />
reasonably consistent (Figure 4.32) while at Burbo<br />
Bight and Cardigan Bay, the proportion of fish<br />
exhibiting gross liver nodules was higher in 2000<br />
and 2001 than in 1999 (Figures 4.33 and 4.34).<br />
At Cardigan Bay, the proportion of fish displaying<br />
Grade 2 liver pathology remained fairly consistent<br />
and there was an increase in the prevalence of<br />
Grade 3 liver pathologies.<br />
Summary<br />
CB concentrations were lowest at the Scottish<br />
sites. A higher proportion of lower chlorinated CBs<br />
was observed at these sites and is consistent with<br />
atmospheric transportation being the main input<br />
route. Inshore sites contained a high proportion<br />
of the more chlorinated CBs consistent with a<br />
particulate bound, waterborne source.<br />
No comparisons to EACs could be made for<br />
fish liver. However, median concentrations in all<br />
estuarine sites were greater than 500 µg kg -1 lipid<br />
weight. These data highlight that at inshore and<br />
estuarine sites, particularly in the south of England<br />
and Liverpool Bay, CB concentrations continue to be<br />
of concern.<br />
Sites in Liverpool Bay and off the North East coast<br />
of England have shown consistent elevated EROD<br />
activity. These results suggest that fish populations<br />
in these areas have undergone long-term exposure<br />
to MFO-inducing chemicals. It has been shown<br />
that flounder (Platichthys flesus) populations in<br />
the estuaries of the Mersey, Tyne and Tees exhibit<br />
significantly elevated levels of EROD activity (Kirby<br />
et al., 1999). The data presented here suggest that<br />
coastal populations of other fish species, such as<br />
dab, may also be affected. The potential influence<br />
of season and specimen size on EROD activity<br />
reinforces the requirement to adhere to the NMMP<br />
monitoring protocol.<br />
Dab and flounder both exhibited patterns of<br />
DNA adducts indicative of exposure to complex<br />
mixtures of PAH. However, it may be that other<br />
environmental contaminants were contributing<br />
to the overall genotoxic response. The migration<br />
of dab is a complicating factor. DNA adducts are<br />
persistent and the detection of DNA adducts in<br />
dab at a particular location may be a consequence<br />
of previous exposure to contaminants elsewhere.<br />
This highlights the need for integrated monitoring<br />
where biomarkers of recent exposure over days<br />
or weeks, such as EROD and bile metabolites, are<br />
used alongside DNA adducts reflecting cumulative<br />
contaminant exposure over months. DNA adducts<br />
are associated with increases in pre-cancerous<br />
and cancerous lesions in marine flatfish. Around<br />
the <strong>UK</strong>, some dab and flounder populations are<br />
being exposed to carcinogenic contaminants partly<br />
responsible for their observed pre-cancerous lesion<br />
Fish disease monitoring showed externally visible<br />
diseases in dab to remain at generally low levels.<br />
In particular, the results from Scottish waters<br />
indicate lower levels of disease than are found more<br />
generally in the North and Irish Seas. Overall, the<br />
prevalence of external diseases in dab was similar to<br />
that previously described from the same sampling<br />
locations in recent years (Anon, 2000, 2001). The<br />
dab captured off Flamborough, in some areas of<br />
the Irish Sea and on the Dogger Bank continue to<br />
exhibit higher levels of disease than fish from the<br />
Rye Bay reference site. Hyperpigmentation was a<br />
prominent condition in dab from several areas in<br />
the North Sea, but had low prevalence in the Irish<br />
Sea and in the English Channel at Rye Bay. The<br />
prevalence of hyperpigmentation has increased at<br />
the Cardigan Bay and West Dogger sites during<br />
the 1990s (CEFAS, 1998 and 2000). Ulceration<br />
was a common pathology in dab from several sites,<br />
50
Table 4.16. External disease and liver nodule prevalence per year and site, as percent.<br />
Sampling Site Year Nearest<br />
NMMP Site<br />
Rye Bay<br />
No. Fish<br />
Examined<br />
51<br />
Ulceration<br />
Epidermal-<br />
Papilloma<br />
Lymphocystis<br />
Hyperpigmentation<br />
1999 486 346 1.2 9.8 1.7 4.3 0.0<br />
2000 202 0.0 4.5 0.5 5.4 0.0<br />
2001 272 0.0 4.4 0.0 0.4 1.2<br />
Inner Cardigan Bay 2000* 656 231 2.6 9.1 1.3 8.2 25.0<br />
2001* 112 0.0 6.3 1.8 2.7 25.0<br />
Smiths Knoll 2001 395 153 0.0 0.7 0.7 0.0 0.0<br />
Red Wharf Bay 1999 776 265 1.9 9.8 1.1 0.4 0.6<br />
2000 223 0.0 9.9 0.9 0.9 4.0<br />
2001 294 0.0 13.9 0.3 0.0 0.5<br />
Inner Liverpool Bay<br />
(Burbo Bight) 2000 706 206 3.9 14.0 0.5 1.5 3.5<br />
Liverpool Bay 2 1999 715 290 1.0 16.9 1.0 0.3 5.3<br />
2000 291 1.4 28.2 2.1 1.4 4.2<br />
2001 259 0.0 18.1 0.8 0.4 5.0<br />
Morecambe Bay 2000 795 263 1.1 14.1 0.8 0.4 0.0<br />
2001 271 0.0 11.8 1.1 0.0 0.6<br />
Off Flamborough 1999 344 242 7.9 2.5 2.1 16.5 8.0<br />
2000 257 8.9 1.6 2.7 10.5 3.5<br />
2001 166 3.6 0.0 0.6 3.0 5.4<br />
Outer Humber 2000 345 261 5.7 1.9 1.1 11.9 1.9<br />
Silver Pit 2001 ~ 271 4.8 2.2 1.5 4.4 1.2<br />
West Dogger 1999 286 376 8.5 5.3 2.4 22.1 8.7<br />
2000 267 6.0 4.5 2.6 35.2 11.4<br />
2001 262 1.5 4.2 0.8 7.6 5.0<br />
Hospital Ground 2000 287 275 3.6 22.2 1.1 25.1 5.7<br />
2001 259 3 10 2 29 8<br />
North Dogger 2001 284 319 1.9 8.2 0.9 10.3 5.9<br />
Amble 2000 244 234 7.7 1.3 1.7 7.7 0.7<br />
2001 157 8.9 1.3 1.9 1.9 2.0<br />
East Dogger 2001 288 237 9.7 9.3 0.8 1.7 4.4<br />
St Bees 1999 768 253 2.0 7.1 2.8 0.0 4.0<br />
2000 147 8.2 4.8 1.4 4.8 0.0<br />
Burbo Bight 1999 705 355 1.7 9.9 2.8 0.3 4.6<br />
2000 234 2.1 17.9 1.7 0.4 1.5<br />
2001 225 0.0 20.0 0.9 0.0 4.9<br />
Off Tees 1999 295 188 5.9 1.1 3.7 5.9 0.0<br />
2000 147 8.2 4.8 1.4 4.8 0.0<br />
2001 150 3.3 2.0 2.0 0.7 2.2<br />
Firth Of Forth 2000 ~ 224 6.3 1.8 5.4 17.0 5.6<br />
Outer Gabbard 2000 475 174 0.6 4.6 2.3 7.5 0.9<br />
2001 218 0.0 1.4 1.4 0.5 0.8<br />
Indefatigable Bank 2001 ~ 265 0.4 4.2 0.4 8.3 3.1<br />
SE Isle Of Man 2001 805 158 2.5 14.6 0.6 0.0 0.0<br />
Bell Rock 1999 155 ~ 5.3 0.7 1.5 ~ ~<br />
2000 2367 2.9 0.6 0.9 ~ ~<br />
2001 1085 5.0 0.5 2.7 3.8 ~<br />
St Abbs 1999 155 ~ 1.6 2.1 1.5 ~ ~<br />
2000 552 2.9 1.6 1.3 ~ ~<br />
2001 513 6.2 1.4 2.1 1.4 ~<br />
Moray Firth 2000 95 3426 4.2 1.0 2.0 ~ ~<br />
2001 1687 4.2 1.6 2.9 2.0 ~<br />
East Orkney 1999 ~ ~ 2.9 0.6 0.5 ~ ~<br />
2000 858 3.6 0.5 1.2 ~ ~<br />
2001 515 1.9 0.0 2.3 1.8 ~<br />
* Prevalence of liver nodules calculated from only 32 and 12 fish in 2000 and 2001 respectively<br />
Liver<br />
Nodules
Proportion<br />
1<br />
0.9<br />
0.8<br />
0.7<br />
0.6<br />
0.5<br />
0.4<br />
0.3<br />
0.2<br />
0.1<br />
0<br />
Grade 1<br />
Grade 2<br />
Grade 3<br />
Grade 4<br />
1999 2000 2001<br />
Figure 4.31. Chart showing the proportion of grades of<br />
liver pathology in dab sampled from the Rye<br />
Bay reference site<br />
Proportion<br />
1<br />
0.9<br />
0.8<br />
0.7<br />
0.6<br />
0.5<br />
0.4<br />
0.3<br />
0.2<br />
0.1<br />
0<br />
Grade 1<br />
Grade 2<br />
Grade 3<br />
Grade 4<br />
1999 2000 2001<br />
Figure 4.32. Chart showing the proportion of grades of<br />
liver pathology in dab sampled from West<br />
Dogger<br />
Proportion<br />
1<br />
0.9<br />
0.8<br />
0.7<br />
0.6<br />
0.5<br />
0.4<br />
0.3<br />
0.2<br />
0.1<br />
0<br />
Grade 1<br />
Grade 2<br />
Grade 3<br />
Grade 4<br />
1999 2000 2001<br />
Figure 4.33. Chart showing the proportion of grades of<br />
liver pathology in dab sampled from Burbo<br />
Bight (Inner Liverpool Bay)<br />
with the highest prevalence on the Dogger Bank<br />
and from areas in the Irish Sea (including Liverpool<br />
Bay and Burbo Bight). Lymphocystis was seen at<br />
most sites, with the highest prevalence in dab from<br />
the North Sea (most notably off Flamborough,<br />
off the Tees estuary and at sites on the Dogger<br />
Bank). Epidermal papilloma was recorded at low<br />
prevalence in fish from all sites. This pathology<br />
was most common in fish from the Firth of Forth,<br />
West Dogger, off Flamborough, off Tees, and inner<br />
Cardigan Bay sites. The presence of macroscopic<br />
nodules or tumours was noted in fish captured from<br />
numerous sites, with the highest prevalences from<br />
the Dogger Bank and Flamborough sites. This is<br />
consistent with previous findings (CEFAS, 1998 and<br />
2000).<br />
Glossary<br />
Adenoma - a benign tumour of glandular tissue<br />
(including liver).<br />
Aetiology - assignment of a cause or reason.<br />
Carcinoma - a malignant tumour derived from<br />
epithelial cells.<br />
Cholangioma - a benign tumour of bile ducts.<br />
Epidermal hyperplasia/papilloma - an externally<br />
visible disease appearing as pale raised areas of<br />
skin. Possibly caused by a virus.<br />
Hemangioma - a benign tumour of endothelial<br />
(lining) cells.<br />
Hyperpigmentation - condition of increased<br />
pigmentation where the upper surface exhibits<br />
dark green/black areas (increased numbers of<br />
pigmented cells containing melanin). On the<br />
underside, affected areas mainly appear white<br />
with some melanisation.<br />
Liver nodule - a discrete pathology of the liver<br />
greater than 2mm in diameter.<br />
Lymphocystis - a disease caused by an iridovirus<br />
giving rise to multiple small nodules, usually on the<br />
surface of the fish.<br />
Neoplasia - an abnormal mass of tissue.<br />
Proportion<br />
1<br />
0.9<br />
0.8<br />
0.7<br />
0.6<br />
0.5<br />
0.4<br />
0.3<br />
0.2<br />
0.1<br />
0<br />
Grade 1 Grade 2 Grade 3 Grade 4<br />
1999 2000 2001<br />
Figure 4.34. Chart showing the proportion of grades of<br />
liver pathology in dab sampled from Cardigan<br />
Bay<br />
52
4.5 Trend detection<br />
The ability of the NMMP to detect temporal trends<br />
has been estimated using the first three years of<br />
data. The 10-year detectable trend was calculated<br />
for each contaminant time series (Nicholson et<br />
al,, 1997) and the results were summarised by<br />
the median 10-year detectable trend for each<br />
determinand/matrix combination (Table 4.17). After<br />
ten years’ monitoring, the NMMP is likely to detect<br />
a 6% annual decrease or increase in metal sediment<br />
concentrations (equivalent to a 43% decrease or<br />
69% increase over ten years). However, the NMMP<br />
is only likely to detect a 20% annual decrease or<br />
increase in CB sediment concentrations (an 87%<br />
decrease or 416% increase over ten years).<br />
The performance of the NMMP was also<br />
summarised by the median number of years<br />
required to detect a 50% reduction in<br />
concentration for each determinand / matrix<br />
combination (Table 4.18). After 10 years of<br />
monitoring, 50% reductions are only likely to be<br />
detected in metal concentrations in sediment,<br />
shellfish, and water. After 20 years of monitoring,<br />
50% reductions in nutrient concentrations and<br />
in PAH concentrations in sediment are also likely<br />
to be detected. However, even after 20 years of<br />
monitoring, a 50% reduction in CB concentrations<br />
would probably not be detected by the present<br />
sampling regime.<br />
The 1999-2001 monitoring data will now be used<br />
to redesign the NMMP with high power to detect<br />
trends in all groups of contaminants. This implies<br />
an increase in sampling effort at ‘key’ monitoring<br />
stations, and a reduction in monitoring frequency<br />
at other ‘sentinel’ stations where contaminant levels<br />
are close to background.<br />
Table 4.17.<br />
Percent annual change in contaminant concentration required to detect trend after 10 years<br />
Sediment Shellfish Seaweed Fish Water<br />
Metals 6% 6% 16% 13% 5%<br />
CBs 20% 15% 17%<br />
PAHs 11% 16%<br />
pesticides 18% 12%*<br />
nutrients 9%<br />
*<br />
This value is unreliable because most pesticide measurements in water were below the limit of detection.<br />
Table 4.18. Numbers of years required to detect a 50% reduction in contaminant concentrations<br />
Sediment Shellfish Seaweed Fish Water<br />
Metals 7 7 >20 >20 6<br />
CBs >20 >20 >20<br />
PAH 20 >20<br />
pesticides >20 >20<br />
nutrients 14<br />
53
5. CONCLUSIONS AND<br />
RECOMMENDATIONS<br />
Riverine inputs and direct discharges to tidal<br />
waters of many contaminants have decreased<br />
since monitoring was initiated by OSPAR in 1990.<br />
Discharges of cadmium and mercury in particular<br />
have decreased substantially as a result of controls<br />
on industrial discharges. The environmental<br />
monitoring data presented in this report cover<br />
the 3 years from 1999-2001 so it is not possible<br />
to comment on long term trends associated with<br />
trends in inputs. The results have shown the spatial<br />
distribution of contaminants and their associated<br />
biological effects and have been used to address<br />
the relevant JAMP issues. Examples of longer term<br />
trends in environmental contaminants associated<br />
with trends in inputs at selected sites are presented<br />
in Part 2 of the report.<br />
JAMP issue 2.1 Are agreed measures effective<br />
at reducing nutrient inputs?<br />
Inputs of phosphate have almost halved since 1990<br />
but there has not been a corresponding decrease in<br />
inputs of nitrogen. Agricultural inputs of nitrogen<br />
are expected to decrease as a result of the recent<br />
designations of Nitrate Vulnerable Zones, which<br />
impose controls on agricultural practices. The area<br />
of coastal waters impacted by these inputs depends<br />
on the relative size of the input and available<br />
dilution. Highest winter nitrate concentrations<br />
occurred in the Wash, Thames, Liverpool Bay and<br />
Eastern Irish Sea. The biological effects of these<br />
inputs were not included in the NMMP, but spring<br />
maximum chlorophyll concentrations have been<br />
found to be correlated to riverine nutrient loads to<br />
coastal waters.<br />
Do contaminant inputs lead to the exceedence of<br />
Environmental Quality Standards in <strong>UK</strong> waters?<br />
Riverine and direct discharges of most contaminants<br />
have decreased in recent years as a result of<br />
controls on point source discharges. Contaminant<br />
concentrations in estuaries were below EQSs but<br />
above background concentrations. Oyster embryo<br />
bioassay tests confirmed that water quality in<br />
estuaries was generally good but variable at some<br />
locations, with sporadic effects occurring at the<br />
same site sampled at different times.<br />
JAMP issue 1.2 What are the concentrations<br />
and fluxes of mercury, cadmium and lead in<br />
sediment and biota?<br />
Historical inputs have left a legacy of contaminated<br />
sediments in some areas. Concentrations of<br />
mercury, cadmium and lead in sediments were<br />
more than twice the background reference<br />
concentration at most sites and particularly high in<br />
industrialised estuaries where the concentrations<br />
were greater than the ecotoxicological assessment<br />
criteria. However, there was no correlation<br />
between concentrations of metals and benthic<br />
community structure, which was largely<br />
determined by the physical nature of the sediments,<br />
salinity and water depth. The lack of correlation of<br />
benthic communities with contaminants suggests<br />
that the stress caused by contaminants is relatively<br />
small compared to variability in physical parameters<br />
between sites and that the current provisional EACs<br />
for metals in sediments require revision. However,<br />
it was possible to correlate improvements in the<br />
benthic community structure with a substantial<br />
reduction in organic inputs in Belfast Lough.<br />
Baseline sediment bioassays have identified sites<br />
in the Mersey, Tyne and Tees estuaries where pore<br />
waters were toxic to test organisms. The extent<br />
and degree of toxicity were particularly pronounced<br />
in the Tees.<br />
Concentrations of mercury, cadmium and lead were<br />
above background in mussels from industrialised<br />
estuaries including the Tyne, Tees, Thames, Mersey,<br />
Clyde and Belfast Lough, reflecting the pattern<br />
observed in sediments . The results indicated a<br />
significant ‘hotspot’ for mercury, cadmium, lead,<br />
arsenic, nickel and zinc in the Medway estuary,<br />
possibly due to a combination of inputs from local<br />
industry at Rochester and Gillingham, and naval<br />
activity at Chatham docks. The biological effect of<br />
metal contamination in mussels was not measured<br />
but the bioavailability of metals will be assessed in<br />
future through the measurement of metallothionein<br />
and possible biological effects determined by the<br />
scope for growth technique.<br />
The fish data showed greater than background<br />
mercury concentrations in flesh from samples from<br />
the Mersey estuary, Liverpool Bay and Morecambe<br />
Bay, as a result of historical discharges of mercury<br />
from the chlor-alkali industry. Cadmium and lead<br />
concentrations in fish liver were generally low,<br />
with some higher concentrations, typically in<br />
industrialised estuaries. Higher concentrations of<br />
cadmium were also measured at Dogger Bank in<br />
the North Sea. There was no correlation between<br />
mercury, cadmium and lead concentrations in fish<br />
liver and metallothionein, but there was a positive<br />
correlation with copper.<br />
JAMP issue 1.7. Do high concentrations of PCBs<br />
pose a risk to the marine ecosytem?<br />
Production of PCBs stopped in the 1970s and<br />
they were removed from sale in 1986. However<br />
PCBs still enter the marine environment from the<br />
54
disposal of old equipment. PCBs were present in all<br />
sediment samples. Concentrations were lowest at<br />
Scottish offshore sites and highest in the Thames<br />
and Medway. The higher proportion of lower<br />
chlorinated CBs observed at the Scottish offshore<br />
sites is consistent with atmospheric transportation<br />
being the main input route. Inshore sites contained<br />
a high proportion of the more chlorinated CBs<br />
consistent with a particulate-bound, waterborne<br />
source. Concentrations in sediments were above<br />
ecotoxicological assessment criteria in the Clyde,<br />
Severn, Thames, Medway, but no contaminant<br />
effect was observed on the benthos.<br />
Median CB concentrations in mussels were above<br />
the lower EAC at all sites but their effects were not<br />
measured. Median concentrations of CBs in fish<br />
liver were relatively high in the Thames, Medway,<br />
Tamar, Mersey and Liverpool Bay.<br />
JAMP issue 1.10 What are the concentrations<br />
of PAHs in the maritime area?<br />
JAMP issue 1.11 Do PAHs affect fish and<br />
shellfish<br />
Wide spatial differences in sediment concentrations<br />
of PAH were observed, with the highest<br />
concentrations in industrialised estuaries and<br />
close to large urban conurbations, consistent with<br />
derivation of these compounds from combustion<br />
sources. Although concentrations in sediments<br />
were high and exceeded the upper EACs at several<br />
sites, concentrations were below the relevant EACs<br />
in mussels. This discrepancy between sediments<br />
and mussels suggests revision of the provisional<br />
EACs for PAH is required.<br />
A suite of methods was used to determine the<br />
possible biological effects of PAH in fish including<br />
EROD, DNA adducts and fish diseases. Fish caught<br />
in coastal waters showed low levels of exposure<br />
to PAH, whereas fish caught in industrialised<br />
estuaries showed higher levels of exposure. These<br />
results are consistent with higher concentrations of<br />
contaminants in estuarine sediments, in particular<br />
the Mersey and Tyne.<br />
JAMP issue 1.3: TBT- to what extent do<br />
biological effects occur in the vicinity of<br />
major shipping routes, offshore installations,<br />
marinas and shipyards?<br />
Imposex in dogwhelks is directly related to TBT<br />
contamination. The effects were widespread but<br />
reproduction appeared only to be significantly<br />
impaired in the immediate vicinity of marinas and<br />
harbours where TBT was used as an anti-foulant.<br />
Environmental TBT concentrations in dogwhelk<br />
flesh were not measured but such monitoring will<br />
commence in 2003.<br />
Although concentrations of some contaminants in<br />
waters, sediment and biota were found to be above<br />
current OSPAR BRCs and EACs in some areas it<br />
was often difficult to relate contaminant levels with<br />
measured biological effects. OSPAR has recognised<br />
that the current values for BRCs and EACs require<br />
revision and is in the process of addressing<br />
this issue. These values may not therefore be<br />
appropriate for the <strong>UK</strong> and the assessments made<br />
against the current criteria should be treated with<br />
caution.<br />
The ability of the NMMP to detect temporal trends<br />
varied widely across groups of contaminants. For<br />
example, the NMMP would probably detect a 50%<br />
reduction over ten years in metal concentrations<br />
in sediment, shellfish or water. However, the same<br />
reduction in metal concentrations in fish, or in<br />
CB or PAH concentrations in any matrix, would<br />
probably not be detected by the current sampling<br />
regime. The NMMP will now be redesigned to<br />
have higher power to detect trends in all groups of<br />
contaminants. This implies an increase in sampling<br />
effort at ‘key’ monitoring stations and a reduction<br />
in monitoring frequency at other ‘sentinel’ stations<br />
where contaminant levels are close to background.<br />
In the light of known future developments and<br />
the results obtained from this second phase of the<br />
NMMP, it is recommended that:<br />
- the programme should be adapted to fulfil future<br />
monitoring requirements arising from changes to<br />
the OSPAR JAMP and the EC Water Framework<br />
Directive;<br />
- the nutrients monitoring programme should be<br />
revised to align more closely with any OSPAR<br />
assessment criteria for eutrophication;<br />
- the development of biological techniques should<br />
continue and be further integrated with chemical<br />
measurements undertaken for the programme;<br />
- where contaminant concentrations in sediment<br />
exceed assessment criteria levels, sediment<br />
bioassays should be used to assess whether there<br />
may be any impact on biota;<br />
- The biological effect of metals and other<br />
contaminants on mussels should be assessed<br />
through the measurement of metallothionein and<br />
scope for growth.<br />
- The programme should be redesigned to target<br />
effort at identified ‘key’ monitoring sites.<br />
55
6. REFERENCES<br />
ANON, 2000. <strong>Monitoring</strong> and surveillance of<br />
non-radioactive contaminants in the aquatic<br />
environment and activities regulating disposal<br />
of wastes at sea, 1997. Science Series, Aquatic<br />
Environment <strong>Monitoring</strong> Report. CEFAS Lowestoft,<br />
52: 39-44.<br />
ANON, 2001. <strong>Monitoring</strong> and surveillance of<br />
non-radioactive contaminants in the aquatic<br />
environment and activities regulating disposal<br />
of wastes at sea, 1998. Science Series, Aquatic<br />
Environment <strong>Monitoring</strong> Report. CEFAS Lowestoft<br />
53: 30-33.<br />
Balls, P.W., 1992. Nutrient behaviour in two<br />
contrasting Scottish estuaries, the Forth and Tay.<br />
Oceanologica Acta, 15: 261-277.<br />
Bolger, M., Henry, S.H. and Carrington, C.D.,<br />
1996. Hazard and risk assessment of crude oil<br />
contaminants in subsistence seafood samples from<br />
Prince William Sound. American Fisheries Science<br />
Symposium, 18: 837-843.<br />
Borja, A., Franco, J. and Perez, V., 2000. A marine<br />
biotic index to establish the ecological quality of<br />
soft-bottom benthos within European estuarine<br />
and coastal environment. <strong>Marine</strong> Pollution, 40(12):<br />
1110-1114.<br />
Bryan, G.W., Langston, W.J., Hummerstone, L.G.,<br />
and Burt, G.R., 1985. A guide to the assessment<br />
of heavy-metal contamination in estuaries using<br />
biological indicators. <strong>Marine</strong> Biological Association<br />
of the <strong>UK</strong>. Occasional Publication No. 4.<br />
Bucke, D., Vethaak, A.D., Lang, T. and Mellergaard,<br />
S., 1996. Common diseases and parasites<br />
of fish in the North Atlantic: Training guide<br />
for identification. ICES Techniques in <strong>Marine</strong><br />
Environmental Science, 19: 27pp.<br />
Burt, G.R., Bryan, G.W., Langston, W.J., and<br />
Hummerstone, L.G., 1992. Mapping the<br />
Distribution of Metal Contamination in <strong>UK</strong><br />
Estuaries. Plymouth <strong>Marine</strong> Laboratory Report.<br />
Plymouth.<br />
CEFAS, 1998. <strong>Monitoring</strong> and surveillance of<br />
non-radioactive contaminants in the aquatic<br />
environment and activities regulating the disposal<br />
of wastes at sea, 1995 and 1996. Science Series<br />
Aquatic Environment <strong>Monitoring</strong> Report. CEFAS<br />
Lowestoft, 51: 116pp.<br />
CEFAS, 2000. <strong>Monitoring</strong> and surveillance of<br />
non-radioactive contaminants in the aquatic<br />
environment and activities regulating the disposal<br />
of wastes at sea, 1997. Aquatic Environment<br />
<strong>Monitoring</strong> Report, MAFF Directorate of Fisheries<br />
Research, Lowestoft, 52: 92pp.<br />
Codling, I.D. and Ashley, S.J., 1992. Development<br />
of a biotic index for the assessment of pollution<br />
status of marine benthic communities. Final<br />
Report to SNIFFER and NRA. NR 3102/1.<br />
DETR, 2001. Pathology biomarkers in estuarine fish<br />
species for the assessment of biological effects of<br />
contaminants. CDEP 84/5/287.<br />
Evans G.L., Williams, P. J., Le B. and Mitchelson-<br />
Jacob, G., 2001. Interdecadal Variability of<br />
Nutrients in the Irish Sea School of Ocean<br />
Sciences, University of Wales, Bangor.<br />
Fryer, R.J. and Nicholson, M.D., 1999. Using<br />
smoothers for comprehensive assessments of<br />
contaminant time series in marine biota. ICES<br />
Journal of <strong>Marine</strong> Science, 56: 779 -790.<br />
Gowen, R.J., Hydes, D.J., Mills, D.K., Stewart, B.M.,<br />
Brown, J., Gibson, C.E., Shammon, T.M., Allen,<br />
M. and Malcolm, S.J., 2002. Assessing trends in<br />
nutrient concentrations in coastal shelf seas: a case<br />
study in the Irish Sea. Estuarine, Coastal and Shelf<br />
Science, 54: 927-939<br />
Holme, N., AND McIntyre, A.D. (eds)., 1971.<br />
Methods for the Study of <strong>Marine</strong> Benthos,<br />
IBP Handbook 16. Oxford, Blackwell Scientific<br />
Publications.<br />
Kirby, M.F., Matthiessen, P., Neall, P., Tylor, T.,<br />
Allchin, C.R., Kelly, C.A., Maxwell, D.L., Thain,<br />
J.E., 1999. Hepatic EROD activity in flounder<br />
(Platichthys flesus) as an indicator of contaminant<br />
exposure in English estuaries. <strong>Marine</strong> Pollution<br />
Bulletin, 38: 676 -686.<br />
Lange, U., Goksoyr, A., Siebers, D. and Karbe, L.,<br />
1999. Cytochrome P450 1A-dependent enzyme<br />
activities in the liver of dab (Limanda limanda):<br />
kinetics, seasonal changes and detection limits.<br />
Compendium of Biochemistry and Physiology B.,<br />
123: 361-371.<br />
Law, R.J., Kelly, C., Baker, K., Jones, J., McIntosh,<br />
A.D. and Moffat, C.F., 2002. Toxic equivalency<br />
factors for PAH and their applicability in<br />
shellfish pollution monitoring studies. Journal of<br />
Environmental <strong>Monitoring</strong>, 4: 383-388.<br />
Lyons, B.P., Stewart, C. and Kirby, M.F., 1999. The<br />
detection of biomarkers of genotoxin exposure in<br />
the European flounder (Platichthys flesus) collected<br />
from the River Tyne Estuary.<br />
Miller, B.S., 1986. Trace metals in the common<br />
mussel Mytilus edulis (L.) in the Clyde Estuary.<br />
Proceedings of the Royal Society of Edinburgh,<br />
90B: 377-391.<br />
MPMMG, 1998. <strong>National</strong> <strong>Monitoring</strong> <strong>Programme</strong>.<br />
Survey of the Quality of <strong>UK</strong> Coastal Waters.<br />
<strong>Marine</strong> Pollution <strong>Monitoring</strong> Management Group.<br />
Aberdeen. ISBN 09532838 3 6.<br />
Nicholson, M.D., Fryer, R.L. and Ross, C.A., 1997.<br />
Designing monitoring programmes for detecting<br />
temporal trends in contaminants in fish and<br />
shellfish. <strong>Marine</strong> Pollution Bulletin, 34: 821-826.<br />
NMMPWG, 2001., <strong>National</strong> <strong>Marine</strong> <strong>Monitoring</strong><br />
<strong>Programme</strong>, Green Book. www.marlab.ac.uk<br />
56
Nedwell, D.B., Dong, L.F., Sage, A. and Underwood,<br />
G.J.C. 2002. Variations of the nutrients loads<br />
to the mainland U.K. estuaries: correlation with<br />
catchment areas, urbanization and coastal<br />
eutrophication. Estuarine, Coastal and Shelf<br />
Science. 54: 951-970.<br />
OSPAR Commission, 1999. Report of an assessment<br />
of trends in the concentrations of certain metals,<br />
PAHs and other organic compounds in the tissues<br />
of various fish species and blue mussels: OSPAR<br />
Ad Hoc Working Group on <strong>Monitoring</strong> 1998.<br />
OSPAR Commission, 2000a. Quality Status Report<br />
2000. OSPAR Commission, London, 108pp.<br />
OSPAR Commission, 2000b. Quality Status Report<br />
2000, Region II — Greater North Sea. OSPAR<br />
Commission, London, 136pp.<br />
OSPAR Commission, 2000c. Quality Staus Report<br />
2000. Region III - Celtic seas. OSPAR Commission,<br />
London, 116pp.<br />
OSPAR Commission, 2000d. Background Reference<br />
Concentrations (BRCs) and Ecotoxicological<br />
Assessment Criteria (EACs). London. December<br />
2000.<br />
OSPAR Commission, 2000e. OSPAR background<br />
document on mercury and organic mercury<br />
compounds. OSPAR Commission, London, 28pp.<br />
OSPAR Commission, 2002. OSPAR background<br />
document on cadmium. OSPAR Commission,<br />
London, 56pp.<br />
Randerath, K., Reddy, M.V. and Gupta., R.C.,<br />
1981. 32 P-postlabelling test for DNA damage.<br />
Proceedings of the <strong>National</strong> Academy of Science<br />
USA, 78: 6126-6129.<br />
Warwick, R.M. and Clarke, K.R., 1991. A<br />
comparison of some methods for analysing<br />
changes in benthic community structure. Journal<br />
of the <strong>Marine</strong> Biological Association of the United<br />
Kingdom, 71(1): 225-244.<br />
57
<strong>UK</strong> CASE STUDIES<br />
This section reports marine environmental monitoring data that are not currently included in the NMMP.<br />
There are 3 different themes:<br />
1. Spatial surveys of determinands such as plankton or brominated flame retardants that may be included in<br />
the future NMMP.<br />
2. Long term trends at specific sites such as Belfast Lough and the estuaries of the Forth, Tyne, Tees, Thames,<br />
Humber and Mersey. These case studies discuss data gathered before the start of the NMMP and discuss<br />
contaminants not included in the NMMP.<br />
3. <strong>Monitoring</strong> of general interest, such as litter, the Milford Haven oil spill and disposal ground monitoring.<br />
Wherever possible the structure of case studies has been based on the DPSIR model, progressing from driving<br />
forces and pressures to the state of the environment and the impact/biological effect of contaminants.<br />
59
1. MARINE LITTER<br />
Litter may be defined as visual and tangible<br />
pollution from the inappropriate disposal of waste.<br />
It is a serious and persistent environmental problem,<br />
posing a hazard to beach users, recreational<br />
water users and wildlife. It looks unsightly, spoils<br />
our enjoyment of Nature and may have serious<br />
economic impact on coastal communities. It is of<br />
great public concern and is largely preventable,<br />
as its source is solely anthropogenic. The general<br />
functioning of society, producing waste as an<br />
inevitable by-product, is the main driving force in<br />
the problem of litter pollution. Litter only arrives on<br />
our beaches because waste is allowed to escape<br />
into the environment.<br />
The main sources of litter<br />
The <strong>Marine</strong> Conservation Society (MCS) in its 2001<br />
‘Beachwatch’ report estimated that about 37% of<br />
collected litter items were attributable to tourism or<br />
beach visitors. Fly tipping, the illegal deposit of any<br />
waste onto land, is also a common problem.<br />
Sewage related debris is a problem on some<br />
beaches. About 1.5-2.0 billion sanitary protection<br />
products are flushed down <strong>UK</strong>. toilets every year,<br />
with about 60-100 million condoms. Many of these<br />
end up in rivers, the sea and our beaches. The<br />
range of coastal litter reflects the wide range of<br />
contributory sources. Coastal litter was quantified<br />
by the MCS: a beach cleaning exercise at 194 sites<br />
in September 2001 found 11,894 crisp and sweet<br />
packets, 12,485 caps and lids, 9,507 plastic drink<br />
bottles, 6,647 cigarette stubs, 5,278 drink cans,<br />
4,849 plastic bags, 6,389 bits of glass, 1,584 fast<br />
food containers, 1,126 balloons, 358 4 or 6 pack<br />
yolks. The total weight of litter debris collected from<br />
141.3 km of beaches was 8.3 tonnes.<br />
Shipping litter comes in many shapes and sizes.<br />
The International Convention for the Prevention<br />
of Pollution from Ships 1973, or MARPOL (2), was<br />
modified in 1978 and ratified in June 1994 by 69<br />
countries, including the <strong>UK</strong>. It regulates the types<br />
and quantities of operational and cargo wastes<br />
that may be discharged from ship to sea, taking<br />
into account the ecological sensitivity of different<br />
sea areas. One requirement of the MARPOL ruling<br />
is that under no circumstances are plastics to be<br />
disposed of at sea. However, everyday domestic<br />
ship waste is often disposed of at sea rather than<br />
bringing it back into port for proper disposal<br />
–MCS estimate that 3% of litter collected during<br />
its Beachwatch survey could be attributed to this<br />
source. Cargo, bulk and containerised, may wash<br />
overboard in storms and contributes substantial<br />
individual items of coastal litter, and poses a<br />
Photo Copyright © Coastwatch<br />
potential shipping hazard. Fishing nets and lines are<br />
lost by accident or are dumped deliberately. These<br />
items may either wash ashore or sink to the sea<br />
bottom.<br />
State of the environment<br />
The MCS Beachwatch survey is the best long-term<br />
indication of trends on <strong>UK</strong> beaches. Despite a<br />
decline in litter in the last four years, it remains<br />
around 50% higher than in 1994 (Figure 1).<br />
The <strong>National</strong> Aquatic Litter Group (NALG) is a<br />
consortium working to reduce litter pollution.<br />
The EA, SEPA and EHSNI are all partners. NALG<br />
has developed a standardised monitoring and<br />
assessment protocol for assessing the aesthetic<br />
state of beaches. The protocol has a standard<br />
survey unit and a four grade classification scheme<br />
from A (very good) to D (poor), based on the<br />
Items per kilometre<br />
2000<br />
1500<br />
1000<br />
500<br />
Figure 1.<br />
0 1994 1995 1996 1997 1998 1999 2000 2001<br />
Beachwatch Surveys 1994-2001. Number<br />
of items per kilometre (Source: <strong>Marine</strong><br />
Conservation Society)<br />
61
assessment of a range of parameters including<br />
sewage related debris, gross and general litter,<br />
potentially harmful debris, oil, dog faeces and large<br />
accumulations of litter.<br />
During 2000-2002 the EA conducted annual<br />
snapshot surveys of each of its designated coastal<br />
bathing waters, using the protocol. For consistency,<br />
and to measure trends, the surveys were in July. In<br />
2002, the survey covered 472 beaches.<br />
Most beaches were graded A or B (very good or<br />
good) with 77% in 2000 rising to 82% in 2002<br />
(Figure 2). At the same time, the number of grade<br />
D beaches fell from 10% in 2000 to 5% in 2002.<br />
Although these were ‘snapshot’ surveys, this is<br />
encouraging.<br />
Impacts of marine litter<br />
Litter on our coasts may have a serious aesthetic,<br />
environmental, health and economic impact. <strong>Marine</strong><br />
litter may kill and injure marine mammals, seabirds<br />
and other forms of marine and coastal life. Plastic<br />
litter kills an estimated 100,000 marine mammals<br />
and turtles world-wide every year - including<br />
30,000 seals, and up to one million seabirds, either<br />
through entanglement or via ingestion.<br />
An autopsy by the Cotentin Cetaceans Study<br />
Group and the University of Caen analysed the<br />
stomach contents of a whale stranded on a beach<br />
in Normandy, and found nearly a kilogram of plastic<br />
bags and packaging. They found one plastic and<br />
foil crisp bag and two supermarket plastic bags<br />
- all from the <strong>UK</strong>, seven coloured dustbin bag<br />
fragments, seven transparent bags and one food<br />
container.<br />
Some litter is long-lived and active for decades. It<br />
consists to a very great extent of plastics, metal and<br />
glass, materials that do not break down easily or<br />
quickly.<br />
Responses to litter pollution<br />
The key to controlling marine litter is to tackle<br />
it at source. The main regulatory control of<br />
Figure 2.<br />
Beach Aesthetics Surveys (England & Wales)<br />
(Source: Environment Agency)<br />
shipping litter is MARPOL. Land sourced litter is<br />
controlled by a number of regulations, the most<br />
important of which are the Environment Act,<br />
1990 (England, Scotland and Wales) and the 1994<br />
Northern Ireland Litter Order. Another key theme<br />
is educational initiatives such as the ‘Bag it and<br />
Bin It’ campaign that aims to educate people into<br />
not flushing litter down the toilet towards our<br />
beaches and riverbanks. Encouraging participation<br />
in initiatives such as the MCS Beachwatch survey<br />
also helps to educate and inform the public about<br />
the problems of aquatic litter. The EA also seeks<br />
public participation in providing data on beach litter<br />
by helping to monitor beaches using the NALG<br />
protocol and entering such data directly onto its<br />
website through an interactive link.<br />
The answer to reducing the threat, general<br />
unsightliness and costs of marine litter and debris<br />
is through a combination of regulation, education<br />
and co-operation between the public and interested<br />
groups and organisations.<br />
62
2. CONTINUOUS NUTRIENT MONITORING AT THE NMMP BUOY IN<br />
THE NORTH WESTERN IRISH SEA<br />
Automatic water samplers have been used to collect<br />
continuous data at the NMMP buoy (site 808) in the<br />
Irish Sea, where concerns about eutrophication have<br />
focused attention on biological processes affecting<br />
the recycling of nutrients. The samplers allowed the<br />
determination of nutrients to traceable standards<br />
but the analytical quality relied on preserving<br />
samples in their original state and getting good<br />
agreement between sampler data and coincident<br />
spot samples. Short-term trials taking independent<br />
samples at the same time and place as the sampler<br />
showed no difference between the two sets of<br />
samples. Long-term data revealed more variability<br />
between results.<br />
Nitrate data have proved robust and reliable and<br />
of most interest since phosphorus is not a limiting<br />
nutrient. Nevertheless, it seems desirable to make<br />
future measurements of phosphorus and to develop<br />
the autosampler so that a full range of nutrients<br />
may be measured reliably.<br />
Measurements restricted to one depth and one<br />
station (Figure 3) showed seasonal cycles of spring<br />
uptake and winter replenishment and possible<br />
interannual variability. Maximum values occured<br />
in the winter when the water was well mixed and<br />
were probably better described than the minima.<br />
Summary<br />
Problems of deployment, filtering and mooring<br />
security were resolved but the prevention of<br />
biofouling and the validation of samples in situ<br />
has been difficult. Biofouling has now largely been<br />
overcome and the sampler may be accepted as<br />
part of a long-term programme giving a context<br />
for short-term cruises. The data acquired by the<br />
samplers and associated thermistor strings have<br />
shown the difficulties of accounting for water<br />
movements in a heterogeneous water mass. Large<br />
changes in nutrients from day to day and apparent<br />
changes in water temperature reflected advection<br />
- the passage of different water masses. These<br />
results have modified our concept of the gyre in this<br />
area as an isolated water mass: major events in both<br />
surface and deep waters during the summer implied<br />
some ingress of water to the region.<br />
1.0 P<br />
0.8<br />
0.6<br />
0.4<br />
0.2<br />
0<br />
µmol l -1<br />
10.0<br />
0.8<br />
0.6<br />
0.4<br />
0.2<br />
0<br />
Si<br />
12.0 N<br />
10.0<br />
0.8<br />
0.6<br />
0.4<br />
0.2<br />
0<br />
1995 1996 1997 1998 1999 2000 2001<br />
Figure 3. Autosampler data for P, Si and N: µmol l -1<br />
63
3. TRENDS IN PHYTOPLANKTON IN <strong>UK</strong> COASTAL WATERS FROM<br />
ANALYSIS OF CONTINUOUS PLANKTON RECORDER (CPR) DATA<br />
Distinguishing between natural and<br />
anthropogenic variability<br />
It is sometimes assumed that local anthropogenic<br />
inputs are the major factor determining long-term<br />
variations in coastal nutrient concentrations, and<br />
hence trophic status (Allen et al., 1998, Gowen<br />
et al., 2002). However, a recent Irish Sea study<br />
concluded that climate is a significant factor. This<br />
contradiction, based on the same nutrient data,<br />
highlights the importance of natural background<br />
variations in accounting for nutrient concentrations<br />
by climate change, as well as by local anthropogenic<br />
inputs.<br />
Many phytoplankton responses thought to<br />
be associated with changes in nutrients or<br />
nutrient ratios may have equally plausible natural<br />
explanations. Distinguishing between natural and<br />
anthropogenic changes is problematic for biological<br />
populations and nutrient concentrations, requiring<br />
background data with wide spatial and long<br />
temporal coverage.<br />
The importance of spatial coverage is exemplified<br />
by the North Sea, where about 90% of the inputs<br />
of the major nutrients, nitrate and phosphate,<br />
derived from the North Atlantic (NSTF, 1993). In<br />
coastal areas such as the Wadden Sea, German<br />
Bight, Kattegat and eastern Skagerrak, nutrient<br />
enrichment and oxygen de-oxygenation (OSPAR,<br />
2000) have been attributed to localised inputs<br />
whereas natural large-scale effects are in fact<br />
responsible.<br />
These spatial aspects are highlighted by long-term<br />
biological patterns, where the dominant external<br />
force depends on the scale of study. For example,<br />
small-scale biological patterns may be driven by<br />
biological interactions, whereas large-scale patterns<br />
may be caused predominantly by physical or climatic<br />
factors. Therefore, one of the disadvantages of<br />
small-scale ecological studies is that larger-scale<br />
responses are obscured and spuriously attributed to<br />
local effects.<br />
The continuous plankton recorder (CPR) survey,<br />
started in 1931 in the North Sea, is one of few longterm<br />
biological monitoring programmes and the<br />
only one at a wide spatial scale giving systematic<br />
coverage of the north-east Atlantic and <strong>UK</strong> shelf<br />
seas. Because the survey extends sufficiently to<br />
detect different regional variability it may help<br />
determine whether localised anthropogenic effects<br />
have a wider-scale impact and it may help separate<br />
anthropogenic from climatic signals. This natural<br />
variability, influenced by global warming, should be<br />
considered in assessing the ecological state of <strong>UK</strong><br />
coastal waters.<br />
CPR data have recently provided information on<br />
harmful algal blooms, monitoring and documenting<br />
the spread of non-indigenous plankton species, and<br />
describing changes in marine biodiversity. Some<br />
case studies using CPR data are summarised below.<br />
Recent case studies by the CPR survey<br />
Eutrophication versus natural<br />
variability<br />
Sudden increases in phytoplankton biomass seen after<br />
the mid-1980s in the North Sea and west of Ireland<br />
between 52ºN and 58ºN (Reid et al., 1998) were<br />
accompanied by a decreasing trend in the Northwest.<br />
Phytoplankton abundance increased in the late 1980s/<br />
early 1990s, with many species occurring one or two<br />
months earlier than normal (Figure 4).<br />
This stepwise increase in chlorophyll levels in the<br />
North Sea might naively be seen as evidence of<br />
eutrophication. However, an identical pattern<br />
occurred west of the British Isles. This suggests<br />
a strong overriding climatic signal common to<br />
regional areas of the north-east Atlantic and coastal<br />
areas of the North Sea, rather than eutrophication.<br />
Indeed, long term changes in phytoplankton<br />
biomass and phytoplankton community correlated<br />
well with the changing climate of the North Atlantic<br />
and trends in the North Atlantic Oscillation (NAO)<br />
index (Edwards et al., 2001).<br />
Climate change and biogeographical<br />
shifts<br />
While the CPR survey has recorded a rapid rise<br />
in the incidence of sub-tropical plankton species<br />
around the British Isles over the last decade, it<br />
has also shown a strong biogeographical shift in<br />
biodiversity, with northward extension of more than<br />
10° in latitude of warm-water species, associated<br />
with a decrease in colder-water species (Beaugrand,<br />
et al., 2002). These shifts correlate with the NAO<br />
index and Northern Hemisphere temperature,<br />
suggesting a link to climate change and global<br />
warming.<br />
Harmful algal blooms<br />
The CPR surveys identify about 170 phytoplankton<br />
taxa. Within the CPR database there are numerous<br />
64
Table 1. Known harmful and detrimental phytoplankton taxa recorded by the CPR survey in the North Atlantic and <strong>UK</strong><br />
coastal waters<br />
Species/genus Associated harmful/detrimental effects Time-series<br />
Ceratium furca Hypoxia/anoxia 1948 –<br />
Coscinodiscus wailesii Production of mucilage. First recorded in 1977 (invasive)<br />
Dinophysis spp Diarrhectic shellfish poisoning (DSP). 1948 –<br />
Gonyaulax spp Unspecified toxicity. 1965 –<br />
Noctiluca scintillans Discolouration and hypoxia/anoxia. 1981 –<br />
Phaeocystis spp Production of foam and mucilage. Hypoxia/anoxia. 1946 – (presence/absence)<br />
Prorocentrum micans<br />
Diarrhectic shellfish poisoning (DSP). Discolouration<br />
and hypoxia/anoxia<br />
1948 –<br />
Pseudo-nitzschia spp Amnesic shellfish poisoning (ASP) 1948 –<br />
Nitzschia closterium<br />
(now Cylindrotheca)<br />
Production of foam and mucilage. 1948 –<br />
Chaetoceros spp Gill clogging 1948 –<br />
Skeletonema costatum Gill clogging 1948 –<br />
harmful and detrimental phytoplankton taxa,<br />
listed in Table 1. One of the most investigated is<br />
the foam alga Phaeocystis that blooms massively<br />
in the southern North Sea area, whose long-term<br />
monthly variability of Phaeocystis is shown in Figure<br />
5. Whereas Phaeocystis was particularly common in<br />
the North Sea in the 1950s it declined through the<br />
1960s and 1970s. Since the mid 1980s however, it<br />
has increased and been recorded frequently. 1999<br />
in particular was an exceptional year with a number<br />
of large blooms.<br />
It has been suggested that increases in Phaeocystis<br />
could be attributed to increased nitrogen and<br />
phosphorus inputs (Lancelot et al., 1987). However,<br />
similar patterns were found in other non-eutrophic<br />
regions of the north-east Atlantic, suggesting the<br />
patterns were caused by climate change, mirroring<br />
the patterns of phytoplankton biomass. Without<br />
inter-regional comparisons, many blooms in the past<br />
have been wrongly attributed to eutrophication.<br />
Figure 4. Changes in phytoplankton colour index in the North Sea<br />
65
References<br />
Figure 5. Long term monthly variability of Phaeocystis<br />
Summary<br />
Major biological and climatic changes have happened<br />
over the last few decades in water around the British<br />
Isles. It is clear that hydro-climatic variability to<br />
some extent drives ecological changes. Whether<br />
it dominates depends on the scale of study and the<br />
importance of localised or climatic variability. Indeed,<br />
eutrophication in European regional seas cannot<br />
be assessed without taking into account the wider<br />
hydro-climatic influences (Edwards and Reid, 2001;<br />
Edwards et al., 2002). It is only when these widerscale<br />
Atlantic influences are considered that we may<br />
have confidence in the assessments of anthropogenic<br />
impacts on the ecological status of <strong>UK</strong> coastal waters.<br />
Allen, J.R., Slinn, D.J., Shammon, T.M. and Hartnoll,<br />
R.G., 1998. Evidence of eutrophication of the<br />
Irish Sea over four decades. Limnology and<br />
Oceanography, 43, 1970-1974.<br />
Beaugrand, G., Reid, P.C., Ibanez, F., Lindley, J.A.<br />
and Edwards, M., 2002. Reorganisation of North<br />
Atlantic <strong>Marine</strong> Copepod Biodiversity and Climate.<br />
Science, 296, 1692-1694.<br />
Edwards, M., 2000. Large-scale temporal and<br />
spatial patterns of marine phytoplankton and<br />
climate variability in the North Atlantic. Ph. D.<br />
thesis, University of Plymouth, 243pp.<br />
Edwards, M. and Reid, P.C., 2001. Implications of<br />
wider Atlantic influences on regional seas with<br />
particular reference to phytoplankton populations<br />
and eutrophication. Contract report for DEFRA,<br />
10pp.<br />
Edwards, M., Reid, P.C. and Planque, B.,<br />
2001a. Long-term and regional variability of<br />
phytoplankton biomass in the north-east Atlantic<br />
(1960-1995). ICES Journal of <strong>Marine</strong> Science, 58,<br />
39-49.<br />
Edwards, M., Beaugrand, G., Reid, P.C., Rowden,<br />
A.A. and Jones, M.B., 2002. Ocean climate<br />
anomalies and the ecology of the North Sea.<br />
<strong>Marine</strong> Ecology Progress Series, 239, 1-10.<br />
Gowen, R.J., Hydes, D.J., Mills, D.K., Stewart, B.M.,<br />
Brown, J., Gibson, C.E., Shammon, T.M., Allen,<br />
M. and Malcolm, S.J., 2002. Assessing nutrient<br />
trends in nutrient concentrations in coastal shelf<br />
seas: a case study in the Irish Sea. Estuarine,<br />
Coastal and Shelf Sciences, 54, 927-939.<br />
Lancelot, C., Billen, G., Sournia, A., Weisse,<br />
T., Colijn, F., Veldhuis, M.J.W., Davies, A. and<br />
Wassman, P., 1987. Phaeocystis blooms and<br />
nutrient enrichment in the continental coastal<br />
zones of the North Sea. Ambio, 16, 38-46.<br />
North Sea Task Force (NSTF), 1993. North Sea<br />
Quality Status Report 1993. - London (Oslo and<br />
Paris Commissions) & Fredensborg, Denmark<br />
(Olsen & Olsen).<br />
OSPAR Commission, 2000. Quality Status Report<br />
2000, region ii – greater North Sea. – 136pp.<br />
London (OSPAR commission).<br />
Reid, P. C., Edwards, M. , Hunt, H.G. and Warner,<br />
A.J., 1998. Phytoplankton change in the North<br />
Atlantic. Nature, 391, 546.<br />
66
4. ASSESSMENT OF EUTROPHICATION IN THE SOLWAY FIRTH<br />
The eutrophication status of the Solway Firth has<br />
been assessed for the requirements of the Urban<br />
Waste Water Treatment Directive and of the Oslo and<br />
Paris Commission (OSPAR) Comprehensive Procedure<br />
(CSTT, 1993, 1997; EEC, 1991; Jak, 2001).<br />
Pressure<br />
The Solway Firth catchment is mainly rural, with<br />
intensive farming. Agriculture accounts for 70%<br />
of land use, mainly mixed livestock with dairy, beef<br />
and sheep. In 1991, the resident population was<br />
about 415,000. The most densely populated area<br />
lies around the three industrial and port towns of<br />
Whitehaven, Workington and Maryport. Discharges<br />
of domestic sewage and industrial effluent are<br />
small, but rivers are subject to localised diffuse<br />
sources of pollution, mainly from farming<br />
Most nutrients derive from 14 rivers (Table 2) with<br />
the Annan, Nith and Eden as the main sources<br />
(Table 3 and Figure 6).<br />
State<br />
Degree of Nutrient Enrichment<br />
Winter nutrient concentrations were measured<br />
in 2001 (Figure 7), 2002 and 2003. Estuarine<br />
nutrients and salinity were correlated (Figure 8):<br />
nitrate concentrations were highest at low salinity,<br />
reflecting river input at the head; the phosphate<br />
Table 2. Nutrient Inputs to the Solway Estuary and Firth<br />
Source<br />
N-NH3<br />
(t yr -1 )<br />
TON<br />
(t yr -1 )<br />
TN<br />
(t yr -1 )<br />
P-DRP<br />
(t yr -1 )<br />
P-TP<br />
(t yr -1 )<br />
Mean Flow<br />
(m 3 s -1 )<br />
Scottish Rivers 365 6,865 10,068 214 428 192.7<br />
English Rivers 48.8 4,527 N/A 354 N/A 19.5<br />
Sewage Works 92 61 200 52 63 N/A<br />
Industry 6 5 89 25 45 3.2<br />
Totals 511.8 11,414 N/A 645 N/A N/A<br />
Table 3. Loadings from Individual Rivers<br />
Scottish Rivers<br />
River<br />
N-NH3<br />
(t yr -1 )<br />
TON<br />
(t yr -1 )<br />
TN<br />
(t yr -1 )<br />
P-DRP<br />
(t yr -1 )<br />
P-TP<br />
(t yr -1 )<br />
Mean Flow<br />
(m 3 s -1 )<br />
Annan 95 2,593 3,208 89 161 41.3<br />
Nith 87 2,216 2,884 74 91 38.7<br />
Esk 34 416 625 9 28 20.9<br />
Dee 55 259 782 8 46 42.5<br />
Cree 22 194 424 5 14 14.6<br />
Bladnoch 13 142 339 4 11 11.3<br />
Liddle 19 224 543 11 40 9.6<br />
Luce 12 47 209 2 7 6.2<br />
Urr 18 444 529 4 9 5.1<br />
Kirtle 6 198 352 7 18 1.6<br />
Piltanton 4 132 172 1 3 0.9<br />
Totals 365 6,865 10,063 214 428 192.7<br />
English Rivers<br />
River<br />
N-NH3<br />
(t yr -1 )<br />
TON<br />
(t yr -1 )<br />
TN<br />
(t yr -1 )<br />
P-DRP<br />
(t yr -1 )<br />
P-TP<br />
(t yr -1 )<br />
Mean Flow<br />
(m 3 s -1 )<br />
Eden 44 4,027 N/A 333 N/A 18.0<br />
Wampool 2.45 301 N/A 17 N/A 0.7<br />
Waver 2.35 199 N/A 4 N/A 0.8<br />
Totals 48.8 4,527 N/A 354 N/A 19.5<br />
Note: total N and total P are measured on unfiltered water samples; na indicates that data are not available<br />
67
River<br />
Nith<br />
N<br />
Urr<br />
Water<br />
Dumfries<br />
River<br />
Annan<br />
Kirtle<br />
Water<br />
River<br />
Esk<br />
River<br />
Dee<br />
Solway Firth<br />
Carlisle<br />
River<br />
Wampool<br />
River<br />
Waver<br />
River<br />
Eden<br />
Workington<br />
0 5 10<br />
Kilometres<br />
Whiteheaven<br />
Figure 6.<br />
Location map and major river inputs<br />
Figure 7. Winter TON concentrations (µmol l -1 ), February 2001<br />
68
Nutrient (µmol l )<br />
-1<br />
120<br />
100<br />
80<br />
60<br />
40<br />
20<br />
0<br />
0.6<br />
0.5<br />
0.4<br />
0.3<br />
0.2<br />
0.1<br />
0<br />
1.0<br />
0.8<br />
0.6<br />
0.4<br />
0.2<br />
0<br />
NO v Salinity<br />
3<br />
y = -2.9253x + 92.778<br />
NO v Salinity<br />
2<br />
PO v Salinity<br />
4<br />
2<br />
R = 0.670<br />
y = 0.0207x + 0.4911<br />
R = 0.746<br />
2<br />
0 5 10 15 20<br />
Salinity<br />
25<br />
20<br />
15<br />
10<br />
5<br />
0<br />
120<br />
100<br />
80<br />
60<br />
40<br />
NH v Salinity<br />
3<br />
y = 1.1146x + 0.3463<br />
R = 0.830<br />
2<br />
TON v Salinity<br />
y = -2.9238x + 93.135<br />
2<br />
R = 0.667<br />
20<br />
0<br />
0 5 10 15 20<br />
Salinity<br />
Figure 8. Nutrient-salinity plots for the Solway Estuary, February 2001<br />
Nitrate (µM) Phosphate (µM)<br />
0.9<br />
0.8<br />
0.7<br />
0.6<br />
0.5<br />
0.4<br />
0.3<br />
0.2<br />
0.1<br />
0<br />
18<br />
16<br />
14<br />
12<br />
10<br />
8<br />
6<br />
4<br />
2<br />
Phosphate v Salinity January 2002<br />
Nitrate v Salinity January 2002<br />
y = -2.4888x + 92.129<br />
R = 0.622<br />
0<br />
30 31 32 33 34<br />
Salinity<br />
2<br />
Figure 9.<br />
Nutrient-salinity plots for the Solway Firth<br />
distribution suggested higher concentrations from<br />
the River Annan. In January 2003, salinity ranged<br />
from 9.2-21.2 and nitrate concentrations from<br />
27-39 µM. Nutrient-salinity plots are shown in<br />
Figure 9 for the January 2002 survey. A significant<br />
correlation with salinity was observed for nitrate,<br />
but not for phosphate. Nitrate concentrations were<br />
in the range 6-16 µM and phosphate from 0.17-<br />
0.81 µM.<br />
On the basis of these limited data, it seemed that<br />
elevated winter nutrient concentrations were<br />
associated with low salinity and high river inputs.<br />
69
Figure 10.<br />
Summer chlorophyll α concentrations (µg l -1 ), depth 1 metre<br />
Impact<br />
Chlorophyll α<br />
Estuarine surveys in July 2001, August 2001, and<br />
July 2002 measured chlorophyll α concentrations.<br />
They ranged from 2.0-21 mg m -3 in July 2001 and<br />
2.58-16.0 mg m -3 in August 2001. In the firth,<br />
concentrations typically were below 2.5 mg m -3<br />
in July 2001 and below 4.0 mg m -3 in July 2002.<br />
Figure 10 shows the distribution of chlorophyll α.<br />
On the basis of these limited data it was concluded<br />
that the Solway Firth waters were not eutrophic.<br />
Intertidal macroalgal densities<br />
To judge if the waters were eutrophic due to<br />
accelerated growth of algae and higher forms<br />
of plant life caused by the enrichment, intertidal<br />
macroalgal densities were looked at. At four<br />
Scottish shore sites between Gretna and Annan in<br />
August 2001, macroalgal populations were limited<br />
by the availability of stony sediment on which to<br />
settle and grow. Where stony sediment occurred,<br />
algal populations were natural.<br />
Phytoplankton<br />
<strong>Marine</strong> phytoplankton were collected at two<br />
stations in July 2001. The estimated total cell<br />
density at the innermost station was 840,000 cells<br />
l -1 , below ‘bloom’ levels - usually taken as exceeding<br />
1 million cells l -1 . The dominant taxa were the<br />
diatoms Asterionella sp. and Chaetoceros sp., with<br />
smaller numbers of other diatom species, including<br />
Thalassiosira sp., Rhizosolenia sp., Cerataulina sp.<br />
and Pseudonitzschia sp. The only dinoflaggellate<br />
species were Noctiluca scintillans at an estimated<br />
density of 450 cells l -1 . At the outermost station<br />
there were fewer plankton, with total density<br />
of only 6,000 cells l -1 . The dominant taxa were<br />
the diatoms Rhizosolenia sp. and Cerataulina sp.,<br />
with much smaller numbers of dinoflagellates<br />
Protoperidium sp. and Prorocentrum sp. Neither<br />
the abundance nor the species composition of these<br />
samples was a cause for concern.<br />
Oxygen deficiency<br />
In February (Winter), May (Spring) and July<br />
(Summer) 2001, surface and deeper waters were<br />
well oxygenated. Dissolved oxygen ranged from<br />
8.6 to 10.6 mg l -1 in February, 8.7 to 11.6 mg l -1 in<br />
May, and 7.3 and 8.8 mg l -1 in July. This pattern<br />
was repeated in 2002 and 2003, with no evidence<br />
of oxygen depletion due to decaying algae.<br />
Response<br />
Trends cannot be examined with these limited data<br />
sets. Agricultural and some small sewage treatment<br />
nutrient inputs are not yet quantified. Nevertheless,<br />
a SEPA strategy to reduce nutrient inputs now deals<br />
with diffuse pollution - including agricultural runoff<br />
and seepage of nutrients into groundwater - by<br />
partnerships to advise farmers of best practice in<br />
activities such as slurry spreading and fertiliser use.<br />
North West Water and Scottish Water manage<br />
public sewage discharges to the Solway Firth<br />
catchment and are upgrading their works to<br />
improve water quality in line with the Bathing<br />
Waters Directive and UWWTD. North West Water<br />
is undertaking new works at Silloth, Allonby,<br />
Workington, Seascale and St. Bees. Work is under<br />
way at Workington, Whitehaven and Egremont,<br />
and is planned for Annan to meet the needs of the<br />
UWTT Directive by 2005.<br />
References<br />
CSTT, 1993. Comprehensive Studies for the<br />
Purposes of Article 6 of Dir 91/271/EEC, the Urban<br />
Waste Water Treatment Directive. Report of the<br />
Comprehensive Studies Task Team of the Group<br />
Co-ordinating Sea Disposal <strong>Monitoring</strong>, for the<br />
<strong>Marine</strong> Pollution <strong>Monitoring</strong> Management Group.<br />
Edinburgh.<br />
70
CSTT, 1997. Comprehensive Studies for the<br />
Purposes of Article 6 of Dir 91/271/EEC, the Urban<br />
Waste Water Treatment Directive. <strong>Second</strong> Edition<br />
of the Report of the Comprehensive Studies Task<br />
Team of the Group Co-ordinating Sea Disposal<br />
<strong>Monitoring</strong>, for the <strong>Marine</strong> Pollution <strong>Monitoring</strong><br />
Management Group. Edinburgh.<br />
EEC, 1991. Council of the European Communities<br />
Directive concerning urban waste water treatment<br />
(91/271/EEC). Official Journal L135/40.<br />
Jak, R.G., 2001. Further Elaboration of Ecological<br />
Quality Objectives for the North Sea with regard<br />
to Nutrients and Eutrophication Effects.<br />
71
5. METALS IN SEAWEED<br />
Wherever mussels were not available for monitoring<br />
metals bioaccumulation, the NMMP specified<br />
brown seaweed (Fucus vesiculosus) as the organism<br />
of second choice. Quality assurance was not<br />
available in the same way for metals in seaweed as<br />
for the mussels, and the seaweed data are therefore<br />
included here as a Case Study.<br />
-1<br />
10 µg kg ww<br />
-1<br />
20 µg kg ww<br />
-1<br />
50 µg kg ww<br />
Brown algae are commonly used in marine<br />
monitoring programmes in the <strong>UK</strong> (see Humber<br />
estuary Case Study). However, there are currently no<br />
BRCs, EACs or EQSs available for metals in seaweed.<br />
The geographical spread of results was restricted to<br />
the northeast and south coast of England, parts of the<br />
Welsh coast, and the Severn Estuary (see Figure 11).<br />
Median mercury concentrations in the range 4.3<br />
- 39.6 µg kg -1 wet weight were reported, with<br />
the lowest value in the Tamar and the highest at<br />
Seaham on the Durham coast (Figure 11). Low<br />
levels in the Tamar may reflect low ambient mercury<br />
concentrations, or suppression of mercury uptake<br />
by competition from very high levels of other<br />
metals, associated with local mineworkings.<br />
Median cadmium concentrations in the range<br />
80-728 µg kg -1 wet weight were reported, with<br />
the lowest value in the Tamar and the highest<br />
at Bedwin on the Severn. These compared to<br />
100-420 µg kg -1 wet weight for West Greenland<br />
- regarded as natural background (Riget et al.,<br />
1997) - and 600 µg kg -1 wet weight for the Humber<br />
estuary. Concentrations were in the ranges<br />
expected for uncontaminated areas and for areas<br />
with known industrial discharges.<br />
Lead concentrations were in the range 280-<br />
29,400 µg kg -1 wet weight, with the lowest<br />
Figure 11.<br />
Median mercury concentrations in Fucoid<br />
algae<br />
value at Bedwin on the Severn. The highest<br />
concentrations were on the Wear, Tyne and Tees,<br />
possibly reflecting high sediment concentrations<br />
or contaminated suspended material in these<br />
industrialised estuaries.<br />
The minimum and maximum median concentrations<br />
of other metals are listed in Table 4.<br />
Table 4. Seaweed metals concentrations<br />
Metal<br />
Minimum<br />
Concentration<br />
(µg kg -1 wet weight)<br />
Site<br />
Maximum<br />
Concentration<br />
(µg kg -1 wet weight)<br />
Site<br />
Arsenic 3,092 Severn Estuary 15,600 Seaham, Durham Coast<br />
Chromium 129 Tamar 2,758 Tees<br />
Copper 1,080 Poole Harbour 12,800 Tyne<br />
Nickel 434 Dovey Estuary (mid- 11,200 Seaham, Durham Coast<br />
Wales)<br />
Selenium 63 Mawddach Estuary 2,091 Tees<br />
(mid-Wales)<br />
Silver 71 Tees 379 Seaham, Durham Coast<br />
Zinc 17,400 Milford Haven 164,000 Wear<br />
72
Summary<br />
The limited dataset for metals in seaweed showed<br />
highest concentrations to be in the industrialised<br />
Tyne, Tees and Wear estuaries, and at Seaham off<br />
the Durham coast.<br />
Reference<br />
Riget, F., Kohanssen, P. and Asmund, G., 1997.<br />
Baseline Levels and natural Variability of Elements<br />
in Three Seaweed Species from West Greenland.<br />
<strong>Marine</strong> Pollution Bulletin, 34(3): 171-176.<br />
73
6. MONITORING OF HEAVY METALS IN THE HUMBER ESTUARY<br />
USING FUCUS VESICULOSUS<br />
Driving force<br />
The Humber is an important estuary with a catchment<br />
area about 1/5 of England. The main inputs of<br />
pollutant are from rivers and direct discharges of<br />
sewage and industrial effluent. The locations of<br />
significant effluent discharges of metals to the<br />
Humber between 1980-90 are shown in Figure 12.<br />
The load of discharged metals is much greater from<br />
industrial effluents than from sewage effluents.<br />
Pressure<br />
It is usually the case that a single discharge is<br />
responsible for a high percentage of any particular<br />
metal. For example, a non-ferrous smelter on the<br />
north bank contributed practically all the arsenic and<br />
most of the cadmium load, with significant amounts<br />
of other metals. This process ceased in 1991 and<br />
the site was restored by 1994, resulting in a marked<br />
decrease in arsenic and cadmium concentrations<br />
in the estuary. A single chemical discharge on the<br />
south bank was responsible for nearly 80% of zinc<br />
discharged to the estuary but the metal recovery<br />
process was improved during the 1990s.<br />
As direct industrial inputs fell over the years, diffuse<br />
inputs from the rivers became more prominent.<br />
This is particularly noticeable in load data for zinc<br />
and cadmium (Figure 13) in wetter years with high<br />
river flows.<br />
1<br />
Figure 12.<br />
2 3<br />
Derwent<br />
Wharfe<br />
Ouse 3<br />
1<br />
5<br />
Aire<br />
2<br />
4<br />
Don<br />
6<br />
7<br />
4<br />
Idle<br />
Trent<br />
0 5 10 15 20 25<br />
Kilometres<br />
4<br />
Bottesford<br />
Beck<br />
6<br />
7<br />
8<br />
9<br />
10<br />
O = Sewage<br />
1 Tadcaster<br />
2 Selby<br />
3 Barlby<br />
4 Snaith<br />
5 Goole<br />
6 Doncaster<br />
7 Thorne<br />
8 Hull<br />
9 Immingham<br />
10 Grimsby<br />
11 Cleethorpes<br />
8 5<br />
The locations of significant effluent discharges<br />
of metals to the Humber between 1980-90<br />
9<br />
10<br />
11<br />
N<br />
= Industrial<br />
1 Animal feeds<br />
2 Citric Acid<br />
3 Fertilizer<br />
4 Non-Ferrous Smelter<br />
5 Chemicals<br />
6 Fertilizer<br />
7 Synthetic Fibres<br />
8 Fine Chemicals<br />
9 Titanium Dioxide<br />
10<br />
Titanium Dioxide<br />
Load (000kg y )<br />
-1<br />
Load (000kg y )<br />
-1<br />
1000 a)<br />
900<br />
800<br />
700<br />
600<br />
500<br />
400<br />
300<br />
200<br />
100<br />
0<br />
3<br />
2<br />
1<br />
Figure 13.<br />
State<br />
b)<br />
Loads of (a) zinc and (b) cadmium to the<br />
Humber<br />
Sewage<br />
River<br />
Industrial<br />
0<br />
1990 91 92 93 94 95 96 97 98 99 2000 01<br />
Early in 1961 it was decided to start a regular<br />
chemical survey of the Humber estuary. Detailed<br />
biological work started in 1971 and later included<br />
bioaccumulation. <strong>Monitoring</strong> of heavy metals<br />
using Fucus vesiculosus has been very successful.<br />
The first survey was in September 1981, and<br />
results appeared during the eighties (Barnett and<br />
Ashcroft, 1985; Barnett et al., 1989). This case<br />
study considers the long term trends for iron, zinc<br />
and cadmium over the two decades of Fucoid<br />
bioaccumulation monitoring, one of the longest<br />
unbroken bioaccumulation time series.<br />
Seaweed samples were collected at ten sites along<br />
the south bank, from approximately 3 km upstream<br />
of the Humber Bridge (the low salinity limit of Fucus<br />
distribution), to Cleethorpes at the seaward end<br />
(Figure 14).<br />
A synoptic view is provided by single values for<br />
each survey of the average tissue concentration<br />
from all (ten) sites. Changes recognisable at this<br />
level represent major changes in metal inputs to the<br />
system.<br />
74
-1<br />
Fe (mg kg ) dry weight<br />
1 2 4 5<br />
3<br />
6<br />
7<br />
8<br />
Figure 14. Fucus sampling sites<br />
9 10<br />
Immingham<br />
CP<br />
G Rdk<br />
G Fdk<br />
Whole estuary average concentrations were from<br />
1000-2000 mg kg -1 throughout the eighties but<br />
in 1988 new discharge arrangements started and<br />
the values declined generally to below 500 mg kg -1<br />
throughout the 1990s (Figure 15).<br />
There was an even more marked difference<br />
between the two periods for the two sites closest<br />
to the discharges (Figure 16). Before 1988<br />
concentrations were seldom lower than 2000 mg<br />
kg -1 and regularly exceeded 4000 mg kg -1 . From<br />
1989 onwards, values rarely exceeded 1000 mg kg -<br />
1<br />
and throughout the mid- and late-nineties were<br />
typically around 500 mg kg -1 or less. This very clear<br />
demonstration of reduced iron in Fucus mirrors the<br />
new discharge arrangements.<br />
Iron<br />
Iron does not normally accumulate in Fucus because<br />
it locks in complexes with the various ions in seawater.<br />
However, the Humber received two large<br />
discharges of acid-iron waste whose nature causes<br />
the iron to remain in solution for extended periods<br />
and thus to be available for uptake.<br />
Zinc<br />
The lower part of the Humber was the recipient<br />
of one of the largest discharges of zinc in the <strong>UK</strong>.<br />
During the mid 1990s the discharger was required<br />
to compose a reduction programme. The whole<br />
estuary average plot (Figure 17) shows zinc to have<br />
been lower in the late nineties than in previous<br />
years, but the pattern is not entirely distinct. On<br />
5000<br />
4000<br />
Fe (mg kg )<br />
-1<br />
3000<br />
2000<br />
1000<br />
0 1981 83 85 87 89 91 93 95 97 99<br />
Figure 15.<br />
September iron levels in Fucus (mg kg -1 ), dry weight<br />
18000<br />
16000<br />
14000<br />
South Killingholme<br />
Grimsby Royal Dock<br />
12000<br />
10000<br />
8000<br />
6000<br />
4000<br />
2000<br />
0<br />
Sept 81<br />
Sept 82<br />
Sept 83<br />
Sept 84<br />
Sept 85<br />
Sept 86<br />
Sept 87<br />
Sept 88<br />
Sept 89<br />
Sept 90<br />
Sept 91<br />
Sept 92<br />
Sept 93<br />
Sept 94<br />
Sept 95<br />
Sept 96<br />
Sept 97<br />
Sept 98<br />
Sept 99<br />
Figure 16.<br />
Whole estuary average iron concentrations in Fucus (mg kg -1 ) dry weight<br />
(1981-1999)<br />
75
1200<br />
Zinc (mg kg )<br />
-1<br />
1000<br />
800<br />
600<br />
400<br />
February<br />
September<br />
200<br />
0<br />
1981 83 85 87 89 91 93 95 97 99<br />
Figure 17. Whole estuary: average zinc concentrations in Fucus, dry weight (1981-2000)<br />
Zinc (mg kg )<br />
-1<br />
1200<br />
1000<br />
800<br />
600<br />
400<br />
200<br />
0<br />
Figure 18.<br />
1991 1992 1993 1994 1995 1996 1997 1998 1999<br />
Zinc levels in Fucus. Average at four lower estuary sites, February<br />
the other hand, after 1997 averaged values of zinc<br />
did not exceed 600 mg kg -1 at four lower estuary<br />
sites that in 1991-96 had shown high levels of 800<br />
to 1000 mg kg -1 (Figure 18). The zinc reduction<br />
programme has clearly been successful, although<br />
confirmatory monitoring will be needed.<br />
Cadmium<br />
Unlike iron and zinc, direct inputs of cadmium have<br />
not been previously identified. Early published work<br />
recognised that elevated concentrations of cadmium<br />
in the Upper Estuary might reflect inputs via the<br />
tidal rivers Trent and Ouse, and discharge from<br />
Capper Pass smelting works in the upper reaches<br />
of the North bank of the Estuary. Whole estuary<br />
average values suggest that tissue concentrations of<br />
cadmium have been lower during the 1990s than in<br />
the preceding decade (Figure 19).<br />
Further insight comes from looking at the<br />
distribution pattern for the ten routine sites in<br />
the late eighties, and contrasting it with the most<br />
recent pattern (1999) (Figure 20). The 1987 pattern<br />
represents that seen throughout the decade, with<br />
higher upstream concentrations and a decline<br />
seawards, in line with classical conservative mixing<br />
behaviour of riverine contaminants. By the end of<br />
the 1990s, this was no longer particularly evident:<br />
the concentrations were lower throughout the<br />
Estuary but greatest reductions were seen the<br />
upper estuary. These changes confirm that the<br />
principal sources of cadmium were in the upper<br />
estuary and tidal rivers, and that there have been<br />
considerable reductions in inputs.<br />
Impacts<br />
The iron acid waste from the titanium dioxide plants<br />
tended to stain the shore red and there was also<br />
a noticeable lack of algae. The discharges were<br />
moved to deeper water and the waste recovery<br />
process was improved. After several years the<br />
shoreline returned to a more normal colour and<br />
some algae returned.<br />
76
8<br />
Cadmium (mg kg ) dry weight<br />
-1<br />
7<br />
6<br />
5<br />
4<br />
3<br />
2<br />
February<br />
September<br />
1<br />
0 1981 83 85 87 89 91 93 95 97 99<br />
Figure 19. Whole estuary: average cadmium concentrations dry weight (1981-2000)<br />
12<br />
Cadmium (mg kg ) dry weight<br />
-1<br />
10<br />
8<br />
6<br />
4<br />
2<br />
87 - W<br />
99 - W<br />
0<br />
1 2 3 4 5 6 7 8 9 10<br />
Sites<br />
Figure 20. Cadmium levels in Fucus, Humber South Bank February 1987 and 1999<br />
Summary<br />
Long-term monitoring of heavy metals in the<br />
Humber with fucoid algae has been an effective<br />
method of demonstrating environmental<br />
improvements resulting from reductions<br />
in discharge of certain heavy metals. The<br />
effectiveness of the technique in revealing trends<br />
justifies its continued use in long-term monitoring<br />
programmes.<br />
References<br />
Barnett, B.E. and Ashcroft C.R., 1985. Heavy<br />
metals in Fucus Vesiculosus in the Humber Estuary.<br />
Environmental Pollution, B 9, 193 – 213.<br />
Barnett, B.E., Forbes, S. and Ashcroft, C.R., 1989.<br />
Heavy Metals on the South Bank of the Humber<br />
Estuary. <strong>Marine</strong> Pollution Bulletin, 20, 17-21.<br />
77
7. LONG TERM TRENDS IN MERCURY, CADMIUM AND LEAD IN THE<br />
FORTH ESTUARY<br />
Driving force<br />
The Forth estuary and its catchment in east<br />
Scotland have been a focus for industrial and<br />
commercial activity for many decades. The estuary<br />
receives discharges from the manufacture of yeast,<br />
paper, chemical and petrochemical industries,<br />
with waste water from about one quarter of the<br />
Scottish population (Figure 21). Many discharges<br />
remained untreated until environmental legislation<br />
was introduced in the mid 1980s. At the second<br />
Intergovernmental Conference in 1987 the <strong>UK</strong><br />
Government agreed to reduce inputs of certain<br />
substances, including cadmium, mercury and lead,<br />
to the North Sea by half between 1985 and 1995.<br />
This led to the reduction and minimisation of point<br />
source discharges of these substances.<br />
Pressure<br />
Annual monitoring of discharges of cadmium,<br />
mercury and lead to tidal waters from riverine,<br />
Stirling STW<br />
Stirling<br />
Alloa STW<br />
Industrial Outfalls<br />
Sewage Outfalls<br />
0 6<br />
Kilometres<br />
N<br />
Kilbagie<br />
Falkirk STW<br />
BP Chemical<br />
Grangemouth<br />
Avecia<br />
BP Kinneil<br />
Dunfermline<br />
STW Caldwells<br />
BP Refinery Ironmill STW<br />
Bo'ness STW<br />
Kinneil Kerse STW<br />
South Queensferry STW<br />
BP<br />
Dalmeny<br />
Figure 21.<br />
Major discharges to the Forth estuary<br />
Table 5. Annual inputs of trace metals to the Forth estuary<br />
Year Mercury (kg y -1 ) Cadmium (kg y -1 ) Lead (tonne y -1 )<br />
1985 1,730 3,700<br />
1990 118 580 22<br />
1991 305 860 11<br />
1992 68 560 15<br />
1993 67 630 17<br />
1994 48 390 14<br />
1995 43 380 15<br />
1996 44 396 15<br />
1997 40 289 7<br />
1998 49 240 20<br />
1999 53 190 9<br />
2000 34 198 13<br />
78
sewage and industrial discharges commenced in<br />
1990. Annual inputs are presented in Table 5 with<br />
1985 baseline data for comparison.<br />
State<br />
The Forth is a turbid estuary (Webb and Metcalfe,<br />
1987) and discharged particle-reactive metals are<br />
adsorbed onto its particulate matter (Balls et al.,<br />
1997). Mercury and lead are particle-reactive and<br />
are retained on the sediments whereas cadmium is<br />
more likely to remain in solution.<br />
Contaminants in sediments<br />
More than 90% of the discharged mercury may<br />
have been retained on the sediments of the estuary<br />
(Elliott and Griffiths, 1986). Routine monitoring<br />
of the mercury and lead content of the sublittoral<br />
sediments showed no reduction consistent with<br />
the reduction in the discharge. Cadmium, on<br />
the contrary, is less particle reactive and stays in<br />
solution. The cadmium content of the sediments<br />
is relatively low and there are no trends in the data<br />
(Figure 22). Mercury concentrations are above the<br />
upper EAC (0.5 mg kg -1 ), lead is around the upper<br />
EAC (50 mg kg -1 ) and cadmium is below the upper<br />
EAC (1 mg kg -1 ). The data cannot be compared to<br />
BRCs because aluminium was not determined but<br />
Balls et al. (1997) reported metal-aluminium ratios<br />
for the Forth sediments above background.<br />
Contaminants in biota<br />
Long-term data are available for mercury in fish<br />
muscle and mussels from the Forth estuary (Figure<br />
23). They reveal a decrease in mercury content,<br />
consistent with the reductions in the industrial<br />
discharge.<br />
The concentration of mercury was above the EAC<br />
(1 mg kg -1 dry weight) in mussels until the 1990s<br />
whereas the concentration in fish fell below the<br />
EAC (0.3 mg kg -1 ww) in the early 1980s.<br />
The cadmium content of mussels in the Forth<br />
estuary is below the EAC (5 mg kg -1 dry weight)<br />
and appears to be declining. (Figure 24). In recent<br />
years it has been close to the BRC (1.4 mg kg -1 dry<br />
weight).<br />
The lead content of the mussels is substantially<br />
above the upper EAC (5 mg kg -1 dw) and recent<br />
results indicate less variability in the data (Figure<br />
25).<br />
Table 6. Trends in sources of trace metals<br />
Year Rivers Sewage Industry<br />
1990 1999 1990 1999 1990 1999<br />
Cadmium (kg y -1 ) 400 150 125 22 55 8<br />
Mercury (kg y -1 ) 26 16 19 16 73 4.5<br />
Lead (t y -1 ) 11 9 7 4.4 0.7 0.3<br />
1.6<br />
1.4<br />
1.2<br />
Cd<br />
Hg<br />
Pb<br />
90<br />
80<br />
70<br />
Cd, Hg, (mg kg )<br />
-1<br />
1<br />
0.8<br />
, ,<br />
0.6<br />
60<br />
50<br />
40<br />
30<br />
Pb (mg kg )<br />
-1<br />
0.4<br />
20<br />
0.2<br />
10<br />
0<br />
0<br />
Mar 85<br />
Mar 87<br />
Mar 89<br />
Oct 90<br />
Oct 91<br />
Apl 92<br />
Mar 93<br />
Mar 94<br />
Apl 95<br />
Apl 96<br />
Mar 97<br />
Mar 98<br />
Feb 99<br />
Feb 00<br />
Feb 01<br />
Date<br />
Figure 22. Mercury, cadmium and lead (mg kg -1 ) at site RA in the Forth estuary<br />
79
0.4<br />
6<br />
Mercury (mg kg ) wet weight in fish<br />
-1<br />
0.35<br />
0.3<br />
0.25<br />
0.2<br />
0.15<br />
0.1<br />
0.05<br />
Fish<br />
Mussels<br />
5<br />
4<br />
3<br />
2<br />
1<br />
Mercury (mg kg ) dry weight in mussels<br />
-1<br />
0<br />
0<br />
1982<br />
1983<br />
1984<br />
1985<br />
1986<br />
1987<br />
1988<br />
1989<br />
1990<br />
1991<br />
1992<br />
1993<br />
1994<br />
1995<br />
1996<br />
1997<br />
1998<br />
1999<br />
2000<br />
Figure 23. Mercury in fish and mussels in the Forth estuary<br />
5<br />
4.5<br />
4<br />
Cd (mg kg ) dry weight<br />
-1<br />
3.5<br />
3<br />
2.5<br />
2<br />
1.5<br />
1<br />
0.5<br />
0<br />
1978 1980 1982 1984 1986 1988 1990 1992 1994 1996 1998 2000 2002<br />
Figure 24.<br />
Cadmium (mg kg -1 dry weight) in mussels in the Forth estuary<br />
25<br />
20<br />
Pb (mg kg ) dry weight<br />
-1<br />
15<br />
10<br />
5<br />
0<br />
1980 1982 1984 1986 1988 1990 1992 1994 1996 1998 2000<br />
Figure 25.<br />
Lead (mg kg -1 dry weight) in mussels in the Forth estuary<br />
80
0.5<br />
4<br />
0.45<br />
3.5<br />
0.4<br />
0.35<br />
Hg<br />
Pb<br />
3<br />
Cd, Pb (µg l )<br />
-1<br />
0.3<br />
0.25<br />
0.2<br />
2.5<br />
2<br />
1.5<br />
Hg (µg l )<br />
-1<br />
0.15<br />
0.1<br />
0.05<br />
Cd<br />
1<br />
0.5<br />
0<br />
0<br />
1984 1986 1988 1990 1992 1994 1996 1998 2000 2002<br />
Figure 26. Dissolved trace metals in the Forth estuary<br />
100<br />
90<br />
80<br />
70<br />
60<br />
Number<br />
50<br />
40<br />
30<br />
20<br />
10<br />
0<br />
1975<br />
1977<br />
1979<br />
1981<br />
1983<br />
1985<br />
1987<br />
1989<br />
1991<br />
1995<br />
1997<br />
1999<br />
Figure 27.<br />
Total Number of taxa in main channel sediments<br />
Contaminants in water<br />
Concentrations of dissolved mercury, cadmium and<br />
lead in the water were always substantially below<br />
Environmental Quality Standards and close to the<br />
limit of detection of the analysis. There are no<br />
trends in the data (Figure 26)<br />
Impact<br />
The total number of taxa in the main channel of<br />
the estuary at Grangemouth has increased since<br />
1975 (Figure 27). The samples were collected in the<br />
vicinity of an industrial discharge, the major point<br />
source of mercury.<br />
Response<br />
The discharge of all metals has fallen as a result of<br />
effluent treatment and minimisation of point source<br />
discharges (Table 6). Water companies are actively<br />
trying to reduce the discharge of mercury from<br />
dentistry.<br />
Summary<br />
The concentrations of dissolved metals in the Forth<br />
estuary are low as the Forth is a turbid estuary<br />
and particle reactive metals are absorbed onto the<br />
particulate phase. The sediments of the Forth are<br />
enriched with cadmium, lead and mercury relative<br />
81
to background levels. The enrichment factor is<br />
greatest for mercury and higher for lead than<br />
cadmium.<br />
A substantial amount of the discharged mercury<br />
has been retained on estuarine sediments. Loss<br />
of mercury from the sediments is expected to<br />
take decades because its flux out of the estuary<br />
on particulate matter is quite slow (Davies et al.,<br />
1986). Fish and shellfish ingest contaminants<br />
from sediments as well as from the overlying<br />
water column. Following the point source input<br />
reductions, mercury contamination in fish and<br />
shellfish reduced gradually, whereas the cadmium<br />
content of mussels reduced rapidly. The lead<br />
content of mussels was highly variable and showed<br />
no distinct trend.<br />
In the macrofaunal community in the sediments of<br />
the Forth there was an increase in the number of<br />
recorded taxa that may be related to the decreased<br />
discharge of contaminants to this part of the<br />
estuary.<br />
References<br />
Balls, P.W., Owens, R.E and Muller, F.L.L., 1997.<br />
Dissolved trace metals in the Clyde, Forth and Tay<br />
estuaries. Coastal Zone Topics, 3, 46-56<br />
Balls, P.W., Hull, S., Miller, B.S., Pirie, J.M. and<br />
Proctor, W., 1997. Trace Metal in Scottish<br />
Estuarine and Coastal Sediments. <strong>Marine</strong> Pollution<br />
Bulletin, 34, 42-50<br />
Davies, I.M., Griffiths, A.H., Leatherland, T.M. and<br />
Metcalfe, A.P., 1986. Particulate mercury fluxes in<br />
the Forth estuary, Scotland. Rapports et Proces-<br />
Verbaux des Reunions du conseil International<br />
pour l’Exploration de la Mer, 186, 301-305.<br />
Elliott, M. and Griffiths, A.H., 1986. Mercury<br />
contamination in components of an estuarine<br />
ecosystem. Water Science and Technology, 18,<br />
161-170.<br />
Webb, A.J. and Metcalfe, A.P., 1987. Physical<br />
aspects, water movements and modelling studies<br />
of the Forth estuary, Scotland. Proceedings of the<br />
Royal Society of Edinburgh, 93B, 259-27<br />
82
8. TRENDS IN THE BIOLOGICAL EFFECT OF TBT IN SULLOM VOE<br />
Driving force<br />
Sullom Voe is a large fjordic inlet on the mainland<br />
of Shetland. The mouth of the Voe is about 5 km<br />
wide, and the Voe extends approximately 13 km<br />
southwards. A large oil terminal on the promontory<br />
of Calback Ness (Figure 28) was opened in November<br />
1978. The tonnage and number of crude and gas<br />
tankers visiting the terminal peaked in 1984.<br />
Pressure<br />
TBT contamination arises from tankers and, up until<br />
1986, from TBT antifoulants used on towing vessels,<br />
navigational buoys and harbour craft. There was<br />
a general movement in the shipping industry away<br />
from high leach rate free association TBT paints<br />
towards copolymer paints around this time. The<br />
tonnage and numbers of tankers fell until 1990<br />
then levelled out at about half their peaks.<br />
State<br />
The Voe has been surveyed almost biennially since<br />
1985, providing a valuable time series more than<br />
15 years long. In each survey, about 40 adult<br />
dogwhelks were collected from 20 sites in Sullom<br />
Voe and Yell Sound (Figure 28) and analysed by<br />
Point of Fethaland<br />
Figure 29.<br />
Billia<br />
Skerry<br />
Yell<br />
Sound<br />
Whale<br />
Geo<br />
Yell<br />
28.81<br />
Lamba<br />
Uynarey<br />
0.09 Little<br />
0.02<br />
Roe<br />
8.9<br />
Grunn<br />
6.2<br />
Taing<br />
23.61<br />
14.21<br />
0 0.02<br />
The 0.5<br />
34.03 Kames<br />
Blanches<br />
Geo 18.06<br />
Sullom<br />
Voe<br />
Mavis<br />
Grind<br />
28.61<br />
1.43<br />
0.03<br />
0.16<br />
30.71<br />
27.65<br />
Mainland<br />
Oil<br />
Terminal<br />
RPSI values in adult dog-whelk populations<br />
from the sampling sites in 2001<br />
0<br />
5 Kilometres<br />
0<br />
N<br />
Point of Fethaland<br />
1<br />
Yell<br />
Sound<br />
Whale<br />
Geo<br />
20<br />
N<br />
Point of Fethaland<br />
0.17<br />
Yell<br />
Sound<br />
Whale<br />
Geo<br />
0.17<br />
N<br />
2<br />
Yell<br />
0.25<br />
Yell<br />
19<br />
0.61<br />
3<br />
Billia<br />
Skerry<br />
1.76<br />
Billia<br />
Skerry<br />
4<br />
Lamba<br />
4.59<br />
Lamba<br />
Grunn<br />
Taing<br />
Blanches<br />
Geo<br />
Sullom<br />
Voe<br />
5<br />
Little<br />
Roe<br />
18<br />
6 13<br />
7 21<br />
12<br />
8<br />
11<br />
The<br />
Kames<br />
Oil<br />
Terminal<br />
Uynarey<br />
17<br />
14<br />
16 15<br />
Grunn<br />
Taing<br />
Blanches<br />
Geo<br />
Sullom<br />
Voe<br />
Uynarey<br />
Little<br />
0.78<br />
1.6<br />
Roe<br />
2.19<br />
4 4.29<br />
4<br />
0.43 0.81<br />
The 1.88<br />
4.25 Kames<br />
4.31<br />
4.33<br />
Oil<br />
Terminal<br />
Mavis<br />
Grind<br />
9<br />
10<br />
Mainland<br />
5 Kilometres<br />
Mavis<br />
Grind<br />
4.42<br />
4.05<br />
Mainland<br />
5 Kilometres<br />
Figure 28.<br />
Map of Sullum Voe and Yell Sound showing<br />
the sampling sites<br />
Figure 30.<br />
VDSI values in adult dog-whelk populations<br />
from the sampling sites in 2001<br />
83
100<br />
80<br />
(a)<br />
1987<br />
1990<br />
1991<br />
1993<br />
6<br />
5<br />
4<br />
(a)<br />
1987<br />
1990<br />
1991<br />
1993<br />
RPSI %<br />
60<br />
40<br />
VDSI<br />
3<br />
2<br />
20<br />
1<br />
0<br />
1 2 3 4 5 6 7 8 6 10 11 12 13 18 14 15 16 17 19 20<br />
Sites<br />
0<br />
1 2 3 4 5 6 7 8 9 10 11 12 13 18 14 15 16 17 19 20<br />
Sites<br />
100<br />
80<br />
(b)<br />
1995<br />
1997<br />
1999<br />
2001<br />
6<br />
5<br />
4<br />
(b) 1995<br />
1997<br />
1999<br />
2001<br />
RPSI %<br />
60<br />
40<br />
VDSI<br />
3<br />
2<br />
20<br />
1<br />
1 2 3 4 5 6 7 8 6 10 11 12 13 18 14 15 16 17 19 20<br />
Sites<br />
0<br />
1 2 3 4 5 6 7 8 9 10 11 12 13 18 14 15 16 17 19 20<br />
Sites<br />
Figure 31.<br />
RPSI values for populations in the surveys from<br />
1987-2001<br />
Figure 32.<br />
VDSI values for populations in the surveys<br />
from 1987-2001<br />
standard procedures. Typical data are shown in<br />
Figures 29 and 30: high values for RPSI and VDSI<br />
in the Voe and around the oil terminal jetties are<br />
clearly differentiated from low values in the open<br />
waters of Yell Sound.<br />
The highest RPSI value was found near the oil<br />
terminal. The RPSI values from populations in Yell<br />
Sound were much lower (0.00%-1.43%) than those<br />
in Sullom Voe (14.21%-34.03%). The low RPSI<br />
values (
9. POLYCYCLIC AROMATIC HYDROCARBON (PAH) CONCENTRATION<br />
AND COMPOSITION IN FARMED BLUE MUSSELS (MYTILUS<br />
EDULIS), OTHER BIOTA AND SEDIMENT FROM LOCH LEVEN<br />
Driving force<br />
According to surveys for the Food Standards<br />
Agency Scotland (FSAS) between 1999 and 2002,<br />
concentrations of polycyclic aromatic hydrocarbons<br />
(PAH) in wild and farmed mussels from Loch Leven,<br />
Argyll, Scotland, were considerably greater than<br />
elsewhere around the Scottish mainland. High<br />
concentrations of PAH have been reported in<br />
discharges from aluminium smelters employing<br />
similar processes to those at Kinlochleven (Naes et<br />
al., 1995 and 1999), believed to be the source of<br />
contamination.<br />
Loch<br />
Linnhe<br />
Loch Leven<br />
Mussel Farms<br />
Loch Etive<br />
0 5 10 20<br />
N<br />
Kilometres<br />
Pressure<br />
Figure 33.<br />
Shellfish growing areas<br />
The smelter discharged untreated effluent into Loch<br />
Leven until March 2000 when a filter was installed<br />
on the fume treatment plant (FTP) water discharge<br />
outlet. The smelter closed and the FTP discharge<br />
ceased in June 2000. The smelter discharged<br />
into waters used for shellfish growing (Figures 33<br />
and 34) and fish farming. As a precaution, the<br />
FSAS and the shellfish farmers agreed to voluntary<br />
closure of the commercial shellfish growing sites in<br />
September 1999.<br />
N<br />
Ballachulish<br />
Shellfish farm<br />
Kinlochleven<br />
shellfish farm<br />
Lower Basin<br />
Kinlochleven<br />
(smelter)<br />
Upper Basin<br />
State/Impact<br />
Loch Leven<br />
0 1 2 4<br />
Kilometres<br />
Polycyclic aromatic hydrocarbon (PAH)<br />
concentration and composition were measured<br />
in farmed blue mussels (Mytilus edulis) from both<br />
Loch Leven and Loch Etive (Table 7, Figure 35). The<br />
monitoring covered three periods: April 1999 to the<br />
smelter closure in June 2000; June 2000 to the reopening<br />
of the Ballachulish farm in February 2001;<br />
and February 2001 to March 2002. The total PAH<br />
concentration in mussels from the Kinlochleven,<br />
upper loch, shellfish farm, ranged from 8210 ng g -1<br />
in September 1999 to 693 ng g -1 wet weight tissue<br />
in May 2000, while the PAH concentration in<br />
mussels from the Ballachulish, lower loch, shellfish<br />
farm ranged from 5323 ng g -1 in July 1999 to 206<br />
ng/g in May 2000. PAH concentrations from both<br />
farms decreased after the smelter closed. The total<br />
measured PAH concentration from the Ballachulish<br />
shellfish farm in February 2001 was 388.6 ng g -1 .<br />
Although there are no PAH standards or guideline<br />
values in current <strong>UK</strong> legislation, the <strong>UK</strong> Food<br />
Standards Agency, advised by the Committee on<br />
Toxicity of Chemicals in Food, Consumer Products<br />
and the Environment (CoT), adopted an interim limit<br />
of 15 ng g -1 wet weight for any of three named<br />
Figure 34.<br />
PAHs of greatest concern: (benz[a]anthracene,<br />
benzo[a]pyrene and dibenz[a,h]anthracene). None<br />
of the samples from the Ballachulish shellfish farm<br />
from September 2000 to February 2001 exceeded<br />
this limit.<br />
From September 2001 to March 2002, PAH<br />
concentrations varied seasonally at both sites<br />
(Webster et al., 1997). The maximum concentration<br />
(685 ng g -1 wet weight PAH) occurred in January<br />
2002. The PAH concentrations were consistently<br />
higher in mussels from the Kinlochleven farm, with<br />
the five-ring PAH dominating the PAH profiles.<br />
Sediment<br />
Sites of smelter and adjacent shellfish farms<br />
The PAH concentration and composition were<br />
determined in sediments from upper and<br />
lower Loch Leven in August 2001 (Table 8).<br />
Concentrations were consistently higher in the<br />
upper basin. Five-ring PAH dominated PAH profiles<br />
of the sediments from both basins.<br />
85
Table 7. PAH concentrations in mussels from Loch Leven and the Loch Etive reference location<br />
Site Date Total PAH<br />
(ng g -1 wet weight) (1)<br />
% 5-ring<br />
PAH (2) B[a]P (3)<br />
(ng g -1 wet weight)<br />
B[a]PE (4)<br />
(ng g -1 wet weight)<br />
Kinlochleven 04/99 7,169.3 (5) 55.1 445.9 862.4<br />
Ballachulish 05/99 4,370.6 56.7 108.5 341.5<br />
Loch Etive 06/99 17.0 22.4 TR 0.2<br />
Kinlochleven 02/00 7,565.5 43.5 418.1 821.9<br />
Ballachulish 02/00 3,046.4 48.0 118.3 295.2<br />
Kinlochleven 10/00 300.6 61.8 14.0 45.7<br />
Ballachulish 10/00 114.5 49.1 3.6 13.0<br />
Loch Etive 10/00 43.3 27.0 1.4 2.2<br />
Kinlochleven 02/01 541.1 59.1 21.1 70.0<br />
Ballachulish (6) 02/01 388.6 41.2 8.0 23.5<br />
Loch Etive 02/01 148.1 28.2 2.3 6.7<br />
Kinlochleven (7) 08/01 215.0 54.4 9.9 29.9<br />
Ballachulish 08/01 68.3 30.6 1.4 4.4<br />
Loch Etive 08/01 56.1 7.1 TR 0.2<br />
Kinlochleven 02/02 284.6 (5) 59.9 16.2 47.3<br />
Loch Etive 02/02 73.6 19.9 1.3 4.6<br />
(1)<br />
Total PAH = 2- to 6-ring parent and branched PAH including acenaphthylene, acenaphthene, fluorene and dibenz[a,h]anthracene<br />
(2)<br />
percentage of total PAH; 5-ring PAH including dibenz[a,h]anthracene<br />
(3)<br />
B[a]P = benzo[a]pyrene concentration<br />
(4)<br />
B[a]PE = benzo[a]pyrene equivalent value<br />
(5)<br />
mean of two samples<br />
(6)<br />
relaxation of voluntary closure<br />
(7)<br />
relaxation of voluntary closure<br />
TR = trace (0.04 – 0.14 ng g -1 )<br />
Table 8. Summary of PAH concentrations in sediment in Loch Leven, August 2001<br />
Sampling site<br />
Loch Leven<br />
Total measured PAH<br />
(ng g -1 dry weight)<br />
% 4- to 6-ring PAH % 5-ring PAH<br />
Lower Basin Range:109 – 22,805<br />
Mean:13,705<br />
SD: 8,351<br />
Upper Basin Range:94,464 - 336,543<br />
Mean:151,185<br />
SD: 69,579<br />
Mean: 93.7<br />
SD: 1.3<br />
Mean: 95.8<br />
SD: 0.96<br />
Mean: 46.2<br />
SD: 1.8<br />
Mean: 46.9<br />
SD: 3.9<br />
Water<br />
Concentrations of PAH in the water at both sites<br />
in August 2001 (Table 9) were generally greater<br />
than the ranges of OSPAR background/reference<br />
concentrations (BRC) for offshore waters but were<br />
less than ranges suggested as ecotoxicological<br />
assessment criteria (EAC) (OSPAR – ASMO, 2003).<br />
The mean total concentration of PAH in the water<br />
column at the Ballachulish shellfish farm site was<br />
9.1 ng l -1 and the mean total concentration at the<br />
Kinlochleven site was 25.2 ng l -1 .<br />
Fish<br />
When monitoring started in 1999, the Atlantic<br />
salmon (Salmo salar) fish farm within Loch Leven<br />
was fallow. The farm was restocked in March/April<br />
2000. The total measured PAH concentrations<br />
from Loch Leven on four occasions between May<br />
and October 2000 were all less than 40 ng g -1 and<br />
similar to those in salmon from Kingairloch. The<br />
PAHs in salmon from both farms were dominated<br />
by low molecular weight compounds (naphthalenes<br />
and phenanthrenes/anthracenes).<br />
Response<br />
Discharges of PAH to Loch Leven reduced after<br />
the smelter closed. Thereafter, PAH concentration<br />
in mussels rapidly declined although the<br />
concentrations at Kinlochleven remained greater<br />
than those at the Loch Etive reference site when<br />
monitoring stopped in 2002. Contamination in the<br />
upper basin sediments is not expected to reduce in<br />
the short term.<br />
86
Table 9. PAH concentrations in Loch Leven water and OSPAR ASMO BRC and EAC values<br />
PAH compound Loch Leven OSPAR ASMO<br />
BRC<br />
EAC<br />
Naphthalene 0.6 – 1.7 ng l -1 0.1 – 2.7 ng l -1 5000 – 50000 ng l -1<br />
Acenaphthene TR – 0.3 ng l -1 0.02 – 0.05 ng l -1 ND<br />
Fluorene 0.2 – 0.5 ng l -1 0.02 – 0.81 ng l -1 ND<br />
Phenanthrene 0.8 – 1.3 ng l -1 0.1 – 0.6 ng l -1 500 – 5000 ng l -1<br />
Anthracene TR 0.001 – 0.004 ng l -1 1 – 100 ng l -1<br />
Fluoranthene 1.0 – 1.4 ng l -1 0.04 – 0.26 ng l -1 10 – 100 ng l -1<br />
Pyrene 0.8 – 1.0 ng l -1 0.02 – 0.05 ng l -1 50 – 500 ng l -1<br />
Benzo[a]anthracene TR – 0.3 ng l -1 0.001 – 0.006 ng l -1 ND<br />
Chrysene/Triphenylene 0.2 – 1.0 ng l -1 0.006 – 0.057 ng l -1 ND<br />
Benzo[b]fluoranthene 0.2 – 1.4 ng l -1 0.001 – 0.017 ng l -1 ND<br />
Benzo[k]fluoranthene 0.2 – 0.8 ng l -1 0.001 – 0.003 ng l -1 ND<br />
Benzo[a]pyrene 0.6 – 0.7 ng l -1 0.001 – 0.005 ng l -1 10 – 100 ng l -1<br />
Indenopyrene TR – 0.8 ng l -1 0.001 – 0.017 ng l -1 ND<br />
Benzoperylene TR – 1.1 ng l -1 0.001 – 0.01 ng l -1 ND<br />
Dibenz[a,h]anthracene TR – 0.3 ng l -1
Naes, K, Hylland, K, Oug, E., Forlin, L. and<br />
Ericson, G., 1999. Accumulation and effects<br />
of aluminium-smelter generated PAHs on softbottom<br />
invertebrates and fish. Environmental<br />
Toxicology and Chemistry, 18, 10, 2205-2216.<br />
OSPAR Convention for the protection of the <strong>Marine</strong><br />
Environment of the North East Atlantic. Meeting<br />
of the Assessment and <strong>Monitoring</strong> Committee<br />
(ASMO). April 2003.<br />
Webster, L., Angus, A., Topping, G., Dalgarno, E.<br />
J. and Moffat, C.F., 1997. Long-term <strong>Monitoring</strong><br />
of Polycyclic Aromatic Hydrocarbons in Mussels<br />
(Mytilus edulis) Following the Braer Oil Spill.<br />
Analyst, December 1997, Vol. 122 (1491-1495).<br />
88
10. MONITORING THE BIOLOGICAL EFFECTS OF POLYNUCLEAR<br />
AROMATIC HYDROCARBONS (PAH) ON FLATFISH IN THE FORTH<br />
AND CLYDE ESTUARIES<br />
Driving force<br />
Dundee<br />
The Forth Estuary on Scotland’s East coast has been<br />
a centre for petrochemical and refining industries<br />
for many years. Refineries at Grangemouth, the<br />
coal-fired power station at Longannet and inputs<br />
from municipal discharges are all likely sources of<br />
PAH input to sediments in the Forth, and warrant<br />
monitoring of these substances and their effects in<br />
this sea area.<br />
7 6 5 4 3<br />
2<br />
1<br />
The Clyde Estuary and Firth of Clyde on Scotland’s<br />
West coast have for decades received direct<br />
and indirect sewage and industrial discharges<br />
from activities associated with half of Scotland’s<br />
population. Consequently, there are many<br />
potential sources of PAH including military,<br />
domestic, municipal and industrial effluents, oil<br />
from recreational, commercial and naval shipping,<br />
sewage and dredge spoil dump sites and a power<br />
station at Irvine Bay.<br />
Pressure<br />
Inputs of PAH have not been quantified but are<br />
connected with the burning of fossil fuels. Inputs<br />
derive from point source discharges (e.g. processing<br />
of oil and gas) and diffuse sources (e.g. wash out of<br />
discharges to the atmosphere).<br />
State/Impact<br />
Forth<br />
Flounder (Platichthys flesus) from stations in the<br />
Forth estuary, Firth of Forth and St. Andrews Bay<br />
Stirling<br />
N<br />
0 2 4 6<br />
Kilometres<br />
Figure 36.<br />
Alloa<br />
Edinburgh<br />
7<br />
Grangemouth<br />
Longannet<br />
Power<br />
Station<br />
6<br />
Bo'ness<br />
Sampling sites in the Forth Estuary and Firth<br />
of Forth and St. Andrews Bay (reference) for<br />
1999 and 2001 PAH specific biological effects<br />
survey in flounder (Platichthys flesus).<br />
1) St. Andrews Bay, 2) Kingston Hudds,<br />
3) Port Edgar, 4) Blackness, 5) Tancred,<br />
6) Bo’ness, 7) Longannet<br />
were sampled for PAH specific biological effects in<br />
1999 and 2001 and the results were compared to<br />
sediment chemistry (Figure 36).<br />
EROD activity in livers of flounder in 1999 and 2001<br />
was elevated from both Forth estuary and Firth<br />
5<br />
4<br />
3<br />
Figure 37.<br />
Hepatic EROD activity of flounder (Platichthys flesus) sampled from 7 stations<br />
in the Forth during surveys in 1999 and 2001. Total sediment PAH burden from<br />
1999 is included for interpretation<br />
89
of Forth sites compared to the control site at St.<br />
Andrews Bay (Figure 37). There were no significant<br />
differences in EROD activity between trawl stations<br />
within the estuary for either survey. Sediment PAH<br />
levels in 1999 reflected the general trends recorded<br />
for EROD activity, with the lowest levels at the<br />
control site outside of the Firth of Forth and higher<br />
but variable levels in sediments from the estuary<br />
and firth (Figure 37).<br />
Holy Loch<br />
Skelmorlie<br />
Broad Bay<br />
Bile metabolite analysis from fish caught in 1999<br />
detected three metabolites (1-OH pyrene, 2-OH<br />
naphthalene and 1-OH phenanthrene). 1-OH<br />
pyrene, a metabolite commonly present at high<br />
levels in environmental samples, dominated and<br />
increased up the estuary, with fish from Longannet<br />
containing significantly greater levels of pyrene<br />
metabolites in bile samples than fish from stations<br />
further out. Other metabolites were present at<br />
much lower levels (Figure 38).<br />
Firth of Clyde<br />
Hunterstone<br />
Garroch Head<br />
Irvine<br />
Bay<br />
0 2 4 6<br />
Kilometres<br />
Metabolite concentration (nmol ml bile)<br />
-1<br />
8<br />
4<br />
0<br />
0.8<br />
0.4<br />
1-OH pyrene<br />
2-OH naphthalene<br />
1-OH phenanthrene<br />
*<br />
**<br />
Figure 39.<br />
Sampling sites in the Firth of Clyde and<br />
Broad Bay (reference) for 1999 and 2000 PAH<br />
specific biological effects survey in plaice<br />
(Pleuronectes platessa)<br />
In 2000, EROD activity in plaice liver from Garroch<br />
Head (a sewage sludge disposal site) and Holy Loch<br />
in the upper Clyde was elevated in comparison to<br />
the reference site at Broad Bay. Total sediment PAH<br />
concentrations followed a similar trend with the<br />
highest levels reported at Holy Loch and Garroch<br />
Head (Figure 40).<br />
0<br />
Figure 38.<br />
Clyde<br />
Outer Tay (1)<br />
Kingston<br />
Hudds (2)<br />
Port Edgar (3)<br />
Blackness (4)<br />
Tancred (5)<br />
Bo’ness (6)<br />
Longannet (7)<br />
Mean (+/- SEM) biliary metabolite<br />
concentrations in male flounder (Platichthys<br />
flesus) from six sites in the Forth, September,<br />
1999. * , ** Denotes significant differences<br />
from Port Edgar<br />
All four PAH metabolites were present in plaice<br />
bile from these areas, with higher concentrations<br />
generally found from the Firth of Clyde compared to<br />
the reference site at Broad Bay. Particularly elevated<br />
concentrations of naphthalene metabolites were<br />
present in fish from the Irvine Bay and Upper Firth<br />
stations, suggesting oil exposure (Figure 41). Fish<br />
from Irvine Bay also contained the highest levels<br />
of phenanthrene and pyrene metabolites, while<br />
fish from the Garroch Head dump site presented<br />
significantly higher levels of benzo[a]pyrene<br />
metabolites than any other station.<br />
Plaice (Pleuronectes platessa) were taken from the<br />
Firth of Clyde in 1999 and 2000, as they were more<br />
readily available than flounder yet respond similarly<br />
to PAH. Fish were assessed for EROD activity and, in<br />
2000, bile metabolites were measured and sediment<br />
samples were analysed for total PAH content so as to<br />
provide background chemistry. Fish from within the<br />
Firth of Clyde were compared to a reference station<br />
at Broad Bay on Lewis (Figure 39).<br />
These biological effects indicators have<br />
demonstrated exposure of marine flatfish to PAH<br />
within Scottish Firths affected by industrial activity.<br />
Flatfish from these areas often showed elevated<br />
levels of EROD activity, generally associated with<br />
increased total sediment PAH. Biliary metabolite<br />
analysis confirmed that exposure to PAH had<br />
occurred and it identified specific compounds of<br />
concern.<br />
90
Figure 40.<br />
EROD activity in liver of plaice (Pleuronectes platessa) from the Firth of Clyde<br />
in 1999 and 2000. Total sediment PAH burden from 2000 is included for<br />
interpretation<br />
Figure 41.<br />
Biliary PAH metabolite concentrations from plaice (Pleuronectes platessa)<br />
sampled from the Firth of Clyde, 2000. Data are mean +/- SEM, while stations<br />
with different superscripts (a,b) are significantly different from Broad Bay<br />
(P
11. TRENDS IN ORGANOCHLORINE RESIDUES IN MUSSELS (MYTILUS<br />
EDULIS) FROM THE MERSEY ESTUARY<br />
Driving force<br />
The Mersey Estuary was abused and neglected since<br />
the Industrial Revolution began. For over 150 years,<br />
manufacturing effluents and burgeoning centres<br />
of population created an unenviable reputation as<br />
one of the most polluted European rivers. It was<br />
believed the large volume and the strong tides<br />
could receive almost unlimited untreated effluents.<br />
Accompanying an increase in manufacturing, many<br />
industries required large volumes of water for<br />
processes such as cooling, bleaching, dying, tanning<br />
and metalworking.<br />
An industrial resurgence followed the <strong>Second</strong><br />
World War, particularly in petrochemicals and<br />
heavy chemicals based upon the chloralkali<br />
industry. Although organochlorines were not<br />
produced on the scale of heavy chemicals, there<br />
was concern because of faunal impact at very low<br />
concentrations. Moreover, many such substances<br />
are not readily biodegradable and consequently<br />
remain in the environment for prolonged periods.<br />
Blue mussels (Mytilus edulis) were used to<br />
determine spatial and temporal trends in the<br />
concentrations of a number of organochlorine<br />
compounds. Mussels were collected from a<br />
number of sites in February 1994 and 1998 (Figure<br />
42) (Connor et al., 2001). Concentrations of all<br />
determinands except PCBs and dieldrin were highest<br />
in the estuary and decreased downstream.<br />
Pressure<br />
Input data were available from the tidal limit of<br />
three rivers draining into the Mersey for g-HCH,<br />
DDT and PCB. During this time inputs of PCBs<br />
decreased but there were no trends in inputs of g-<br />
HCH and DDT.<br />
Dove<br />
Point<br />
New<br />
Brighton<br />
Caldy<br />
Blacks<br />
Dee<br />
Estuary<br />
Crosby<br />
Egremont<br />
Rock<br />
Ferry<br />
Figure 42. Mussels sampling sites<br />
Liverpool<br />
Mersey Estuary<br />
0 5<br />
Kilometres<br />
N<br />
State<br />
α-MHCH<br />
This methyl derivative of HCH (hexachorocyclohexane)<br />
showed a significant 4 to 10-fold reduction<br />
in mussel tissue (Figure 43). The reduction from<br />
1994 to 1998 was much greater than that for<br />
other organochlorines. The source was located to<br />
a chemical plant in the inner estuary. Since MHCH<br />
contamination was first reported in the early 1990s,<br />
the company commissioned a new chlorination<br />
plant in 1994 and changed the operating<br />
procedures, including treatment and disposal of<br />
chemical waste in pursuit of waste minimisation.<br />
Such a big difference in the observed concentration<br />
of this compound over only 4 years is remarkable<br />
when other organochlorines such as pp’–DDT<br />
persist for decades after termination of their use by<br />
law.<br />
Concentration (µg kg ) wet weight<br />
-1<br />
12<br />
10<br />
8<br />
6<br />
4<br />
2<br />
0<br />
Figure 43.<br />
There is no evidence of historical contamination<br />
of MHCHs in dated sediments from other Mersey<br />
cores, in contrast to high concentrations reported<br />
for pp’-DDT and its metabolites. With reduced<br />
contemporary discharge of MHCHs, no historical<br />
sediment sink to recycle, and with short biological<br />
half-life, MHCHs could become almost undetectable<br />
within a decade.<br />
PCBs<br />
Rock<br />
Ferry<br />
Crosby<br />
Egremont<br />
New<br />
Brighton<br />
Dove<br />
Point<br />
Caldy<br />
Blacks<br />
1994<br />
1998<br />
α-MH6CH in mussels from the Mersey Estuary<br />
(1994 vs 1998)<br />
Although there has been little change (Figure 44)<br />
in PCB concentration when presented as ΣICES7<br />
(summation of congeners 28, 52, 101, 118, 138,<br />
153 and 180), there have been changes in individual<br />
congeners. For example, between 1994 and 1998<br />
congeners 28 and 101 reduced at Rock Ferry while<br />
others remained static (Connor et al., 2001).<br />
92
Concentration (µg kg ) wet weight<br />
-1<br />
40<br />
35<br />
30<br />
25<br />
20<br />
15<br />
10<br />
5<br />
0<br />
Figure 44.<br />
As inputs from point sources declined,<br />
concentrations of congeners 28 and 101 fell.<br />
Higher chlorinated congeners such as 153 and 138,<br />
predominantly attached to particulate material, may<br />
be trapped in sediment perhaps to be remobilised in<br />
response to salt marsh accretion and erosion. The<br />
slow rate of decline in ΣICES7 between 1994 and<br />
1998 suggests it will be decades before the estuary<br />
loses its legacy of PCB contamination<br />
DDT<br />
Rock<br />
Ferry<br />
Crosby<br />
Egremont<br />
New<br />
Brighton<br />
Dove<br />
Point<br />
Caldy<br />
Blacks<br />
Isle of<br />
Man<br />
1994<br />
1998<br />
ΣICES 7 PCB Congeners in mussels from the<br />
Mersey Estuary (1994 vs 1998)<br />
Isle of<br />
Skye<br />
DDT is presented (Figure 45) as the summation<br />
of the pp’–DDT, pp’ –DDD and the pp’–DDE<br />
concentrations. Change was less pronounced than<br />
that for α-MHCH but more than that for PCBs,<br />
with a 25-60% reduction in the Mersey sites. In<br />
1998, Rock Ferry, Egremont and Crosby remained<br />
the most contaminated but the difference between<br />
the two inner estuary sites had gone. The reason<br />
follows from sedimentary analyses (Connor et al.,<br />
2001). In 1994, mussels had a profile similar to the<br />
1990 nearby sediment, except for pp’-DDE, which<br />
was much lower (Figure 48), because it converts<br />
rapidly in sediment to pp’-DDD. The 1994 mussel<br />
monitoring preceded the full benefit of investments<br />
to improve water quality. Relative abundance of<br />
pp’-DDT in both the 1994 mussels from Rock Ferry<br />
and the 1990 sediment indicates that, although<br />
long since banned, pp’-DDT was still being<br />
discharged or remobilised from sediment. The<br />
1998 data reveal a reduction in both pp’-DDE and<br />
pp’-DDT concentrations after cessation of untreated<br />
sewage discharge and increasing effectiveness of<br />
the DDT ban.<br />
Dieldrin<br />
The difference in dieldrin concentrations between<br />
1994 and 1998 (Figure 46) follows a trend similar<br />
to that for ΣDDT. Correlation between the Dieldrin<br />
and ΣDDT concentrations for the 1998 samples<br />
probably reflects similar physicochemical properties<br />
and sources.<br />
Concentration (µg kg ) wet weight<br />
-1<br />
4.5<br />
4.0<br />
3.5<br />
3.0<br />
2.5<br />
2.0<br />
1.5<br />
1.0<br />
0.5<br />
0<br />
Rock<br />
Ferry<br />
Figure 46.<br />
Crosby<br />
Egremont<br />
New<br />
Brighton<br />
Dove<br />
Point<br />
HCB (hexachlorobenzene)<br />
Caldy<br />
Blacks<br />
Isle of<br />
Man<br />
1994<br />
1998<br />
Isle of<br />
Skye<br />
Dieldrin in mussels from the Mersey Estuary<br />
(1994 vs 1998)<br />
HCB levels likewise reduced over the 4 years (Figure<br />
47), approaching those at uncontaminated locations<br />
near the Isle of Man and Isle of Skye. The change<br />
is statistically significant and may be a response to<br />
better sewage treatment and falling industrial loads.<br />
HCB is one of the by-products of the century-old<br />
<strong>UK</strong> chloralkali industry, which has responded to<br />
regulatory pressures by investing methods to reduce<br />
HCB discharges.<br />
Concentration (µg kg ) wet weight<br />
-1<br />
35<br />
30<br />
25<br />
20<br />
15<br />
10<br />
5<br />
0<br />
Rock<br />
Ferry<br />
Crosby<br />
Egremont<br />
New<br />
Brighton<br />
Dove<br />
Point<br />
Caldy<br />
Blacks<br />
Isle of<br />
Man<br />
1994<br />
1998<br />
Isle of<br />
Skye<br />
Concentration (µg kg ) wet weight<br />
-1<br />
1.2<br />
1.0<br />
0.8<br />
0.6<br />
0.4<br />
0.2<br />
0<br />
Rock<br />
Ferry<br />
Crosby<br />
Egremont<br />
New<br />
Brighton<br />
Dove<br />
Point<br />
Caldy<br />
Blacks<br />
Isle of<br />
Man<br />
1994<br />
1998<br />
Isle of<br />
Skye<br />
Figure 45.<br />
ΣDDT in mussels from the Mersey Estuary<br />
(1994 vs 1998)<br />
Figure 47.<br />
Hexachlorobenzene (HCB) in mussels from the<br />
Mersey Estuary (1994 vs 1998)<br />
93
Concentration (µg kg )<br />
-1<br />
20<br />
18<br />
16<br />
14<br />
12<br />
10<br />
8<br />
6<br />
4<br />
2<br />
0<br />
Figure 48. DDT Components of Rock Ferry mussels (1994<br />
vs 1998) and sediment from Widnes Warth<br />
(1990)<br />
Impact<br />
Rock ferry 1994<br />
Rock ferry 1998<br />
Widnes Warth 1990<br />
pp’DDE pp’DDD pp’DDT<br />
Many years of large discharges of untreated<br />
domestic sewage and industrial effluents have<br />
seriously affected the estuary in three principal<br />
ways: fouling of beaches with sewage debris;<br />
summer dissolved oxygen loss from long reaches in<br />
the upper estuary; and accumulation of dangerous<br />
substances (heavy metals and persistent organics) in<br />
the sediments and biota.<br />
Published work over thirty years has revealed<br />
elevated concentrations of these materials in water,<br />
fish, shellfish and sediments. In 1992, MAFF<br />
advised consumers not to eat fish caught in such<br />
industrialised estuaries.<br />
Recent biomarker research on the stress response<br />
syndrome has raised continuing concern about<br />
the status of the estuary. Tests such as hepatic<br />
ethoxyresorufin O-deethylase (EROD) and induction<br />
of the yolk protein vitellogenin have been used<br />
to appraise sub-lethal contamination in fish from<br />
several industrialised <strong>UK</strong> estuaries. The highest<br />
mean EROD activity was in flounder (Platichthys<br />
flesus) from the Mersey. The intersex condition of<br />
fish based on the vitellogenin levels and oocytes<br />
in their testes underpinned these anxieties about<br />
environmental quality.<br />
Many, if not all, of these biological effects have<br />
been linked with the concentration of PAHs and<br />
PCBs. These and other persistent organics are<br />
ubiquitous in the Mersey.<br />
Response<br />
In the last twenty years, numerous initiatives have<br />
tackled the problem, the most important being the<br />
Mersey Basin Campaign. This 25-year governmentsupported<br />
partnership between local authorities,<br />
industry, voluntary organisations and government<br />
agencies delivers water quality improvements and<br />
waterside regeneration. Continuous discharge of<br />
raw sewage from a large part of the conurbation<br />
has ceased and interceptor sewers now lead to a<br />
new wastewater treatment plant at Sandon Dock in<br />
Liverpool. The chemical industry has also changed,<br />
with continuing commercial pressure to reduce<br />
costs by increasing process efficiency, reducing<br />
waste, and cheaper treatment. Collectively, these<br />
measures have improved water quality significantly<br />
and there is now unequivocal evidence that the<br />
large capital investment is succeeding (Jones, 2000).<br />
References<br />
Jones, P.D., 2000. The Mersey Estuary – back<br />
from the dead? Solving a 150-year old problem.<br />
Journal of the Chartered Institute of Water<br />
Engineering Management, 14, 124-130.<br />
Connor, L., Johnson, M.S., Copplestone, D. and<br />
Leah, R.T., 2001. Recent trends in organochlorine<br />
residues in mussels (Mytilus edulis) from the<br />
Mersey Estuary. <strong>Marine</strong> Environmental Research,<br />
52, 397-411.<br />
94
12. SPATIAL SURVEY OF BROMINATED FLAME RETARDANTS<br />
Brominated flame retardants (BFRs) comprise a<br />
diverse group of about 75 commercially produced<br />
brominated organic compounds. Polybrominated<br />
diphenyl ethers (PBDEs), hexabromocyclohexane<br />
(HBCD) and tetrabromo bisphenol – A (TBBP-A)<br />
are used in numerous commercial and domestic<br />
applications where flame retarding and fire<br />
prevention matters. They are used in building and in<br />
common products such as carpet backing, textiles,<br />
printed circuit boards, expanded polystyrene, and<br />
polyvinyl chloride piping.<br />
PBDEs are lipophilic hydrophobic compounds with<br />
bioaccumulative potential, now recognised as global<br />
contaminants. The lower brominated compounds<br />
have the potential for long-range atmospheric<br />
transport. Commercial formulations are classified<br />
according to the degree of bromination and<br />
commonly referred to as ‘penta mix’, ‘octa mix’ or<br />
‘deca mix’. In 1999 210 tonnes ‘penta mix’, 450<br />
tonnes ‘octa mix’ and 7500 tonnes ‘deca mix’ were<br />
used in the EU. In addition 13,800 tonnes of TBBP-<br />
A and 3100 tonnes of HBCD were used.<br />
Clyde<br />
Tyne<br />
Skerne<br />
Tees<br />
Humber<br />
Mersey<br />
Most <strong>UK</strong> aquatic environment monitoring has<br />
focussed on PBDEs, although more recently on<br />
HBCD and TBBP-A (Allchin et al., 1999, 2000, 2001;<br />
Boon et al., 2002; Morris et al., in prep.). Much of<br />
this has concentrated on the Tees, with input from<br />
a manufacturer that used to produce PBDEs but has<br />
now switched production to HBCD.<br />
1800<br />
BDE47<br />
BDE99<br />
Concentrations of BDE in µg kg -1<br />
PBDEs in sediment and biota<br />
Concentrations of selected PBDE congeners were<br />
determined in dab liver from NMMP sites in the<br />
Tees estuary. Sediments have been sampled in the<br />
Tees at some other sites as part of a more extensive<br />
programme, see Figure 49 .<br />
Anglesey<br />
Sole Pit<br />
Dogger<br />
German Bight<br />
5000<br />
The most dominant PBDE congener found in biota<br />
is the 2,2’,4,4’ tetrabromodiphenyl ether, BDE47. It<br />
dominates ‘penta mix’ formulations, so its presence<br />
probably reflects ‘penta mix’ usage. PBDEs were<br />
detected in all samples. The highest total BDE<br />
concentrations outside the Tees, up to 330 µg kg -1<br />
wet weight, were recorded off Anglesey : lowest<br />
levels were recorded in the German Bight.<br />
High concentrations of BDE209, the fully<br />
brominated deca compound, have also been seen.<br />
The lack of BDE209 in biota is probably a function<br />
of its molecular weight and cross section, which<br />
prohibit bioaccumulation. With the exception<br />
of terrestrial birds of prey, (ref) BDE209 is rarely<br />
reported in biota at other than at very low levels.<br />
BDE47<br />
BDE99<br />
Concentrations of BDE in µg kg -1<br />
Figure 49. The concentrations of BDE in dab liver<br />
The rivers Skerne and Tees had the highest PBDE<br />
concentrations but significant concentrations were<br />
also seen in the Clyde and Mersey.<br />
Recent investigations have shown high levels of<br />
HBCD diasteroisomers in fish tissue, porpoises,<br />
cormorants and sediment from the Tees catchment<br />
(Morris et al., in prep.).<br />
95
Despite recent EU restrictions, PBDEs are common<br />
marine contaminants and warrant further study.<br />
TBBP-A is occasionally present in sediments and<br />
biota but at much lower concentrations than either<br />
PBDEs or HBCD. Few data are available for HBCD<br />
but recent work suggests concentrations in some<br />
locations and matrices may be higher than levels<br />
of PBDEs. Because HBCD is still unrestricted, these<br />
levels may increase.<br />
References<br />
Allchin, C.R., Law, R.J. and Morris, S., 1999.<br />
Polybrominated diphenyl ethers in sediments and<br />
biota downstream of potential sources in the <strong>UK</strong>.<br />
Environmental Pollution, 105:197-207.<br />
Allchin, C.R., Morris, S., Bennett, M., Law, R.J. and<br />
Russell, I.C., 2000. Polybrominated diphenyl ether<br />
residues in cormorant (Phalcrocorax carbo) livers<br />
from England <strong>UK</strong>. Organohalogen Compounds,<br />
47: 190-193.<br />
Allchin, C.R. and de Boer, J., 2001. Results of a<br />
comprehensive survey for PBDEs in the river Tees<br />
<strong>UK</strong>. Organohalogen Compounds, 52: 30-33.<br />
Boon, J.P., Lewis, W.E., Tjoen-A-Choy, M.R., Allchin,<br />
C.R., Law, R.J., de Boer, J., ten Halles-Tjabbes, C.C.<br />
and Zegers, B.N., 2002. Levels of polybrominated<br />
diphenyl ether (PBDE) flame retardants in animals<br />
representing different trophic levels of the North<br />
Sea food web. Environmental Science and<br />
Technology, 36: 4025-4032.<br />
Morris, S., Allchin, C.R., Zegers, B., hafta, J., Boon,<br />
J., Belpaire, C. and de Boer, J. (in prep.). The<br />
behaviour of the brominated flame retardants<br />
and hexabromocyclododecane (HBCD) and<br />
tetrabromobisphenol-A (TBBP-A) in estuaries and<br />
marine food webs.<br />
96
13. VITELLOGENIN EXPRESSION IN ESTUARINE MALE FLOUNDER<br />
(PLATICHTHYS FLESUS)<br />
Some substances disrupt the normal endocrine<br />
processes of fish. The potential effects of endocrine<br />
disrupting chemicals in the sea were first recognised<br />
after freshwater research connected oestrogenic<br />
chemicals - originating from domestic sewage<br />
and industrial discharges - with various biological<br />
effects. Initial monitoring showed similar impacts<br />
within estuaries. The potency of many endocrine<br />
disrupting chemicals, their ubiquity in sewage<br />
effluents and their potential for interfering with<br />
the normal reproduction of fish have led to further<br />
research.<br />
The most widespread evidence of endocrine<br />
disruption is the feminisation of male fish through<br />
their exposure to oestrogenic substances. The<br />
degree of feminisation is quantifiable by the<br />
presence of vitellogenin (VTG) in male blood<br />
plasma. VTG is a female-specific yolk precursor<br />
protein, measured by an enzyme linked<br />
immunosorbent assay (ELISA) or radio-immuno<br />
assay (RIA) technique (Matthiessen et al., 1998).<br />
Since 1996, VTG in male flounder has been<br />
monitored in a number of <strong>UK</strong> estuaries. Decreases<br />
in VTG have been associated with improvements in<br />
effluent treatment.<br />
Results<br />
Plasma VTG concentrations were elevated in male<br />
flounder from a number of estuaries (Figure 50).<br />
The highest levels (>10 7 ng ml -1 ) were recorded in<br />
the Tees and Mersey estuaries. Occasional high<br />
levels (>10 5 ng ml -1 ) were also observed in the Tyne,<br />
Clyde and Forth. Results for individual estuaries are<br />
discussed below.<br />
Alde<br />
The Alde is a small estuary in Suffolk that receives<br />
neither sewage nor industrial discharges. Plasma<br />
VTG concentrations in male flounder have remained<br />
consistently low (10 7 ng ml -1 ). However, in<br />
September 2001, mean levels were below 10 4 ng<br />
ml -1 . Despite this substantial reduction, the mean<br />
levels remained high compared to other estuaries,<br />
although only 30% of fish were affected.<br />
Tyne<br />
Different patterns were observed at each of the<br />
three sampling sites. At the most upstream (St.<br />
Anthony’s), the mean concentration in September<br />
2001 was much lower than previously, only 20% of<br />
fish showing induction. There was no clear trend in<br />
the data.<br />
10 8<br />
Alde Humber Thames Clyde Tees Tyne Mersey Forth<br />
10 7<br />
Mean plasma VTG (ng ml )<br />
-1<br />
10 6<br />
10 5<br />
10 4<br />
10 3<br />
10 2<br />
Nth of Orford<br />
Reads Island<br />
Off Hull<br />
Nore Sands<br />
Erith Sands<br />
Gallions Reach<br />
Bowling<br />
Pillar Bank<br />
Nth Gare Sands<br />
Dabholm Gut<br />
St Anthonys<br />
Hebburn<br />
Howdon<br />
Eastham Sands<br />
Port Edgar<br />
Sept-Dec 96 Sept-Oct 97 Sept-Nov 99 March 00 Nov-Dec 00 February 01 Sept-Oct 01<br />
Figure 50.<br />
Mean plasma VTG (ng ml -1 ) in male flounder from estuarine surveys between<br />
1996 and 2001<br />
97
At Hebburn, there was a clear and consistent<br />
downward trend from more than 10 5 ng ml -1 in<br />
1997 to below 10 3 ng ml -1 in September 2001. In<br />
1996 all fish showed evidence of VTG induction but<br />
by October 2001, levels were low (10 5<br />
ng ml -1 ) between 1996 and March 2000. By<br />
November 2000, plasma VTG concentrations had<br />
declined to just above 10 3 ng ml -1 and remained<br />
there.<br />
Tees<br />
Concentrations at Dabholm Gut were high<br />
throughout. Between 1997 and November 2000,<br />
mean concentrations were consistently greater<br />
than 10 6 ng ml -1 with a peak of above 10 7 ng ml -1<br />
in March 2000. A small reduction below 10 6 ng<br />
ml -1 was seen in September 2001, still two orders<br />
of magnitude higher than any other estuary at this<br />
time. However, the first evidence of non-induced<br />
specimens was found in November 2000 and in<br />
2001.<br />
Clyde<br />
Fish were collected from two sites, Pillar Bank and<br />
Bowling. At Pillar Bank there was no evidence of<br />
VTG induction in 1997, 1999 and 2001. There was<br />
evidence of induction on both occasions in 2000.<br />
At Bowling there was low to moderate induction<br />
in 1997 and 2001, but higher levels in September<br />
1999 and March 2000. In March 2000 the mean<br />
concentration was above 10 4 ng ml -1 at Pillar Bank<br />
and above 10 5 ng ml -1 at Bowling.<br />
Forth<br />
The Port Edgar site on the Forth estuary was<br />
only sampled after September 1999. Although<br />
there was clear evidence of induction in over<br />
70% of male flounder in March 2000, with mean<br />
concentrations above 10 4 ng ml -1 , it was low or<br />
absent at other times.<br />
Summary<br />
Plasma VTG concentrations in male flounder were<br />
raised in the Tees, Mersey and Tyne, and appeared<br />
to be decreasing in the Tyne and Mersey but not<br />
the Tees.<br />
The reduction in plasma VTG concentrations in<br />
male flounder captured near the Howdon sewage<br />
treatment outfall (Tyne) was linked to introduction<br />
of secondary treatment in 2000 (Kirby et al., 2003).<br />
Conversely, concentrations in plasma of male fish<br />
captured adjacent to the Dabholm Gut discharge<br />
in the Tees estuary seem not to have declined even<br />
though reduction and treatment of the effluents<br />
has also occurred there.<br />
References<br />
Kirby, M.F., Allen, Y.T., Dyer, R.A., Feist, S.W.,<br />
Katsiadaki, I., Matthiessen, P., Scott, A.P., Smith,<br />
A., Stentiford, G., Thain, J.E., Thomas, K.V.,<br />
Tolhurst, L. and Waldock, M.J., 2003. Surveys of<br />
plasma vitellogenin and intersex in male flounder<br />
(Platichthus flesus) as measures of endocrine<br />
disruption by oestrogenic contamination in<br />
<strong>UK</strong> estuaries: Temporal trends 1996-2001.<br />
Environmental Science and Technology, in press.<br />
Matthiessen, P., Allen, Y.T., Allchin, C.R., Feist,<br />
S.W., Kirby, M.F., Law, R.J., Scott, A.P., Thain, J.E.<br />
and Thomas, K.V., 1998. Oestrogenic endocrine<br />
disruption in flounder (Platichthys flesus) from<br />
<strong>UK</strong> estuarine and marine waters. Science Series<br />
Technical Report, CEFAS Lowestoft, 107: 48pp.<br />
98
14. MEIOFAUNA STUDIES IN MARINE MONITORING PROGRAMMES<br />
Introduction<br />
The soft-bottom benthic infauna is used frequently<br />
to monitor the effects of man-made activities on<br />
the sea bed. They are largely sedentary and so<br />
must withstand local environment extremes or<br />
perish. For convenience, most traditional biological<br />
investigations targeted larger macroinfauna<br />
(animals retained on 1000 or 500 µm sieves),<br />
whereas the smaller meiofauna (between 500<br />
and 63 µm, Figure 51) was largely neglected.<br />
Because of high abundance, ubiquitous distribution,<br />
rapid generation times and fast metabolic rates,<br />
meiofauna play an important role in ecosystem<br />
function (Coull and Chandler, 1992) and their state<br />
may reflect the overall health of the marine benthos<br />
(Kennedy and Jacoby, 1999).<br />
To improve understanding of meiobenthic<br />
communities’ response to anthropogenic impacts<br />
and natural environmental factors, twelve locations<br />
around the <strong>UK</strong> - some of them long-term NMMP<br />
stations - were sampled (Figure 52). The specific<br />
objectives addressed in this study were: to assess<br />
the spatial pattern inshore (1998/99) and offshore<br />
(1997); to determine the temporal stability of the<br />
spatial patterns (between 1997 and 1999) at four<br />
selected offshore sites; to relate observed patterns<br />
to measured environmental variables; and to<br />
relate meiofauna distributions to the sedimentary<br />
concentration of trace metals.<br />
Sediment samples were collected with the Bowers<br />
and Connelly multiple mini-corer and analysed for<br />
meiofauna (nematode and harpacticoid copepod<br />
assemblages), particle size distributions and trace<br />
metals concentrations. The data were analysed<br />
using univariate and multivariate statistical<br />
techniques (Clarke and Warwick, 1994).<br />
Figure 51.<br />
Dominant meiofaunal taxa - Nematode worm<br />
(top) and Harpacticoid copepod (bottom)<br />
Inshore location<br />
Offshore location<br />
Temporal study<br />
All sediments were muddy sands or sandy muds.<br />
The silt and clay content was lowest inshore off<br />
the Tyne (17%) and the Thames (19%) and highest<br />
in Dundrum Bay (87%). The total organic carbon<br />
content, ranging from 1.3% to 3.2%, was highest<br />
off the Tyne and in the Burbo Bight, and lowest<br />
off Plymouth. The concentrations of most trace<br />
metals were generally low. Copper and mercury in<br />
particular, were higher inshore than offshore.<br />
Meiofauna assemblage structure<br />
Spatial patterns<br />
Inshore, diversity of nematode assemblages was<br />
highest at the Tees and lowest in Burbo Bight.<br />
Offshore, diversity was significantly higher in the<br />
Celtic Deep than off the Tyne and in Lyme Bay<br />
Dundrum Bay,<br />
78 m (Dun)<br />
Celtic Deep,<br />
95 m (Cel)<br />
Figure 52.<br />
Cardigan Bay,<br />
26 m (Car)<br />
Burbo Bight,<br />
13 m (Bur)<br />
Swansea Bay,<br />
20m (Swa)<br />
Off Plymouth, 10 m (Ply)<br />
Tyne<br />
inshore,<br />
25 m<br />
(Tyn)<br />
Lyme Bay, 53 m (Lym)<br />
Off Tyne, 72 m (Tyn)<br />
Tees inshore, 15 m (Tee)<br />
Sites sampled for meiofauna and<br />
environmental variables<br />
Off Humber,<br />
75 m (Hum)<br />
Off Thames,<br />
< 10 m (Tha)<br />
99
4<br />
Inshore<br />
Nematodes<br />
Offshore<br />
Diversity [H']<br />
2<br />
0<br />
Tyn Tee Tha Ply Swa Bur Tyn Hum Lym Cel Car Dun<br />
Location<br />
4<br />
Inshore<br />
Harpacticoid<br />
copepods<br />
Offshore<br />
Diversity [H']<br />
2<br />
0<br />
Tyn Tee Tha Ply Swa Bur Tyn Hum Lym Cel Car Dun<br />
Location<br />
Figure 53.<br />
Mean diversity (±95% confidence) of nematode and harpacticoid copepod<br />
assemblages. Codes as in Figure 52<br />
(Figure 53). The inshore harpacticoid copepod<br />
diversity was highest off Plymouth whereas offshore<br />
diversity was significantly higher in the Celtic Deep<br />
compared with most other stations (Figure 53).<br />
Multivariate analysis of both the nematode<br />
(Figure 54) and harpacticoid copepod (Figure<br />
55) components discriminated between different<br />
locations, indicating distinct differences in species<br />
composition.<br />
Bur<br />
Bur<br />
Inshore<br />
Ply<br />
Swa Ply Ply<br />
Swa Ply<br />
Swa<br />
Bur<br />
Swa<br />
ThaTyn<br />
Tha Tha Tyn<br />
Tee Tee<br />
Tha Tyn<br />
Tyn<br />
Tee<br />
Tee<br />
Nematodes<br />
Offshore<br />
Car<br />
Hum<br />
Car Hum Hum<br />
Cel<br />
Lym<br />
Dun Car Hum<br />
Lym<br />
Cel Cel<br />
Cel Tyn Lym<br />
Lym<br />
Car<br />
Tyn<br />
Tyn<br />
Dun Tyn<br />
Dun<br />
Dun<br />
Lower diversity at some inshore locations compared<br />
to offshore was clearly related to higher sedimentary<br />
concentrations of trace metals. The concentrations<br />
of most trace metals were highest in the Burbo<br />
Bight (Liverpool Bay) where the species diversity of<br />
meiofauna was lowest. The correlations between<br />
nematode and harpacticoid copepod assemblage<br />
structure and measured environmental variables were<br />
generally higher inshore than offshore.<br />
Temporal patterns<br />
Four NMMP offshore sites off the Humber, off<br />
the Tyne, in Lyme Bay and in the Celtic Deep were<br />
sampled for nematodes and environmental variables<br />
over three years (Figure 52).<br />
Figure 54.<br />
Non-metric multi-dimensional scaling (MDS)<br />
ordination based on relative abundance of<br />
nematodes at all sampling locations. Codes as<br />
in Figure 52<br />
Inshore<br />
Swa Ply Tha<br />
Swa<br />
Ply<br />
Ply<br />
Ply<br />
Tha<br />
Swa<br />
Tha<br />
Tyn<br />
Tee Tha<br />
Tyn<br />
Bur Tee Tee Tee<br />
Bur Tyn Tyn Bur<br />
Harpacticoid copepods<br />
Offshore<br />
Car<br />
Car<br />
Car Dun Cel<br />
Lym<br />
Tyn<br />
Lym<br />
Cel Cel Lym<br />
Tyn Lym<br />
Tyn<br />
Tyn Hum Hum<br />
Cel Hum Dun<br />
Hum Dun<br />
Car<br />
Dun<br />
The offshore spatial variability in terms of sediment<br />
characteristics, nematode diversity (Figure 56)<br />
and assemblage structure (Figure 57) was more<br />
pronounced than temporal differences.<br />
Figure 55.<br />
Non-metric multi-dimensional scaling (MDS)<br />
ordination based on relative abundance<br />
of harpacticoid copepods collected at all<br />
sampling locations. Codes as in Figure 52<br />
100
Diversity [H’]<br />
4<br />
2<br />
0<br />
Figure 56.<br />
Figure 57.<br />
97 98 99<br />
Off Tyne Off Humber Lyme Bay Celtic De<br />
Mean diversity (±95% confidence intervals)<br />
of nematode assemblages at four NMMP<br />
offshore locations over a three-year period<br />
Lyme Bay<br />
English Channel<br />
Off Tyne<br />
Tyn97<br />
53 m depth<br />
North Sea<br />
Tyn97<br />
72 m depth<br />
Lym99<br />
Tyn99 Tyn97<br />
Lym97<br />
Tyn99<br />
Tyn97 Tyn98<br />
Tyn98<br />
Lym99<br />
Tyn99 Tyn98<br />
Lym97<br />
Cel98 Lym98<br />
Tyn98<br />
Cel99<br />
Lym98<br />
Tyn99<br />
Cel98<br />
Lym98<br />
Lym97<br />
Cel98 Cel99<br />
Lym99 Lym98<br />
Cel98 Cel99 Lym99 Lym97<br />
Cel99<br />
Cel97<br />
Cel97 Hum97 Hum96 Hum98<br />
Hum97<br />
Cel97<br />
Hum97<br />
Hum98<br />
Hum98 Hum96<br />
Hum98<br />
Hum97<br />
Cel97<br />
Hum96<br />
Hum96<br />
Celtic Deep<br />
Celtic Sea<br />
95 m depth<br />
Off Humber<br />
North Sea<br />
75 m depth<br />
Non-metric multi-dimensional scaling (MDS)<br />
ordination based on relative abundance of<br />
nematodes at four offshore locations over<br />
three years. Codes as in Figure 52<br />
Geographical location and water depth were major<br />
factors contributing to the establishment and<br />
maintenance of nematode distributions whereas<br />
the correlation between nematode assemblage<br />
structure and the concentrations of trace metals<br />
was low.<br />
Summary<br />
Distinct spatial differences in meiofauna species<br />
distributions correlate with the natural physical<br />
characteristics and sedimentary concentrations of<br />
trace metals. Inshore, elevated concentrations of<br />
most trace metals compared to offshore might<br />
indicate anthropogenic inshore impacts. The<br />
concentrations of correlated trace metals were<br />
relatively low at most stations and so were unlikely<br />
as a cause of biological effects. The diversity of<br />
meiofauna assemblages was higher offshore.<br />
Inshore, large fluctuations in physical factors<br />
including wave and tidal currents, salinity and<br />
temperature generally resulted in lower species<br />
diversity.<br />
Univariate and multivariate analysis indicated that<br />
the spatial variability of nematode assemblage<br />
structure at four locations exceeded temporal<br />
differences. There was no evidence of any adverse<br />
effect of trace metal concentrations on meiofaunal<br />
assemblage structure .<br />
References<br />
Clarke, K.R., Warwick, R.M., 1994. Change in<br />
marine communities: an approach to statistical<br />
analysis and interpretation. Plymouth, Plymouth<br />
<strong>Marine</strong> Laboratory.<br />
Coull, B.C., Chandler, G.T., 1992. Pollution and<br />
meiofauna: field, laboratory and mesocosm<br />
studies. Oceanography and <strong>Marine</strong> Biology Annual<br />
Review, 30, 191-271.<br />
Kennedy, A.D., Jacoby, C.A., 1999. Biological<br />
indicators of marine environmental health:<br />
meiofauna - a neglected benthic component?<br />
Environmental <strong>Monitoring</strong> and Assessment, 54,<br />
47-68.<br />
101
15. HOLY LOCH, SCOTLAND: AN ASSESSMENT OF THE<br />
CONTAMINATION AND TOXICITY OF MARINE SEDIMENTS<br />
Driving force<br />
A United States Navy Submarine Base was located<br />
in the Holy Loch, adjacent to the Firth of Clyde,<br />
Scotland (Figure 58) for over 30 years. After<br />
the base closed in 1992, video surveys revealed<br />
considerable seabed debris, largely scrap metal.<br />
A working group was set up to examine ways of<br />
cleaning the loch. Consultants employed by the <strong>UK</strong><br />
Ministry of Defence made an environmental survey,<br />
including assessment of the consequences of lifting<br />
the debris from the loch bed.<br />
Pressure<br />
The survey found sediments to be contaminated<br />
by organic compounds and metals (ERM, 1997).<br />
These are persistent, toxic and bioaccumulative<br />
substances, and concern was expressed that the<br />
debris removal operation might release sedimentbound<br />
contaminants, in turn exerting toxic effects<br />
on local flora and fauna. The Scottish Environment<br />
Protection Agency (SEPA) decided, before the debris<br />
removal, to verify sediment contaminant levels, to<br />
set these in context on a <strong>UK</strong> scale, and to assess<br />
the toxicity of sediment and water mixtures to local<br />
flora and fauna.<br />
Figure 58.<br />
0 1<br />
Kilometre<br />
Sandbank<br />
20<br />
Holy<br />
Loch<br />
N<br />
19<br />
11<br />
23<br />
14<br />
8 A<br />
B<br />
Ardnadam<br />
3<br />
15<br />
17<br />
Dunoon<br />
Location of Holy Loch within Scotland, and<br />
positions of sampling sites<br />
16<br />
Kilmun<br />
C<br />
2<br />
Strone<br />
Point<br />
Firth<br />
of<br />
Clyde<br />
Table 10. Concentration of trace metals in Holy Loch sediments (mg kg -1 dry weight)<br />
Sampling<br />
Station<br />
Depth<br />
(cm)<br />
Cd Cr Cu Mn Ni Pb Zn Hg<br />
(µg kg -1 )<br />
A 0-5 0.34 266 111 305 47 257 458 1,150<br />
B 0-5 0.30 222 85 276 42 223 353 872<br />
C 0-5 0.22 179 61 324 42 186 271 3,610<br />
2 0-5 0.22 206 66 378 42 217 299 1,010<br />
3 0-5 0.53 256 562 640 78 517 3,721 2,530<br />
3 5-10 0.96 307 1,566 1,051 145 996 6,527 3,950<br />
8 0-5 0.42 245 409 572 61 33 1,775 1,080<br />
8 5-10 0.33 258 451 517 63 385 1,875 1,320<br />
11 0-5 0.88 282 444 596 62 383 2,076 950<br />
11 5-10 1.01 286 412 463 62 388 1,180 950<br />
14 0-5 0.33 298 672 608 55 281 1,877 804<br />
14 5-10 0.43 379 1,102 596 68 396 3,200 950<br />
15 0-5 0.20 204 100 332 45 211 395 1,980<br />
15 5-10 0.27 223 83 324 48 246 374 992<br />
16 0-5 0.25 208 125 363 48 237 578 1,480<br />
16 5-10 0.31 260 153 448 52 292 743 1,200<br />
17 0-5 0.28 206 120 350 45 218 407 1,200<br />
17 5-10 0.28 198 82 328 48 272 397 1,060<br />
19 0-5 0.54 223 157 307 50 243 531 1,590<br />
20 0-5 0.40 124 70 265 37 136 251 807<br />
23 0-5 0.33 391 1,185 695 58 272 2,692 835<br />
23 5-10 0.52 479 1,683 656 67 300 4,089 784<br />
102
State<br />
Metals<br />
Sediment metal concentrations were very variable<br />
(see Table 10). The highest concentrations were at<br />
former positions of the US Navy Base, either before<br />
1972 (station 3) or after 1972 (stations 8, 14 and<br />
23). The pattern for copper and zinc is shown in<br />
Figure 59. Sediment contamination could not be<br />
compared to OSPAR BRCs because metal/aluminium<br />
ratios were not determined but contamination was<br />
described as severe at some sites compared to other<br />
areas (Bryan and Langston, 1992) (see Figure 60).<br />
The results were compared to the OSPAR<br />
Ecotoxicological Assessment Criteria (EACs) and<br />
sediment quality values (SQVs) in Table 11. OSPAR<br />
EACs are provisional values designed to identify<br />
areas of potential concern. SQVs derived by Long<br />
et al. (1995) for the US <strong>National</strong> Oceanographic<br />
and Atmospheric Administration (NOAA) and by<br />
Environment Canada (CCME, 1998) are shown for<br />
comparison. The percentages of sites where adverse<br />
biological effects on benthic infauna were predicted<br />
as ‘possible’ or ‘probable’, on the basis of these<br />
values, are shown in parenthesis. Comparison with<br />
EACs indicates that chromium, copper, mercury and<br />
lead concentrations at 95-100% of the sites were<br />
mg kg dry weight<br />
-1<br />
g kg dry weight<br />
-1<br />
2500<br />
2000<br />
1500<br />
1000<br />
500<br />
0<br />
4<br />
3<br />
2<br />
1<br />
0<br />
Figure 60.<br />
Max/min Mean Median<br />
"Typical"<br />
Holy Loch<br />
"Typical"<br />
Holy Loch<br />
"Contaminated"<br />
Holy Loch<br />
"Contaminated"<br />
Holy Loch<br />
Copper<br />
Clyde<br />
Sea Lochs<br />
Zinc<br />
Clyde<br />
Sea Lochs<br />
<strong>UK</strong> Estuaries<br />
Comparison of sediment copper and zinc<br />
concentrations<br />
Mining Areas<br />
Max/min Mean Median<br />
<strong>UK</strong> Estuaries<br />
Mining Areas<br />
2000<br />
Copper<br />
Depth<br />
0-5 cm<br />
5-10 cm<br />
7<br />
6<br />
Zinc<br />
mg kg dry weight<br />
-1<br />
1500<br />
1000<br />
500<br />
g kg dry weight<br />
-1<br />
5<br />
4<br />
3<br />
2<br />
1<br />
0<br />
20<br />
19<br />
11<br />
23 14 8<br />
B<br />
A<br />
17 15 3 16<br />
C<br />
2<br />
0<br />
20 19 11 23 14 8 B A 17 15 3 16 C 2<br />
µg kg -1 dry weight<br />
300<br />
200<br />
100<br />
0<br />
Total PCBs<br />
16 Organic matter<br />
14<br />
12<br />
% dry weight<br />
2<br />
20 19 11 23 14 8 B A 17 15 3 16 C 2<br />
0<br />
20 19 11 23 14 8 B A 17 15 3 16 C 2<br />
Sampling site<br />
Sampling site<br />
10<br />
8<br />
6<br />
4<br />
Figure 59.<br />
Concentrations of key parameters in Holy Loch sediments<br />
103
Table 11. OSPAR Ecotoxicological Assessment Criteria (EACs) and US and Canadian Sediment Quality Values (SQVs)<br />
Metal OSPAR EACs (mg kg -1<br />
dry wt)<br />
(percentage of<br />
sites above range)<br />
US and Canada SQVs<br />
(percentage of Holy Loch sites in each category)<br />
ISQG (a) ER-L (b) PEL (a) ER-M (b)<br />
Cadmium 0.1-1<br />
(5)<br />
Chromium 10-100<br />
(100)<br />
Copper 5-50<br />
(100)<br />
Mercury 0.05-0.5<br />
(100)<br />
Nickel 5-50<br />
(50)<br />
Lead 5-50<br />
(95)<br />
Zinc 50-500<br />
(59)<br />
Unlikely Possible if >ER-L Probable if >PEL Very Probable if<br />
>ER-M<br />
0.7<br />
(100)<br />
1.2<br />
(0)<br />
52.3 81<br />
(7)<br />
18.7 34<br />
(36)<br />
4.2 9.6<br />
160<br />
(86)<br />
108<br />
(29)<br />
370<br />
(7)<br />
270<br />
(36)<br />
0.13 0.15 0.7 0.71<br />
(100)<br />
30.2<br />
(7)<br />
124 150<br />
(7)<br />
Data as mg kg -1 dry weight from (a) CCME, 1998 and (b) Long et al.,1995.<br />
21<br />
(64)<br />
47 112<br />
(36)<br />
271<br />
(36)<br />
52<br />
(36)<br />
220<br />
(57)<br />
410<br />
(57)<br />
sufficiently high to cause concern. Comparison with<br />
SQVs indicates that adverse effects were ‘probable’<br />
at 86% of sites for chromium, ‘very probable’ at<br />
100% of sites for mercury and at 57% of sites for<br />
lead and zinc. These considerations do not account<br />
for the additive toxic effects of metals, nor for<br />
acclimation by local species.<br />
These results suggest that the sediments should not<br />
be dredged, since this may cause the metals to be<br />
re-mobilised.<br />
Persistent organic pollutants<br />
PCBs were detected in all of the sediments and<br />
their distribution is shown in Figure 59. The highest<br />
concentrations were at stations 3 and 19. Higher<br />
PCB concentrations were measured in the 5-10<br />
cm layer than in the 0-5 cm layer. The congener<br />
patterns were similar at each site, suggesting a<br />
common origin.<br />
Concentrations of PCBs in Holy Loch sediments<br />
were similar to those for other Clyde sea lochs such<br />
as the Gareloch and were typical of coastal waters<br />
close to an industrialised estuary (SEPA unpublished<br />
data; Kelly and Campbell, 1995; CEFAS, 1997) (see<br />
Figure 61).<br />
The OSPAR EAC range for the sum of the ICES<br />
seven CB congeners is 0.001-0.01 mg kg -1 dry<br />
weight (OSPAR, 2000). Sediment Quality Values<br />
have also been developed for ‘total’ PCBs (2.5 x<br />
the sum of the ICES 7 congeners), and these are<br />
summarised in Table 12 (Miller et al., 2000). The<br />
µg uk PCB as ICES7C<br />
-1<br />
160<br />
140<br />
120<br />
100<br />
80<br />
60<br />
40<br />
20<br />
0<br />
Clyde<br />
Estuary<br />
Figure 61.<br />
Firth<br />
of Clyde<br />
Holy Loch<br />
Mersey<br />
Estuary<br />
Humber<br />
Estuary<br />
Comparison of PCBs in Holy loch sediments<br />
with other <strong>UK</strong> areas<br />
Tyne<br />
Estuary<br />
guidelines derived by Wells et al. (1989) do not<br />
account for sediment-bound organic carbon,<br />
whereas those derived by the Florida Department of<br />
Environmental Protection (FDEP, 1994) and by the<br />
Joint <strong>Monitoring</strong> Group (JMG) of the Oslo and Paris<br />
Commission (Fleming et al., 1995) are normalised to<br />
1% total organic carbon.<br />
The PCB concentrations in Holy Loch sediments<br />
exceeded the OSPAR EAC range at all sites. Using<br />
the guidelines (Wells et al., 1989), the sediments<br />
were classed as ‘contaminated’ or ‘heavily<br />
contaminated’ by PCBs. Concentrations exceeded<br />
the FDEP threshold effects level and the JMG ‘no<br />
biological effects’ level, but none exceeded the<br />
FDEP probable effects level.<br />
104
Table 12. Summary of Sediment Quality Values for PCBs<br />
Origin of Sediment Guideline Description of Sediment Guideline PCBs Concentration<br />
(µg kg -1 dry sediment as Arochlor 1254)<br />
Wells et al., 1989<br />
FDEP<br />
JMG<br />
No contamination<br />
Slightly contaminated<br />
Contaminated<br />
Heavily contaminated<br />
Threshold effects level<br />
Probable effects level<br />
100<br />
21.6<br />
189<br />
Concentration below which biological<br />
effects are unlikely 1-10<br />
Impact<br />
Sensitive site-specific Microtox and oyster embryo<br />
bioassay toxicity tests were used to assess the risk<br />
from contaminated sediments.<br />
The Microtox test is quantitative to the toxicant<br />
concentration. Sediment elutriates were found<br />
to be non-toxic to Microtox bacteria. The results<br />
for exposure times of 5, 15 and 30 min. showed<br />
median levels of bioluminescence inhibition of<br />
only about 10% for each sediment elutriate<br />
concentration (1, 10 and 100 g l -1 ).<br />
The oyster embryo bioassay is sensitive and is<br />
recommended for monitoring (MPMMG, 1994). The<br />
percentage normal embryo development was very<br />
high, typically 80-90%, with median values close to<br />
85%. Results for the Holy Loch samples were similar<br />
to embryo development in Cape Wrath and Holy<br />
Loch reference seawater, whose mean values were<br />
respectively 91% and 93%, demonstrating that the<br />
sediment elutriates were not toxic.<br />
These tests suggest that acute water column toxicity<br />
would be unlikely were sediments to be mobilised<br />
during the lifting of debris.<br />
Long-term effects on local flora and<br />
fauna<br />
Bioaccumulation of contaminants was assessed<br />
by analysing batches of the common mussel<br />
Mytilus edulis (L.) before and after winter removal<br />
operations. Mussels were collected monthly at six<br />
stations and a control site. Metals and organics<br />
concentrations in the mussels were low, with no<br />
significant changes during the initial period of<br />
debris removal from October 1987 to March 1988<br />
(Miller et al., 2000).<br />
Although sediment contaminants posed a risk to<br />
local fauna, toxicity tests showed that sediment<br />
elutriates were non-toxic to the test organisms. The<br />
absence of toxicity indicates that the contaminants<br />
were not released into the overlying water column<br />
when the sediments were disturbed. This was<br />
confirmed by the long term monitoring of mussels<br />
in the Loch.<br />
Response<br />
Debris removal was completed after the winter<br />
of 2001/2. The Holy Loch remains a scenic area<br />
suitable for tourism, and it is anticipated that<br />
trawling for commercial fish species will resume.<br />
References<br />
Bryan, G.W. and Langston, W.J., 1992.<br />
Bioavailability, accumulation and effects<br />
of heavy metals in sediments with special<br />
reference to United Kingdom estuaries: a review.<br />
Environmental Pollution 76, 89-131.<br />
CCME, 1998. Canadian sediment quality guidelines<br />
for the protection of aquatic life: Introduction and<br />
Summary tables. In: Canadian sediment quality<br />
guidelines, 1998, Canadian Council of Ministers of<br />
the Environment, Winnipeg.<br />
CEFAS, 1997. <strong>Monitoring</strong> and surveillance of<br />
non-radioactive contaminants in the aquatic<br />
environment and activities regulating the disposal<br />
of wastes at sea, 1994. Aquatic Environmental<br />
<strong>Monitoring</strong> Report No. 47, CEFAS, Lowestoft.<br />
59pp.<br />
ERM, 1997. Holy Loch Environmental Assessment.<br />
Sediment Quality Investigation Interpretative<br />
Report. Project No: 08431. Final Report. January<br />
1997.<br />
FDEP, 1994. Approach to the Assessment of<br />
Sediment Quality in Florida Coastal Waters.<br />
Volume 1 - Development and Evaluation of<br />
Sediment Quality Assessment Guidelines.<br />
Florida Department of Environmental Protection,<br />
Tallahassee, Florida. pp 126.<br />
Fleming, R., Johnson, I., Delaney, P. and Reynolds,<br />
P., 1995. Freshwater Sediment Assessment -<br />
Scoping Study. SNIFFER Report No.SR3931.<br />
105
Kelly, A.G. and Campbell, L.A., 1995. Persistent<br />
Organochlorine Contaminants in the Firth of<br />
Clyde in Relation to Sewage Sludge Input. <strong>Marine</strong><br />
Environmental Research, 41 (1), 99-132.<br />
Long, E.R., Macdonald, D.D., Smith, S.L. and Calder,<br />
F.D., (1995). Incidence of adverse biological<br />
effects within ranges of chemical concentrations<br />
in marine and estuarine sediments. Environmental<br />
Management, 19, 81-97.<br />
Miller, B.S., Pirie, D.J. and Redshaw, C.J., 2000. An<br />
Assessment of the Contamination and Toxicity<br />
of <strong>Marine</strong> Sediments in the Holy Loch, Scotland.<br />
<strong>Marine</strong> Pollution Bulletin, 40 (1), 22-35.<br />
MPMMG, 1994. <strong>Marine</strong> Pollution <strong>Monitoring</strong><br />
Management Group. <strong>Monitoring</strong> Co-ordination<br />
Sub-group. <strong>UK</strong> <strong>National</strong> <strong>Monitoring</strong> Plan. HMIP,<br />
London. 39pp.<br />
OSPAR, 2000. Background Reference<br />
Concentrations (BRCs) and Ecotoxicological<br />
Assessment Criteria (EACs). MON 00/5/Info.4-E.<br />
London.<br />
Wells, D.E., Kelly, A., Findlayson, D.M., Eaton, S.,<br />
Robson, J., and Campbell, L., 1989. Report of<br />
the survey for PCB contamination following the<br />
Piper Alpha incident. SOAFD <strong>Marine</strong> Laboratory,<br />
Aberdeen. 9-10.<br />
106
16. THE NMMP AND MONITORING SPECIAL AREAS OF CONSERVATION<br />
In 1992 the European Community adopted Council<br />
Directive 92/43 EEC on the Conservation of natural<br />
habitats and of wild fauna and flora (the Habitats<br />
Directive) which aims to conserve Nature within<br />
all territory of the European Union. It requires<br />
that Member States designate Special Areas of<br />
Conservation (SACs) for specified habitats and<br />
habitats of specified species of plants and animals.<br />
This Directive applies to seas of the European Union<br />
out to 200 nautical miles. Figure 62 shows the<br />
proposed <strong>UK</strong> marine SACs proposed for their habitat<br />
features. SACs are also proposed for common<br />
and grey seals, and bottlenose dolphins. Work<br />
is underway to identify offshore SACs. Member<br />
States must report to Europe on the status of the<br />
designated habitats and species every six years.<br />
SAC monitoring<br />
The <strong>UK</strong> government’s statutory nature conservation<br />
agencies (English Nature, Countryside Council for<br />
Wales, Scottish Natural Heritage, and Environment<br />
and Heritage Service Northern Ireland) have<br />
developed an integrated and consistent approach<br />
to assess designated sites. The <strong>Marine</strong> <strong>Monitoring</strong><br />
Handbook (Davies et al., 2001) guides the<br />
monitoring of features within marine SACs.<br />
The desired state is defined in terms of objectives or<br />
targets, and site monitoring assesses whether these<br />
objectives are met. Site monitoring is distinct from<br />
surveillance, which repeats surveys with a standard<br />
methodology to provide a series of observations.<br />
Surveillance may yield valuable information on<br />
trends in biodiversity and physical features but<br />
may not by itself reveal whether objectives or<br />
standards have been met. The <strong>UK</strong> <strong>National</strong><br />
<strong>Marine</strong> <strong>Monitoring</strong> <strong>Programme</strong> is an example of<br />
a surveillance programme. Such information may<br />
form part of an assessment when combined with<br />
objective or standard setting.<br />
Sandbanks<br />
Estuaries<br />
Mudflats<br />
Lagoons<br />
Inlets & bays<br />
Reefs<br />
Caves<br />
Figure 62.<br />
<strong>UK</strong> marine candidate Special Areas of Conservation with their<br />
designated features. Symbols do not represent the relative<br />
proportions of each feature<br />
107
Each interest feature has measurable characteristics<br />
or attributes that indicate its condition. They<br />
may be quantitative (e.g. extent), qualitative (e.g.<br />
biotope composition) or descriptive of physical or<br />
environmental processes (e.g. salinity regime) that<br />
support the feature. Targets set for these attributes<br />
give upper or lower thresholds outside which<br />
the condition is deemed unfavourable. Routine<br />
surveillance may be compared with these targets,<br />
which are intended to trigger management action:<br />
if a target is not met, this prompts investigation of<br />
site management and whether current activities<br />
need changing. The valid interpretation of condition<br />
monitoring may also require contextual information,<br />
perhaps from a wider geographical area or longer<br />
time scales. It is important to attribute observed<br />
change correctly to local activity on a site, or to<br />
inherent variability, or to a nationwide trend caused<br />
by some other factor such as climate change.<br />
<strong>Marine</strong> SAC features need frequent surveillance in<br />
future to reveal their inherent variation, to detect<br />
important changes, to judge better the aptness<br />
of existing targets, or to define new target values<br />
for those attributes lacking many data. Existing<br />
surveillance programmes, such as the NMMP, thus<br />
contribute significantly to the SAC programme,<br />
providing data where sites fall within the SAC<br />
boundary and also wider contextual information.<br />
The NMMP assesses the distribution and biological<br />
impact of contaminants. A large proportion of sites<br />
lies in contaminated estuaries with some reference<br />
sites in uncontaminated areas. Benthic faunal data<br />
are the only directly relevant biological community<br />
information collected by the NMMP but water<br />
quality, bioaccumulation and biological effects data<br />
help the wider contextual description. Seventeen<br />
percent of NMMP stations fall within a marine SAC.<br />
Uses of NMMP data<br />
The use of data for SAC monitoring depends on the<br />
location of the NMMP station in relation to a SAC.<br />
There are three possibilities:<br />
NMMP sediment station within a SAC<br />
with sediment features<br />
Where a NMMP biological station lies within a<br />
sediment feature of a SAC, the NMMP data may<br />
be used directly in the assessment of feature<br />
condition. Historical data may inform target<br />
values for attributes measuring the species<br />
composition, or may reveal the acceptable range<br />
of historical variability. Future NMMP data may<br />
also illuminate changes or trends within the SAC<br />
interest feature.<br />
NMMP stations within SACs<br />
NMMP benthic community stations within a<br />
SAC not designated for a sediment feature do<br />
not contribute directly to feature assessment<br />
but nevertheless provide a valuable context. For<br />
example, changes observed by the NMMP of<br />
sediment habitats within an SAC designated only<br />
for its reef feature might mirror changes seen on<br />
the reef feature. The NMMP might thus inform<br />
or explain indirectly changes or trends within the<br />
interest features or it may provide an early warning<br />
in condition assessment that the condition has<br />
changed. NMMP stations measuring chemical<br />
and biological effects parameters within a SAC<br />
contribute data on anthropogenic pressures and<br />
any of their trends. Adverse trends in these variables<br />
may help explain any failure of a designated feature<br />
to meet its target, and provide information to<br />
identify appropriate management action.<br />
NMMP stations outside SACs<br />
Data from NMMP stations outside existing SACs<br />
provide a valuable context of regional or national<br />
biological or chemical trends that may lie behind<br />
changes within a single SAC, or in a feature<br />
common to several SACs: for example if a sediment<br />
feature in all SACs in a region were to have failed<br />
to meet its target. Alternatively, the overall status<br />
of a feature at <strong>UK</strong> level may be compared with<br />
national trends in the NMMP data to help ensure a<br />
consistency of judgements at the national level.<br />
Reporting<br />
Regular NMMP reporting provides an early warning<br />
mechanism for the planning of SAC monitoring. It<br />
helps identify any local trends within the six-yearly<br />
SAC monitoring cycle, enabling precautionary<br />
management.<br />
Conclusion<br />
The NMMP makes a useful contribution to the<br />
monitoring of SACs under the Habitats Directive<br />
directly via the provision of data, and indirectly<br />
with contextual information on local, regional and<br />
national trends in biological and chemical parameters<br />
Contextual information from other biological<br />
surveillance programmes gives the <strong>UK</strong> conservation<br />
agencies confidence that the attributes they have<br />
identified describe the status of the feature, that the<br />
targets are appropriate and that they take account<br />
of natural variation. Contextual information also<br />
helps to compare local and national trends, to<br />
explain changes and to ensure consistency of<br />
judgements at the national level.<br />
108
Reference<br />
Davies, J., Baxter, J., Bradley, M., Connor, D., Khan,<br />
J.,Murray, E., Sanderson, W., Turnbull, C. and<br />
Vincent, M., 2001. <strong>Marine</strong> <strong>Monitoring</strong> handbook,<br />
Joint Nature Conservation Committee.<br />
109
17. THE SEA EMPRESS OIL SPILL<br />
Driving force<br />
Milford Haven Waterway developed in the 1960s<br />
as a major oil terminal and processing site. The<br />
handled volume of oil and associated products<br />
rose steadily to a peak of 60 million tonnes in 1974<br />
(Figure 63). Annual cargo passing through the<br />
waterway fell as the production of North Sea oil<br />
reached a peak in the 1980s but it still exceeded 32<br />
million tonnes in 1990.<br />
Cargo handled (10 tonnes)<br />
6<br />
60<br />
50<br />
40<br />
30<br />
20<br />
10<br />
0<br />
Figure 63. Oil handled in Milford Haven: 1961 to 1990<br />
(Milford Port Authority)<br />
Pressure<br />
1965<br />
1970<br />
An inevitable hazard is the danger of oil spills.<br />
Between 1961 and 1990 the annual average was<br />
39 spills, although most were small usually with less<br />
than 50 tonnes spilled (Hobbs and Morgan, 1992).<br />
The mean annual quantity spilled from tankers<br />
is estimated to be about 14.5 tonnes, compared<br />
with 180 tonnes from other effluents. Overall, no<br />
more than an estimated average 240 tonnes of oil<br />
enters the waterway annually, most well dispersed<br />
in water and already associated with suspended<br />
particles (Little et al., 1987).<br />
1975<br />
1980<br />
1985<br />
1990<br />
In February 1996, 72000 tonnes of crude oil and<br />
480 tonnes of heavy fuel oil were released when<br />
the Sea Empress ran aground at the mouth of<br />
the Milford Haven Waterway. Most of the oil was<br />
released over four days, generally on ebbing tides<br />
and in northerly winds. These combined to carry<br />
the oil offshore into deeper water where over<br />
400 tonnes of chemical dispersants were used to<br />
disperse the oil. After a further five days the wind<br />
veered to the Southwest and the remaining slick<br />
was driven on to the coast. In all, oil contaminated<br />
about 200 km of Pembrokeshire coastline from<br />
Skomer Island to Pendine Sands in Carmarthen<br />
Bay and penetrated the Haven as far as Pembroke<br />
(Figure 64).<br />
It is estimated that up to 40% of the oil evaporated<br />
soon after release and that approximately 50%<br />
dispersed into the water column as a result of<br />
natural mixing and the spraying of dispersants. A<br />
further 2% was recovered from the sea surface.<br />
Of the 7% of the oil that came ashore much was<br />
removed by clean-up and natural remediation.<br />
State<br />
Water<br />
Approximately 38% of the spilled oil dispersed<br />
as a result of dispersants, while a further 14%<br />
dispersed naturally (SEEEC, 1998). Following the<br />
spill a maximum total hydrocarbon concentration<br />
of 10 mg l -1 was recorded in the water near the<br />
grounding site compared with pre-spill levels of<br />
5–53 µg l -1 within the Haven. Within six weeks<br />
N<br />
1 10<br />
Kilometres<br />
Extent of surface oil<br />
Coastline effected by oiling<br />
St David's<br />
Head<br />
Skomer Is.<br />
Sea Empress<br />
Angle Bay<br />
Tenby<br />
Pendine<br />
Sands<br />
Three<br />
Rivers<br />
Burry<br />
Inlet<br />
Rhossili<br />
Port Eynon Pt.<br />
Bristol Channel<br />
Figure 64.<br />
Extent of the oil at sea and the coastline affected by oiling. Variability in<br />
severity of the slick and shoreline contamination means this map is merely a<br />
rough guide<br />
110
Total hydrocarbons (mg kg )<br />
-1<br />
1200<br />
900<br />
600<br />
300<br />
Oct 93<br />
Mar 96<br />
Oct 96<br />
Apr 97<br />
Oct 97<br />
Oct 98<br />
Sep 00<br />
0<br />
Figure 65.<br />
* *<br />
Upper Haven Middle Haven Angle Bay Lower Haven Off St Ann’s Head<br />
Average total hydrocarbon concentrations in sediments from the Milford<br />
Haven Waterway between October 1993 and September 2000. (* = no samples)<br />
levels had fallen below 100 µg l -1 over most of<br />
the affected area and by June 1996 had returned<br />
to background levels of between 1 and 10 µg l -1<br />
(SEEEC, 1998).<br />
Sediment<br />
Pre-spill hydrocarbon concentrations increased<br />
into the Haven (Rostron, et al., 1986; McLaren and<br />
Little, 1987; Little and McLaren, 1989) as a result<br />
of the dominant flood tide carrying fine particles<br />
and associated contaminants up the waterway<br />
(McLaren and Little, 1987). After the Sea Empress<br />
spill, hydrocarbon contamination was evident in<br />
the lower reaches of the waterway and Angle Bay<br />
with order of magnitude increases in sediments<br />
one month afterwards (Figure 65). No appreciable<br />
differences in hydrocarbon levels before and after<br />
the spill were apparent elsewhere, although in<br />
March 1996 there was a sheen of oil on sediments<br />
collected from all sites other than the uppermost<br />
part of the Haven (Levell et al., 1997). By Spring<br />
1997 concentrations were similar to those before<br />
the spill, with degraded and combustion-derived<br />
hydrocarbons predominating over those derived<br />
from crude oil (Hobbs, 1998).<br />
Biota<br />
Hydrocarbon concentrations in mussels in the most<br />
impacted areas rose rapidly to approximately 2500<br />
mg kg -1 total hydrocarbon content (THC) and 1000<br />
mg kg -1 polycyclic aromatic hydrocarbons (PAH) one<br />
week after the grounding (Dyrynda et al., 1997).<br />
Within three months they had reduced - especially<br />
PAH concentrations which fell by over 90%. THC<br />
concentrations in whelks taken in Carmarthen<br />
Bay were up to 40000 µg kg -1 and 3800 µg kg -1<br />
PAH, although variable, indicating localised seabed<br />
contamination (SEEEC, 1998). PAH concentrations of<br />
86 µg kg -1 were detected in limpets from the mouth<br />
of Milford Haven two weeks after the spill (Glegg et<br />
al., 1999). Over the following seven months these<br />
levels fell by several orders of magnitude to near<br />
background levels.<br />
Despite the amount of oil spilled from the Sea<br />
Empress and the sensitivity of the contaminated<br />
ecosystems, long-term effects appear small.<br />
Impact<br />
Water<br />
There were three oyster embryo bioassays of water<br />
samples from various sites in the Haven within<br />
two weeks of the spill. There were low level toxic<br />
effects in samples from the upper Haven within one<br />
week of the spill, although none after two weeks<br />
(Environment Agency, 1997).<br />
Sediments<br />
The macrobenthic fauna of the Milford Haven<br />
Waterway was studied periodically until the<br />
early 1990s, with regular monitoring after the<br />
grounding of the Sea Empress in 1996. Generally,<br />
benthic communities showed little impact of oil<br />
contamination, although there was some change<br />
at population level (SEEEC, 1998). There was a<br />
decline in amphipod fauna throughout the Haven,<br />
particularly in the middle and lower reaches, with<br />
the genera Ampelisca and Harpinia and the family<br />
Isaeidae particularly affected. This was accompanied<br />
by increases in abundance of opportunist<br />
polychaete populations as individual species took<br />
advantage of the decline of the amphipod fauna<br />
(Figure 66). Within five years of the spill the<br />
amphipod fauna was clearly re-established and the<br />
abundance of opportunists had returned to pre-spill<br />
levels (Nikitik, 2001).<br />
111
Amphipod abundance (m )<br />
-2<br />
2000<br />
1500<br />
1000<br />
500<br />
0<br />
(i) Upper Haven<br />
1993 1996 1997 1998 2000<br />
1000<br />
800<br />
600<br />
400<br />
200<br />
0<br />
3000<br />
2000<br />
1000<br />
0<br />
(ii) Middle Haven<br />
1993 1996 1997 1998 2000<br />
8000<br />
6000<br />
4000<br />
2000<br />
0<br />
Opportunist abundance (m )<br />
-2<br />
Amphipod abundance (m )<br />
-2<br />
600<br />
400<br />
200<br />
0<br />
(iii) Angle Bay<br />
1993 1996 1997 1998 2000<br />
8000<br />
6000<br />
4000<br />
2000<br />
0<br />
600<br />
400<br />
200<br />
0<br />
(iv) Lower Haven<br />
1993 1996 1997 1998 2000<br />
2000<br />
1500<br />
1000<br />
500<br />
0<br />
Opportunist abundance (m )<br />
-2<br />
Opportunistic Polychaetes<br />
Amphipods<br />
Figure 66.<br />
Abundance of amphipods and opportunist species in the Milford Haven Waterway<br />
between October 1993 and September 2000.<br />
Biota<br />
After the spill, there were no obvious adult fish<br />
kills, but appreciable numbers of dead or moribund<br />
sediment-dwelling animals including cockles, striped<br />
Venus sp. and razor shells were washed ashore<br />
in following weeks (SEEEC, 1998). Also, 7 to 10<br />
weeks after the spill many thousands of moribund<br />
rayed trough shells stranded on the eastern side of<br />
Carmarthen Bay, outside the zone of heavy bulk<br />
oil pollution. The concentrations of hydrocarbons<br />
in some tissues indicate that these events were a<br />
consequence of the spill.<br />
Populations of salmonids (Roberts et al., 1998a<br />
& b). and seabass were not affected by the spill<br />
(Lancaster et al., 1998) and there was no significant<br />
impact on plankton in the southern Irish Sea<br />
(Batten et al., 1998). In the aftermath, about seven<br />
thousand oiled birds of some thirty six species<br />
were recovered, although the total number killed is<br />
probably much greater. Of these, over 90% were<br />
common scoters, razorbills and guillemots, with<br />
other diving species commonly affected. During<br />
the subsequent breeding season guillemot numbers<br />
reduced by 13% and razorbills by 7%, although by<br />
the 1997 breeding season numbers of both species<br />
had recovered significantly (SEEEC, 1998).<br />
Response<br />
Following the Sea Empress spill, clean-up involved<br />
physical removal of bulk oil from beaches, beach<br />
washing, onshore use of dispersants and sorbents,<br />
and offshore use of booms, mechanical recovery<br />
and chemical dispersants.<br />
Immediately after the incident formal fishing<br />
controls were put in place under the Food<br />
and Environmental Protection Act (FEPA). The<br />
designated area covered about 2000 km 2 of coastal<br />
water and included all entering freshwater rivers<br />
and streams. Restrictions were removed in stages<br />
once monitoring showed that concentrations of<br />
hydrocarbons and PAH in edible tissues posed no<br />
further risk to consumers and that the relevant<br />
species were free of taint. Controls on fish, cockle<br />
beds and crustacea were removed respectively<br />
within 3, 7 and 8 months. The restrictions covering<br />
intertidal mussels in the south east area of the<br />
closure area and oysters within Milford Haven were<br />
removed relatively slowly and last, after 19 months.<br />
In contrast, some shellfisheries were closed for<br />
seven years following both the Amoco Cadiz and<br />
Braer spills.<br />
112
References<br />
Batten, S.D., Allen, R.J.S. and Wotton, C.O.M.,<br />
1998. The effects of the Sea Empress oil spill on<br />
the plankton of the southern Irish Sea. <strong>Marine</strong><br />
Pollution Bulletin, 36(10), 764-774.<br />
Dyrynda, E.A., Law, R.J., Dyrynda, P.E.J., Kelly,<br />
C.A., Pipe, R.K., Graham, K.L., and Ratcliffe, N.A.,<br />
1997. Modulation in cell-mediated immunity of<br />
Mytilus edulis following the ‘Sea Empress’ oil spill.<br />
Journal of the <strong>Marine</strong> Biological Association of the<br />
United Kingdom, 77 281-284.<br />
Environment Agency, 1997. Sea Empress<br />
environmental monitoring. Version II. Data to<br />
May 1997. Environment Agency, Welsh Region,<br />
Haverfordwest.<br />
Glegg, G.A., Hickman, L. and Rowland, S.J.,<br />
1999. Contamination of limpets (Patella vulgata)<br />
following the Sea Empress oil spill. <strong>Marine</strong><br />
Pollution Bulletin, 38(2), 119-125.<br />
Hobbs, G., 1998. Macrobenthic monitoring in<br />
Milford Haven and the adjacent coastal waters<br />
following the Sea Empress oil spill of February<br />
1996. Report to the Environment Agency from<br />
OPRU/CORDAH. Report No. OPRU/29/97.<br />
Hobbs, G. and Morgan, C.I., 1992. A review of the<br />
current state of environmental knowledge of the<br />
Milford Haven Waterway. A report from the Field<br />
Studies Council Research Centre commissioned<br />
by the Milford Haven Waterway Environmental<br />
<strong>Monitoring</strong> Steering Group. pp. 140. FSC Report<br />
No. FSC/RC/5/92.<br />
Lancaster, J.E., Pawson, M.G., Pickett, G.D. and<br />
Jennings, S., 1998. The impact of the ‘Sea<br />
Empress’ oil spill on seabass recruitment. <strong>Marine</strong><br />
Pollution Bulletin, 36(9), 677-688.<br />
Levell, D., Hobbs, G., Smith, J. and Law, R.J., 1997.<br />
The effects of the Sea Empress oil spill on the<br />
sub-tidal macrobenthos of the Milford Haven<br />
Waterway: a comparison of the survey data from<br />
October 1993 and October 1996. Report to the<br />
Environment Agency from OPRU/CORDAH. Report<br />
No. OPRU/22/97.<br />
Little, D.I., Howells, S.E., Abbiss, T.P. and Rostron,<br />
D., 1987. Some factors affecting the fate of<br />
estuarine sediment hydrocarbons and trace metals<br />
in Milford Haven. In: (Eds. P.J. Coughtrey, M.H.<br />
Martin & M.H. Unsworth) Pollutant Transport and<br />
Fate in Ecosystems. Blackwell, Oxford. pp. 55-87.<br />
Little, D.I. and McLaren, P., 1989. Sediment and<br />
Contaminant transport in Milford Haven. In: (Ed. B.<br />
Dicks) Ecological Impact of the Petroleum Industry.<br />
John Wiley & Sons, London. pp203-234.<br />
McLaren, P. and Little, D.I., 1987. The effects of<br />
sediment transport on contaminant dispersal: an<br />
example from Milford Haven. <strong>Marine</strong> Pollution<br />
Bulletin, 18(11), 586-594.<br />
Nikitik, C., 2001. Patterns in the benthic populations<br />
in the Milford Haven Waterway following the ‘Sea<br />
Empress’ Oil Spill. Environment Agency, Welsh<br />
Region, St. Mellons. Report No. EASE/REP/01/06.<br />
Roberts, D.E., Jones, F.H., Wyatt, R.J. and Milner,<br />
N.J., 1998a. The impact of the Sea Empress oil spill<br />
on the abundance of juvenile migratory salmonids<br />
in West Wales. Environment Agency, Welsh<br />
Region, Llanelli. Report No. EA/M/10/A.<br />
Roberts, D.E., Jones, F.H., Wyatt, R.J. and Milner,<br />
N.J., 1998b. The impact of the Sea Empress oil spill<br />
on the abundance of adult migratory salmonids in<br />
West Wales. Environment Agency, Welsh Region,<br />
Llanelli. Report No. EA/M/8.<br />
Rostron, D.M., Little, D.I. and Howells, S.E., 1986. A<br />
study of the sediments and communities in Milford<br />
Haven, Wales. Oil & Chemical Pollution, 3, 131-<br />
166.<br />
SEEEC, 1998. The environmental impact of the Sea<br />
Empress Oil Spill. Final report of the Sea Empress<br />
Environmental Evaluation Committee. pp. 135.<br />
Stationery Office, London.<br />
113
18. LONG TERM TRENDS IN THE TYNE ESTUARY<br />
Driving force<br />
The Tyne estuary has been heavily modified,<br />
85% of its intertidal area has been reclaimed,<br />
the lower reaches were canalised in the 1850s<br />
and are dredged. The industrial heritage is typical<br />
of the region, with shipbuilding, mining, and<br />
discharges of waste and crude sewage from<br />
the expanding population. Commercial decline,<br />
increasing regulation and better sewage treatment<br />
have substantially reduced the discharges. The<br />
estuary is now affected by activities such as<br />
riverine regulation, wastewater discharge and<br />
fishing. Persistent pollutants such as TBT and PCBs<br />
remain, raising issues of dredging and riverside<br />
development.<br />
Pressure<br />
After 1980, sewage discharges were amalgamated<br />
and treatment was improved. By 2000 almost all<br />
discharges were pumped to Howdon STW in the<br />
lower estuary for secondary treatment, with UV<br />
added in 2002. These steps resulted in a smaller<br />
load from only one point. Numerous consented<br />
industrial discharges remain, but Howdon STW<br />
represents the largest organic load.<br />
There is a coastal net fishery for salmon, although it<br />
is impossible to determine the proportion of caught<br />
salmon originating in the Tyne. A net limitation<br />
order in 1992 reduced licence numbers, but catches<br />
fluctuated. Over 20 angling clubs and associations<br />
fish the river, mainly concentrating on game fishing.<br />
State<br />
The estuary is stratified to an extent that depends<br />
on tidal state, season and river flow but is most<br />
marked during neap tides and low river flows.<br />
With lower summer flows, salinity increases and<br />
the freshwater layer may be warmer than deeper<br />
saline water. Dissolved oxygen (DO) concentration is<br />
highest at the mouth and at the tidal limit, sagging<br />
in the middle-upper area. The surface (freshwater)<br />
DO is relatively high with a depression in the lower<br />
reaches because of the influence of the STW (Figure<br />
67). In warm dry conditions fish have died: the<br />
summers of 1995 and 1996 were the worst. These<br />
deaths were usually localised to a small reach.<br />
Sedimentary organic matter derived from terrestrial<br />
plant material, decaying marine phytoplankton and<br />
anthropogenic inputs such as sewage consumes<br />
oxygen from the water via the sediment oxygen<br />
110<br />
88<br />
Surface<br />
DO percentage<br />
66<br />
44<br />
Middle<br />
Bottom<br />
22<br />
0<br />
HW<br />
Ebb<br />
110<br />
DO percentage<br />
88<br />
66<br />
44<br />
22<br />
LW<br />
Flood<br />
0<br />
30 20 10 0 30 20 10 0<br />
Distances from the mouth in kilometres<br />
Figure 67. DO levels in August 1996<br />
114
demand (SOD). In 1980-1982 the SOD was high,<br />
typically 0.5-0.9 gO 2<br />
m -2 h -1 throughout the middle<br />
reaches. It dropped to
4000<br />
Salmon<br />
Sea trout<br />
3000<br />
Numbers caught<br />
2000<br />
1000<br />
0<br />
1879<br />
1885<br />
1890<br />
1895<br />
1900<br />
1905<br />
1910<br />
1915<br />
1920<br />
1925<br />
1930<br />
1935<br />
1940<br />
1945<br />
1950<br />
1955<br />
1960<br />
1965<br />
1970<br />
1975<br />
1980<br />
1985<br />
1990<br />
1995<br />
2000<br />
Figure 72.<br />
Declared rod catches of migratory salmon and sea trout in the Tyne<br />
catchment<br />
NMMP3 in the lower estuary showed an<br />
insignificant increase in diversity, with a low 1997<br />
value caused by increase in one very ephemeral and<br />
opportunistic species, Capitella capitata. Much<br />
variability here was associated with fluctuations<br />
in C. capitata, despite transformation of the data<br />
to account for this in the MDS plots of Figure<br />
69. Decline in Ophyrotrocha spp. after 1994 and<br />
Tubificoides spp. after 1997 accounted for most of<br />
the remaining variability.<br />
Fish<br />
Numbers of returning salmonids have increased<br />
substantially, although in the early 1980s poor<br />
water quality still presented a partial barrier and in<br />
recent hot summers migratory fish have died in the<br />
upper reaches. Resident estuarine populations are<br />
not as diverse as similar regional estuaries.<br />
Records of rod catches for over a century have been<br />
based on fishing effort (Figure 72) and indicate<br />
population trends. This century, salmon catches<br />
peaked in the late 1920s. The 1930s fall and<br />
persistent low catches until the late 1960s were<br />
attributed to the barrier of poor water quality.<br />
Since 1979 the population has been supported by<br />
introductions from the salmon hatchery (EA, 1998).<br />
Further fish were introduced in addition to the<br />
mitigation stocking and, more recently, to compensate<br />
for deaths in the summers of 1995 and 1996.<br />
In the early 1970s the salmon and sea trout rod<br />
catches increased, more rapidly from 1985 to<br />
2000, the highest since the 1920s. It is impossible<br />
to distinguish the effect of the hatchery. Many<br />
more salmon were released than sea trout, yet<br />
both catches indicated a similar increase: it is clear<br />
that the driving force has been the improvement in<br />
water quality.<br />
Response<br />
Annual average measurements of DO have<br />
increased but sustained low values still present<br />
problems especially in the urbanised stretches. As<br />
the SOD decreases and DO levels rise in the water,<br />
conditions are expected to improve. The decline<br />
in fish populations previously linked to poor water<br />
quality (Harwood et al., 1997) is expected to reverse<br />
as reduced SOD reduces the stress and allows a<br />
greater diversity.<br />
References<br />
Harwood, K.G., Gill, M.E. and Frid, C.L.J., 1997.<br />
Temporal changes in fish abundance, species<br />
diversity and the health of flounder, Platichthys<br />
flesus, in the Tyne Estuary: implications for water<br />
quality monitoring. Report for the Environment<br />
Agency, NE Region.<br />
NRA, 1996. Tyne Estuary Investigation 1995:<br />
Report of the Tyne Estuary Group. <strong>National</strong> Rivers<br />
Authority, Northumbria Area, NE Region.<br />
EA, 1998. Tyne Salmon Action Plan. Environment<br />
Agency, NE Region.<br />
116
19. LONG TERM TRENDS IN THE TEES ESTUARY<br />
Driving force<br />
Large scale industry started in the Tees Estuary<br />
during the Industrial Revolution. Today, chemical,<br />
petrochemical and steel making industries play an<br />
important economic and social role in the area.<br />
As a consequence of industrialisation, patterns of<br />
human settlement were modified and important<br />
populations arose in the area. Today therefore,<br />
the estuary receives treated urban waste waters,<br />
nutrients of agricultural origin and industrial<br />
effluents. Industrial activity is likely to increase<br />
in the near future and pollution incidents occur<br />
frequently. The estuary is dredged regularly,<br />
with the risk of re-suspending contaminants.<br />
Nevertheless, biodiversity, aesthetics and<br />
recreational use must be preserved. The site<br />
qualifies as a Special Protection Area under the<br />
Habitats Directive (79/409/EEC) by supporting bird<br />
populations of European importance.<br />
Pressure<br />
The daily discharge from industrial processes and<br />
untreated domestic sewage reached more than 500<br />
tonnes of Biochemical Oxygen Demand (BOD) in<br />
1970. No dissolved oxygen was available for biological<br />
processes along many sections of the estuary and the<br />
lower stretch was virtually devoid of life.<br />
<strong>Programme</strong>s to improve water quality and to<br />
encourage the return of migratory fish to the river<br />
started in 1980. They included the commissioning<br />
of sewerage schemes, sewage treatment works,<br />
a reed bed and a sulphuric acid treatment plant<br />
commissioned by ICI at their Billingham site. As a<br />
consequence of the improvements, the discharge<br />
loads in 1998 were less than a quarter of those<br />
of 1970 (Figure 73). Efforts focused on reducing<br />
BOD and ammonia inputs. Ammonia levels, though<br />
substantially reduced, remained high enough for<br />
concern (Figure 74).<br />
These improvements in water quality significantly<br />
affected the biological populations: diversity and<br />
abundance increased substantially from the late 1970s<br />
to 1997 (Gray, 1976).<br />
The Tees Barrage reduced the estuarine extent in<br />
1995 from 40 km to 17 km. It substantially reduced<br />
dynamic energy in the system and increased<br />
stratification. In consequence, oxygen input from<br />
the upper layers was reduced in some stretches,<br />
silt deposited upstream of the barrage, while<br />
downstream sediments coarsened. Salt-water<br />
residence times increased and the salt wedge has<br />
penetrated further up the estuary (Riddle, 1977; Tapp<br />
et al., 1978; Riddle et al., 1996; Lewis et al., 1998).<br />
Tonnes per day<br />
90<br />
80<br />
70<br />
60<br />
50<br />
40<br />
30<br />
20<br />
10<br />
0 1970 80 90 94 95 97 98 99 2000 01<br />
Figure 74.<br />
Average daily load of ammonia released to<br />
the estuary between 1970 and 2001<br />
Site<br />
Easting Northing<br />
A Phillips Approach Buoy 454130 526370<br />
B No. 23 Buoy 453033 522477<br />
C Bamletts Bight 448419 522082<br />
A<br />
Tonnes (thousands) per annum<br />
200<br />
180<br />
160<br />
140<br />
120<br />
100<br />
80<br />
60<br />
40<br />
20<br />
0 1970 80 90 96 97 98 99 2000 01<br />
C<br />
B<br />
Figure 73.<br />
Biochemical Oxygen Demand (BOD) released<br />
to the estuary between 1970 and 2001<br />
Figure 75.<br />
Sampling stations in the Tees estuary<br />
117
State/Impact<br />
Ammonia and BOD<br />
Relocation of sewage discharges has had a major<br />
impact on water quality. Loads of organic material<br />
and associated BOD have decreased in the main<br />
channel, and dissolved oxygen levels remain<br />
mainly above 60% saturation (Figures 76 and<br />
77). Ammonia is no threat for biota, apart from at<br />
Redcar Jetty, where concentrations of un-ionised<br />
ammonia have periodically exceeded their EQS of<br />
21 µg l -1 .<br />
Biological populations<br />
Populations of migratory birds and infaunal<br />
invertebrates have declined on intertidal mudflats<br />
included within the Teesmouth and Cleveland<br />
Coast Special Protection Area since 1995 (Evans<br />
et al., 2000). Coverage (extension and thickness)<br />
of filamentous green algae (Enteromorpha spp.)<br />
has also increased over the last few years. It is not<br />
known if these changes relate to water or sediment<br />
quality or to effects of the Barrage on water<br />
dynamics and sediment deposition patterns (Evans<br />
et al., 2000).<br />
Oxygen (%) Ammonia (N) mg l -1<br />
9<br />
8<br />
7<br />
6<br />
5<br />
4<br />
3<br />
2<br />
1<br />
0<br />
120<br />
100<br />
80<br />
60<br />
40<br />
20<br />
0<br />
1990<br />
1990<br />
1991<br />
1991<br />
1992<br />
1992<br />
1993<br />
1993<br />
1994<br />
1994<br />
1995<br />
1995<br />
1996<br />
1996<br />
1997<br />
1997<br />
1998<br />
1998<br />
1999<br />
1999<br />
2000<br />
2000<br />
2001<br />
2001<br />
Figure 76.<br />
Ammonia and oxygen saturation, Phillips Buoy<br />
Ammonia (N) mg l -1 Ammonia (N) mg l -1<br />
16 (a)<br />
14<br />
12<br />
10<br />
8<br />
6<br />
4<br />
2<br />
0<br />
120 (b)<br />
100<br />
80<br />
60<br />
40<br />
20<br />
0<br />
1990<br />
1990<br />
1991<br />
1991<br />
1992<br />
1992<br />
1993<br />
1993<br />
1994<br />
1994<br />
1995<br />
1995<br />
1996<br />
1996<br />
1997<br />
1997<br />
1998<br />
1998<br />
1999<br />
1999<br />
2000<br />
2000<br />
2001<br />
2001<br />
Oxygen (%)<br />
Oxygen (%)<br />
120<br />
100<br />
80<br />
60<br />
40<br />
20<br />
0<br />
120<br />
100<br />
80<br />
60<br />
40<br />
20<br />
0<br />
1990<br />
1990<br />
1991<br />
1991<br />
1992<br />
1992<br />
1993<br />
1993<br />
1994<br />
1994<br />
1995<br />
1995<br />
1996<br />
1996<br />
1997<br />
1997<br />
1998<br />
1998<br />
1999<br />
1999<br />
2000<br />
2000<br />
2001<br />
2001<br />
Figure 77. Ammonia and oxygen saturation in water column: (a) Phillips Buoy and (b) Buoy 23<br />
118
Macrobenthos<br />
Biological diversity of infaunal invertebrates<br />
improved steadily between 1979 and 1985.<br />
Diversity declined during 1986-1988, followed by<br />
a recovery in 1989 that continued to 1990. Water<br />
quality improvement has improved the benthic<br />
biology of the estuary (Shillabeer and Tapp, 1989,<br />
1990; Tapp et al., 1993).<br />
Since 1992, subtidal invertebrate infaunal<br />
populations were sampled once a year at three<br />
sites (Figure 75). Total abundance of macrobenthic<br />
invertebrates, calculated on averaged replicates, at<br />
each site is graphically represented in Figures 78 and<br />
79 Other univariate statistics - a Pielou’s evenness<br />
(J) and Shannon-Wiener (H’) - were calculated on<br />
combined replicates and are represented in Figure<br />
80.<br />
NMMP1 (Philip’s Approach, Lower estuary)<br />
Abundance declined in 1995-1996, due to<br />
reduction in opportunistic, pollution tolerant<br />
species. Polydora ciliata is a very resilient,<br />
opportunistic species, often found in environments<br />
with high levels of nutrients and sewage. Diversity<br />
also declined in 1995-1996, to recover by 1998<br />
with increases in more specialised and less tolerant<br />
species.<br />
NMMP2 (Buoy 23, Mid-estuary)<br />
As at NMMP1, abundance declined in 1995-<br />
1996, mainly by falls in numbers of opportunistictolerant<br />
species (Polydora ciliata, Capitella capitata,<br />
Tubificoides pseudogaster and Tubificoides benedii).<br />
However, abundance remained high, averaging<br />
about 5000 individuals per sample. Diversity<br />
increased slightly but it was still higher than at<br />
NMMP1.<br />
Numbers<br />
25000<br />
20000<br />
15000<br />
10000<br />
5000<br />
0<br />
1992 1993 1994 1995 1996 1997 1998 1999 2000 2001<br />
Figure 78. Abundance in NMMP1 (Philip’s Approach)<br />
Numbers Numbers<br />
25000<br />
20000<br />
15000<br />
10000<br />
5000<br />
0<br />
25000<br />
20000<br />
15000<br />
10000<br />
5000<br />
Figure 79.<br />
(a)<br />
1992 1993 1994 1995 1996 1997 1998 1999 2000 2001<br />
(b)<br />
0<br />
1992 1993 1994 1995 1996 1997 1998 1999 2000 2001<br />
Abundance and diversity in (a) NMMP2 (Buoy<br />
23) and (b) NMMP3 (Bamlett’s Bight)<br />
NMMP3 (Bamlett’s Bight, upper estuary)<br />
Abundance has declined at this site since 1996.<br />
Values were still relatively high, with the exception<br />
of those of 2000. Diversity increased since 1992 and<br />
to become higher than at NMMP1 and NMMP2.<br />
Tees NMMP J'<br />
NMP 1 NMP 2 NMP 3<br />
Tees NMMP H'(log2)<br />
1.0<br />
0.8<br />
0.6<br />
0.4<br />
0.2<br />
0.0<br />
3.5<br />
3.0<br />
2.5<br />
2.0<br />
1.5<br />
1.0<br />
0.5<br />
0.0<br />
1992 1993 1994 1995 1996 1997 1998 1999 2000 2001<br />
1992 1993 1994 1995 1996 1997 1998 1999 2000 2001<br />
Figure 80.<br />
Shannon-Wiener and Pielou indices<br />
119
Classification analysis<br />
In view of the natural variability of salinity and<br />
temperature along the different sections of the<br />
estuary, the distribution (Figure 81) of samples in<br />
the graphical representation of Multi-dimensional<br />
Scaling (MDS) is typical of estuarine benthos.<br />
NMP 1 NMP 2 NMP 3<br />
Figure 81.<br />
98<br />
92<br />
9697<br />
95<br />
94<br />
01<br />
00<br />
94<br />
92<br />
01<br />
01<br />
00 00<br />
99 98 99<br />
97<br />
97<br />
98<br />
99<br />
96 96<br />
95<br />
95<br />
94 92<br />
Tees macrobenthos 1992-2001: Multidimensional<br />
Scaling (MDS)<br />
Stress: 0.08<br />
It is noteworthy that the polichaete Euchone sp.<br />
– one of the dominant species in the three sites over<br />
the last few years - is an alien, perhaps brought to<br />
the Tees with ballast water.<br />
These changes from 1992 to 2001 may relate to<br />
general improvements in water quality over the last<br />
thirty years. However, the Tees Barrage changed<br />
estuarine circulation, current speed, sedimentation<br />
patterns and salinity. These are the most<br />
important environmental parameters to determine<br />
macrobenthic community type. They seem to<br />
have been particularly affected in the intertidal<br />
areas of the lower estuary and may explain others’<br />
observations of decline in intertidal macrobenthic<br />
populations and migratory birds.<br />
The NMMP macrobenthic data suggest that, since<br />
1979, the improving trend in biological diversity of<br />
subtidal infaunal invertebrates in the Tees estuary<br />
has continued between 1992 and 2001. This more<br />
diverse macrobenthic community, less dominated<br />
by opportunistic species and with some sensitive<br />
species, reflects the improvements in water quality<br />
and, possibly, some of the effects of the Tees<br />
Barrage.<br />
References<br />
A trend may also be seen within the samples of<br />
each group. Recent samples form separate subgroups<br />
within the MDS plot: samples taken in<br />
2000 and 2001 are represented in the upper side<br />
of the plot, whereas the earliest ones (1992, 1994,<br />
1995) are closer to the bottom. Therefore, the<br />
horizontal axis represents lower estuary to upper<br />
estuary geographical variation, while the vertical<br />
axis shows the temporal variation. This represents a<br />
change from communities with higher abundance<br />
and lesser diversity - a few pollution-tolerant and<br />
opportunistic species reaching high densities - to<br />
less abundant and more diverse communities, with<br />
some less tolerant species.<br />
Response<br />
The decline in abundance of subtidal macrobenthic<br />
populations in 1995-1996 corresponded to a<br />
reduction in abundance of species that occur in<br />
great numbers in polluted areas. Thereafter, a<br />
more diverse and relatively stable macrobenthic<br />
community was established, with an increase<br />
from 1998-1999 in less pollution-tolerant species.<br />
This change was most noticeable in the lower<br />
estuary (NMMP1), with species that tolerate<br />
slight pollution but decrease as pollution increases<br />
- like Corophium volutator, Hydrobia ulvae and<br />
Cerastoderma edule (See also Warwick et al.,<br />
2002)..<br />
Evans et al., 2000. Preliminary Evaluation of the<br />
Results of the 1999 <strong>Monitoring</strong> <strong>Programme</strong>s<br />
related to the Nature Conservation Concerns<br />
arising from the River Tees Barrage and Crossing<br />
Act 1990.<br />
Gray, J.S., 1976. The Fauna of the Polluted River<br />
Tees Estuary. Estuarine and Coastal <strong>Marine</strong><br />
Science, 4, 653-676.<br />
Lewis, R.E., Riddle, A.M. and Lewis, J.O., 1998.<br />
Effect of a tidal barrage on currents and density<br />
structure in the Tees estuary. Physics of Estuaries<br />
and Coastal Seas, Dronkers & Schefflers (eds).<br />
Balkema, Rotterdam, ISBN 90 54 10 965 3.<br />
Riddle, A.M., 1977. Tees Bay Hydrography 1974-<br />
1976 and predictions of density circulation. ICI,<br />
Brixham Laboratory, BL/ B/1785<br />
Riddle, A.M., Lewis, J.O. and Sharpe, A.D., 1996.<br />
Tees Estuary Survey: An assessment of water<br />
quality. Brixham Laboratory, Zeneca Ltd. BL/5650/<br />
B.<br />
Shillabeer, N. and Tapp, J.F., 1989. Improvements<br />
in the Benthic fauna of the Tees Estuary after a<br />
period of Reduced Pollution Loadings. <strong>Marine</strong><br />
Pollution Bulletin Volume, 20, No. 3, pp 119-123<br />
Shillabeer, N. and Tapp, J.F., 1990. Long Term<br />
Studies of the benthic biology of Tees Bay and the<br />
Tees Estuary. Hydrobiologia, 195: 63-78.<br />
Tapp, J.F., Lewis, R.E., Taylor, D., 1978. Tees Bay:<br />
Hydrographical and Ecological <strong>Monitoring</strong> 1976-<br />
77. ICI, Brixham Laboratory. BL/B/1871.<br />
120
Tapp, J., 1993. Continued observations of the<br />
benthic fauna of the industrialised Tees Estuary,<br />
1979-1990. Journal of Experimental and <strong>Marine</strong><br />
Biological Ecology, 172 67-80.<br />
Warwick, R.M., Ashman, C.M., Brown, A.R.,<br />
Clarke, K.R., Dowell, B., Hart, B., Lewis, R.E.,<br />
Shillabeer, N., Sommerfield, P.J. and Tapp, J.F.,<br />
2002. Inter-annual changes in the biodiversity and<br />
community structure of the macrobenthos in Tees<br />
Bay and the Tees estuary, <strong>UK</strong>, associated with<br />
local and regional environmental events. <strong>Marine</strong><br />
Ecology Progress Series, Vol. 234: 1-13.<br />
121
20. RECOVERY OF THE THAMES ESTUARY<br />
Freshwater Brackish <strong>Marine</strong><br />
Barking<br />
Isle of Dogs<br />
City of Thames<br />
London London Barrier<br />
Brentford<br />
Bridge<br />
Fulham<br />
Barnes<br />
Putney<br />
Teddington Weir<br />
Lambeth<br />
Woolwich<br />
Greenwich<br />
Dartford<br />
Tunnel QEII Bridge<br />
Dartford<br />
Gravesend<br />
Canvey<br />
Island<br />
Isle of Grain<br />
Southend<br />
on Sea<br />
Sheerness<br />
Figure 82.<br />
The Thames Estuary<br />
Driving force<br />
The Thames estuary extends from the upstream<br />
tidal limit at Teddington, through central London,<br />
to Shoeburyness and into the North Sea (Figure<br />
82). The estuary receives wastewater from the large<br />
urban population of London and its industries. In<br />
1949, the Thames Survey Committee identified<br />
the need for improvements to the main sewage<br />
treatment works, and a government study in<br />
1951 concluded that the water quality should be<br />
improved to enable passage of migratory fish.<br />
Improvements to sewage treatment, diversion<br />
of some industrial effluents, and introduction<br />
of biodegradable detergents reduced organic<br />
loading after the 1950s to the present (Figure<br />
83). Anaerobic conditions were eliminated<br />
after completion of Crossness STW in 1964 and<br />
background dissolved oxygen levels continued to<br />
increase as Beckton STW provided full treatment.<br />
Further improvements were recorded as treatment<br />
was installed at tideway STWs. (Figure 84).<br />
Pressure/State<br />
In the nineteenth and twentieth centuries, major<br />
increases in industrialisation and urbanisation placed<br />
tremendous pressure on the water quality status of<br />
the estuary.<br />
Polution load (Tonnes d )<br />
-1<br />
1000<br />
800<br />
600<br />
400<br />
200<br />
0<br />
117<br />
Sewage effluent Industrial effluent<br />
881<br />
57<br />
762 34<br />
401 19 18<br />
170<br />
2<br />
129 116<br />
1950 1960 1970 1980 1990 2000<br />
Prior to 1800, records show that the estuary<br />
supported a good diversity of fish species, including<br />
a number of commercial fisheries, indicating that<br />
water quality was good.<br />
Industrialisation and urbanisation in the nineteenth<br />
and twentieth centuries increased the untreated<br />
wastewater discharge to the estuary. Development<br />
during the first half of the 20th Century raised<br />
polluting loads to the estuary dramatically. By<br />
the 1950s the combined effect of sewage and<br />
industrial effluents, thermal pollution from power<br />
stations and the introduction of non-biodegradable<br />
detergents placed tremendous pressure on the<br />
estuary so that it almost died for lack of oxygen in<br />
the water. Figure 83 illustrates the organic loading<br />
from the 1950s onwards. Between the 1950s and<br />
1960s, the middle reaches were completely devoid<br />
of oxygen during much of the summer (Figure 84).<br />
Anaerobic conditions associated with release of<br />
hydrogen sulphide occurred frequently. In the late<br />
1950s surveys found no established fish populations<br />
in a 70-kilometre length of river between Kew and<br />
Gravesend.<br />
Figure 83.<br />
Dissolved oxygen % air saturation<br />
100<br />
90<br />
80<br />
70<br />
60<br />
50<br />
40<br />
30<br />
20<br />
10<br />
Figure 84.<br />
Mogden STW<br />
Temporal organic load to the Thames Estuary<br />
1950<br />
1960<br />
1970<br />
1975<br />
1980<br />
1990<br />
2000<br />
Beckton STW<br />
Crossness STW<br />
0<br />
30 20 10 0 10 20 30 40 50 60<br />
Above<br />
Below<br />
Kilometres from London Bridge<br />
Longreach STW<br />
Temporal dissolved oxygen levels in the<br />
Thames Estuary<br />
122
Impact<br />
The serious deterioration in water quality in the<br />
nineteenth and first part of the twentieth centuries,<br />
and subsequent improvements since the 1950s have<br />
resulted in large-scale changes to the ecological<br />
status of the estuary, including its fish populations.<br />
Prior to 1800, there were substantial fisheries for<br />
a range of species across the whole estuary from<br />
Teddington to Southend and beyond. In the lower<br />
estuary below Gravesend, the major fisheries were<br />
for smelt, shrimp, whitebait, herring, flounder,<br />
sprat, sole, cockles, and oysters. Above that point<br />
there were large-scale fisheries for smelt, shad,<br />
whitebait, salmon, lamprey and flounder.<br />
Most of the fish and associated fisheries above<br />
Gravesend disappeared by the late 1830s with<br />
the advent of sewage pollution, and the last<br />
salmon was recorded in 1833. By 1849, fish had<br />
disappeared from the London reaches of the<br />
Thames, and temporary improvements in water<br />
quality towards the end of the nineteenth century<br />
were followed by a further deterioration in the early<br />
part of the twentieth.<br />
Fish began to appear on power station cooling<br />
water intake screens at West Thurrock and Tilbury<br />
after sewage treatment began in 1964. Early<br />
recovery was rapid with 56 species of fish by 1970<br />
and 100 by 1980. A salmon rehabilitation scheme<br />
began in 1978, with returning adults appearing by<br />
1983. A commercial eel fishery began below Tower<br />
Bridge in the same year. Up to 338 adult salmon<br />
have been recorded ascending the estuary in any<br />
one year. Today, the estuary supports 119 species<br />
of fish (Figure 85), representing the majority of<br />
available freshwater and marine species.<br />
In the past two decades, the estuary has become<br />
one of the largest sole nurseries in England and<br />
Wales as well as the largest new bass nursery in<br />
Cumulative Species No.<br />
140<br />
120<br />
100<br />
80<br />
60<br />
40<br />
20<br />
0<br />
1964<br />
1966<br />
1968<br />
1970<br />
1972<br />
1974<br />
1976<br />
1978<br />
1980<br />
1982<br />
1984<br />
1986<br />
Figure 85.<br />
1988<br />
1990<br />
1992<br />
1994<br />
1996<br />
1998<br />
2000<br />
Temporal trend in the number of fish species<br />
found in the Thames Estuary<br />
2002<br />
the southern North Sea. Spawning species include<br />
the common goby, smelt, sand-smelt, dace and<br />
sole. These have recently been joined by the sea<br />
lamprey. River lamprey have begun to recolonize<br />
the catchment and twaite shad numbers built<br />
up steadily in the lower estuary. These last three<br />
species have important implications for the Habitats<br />
Directive. Apart from the eel fishery, there are<br />
commercial fisheries for bass and grey mullet below<br />
Woolwich and whiting, sprat, whitebait and shrimp<br />
below Gravesend. Recreational fisheries for dace,<br />
roach, perch and bream exist in the upper estuary<br />
down to Battersea and for sea fish such as bass,<br />
grey mullet, flounder, eel and sole below Woolwich.<br />
The improvements started in the early 1960s<br />
brought rapid results. However, the recovery<br />
continues in more subtle ways. The smelt is now<br />
rare and threatened in Europe, reflecting its nature<br />
as a fastidious species, needing good water quality<br />
and clean subtidal gravels just above the saline<br />
wedge to spawn on. Smelt spend most of the<br />
year in the lower estuary below Gravesend. In<br />
March and April, waves of spawning fish ascend<br />
to spawn just below the low tide mark in the<br />
Wandsworth area. The ova, initially attached<br />
to the bed, shear off after 48 hours and move<br />
downstream. Hatching may take up to 28 days.<br />
By the time the fry are able to breast the current<br />
at 14 days old, they will have been taken down<br />
to Millwall, Greenwich and beyond. The fry then<br />
employ selective tidal stream transport to move<br />
upstream on flooding tides. Passage through the<br />
narrow reaches in the city is particularly fraught<br />
because of the poor refuge afforded in the margins<br />
on the fast moving ebb tide. By mid June the<br />
fry may be distributed across most of the estuary<br />
above the city and by late autumn, young may<br />
be found across the whole estuary. Smelt have a<br />
short life cycle, maturing at three years of age, and<br />
living for a further year or two. This life strategy, in<br />
combination with demanding quality requirements,<br />
mean that the species is liable to large population<br />
crashes.<br />
Response<br />
The Thames estuary is now one of the cleanest<br />
metropolitan estuaries in Europe and, to sustain<br />
this, continuing pressures are monitored and<br />
managed interactively in an integrated way. An<br />
operating agreement between Thames Water<br />
and the Environment Agency is crucial to the<br />
management of dissolved oxygen levels in the<br />
summer. However, dissolved oxygen may still fall<br />
such as to kill fish after summer storms. To respond<br />
rapidly to poor water quality, the Agency receives<br />
real time data every 15 minutes from the critical<br />
reaches of the estuary.<br />
123
The water quality management strategy for the<br />
estuary was reviewed in 1989, revealing a need for<br />
improved sewage treatment works performance in<br />
summer. It also highlighted the problem of acute<br />
de-oxygenation due to combined sewer overflows<br />
(CSOs), especially in heavy summer storms. These<br />
events may kill fish, despite the deployment of<br />
2 oxygenation vessels and the use of hydrogen<br />
peroxide, and the Agency is now working closely<br />
with Thames Water Plc, DEFRA and the GLA to<br />
produce a new sustainable strategy for London’s<br />
drainage.<br />
124
21. LONG TERM TRENDS IN BELFAST LOUGH<br />
Driving force<br />
Belfast Lough is a shallow semi-enclosed marine<br />
bay on the east coast of Northern Ireland (Figure<br />
86). At the head of the Lough lies the city of<br />
Belfast, which was the main centre of the industrial<br />
revolution in Ireland. In the nineteenth century<br />
Belfast became the world’s largest linen producer<br />
and, between 1850 and 1900, a major industrial<br />
centre, hosting a large shipyard and ropeworks as<br />
well as whiskey distilling, tobacco rolling and service<br />
industries. In this period, many mudflats were<br />
claimed for industrial and port development, with<br />
over 1100 ha of estuarine intertidal area claimed<br />
since 1750 (Buck and Donaghy, 1996). During the<br />
20th Century the Port of Belfast continued as a<br />
centre of industry with approximately 20,000 ship<br />
movements per annum. Other industries were<br />
ship building and repair, aircraft industry, timber<br />
treatment plants, a major fertilizer manufacturer,<br />
a power station and two major sewage treatment<br />
works. In recent years, industry declined, either<br />
reducing production or closing. In addition, tighter<br />
legislation from the EC through the Urban Waste<br />
Water Treatment Directive lead to the upgrading of<br />
major sewage works.<br />
Pressures<br />
The catchment of Belfast Lough is highly urbanised<br />
with a total sewered population in the Lough and<br />
Lagan catchments of 750,000, approximately<br />
half of the total population of Northern Ireland<br />
(Charlesworth and Service 2000). The principal<br />
watercourse entering the Lough is the River Lagan,<br />
draining about 609 km 2 of agricultural land. The<br />
riverine input is small relative to the sea and<br />
therefore the Lough is fully saline for most of its<br />
length.<br />
Metal contamination<br />
By the end of the 1990s, heavy industry had been<br />
largely reduced, as had heavy metal loads. For<br />
example, the annual loading of zinc in the mid<br />
seventies from one major textile plant was about<br />
1095 t y -1 (DOE, 1974). By contrast, in 1992<br />
the total annual loading from industry, sewage<br />
treatment works and rivers was estimated at 33<br />
t y -1 .<br />
Nutrients<br />
The major nutrient inputs have been sewage<br />
treatment works and a fertilizer plant in the Inner<br />
Lough (Figure 87). In 1996, these sources supplied<br />
N<br />
Figure 86.<br />
Flaxall's<br />
Greenlane SDW<br />
Newtownabbey<br />
SDW<br />
Duncrue SI<br />
SDW<br />
Total N (t y )<br />
-1<br />
Total N (t y )<br />
-1<br />
600<br />
500<br />
400<br />
300<br />
200<br />
100<br />
8000<br />
7000<br />
6000<br />
5000<br />
4000<br />
3000<br />
2000<br />
1000<br />
Figure 87.<br />
(a)<br />
Kinnegar<br />
SDW<br />
Outfall<br />
Courtaulds<br />
I.C.I.<br />
Outfall<br />
Outfall<br />
Belfast Lough in the late 1970s: heavy industry<br />
concentrated on the North Shore and Harbour<br />
Industry<br />
Duncrue<br />
Kinnegar<br />
Introduction of secondary<br />
treatment with nutrient<br />
removal<br />
0<br />
199119921993199419951996199719981999200020012002<br />
(b)<br />
0<br />
1992 1993 1994 1995 1996 1997 1998 1999 2000 2001 2002<br />
Total nitrogen loadings from major sources<br />
to Belfast Lough: (a) major sewage treatment<br />
works and (b) fertilizer manufacturer<br />
between 70% and 90% (it varies seasonally) of the<br />
total dissolved inorganic nitrogen loading to the<br />
Lough (Charlesworth and Service, 1999). After 1996<br />
the effluent consent conditions for the fertilizer plant<br />
were tightened. Additionally, the two major sewage<br />
works discharging to the inner Lough were upgraded<br />
from primary treatment to full secondary treatment<br />
with nutrient removal (Figure 87). The inner Lough<br />
was designated as a sensitive area in 2000 under the<br />
Urban Waste Water Treatment Directive.<br />
125
54.75<br />
a<br />
54.75<br />
b<br />
54.70<br />
54.70<br />
720<br />
680<br />
54.65<br />
54.60<br />
-5.90 -5.85 -5.80 -5.75 -5.70 -5.65 -5.60<br />
640<br />
600<br />
560<br />
520<br />
480<br />
440<br />
400<br />
360<br />
320<br />
280<br />
240<br />
200<br />
160<br />
120<br />
80<br />
40<br />
0<br />
54.65<br />
54.60<br />
-5.95 -5.90 -5.85 -5.80 -5.75 -5.70 -5.65 -5.60<br />
720<br />
680<br />
640<br />
600<br />
560<br />
520<br />
480<br />
440<br />
400<br />
360<br />
320<br />
280<br />
240<br />
200<br />
160<br />
120<br />
80<br />
40<br />
0<br />
Figure 88. Zinc concentrations in surficial sediments in 1978 (re-analysed samples) (Parker, 1982) and 2000 (Gens, 2001)<br />
Depth in cm<br />
-10<br />
-12<br />
-14<br />
-16<br />
-18<br />
-20<br />
Figure 89.<br />
Zn/Al<br />
1.00 1.50 2.00 2.50 3.00 3.50 4.00<br />
0<br />
-2<br />
-4<br />
-6<br />
-8<br />
1961<br />
1991<br />
Core 1<br />
Core 2<br />
Zinc/aluminium ratios in a dated sediment<br />
core from Belfast Lough<br />
µmol l -1<br />
300<br />
(a)<br />
250<br />
200<br />
150<br />
100<br />
50<br />
Zn<br />
0<br />
1980 1985 1990 1995 2000<br />
140<br />
(b)<br />
120<br />
100<br />
State<br />
Metal contamination<br />
Reductions in heavy metal loading have been<br />
mirrored by a reduction in zinc in surficial sediments<br />
(Figure 88).<br />
Cores showed the build up of sedimentary zinc<br />
concentrations from development of industry, with<br />
a sharp decline following closure of industrial plants<br />
after 1980 (Figure 89).<br />
The reduction in zinc concentrations can also be<br />
seen in shellfish flesh (Figure 90).<br />
Nutrient enrichment<br />
Reductions in nutrient inputs have been mirrored by<br />
a decrease in winter nutrient concentrations both in<br />
the inner and outer Lough (Figure 91).<br />
Impacts<br />
Improvements in water quality have reflected in<br />
the ecology. Amphipods are sediment dwelling<br />
µmol l -1<br />
80<br />
60<br />
40<br />
20<br />
0<br />
Figure 90.<br />
1993 1994 1995 1996 1997 1998 1999 2000 2001 2002<br />
Zinc concentrations in shellfish (mg kg -1 dry<br />
weight) at (a) Bangor and (b) Belfast Lough<br />
organisms among the most sensitive to pollution of<br />
all marine taxa (Rand and Petrocelli, 1985). A 1976<br />
survey (Parker, 1980) showed that the amphipod<br />
and crustacean taxa increased significantly in<br />
abundance and diversity the greater the distance<br />
from Belfast and that specific species were typically<br />
absent from the polluted areas (Figure 92).<br />
In 2001, 20 of the 42 sites surveyed in 1976 were<br />
compared. In 1976, five sites in the inner harbour<br />
sites and two sites on the North shore of the Lough<br />
were azoic (without any species). A similar picture<br />
could be seen from the wider infaunal community,<br />
clearly showing areas of severe impact with<br />
widespread impoverishment and modification of<br />
benthic community composition in Figure 93.<br />
126
µmol l -1<br />
µmol l -1<br />
500<br />
450<br />
400<br />
350<br />
300<br />
250<br />
200<br />
150<br />
100<br />
50<br />
0<br />
140<br />
120<br />
100<br />
80<br />
60<br />
40<br />
20<br />
diversity, attributed to the dredging of the shipping<br />
channel at the time of the 2001 survey.<br />
Response<br />
Improvements in water quality are clear over<br />
the last 30 years. They have been reflected in<br />
both the sediment chemistry and biology. These<br />
improvements have owed partly to improved<br />
environmental protection, particularly in recent<br />
years when there has been clearer understanding<br />
of some of the environmental problems. However,<br />
some of the improvements also owe to the decline<br />
of industry in Northern Ireland over the last 30<br />
years. Further improvements are necessary in<br />
some areas of the Lough and continued monitoring<br />
is essential to measure the effectiveness of<br />
management action.<br />
Figure 91.<br />
0<br />
1993 1994 1995 1996 1997 1998 1999 2000 2001 2002<br />
Mean winter dissolved inorganic nitrogen in<br />
Belfast Lough (a) Inner Lough - (BL2) and (b)<br />
Outer Lough (BL5)<br />
In 2001, none of the sampled sites was azoic. The<br />
general picture was one of biological improvement.<br />
The inner harbour sites and North shore sites<br />
all supported a mixed fauna, including several<br />
amphipod species (Perioculodes longimanus and<br />
Photis longicau. Eleven of the sites showed an<br />
increase in diversity since 1976. Four sites showed<br />
no significant change. Five sites showed a decline in<br />
References<br />
Buck, A.L. and Donaghy, A., 1996. An Inventory<br />
of <strong>UK</strong> Estuaries – Volume 7, Northern Ireland. Joint<br />
Nature Conservation Committee.<br />
Charlesworth, M. and Service, M., 1999. Nutrient<br />
inputs, trophic status and mathematical modelling<br />
of nitrogen and phosphorus in the Tidal Lagan and<br />
Belfast Lough. Report for EHS.<br />
Charlesworth, M. and Service, M., 2000. An<br />
assessment of metal contamination in Northern<br />
Irish coastal sediments. Biology and Environment:<br />
Proceedings of the Royal Irish Academy, Volume<br />
100B, No.1, 1-12.<br />
54.8<br />
54.8<br />
54.75<br />
54.75<br />
54.7<br />
54.7<br />
54.65<br />
54.65<br />
54.6<br />
54.6<br />
-5.9 -5.85 -5.8 -5.75 -5.7 -5.65 -5.6 -5.55 -5.5<br />
-5.9 -5.85 -5.8 -5.75 -5.7 -5.65 -5.6 -5.55 -5.5<br />
Figure 92.<br />
(a) 1976 Number of crustacean taxa (based on 42 sites) and (b) 2001 Number of crustacean taxa (based on 20 sites)<br />
54.8<br />
54.8<br />
54.75<br />
3.5<br />
54.75<br />
54.7<br />
3<br />
2<br />
54.7<br />
54.65<br />
1<br />
54.65<br />
54.6<br />
0<br />
54.6<br />
-5.9 -5.85 -5.8 -5.75 -5.7 -5.65 -5.6 -5.55 -5.5<br />
-1<br />
-5.9 -5.85 -5.8 -5.75 -5.7 -5.65 -5.6 -5.55 -5.5<br />
Figure 93. (a) 1976 Log 10<br />
crustacean abundance (Based on 42 sites) and (b) 2001 Log 10<br />
crustacean abundance (based on 20<br />
sites) (Azoic sites plotted as –1)<br />
127
DOE, 1974. Pollution of Belfast Lough – Interim<br />
Report. Northern Ireland Water Council.<br />
Parker, J.G., 1982. Structure and chemistry of sediments<br />
in Belfast Lough, a semi-enclosed marine bay.<br />
Estuarine, Coastal and Shelf Science 15: 373-384.<br />
Gens, S., 2001. A History of Metal Contamination<br />
in Belfast Lough. MSc Thesis Queen’s University<br />
of Belfast.<br />
Parker, J.G. 1980. Effects of pollution upon the<br />
benthos of Belfast Lough. <strong>Marine</strong> Pollution<br />
Bulletin. 11: 80-83.<br />
Rand, G.M. and Petrocelli, S.R., 1985. Fundamentals<br />
of Aquatic Toxicology. Hemisphere, Washington<br />
DC.<br />
128
22. MONITORING <strong>UK</strong> MARINE DREDGED MATERIAL DISPOSAL SITES<br />
Driving force<br />
Statutory control of the disposal of wastes to sea<br />
from ships is provided by the Food and Environment<br />
Protection Act (Great Britain - Parliament, 1985).<br />
This disposal route is now largely confined to<br />
dredged material arising from the maintenance<br />
of port/harbour facilities and their approach<br />
channels, and periodically from capital projects<br />
such as those involving channel deepening or new<br />
constructions. The effective management of the sea<br />
disposal option has strategic importance due to the<br />
continuing significance of maritime trade for the <strong>UK</strong><br />
economy.<br />
Through application of a screening process,<br />
applications for the disposal of excessively<br />
contaminated material are rejected at the licensing<br />
stage.<br />
<strong>Monitoring</strong> of licensed disposal activity is conducted<br />
to ensure that:<br />
• environmental conditions at newly designated<br />
sites are suitable for the commencement of<br />
disposal activities<br />
• disposal operations conform with licence<br />
conditions<br />
• predictions for established sites concerning<br />
limitations of effects are met<br />
<strong>Monitoring</strong> outcomes contribute directly to<br />
the licensing/enforcement process, by ensuring<br />
that action is quickly taken if any evidence of<br />
unacceptable changes or practices is found.<br />
Pressure<br />
Pressure arises from:<br />
• the physico-chemical characteristics of the<br />
dredged material<br />
• the amount and frequency of disposal<br />
• the characteristics of the receiving area<br />
There are over 150 sites around the <strong>UK</strong> designated<br />
for the disposal of dredged material, although<br />
not all of these are used in any one year (Figure<br />
94). In total, approximately 40 million wet tonnes<br />
are disposed of annually. Quantities disposed of<br />
at individual sites range from a few hundred to<br />
several million tonnes. This material ranges from<br />
consolidated sediments, for example to extend<br />
harbours (‘capital’ works), boulders and crushed<br />
rock, through to finer material as a result of<br />
‘maintenance’ dredging in estuaries.<br />
Figure 94.<br />
17,427<br />
10,365<br />
32,573<br />
437,270<br />
4,940<br />
12,378<br />
29,722<br />
74,493<br />
5,591<br />
800<br />
1,761<br />
2,607<br />
3,000<br />
126,047<br />
82,282<br />
1,213,543<br />
9,187<br />
410,943<br />
9,723<br />
1,262<br />
525,351<br />
3,000<br />
540,570<br />
151,689 24,573<br />
9,556<br />
450<br />
605,385 8,236<br />
147,874<br />
1,153,734<br />
1,211,978<br />
673,472<br />
4,048,855<br />
28,835<br />
15,317<br />
27,726<br />
3,833,149<br />
37,619<br />
31,098<br />
52,126 26,832190,015<br />
2,638<br />
41,332<br />
502,767<br />
65,999<br />
3,980<br />
4,862 38,574<br />
Amounts of dredged material deposited in<br />
tonnes wet weight in 2000. (Vivian, 2003),<br />
Closed circles represent individual sites or,<br />
where more than one is used locally, (e.g. in<br />
the Humber estuary) as an approximation to<br />
centres of activity<br />
Given the large number of disposal sites and<br />
significant variations in year-on-year usage, regular<br />
monitoring is targeted at representative sites.<br />
Other locations are also monitored where there is<br />
local concern over the potential for adverse effects<br />
of contamination, or where disposal may have<br />
implications for conservation interests.<br />
State<br />
Since it is the longer-term transport and fate of<br />
particulates that is of most concern and since<br />
sediments represent the eventual sink for most<br />
contaminants discharged to sea, monitoring is<br />
focused on seabed sediments and their associated<br />
fauna. Effects may arise from a combination of<br />
physico-chemical impacts and organic enrichment,<br />
which can complicate interpretation of the results<br />
(Rees et al., 1991).<br />
129
The diversity of approaches necessary for effective<br />
field evaluations at dredged material disposal<br />
sites are illustrated below through discussion of<br />
monitoring at three sites.<br />
North Tyne and Souter Point Sites, off<br />
the Tyne<br />
These sites are located at about 40 m depth, where<br />
the seabed is characterised by muddy sands (Figure<br />
95). However, both sites have been modified by<br />
historical disposal of minewaste and fly ash from<br />
power stations, giving rise to local accumulations<br />
of coarser material (Rees and Rowlatt, 1994).<br />
Currently, the sites jointly receive about 0.5 m<br />
tonnes mainly of maintenance dredgings from the<br />
Tyne estuary each year, although these amounts<br />
vary over time due to the periodic nature of<br />
‘capital’ works.<br />
Elevated TBT concentrations in sediments were<br />
found in the area, with the highest concentrations<br />
confined to the disposal sites (Figure 95) and, in the<br />
case of Souter Point, at the western edge, indicating<br />
that disposal activity is concentrated there.<br />
Figure 95.<br />
R. Tyne<br />
TBT content at the North Tyne and Souter<br />
Point dredge disposal sites off the Tyne in<br />
1999<br />
Site Z, in inner Liverpool Bay<br />
TBT concentrations (ppm)<br />
0.1 to 0.28<br />
0.07 to 0.1<br />
0.03 to 0.07<br />
0.002 to 0.03<br />
TBT level is below<br />
minimum detection llimit<br />
0 2 4<br />
Kilometres<br />
This site is located at about 10 m depth in inner<br />
Liverpool Bay. Sediments are typically muddy sands<br />
which are periodically vulnerable to disturbance<br />
by wave action, and by tidal currents of up to 0.8<br />
m s -1 . The site receives about 1.5 million wet tonnes<br />
of maintenance dredgings from the Mersey estuary<br />
each year, a considerable reduction over amounts<br />
in previous years (Vivian, 2003). Material disposed<br />
of ranges from sand to mud according to source,<br />
and may contain elevated levels of organic matter<br />
and trace metals (Rowlatt, 1988; Rees et al., 1992;<br />
Rowlatt and Rees, 1993; Somerfield et al., 1995). In<br />
the mid-1990s, there was evidence of shallowing at<br />
the centre of the site due to disposal practices.<br />
Roughs Tower, off Harwich<br />
Located at about 20 m depth, this site has been<br />
used for the disposal of dredged material principally<br />
from the ports at Harwich and Felixstowe and,<br />
until 1996, for the disposal of sewage sludge.<br />
The periodic disposal of large quantities of capital<br />
dredged material had previously given rise to<br />
concerns over shallowing of the site, while the<br />
dispersion of finer material was a concern for the<br />
local crustacean fishery. During 1999/2000, the<br />
site received 29 million tonnes of dredged material<br />
from Harwich. Although the site is naturally<br />
dispersive, a ‘containment’ approach was adopted<br />
in this instance, due to the nature and quantity of<br />
the material and the accompanying decision for its<br />
effective closure upon completion. Using a variety<br />
of survey techniques, conditions at the seabed were<br />
determined at intervals during and after disposal<br />
(Rees et al., 2003).<br />
Images obtained after cessation show that the<br />
boundary between the dredged material placement<br />
and the surrounding substrata was still intact.<br />
Impacts<br />
North Tyne/Souter Point, off Tyne<br />
Earlier studies demonstrated significant localised<br />
changes in the benthic macrofauna, principally due<br />
to the physical consequences of the disposal of a<br />
combination of minewaste, fly ash and dredged<br />
material (Rees and Rowlatt, 1994). Recent studies<br />
of the effects of maintenance dredgings disposal<br />
at Souter Point identified localised modifications to<br />
nematode assemblages (Schratzberger et al., 2004).<br />
Complementary laboratory microcosm studies<br />
indicated that TBT at concentrations comparable<br />
to those found at the site could be a contributory<br />
factor to observed changes.<br />
Site Z, Liverpool Bay<br />
Earlier surveys (e.g. Rees et al., 1992) identified higher<br />
macrofaunal densities adjacent to the site in response<br />
to the disposal of dredged material (Figure 96), along<br />
with an expected reduction in most species at the<br />
centre. Species typically inhabiting estuary sediments<br />
were found, suggesting that these had survived the<br />
process of estuary dredging and disposal.<br />
Meiofaunal studies at site Z and at other disposal<br />
sites (Somerfield et al., 1995; Boyd et al., 2000)<br />
identified species common to the site centres, even<br />
though they were widely separated and of different<br />
character. This was in contrast to the macrofaunal<br />
results where ‘indicator’ species, if found, were<br />
local to an area, and not universal in their response<br />
to dredged material (Anon., 1996).<br />
130
10000<br />
(a)<br />
<br />
disposal (Rees et al., 2003). Furthermore, there<br />
was evidence of significant amelioration of these<br />
impacts over time, including recolonisation by<br />
appreciable densities of juvenile crabs and lobsters.<br />
1000<br />
Response<br />
Nos.0.1m (x+1)<br />
-2<br />
100<br />
10<br />
1<br />
1 2 3 4 5 6 7<br />
Station<br />
Polychaeta Crustacea Mollusca<br />
Anthozoa Nemertea spp Other groups<br />
Prior to disposal, samples of dredged material are<br />
routinely screened for a range of contaminants.<br />
The range has increased in recent years in line with<br />
tighter regulatory controls, and now includes TBT<br />
originating from anti-fouling paints (Murray et<br />
al., 1999). Occasionally, TBT concentrations were<br />
sufficiently high (>0.1 mg kg -1 ) to preclude sea<br />
disposal, for example, in the case of sediments near<br />
to dry-dock facilities. However, concerns remain<br />
over the potential for adverse effects arising from<br />
earlier disposal of TBT-contaminated sediments.<br />
Consequently, monitoring effort at the Tyne sites<br />
(where the highest concentrations were found) has<br />
been increased in recent years, and now includes<br />
a number of research projects aimed at improving<br />
knowledge regarding contaminant fate and effects.<br />
Nos.0.1m (x+1)<br />
-2<br />
1000<br />
100<br />
10<br />
1<br />
Figure 96.<br />
1 2 3 4 5 6 7<br />
Station<br />
Lanice conchilega Lagis koreni Mysella bidentata<br />
Edwardsia claparedii Pholoe minuta Abra alba<br />
Nemertea spp<br />
(b)<br />
<br />
Nucula nitidosa<br />
Densities of numerically dominant<br />
macrofaunal groups (a) and individual taxa<br />
(b) along a transect though site Z. Error bars<br />
are omitted for clarity. (Arrows indicate the<br />
location of the disposal site)<br />
Roughs Tower, off Harwich<br />
<strong>Monitoring</strong> results supported earlier predictions<br />
concerning containment of material, and limitation<br />
of ecological impacts to the near vicinity of<br />
The case studies revealed significant variation in<br />
ecological responses due to differences in the<br />
nature (and quantity) of deposited materials, and<br />
the nature of the receiving area. Thus, in the case<br />
of site ‘Z’, these were less negative than might<br />
have been anticipated. For example, there was no<br />
evidence of a widespread area of azoic sediments.<br />
This may be due to the stabilising or nutritional<br />
properties of deposited material, and might suggest<br />
a beneficial consequence through an increased food<br />
supply for fish. However, this may be offset by the<br />
risk of enhanced bioaccumulation of contaminants<br />
(Rees and Rowlatt, 1994). Therefore, controls on<br />
contaminant concentrations at source continue<br />
to be rigorously enforced. Recent concerns over<br />
shallowing at the centre of the disposal site have<br />
been addressed by extending the boundaries to<br />
the west and, to date, this strategy appears to have<br />
alleviated the problem.<br />
<strong>Monitoring</strong> at Roughs Tower demonstrated<br />
the utility of sidescan sonar techniques as a<br />
complement to conventional sampling. An ongoing<br />
study is addressing the progress towards recovery of<br />
the benthic community (Rees et al., 2003). Evidence<br />
to date suggests that the adopted ‘containment’<br />
strategy, accompanied by the effective closure of<br />
the site, has been successful.<br />
Common elements to observed environmental<br />
responses to the disposal of dredged material allow<br />
hypotheses for changes to be erected prior to new<br />
or altered disposal regimes (Anon, 1996). However,<br />
monitoring the local marine environment remains<br />
essential to test for the effectiveness of controls on<br />
dredgings disposal.<br />
131
While monitoring has succeeded in identifying local<br />
problems, thereby contributing to their subsequent<br />
resolution, findings at the majority of sites indicate<br />
that the option of sea disposal of dredged material<br />
is acceptable, subject to continued oversight of the<br />
activity.<br />
References<br />
ANON., 1996. <strong>Monitoring</strong> and assessment of the<br />
marine benthos at <strong>UK</strong> dredged material disposal<br />
sites. Scottish Fisheries Information Pamphlet, No.<br />
21, 35pp.<br />
Boyd, S.E., Rees, H.L. and Richardson, C.A., 2000.<br />
Nematodes as sensitive indicators of change at<br />
dredged material disposal sites. Estuarine and<br />
Coastal Shelf Science, 51: 805-819.<br />
Great Britain - Parliament, 1985. Food and<br />
Environment Protection Act, 1985. Chapter 48.<br />
London: HMSO.<br />
Murray, L.A., Waldock, R., Reed, J. and Jones,<br />
B., 1999. Sediment quality in dredged material<br />
disposed to sea from England and Wales. In:<br />
Proceedings of CATS 4 (Characterisation And<br />
Treatment of Sediments), Antwerp: September 15<br />
– 17.<br />
Rees, H.L., Heip, C., Vincx, M. and Parker, M.M.,<br />
1991. Benthic communities: use in monitoring<br />
point-source discharges. ICES Techniques in<br />
<strong>Marine</strong> Environmental Sciences, No. 16, 70pp.<br />
Rees, H.L., Rowlatt, S.M., Limpenny, D.S., Rees,<br />
E.I.S. and Rolfe, M.S., 1992. Benthic studies at<br />
dredged material disposal sites in Liverpool Bay.<br />
Aquatic Environment <strong>Monitoring</strong> Report, MAFF<br />
Directorate of Fisheries Research, Lowestoft, No.<br />
28, 21pp.<br />
Rees, H.L. and Rowlatt, S.M., 1994. Studies at solid<br />
waste and dredged material disposal sites. In:<br />
Franklin, A. and Jones, J. (compilers), <strong>Monitoring</strong><br />
and surveillance of non-radioactive contaminants<br />
in the aquatic environment and activities<br />
regulating the disposal of wastes at sea, 1992.<br />
Aquatic Environment <strong>Monitoring</strong> Report, MAFF<br />
Directorate of Fisheries Research, Lowestoft, No.<br />
40, 52-67.<br />
Rees, H.L., Murray, L.A., Waldock, R., Bolam, S.G.,<br />
Limpenny, D.S. and Mason, C.E., 2003. Dredged<br />
materialfrom port developments: a case study of<br />
options for effective environmental management.<br />
In: Proceedings, 28th International Conference on<br />
Coastal Engineering. World Scientific Inc., 3616-<br />
3629.<br />
Rowlatt, S.M., 1988. Metal contamination in<br />
sediments from Liverpool docks and the Mersey<br />
estuary. ICES C.M. 1988/E:12, 10pp (mimeo).<br />
Rowlatt, S. and Rees, H., 1993. Studies at the<br />
Liverpool Bay site Z dredged material disposal<br />
site. In: Franklin, A. and Jones, J. (compilers),<br />
<strong>Monitoring</strong> and surveillance of non-radioactive<br />
contaminants in the aquatic environment and<br />
activities regulating the disposal of wastes at<br />
sea, 1991. Aquatic Environment <strong>Monitoring</strong><br />
Report, MAFF Directorate of Fisheries Research,<br />
Lowestoft, No. 36, 59-61.<br />
Schratzberger M., Wall C.M., Reynolds W.J.,<br />
Reed J. and Waldock M.J., 2002. Effects of<br />
paint-derived tributyltin (TBT) on structure of<br />
estuarine nematode assemblages in experimental<br />
microcosms. Journal of Experimental <strong>Marine</strong><br />
Biolology and Ecology, 272: 217-235<br />
Somerfield, P.J., Rees, H.L. and Warwick, R.M.,<br />
1995. Interrelationships in community structure<br />
between shallow-water marine meiofauna and<br />
macrofauna in relation to dredgings disposal.<br />
<strong>Marine</strong> Ecology Progress Series, 127: 103-112.<br />
Vivian, C., 2003. Licensing of deposits in the sea.<br />
In: Irish, R. (compiler), <strong>Monitoring</strong> of the quality<br />
of the marine environment, 1999-2000. Science<br />
Series, Aquatic Environment <strong>Monitoring</strong> Report,<br />
CEFAS, Lowestoft, No. 54, 74-80.<br />
132
APPENDIX 1. MEMBERSHIP OF THE NMMP WORKING GROUP<br />
Mr Andrew Franklin (Chair)<br />
CEFAS Burnham Laboratory<br />
Remembrance Avenue<br />
Burnham-on-Crouch<br />
Essex CM0 8HA<br />
Ms Judy Dobson (Technical Secretary)<br />
Scottish Environment Protection Agency<br />
Clearwater House<br />
Heriot Watt Research Park<br />
Avenue North<br />
Riccarton<br />
Edinburgh EH14 4AP<br />
Dr Brian Miller (Chair - NMCAQC Group)<br />
Scottish Environment Protection Agency<br />
Tidal Waters<br />
5 Redwood Crescent<br />
Peel Park<br />
East Kilbride<br />
Glasgow G74 5PP<br />
Dr Matt Service (Chair - NMBAQC Group)<br />
AFESO<br />
Dept of Agriculture and Rural Development for<br />
Northern Ireland<br />
Newforge Lane<br />
Belfast BT9 5PX<br />
Mr John Thain (Chair - NMEAQC Group)<br />
CEFAS Burnham Laboratory<br />
Remembrance Avenue<br />
Burnham-on-Crouch<br />
Essex CM0 8HA<br />
Mrs Jacqueline Jones<br />
CEFAS Burnham Laboratory<br />
Remembrance Avenue<br />
Burnham-on-Crouch<br />
Essex CM0 8HA<br />
Dr Rob Fryer<br />
FRS <strong>Marine</strong> Laboratory<br />
PO Box 101<br />
375 Victoria Road<br />
Aberdeen AB11 9DB<br />
Dr Ian Davies<br />
FRS <strong>Marine</strong> Laboratory<br />
PO Box 101<br />
375 Victoria Road<br />
Aberdeen AB11 9DB<br />
Dr Mark Charlesworth<br />
Environment and Heritage Service<br />
Calvert House<br />
23 Castle Place<br />
Belfast BT1 1FY<br />
Mr Andrew Osborne<br />
<strong>Marine</strong> and Waterways Division<br />
Department for Environment, Food and Rural Affairs<br />
Floor 3/D8<br />
Ashdown House<br />
123 Victoria Street<br />
London SW1E 6DE<br />
Ms Beth Greenaway<br />
<strong>Marine</strong> and Waterways Division<br />
Department for Environment, Food and Rural Affairs<br />
Room 3/B8<br />
Ashdown House<br />
123 Victoria Street<br />
London SW1E 6DE<br />
Mr Anton Edwards<br />
Scottish Environment Protection Agency<br />
Clearwater House<br />
Heriot Watt Research Park<br />
Avenue North<br />
Riccarton<br />
Edinburgh EH14 4AP<br />
Dr Mike Best<br />
Environment Agency - Anglian Region<br />
Kingfisher House<br />
Goldhay Way<br />
Orton Goldhay<br />
Peterborough PE2 5ZR<br />
Dr Chris Ashcroft<br />
Environment Agency - <strong>National</strong> <strong>Marine</strong> Service<br />
Kingfisher House<br />
Goldhay Way<br />
Orton Goldhay<br />
Peterborough PE2 5ZR<br />
Mr Dave Jowett<br />
Environment Agency Headquarters<br />
Rombourne House<br />
130 Aztec West<br />
Almondsbury<br />
Bristol BS32 4UB<br />
133
Dr Jon Davis/Ms Jenny Hill<br />
Joint Nature Conservation Committee<br />
Monkstone House<br />
City Road<br />
Peterborough PE1 1JY<br />
Ms Emily Orr<br />
Environment Agency<br />
Environmental Data Unit<br />
Lower Bristol Road<br />
Bath BA2 9ES<br />
Dr Lynda Webster<br />
FRS <strong>Marine</strong> Laboratory<br />
PO Box 101<br />
375 Victoria Road<br />
Aberdeen AB11 9DB<br />
134
APPENDIX 2. MARINE ENVIRONMENT MONITORING GROUP<br />
Dr M J Waldock (Chairman)<br />
CEFAS Weymouth Laboratory<br />
The Nothe<br />
Barrack Road<br />
Weymouth<br />
Dorset DT4 9UB<br />
Mrs Jacqueline Jones (Secretary)<br />
CEFAS Burnham Laboratory<br />
Remembrance Avenue<br />
Burnham-on-Crouch<br />
Essex CM0 8HA<br />
Dr C Moffat<br />
FRS <strong>Marine</strong> Laboratory<br />
PO Box 101<br />
375 Victoria Road<br />
Torry<br />
Aberdeen AB11 9DB<br />
Dr Matt Service<br />
AESD<br />
Dept of Agriculture and Rural Development for<br />
Northern Ireland<br />
Newforge Lane<br />
Belfast BT9 5PX<br />
Mr A Osborne<br />
<strong>Marine</strong> and Waterways Division<br />
Department for Environment, Food and Rural Affairs<br />
Floor 3/D8<br />
Ashdown House<br />
123 Victoria Street<br />
London SW1E 6DE<br />
Ms Beth Greenaway<br />
<strong>Marine</strong> and Waterways Division<br />
Dept for Environment, Food and Rural Affairs<br />
Floor 3/B8<br />
Ashdown House<br />
123 Victoria Street<br />
London SW1E 6DE<br />
Dr P C Reid<br />
Director<br />
Sir Alister Hardy Foundation for Ocean Science<br />
The Laboratory<br />
Citadel Hill<br />
Plymouth PL1 2PB<br />
Dr L A Kelly<br />
The Scottish Executive Environment and Rural<br />
Affairs Department<br />
Water Environment Unit<br />
Area 1/H<br />
Victoria Quay<br />
Edinburgh EH6 6QQ<br />
Ms Roslyn Todd<br />
Environment and Heritage Service<br />
Calvert House<br />
23 Castle Place<br />
Belfast BT1 1FY<br />
Dr H Prosser<br />
Environment Division<br />
<strong>National</strong> Assembly for Wales<br />
Cathays Park<br />
Cardiff CF10 3NQ<br />
Mr P Holmes<br />
Scottish Environment Protection Agency<br />
5 Redwood Crescent<br />
Peel Park<br />
East Kilbride G74 5PP<br />
Dr T M Leatherland<br />
Scottish Environment Protection Agency<br />
Clearwater House<br />
Heriot Watt Research Park<br />
Avenue North<br />
Riccarton<br />
Edinburgh EH14 4AP<br />
Dr A J D Ferguson<br />
Environment Agency, Head Office<br />
Rio House<br />
Waterside Drive<br />
Aztec West<br />
Almondsbury<br />
Bristol BS32 4UD<br />
Mr D Connor<br />
Joint Nature Conservation Committee<br />
Monkstone House<br />
City Road<br />
Peterborough PE1 1JY<br />
Dr L A Murray (Chairman GCSDM)<br />
CEFAS Burnham Laboratory<br />
Remembrance Avenue<br />
Burnham-on-Crouch<br />
Essex CM0 8HA<br />
135
Mr A Franklin (Chairman NMMP WG)<br />
CEFAS Burnham Laboratory<br />
Remembrance Avenue<br />
Burnham-on-Crouch<br />
Essex CM0 8HA<br />
Mr D Jowett (Chairman WFD sub-group)<br />
Environment Agency Headquarters<br />
Rombourne House<br />
130 Aztec West<br />
Almondsbury<br />
Bristol BS32 4UB<br />
Dr J E Portmann (Observer IACMST)<br />
JEP Environmental Consultancy<br />
The Shieling<br />
26 Sheepcotes Lane<br />
Southminster<br />
Essex CM0 7AF<br />
ADDRESS LIST OF CORRESPONDENCE MEMBERS<br />
Mr J Roberts<br />
Dept for Environment, Food and Rural Affairs<br />
Floor 3/D10<br />
Ashdown House<br />
123 Victoria Street<br />
London SW1E 6DE<br />
Mr K O’Carroll<br />
Dept of Trade and Industry<br />
Oil and Gas Office<br />
86-88 Guild Street<br />
Aberdeen AB11 6AR<br />
Mr K Colcomb<br />
Maritime and Coastguard Agency<br />
Bay 1/2<br />
Spring Place<br />
105 Commercial Road<br />
Southampton SO15 1EG<br />
Dr M Waring<br />
Dept of Health<br />
Room 656C<br />
Skipton House<br />
80 London Road<br />
Elephant and Castle<br />
London SE1 6LW<br />
Dr R Kruger<br />
Environment and Scientific Adviser<br />
Water <strong>UK</strong><br />
1 Queen Anne’s Gate<br />
London SW1H 9BT<br />
Mr P Woodcock<br />
Environmental Protection Manager<br />
Anglian Water<br />
Compass House<br />
Chivers Way<br />
Histon<br />
Cambs CB4 4ZY<br />
Mr E Harper<br />
North West Water Ltd<br />
Dawson House<br />
Great Sankey<br />
Warrington WA5 3LW<br />
Dr Tim Lack<br />
WRC PLC<br />
Fraukland Road<br />
Blagrove<br />
Swindon<br />
Wiltshire SN5 8YF<br />
Dr P Newton<br />
Head of <strong>Marine</strong> Science Team<br />
NERC<br />
Polaris House<br />
North Star Avenue<br />
Swindon<br />
Wilts SN2 1EU<br />
136