Dynamic screening and electronâelectron scattering - Donostia ...
Dynamic screening and electronâelectron scattering - Donostia ...
Dynamic screening and electronâelectron scattering - Donostia ...

Create successful ePaper yourself
Turn your PDF publications into a flip-book with our unique Google optimized e-Paper software.
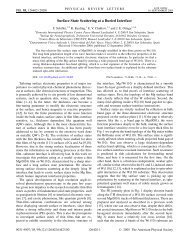
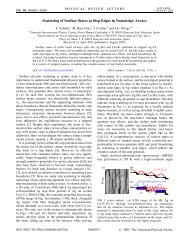
V.M. Silkin et al. / Surface Science 601 (2007) 4546–4552 4549<br />
Fig. 2. Quantum well states energy dispersion for E QWS ¼ 0:127 eV<br />
C<br />
(solid line), E QWS ¼ 0:042 eV (dashed line), <strong>and</strong> E QWS ¼ 0 (dotted line).<br />
C<br />
C<br />
Grey area shows the regions of projected bulk electronic structure of bare<br />
Cu(111) surface being most efficient decay channel in Na/Cu(111)<br />
systems as well [18]. The two main decay channels, namely intrab<strong>and</strong> <strong>and</strong><br />
interb<strong>and</strong> transitions, are shown schematically by arrows.<br />
the QWS wave functions / 0 (z) <strong>and</strong> the bulk electronic structure<br />
for all the three different QWS energy positions have<br />
been hold the same in the present calculation. In addition<br />
to the above-mentioned similarity of the available phase<br />
space for decay, the remaining difference between these calculations<br />
is the screened Coulomb interaction W(z,z 0 ,q k ,x)<br />
originated from different QWS energy positions. We perform<br />
calculation of W(z,z 0 ,q k ,x) for all the three systems<br />
<strong>and</strong> analyze them below. First of all, we note a strong<br />
variation of ImW as a function of all its variables z, q k ,<br />
<strong>and</strong> x. To give a general idea of it in Fig. 3, we present<br />
ImW(z,z,q k ,x) as a function of z <strong>and</strong> x for the E QWS ¼<br />
C<br />
0:127 eV <strong>and</strong> E QWS ¼ 0:042 eV cases for two-dimensional<br />
momentum value q k = 0.05 a.u.<br />
1 . The use of<br />
C<br />
ImW(z,z,q k ,x) as an example is reasonable as inside the<br />
solid <strong>and</strong> near the surface ImW(z,z 0 ,q k ,x) has the maximum<br />
magnitude at z = z 0 <strong>and</strong> only far from the surface into<br />
the vacuum the maximum of this quantity occurs at z 5 z 0<br />
[44]. InFig. 3 one can observe a strong enhancement of<br />
ImW(z,z,q k ,x) for z P 0 <strong>and</strong> energies x 6 0.25 eV <strong>and</strong><br />
x 6 0.18 eV, respectively. Comparing both figures one<br />
can see that the amplitude of ImW in low left corner for<br />
the E QWS ¼ 0:042 eV case is much larger than for the<br />
C<br />
E QWS ¼ 0:127 eV case. Therefore, although the phase<br />
C<br />
space in the former case is smaller as one can appreciate<br />
in Fig. 5, this ImW enhancement leads to a larger linewidth<br />
for the E QWS ¼ 0:042 eV case for small energies. When the<br />
C<br />
energy increases, the relative role of this enhanced region<br />
of ImW decreases leading to a smaller linewidth for<br />
the E QWS ¼ 0:042 eV case, as compared to the E QWS ¼<br />
C<br />
C<br />
0:127 eV one. In Fig. 4, ImW(z,z,q k ,x) for E QWS ¼<br />
C<br />
0:127 eV <strong>and</strong> E QWS ¼ 0 are presented for two values of<br />
C<br />
q k , demonstrating that, at the surface, the amplitude of<br />
Fig. 3. Imaginary part of the screened interaction, ImW(z,z,q k ,x), for the<br />
E QWS ¼ 0:127 eV (upper panel) <strong>and</strong> E QWS ¼ 0:042 eV (lower panel)<br />
C<br />
C<br />
cases as a function of distance z <strong>and</strong> energy x for the two-dimensional<br />
momentum q k = 0.05 a.u.<br />
1 . Na adlayer is located at z = 0 <strong>and</strong> negative<br />
(positive) z values correspond to the solid (vacuum) side.<br />
ImW is two orders of magnitude larger than in the former<br />
case, whereas the latter is very similar to the clean Cu(111)<br />
case [44].<br />
Furthermore, in Fig. 3, one can see additional peaks at<br />
the maximum energy for QWS intrab<strong>and</strong> e–h excitations<br />
which correspond to the collective electronic excitations<br />
similar to the acoustic surface plasmon (ASP) at the clean<br />
metal surfaces [33,34]. Their dispersions closely follow the<br />
upper edge of regions for e–h excitations within the QWS<br />
b<strong>and</strong>s <strong>and</strong> are shown in Fig. 5. The origin of this collective<br />
mode is the coexistence at the surface of both the QWS <strong>and</strong><br />
bulk electrons. More detailed analysis of its properties will<br />
be given elsewhere. From Fig. 5, it is clear that the ASP<br />
contributes to the total linewidth C e–e . Nevertheless, it is<br />
difficult to separate this contribution from the very efficient<br />
decay channel due to intrab<strong>and</strong> QWS e–h excitations.<br />
3.2. Metal clusters<br />
One of the most appealing features of low-dimensional<br />
systems such as clusters is that their properties can often