Time-dependent screening in a two-dimensional electron gas
Time-dependent screening in a two-dimensional electron gas
Time-dependent screening in a two-dimensional electron gas

Create successful ePaper yourself
Turn your PDF publications into a flip-book with our unique Google optimized e-Paper software.
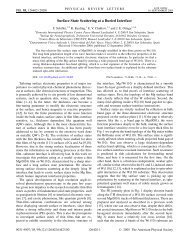
236 M. Alduc<strong>in</strong> et al. / Surface Science 559 (2004) 233–240<br />
q <strong>in</strong>d ðrÞ ¼ Z Z 1<br />
<br />
<br />
1<br />
1<br />
dqqJ 0 ðqrÞRe<br />
1 ;<br />
2p 0<br />
2D ðq; 0Þ<br />
ð5Þ<br />
which correspond to the stationary expression for<br />
the density <strong>in</strong>duced by an external charge density<br />
q ext ðrÞ ¼Z 1 dðrÞ. We checked that the results obta<strong>in</strong>ed<br />
by omitt<strong>in</strong>g the cos<strong>in</strong>e term <strong>in</strong> Eq. (4)<br />
reproduce well those obta<strong>in</strong>ed with Eq. (5). Notice,<br />
however, that <strong>in</strong> order to achieve this agreement it<br />
was necessary to use the exact x p ðqÞ <strong>in</strong>stead of the<br />
analytical approximations.<br />
3. Results and discussion<br />
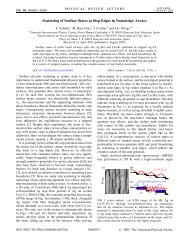
Fig. 1. Spectrum of excitations for (a) 2D <strong>electron</strong> <strong>gas</strong> (upper<br />
panel) and (b) 3D <strong>electron</strong> <strong>gas</strong> (lower panel). In both cases<br />
r s ¼ 2. The shadow areas <strong>in</strong>dicate the ðq; xÞ-values at which the<br />
e-h pair excitations can take place. The curves x p ðqÞ <strong>in</strong>dicate<br />
the plasmon excitations.<br />
In the 2D case however, the plasmon frequency<br />
behaves as<br />
x 2 p ’ q2 F q<br />
for small values of q<br />
and as<br />
x 2 p ’ q2 F q þ 3=4q2 F q2 for larger values of q:<br />
There are <strong>two</strong> dist<strong>in</strong>ctive features for the 2Dplasmon<br />
frequency as compared to the 3D one: x p<br />
is zero for q ¼ 0 and the q-dispersion is stronger.<br />
Let us make a f<strong>in</strong>al comment on the expression<br />
we derived for the <strong>in</strong>duced density <strong>in</strong> Eq. (4). In<br />
the limit t !1, s<strong>in</strong>ce the cosðxtÞ term <strong>in</strong>tegrates<br />
to zero, the x-<strong>in</strong>tegral can be analytically evaluated<br />
us<strong>in</strong>g the Kramers–Kron<strong>in</strong>g relations. Hence,<br />
one gets<br />
In this section we show results for an external<br />
charge created <strong>in</strong> an <strong>electron</strong> <strong>gas</strong> with r s ¼ 2.<br />
Calculations were also carried out for different<br />
metallic densities (r s ¼ 3, 4). In general, we observe<br />
that for lower densities, the response of the medium<br />
to screen the external impurity is slower. Except<br />
for this fact, the comparative analysis between<br />
the 2D and the 3D <strong>electron</strong> <strong>gas</strong> presented <strong>in</strong> this<br />
section can be qualitatively generalized to those<br />
densities.<br />
In Fig. 2 we plot the <strong>electron</strong>ic density n <strong>in</strong>d ¼<br />
q <strong>in</strong>d <strong>in</strong>duced at the position of the suddenly created<br />
charge as a function of time t for a 2D (Fig.<br />
2(a), upper panel) and a 3D (Fig. 2(b), lower<br />
panel) <strong>electron</strong> <strong>gas</strong>. S<strong>in</strong>ce the spectral functions<br />
Imf1= RPA<br />
2D;3D<br />
g consist of a cont<strong>in</strong>uum part (e-h<br />
pair) and a plasmon mode, we calculate the <strong>in</strong>duced<br />
density as q <strong>in</strong>d ¼ q eh þ q pl , where q eh and q pl<br />
take <strong>in</strong>to account the contribution to the <strong>screen<strong>in</strong>g</strong><br />
process com<strong>in</strong>g from e-h and plasmon excitation,<br />
respectively. Accord<strong>in</strong>gly <strong>in</strong> Fig. 2, n <strong>in</strong>d (bold-solid<br />
l<strong>in</strong>e) is the sum of n eh (long-dashed l<strong>in</strong>e) and n pl<br />
(dotted l<strong>in</strong>e). The stationary value (t !1) is<br />
<strong>in</strong>dicated by a th<strong>in</strong>-solid l<strong>in</strong>e. As it may be seen<br />
from the figure, n <strong>in</strong>d ð0; tÞ is dom<strong>in</strong>ated by the e-h<br />
part that rises quite fast with<strong>in</strong> the first 2–3 a.u. of<br />
time. This behaviour is observed for both the 2D<br />
and the 3D medium. Nevertheless, an important<br />
difference arises between both cases. Whereas <strong>in</strong> a<br />
2D <strong>electron</strong> <strong>gas</strong> n <strong>in</strong>d reaches the stationary value at<br />
t 8–9 a.u., <strong>in</strong> the 3D case n <strong>in</strong>d oscillates around<br />
its stationary value even for the longest time