

2011 Estimated Water Use - Southwest Florida Water Management ...
2011 Estimated Water Use - Southwest Florida Water Management ...
2011 Estimated Water Use - Southwest Florida Water Management ...

You also want an ePaper? Increase the reach of your titles
YUMPU automatically turns print PDFs into web optimized ePapers that Google loves.
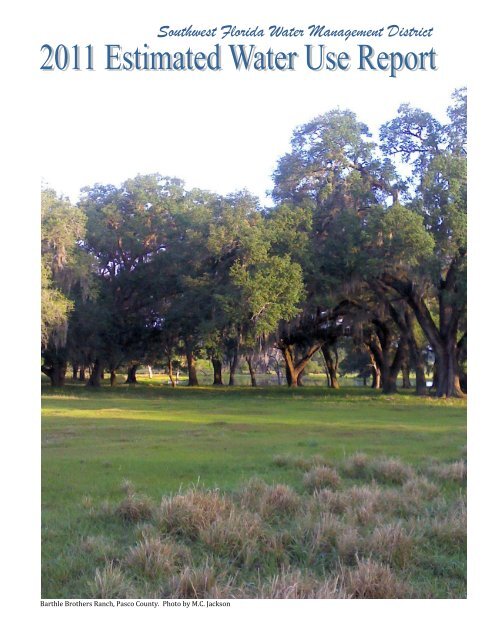
Barthle Brothers Ranch, Pasco County. Photo by M.C. Jackson<br />
<strong>Southwest</strong> <strong>Florida</strong> <strong>Water</strong> <strong>Management</strong> District
<strong>Southwest</strong> <strong>Florida</strong> <strong>Water</strong> <strong>Management</strong> District<br />
This report is produced by the <strong>Southwest</strong> <strong>Florida</strong> <strong>Water</strong> <strong>Management</strong> District,<br />
Resource <strong>Management</strong>, <strong>Water</strong> Resources Bureau, <strong>Water</strong> Supply Section<br />
April 9, 2013<br />
Author: Marie Christine Jackson, P.G., Senior Hydrogeologist<br />
Primary SAS Author: Bruce Albritton, MIS, Inc.<br />
This report is available on‐line at: http://www.watermatters.org<br />
You may send a request for a printed copy to info@watermatters.org<br />
The <strong>Southwest</strong> <strong>Florida</strong> <strong>Water</strong> <strong>Management</strong> District (District) does not discriminate on the basis of<br />
disability. This nondiscrimination policy involves every aspect of the Districts functions, including<br />
access to and participation in the District's programs and activities. Anyone requiring reasonable<br />
accommodation as provided for in the Americans with Disabilities Act should contact the District's<br />
Human Resources Director, 2379 Broad Street, Brooksville, <strong>Florida</strong> 346046899; telephone (352) 796<br />
7211, ext. 4702 or 18004231476 (FL only), ext. 4702; TDD (FL only) 18002316103; or email to<br />
ADACoordinator@swfwmd.state.fl.us<br />
These data were collected for specific permits by the District from various sources and methods<br />
over many years. The data obtained from the <strong>Southwest</strong> <strong>Florida</strong> <strong>Water</strong> <strong>Management</strong> District’s<br />
Databases may be provisional and thus subject to revision. The District does not warrant, guarantee,<br />
or make any representations regarding the use, or the results of the use, of the data in terms of<br />
correctness, accuracy, reliability, completeness, usefulness, timeliness or otherwise and the District<br />
specifically disclaims any warranty, either expressed or implied, including but not limited to the<br />
implied warranties of merchantability and fitness for a particular use. The data is provided “as is”<br />
and the entire risk as to quality and performance is with the user. In no event will the District be<br />
liable for any direct, indirect, incidental, special, consequential, or other damages, including loss of<br />
profit, arising out of the use of these data even if the District has been advised of the possibility of<br />
such damages. All data are intended for resource project’s and other District Department’s use.<br />
These data do not represent an endorsement or recommendation. If you have any questions<br />
concerning these data, contact the <strong>Water</strong> Resources Bureau at (352) 796‐7211 or 1‐800‐423‐1476<br />
(<strong>Florida</strong>).
<strong>2011</strong> ESTIMATED WATER USE REPORT<br />
Table of Contents<br />
EXECUTIVE SUMMARY 1<br />
INTRODUCTION 5<br />
PUBLIC SUPPLY 13<br />
DOMESTIC SELF‐SUPPLY USE 23<br />
RECREATION/AESTHETIC 27<br />
AGRICULTURE USE 33<br />
MINING/DEWATERING 41<br />
INDUSTRIAL/COMMERCIAL USE 45<br />
TOTAL WATER USE 49<br />
LIST OF FIGURES<br />
FIGURE 1. WATER USE PERMITS IN THE SWFWMD, <strong>2011</strong> 11<br />
FIGURE 2. SWFWMD COUNTIES AND WATER USE CAUTION AREAS 12<br />
FIGURE 3. PERCENTAGE OF PUBLIC SUPPLY PUMPAGE AND WATER USE BY COUNTY 22<br />
FIGURE 4. PUBLIC SUPPLY MONTHLY PUMPAGE AND MONTHLY REGIONAL RAINFALL 22<br />
FIGURE 5. PERCENTAGE DOMESTIC SELF‐SUPPLY WATER USE BY COUNTY 25<br />
FIGURE 6. PERCENTAGE RECREATION/AESTHETIC WATER USE BY COUNTY 31<br />
FIGURE 7. RECREATION/AESTHETIC MONTHLY PUMPAGE AND MONTHLY REGIONAL RAINFALL 31<br />
FIGURE 8. PERCENTAGE AGRICULTURE WATER USE BY COUNTY 39<br />
FIGURE 9. AGRICULTURE MONTHLY PUMPAGE AND MONTHLY REGIONAL RAINFALL 39<br />
FIGURE 10. PERCENTAGE MINING / DEWATERING WATER USE BY COUNTY 44<br />
FIGURE 11. MINING / DEWATERING MONTHLY PUMPAGE AND MONTHLY REGIONAL RAINFALL 44<br />
FIGURE 12. PERCENTAGE INDUSTRIAL/COMMERCIAL WATER USE BY COUNTY 48<br />
FIGURE 13. INDUSTRIAL/COMMERCIAL MONTHLY PUMPAGE AND MONTHLY REGIONAL RAINFALL 48<br />
FIGURE 14. PERCENTAGE OF TOTAL PUMPAGE AND TOTAL USE BY COUNTY 58<br />
FIGURE 15. TOTAL GROUNDWATER AND SURFACE WATER PUMPAGE BY COUNTY 59<br />
FIGURE 16. GROUNDWATER AND SURFACE WATER MONTHLY PUMPAGE AND MONTHLY RAINFALL 59<br />
LIST OF TABLES<br />
TABLE 1. PUBLIC SUPPLY SERVICE AREA POPULATION AND WATER USE 20<br />
<strong>Southwest</strong> <strong>Florida</strong> <strong>Water</strong> <strong>Management</strong> District<br />
Page | i
<strong>2011</strong> ESTIMATED WATER USE REPORT<br />
TABLE 2. DOMESTIC SELF‐SUPPLY WATER USE BY COUNTY 24<br />
TABLE 3. RECREATION/AESTHETIC WATER USE BY COUNTY, WATER SOURCE, AND USE TYPE 30<br />
TABLE 4. AGRICULTURAL WATER USE BY COUNTY, WATER SOURCE, AND USE TYPE 38<br />
TABLE 5. MINING/DEWATERING QUANTITIES CONSUMED BY COUNTY, WATER SOURCE, AND USE TYPE 43<br />
TABLE 6. INDUSTRIAL/COMMERCIAL USE BY COUNTY, WATER SOURCE, AND USE TYPE 47<br />
TABLE 7A. SUMMARY OF 10 YEARS OF METERED WATER USE DATA, 2002 ‐ <strong>2011</strong> 52<br />
TABLE 7B. COMPARISON OF PERMITTED QUANTITIES FOR METERED & UNMETERED WUPS 52<br />
TABLE 8. TOTAL WATER USE BY USE CATEGORY AND COUNTY 53<br />
TABLE 9. TOTAL WITHDRAWAL AND USE QUANTITIES BY USE CATEGORY AND COUNTY 54<br />
TABLE 10. TOTAL PERMITTED AND PUMPED ANNUAL AVERAGE QUANTITIES 55<br />
TABLE 11. PERMITTED AND PUMPED ANNUAL AVERAGE QUANTITIES, METERED WUPS 56<br />
TABLE 12. PERMITTED AND PUMPED ANNUAL AVERAGE QUANTITIES, UNMETERED WUPS 57<br />
APPENDICES<br />
APPENDIX A SUMMARIES OF METERED & ESTIMATED WATER USE PERMITS 60<br />
TABLE A‐1, PART 1 <strong>2011</strong> PUBLIC SUPPLY ANNUAL REPORTS 63<br />
TABLE A‐1, PART 2 METERED NON‐PSAR AND UNMETERED PUBLIC SUPPLY WUPS 76<br />
TABLE A‐2 <strong>2011</strong> PUBLIC SUPPLY ANNUAL REPORT AND RESIDENTIAL PER CAPITA 80<br />
TABLE A‐3 PUBLIC SUPPLY ANNUAL REPORT PERMIT TO PERMIT WATER TRANSFERS 91<br />
TABLE A‐4. TOTAL PUBLIC SUPPLY MONTHLY AVERAGE PUMPAGE AND USE BY COUNTY 95<br />
TABLE A‐5. PERMITTED AND PUMPED QUANTITIES ON METERED RECREATION/AESTHETIC WUPS 96<br />
TABLE A‐6. TOTAL RECREATION/AESTHETIC AVERAGE MONTHLY PUMPAGE BY COUNTY 133<br />
TABLE A‐7. PERMITTED AND PUMPED QUANTITIES ON METERED AGRICULTURAL WUPS 134<br />
TABLE A‐8. TOTAL AGRICULTURE AVERAGE MONTHLY PUMPAGE BY COUNTY 351<br />
TABLE A‐9. PERMITTED AND PUMPED QUANTITIES ON METERED MINING/DEWATERING WUPS 352<br />
TABLE A‐10. TOTAL MINING/DEWATERING AVERAGE MONTHLY PUMPAGE BY COUNTY 360<br />
TABLE A‐11. PERMITTED AND PUMPED QUANTITIES ON METERED INDUSTRIAL/COMMERCIAL WUPS 361<br />
TABLE A‐12. TOTAL INDUSTRIAL/COMMERCIAL AVERAGE MONTHLY PUMPAGE BY COUNTY 375<br />
APPENDIX B SUMMARIES OF GROUNDWATER & SURFACE WATER PUMPAGE 376<br />
TABLE B‐1. DISTRICT‐WIDE PER COUNTY 377<br />
TABLE B‐2. IN THE SOUTHERN WATER USE CAUTION AREA 378<br />
TABLE B‐3. IN THE MOST IMPACTED AREA OF THE SOUTHERN WATER USE CAUTION AREA 379<br />
<strong>Southwest</strong> <strong>Florida</strong> <strong>Water</strong> <strong>Management</strong> District<br />
Page | ii
<strong>2011</strong> ESTIMATED WATER USE REPORT<br />
TABLE B‐4. IN THE NORTHERN TAMPA BAY WATER USE CAUTION AREA 380<br />
TABLE B‐5. IN THE DOVER/PLANT CITY WATER USE CAUTION AREA 381<br />
APPENDIX C PERMITTED GROUNDWATER & SURFACE WATER ANNUAL AVERAGE QUANTITIES 382<br />
TABLE C‐1. DISTRICT‐WIDE PER COUNTY 383<br />
TABLE C‐2. IN THE SOUTHERN WATER USE CAUTION AREA 384<br />
TABLE C‐3. IN THE MOST IMPACTED AREA OF THE SWUCA 385<br />
TABLE C‐4. IN THE NORTHERN TAMPA BAY WATER USE CAUTION AREA 386<br />
TABLE C‐5. IN THE DOVER/PLANT CITY WATER USE CAUTION AREA 387<br />
TABLE C‐6. GROUNDWATER FREEZE PROTECTION QUANTITIES IN THE DOVER/PLANT CITY WUCA 388<br />
TABLE C‐7. # AGRICULTURE WUPS WITH FREEZE PROTECTION IN THE DOVER/PLANT CITY WUCA 388<br />
APPENDIX D TENYEAR HISTORIC PUMPAGE AND PER CAPITA RATES FOR LARGE WUPS 389<br />
TABLE D‐1. PUBLIC SUPPLY WUPS 390<br />
TABLE D‐2. AGRICULTURE WUPS 394<br />
TABLE D‐3. MINING/DEWATERING WUPS 400<br />
TABLE D‐4. INDUSTRIAL/COMMERCIAL WUPS 401<br />
TABLE D‐5. RECREATION/AESTHETIC WUPS 403<br />
TABLE D‐6. PUBLIC SUPPLY UNADJUSTED GROSS PER CAPITA WATER USE 404<br />
APPENDIX E UNIFORM PER CAPITA REPORT 411<br />
APPENDIX F ESTIMATED WATER USE REPORT METHODOLOGY AND CHANGES 424<br />
<strong>Southwest</strong> <strong>Florida</strong> <strong>Water</strong> <strong>Management</strong> District<br />
Page | iii
<strong>2011</strong> ESTIMATED WATER USE REPORT<br />
EXECUTIVE SUMMARY<br />
The <strong>Estimated</strong> <strong>Water</strong> <strong>Use</strong> (EWU) Report analyzes<br />
and summarizes the withdrawal and use of<br />
regulated groundwater and surface water from<br />
natural surface water bodies in the <strong>Southwest</strong><br />
<strong>Florida</strong> <strong>Water</strong> <strong>Management</strong> District (District).<br />
The EWU report is generally used as a data<br />
source for a variety of water supply planning and<br />
management purposes. It is not used to<br />
determine compliance with terms and conditions<br />
of the water use permit (WUP).<br />
In the District, there were 7,745 water use<br />
permits (WUPs) in active status in <strong>2011</strong> that<br />
were permitted for 1,911 million gallons per day<br />
(mgd) on an annual average basis.<br />
The water withdrawn for agriculture, industrial/<br />
commercial, mining/dewatering and recreation/<br />
aesthetic uses were used when and where they<br />
were withdrawn. The water withdrawn for<br />
public supply went through treatment<br />
procedures that caused some water losses, and<br />
large quantities of potable water were<br />
transported between utilities as imports and<br />
exports, causing distribution losses. Thus, for<br />
public supply, water is frequently not used in the<br />
same quantity as was withdrawn or where it was<br />
withdrawn. Table A‐1 in Appendix A gives<br />
details on treatment losses, imports and exports.<br />
The following table shows the <strong>2011</strong> Districtregulated<br />
water withdrawals.<br />
Total Withdrawals<br />
AG I/C M/D PS R/A TOTAL<br />
MGD 390 54 22 520 62 1,048<br />
Portion<br />
of Total 37% 5% 2% 50% 6% 100%<br />
(excludes domestic self‐supply)<br />
As shown in the table above, the total amount of<br />
water withdrawn from the groundwater and<br />
surface water resources via regulated<br />
withdrawal points in the District was 1,048 mgd<br />
(Table 10). The largest water withdrawals were<br />
for public supply for 50% of the total pumpage in<br />
the District. The second largest water<br />
withdrawals were for agricultural water use for<br />
37% of the total District water pumpage.<br />
Approximately 87% of the total (estimated +<br />
metered) pumpage was from groundwater,<br />
assuming domestic self‐supply was all from<br />
groundwater.<br />
The following table shows the total water use in<br />
the District for <strong>2011</strong>.<br />
Total <strong>Use</strong><br />
AG I/C M/D PS R/A TOTAL<br />
MGD 390 54 22 493 62 1,022<br />
Portion<br />
of Total 38% 5% 2% 49% 6% 100%<br />
(excludes domestic self‐supply)<br />
Including an estimate for domestic self‐supply<br />
(37mgd), the total quantity withdrawn was<br />
1,085 mgd (Table 9). After imports, exports and<br />
treatment losses for public supply water, the<br />
total water used in the District was 1,059 mgd<br />
(including domestic self‐supply).<br />
PUBLIC SUPPLY<br />
The public supply use category includes public<br />
water systems, privately held water utilities,<br />
entities that provide potable water to persons<br />
other than household members as well as<br />
residential lawn and landscape irrigation. Public<br />
supply is shown as both water withdrawn<br />
(pumped) and water used after treatment losses,<br />
imports and exports are accounted for.<br />
Public Supply Annual Reports Public supply<br />
permittees having 100,000 gpd or more annual<br />
average quantities permitted for public supply<br />
on their WUP are required to submit a Public<br />
Supply Annual Report (PSAR) by April of each<br />
year for the previous calendar year. The District<br />
received 160 PSAR forms for the <strong>2011</strong> calendar<br />
year. There were discrepancies (most of which<br />
were minor) found between the pumpage given<br />
on the PSAR forms and the pumpage recorded in<br />
the <strong>Water</strong> <strong>Management</strong> Information System<br />
(WMIS) for 35 WUPs. Significant discrepancies<br />
were investigated prior to presenting this data,<br />
and obvious errors in the database were<br />
corrected. Since the WMIS pumpage data exists<br />
in much more detail, it was used for 94% of the<br />
public supply WUPs for which a PSAR form was<br />
submitted.<br />
Total Public Supply<br />
Withdrawal Totals<br />
<strong>Southwest</strong> <strong>Florida</strong> <strong>Water</strong> <strong>Management</strong> District Page | 1
<strong>2011</strong> ESTIMATED WATER USE REPORT<br />
Including the remaining public supply WUP<br />
metered pumpage data (8 mgd) and the<br />
estimated water use (5 mgd) for permittees not<br />
required to meter their pumpage, total public<br />
supply water withdrawn in <strong>2011</strong> was 520 mgd<br />
(Table 9). This was up from the 478 mgd<br />
withdrawn in 2010. Slightly over 99% was<br />
metered (514 mgd), and less than 1% was<br />
estimated (5 mgd). Including domestic self<br />
supply, total withdrawal for potable use was 557<br />
mgd.<br />
<strong>Use</strong> Totals<br />
After imports and exports were accounted for<br />
and treatment losses were deducted, the total<br />
use was 480 mgd (Table 1). With the additional<br />
13 mgd for metered WUPs that did not need to<br />
submit the PSAR and estimated use for<br />
unmetered WUPs, the unadjusted gross water<br />
use was 493 mgd for approximately 4.9 million<br />
people. This gives an unadjusted gross per<br />
capita of 102 gpd. Taking the deductions<br />
allowed under Chapter 40D‐2, <strong>Florida</strong><br />
Administrative Code (F.A.C.), the adjusted gross<br />
per capita was 100 gpd and the compliance per<br />
capita was 97 gpd. See the public supply section<br />
in this report for descriptions of each per capita<br />
rate.<br />
There were 496 WUPs in active status that<br />
included the public supply use category. Of<br />
these, 205 WUPs (41%) were metered and 291<br />
WUPs were unmetered.<br />
DOMESTIC SELFSUPPLY<br />
This use category includes the estimated<br />
freshwater consumption from non‐permitted<br />
individual wells that provide potable water for<br />
indoor and outdoor personal domestic use. The<br />
District does not regulate domestic self‐supplied<br />
use; however, using population data and<br />
residential per capita rates for the counties, it<br />
was estimated to have been 37 mgd in <strong>2011</strong>.<br />
This was down from the 68 mgd estimated to<br />
have been used in 2010. The large decrease is<br />
thought to be due to the use of extrapolated<br />
census data from the 2000 Census for 2010 and<br />
the use of recent 2010 Census data for <strong>2011</strong>.<br />
RECREATION/AESTHETIC<br />
The recreation/aesthetic use category includes<br />
self‐supplied water used for large‐scale<br />
landscapes such as in parks associated with<br />
neighborhoods, counties and the state; sports<br />
playing fields; theme parks, water parks, and<br />
other recreational attractions; botanical gardens;<br />
cemeteries; and golf courses. Since the use is<br />
onsite, the withdrawal amount and the used<br />
amount are generally considered the same for<br />
each county. The total use (metered +<br />
estimated) for <strong>2011</strong> was 62 mgd. This was up 1<br />
mgd from the 61 mgd estimated to have been<br />
pumped in 2010. As in 2010, the biggest use of<br />
water in the recreation/aesthetic category was<br />
for irrigation of golf courses.<br />
AGRICULTURE<br />
The agriculture use category includes water use<br />
for irrigation of crops, freeze protection of crops,<br />
fertigation, chemigation, irrigation system<br />
maintenance, on‐site washing and packing,<br />
animal needs and potable supply for employees.<br />
The total use (metered + estimated) was 390<br />
mgd. This was down from the 467 mgd<br />
estimated to have been pumped in 2010. Several<br />
reasons for the large decrease are given in the<br />
Agriculture section of this report. The highest<br />
water use crop was citrus, followed by tomatoes.<br />
MINING/DEWATERING<br />
The mining/dewatering use category includes<br />
only water quantities that are removed from the<br />
mine site (consumptively used). These include<br />
dewatering quantities that are discharged offsite,<br />
washing and sorting of mined materials, nonrecycled<br />
slurry transport water, onsite<br />
processing and beneficiation of phosphates,<br />
water entrained with the product, and water for<br />
potable/sanitary use by employees. In this<br />
report, the consumptive uses are itemized by the<br />
type of material being extracted. If any of the<br />
water used is recirculated to settling ponds, it is<br />
not counted. The total use (metered +<br />
estimated) was 22 mgd in <strong>2011</strong>. This was down<br />
from the 27 mgd estimated to have been pumped<br />
in 2010.<br />
INDUSTRIAL/COMMERCIAL<br />
The industrial/commercial use category is for<br />
self‐supplied water used by industries and<br />
businesses. These are product manufacturing,<br />
phosphate processing that takes place away from<br />
the mine site, food and beverage processing and<br />
<strong>Southwest</strong> <strong>Florida</strong> <strong>Water</strong> <strong>Management</strong> District Page | 2
<strong>2011</strong> ESTIMATED WATER USE REPORT<br />
packing, power generation, and various general<br />
commercial operations. The total use (metered +<br />
estimated) in <strong>2011</strong> was 54 mgd. This was up<br />
from the 52 mgd estimated to have been pumped<br />
in 2010.<br />
WATER USE CAUTION AREAS<br />
<strong>Water</strong> withdrawal quantities for the three water<br />
use caution areas (WUCAs) and the Most<br />
Impacted Area of the Southern <strong>Water</strong> <strong>Use</strong><br />
Caution Area (SWUCA) are given in Appendix B.<br />
Total water quantities withdrawn for the five use<br />
types in the SWUCA was 607 mgd, which was<br />
58% of the total quantity withdrawn in the<br />
District. Groundwater withdrawals accounted<br />
for 84% of the total quantity withdrawn. Total<br />
groundwater withdrawals in the SWUCA for<br />
<strong>2011</strong> decreased by 53 mgd from 2010. The<br />
highest use in the SWUCA was for agriculture<br />
(326 mgd).<br />
In the Northern Tampa Bay WUCA (NTB WUCA),<br />
258 mgd of water was withdrawn in <strong>2011</strong>, which<br />
was 25% of the total withdrawals in the District.<br />
Groundwater withdrawals made up 63% of the<br />
total withdrawals in the NTB WUCA. The highest<br />
use in the NTB WUCA was public supply (207<br />
mgd).<br />
The Dover/Plant City WUCA overlaps both the<br />
SWUCA and NTB WUCA, so an accounting of<br />
withdrawal quantities there duplicates the count<br />
of gallons withdrawn in the other two WUCAs.<br />
However, irrespective of the other two WUCAs,<br />
74 mgd was withdrawn in the Dover/Plant City<br />
WUCA, and almost 100% was from groundwater.<br />
The highest use in the Dover/Plant City WUCA<br />
was for public supply (38 mgd).<br />
A metering initiative was implemented in 2010<br />
in the Dover/Plant City WUCA to install meters<br />
on all withdrawal points that have permitted<br />
freeze protection quantities or are permitted for<br />
a use that typically needs freeze protection. The<br />
installation of the meters progressed through<br />
<strong>2011</strong>, so the meter data will not be available until<br />
2012. However, input of the permitted freeze<br />
quantities from groundwater in the Dover/Plant<br />
City WUCA groundwater flow model closely<br />
simulated actual drawdown of the<br />
potentiometric surface of the Upper <strong>Florida</strong>n<br />
aquifer recorded during freeze events.<br />
Permitted maximum daily quantities for crop<br />
freeze protection from groundwater was 886<br />
mgd (Table C‐6, Appendix C).<br />
DATA SOURCES<br />
The primary sources of data for this report are<br />
permittee‐reported, monthly meter readings<br />
recorded in the District WUP database in the<br />
WMIS. The meter readings are mathematically<br />
converted to pumpage in gallons per day per<br />
month by the District. Estimates of water use are<br />
made based on the assumption that similar<br />
(same general WUP size and same use)<br />
permittees use water in similar proportions.<br />
Additional data sources include the PSAR forms<br />
and population studies from BEBR.<br />
In <strong>2011</strong>, the estimated functional population<br />
within the District that was supplied potable<br />
water via WUPs was 4.9 million people, which is<br />
up from the 4.7 million persons estimated for<br />
2010. Using the BEBR functional population for<br />
the counties (partial population for partial<br />
counties), the total population within the District<br />
was estimated to have been 5.1 million people in<br />
<strong>2011</strong>.<br />
METERED WITHDRAWALS<br />
Of the 7,745 issued WUPs in the District, 1,689<br />
WUPs (22%) had metering requirements on<br />
6,521 withdrawal points. There were 1,636 mgd<br />
of water permitted on an annual average basis to<br />
metered WUPs, which was 86% of the total<br />
permitted annual average quantity. In terms of<br />
pumpage, withdrawal of 889 mgd were metered<br />
(85%) while only 156 mgd (15%) were<br />
estimated (Tables 8, 11, 12).<br />
METHODOLOGY AND DATA QUALITY IMPROVEMENT<br />
The methodology used to generate the numbers<br />
used in this report are summarized in Appendix<br />
F. The District is improving the quality of the<br />
<strong>Estimated</strong> <strong>Water</strong> <strong>Use</strong> Reports by refining<br />
parameters requested and filtering the data to<br />
remove duplicative accountings of withdrawals<br />
as well as errors in the database. The<br />
improvements to the data are also summarized<br />
in Appendix F.<br />
<strong>Southwest</strong> <strong>Florida</strong> <strong>Water</strong> <strong>Management</strong> District Page | 3
<strong>2011</strong> ESTIMATED WATER USE REPORT<br />
This page is intentionally blank.<br />
<strong>Southwest</strong> <strong>Florida</strong> <strong>Water</strong> <strong>Management</strong> District Page | 4
<strong>2011</strong> ESTIMATED WATER USE REPORT<br />
INTRODUCTION<br />
The <strong>Southwest</strong> <strong>Florida</strong> <strong>Water</strong> <strong>Management</strong><br />
District (District) is one of five regional water<br />
management districts created by the <strong>Florida</strong><br />
Legislature and charged with managing water<br />
resources in the State of <strong>Florida</strong>. Jurisdictional<br />
boundaries for the five water management<br />
districts are mostly based on hydrologic<br />
features, such as watershed drainage basins,<br />
that frequently do not coincide with municipal<br />
boundaries. The District encompasses all or<br />
part of the following sixteen (16) counties:<br />
Charlotte, Citrus, DeSoto, Hardee, Hernando,<br />
Highlands, Hillsborough, Lake, Levy, Marion,<br />
Manatee, Pasco, Pinellas, Polk, Sarasota and<br />
Sumter.<br />
Figure 2 shows the 16 full and partial counties<br />
that are within the District’s jurisdiction and the<br />
boundaries of the three water use caution areas<br />
(WUCAs) in the District: the Southern WUCA<br />
(SWUCA), the Northern Tampa Bay WUCA (NTB<br />
WUCA), and the Dover/Plant City WUCA. The<br />
region known as the Most Impacted Area (MIA)<br />
is a special area within the SWUCA where<br />
permitting of new quantities that impact the<br />
Upper <strong>Florida</strong>n aquifer water level are no<br />
longer allowed. It is not a WUCA itself. <strong>Water</strong><br />
use permits within the WUCAs have additional<br />
monitoring and reporting requirements<br />
associated with them.<br />
Portions of the SWUCA and the NTB WUCA were<br />
created in 1989 and 1991 respectively because<br />
in each, long‐term overuse of the groundwater<br />
resource in the Upper <strong>Florida</strong>n aquifer<br />
contributed to sea water intrusion into the<br />
aquifer from the Gulf of Mexico and to the<br />
reduction of aquifer levels that adversely<br />
impacted some land uses and lowered water<br />
levels in some lakes and wetlands. The SWUCA<br />
was expanded in 2003 to include all of the<br />
southern groundwater basin. In 2007, the NTB<br />
WUCA was expanded to include all of Pasco<br />
County and all of Hillsborough County that was<br />
not in the SWUCA.<br />
The Dover/Plant City WUCA was created in June<br />
<strong>2011</strong> due to adverse impacts to wells and<br />
damage to offsite property caused by shortterm,<br />
but intense, pumping from the Upper<br />
<strong>Florida</strong>n aquifer for freeze protection of crops.<br />
The Dover/Plant City WUCA includes a portion<br />
of the SWUCA and the NTB WUCA but does not<br />
supersede them because the Dover/Plant City<br />
WUCA addresses short term pumping impacts<br />
and the SWUCA and NTB WUCA address long<br />
term pumping impacts.<br />
In all instances, the District’s Governing Board<br />
determined that recovery strategies were<br />
needed to address the resource impacts in these<br />
WUCAs. These strategies include enhanced<br />
regulatory requirements and other water use<br />
management tools to help address the impacts<br />
and return the resource to a previous, less<br />
impacted state. The recovery strategies are<br />
different for the three WUCAs.<br />
In <strong>2011</strong>, the Central <strong>Florida</strong> Coordination Area<br />
(CFCA) was an area of water resource concern<br />
that had been shared with the St. John’s River<br />
<strong>Water</strong> <strong>Management</strong> District and the South<br />
<strong>Florida</strong> <strong>Water</strong> <strong>Management</strong> District. Temporary<br />
rules had been put into place to protect the<br />
water resource from harm caused by rapidly<br />
increasing withdrawals of groundwater from<br />
the Upper <strong>Florida</strong>n aquifer. The rules for the<br />
CFCA were terminated on December 31, 2012.<br />
The three water management districts are<br />
currently writing regulations to replace the<br />
CFCA rules for the same area, and the effort is<br />
known as the Central <strong>Florida</strong> <strong>Water</strong> Initiative<br />
(CFWI).<br />
HISTORY OF SWFWMD ESTIMATED WATER USE<br />
REPORTS<br />
The District has prepared <strong>Water</strong> <strong>Use</strong> Estimate<br />
(EWU) reports since 1982. Through 1986, the<br />
preparation of these reports was a cooperative<br />
effort between the District and U.S. Geological<br />
Survey (USGS). Beginning in 1987, the District<br />
published these reports on an annual or biannual<br />
basis. Prior to 1992, the EWU reports<br />
relied on non‐documented data such as<br />
Benchmark Farms data extrapolated for WUPs<br />
for agriculture use, voluntary survey responses<br />
for public supply, the University of <strong>Florida</strong>’s<br />
Bureau of Economic and Business Research<br />
(BEBR) population information for domestic<br />
use (this is still done because the District does<br />
not regulate this water use), and only metered<br />
<strong>Southwest</strong> <strong>Florida</strong> <strong>Water</strong> <strong>Management</strong> District Page | 5
<strong>2011</strong> ESTIMATED WATER USE REPORT<br />
data was used for industrial use and power<br />
generation use. The historic use categories<br />
were also slightly different from those that have<br />
been used since 1992. It is not recommended to<br />
create charts and graphs that combine the pre‐<br />
1994 water use totals with the post‐1994 water<br />
use totals due to the change in scientific<br />
method.<br />
The data used for this report is primarily from<br />
the District WUP database in the <strong>Water</strong><br />
<strong>Management</strong> Information System (WMIS)<br />
database. The water quantity data in the EWU<br />
is derived from metered withdrawal points and<br />
from estimates made on unmetered withdrawal<br />
points. The provenance of the data will be<br />
clearly differentiated throughout the report.<br />
The population data is based on population<br />
numbers given by 160 public supply permittees<br />
on the Public Supply Annual Report (PSAR)<br />
forms and BEBR population data from the 2010<br />
Census.<br />
In this report, water uses in the tables are<br />
presented as “Metered + <strong>Estimated</strong>”. Since the<br />
total water use contains an element of<br />
estimation, this report is collectively known as<br />
the <strong>Estimated</strong> <strong>Water</strong> <strong>Use</strong> Report. Some tables<br />
(Tables 8, 10, 11, 12) present the metered<br />
pumpage data separately from the estimated<br />
pumpage data.<br />
Unless otherwise indicated, quantity data is<br />
reported as an annual average daily rate using<br />
the unit “million gallons per day” (mgd). For<br />
those counties which are only partially within<br />
District boundaries, (Charlotte, Highlands, Lake,<br />
Levy, Marion and Polk), the pumpage and<br />
estimates include water use data for only the<br />
portions of the counties within the District. In<br />
many charts, the source of water is also<br />
identified to be groundwater or surface water.<br />
WATER USE CATEGORIES<br />
The District identifies the use of water by five<br />
broad “predominant use” categories:<br />
Public Supply<br />
Recreation/Aesthetic<br />
Agricultural<br />
Mining/Dewatering<br />
Industrial/Commercial<br />
Domestic Self‐Supply*<br />
* Domestic self‐supply is not regulated by the District, and<br />
the data used is obtained from BEBR population and<br />
average county gross per capita use.<br />
There are many specific water uses within each<br />
water use category, such as citrus, pasture, and<br />
vegetable irrigation in the agriculture water use<br />
category, or common area irrigation and<br />
residential single family use in the public supply<br />
water use category. A section of this report is<br />
dedicated to each of these five water use<br />
categories. This report also includes a section<br />
on domestic self‐supply even though this is not<br />
a regulated water use.<br />
MEASURING WATER USE<br />
Being able to keep accurate records on water<br />
used is tremendously important to managing<br />
the limited water resources of the District.<br />
Doing so increases the likelihood that water is<br />
shared fairly, and withdrawals of water do not<br />
adversely impact existing legal users, existing<br />
offsite land use, the environment, and the<br />
resource itself. Compliance varies from<br />
permittee to permittee and from year to year;<br />
however, the District has a high number of<br />
responsible permittees, so it enjoys a high<br />
success rate for receiving the data and reports<br />
required under the terms and conditions of<br />
their water use permits. Maintaining accurate<br />
records of pumpage is also of high value to<br />
permittees having metered WUPs. Overpumpage<br />
of the permitted quantity is a violation<br />
of the terms of the WUP, which is a legally<br />
binding document issued by the state. If such a<br />
violation occurs, it is very helpful to a permittee<br />
if he or she can demonstrate that the overpumpage<br />
was a rare if not isolated occurrence.<br />
Chronic over‐pumping does result in monetary<br />
fines.<br />
Permittees can submit meter reading data (as<br />
well as other types of data) on scanning forms<br />
that they mail to the District, via the District<br />
website after they establish a web account, or<br />
using excel spreadsheets that can also be<br />
electronically uploaded. Tallying actual<br />
pumpage in the District requires the<br />
compilation and refinement of monthly meter<br />
reading data on 6,521 withdrawal points<br />
contained in the WUP database in the WMIS.<br />
<strong>Southwest</strong> <strong>Florida</strong> <strong>Water</strong> <strong>Management</strong> District Page | 6
<strong>2011</strong> ESTIMATED WATER USE REPORT<br />
Metered <strong>Water</strong> <strong>Use</strong> In <strong>2011</strong>, permittees<br />
reported meter readings or pumpage data on<br />
1,689 WUPs. Metering pumpage is required on<br />
all WUP in the WUCAs that are permitted for<br />
100,000 gpd or more on an annual average<br />
basis. Outside of the WUCAs, the metering<br />
threshold is 500,000 gpd on an annual average<br />
basis.<br />
In <strong>2011</strong>, metering was required on all permits<br />
in the Dover/Plant City WUCA that were<br />
permitted with freeze protection quantities to<br />
be withdrawn from groundwater or that had<br />
groundwater permitted for supplemental<br />
irrigation of crops that typically need freeze<br />
protection. The District provided funding for<br />
the flow meters and their installation on all<br />
existing withdrawal points newly affected by<br />
the rule. Previously, permittees did not have to<br />
submit meter readings on pumpage for freeze<br />
protection of crops even if the withdrawal point<br />
was metered. Permittees were required to<br />
submit an estimate of their freeze protection<br />
pumpage based on hours of operation. It was<br />
considered a hardship for growers to record<br />
meter readings before initiation of pumping and<br />
then again after cessation of pumping in the<br />
middle of the night when they were trying to<br />
save their crops from freeze damage.<br />
To address this hardship, the District also<br />
provided and installed automatic meter reading<br />
devices on each flow meter on each operational<br />
freeze protection withdrawal point so that<br />
hourly meter readings of freeze protection<br />
pumpage would be electronically received by<br />
the District. The subscription fee for the<br />
automatic sending of the meter reading by the<br />
automated meter reading device vendor to the<br />
District is also paid for by the District. This<br />
pumpage data is not available for calendar year<br />
<strong>2011</strong> because the installation of the new meters<br />
and automated meter reading devices were still<br />
ongoing. The 2012 EWU will include the<br />
pumpage quantities, but for this year, only the<br />
permitted freeze protection quantities are<br />
reported. Appendix F contains a short summary<br />
of the history of metering in the District.<br />
Multiple Measurements of <strong>Water</strong> <strong>Use</strong> <strong>Water</strong> use<br />
is measured in numerous ways to ensure that<br />
the quantities withdrawn are reasonable and<br />
beneficial with respect to the use. Direct<br />
pumpage from the resource straight to the end<br />
use is “production” pumpage. Pumpage from<br />
the resource into a containment, such as a pond,<br />
from which the quantities are then repumped to<br />
the end use is called “augmentation”.<br />
Monitoring withdrawals from the groundwater<br />
and surface water resources are essential to<br />
management and protection of these resources.<br />
Only production pumpage and augmentation<br />
pumpage are included in this report so that this<br />
vital measurement is provided for the District’s<br />
programs for resource management and<br />
protection. The quantities withdrawn from the<br />
augmented containment is called “repump”.<br />
Repumped quantities are excluded because<br />
those withdrawals are not directly from the<br />
resource and have already been counted. Until<br />
this report, repump quantities were included as<br />
a surface water source in the tally of permitted<br />
quantities.<br />
Other types of meter readings that are reported<br />
are for District‐required environmental<br />
mitigation, inflow quantities and use of<br />
reclaimed water supplied by a water treatment<br />
plant, inflow quantities and use of other types of<br />
alternative water supplies, and flow at transfer<br />
points between utilities. These flow<br />
measurements are not included in this report.<br />
Typically environmental mitigation pumpage is<br />
merely circulating water from the aquifer to the<br />
surface where it quickly filters downward back<br />
to the aquifer. This happens because there is<br />
poor confinement or lack of confinement<br />
between the surface and the aquifer in these<br />
locations. The poor confinement or lack of<br />
confinement between the surface and the Upper<br />
<strong>Florida</strong>n aquifer is the reason the pumpage<br />
from the aquifer impacts the surface.<br />
<strong>Estimated</strong> <strong>Water</strong> <strong>Use</strong> Since the 1991‐1992 EWU<br />
reports, non‐metered water use has been<br />
estimated for permits that did not have a<br />
condition requiring the permittee to submit<br />
pumpage information. The estimation<br />
methodology was developed using the<br />
assumption that permittees having a permit<br />
that is similar to a metered permit will use a<br />
proportionally similar amount of water. Most of<br />
<strong>Southwest</strong> <strong>Florida</strong> <strong>Water</strong> <strong>Management</strong> District Page | 7
<strong>2011</strong> ESTIMATED WATER USE REPORT<br />
the unmetered WUPs are Small General WUPs<br />
(usually those issued for less than 100,000 gpd<br />
on an annual average basis). However, since<br />
some small WUPs are metered if circumstances<br />
warrant it to monitor potential impacts,<br />
metered data is available to be applied to the<br />
small unmetered WUPs. The comparisons take<br />
into account that permittees having small WUPs<br />
usually withdraw amounts closer to their<br />
permitted quantities than do the permittees<br />
having larger WUPs.<br />
Some WUPs that are required to be metered<br />
include withdrawal points that are not required<br />
to be metered. Generally this is true for<br />
withdrawal points permitted for less than<br />
10,000 gpd for uses different from the main use<br />
on the permit. Such separate uses include tank<br />
fill for fertigation or chemigation, livestock<br />
watering, and potable supply for employees.<br />
The individual use quantities from these smaller<br />
withdrawal points are not estimated; however<br />
their permitted quantities are included in the<br />
scaling procedure (see Appendix F).<br />
The District’s best management tool is the fact<br />
that 87% of the water used in the District is<br />
metered. This is accomplished via metering<br />
data on only 22% of the WUPs issued, as shown<br />
in the following table.<br />
Status<br />
Metered and <strong>Estimated</strong><br />
<strong>Water</strong> <strong>Use</strong> Permits, <strong>2011</strong><br />
No. of<br />
WUPs<br />
Excludes Domestic Self‐Supply<br />
%<br />
Pumped<br />
Quantity<br />
(mgd)<br />
Metered 1,689 22 909 87<br />
<strong>Estimated</strong> 6,056 78 139 13<br />
Total 7,745 100 1,048 100<br />
CAVEATS FOR ESTIMATION OF TOTAL WATER USE<br />
Not all the pumpage that occurs in the District is<br />
quantifiable either directly via metering or by<br />
estimations based on use similarities. Entities<br />
using less than 100,000 gallons per day (gpd)<br />
from wells that are less than 6‐inches in<br />
diameter and/or from surface water withdrawal<br />
pipes that are less than 4‐inches in diameter are<br />
not required to have a WUP. In the MIA of the<br />
SWUCA, the threshold to require a WUP is when<br />
%<br />
the cumulative outside diameter of the wells<br />
constructed after April 11, 1994 is greater than<br />
6 inches at the surface. Pumpage data for small<br />
non‐domestic water users who are below<br />
thresholds for requiring a water use permit do<br />
not exist. It cannot be estimated because the<br />
intended use of the withdrawal points is usually<br />
not recorded. In addition, the estimate for<br />
domestic self‐service does not include<br />
quantities that may be used for small water<br />
uses, such as a personal grove or small<br />
vegetable garden.<br />
The meter readings submitted by permittees<br />
are only as good as the submitter makes them.<br />
Obvious errors such as dropping zeros on a<br />
meter that reads to one hundred or one<br />
thousand gallons, or missed calculations for<br />
meter rollovers are fixed when found (with the<br />
permission of the permittee). Other possible<br />
errors are masked by the fact that pumpage on a<br />
property can and does vary greatly from month<br />
to month and from year to year. Many factors<br />
affect water use, including but not limited to,<br />
water conservation activities, economic<br />
conditions, weather, and the use of alternative<br />
water sources. In light of this, since the District<br />
received 78,252 meter readings (monthly meter<br />
readings for 6,521 withdrawal points) in <strong>2011</strong>,<br />
it is difficult to analyze whether variations in<br />
pumpage, which are within the realm of<br />
possibility, are real or are a recording or<br />
reporting error.<br />
Throughout this report, numbers that have been<br />
generated via SAS computer programs have<br />
been rounded to the nearest thousand gallons<br />
per day, expressed as million gallons per day to<br />
three decimal places. As is correct, the data is<br />
rounded at the last stage of analysis. The SAS<br />
datasets are calculated to many decimal places.<br />
SAS output is put into Excel spreadsheets, and<br />
Excel stores the data as it received it, but<br />
portrays it as rounded. Thus, every alternative<br />
way to add data appears to give a slightly<br />
different answer (despite the commutative and<br />
associative laws of addition, subtraction, and<br />
multiplication). When these numbers are<br />
compiled in different ways, apparent<br />
discrepancies due to rounding become visible.<br />
Thus, the totals shown may be slightly different<br />
<strong>Southwest</strong> <strong>Florida</strong> <strong>Water</strong> <strong>Management</strong> District Page | 8
<strong>2011</strong> ESTIMATED WATER USE REPORT<br />
from manual calculations performed by the<br />
reader. For this reason, in the chapters on<br />
specific water use categories that follow, the<br />
million gallons per day totals, which are given to<br />
three decimal places in the tables and<br />
appendices, are given to only one decimal place<br />
in the text.<br />
PROCESSING WATER USE DATA<br />
The scaling, fractioning and grouping of water<br />
use data that is described in Appendix F is<br />
another reason that the data contained within<br />
the summary tables of each chapter should be<br />
used with discretion when comparing it to a<br />
straight download of data directly from the<br />
database. In addition, most permittees have<br />
many detailed uses catalogued on their WUPs.<br />
The detailed uses are grouped into the five<br />
water use categories mentioned earlier;<br />
however, using only this level of grouping does<br />
not give enough detail on why more water is<br />
used for one water use activity than another.<br />
On the other hand, the report would become<br />
overly complicated if each detailed use was<br />
tallied alone. This report assigns the detailed<br />
uses into groups based on general similarities.<br />
WATER USE VERSUS WATER WITHDRAWN<br />
For all water use categories except public<br />
supply, water use in this report is synonymous<br />
with water withdrawn (pumped) because water<br />
is used where and when it is withdrawn. There<br />
are some water losses in transporting the water<br />
to the end use at any of these sites, but the<br />
majority of such losses are minimal. However,<br />
for the public supply water use category, the<br />
actual water use in a service area is sometimes<br />
quite different from the amount of water<br />
withdrawn or pumped in that area. The<br />
difference is due to imports and exports to and<br />
from other utilities, including those outside of<br />
the District; to water treatment losses, which<br />
can be in excess of 30% for some systems; and<br />
to transmission losses between utilities due to<br />
long pipeline distances.<br />
<strong>Water</strong> is assumed to be used where it is<br />
withdrawn by the small utilities and potable<br />
supply quantities withdrawn by entities that<br />
provide potable water to persons other than<br />
household members.<br />
The data contained in this report is not used to<br />
determine compliance with the terms and<br />
conditions of the WUP.<br />
SNAPSHOT IN TIME<br />
The WUP database in the WMIS is continuously<br />
updating in real time as new permits are issued,<br />
existing permits are modified, and permits<br />
expire. Although not as volatile, in this aspect, it<br />
is like the stock exchanges’ fluctuations in stock<br />
value over the day. The estimated water use<br />
database is only a “snapshot” of this dynamic<br />
database taken on or near December 31 of each<br />
year. This snapshot captures all attributes of a<br />
WUP, which can number in the thousands.<br />
Attributes used for this report are the status of<br />
the WUP; uses for the water; total permitted<br />
quantities for the permit, for each withdrawal<br />
point, and for each use type; and a series of<br />
alpha‐numeric codes applied to the permit and<br />
withdrawal points that fully describe the<br />
purpose, intent and use of the water and<br />
identify the type of metering conditions.<br />
The District does not wait until final entry of<br />
these attributes of the WUP is made into the<br />
database to issue the WUP. With large WUPs,<br />
there can be a substantial delay between the<br />
time the WUP is issued and when the WUPs<br />
shows as issued in the database. These larger<br />
WUPs are missed in the snapshot if they are<br />
issued at the end of the year. However, since<br />
2010, these missed WUPs are identified and<br />
programmed back into the EWU database.<br />
Pumpage Data The status of the WUP on<br />
December 31 triggers capture of its pumpage<br />
data if it has the correct pumpage codes. The<br />
pumpage data for the entire year is captured<br />
whether or not it occurred under a revision that<br />
shows a status of “Approved” or not. Pumpage<br />
is more easily isolated in time, so a final<br />
snapshot of the <strong>2011</strong> pumpage was taken only<br />
after as much as possible of the tardily<br />
submitted information was input, and District<br />
staff had been able to identify pumpage and<br />
meter reading problems that would give rise to<br />
errors in the tally. The <strong>2011</strong> pumpage snapshot<br />
was taken October 30, 2012, after many<br />
pumpage errors were corrected by Resource<br />
Regulation staff. Whenever possible, the<br />
database is corrected for obvious errors;<br />
<strong>Southwest</strong> <strong>Florida</strong> <strong>Water</strong> <strong>Management</strong> District Page | 9
<strong>2011</strong> ESTIMATED WATER USE REPORT<br />
however, smaller errors in the data are not<br />
caught and can cumulatively cause a large error<br />
when data is amalgamated. The District puts a<br />
great amount of staff time and energy into<br />
providing the best possible pumpage data for<br />
these reports<br />
APPENDICES<br />
Six appendices are located in the back of this<br />
report.<br />
Appendix A shows details for public supply<br />
WUPs, and the data presented on PSAR forms<br />
are summarized. It also contains detailed lists<br />
of all metered WUPs per water use category and<br />
gives the metered pumpage quantity, the permit<br />
total, and how much of the permitted total for<br />
that WUP is for the listed water use category.<br />
The web version of this report also includes the<br />
same information for unmetered WUPs. A table<br />
showing the monthly withdrawals for each<br />
water use category, except public supply,<br />
follows each water use category listing.<br />
Appendix B shows the total (estimated plus<br />
metered) annual average quantities withdrawn<br />
by water source (groundwater or surface<br />
water) for the District as well as for the three<br />
WUCAs.<br />
Appendix C identifies the total permitted annual<br />
average quantities from surface water and<br />
groundwater by county for the District and the<br />
WUCAs. Appendix C also contains freeze<br />
protection quantities permitted for agricultural<br />
use in the Dover/Plant City WUCA.<br />
Appendix D contains 10 years of historic water<br />
use for WUPs issued for one million gallons per<br />
day or more by water use category. In addition,<br />
a ten‐year public supply per capita water use<br />
comparison is presented in Table D‐6.<br />
Appendix E contains calculations for the<br />
uniform per capita report prepared for the<br />
<strong>Florida</strong> Department of Environmental<br />
Protection.<br />
Appendix F provides an explanation on how the<br />
data in the WUP database of the WMIS is<br />
analyzed and processed to create the EWU<br />
reports. It also contains information regarding<br />
changes to the data captured and used in the<br />
2010 EWU Report and additional improvements<br />
to the data captured for the <strong>2011</strong> EWU Report.<br />
<strong>Southwest</strong> <strong>Florida</strong> <strong>Water</strong> <strong>Management</strong> District Page | 10
<strong>2011</strong> ESTIMATED WATER USE REPORT<br />
Legend<br />
WUPs Permitted in <strong>2011</strong><br />
County Boundary<br />
District Boundary<br />
Figure 1. <strong>Water</strong> <strong>Use</strong> Permits In the <strong>Southwest</strong> <strong>Florida</strong> <strong>Water</strong> <strong>Management</strong> District<br />
<strong>Southwest</strong> <strong>Florida</strong> <strong>Water</strong> <strong>Management</strong> District Page | 11
<strong>2011</strong> ESTIMATED WATER USE REPORT<br />
Figure 2. <strong>Southwest</strong> <strong>Florida</strong> <strong>Water</strong> <strong>Management</strong> district, Counties, and <strong>Water</strong> <strong>Use</strong> Caution Areas<br />
<strong>Southwest</strong> <strong>Florida</strong> <strong>Water</strong> <strong>Management</strong> District Page | 12
<strong>2011</strong> ESTIMATED WATER USE REPORT<br />
PUBLIC SUPPLY WATER PUMPAGE = 520<br />
MGD<br />
PUBLIC SUPPLY WATER USE = 493 MGD<br />
For the public supply use category, quantities of<br />
water used by customers are less than quantities<br />
of water withdrawn from the resources.<br />
Treatment and distribution system losses,<br />
imports, and exports between public supply<br />
utilities are included in the public supply category<br />
and create the difference between water used<br />
(provided) and water withdrawn (pumped). In<br />
<strong>2011</strong>, withdrawals from groundwater and surface<br />
water bodies for public supply under the<br />
authority of water use permits totaled to 519.6<br />
mgd. Slightly over 99% was metered (514.4<br />
mgd), and less than 1% was estimated ( 5.2 mgd).<br />
After distribution losses associated with imports<br />
and exports were accounted for, and treatment<br />
losses were deducted, the total gross public<br />
supply water use was 493.3 mgd.<br />
GENERAL INFORMATION<br />
The public supply water use category is for water<br />
quantities distributed by public and private water<br />
utilities (as defined by the <strong>Florida</strong> Department of<br />
Environmental Protection (FDEP) as a community<br />
water system that serves at least 15 service<br />
connections that are used by year‐round<br />
residents, or one that regularly serves at least 25<br />
individual year‐round residents). It is also for<br />
personal/sanitary water provided to employees,<br />
visitors and guests where the activity for which<br />
the permit was issued is not connected to a publis<br />
supply utility. Sub‐categories within the public<br />
supply use category include uses not directly<br />
related to population, such as fire suppression<br />
use, lawn and landscape irrigation, common area<br />
irrigation, and water supplied to businesses and<br />
commerce. These nonresidential users are<br />
included in the public supply category because<br />
the water for these uses are supplied by a public<br />
supply utility.<br />
<strong>2011</strong> DATA<br />
There are two sources of data for the public<br />
supply water use category: the WUP database in<br />
the WMIS and the Public Supply Annual Reports<br />
(PSARs). The WUP database has all the pumpage<br />
from withdrawal points that have a metering<br />
condition if the permittee submitted them. The<br />
WUP database shows that in <strong>2011</strong>, there were<br />
496 WUPs in active status that included the public<br />
supply use category. Of these, 205 had metered<br />
withdrawal points, and monthly submittals of<br />
meter readings and/or pumpage quantities were<br />
required. In addition, permittees that fit the FDEP<br />
definition of a utility and have WUPs that were<br />
permitted for 100,000 gpd or more on an annual<br />
average basis for public supply are required to<br />
submit the PSAR forms. These forms provide<br />
space in which the permittee can report their<br />
water pumpage, treatment processes, water<br />
losses, imports, exports, and calculate their gross<br />
per capita rate, adjusted gross per capita rate, and<br />
if applicable, the compliance per capita rate. They<br />
are also required to show how much is provided<br />
for residential use (single family, multi‐family,<br />
mobile homes), for industrial/commercial use, for<br />
golf course irrigation and for irrigation of<br />
common areas within the service area.<br />
In <strong>2011</strong>, 160 out of 177 permittees that were<br />
required to submit this report did so. Others that<br />
did not may not have started withdrawing from<br />
their proposed public supply wellfield or did not<br />
have their water treatment plant in operation in<br />
<strong>2011</strong>. For existing permittees that used water but<br />
did not submit the data, District pumpage records<br />
and Bureau of Economic Business Research<br />
(BEBR) populations were used. This information<br />
is summarized in Tables A‐1, A‐2, and A‐3 in<br />
Appendix A.<br />
Both the pumpage submitted on the PSAR forms<br />
and the pumpage, as calculated from the meter<br />
readings submitted during <strong>2011</strong> by the permittee,<br />
are shown in Table A‐1. The pumpage that was<br />
given on the PSAR form should be the same as<br />
what they submitted to the District over the<br />
course of the year. In most instances, this is true.<br />
However, cumulatively, there was a 17 mgd<br />
difference between the pumpage given on the<br />
PSAR forms and what was in the District’s WUP<br />
database. The PSAR reported pumpage was 488.5<br />
mgd from 160 permits while the District’s records<br />
show that 471.1 mgd was pumped from these<br />
same WUPs.<br />
<strong>Southwest</strong> <strong>Florida</strong> <strong>Water</strong> <strong>Management</strong> District Page | 13
<strong>2011</strong> ESTIMATED WATER USE REPORT<br />
The District database on pumpage is only as good<br />
as the data that is submitted. There were 35<br />
WUPs showing pumpage discrepancies between<br />
what they gave on the PSAR and what was in the<br />
database. Some was higher, and some was lower.<br />
Each discrepancy was researched, and when<br />
errors were found in the District’s data, the<br />
District data was corrected. However, that did not<br />
resolve the discrepancy. Since District pumpage<br />
data exists is greater detail, it was used in this<br />
report for 94% of the WUPs that had submitted or<br />
were supposed to have submitted PSAR forms.<br />
The PSAR pumpage was used for six WUPs on the<br />
PSAR list, because two WUPs were not metered<br />
and four WUPs had significant submittal gaps for<br />
<strong>2011</strong>. The total pumpage for the WUPs on the<br />
PSAR list in Table A‐1 was 506.3 mgd.<br />
To tally District‐wide totals, 8.1 mgd water<br />
pumpage was added for metered public supply<br />
users that did not have to submit a PSAR, and 5.2<br />
mgd was added for unmetered public supply<br />
water users. The total water withdrawn was<br />
calculated to be 520 gpd. After distribution losses<br />
associated with imports and exports were<br />
accounted for, and treatment losses were<br />
deducted, the total gross water use was 493.3<br />
mgd. Hillsborough County (131.6 mgd) and<br />
Pinellas County (88.8 mgd) together used 45% of<br />
the total water use for public supply in the District<br />
(Table 1).<br />
In <strong>2011</strong>, groundwater was the principal source of<br />
public supply water in the District, with 83%<br />
(326.3 mgd) coming mostly from the Upper<br />
<strong>Florida</strong>n aquifer. Seventeen percent (17%)<br />
(193.0 mgd) came from withdrawals from surface<br />
water bodies. The surficial aquifer and<br />
intermediate aquifer system are groundwater<br />
sources in some southern counties, such as<br />
Sarasota and Charlotte counties, where the Upper<br />
<strong>Florida</strong>n aquifer is either not readily accessible or<br />
has poor water quality.<br />
Of the total regulated withdrawals from surface<br />
water bodies, 86% was for public supply. Five<br />
counties in the District depend significantly on<br />
surface water sources for public supply water use.<br />
The City of Punta Gorda in Charlotte County relies<br />
on the Shell Creek Reservoir. Portions of<br />
Charlotte, DeSoto and Sarasota counties receive<br />
surface water withdrawn from the Peace River in<br />
DeSoto County. The Hillsborough River supplies<br />
water to the City of Tampa and to some parts of<br />
Hillsborough County. Tampa Bay <strong>Water</strong><br />
withdraws and treats surface water from the<br />
Hillsborough and Alafia rivers and from the<br />
Tampa Bypass Canal for their member<br />
governments. Manatee County and the City of<br />
Bradenton rely almost completely on reservoirs<br />
known as Lake Manatee and Evers Lake<br />
respectively.<br />
ESTIMATED WATER USE FOR UNMETERED PUBLIC<br />
SUPPLY WUPS<br />
The calculation of estimated public supply water<br />
use data is based on the assumption that<br />
permittees not required to report pumpage use<br />
roughly the same percentage of their average<br />
daily permitted quantity as those permittees that<br />
are required to report pumpage. The magnitude<br />
of the quantities permitted on both types of<br />
permits (metered and un‐metered) was also a<br />
consideration when applying a ratio of used<br />
quantities to permitted quantities. Appendix F<br />
gives greater detail on how water use estimates<br />
are made.<br />
In <strong>2011</strong>, the estimated public supply water<br />
withdrawn was approximately 5.2 mgd. Polk<br />
County had the highest estimated public supply<br />
withdrawals at approximately 1.6 mgd, and<br />
Hillsborough County had the second highest<br />
estimated public supply withdrawals at 1.2 mgd.<br />
It is important to note that some residential<br />
customers receiving water from a public supplier<br />
may have a well for landscape irrigation purposes<br />
only. It is difficult to estimate how much water<br />
was withdrawn and used in this manner. Those<br />
withdrawals are neither included nor estimated in<br />
these reports.<br />
Figure 3 gives a visual comparison of county‐level<br />
public supply water pumpage and county‐wide<br />
water use via two pie charts.<br />
Figure 4 compares monthly estimated public<br />
supply water use with total‐area, monthly rainfall.<br />
FUNCTIONAL POPULATION<br />
Block‐level census data from the 2010 Census was<br />
applied to the reasonableness of functional<br />
population estimates submitted by public supply<br />
permittees on the PSAR forms. It was also used<br />
<strong>Southwest</strong> <strong>Florida</strong> <strong>Water</strong> <strong>Management</strong> District Page | 14
<strong>2011</strong> ESTIMATED WATER USE REPORT<br />
for the remaining population estimates. The<br />
number of permanent residents was adjusted for<br />
seasonal residency, tourists, and commuters<br />
coming into the service area for the day if the<br />
permittee made the calculations and submitted<br />
the supporting documentation. This yielded a<br />
“functional” population, which is the population<br />
given in this report.<br />
Table 1 provides data on water withdrawn and<br />
used by public supply permittees who were<br />
metered but did not have to submit a PSAR. It<br />
also provides the estimated withdrawal and use<br />
rates for public supply on WUPs that did not have<br />
a metering requirement. An estimated population<br />
served by these two groups was calculated by<br />
multiplying the county average unadjusted gross<br />
per capita rate (county unadjusted gross water<br />
use divided by the county population) by the<br />
combined metered plus estimated pumpage rate.<br />
This calculation gave an additional 123,163<br />
people, bringing the total to just under 4.9 million<br />
people served potable water under District WUPs.<br />
A caveat should be added for the population<br />
estimated from the unmetered public supply use.<br />
Some pumpage records of this type of use are<br />
actually personal and sanitary use by employees<br />
and guests on ranches and farms, in<br />
industrial/commercial companies,<br />
recreation/aesthetic enterprises, and at<br />
mining/dewatering operations. Employees and<br />
club members are probably already counted<br />
under a utility’s population count, and guests<br />
might also be already counted under seasonal and<br />
tourist population adjustments done to<br />
permanent population data by utilities.<br />
GROSS USE<br />
Table A‐1 in Appendix A lists the amount of raw<br />
water withdrawn, functional population served,<br />
and the general water sources (groundwater,<br />
surface water, both, or desalinated water) for<br />
each permit. Losses associated with desalination<br />
water treatment (typically reverse osmosis (RO)<br />
or electro‐dialysis reversal (EDR)) and some<br />
conventional treatment processes (such as<br />
flocculating suspended solids and filter<br />
backwashing) are also shown. The finished water<br />
actually made available for use by customers of<br />
the utilities on the PSAR list out of the 506.3 mgd<br />
pumped in <strong>2011</strong> were 479.4 mgd, or 95% of the<br />
water withdrawn.<br />
Table A‐1 also provides permit‐specific details<br />
about water imports and exports. Thirteen public<br />
supply permits were only for withdrawal and<br />
exportation of water to other utilities (WUP No.<br />
11771 is shown three times but is only counted<br />
once). Eight WUPs were public supply wholesale<br />
importers only. Two permittees that have<br />
multiple WUPs presented their population and<br />
use data under their WUP that included the water<br />
treatment plant (Manatee County and City of<br />
Sarasota).<br />
If a permit served a population in more than one<br />
county, or if its use occurred in a county other<br />
than the county of withdrawal, it is possible for<br />
the same permit number to be listed in more than<br />
one county within this table.<br />
PER CAPITA<br />
Per Capita is a measure of the amount of water<br />
used by a population. The District uses three<br />
measures of per capita: unadjusted gross,<br />
adjusted gross, and compliance. These per capita<br />
types are shown in Table A‐1 of Appendix A for<br />
the larger utilities, and a brief explanation is<br />
provided for each per capita type in this section.<br />
For a more complete explanation, the reader can<br />
access the <strong>Water</strong> <strong>Use</strong> Permit Information Manual,<br />
Part B, Basis of Review that is adopted under Rule<br />
40D‐2.019, F.A.C., at the District website.<br />
The required per capita rate for all public supply<br />
permittees to attain was set to 150 gpd by rule in<br />
2009, and this rate has to be achieved by<br />
December 31, 2019 by all public supply<br />
permittees. Those public supply permittees that<br />
have a five year average (2005‐2009) compliance<br />
per capita rate (explained below) above 150<br />
gpd/person limit must be at least half of the way<br />
to this goal by December 31, 2014. The 150 gpcd<br />
(gallons per capita day) requirement can be met<br />
via the unadjusted gross per capita, adjusted<br />
gross per capita, or compliance per capita.<br />
A fourth type of per capita, residential per capita,<br />
exists and is presented in Appendix A, Table A‐2.<br />
There are no regulations associated with this per<br />
capita rate.<br />
UNADJUSTED GROSS PER CAPITA<br />
<strong>Southwest</strong> <strong>Florida</strong> <strong>Water</strong> <strong>Management</strong> District Page | 15
<strong>2011</strong> ESTIMATED WATER USE REPORT<br />
Eighteen WUPs did not have a gross use because<br />
they were either wholesale suppliers only, had<br />
not begun withdrawals yet, or combined their<br />
withdrawals under multiple WUPs into one for<br />
the calculations. For the remaining 159 WUPs,<br />
the sum of the gross use was 479.4 mgd in <strong>2011</strong>.<br />
Division by the functional population of 4.72<br />
million persons gives an Unadjusted Gross Per<br />
Capita (UGPC) rate of 102 gpd. There were 136<br />
utilities (86%) that met the 150 gpcd or less per<br />
capita rate requirement under their UGPS rate.<br />
This was the same as the number of utilities that<br />
met this requirement under their UGPC in 2010,<br />
although the utilities in this group might be<br />
different.<br />
High per capita water use is more common in<br />
master‐metered communities. People who are<br />
not held accountable and charged for the amount<br />
of water they use do not have an economic<br />
incentive to be efficient. Residential<br />
developments with large lots sizes have larger<br />
lawns and tend to have higher per capita water<br />
use rates. New residential developments with a<br />
high number of new lawns also tend to have high<br />
per capita water use rates because homeowners<br />
“water‐in” the new lawns. Communities that have<br />
less than the District average number of persons<br />
per dwelling unit will also show a higher<br />
unadjusted per capita rate. If the permittee can<br />
support the data, an adjustment can be made to<br />
account for the low persons per household effect<br />
on per capita rate calculations.<br />
A low unadjusted gross per capita water use rate<br />
is more common in communities with high water<br />
prices and for permittees using the “dwelling<br />
unit” population estimation method. This method<br />
takes the number of dwelling units in a utility’s<br />
service area and multiplies that number by an<br />
average number of people per household. This<br />
method incorrectly assumes that all dwelling<br />
units are occupied year around, thus erroneously<br />
over‐estimating the population.<br />
The accuracy of per capita water use rate data is<br />
highly dependent on the quality of population<br />
information used in the calculation. A population<br />
that is adjusted to be a functional population<br />
yields not only a lower per capita rate but a more<br />
accurate one. In the past, per capita calculations<br />
could also have been affected by population data<br />
that is skewed by double reporting of population<br />
in overlapping public supply service areas.<br />
However, since 2008, the District has had fully<br />
digitized service area information in its GIS<br />
database, and no overlaps are allowed. All<br />
population data submitted is verified, and if the<br />
population submitted seems unduly large or<br />
small, District staff will adjust it using the<br />
District’s population information that is published<br />
on the District website.<br />
ADJUSTED GROSS PER CAPITA<br />
Unadjusted gross per capita rates are usually not<br />
directly comparable between utilities if one<br />
supplies a large amount of water to nonresidential<br />
users, to golf courses for irrigation or<br />
have to provide environmental mitigation to<br />
impacted environmental. The current per capita<br />
system now takes these circumstances into<br />
consideration with the Adjusted Gross Per Capita<br />
(AGPC) rate.<br />
Before the service area water use is divided by the<br />
functional population, deductions can be taken for<br />
non‐population‐related water use to calculate the<br />
AGPC. These are significant industrial/<br />
commercial uses, District‐required environmental<br />
mitigation, and separately accounted irrigation<br />
water provided to golf courses. Details of these<br />
deductions per public supply WUP are shown in<br />
Table A‐1 in Appendix A.<br />
The industrial/commercial use deductions are<br />
referred to as “Significant <strong>Use</strong>”. To qualify as a<br />
significant use, the amount delivered must meet<br />
certain criteria, and the permittee must submit<br />
documentation for the deduction claimed and<br />
provide a copy of their conservation plan for each<br />
significant user claimed. The <strong>Water</strong> <strong>Use</strong> Permit<br />
Information Manual, Part B, Basis of Review<br />
provides details about such criteria,<br />
documentation and water conservation plans. An<br />
environmental mitigation deduction can be taken<br />
if a permittee is required by the District to pump<br />
water to replenish lakes and wetlands that were<br />
impacted by their withdrawals.<br />
AGPC rates allow for more equitable comparison<br />
of the utilities with respect to their population’s<br />
water use habits. If the utility fails to qualify for<br />
significant use deductions (such as water<br />
provided to a power plant), declared on the<br />
<strong>Southwest</strong> <strong>Florida</strong> <strong>Water</strong> <strong>Management</strong> District Page | 16
<strong>2011</strong> ESTIMATED WATER USE REPORT<br />
survey, Table A‐1 will show a higher AGPC rate<br />
than the permittee claimed.<br />
From the PSAR data, the total adjusted gross use<br />
was 480.0 mgd, giving an average AGPC rate of<br />
101 gpd. There were 139 reporting utilities<br />
(87%) with an AGPC rate less than or equal to the<br />
mandated 150 gpd per capita rate. In 2010, 142<br />
out of 160 utilities had an AGPC rate less than or<br />
equal to 150 gpd.<br />
COMPLIANCE PER CAPITA<br />
The Compliance Per Capita (CPC) rate allows the<br />
public supply permittee to further reduce their<br />
per capita rate for compliance with the 150 gpcd<br />
limit by deducting reclaimed water and<br />
stormwater provided as Alternative <strong>Water</strong> Supply<br />
(AWS) sources to customers who are not included<br />
in their service area. These sources of water<br />
cannot have been used to reduce the public<br />
supply permittees’ UGPC rate or AGPC rate. For<br />
instance, the use of reclaimed water as an<br />
irrigation source within the service area cannot<br />
be a deduction because the use of reclaimed water<br />
instead of treated potable water in the service<br />
area has already lowered the per capita rate. Also,<br />
AWS deductions cannot be included in the CPC<br />
rate if they were deducted under the golf course<br />
irrigation deduction used to get the adjusted gross<br />
per capita rate. The CPC rate is the final per<br />
capita rate that can be used to meet compliance<br />
with the District per capita requirement in 2014<br />
and 2019.<br />
The <strong>2011</strong> average CPC rate from the PSAR forms<br />
for the District was 97 gpd, which was up from the<br />
2010 average of 92 gpcd. This could have been<br />
due to fewer utilities taking the stormwater or<br />
reclaimed water deduction even though they<br />
could have done so. In <strong>2011</strong>, 139 utilities (87%)<br />
had a CPC rate less than or equal to150 gpd. In<br />
2010, 143 utilities (89%) met the rule required<br />
150 gpd per capita rate via the CPC rate<br />
calculation.<br />
RESIDENTIAL PER CAPITA WATER USE<br />
This per capita rate is not included in the<br />
regulations governing public supply use in the<br />
District. It is close to the adjusted gross per<br />
capita, except no documentation is required or<br />
given for deductions from the quantity of water<br />
withdrawn. It represents just water used at a<br />
residence, whether that is a single family, multifamily<br />
or mobile home and is based on the utility’s<br />
billing detail. Table A‐2 in Appendix A gives the<br />
<strong>2011</strong> residential per capita rates. The combined<br />
District rate was 71 gpd/person.<br />
PUBLIC SUPPLY WATER TRANSFERS<br />
Geographic conditions and population growth<br />
differences necessitated inter‐county and/or<br />
inter‐permit water transfers in some parts of the<br />
District. Such transfers will play an increasingly<br />
important role as more emergency interconnect<br />
systems are constructed, existing regional water<br />
supply authorities develop additional wholesale<br />
arrangements with member systems, and new<br />
regional water supply systems are developed to<br />
meet the growing demand for potable water in<br />
the District.<br />
Table A‐3 in Appendix A provides some detail of<br />
permit‐to‐permit water transfers. In the District,<br />
60 utilities imported 292 mgd from 31 exporting<br />
utilities. Of the 60 importers, 45 held WUPs from<br />
this District, and two held Consumptive <strong>Use</strong><br />
Permits (CUPs) from South <strong>Florida</strong> <strong>Water</strong><br />
<strong>Management</strong> District. There were 11<br />
communities listed in this table that had a<br />
demand less than 100,000 gpd on an annual<br />
average basis, which is the threshold for requiring<br />
a wholesale water use permit in the District.<br />
These small utilities will not appear in any other<br />
place in the report. Their demand is included in<br />
the permitted quantities of the public supply<br />
permittee that provides the water. Of the 31<br />
exporters, 29 held WUPs from the District and<br />
two held CUPs from South <strong>Florida</strong> <strong>Water</strong><br />
<strong>Management</strong> District.<br />
MONTHLY WATER WITHDRAWALS<br />
Because of the discrepancy in pumpage quantities<br />
reported on the PSAR and in the WUP database,<br />
the data for monthly withdrawal rates uses the<br />
District database as the only data source. Monthly<br />
withdrawals reported for public supply in the<br />
District are shown in Table A‐4 in Appendix A and<br />
are illustrated in Figure 4 in this chapter.<br />
COUNTY AND WATER USE CAUTION AREA PUBLIC<br />
SUPPLY PUMPAGE<br />
Pumpage by use category and by water source for<br />
the 16 counties and the three water use caution<br />
<strong>Southwest</strong> <strong>Florida</strong> <strong>Water</strong> <strong>Management</strong> District Page | 17
<strong>2011</strong> ESTIMATED WATER USE REPORT<br />
areas (WUCAs) is given in Appendix B. The data is<br />
derived from the <strong>Estimated</strong> <strong>Water</strong> <strong>Use</strong> tables<br />
output by the SAS programs that were made by<br />
District staff. The exception to this is some of the<br />
public supply data, which was adjusted per the<br />
PSAR information. A total of 326.6 mgd of<br />
groundwater were pumped for public supply in<br />
<strong>2011</strong> (Table B‐1). Polk County pumped the most<br />
groundwater for public supply (66.2 mgd), and<br />
was followed by Hillsborough County (63.8 mgd)<br />
and Pasco County (58.7 mgd).<br />
A total of 193.0 mgd were pumped from surface<br />
water resources in <strong>2011</strong>, with Hillsborough<br />
County pumping the most (126.2 mgd from the<br />
Hillsborough River and Alafia River), followed by<br />
DeSoto County (30.8 mgd from the Peace River),<br />
and Manatee County (29.7 mgd from the Manatee<br />
County Reservoir and Braden River).<br />
In the Southern <strong>Water</strong> <strong>Use</strong> Caution Area<br />
(SWUCA), 131.6 mgd were pumped for public<br />
supply from groundwater (Table B‐2), with the<br />
most having been withdrawn in Polk County (58.4<br />
mgd). Surface water withdrawals totaled to 74.0<br />
mgd with the most having occurred in Manatee<br />
County (29.7 mgd). Forty percent (40%) of the<br />
total water withdrawn for public supply was in<br />
the SWUCA.<br />
Within the Most Impacted Area (MIA) of the<br />
SWUCA, 11.6 mgd of groundwater were<br />
withdrawn (Table B‐3), with 93% (10.8 mgd)<br />
having come from Sarasota County. Manatee<br />
County headed the surface water withdrawals in<br />
the MIA with 29.8 mgd having been withdrawn.<br />
Only 8% of the quantities withdrawn for public<br />
supply District‐wide were from inside the MIA.<br />
In the Northern Tampa Bay <strong>Water</strong> <strong>Use</strong> Caution<br />
Area (NTB WUCA) (Table B‐4), 116.1 mgd were<br />
pumped from groundwater for public supply use.<br />
Most of the groundwater quantities were pumped<br />
in Pasco County (94.6 mgd). The only surface<br />
water pumpage in the NTB WUCA was in<br />
Hillsborough County for 90.8 mgd. This was<br />
mostly from the Hillsborough River system which<br />
included the Tampa Bypass Canal.<br />
The Dover/Plant City WUCA was created in <strong>2011</strong><br />
based on impacts to existing legal users and offsite<br />
land use caused by pumping groundwater for<br />
freeze protection of crops. The time span for<br />
freeze pumping is limited to December through<br />
February, and public supply permittees also have<br />
to pump groundwater at this same time. Table B‐<br />
5 shows that there were 38.3 mgd pumped from<br />
groundwater in the Dover/Plant City WUCA, and<br />
most of this occurred in Hillsborough County.<br />
Only 0.001 mgd (1,000 gpd) of public supply<br />
water were pumped from surface water bodies in<br />
the Dover/Plant City WUCA.<br />
PUBLIC SUPPLY PERMITTED QUANTITIES<br />
Total annual average permitted quantities by<br />
county, by use and by WUCA are given in<br />
Appendix C. Total permitted annual average<br />
quantities for public supply were 771.7 mgd. Of<br />
this, 475.8 mgd (62%) were from groundwater,<br />
and 295.9 mgd (38%) were from surface water.<br />
Polk County and Pasco County were permitted to<br />
withdraw the most groundwater for public supply<br />
use ( 117.9 mgd and 113.7 mgd respectively).<br />
These two counties account for almost half (49%)<br />
of the 475.8 mgd groundwater permitted to be<br />
pumped District‐wide for public supply. Surface<br />
water quantities permitted for public supply<br />
totaled to 295.9 mgd, with 204.6 mgd (69%)<br />
having been permitted in Hillsborough County.<br />
Appendix C gives the permitted annual average<br />
quantities for each use category from<br />
groundwater and surface water bodies from the<br />
entire District, SWUCA, MIA, NTB WUCA and<br />
Dover/Plant City WUCA. Comparing actual<br />
groundwater pumped (326.6 mgd) for public<br />
supply use category District‐wide (Table B‐1) to<br />
permitted groundwater quantities for public<br />
supply District‐wide (475.8 mgd in Table C‐1)<br />
shows that 69% of permitted groundwater<br />
quantities were pumped.<br />
In the SWUCA, public supply groundwater<br />
pumpage (131.6 mgd, Table B‐2) was 59% of<br />
permitted public supply groundwater quantities<br />
(221.8 mgd, Table C‐2). Overall, 67% of the total<br />
quantities permitted for public supply were used.<br />
In the MIA, only 38% (11.6 mgd, Table B‐3) of the<br />
groundwater permitted for public supply (31.7<br />
mgd, Table C‐3) were used, but 81% (29.8 mgd,<br />
Table B‐3) of the surface water quantities<br />
permitted for public supply (36.8 mgd, Table C‐3)<br />
were used.<br />
<strong>Southwest</strong> <strong>Florida</strong> <strong>Water</strong> <strong>Management</strong> District Page | 18
<strong>2011</strong> ESTIMATED WATER USE REPORT<br />
In the NTB WUCA, 76% (116.1 mgd, Table B‐4) of<br />
the 152.6 mgd of groundwater permitted (Table<br />
C‐4) for public supply were used. Of the 187.2<br />
mgd of surface water permitted for public supply<br />
in the NTB WUCA (Table C‐4), only 49% (90.8<br />
mgd) of it was used (Table B‐4).<br />
In the Dover/Plant City WUCA, 72% (38 mgd,<br />
Table B‐5) of the groundwater quantities<br />
permitted for public supply (53 mgd, Table C‐5)<br />
and 20% (.001 mgd, Table B‐5) of the surface<br />
water quantities permitted for public supply (.005<br />
mgd, Table C‐5)use were actually used.<br />
UNIFORM PER CAPITA RATE<br />
Appendix D gives the uniform per capita rate for<br />
the utilities within the District. In response to<br />
concerns that <strong>Florida</strong>’s five water management<br />
districts were using different methods to calculate<br />
public supply water use and per capita rates, the<br />
FDEP developed a uniform statewide convention<br />
for the calculation of public supply per capita<br />
water use in 2009. The document, entitled<br />
“Guidance on Per Capita <strong>Water</strong> <strong>Use</strong>: Uniform<br />
Definition and Performance Measures,” March 3,<br />
2009, was developed by staff members from each<br />
water management district and staff from the<br />
FDEP. The District, using the methods prescribed<br />
in the guidance document, began reporting this<br />
information to the FDEP in 2007, beginning with<br />
the 2006 calendar year. This uniform per capita<br />
data is only used for comparison purposes by the<br />
FDEP and are not used as data sources for<br />
planning or calculating demand projections.<br />
The uniform per capita rate is calculated as<br />
follows:<br />
(Withdrawals + Imports Exports <br />
Treatment Losses) / Residential<br />
Population Served, where “Residential<br />
Population Served” is equal to Housing<br />
Units Served by the Utility times the<br />
Average Persons Per Household within the<br />
Utility<br />
Appendix D also provides a ten‐year history of<br />
pumpage for the larger WUPs. A graph of the<br />
2002 through <strong>2011</strong> public supply pumpage<br />
shows, via the linear trend line, that public supply<br />
water use has remained flat.<br />
Appendix E shows the per capita values used in<br />
the <strong>2011</strong> FDEP Uniform Per Capita Report.<br />
<strong>Southwest</strong> <strong>Florida</strong> <strong>Water</strong> <strong>Management</strong> District Page | 19
<strong>2011</strong> ESTIMATED WATER USE REPORT<br />
Table 1. Summary of Metered and <strong>Estimated</strong> Public Supply Service Area Population and <strong>Water</strong> <strong>Use</strong> (mgd), <strong>2011</strong><br />
From the Public Supply Annual Reports (PSAR )<br />
County<br />
Total<br />
pumpage<br />
(mgd)<br />
Total<br />
Imported<br />
<strong>Water</strong><br />
(mgd)<br />
Total<br />
Exported<br />
<strong>Water</strong><br />
(mgd)<br />
Treatment<br />
Loss<br />
(mgd)<br />
Unadjusted<br />
Gross<br />
<strong>Water</strong><br />
<strong>Use</strong> 1<br />
(mgd)<br />
Reported<br />
Service Area<br />
Population<br />
Unadjusted<br />
Gross Per<br />
Capita 2<br />
(gpd)<br />
Non<br />
PSAR<br />
Metered<br />
<strong>Water</strong><br />
<strong>Use</strong> 3<br />
(mgd)<br />
<strong>Estimated</strong><br />
NonMetered<br />
Gross <strong>Water</strong><br />
<strong>Use</strong> 4 (mgd)<br />
Additional<br />
Population 5<br />
Total Public<br />
Supply Unadjusted<br />
Gross<br />
<strong>Water</strong> <strong>Use</strong><br />
(mgd) 6<br />
Total<br />
Population<br />
Served via<br />
<strong>Water</strong> <strong>Use</strong><br />
Permits<br />
*Charlotte 7.049 9.504 0.447 1.068 15.038 172,948 87 0.000 0.025 287 15.063 173,235<br />
Citrus 14.695 0.464 0.492 0.145 14.522 112,060 130 0.157 0.458 4,740 15.137 116,669<br />
DeSoto 31.722 0.013 23.437 0.578 0.820 7 8,357 96 0.002 0.011 136 0.833 8,712<br />
Hardee 0.868 0.040 0.040 0.004 0.864 14,350 60 0.228 0.121 5,796 1.213 20,146<br />
Hernando 20.570 0.000 0.000 0.000 20.570 149,323 138 0.000 0.209 1,517 20.779 150,840<br />
*Highlands 7.222 0.000 0.000 0.112 7.110 74,867 95 0.088 0.168 2,696 7.366 77,563<br />
Hillsborough 183.080 162.990 210.020 6.546 125.296 1,208,422 104 5.694 1.209 66,243 132.829 1,274,665<br />
*Lake 0.000 0.000 0.000 0.000 0.000 0 NA 0.000 0.000 0 0.000 0<br />
*Levy 0.691 0.000 0.000 0.007 0.684 5,607 122 0.000 0.03 246 0.714 5,853<br />
Manatee 44.586 18.564 23.402 2.279 37.469 455,555 82 0.030 0.005 426 37.504 455,981<br />
*Marion 11.012 0.000 0.000 0.457 10.555 67,682 153 0.090 0.31 2,622 10.955 71,813<br />
Pasco 56.383 28.576 43.415 0.275 41.269 370,313 111 1.409 0.862 20,378 43.540 390,691<br />
Pinellas 22.257 96.737 27.650 2.575 88.769 1,057,634 84 0.000 0.083 990 88.851 1,059,818<br />
*Polk 64.328 2.954 0.509 1.619 64.914 542,052 120 0.299 1.584 15,714 66.797 557,445<br />
Sarasota 20.745 21.474 6.234 5.365 30.620 400,013 77 0.000 0.038 496 30.658 400,510<br />
Sumter 21.074 0.000 0.000 0.187 20.887 84,629 230 0.119 0.082 875 21.088 91,798<br />
District Totals<br />
and Averages<br />
506.282 341.316 335.647 21.216 480.017 4,732,577 101 8.116 5.195 123,163 493.328 4,855,740<br />
Data Sources: <strong>2011</strong> Public Supply Annual Reports & <strong>2011</strong> <strong>Estimated</strong> <strong>Water</strong> <strong>Use</strong> Tables derived from the WMIS WUP database.<br />
* Data is only for that portion within the District.<br />
1 Total withdrawal quantity + Imports – Exports – Treatment losses (Gross <strong>Use</strong> on Table A‐1, Appendix A). The District total is the sum of the county unadjusted gross water use<br />
from the PSAR forms.<br />
2<br />
(Unadjusted gross water use x 1,000,000)/Population<br />
3<br />
Quantities metered by public supply permittees not required to submit PS Annual Reports.<br />
4<br />
<strong>Estimated</strong> for non‐metered Small General water use permits (less than 100,000 gpd on an annual average basis).<br />
5<br />
[(Non‐Survey Metered <strong>Water</strong> <strong>Use</strong>) + (<strong>Estimated</strong> non‐metered gross water use)] x 10 6 , divided by the Unadjusted Gross Per Capita Rate.<br />
6<br />
Total unadjusted gross use + metered but non‐PSAR submitters withdrawals + estimated public supply use. The District total is the sum of the county subtotals.<br />
7<br />
Approximately 6.248 mgd were put into storage under WUP No. 10420 (Peace River‐Manasota Regional <strong>Water</strong> Supply Authority).<br />
<strong>Southwest</strong> <strong>Florida</strong> <strong>Water</strong> <strong>Management</strong> District Page | 20
<strong>2011</strong> ESTIMATED WATER USE REPORT<br />
Percent Public of Total Supply Pumpage by County<br />
Other =<br />
*Charlotte,<br />
Citrus, Hardee,<br />
*Highlands,<br />
*Lake, *Levy<br />
Counties<br />
* Data is only for<br />
the portion of the<br />
county within the<br />
District.<br />
Sumter<br />
4%<br />
Sarasota<br />
4%<br />
Polk<br />
13%<br />
Pinellas<br />
4%<br />
Pasco<br />
11%<br />
Other<br />
8%<br />
Manatee<br />
9%<br />
DeSoto<br />
6% Hernando<br />
4%<br />
Hillsborough<br />
37%<br />
Total Pumpage = 520 mgd<br />
Percent of Total Public Supply <strong>Use</strong> by County<br />
Other = *Charlotte,<br />
Citrus, DeSoto,<br />
Hardee, *Highlands,<br />
*Lake, *Levy,<br />
*Marion<br />
* Data is only for the<br />
portion of the<br />
county within the<br />
District.<br />
Sumter<br />
4%<br />
Sarasota<br />
6%<br />
*Polk<br />
14%<br />
Other<br />
10%<br />
Pinellas<br />
18%<br />
Hernando<br />
4%<br />
Pasco<br />
9%<br />
Hillsborough<br />
27%<br />
Manatee<br />
8%<br />
Total Gross <strong>Water</strong> <strong>Use</strong> = 493 mgd<br />
Figure 3.<br />
Two Pie Charts Showing the County Distribution of Public Supply Quantities<br />
Withdrawn and Public Supply <strong>Water</strong> <strong>Use</strong>d in <strong>2011</strong>. (Data Sources: Public Supply Annual<br />
Reports and the <strong>Estimated</strong> <strong>Water</strong> <strong>Use</strong> Tables derived from the WMIS WUP database, <strong>2011</strong>)<br />
<strong>Southwest</strong> <strong>Florida</strong> <strong>Water</strong> <strong>Management</strong> District Page | 21
<strong>2011</strong> ESTIMATED WATER USE REPORT<br />
Public Supply Pumpage and Rainfall<br />
700<br />
10.0<br />
600<br />
Pumpage<br />
Rainfall<br />
9.0<br />
8.0<br />
Pumpage (mgd/month)<br />
500<br />
400<br />
300<br />
200<br />
7.0<br />
6.0<br />
5.0<br />
4.0<br />
3.0<br />
Rainfall (inches/month)<br />
100<br />
2.0<br />
1.0<br />
0<br />
Jan Feb Mar Apr May Jun Jul Aug Sep Oct Nov Dec<br />
0.0<br />
Total Monthly Pumpage<br />
Total Monthly Rainfall<br />
Figure 4. Metered + <strong>Estimated</strong> Public Supply <strong>Water</strong> Pumpage (mgd/month) and District<br />
Regional Total Rainfall (inches/month), <strong>2011</strong> (Data Sources: <strong>Estimated</strong> <strong>Water</strong> <strong>Use</strong> Tables<br />
derived from the WMIS WUP database, <strong>2011</strong> and District rainfall data)<br />
<strong>Southwest</strong> <strong>Florida</strong> <strong>Water</strong> <strong>Management</strong> District Page | 22
<strong>2011</strong> ESTIMATED WATER USE REPORT<br />
DOMESTIC SELFSUPPLY USE =<br />
37MGD<br />
In <strong>2011</strong>, approximately 36.7 mgd of water was<br />
used for domestic self‐supply purposes within<br />
the District. Because the users included in this<br />
category were not required to have water use<br />
permits, the estimates are indirectly calculated<br />
based on available population estimates and<br />
conceptual water use data (Table 2). This<br />
estimate was down from the 68 mgd calculated<br />
as having been withdrawn for domestic selfsupply<br />
in 2010. The large reduction is<br />
probably due to use of the 2010 Census data<br />
that was published in <strong>2011</strong> rather than an<br />
extrapolation of the 2000 Census that was used<br />
in 2010..<br />
domestic self‐supply population to derive<br />
estimated use of 36.7 mgd.<br />
Figure 5 shows the percentages of the total<br />
36.7 mgd that are used in the counties. Polk<br />
County had the highest domestic self‐supply<br />
use (18%), followed by Hillsborough (16%),<br />
and Pasco (15 %) counties. Because domestic<br />
self‐supply water use is estimated based on<br />
public supply data, it is assumed that the<br />
monthly use pattern tracks that of public<br />
supply. Consequently, a separate monthly<br />
fluctuation chart is not included in this report.<br />
GENERAL INFORMATION<br />
The domestic self‐supply category estimates<br />
the amount of potable water withdrawn from<br />
individual wells that serve a private residence<br />
made up of family members. These residential<br />
users are usually located in rural areas, but<br />
they can also be located in suburban or urban<br />
areas. It is generally true that the water is<br />
withdrawn from small diameter wells;<br />
however, any size well that is used only for<br />
domestic use is exempt from regulation by the<br />
water management districts. It is also assumed<br />
that groundwater is the source of water for<br />
domestic self‐supply because surface water<br />
would have to be treated.<br />
<strong>2011</strong> DATA<br />
Domestic self‐supply water use estimates are<br />
based on the population for a given county and<br />
is calculated as the difference between the<br />
county‐level functional population and the<br />
total functional population served by regulated<br />
public supply utilities for the same county<br />
(Table 2, Column 1). The county functional<br />
population was taken from 2010 Census.<br />
Assuming that self‐supplied water users have<br />
the same water use habits and thus the same<br />
residential per capita water use as the people<br />
served by the public supply systems, the<br />
residential per capita data per county from<br />
Appendix A, Table A‐2 was multiplied by the<br />
<strong>Southwest</strong> <strong>Florida</strong> <strong>Water</strong> <strong>Management</strong> District Page | 23
<strong>2011</strong> ESTIMATED WATER USE REPORT<br />
Table 2. Summary of Domestic SelfSupply <strong>Water</strong> <strong>Use</strong> by County, <strong>2011</strong><br />
County<br />
<strong>2011</strong> Functional<br />
Population 1<br />
Population Served by a<br />
Public Supplier 2<br />
SelfSupply<br />
Population 3<br />
Residential Per<br />
Capita 4 (gpd/person)<br />
Domestic SelfSupply<br />
<strong>Water</strong> <strong>Use</strong> 6 (mgd)<br />
*Charlotte 175,971 173,235 2,736 63 0.172<br />
Citrus 154,956 116,669 38,287 99 3.790<br />
DeSoto 37,201 8,712 28,489 69 1.966<br />
Hardee 29,549 20,146 9,403 51 0.480<br />
Hernando 178,062 150,840 27,221 107 2.913<br />
*Highlands 96,580 77,563 19,017 63 1.198<br />
Hillsborough 1,308,818 1,274,665 34,153 69 2.357<br />
*Lake 1,056 0 1,056 71 5 0.075<br />
*Levy 23,886 5,853 18,034 67 1.208<br />
Manatee 358,950 455,981 0 58 0.000<br />
*Marion 107,234 71,813 35,421 138 4.888<br />
Pasco 487,819 390,691 97,128 78 7.576<br />
Pinellas 996,554 1,059,818 0 58 0.000<br />
*Polk 635,023 557,445 77,578 84 6.517<br />
Sarasota 437,146 400,510 36,637 53 1.942<br />
Sumter 100,219 91,798 8,421 188 1.583<br />
District Totals and<br />
Averages 5,129,024 4,855,740 433,579 71 36.664<br />
*<br />
1<br />
Data sources: District GIS population, <strong>Estimated</strong> <strong>Water</strong> <strong>Use</strong> <strong>2011</strong> Tables derived from the WMIS WUP database and Public Supply Annual Report data.<br />
Data is only for the portion of the County within the District.<br />
Functional population is taken from the Bureau of Economic and Business Research (BEBR) for <strong>2011</strong>.<br />
2 Population served by utilities having a <strong>Water</strong> <strong>Use</strong> Permit from PSAR submittals and estimates for populations associated with<br />
WUPs for which a PSAR is not submitted.<br />
3<br />
Self‐supply population is calculated as the difference between the “<strong>2011</strong> Functional Population" and "Total Population Served via <strong>Water</strong> <strong>Use</strong> Permits". If the<br />
Functional Population per the BEBR is less than the population indicated by reporting utilities in the county, the Self Supply Population was set to zero.<br />
4 "Residential Per Capita," from Table A‐2 in Appendix A. The population used for this per capita calculation is from the PSAR residential population data<br />
submitted by utilities.<br />
5<br />
The District‐wide residential per capita (Appendix A, Table A‐2) was used as the multiplier for Lake County<br />
6<br />
("Self‐Supply Population" x "Residential Per Capita”)/ 1,000,000<br />
<strong>Southwest</strong> <strong>Florida</strong> <strong>Water</strong> <strong>Management</strong> District Page | 24
<strong>2011</strong> ESTIMATED WATER USE REPORT<br />
Percent of Total District Domestic <strong>Use</strong> by County<br />
Other = *Charlotte,<br />
DeSoto, Hardee,<br />
*Highlands, *Lake,<br />
*Levy, Manatee,<br />
Pinellas<br />
*Polk<br />
17%<br />
Sarasota<br />
5%<br />
Sumter<br />
7%<br />
Other<br />
13%<br />
Citrus<br />
10%<br />
Hernando<br />
8%<br />
* Data is only<br />
for the<br />
portion of the<br />
county within<br />
the District.<br />
Pasco<br />
20%<br />
*Marion<br />
13%<br />
Hillsborough<br />
7%<br />
Total <strong>Use</strong> = 37 mgd<br />
Figure 5. <strong>Estimated</strong> Domestic Selfsupply <strong>Water</strong> <strong>Use</strong> (mgd) by County, <strong>2011</strong> (Data sources:<br />
District GIS population, District WUP database and Public Supply Annual Report data)<br />
<strong>Southwest</strong> <strong>Florida</strong> <strong>Water</strong> <strong>Management</strong> District Page | 25
<strong>2011</strong> ESTIMATED WATER USE REPORT<br />
This page is intentionally blank.<br />
<strong>Southwest</strong> <strong>Florida</strong> <strong>Water</strong> <strong>Management</strong> District Page | 26
<strong>2011</strong> ESTIMATED WATER USE REPORT<br />
RECREATION/AESTHETIC USE = 62 MGD<br />
Metered plus estimated recreation/aesthetic<br />
water use within the District was 62.3 mgd for<br />
<strong>2011</strong> (Table 3), which was up 1.4 mgd from 2010.<br />
Of this amount, approximately 56.0 mgd (90%)<br />
were withdrawn from groundwater sources, and<br />
the remaining 6.3 mgd were withdrawn from<br />
surface water sources (Table B‐1, Appendix B).<br />
GENERAL INFORMATION<br />
The recreation/aesthetic water use category<br />
includes the irrigation of golf courses, cemeteries,<br />
parks, sport playing fields, and other large<br />
landscapes, as well as water park and theme park<br />
water demands. It does not include reclaimed<br />
water or other types of alternative water supply<br />
sources that are used for those same purposes.<br />
The lawn and landscape categorized under this<br />
use category is not associated with residential<br />
lawns and landscape or with landscaped common<br />
areas in cities, towns, and housing developments.<br />
These latter uses are under the public supply use<br />
category. As in all use categories, there are<br />
recreation/aesthetic water users that use<br />
withdrawal points below regulatory thresholds to<br />
require a WUP. There is no information on these<br />
small water‐users.<br />
The District irrigation rate calculation program,<br />
known as AGMOD, is used to derive the acre‐inch<br />
application rate for irrigation of golf courses,<br />
lawn and landscape, parks, cemeteries, and<br />
sports fields based on <strong>Florida</strong>‐modified Blaney‐<br />
Criddle calculations. AGMOD uses site‐specific<br />
data for soil type, irrigation method, amount of<br />
solar radiation received on average, historic<br />
rainfall for the county, root depth and other<br />
factors that affect how much supplemental<br />
irrigation is required to meet the plants’ needs.<br />
<strong>2011</strong> DATA<br />
Most (89%) of the recreation/aesthetic<br />
withdrawal quantities were for irrigation: 56%<br />
for golf courses (35.1 mgd); 31% for lawn and<br />
landscape (19.4 mgd), and 6% for parks,<br />
cemeteries, sports playing fields, botanical<br />
gardens, etc. (3.6 mgd). The recreation/aesthetic<br />
lawn and landscape uses are for the non‐playing<br />
surfaces associated with recreational facilities<br />
(golf clubs, sports clubs, animal attractions, water<br />
parks, etc.).<br />
Irrigation for golf courses is the highest use of<br />
water in the recreation/aesthetic use category.<br />
Irrigation quantities are permitted for golf course<br />
irrigation based on the actual measured acreage<br />
of tees, greens, and fairways. A standard 50<br />
inches/acre is permitted for tees and greens due<br />
to heavy foot traffic and very short cut height.<br />
The fairways receive acre‐inch supplemental<br />
irrigation quantities according AGMOD<br />
calculations. No irrigation quantity is given for<br />
roughs. Roughs are generally described as areas<br />
outside the main playing field for average golfers<br />
or at the third turfgrass cut height. Golf course<br />
permittees may irrigate these areas if there is<br />
water left over from the amount permitted for<br />
only the playing areas. This restriction also<br />
applies to the use of reclaimed water or other<br />
types of alternative water supply sources, unless<br />
disposal is needed.<br />
Golf course permittees are required to utilize all<br />
of their reclaimed water or other alternative<br />
water supply sources first, as are all permittees<br />
having access to reclaimed water or other<br />
alternative water supplies. As more reclaimed<br />
water becomes available, use of the natural<br />
resource for recreation/aesthetic irrigation will<br />
decline.<br />
Table 3 provides county‐level water use data for<br />
each use group within the recreation/aesthetic<br />
use category. The county with the highest<br />
recreation/aesthetic use was Manatee County<br />
(10.4 mgd) with Hillsborough County second (8.6<br />
mgd), and Polk County third (8.3 mgd). Sarasota<br />
County came in fourth with 6.8 mgd used for<br />
recreation/aesthetic use. Figure 6 shows that<br />
these four counties accounted for 55% of the<br />
total recreation/aesthetic use in the District.<br />
Figure 7 shows monthly rainfall (line graph) and<br />
monthly pumpage (bar graph) for<br />
recreation/aesthetic use. As is expected,<br />
withdrawals for recreation/ aesthetic use<br />
increased when the rainfall decreased because<br />
the highest water demand for recreation/<br />
aesthetic use was for irrigation, which is directly<br />
affected by rainfall.<br />
<strong>Southwest</strong> <strong>Florida</strong> <strong>Water</strong> <strong>Management</strong> District Page | 27
<strong>2011</strong> ESTIMATED WATER USE REPORT<br />
Table A‐5 in Appendix A provides detailed,<br />
permit‐specific water use data per county for<br />
metered recreation/aesthetic WUPs. The table<br />
shows the WUP number, permittee name, water<br />
use code, withdrawal source (groundwater<br />
versus surface water), annual average pumpage,<br />
total WUP permitted quantities, and how much of<br />
the permitted quantity is for recreation/aesthetic<br />
use. The units for the quantities are million<br />
gallons per day. The web version of this report<br />
includes the unmetered WUPs in Table A‐5 and<br />
gives the estimated pumpage for each.<br />
Table A‐6 in Appendix A gives the total (metered<br />
plus estimated) monthly recreation/aesthetic<br />
water pumpage per county.<br />
Appendix B gives the annual average quantities<br />
pumped per use category by water source<br />
(groundwater and surface water) per county and<br />
in the water use caution areas (WUCAs).<br />
Appendix C gives the permitted annual average<br />
quantities per use category by water source, and<br />
WUCA. Total permitted annual average<br />
quantities for recreation/aesthetic use in <strong>2011</strong><br />
was 121.5 mgd. It should be noted that the <strong>2011</strong><br />
permitted quantities shown in Appendix C no<br />
longer include repumped groundwater as a<br />
surface water source. Because of this, the annual<br />
average quantity of groundwater permitted<br />
appears to have increased, and the annual<br />
average quantity of surface water permitted<br />
appears to have decreased with respect to those<br />
shown in previous Appendices C . Actually, this is<br />
an artifact of the exclusion of repumped<br />
groundwater as a surface water source for <strong>2011</strong>.<br />
See Appendix F for an explanation of how annual<br />
average quantities permitted to withdrawal<br />
points are scaled to the permit total annual<br />
average quantity and how that affects quantity by<br />
source type totals.<br />
Comparison of the quantities in the two<br />
appendices shows the percentage of permitted<br />
groundwater and surface water quantities are<br />
actually used. Only 51% (62.3 mgd) of the annual<br />
average quantity of water permitted for<br />
recreation/aesthetic use were used. Table C‐1<br />
shows that 100.9 mgd were permitted for<br />
recreation/aesthetic use from groundwater<br />
resources, and Table B‐1 shows that 56% (56.0)<br />
of these groundwater quantities were used in the<br />
District. Only 31% (6.3 mgd) of the permitted<br />
surface water quantities (20.6 mgd) were used. It<br />
is clear that another source of irrigation water is<br />
being used.<br />
SWUCA: More than half (65.6 mgd or 54%) of the<br />
121.5 mgd water permitted for recreation/<br />
aesthetic use were permitted in the SWUCA<br />
(Table C‐2). Table B‐2 shows that only 48% (31.4<br />
mgd) of the quantity permitted were used, and<br />
87% of this was from groundwater resources<br />
(27.4 mgd).<br />
MIA of the SWUCA Just 48% (12.7 mgd) of the<br />
groundwater permitted (26.3 mgd) was used, and<br />
only 24% (1.3 mgd) of surface water permitted<br />
(5.3 mgd) were used.<br />
NTB WUCA In the NTB WUCA, the pattern of low<br />
use of permitted quantities for recreation/<br />
aesthetic use continued with only 42% (10.7<br />
mgd) of permitted groundwater (25.4 mgd)<br />
having been used and only 30% (1.3 mgd) of<br />
permitted surface water (4.3 mgd) having been<br />
used.<br />
Dover/Plant City WUCA Only 0.4 mgd of the 0.9<br />
mgd permitted for recreation/aesthetic use from<br />
groundwater were used for recreation/aesthetic<br />
use in the Dover/Plant City WUCA. None of the<br />
0.3 mgd annual average quantities permitted<br />
from surface water sources were used.<br />
Groundwater withdrawals for recreation/<br />
aesthetic use do not add to the freeze protection<br />
pumpage impacts because recreation/aesthetic<br />
plant types do not need freeze protection. Also,<br />
when the freeze protection quantities are being<br />
pumped for crops, it is highly unlikely that<br />
irrigation quantities for recreation/aesthetic use<br />
are being withdrawn.<br />
Alternative <strong>Water</strong> Supply Sources. The <strong>Florida</strong><br />
Statutes allow water management districts to<br />
require the use of reclaimed water in lieu of all or<br />
a portion of a proposed used of groundwater or<br />
surface water when the use of reclaimed water is<br />
available; is environmentally, economically, and<br />
technically feasible; and is of such quality and<br />
reliability as is necessary to the user. In these<br />
cases, the District will put the offset quantity of<br />
groundwater or surface water on standby with<br />
<strong>Southwest</strong> <strong>Florida</strong> <strong>Water</strong> <strong>Management</strong> District Page | 28
<strong>2011</strong> ESTIMATED WATER USE REPORT<br />
the provision that if the permittee loses the use of<br />
the reclaimed water through no fault of their<br />
own, they can avail themselves of the permitted<br />
standby groundwater or surface water quantities.<br />
There are approximately 400 golf courses in the<br />
District. Reclaimed water is being used for all or<br />
part of the irrigation requirements on 200 of<br />
them, and permitted quantities from<br />
groundwater and surface water are on standby.<br />
For more information, reclaimed water use in the<br />
District is presented in various reports at<br />
http://www.swfwmd.state.fl.us/conservation/re<br />
claimed/.<br />
<strong>Southwest</strong> <strong>Florida</strong> <strong>Water</strong> <strong>Management</strong> District Page | 29
<strong>2011</strong> ESTIMATED WATER USE REPORT<br />
Table 3. Summary of Metered + <strong>Estimated</strong> Annual Average Recreation/Aesthetic <strong>Water</strong> Pumpage (mgd) by County<br />
and <strong>Water</strong> Source by <strong>Use</strong> Type, <strong>2011</strong><br />
General<br />
Recreation/<br />
Aesthetic<br />
Irrigation:<br />
Lawn /<br />
Landscape<br />
Irrigation:<br />
Parks,<br />
Cemeteries,<br />
Playing Fields,<br />
etc.<br />
Total<br />
Groundwater<br />
/<br />
County<br />
Total<br />
Surface<br />
<strong>Water</strong> /<br />
County<br />
Animals and County<br />
County<br />
Golf Course<br />
<strong>Water</strong> Parks Total<br />
*Charlotte 0.000 1.453 0.190 0.087 0.000 1.730 0.661 1.068<br />
Citrus 0.003 5.039 0.152 0.057 0.003 5.254 4.803 0.451<br />
Desoto 0.027 0.149 0.176 0.004 0.000 0.356 0.265 0.090<br />
Hardee 0.004 0.282 0.015 0.000 0.000 0.301 0.269 0.032<br />
Hernando 0.387 3.735 0.842 0.099 0.000 5.063 4.718 0.345<br />
*Highlands 0.000 2.081 0.294 0.054 0.000 2.429 2.392 0.037<br />
Hillsborough 0.773 3.560 2.788 1.436 0.094 8.651 8.219 0.431<br />
*Lake 0.000 0.000 0.000 0.000 0.000 0.000 0.000 0.000<br />
*Levy 0.000 0.205 0.008 0.028 0.007 0.248 0.247 0.000<br />
Manatee 0.011 1.724 8.317 0.350 0.000 10.402 9.464 0.937<br />
*Marion 0.541 2.730 0.481 0.067 0.006 3.825 3.651 0.173<br />
Pasco 0.508 2.676 0.761 0.289 0.000 4.234 3.594 0.640<br />
Pinellas 0.000 1.130 0.627 0.232 0.000 1.989 1.424 0.565<br />
*Polk 1.665 4.749 1.314 0.551 0.058 8.337 7.846 0.491<br />
Sarasota 0.034 3.650 2.832 0.295 0.030 6.841 5.794 1.046<br />
Sumter 0.000 1.954 0.595 0.011 0.097 2.657 2.656 0.000<br />
District Total 3.953 35.117 19.392 3.560 0.295 62.317 56.003 6.306<br />
% of Total 6% 56% 31% 6% 0% 100% 90% 10%<br />
Total Groundwater<br />
/<strong>Use</strong> 3.412 31.320 17.439 3.546 0.288<br />
Total Surface <strong>Water</strong> /<br />
<strong>Use</strong> 0.542 3.797 1.953 0.012 0.005<br />
* Data is only for the portion of the county within the District.<br />
Data source: <strong>Estimated</strong> <strong>Water</strong> <strong>Use</strong> Tables derived from the WMIS WUP database, <strong>2011</strong><br />
<strong>Southwest</strong> <strong>Florida</strong> <strong>Water</strong> <strong>Management</strong> District Page | 30
<strong>2011</strong> ESTIMATED WATER USE REPORT<br />
Percent of Total Recreation/Aesthetic Pumpage & <strong>Use</strong> by County<br />
Other = *Charlotte,<br />
DeSoto, Hardee,<br />
*Highlands, *Lake,<br />
*Levy, Pinellas,<br />
Sumter<br />
Sarasota<br />
11%<br />
Others<br />
12%<br />
Citrus<br />
8%<br />
Hernando<br />
8%<br />
*Highlands<br />
4%<br />
* Data is only from<br />
the portion of the<br />
county within the<br />
District.<br />
*Polk<br />
13%<br />
Pasco<br />
7%<br />
*Marion<br />
6%<br />
Manatee<br />
17%<br />
Hillsborough<br />
14%<br />
Total <strong>Use</strong> = 62 mgd<br />
Figure 6. Metered + <strong>Estimated</strong> Recreation/Aesthetic <strong>Water</strong> <strong>Use</strong> by County, <strong>2011</strong> (Data<br />
Source: WMIS WUP database)<br />
Pumpage (mgd/month)<br />
100.00<br />
90.00<br />
80.00<br />
70.00<br />
60.00<br />
50.00<br />
40.00<br />
30.00<br />
20.00<br />
10.00<br />
0.00<br />
Recreation/Aesthetic Pumpage and Rainfall<br />
Pumpage <br />
Rainfall<br />
Jan Feb Mar Apr May Jun Jul Aug Sep Oct Nov Dec<br />
10.0<br />
9.0<br />
8.0<br />
7.0<br />
6.0<br />
5.0<br />
4.0<br />
3.0<br />
2.0<br />
1.0<br />
0.0<br />
Rainfall (inches/month)<br />
Total Monthly Pumpage<br />
Total Monthly Rainfall<br />
Figure 7. Metered +<strong>Estimated</strong> Recreation/Aesthetic <strong>Water</strong> <strong>Use</strong> (mgd/month) and<br />
District Regional Total Rainfall (inches/month), <strong>2011</strong> (Data Source: WMIS WUP<br />
database and District rainfall data)<br />
<strong>Southwest</strong> <strong>Florida</strong> <strong>Water</strong> <strong>Management</strong> District Page | 31
<strong>2011</strong> ESTIMATED WATER USE REPORT<br />
This page is intentionally blank.<br />
<strong>Southwest</strong> <strong>Florida</strong> <strong>Water</strong> <strong>Management</strong> District Page | 32
<strong>2011</strong> ESTIMATED WATER USE REPORT<br />
AGRICULTURE USE = 390 MGD<br />
In <strong>2011</strong>, the total metered plus estimated<br />
agriculture water pumpage and use in the<br />
District was determined to be 390.4 mgd. The<br />
agriculture use type category is for<br />
groundwater and surface water withdrawals<br />
related to agriculture activities such as bed<br />
preparation, crop establishment, irrigation,<br />
fertigation, chemigation, product washing and<br />
packing, freeze protection, irrigation system<br />
maintenance, livestock water needs, and<br />
potable water for farm employees.<br />
GENERAL INFORMATION<br />
Historically, agriculture water use estimates<br />
were calculated indirectly based on estimated<br />
production acreage and crop water use<br />
coefficients. Since 1989, the District has<br />
increasingly required meters to be installed on<br />
withdrawal points on WUPs as the evergrowing<br />
withdrawals from groundwater caused<br />
adverse impacts to the aquifer, other legal<br />
existing users, off‐site land use, and the<br />
environment.<br />
Presently, metering is required for withdrawal<br />
points on WUPs issued for 100,000 gpd or more<br />
on an annual average basis in the SWUCA and<br />
the NTB WUCA. In the SWUCA, all irrigation<br />
permits for 100,000 gpd or more on a drought<br />
annual average basis (2‐in‐10 statistical rainfall<br />
year) were required to meter withdrawals as of<br />
2003. The “drought” annual average quantity<br />
permitted for irrigation in the SWUCA is the<br />
same as the “standard” annual average quantity<br />
permitted for irrigation outside of the SWUCA.<br />
In <strong>2011</strong>, the Dover/Plant City WUCA was<br />
established, and all withdrawal points<br />
permitted with freeze protection quantities or<br />
permitted for uses that typically require freeze<br />
protection were required to be metered. Since<br />
measurement of crop protection quantities have<br />
to be done when the permittee is trying to save<br />
their businesses, the District had automatic<br />
meter reading devices installed on the meter.<br />
The District is also paying for the subscription<br />
to have them read electronically.<br />
acreages and crops grown in the SWUCA and<br />
NTB WUCA, gives the District excellent data on<br />
water used for irrigation of many crop types<br />
under varying climate conditions.<br />
The District irrigation rate calculation program,<br />
known as AGMOD, is used to derive the acreinch<br />
application rate for 39 crop types based on<br />
<strong>Florida</strong>‐modified Blaney‐Criddle calculations<br />
that take crop type, growing season, geographic<br />
location, rainfall, soil type, irrigation method,<br />
solar radiation, and root depth into account. If<br />
the irrigation method allows the crop to utilize<br />
effective rainfall, the quantity allowed to be<br />
pumped from the resource is a supplemental<br />
irrigation quantity to make up for any rainfall<br />
shortage. Crops that cannot utilize effective<br />
rainfall are those grown under plastic sheeting<br />
(called mulch), or in greenhouses. The<br />
quantities permitted to be pumped for this<br />
latter group are the entire amount needed for<br />
optimum growth.<br />
The reader is referred to Chapters 3 and 5 in the<br />
<strong>Water</strong> <strong>Use</strong> Permit Information Manual, Part B,<br />
Basis of Review for a more detailed explanation<br />
of rainfall frequency relative to permitted<br />
quantities and metering thresholds respectively.<br />
<strong>2011</strong> DATA<br />
There was a 77 mgd reduction in water use for<br />
agriculture from 2010, when it was estimated to<br />
have been 467 mgd. Despite the EWU Reports<br />
not being an in‐depth analysis of water use, a<br />
few reasons for the decrease in water use from<br />
467 mgd to 390 mgd were explored.<br />
Fewer WUPs: Between 2010 and <strong>2011</strong>, there<br />
were 206 fewer water use permits in active<br />
status due to expirations, cancellations, and<br />
some combining of multiple WUPs into one. Of<br />
these, 144 WUPs included agricultural use.<br />
The largest decrease in quantities (‐45 mgd)<br />
was associated with cancellation or expiration<br />
of 146 Small General WUPs (those permitted for<br />
less than 100,000 gpd on an annual average<br />
basis). This reduction in WUPs was partly due<br />
to updating the database in <strong>2011</strong> for the SWUCA<br />
Recovery Project with respect to citrus acreage.<br />
It was necessary to reconcile the high amount<br />
of citrus acreage in the District database with<br />
The combination of metering withdrawals for<br />
crops and the further requirement for<br />
agricultural water uses to provide details on<br />
the much smaller citrus acreage counted by the<br />
<strong>Southwest</strong> <strong>Florida</strong> <strong>Water</strong> <strong>Management</strong> District Page | 33
<strong>2011</strong> ESTIMATED WATER USE REPORT<br />
<strong>Florida</strong> Department of Agriculture and<br />
Consumer Services. The difference appeared to<br />
be more than could be accounted for by the<br />
District’s practice of including proposed acreage<br />
in the count. Many small citrus WUPs were<br />
cancelled in <strong>2011</strong> in the SWUCA because the<br />
property had been converted to housing<br />
developments from about 2003 to 2008.<br />
However, many of these citrus WUPs were still<br />
in “Approved” status until <strong>2011</strong>. Therefore they<br />
were counted as existing water use for citrus,<br />
and pumpage quantities had been estimated for<br />
them. That accounted for some of the decrease<br />
from 2003 to <strong>2011</strong>; however, it does not<br />
account for the magnitude of the decrease in<br />
pumpage from 2010 to <strong>2011</strong>. The table below<br />
shows that pumpage from metered agricultural<br />
WUPs decreased by 32 mgd, but the number of<br />
metered agricultural WUPs increased by 2<br />
WUPs. There was more going on than can be<br />
explained by the reduced agricultural WUP<br />
numbers.<br />
Year<br />
Agricultural <strong>Water</strong> <strong>Use</strong>, 2010 & <strong>2011</strong><br />
Quantity Decrease<br />
Metered/<br />
% of<br />
No. of<br />
<strong>Use</strong>d<br />
<strong>Estimated</strong><br />
Total WUPs<br />
(mgd) (mgd)<br />
WUP #<br />
Change<br />
2010 Metered 304 65 1,180<br />
2010 <strong>Estimated</strong> 163 35 5,073<br />
Total 467 100 6,253<br />
<strong>2011</strong> Metered 272 70 ‐32 1,182 +2<br />
<strong>2011</strong> <strong>Estimated</strong> 118 30 ‐45 4,927 ‐146<br />
Total 390 100 ‐77 6,109 ‐144<br />
Rainfall: The amount of total annual rainfall in<br />
<strong>2011</strong> (49.6 inches) was only slightly more than<br />
that of 2010 (49.3 inches). However,<br />
agricultural irrigation is much more sensitive to<br />
the timing of rainfall events than to the absolute<br />
rainfall amount. Analyses of the patterns of<br />
rainfall and pumpage for 2010 and <strong>2011</strong> shed<br />
light on the drop in pumpage in <strong>2011</strong> for<br />
agricultural use. Comparing the rainfall<br />
quantity per month between 2010 and <strong>2011</strong><br />
shows a large rainfall increase from practically<br />
none in October 2010 to 5 inches in October<br />
<strong>2011</strong>.<br />
inches/month<br />
October is when strawberry beds are wetted in<br />
preparation for mounding under plastic<br />
followed by using overhead sprinklers to help<br />
establish the seedlings and protect them from<br />
heat stress. Large quantities of water had to be<br />
pumped for the strawberry crops in 2010 that<br />
were not necessary in <strong>2011</strong>, as is shown in the<br />
next graph.<br />
Million Gal/Day<br />
15.00<br />
10.00<br />
5.00<br />
0.00<br />
1500<br />
1000<br />
500<br />
0<br />
Comparision of Monthly Rainfall<br />
Jan<br />
Feb<br />
Mar<br />
Apr<br />
May<br />
Agricultural water pumpage was higher in the<br />
spring of <strong>2011</strong> than it was in the spring of 2010.<br />
This was expected in February and April of<br />
<strong>2011</strong> because rainfall was lower than February<br />
and April of 2010. However, during March<br />
<strong>2011</strong>, it appears that approximately double the<br />
pumpage occurred during a month when<br />
rainfall totals were similar.<br />
A review of the daily rainfall charts for March<br />
<strong>2011</strong> was made. Very many of the rainfall<br />
stations showed little to no rain in February and<br />
then almost 27 days without rain in March,<br />
except for a 1.5 inch rainfall event on March 10.<br />
Each station showed very high rainfall at the<br />
end of the month.<br />
Jun<br />
Jul<br />
Aug<br />
2010 <strong>2011</strong><br />
Sep<br />
Oct<br />
Comparison of Monthly Pumpage<br />
Jan Feb Mar Apr May Jun<br />
Nov<br />
Dec<br />
Jul Aug Sep Oct Nov Dec<br />
2010 pumpage <strong>2011</strong> pumpage<br />
<strong>Southwest</strong> <strong>Florida</strong> <strong>Water</strong> <strong>Management</strong> District Page | 34
<strong>2011</strong> ESTIMATED WATER USE REPORT<br />
The chart of daily rainfall totals at the Sarasota‐<br />
Bradenton Airport during March <strong>2011</strong> was<br />
chosen to serve as an illustration of the rainfall<br />
pattern that was found at many rainfall stations<br />
in many counties in the District in March <strong>2011</strong>.<br />
The high pumpage in March <strong>2011</strong> was in<br />
response to a dry spell that lasted longer than a<br />
month. The rainfall amount that put March <strong>2011</strong><br />
in the “very wet” category with respect to<br />
historic March rainfall only occurred for three<br />
days at the end of the month.<br />
Freeze Protection: The amount of water used<br />
for freeze protection of crops in 2010 was much<br />
higher than it was in <strong>2011</strong>. In January 2010,<br />
there were six major freeze events, each lasting<br />
approximately 1 day in the SWUCA (the largest<br />
citrus and strawberry growing area in the<br />
District). In December 2010, there were two<br />
significant freeze events in the SWUCA, each<br />
lasting for several days. Making matters worse,<br />
the 2010 December freeze was earlier than<br />
normal when the strawberry plants were<br />
younger, more easily damaged, and less<br />
salvageable if damaged. In <strong>2011</strong> there were<br />
two days in January when temperatures went<br />
below 35 0 F in the SWUCA, and there was a twoday<br />
freeze in February <strong>2011</strong>. There were no<br />
freeze events in November and December <strong>2011</strong><br />
anywhere in the District. This is reflected in the<br />
comparatively lower pumpage in January and<br />
December <strong>2011</strong>.<br />
Citrus Disease: The largest decreases in<br />
pumpage from 2010 to <strong>2011</strong> took place in Polk<br />
County (‐24 mgd), and the highest agricultural<br />
use in Polk County was for irrigating citrus<br />
groves. Some of the reduced water use could be<br />
a consequence of infection of citrus groves in<br />
the District with the Huanglongbing (HLB)<br />
greening virus that was detected in many citrus<br />
groves in the District. However, some growers<br />
used more water on these groves because it was<br />
thought that increasing irrigation quantities by<br />
about 10% on infected groves delayed and<br />
reduced the adverse effects of HLB greening.<br />
Other growers tried irrigating with less water,<br />
and yet others abandoned their groves. The<br />
District is currently investigating if it is<br />
reasonable and beneficial to allocate additional<br />
disease control quantities for groves infected<br />
with the HLB greening virus.<br />
Normal Fluctuation: Historically, the amount of<br />
water used for agricultural irrigation has<br />
fluctuated a great deal from one year to the<br />
next. The following graph shows the annual<br />
average pumpage for 2002 to <strong>2011</strong> from 131<br />
agricultural WUPs that are permitted for<br />
1,000,000 gpd or more on an annual average<br />
basis. Total annual average pumpage fluctuated<br />
from as much as 52 mgd between 2005 and<br />
2006 to as little as 6 mgd between 2003 and<br />
2004.<br />
MGD<br />
160<br />
140<br />
120<br />
100<br />
80<br />
Annual Average Pumpage from AG WUPs<br />
Permitted for 1 MGD or More<br />
Annual Average Pumpage<br />
SOURCE, COUNTY AND CROP TYPES<br />
Of the total 390.4 mgd agriculture water use<br />
volume, approximately 374.5 mgd or 96 percent<br />
was withdrawn from groundwater sources<br />
(Table B‐1, Appendix B).<br />
Table 4 summarizes water use by county and by<br />
agricultural use groups based on similarity of<br />
crop types. The District’s agricultural groupings<br />
are the same as those used by the <strong>Florida</strong><br />
Department of Agricultural and Consumer<br />
<strong>Southwest</strong> <strong>Florida</strong> <strong>Water</strong> <strong>Management</strong> District Page | 35
<strong>2011</strong> ESTIMATED WATER USE REPORT<br />
Services. Citrus was still the largest crop in the<br />
District, utilizing 57% (222.7 mgd) of the total<br />
agricultural pumpage. The highest citrus<br />
growing counties were Polk (71.2 mgd), DeSoto<br />
(51.4 mgd), Highlands (38.8 mgd), and Hardee<br />
(27.2 mgd) counties for 85% of the water use<br />
for citrus. Tomatoes were the second largest<br />
crop, utilizing 12% (48.0 mgd) of the total<br />
agricultural pumpage, and general vegetables<br />
were the third largest crop utilizing 6% (23.6<br />
mgd) of the total agricultural pumpage. Both of<br />
these row‐crop types were predominantly<br />
grown in Manatee County. Together, these three<br />
crop types utilized 75% of the water withdrawn<br />
for irrigation of crops.<br />
Permit‐specific water use data for all metered<br />
agriculture WUPs are given Table A‐7 in<br />
Appendix A. The crop type shown in this table<br />
is the one for which the highest quantity of<br />
water was permitted even though many other<br />
crops may also have been included in the<br />
permittee’s WUP. The source of water, annual<br />
average quantities pumped, the total permit<br />
annual average quantities, and the annual<br />
average quantity that is permitted for<br />
agricultural use is given for metered WUPs. The<br />
web version of this report also includes the<br />
unmetered WUPs in Table A‐7.<br />
Figure 8 divides the percentage of water used<br />
for agriculture by county. The county with the<br />
greatest percentage of agriculture water use in<br />
<strong>2011</strong> was Polk County, using approximately<br />
21% (80.3 mgd) of the water used for<br />
agriculture activities. DeSoto County had the<br />
second highest agricultural water use (67.5<br />
mgd) and Manatee County had the third highest<br />
use (65.6 mgd). However, in terms of<br />
percentages, DeSoto and Manatee counties tie at<br />
17% of the total.<br />
Figure 9 presents the total monthly pumpage<br />
and total monthly rainfall, showing their inverse<br />
relationship. The high rainfall (7.4 inches) and<br />
anomalously high pumpage (490 mgd) in March<br />
<strong>2011</strong> is explained when daily rainfall for the<br />
month was analyzed (above).<br />
Dover/Plant City WUCA is not included in this<br />
table because it overlaps with some of the<br />
SWUCA and some of the NTB WUCA.<br />
Pumpage<br />
SWUCA<br />
NTB<br />
WUCA<br />
Non<br />
WUCA<br />
MGD 326 31 33<br />
% Total 84 8 8<br />
Table A‐8 in Appendix A shows withdrawals by<br />
county by month. For more information<br />
regarding agriculture water withdrawal and<br />
use, please refer to Tables 4, 8, and 9, and to<br />
Tables A‐7, A‐8 and B‐1 in the appendices of this<br />
report.<br />
Table C‐2 shows the permitted annual average<br />
quantities in the SWUCA by groundwater and by<br />
surface water. The increase in permitted annual<br />
average quantities from groundwater is an<br />
artifact of the removal of repumped water from<br />
the tally. When repumped water was included<br />
as a surface water source, the sum of the annual<br />
average quantities on the withdrawal points<br />
exceeded the permit total annual average<br />
quantities. The excessive “permitted” quantities<br />
on withdrawal points was normalized to the<br />
permit total quantities, causing the contribution<br />
to the total annual average quantity from<br />
groundwater to be reduced. Table C‐2 also<br />
shows that the permitted annual average<br />
quantities from surface water decreased from<br />
those “permitted” 2010. See Appendix F for<br />
more information on the scaling methodology.<br />
Manatee County showed the largest increase in<br />
permitted groundwater annual average<br />
quantities for agricultural. There were<br />
groundwater or surface water permitted<br />
quantity changes on 35 agricultural WUPs from<br />
2010 to <strong>2011</strong>. Fourteen were modifications,<br />
two WUPs were new, and 19 WUPs had not<br />
been modified. All the un‐modified WUPs that<br />
showed the change in quantities from surface<br />
water to groundwater had repump water<br />
counted as surface water in 2010 (and earlier).<br />
All of their apparent increase in groundwater<br />
permitted and concurrent decrease in surface<br />
water permitted to them were due to the fact<br />
that repumped quantities were excluded for<br />
The following table shows that 84% of<br />
agricultural water use occurred in the SWUCA.<br />
(See Appendix B for greater detail). The<br />
<strong>2011</strong>. The correct methodology of removing<br />
<strong>Southwest</strong> <strong>Florida</strong> <strong>Water</strong> <strong>Management</strong> District Page | 36
<strong>2011</strong> ESTIMATED WATER USE REPORT<br />
repumped quantities from the tally of permitted<br />
quantities had been initiated for the <strong>2011</strong> EWU<br />
Report. Removal of pumpage data for repump<br />
withdrawal points was implemented in 2010.<br />
DOVER/PLANT CITY WUCA<br />
As was mentioned earlier, the Dover/Plant City<br />
WUCA was created in <strong>2011</strong> to address adverse<br />
impacts to existing legal users and off‐site land<br />
use caused by high pumpage from the Upper<br />
<strong>Florida</strong>n aquifer for freeze protection of crops.<br />
The high pumpage rates draw down the aquifer<br />
water level to such an extent that pumps in<br />
shallow, short‐cased wells burn out when the<br />
water level falls below the pump bowls if the<br />
pumps are not turned off. In addition, the<br />
shallow Upper <strong>Florida</strong>n aquifer contains<br />
dissolution cavities, and removal of the water in<br />
the aquifer by pumping (or by very low rainfall)<br />
diminishes the support it provides to the land<br />
surface. The result can be the formation of<br />
sinkholes. In the winter, it is pumping for<br />
freeze protection of strawberries, citrus, and<br />
blueberries (as well as for nurseries and fish<br />
farms) that removes a large amount of water<br />
(generally over 800 mgd) in a short time.<br />
Table B‐5 in Appendix B gives the annual<br />
average pumpage quantities for the<br />
Dover/Plant City WUCA. Accurate data on<br />
actual maximum daily pumpage for freeze<br />
protection of crops is not yet available.<br />
Historically, freeze pumping was only a bestguess<br />
because the grower was not required to<br />
take meter readings before and after a freeze<br />
event. Most of the annual average pumpage is<br />
from groundwater, so it is assumed that most of<br />
the actual freeze protection comes from<br />
groundwater. In <strong>2011</strong>, metering of freeze<br />
protection pumping became required on all<br />
withdrawal points having maximum day<br />
quantities permitted on their WUP for freeze<br />
protection and on wells not permitted for freeze<br />
protection but permitted with annual average<br />
quantities for a use that typically requires freeze<br />
protection. However, the meters and<br />
automated reporting devices were in the<br />
process of being installed in <strong>2011</strong>, so actual<br />
pumpage for freeze protection of crops was not<br />
available for <strong>2011</strong>.<br />
The District reimbursed permittees that had to<br />
install meters on wells pursuant to the new<br />
rules. It also financed the addition of automatic<br />
meter reading devices to wells used for freeze<br />
protection as well as the subscription costs to<br />
the vendor that takes the readings and sends<br />
the data to the District.<br />
Table C‐5 in Appendix C gives the total<br />
permitted annual average quantities in the<br />
Dover/Plant City WUCA. Table C‐6 presents<br />
freeze protection quantities permitted to<br />
agricultural WUPs by crop type. Of the 1,126.2<br />
mgd permitted for freeze protection of crops,<br />
79% (886.3 mgd) was from groundwater. The<br />
Dover/Plant City WUCA rules strongly<br />
encourage the use of surface water, and<br />
especially alternative water supply sourced<br />
from surface water, to replace groundwater<br />
withdrawals for crop freeze protection.<br />
Furthermore, the District’s Facilitating<br />
Agricultural Resource <strong>Management</strong> Systems<br />
(FARMS) cost‐share program targets this region<br />
with financial aid to promote creation of surface<br />
water sources. Consequently, the percentage of<br />
freeze protection water sourced from<br />
groundwater is expected to decrease.<br />
Strawberries were, and still are, the<br />
predominant crop in the Dover/Plant City<br />
WUCA. Eighty‐two percent (82%) of the<br />
quantity permitted for freeze protection of<br />
agricultural uses was for the protection of<br />
strawberries (927 mgd). However, the other<br />
agricultural enterprises that require freeze<br />
protection in the winter are blueberries, citrus,<br />
nurseries, other fruit‐bearing trees and<br />
aquaculture. The timing and method for using<br />
water to provide freeze protection varies<br />
according to the crop. For instance, overhead<br />
sprinklers are used on strawberries,<br />
blueberries, and nurseries, while microjet spray<br />
is used on citrus and other fruit‐bearing trees.<br />
The fish farms add the warmer water from the<br />
aquifer to the surface ponds to keep water<br />
temperature at a healthier level for the fish.<br />
Also, pumping for freeze protection begins<br />
at different temperatures depending on<br />
what is being protected and how it is being<br />
protected.<br />
<strong>Southwest</strong> <strong>Florida</strong> <strong>Water</strong> <strong>Management</strong> District Page | 37
<strong>2011</strong> ESTIMATED WATER USE REPORT<br />
Table 4. Summary of Metered + <strong>Estimated</strong> Annual Average Agricultural <strong>Water</strong> Pumpage (mgd) by County and <strong>Water</strong> Source by<br />
<strong>Use</strong>, <strong>2011</strong><br />
County<br />
Citrus<br />
Field<br />
Crop 1<br />
Melon Nursery Pasture Sod<br />
<strong>Southwest</strong> <strong>Florida</strong> <strong>Water</strong> <strong>Management</strong> District Page | 38<br />
Straw<br />
berry<br />
Tomato Vegetable<br />
Blueberry<br />
Aquaculture<br />
Other 2<br />
Total<br />
GW+SW<br />
Total<br />
Groundwater<br />
Total<br />
Surface<br />
<strong>Water</strong><br />
*Charlotte 0.000 5.713 0.320 0.884 0.066 0.373 0.612 0.000 2.091 0.908 0.000 0.002 10.970 7.792 3.177<br />
Citrus 0.046 0.218 0.267 0.174 0.303 0.130 0.017 0.192 0.000 0.073 0.009 0.002 1.431 1.431 0.000<br />
Desoto 0.173 51.375 0.210 4.995 0.042 0.968 2.536 1.504 1.787 1.388 2.444 0.079 67.502 66.181 1.321<br />
Hardee 0.266 27.224 0.720 1.047 1.964 1.412 3.281 0.418 0.745 0.125 0.005 0.682 37.892 37.442 0.449<br />
Hernando 0.202 0.727 0.221 0.000 0.347 0.108 0.000 0.000 0.002 0.000 0.000 0.169 1.778 1.778 0.000<br />
*Highlands 0.127 38.772 0.073 0.000 1.213 0.149 0.150 0.000 0.000 0.000 0.000 0.082 40.566 35.860 4.707<br />
Hillsborough 0.354 7.968 0.439 1.164 3.694 0.245 1.442 15.572 13.054 3.540 2.825 0.242 50.537 48.079 2.458<br />
*Lake 0.018 0.646 0.159 0.141 0.000 0.211 0.000 0.000 0.000 0.000 0.000 0.001 1.176 1.166 0.010<br />
*Levy 0.038 0.000 3.441 1.610 0.346 0.452 0.586 0.000 0.000 0.044 0.000 0.014 6.532 6.336 0.196<br />
Manatee 0.017 12.190 0.603 0.468 1.280 0.709 3.025 0.634 29.560 16.688 0.111 0.321 65.608 65.048 0.561<br />
*Marion 0.001 0.003 2.313 0.929 0.358 0.193 0.000 0.000 0.002 0.089 0.000 0.088 3.976 3.950 0.026<br />
Pasco 0.109 5.758 1.072 0.382 0.604 0.258 0.390 0.232 0.222 0.364 0.068 0.246 9.704 9.513 0.191<br />
Pinellas 0.000 0.000 0.000 0.000 0.064 0.000 0.000 0.000 0.000 0.000 0.000 0.040 0.103 0.074 0.030<br />
*Polk 2.076 71.182 0.912 0.098 1.974 1.133 1.093 0.409 0.137 0.105 1.098 0.130 80.346 78.472 1.874<br />
Sarasota 0.000 0.752 0.295 0.632 0.188 0.067 2.231 0.000 0.222 0.007 0.149 0.029 4.572 4.298 0.274<br />
Sumter 0.066 0.188 1.448 0.941 1.883 0.249 0.490 0.005 0.129 0.292 1.712 0.352 7.755 7.128 0.627<br />
District 3.494 222.716 12.492 13.466 14.328 6.659 15.853 18.966 47.951 23.623 8.421 2.479 390.448 374.547 15.901<br />
% of Total 1% 57% 3% 3% 4% 2% 4% 5% 12% 6% 2% 1% 100% 96% 4%<br />
Total<br />
Groundwater<br />
<strong>Use</strong><br />
Total Surface<br />
<strong>Water</strong> <strong>Use</strong><br />
3.425 213.671 12.101 12.648 13.567 6.612 14.609 17.625 46.250 23.376 8.416 2.242 374.542<br />
0.068 9.045 0.393 0.817 0.759 0.044 1.244 1.342 1.701 0.246 0.006 0.238 15.903<br />
Data source: <strong>Estimated</strong> <strong>Water</strong> <strong>Use</strong> Tables derived from the WMIS WUP database, Calendar Year <strong>2011</strong><br />
* Data is only for the portion of the county within the District<br />
1 Field crops are grains, legumes and commercial hay.<br />
2 Other = Lawn & landscape irrigation (0.154 mgd), animals (0.393 mgd), fruit trees (other than citrus) (0.083 mgd), dairy (0.747 mgd), research (0.225 mgd),<br />
dewatering to off‐site for agricultural purposes (0.234 mgd),and miscellaneous non‐irrigation agriculture use (0.644)
<strong>2011</strong> ESTIMATED WATER USE REPORT<br />
Percent of Total Agriculture Pumpage & <strong>Use</strong> by County<br />
Others = Citrus,<br />
Hernando,<br />
*Lake, *Levy,<br />
*Marion, Pasco,<br />
Pinellas, Sarasota,<br />
Sumter<br />
Polk<br />
21%<br />
Others<br />
9%<br />
Charlotte<br />
3%<br />
Desoto<br />
17%<br />
Hardee<br />
10%<br />
* Data is only from<br />
the portion of the<br />
county within the<br />
District,<br />
Manatee<br />
17%<br />
Hillsborough<br />
13%<br />
Highlands<br />
10%<br />
Total Pumpage and <strong>Use</strong> = 390<br />
Figure 8. Metered + <strong>Estimated</strong> Agriculture <strong>Water</strong> <strong>Use</strong> by County (mgd), <strong>2011</strong> (Data source:<br />
<strong>Estimated</strong> <strong>Water</strong> <strong>Use</strong> Tables derived from the WMIS WUP database, <strong>2011</strong>)<br />
Pumpage (mgd/month)<br />
700.00<br />
600.00<br />
500.00<br />
400.00<br />
300.00<br />
200.00<br />
100.00<br />
0.00<br />
Agriculture Pumpage and Rainfall<br />
Pumpage <br />
Rainfall<br />
Jan Feb Mar Apr May Jun Jul Aug Sep Oct Nov Dec<br />
10.0<br />
9.0<br />
8.0<br />
7.0<br />
6.0<br />
5.0<br />
4.0<br />
3.0<br />
2.0<br />
1.0<br />
0.0<br />
Rainfall (inches/month)<br />
Total Monthly Pumpage<br />
Total Monthly Rainfall<br />
Figure 9. Metered + <strong>Estimated</strong> Agriculture <strong>Use</strong> (mgd/month) and District Regional Total<br />
Rainfall (inches/month), <strong>2011</strong> (Data Sources: <strong>Estimated</strong> <strong>Water</strong> <strong>Use</strong> Tables derived from the WMIS<br />
WUP database and <strong>2011</strong> District rainfall data)<br />
<strong>Southwest</strong> <strong>Florida</strong> <strong>Water</strong> <strong>Management</strong> District Page | 39
<strong>2011</strong> ESTIMATED WATER USE REPORT<br />
This page is intentionally blank.<br />
<strong>Southwest</strong> <strong>Florida</strong> <strong>Water</strong> <strong>Management</strong> District Page | 40
<strong>2011</strong> ESTIMATED WATER USE REPORT<br />
MINING/DEWATERING USE = 22 MGD<br />
In <strong>2011</strong>, 21.6 mgd of water was withdrawn and<br />
removed from mining sites due to mining and<br />
dewatering activities in the District (Table 5).<br />
Nearly all of the water was withdrawn from<br />
groundwater sources; only 0.3 mgd were<br />
withdrawn from surface water sources.<br />
GENERAL INFORMATION<br />
The mining/dewatering water use category<br />
includes phosphate, peat, limestone, and<br />
sand/shell/gravel mining, reclamation<br />
irrigation, landscape irrigation, dewatering for<br />
the creation of borrow pits for construction<br />
purposes, and personal/sanitary water needs of<br />
employees. If washing and/or processing of<br />
mined materials is done onsite, those water<br />
uses are included in the mining/ dewatering<br />
category.<br />
The permitted quantities on mining/dewatering<br />
WUPs issued by the District prior to 2000 were<br />
based on dewatering quantities regardless of<br />
whether the water was recirculated onsite or<br />
discharged offsite. Since 2000, as<br />
mining/dewatering WUPs were renewed, only<br />
the water that was removed from the local<br />
hydrologic system was put on the WUP as a<br />
permitted quantity. These are dewatering<br />
quantities discharged off‐site; water entrained<br />
with the mined product; losses associated with<br />
washing and processing the product onsite;<br />
water used to move the product if it was<br />
discharged offsite; evaporative losses;<br />
reclamation irrigation; generation of electric<br />
power needed by a mining operation (a process<br />
known as co‐generation); gypsum stack closure;<br />
maintenance of equipment and vehicles;<br />
landscape irrigation; fire suppression and<br />
testing; and personal/ sanitary needs of<br />
employees.<br />
The reason for the change in quantifying<br />
mining/dewatering permitted use was because<br />
when water is pumped out of a mine pit into an<br />
onsite pond or surface water body, and there is<br />
a strong hydraulic connection between the two,<br />
the water quickly drains from the pond into the<br />
underlying aquifer and then flows laterally back<br />
to the mine pit. The “same” water is usually<br />
pumped repeatedly in these instances. When<br />
hydrogeologic information indicates this is<br />
happening, the District categorizes that as a<br />
dewatering quantity that does not add to<br />
consumptive loss. It is given a “use code” in the<br />
database that identifies it as a non‐consumptive<br />
use, and it is excluded from this report (see<br />
Appendix F). Strong hydraulic connections<br />
between mine pits and nearby receiving water<br />
bodies are common in south‐central <strong>Florida</strong>.<br />
However, if there is not a strong hydraulic<br />
connection between the mine pit and receiving<br />
pond, the dewatering quantities are included as<br />
permitted quantities on the WUP, a different use<br />
code is given, and it is included in this report.<br />
Also, if the dewatering operation is not directly<br />
related to withdrawal‐related impacts, the<br />
dewatering pump is usually not required to be<br />
metered. Due to this, permitted quantities and<br />
pumpage data for the mining/dewatering<br />
category has been reduced significantly from<br />
those indicated in the pre‐2000 data.<br />
Most of the mining operations today re‐circulate<br />
dewatering quantities onsite, and the product<br />
usually sits onsite to dewater prior to being<br />
taken offsite. The quantity of water entrained<br />
with the product is a calculation made<br />
according to the product and mining operations.<br />
A “sealing” water well is a well that withdraws<br />
water to transport mined products through<br />
pipelines as slurry. <strong>Water</strong> is introduced at<br />
various locations along the pipeline to keep the<br />
slurry moving. Sealing water wells are drilled<br />
as needed and then plugged when the pipeline<br />
is moved elsewhere. A new sealing water well<br />
is then drilled at the new pipeline location. A<br />
quantity is permitted to these wells, and if the<br />
slurry water is discharged offsite, the quantity is<br />
included in the permit total. If the slurry water<br />
is recycled, only water losses associated with<br />
the process of moving the slurry and<br />
evaporative losses associated with any recycling<br />
pond are included in the permitted quantity on<br />
the WUP.<br />
<strong>2011</strong> DATA<br />
<strong>Southwest</strong> <strong>Florida</strong> <strong>Water</strong> <strong>Management</strong> District Page | 41
For this report, the withdrawals on the large<br />
Mosaic Fertilizer LLC permit were apportioned<br />
to the counties in which they occurred (Manatee<br />
for 19% and Hillsborough for 81%). Although<br />
Mosaic Fertilizer LLC also owned property in<br />
Hardee County in <strong>2011</strong>, no pumping was done<br />
there. However, CF Industries, Inc. was actively<br />
mining phosphate in Hardee County.<br />
Table 5 summarizes county‐level water use by<br />
product type. Ninety‐four percent (94%) of the<br />
annual average quantities used for mining/<br />
dewatering were in Polk County (11.2 mgd),<br />
Hernando County (4.6 mgd), and Manatee<br />
County (3.5 mgd). The largest mineral mined<br />
was phosphate for 70% of the water used.<br />
Figure 10 shows that in <strong>2011</strong>, 56% of the<br />
quantities withdrawn for mining/dewatering<br />
use were in Polk County, and 88% of that was<br />
for phosphates. Hernando County accounted for<br />
22% of the total annual average quantities used<br />
in the mining/ dewatering use category, and all<br />
of it was for limestone mining. Manatee County<br />
used 16% of the total annual average quantity<br />
for mining/dewatering use for phosphate<br />
mining.<br />
Figure 11 shows mining/dewatering water use<br />
compared to rainfall. There is a slight<br />
relationship between mining and rainfall due to<br />
dewatering activities.<br />
Table A‐9 in Appendix A presents permitspecific<br />
water withdrawal data for<br />
mining/dewatering use, grouped by county.<br />
Table A‐10 illustrates average monthly<br />
withdrawals by county and water source.<br />
<strong>2011</strong> ESTIMATED WATER USE REPORT<br />
<strong>Southwest</strong> <strong>Florida</strong> <strong>Water</strong> <strong>Management</strong> District Page | 42
<strong>2011</strong> ESTIMATED WATER USE REPORT<br />
Table 5. Summary of Metered + <strong>Estimated</strong> Annual Average Mining / Dewatering Quantities Consumed (mgd) by<br />
County and <strong>Water</strong> Source Type, <strong>2011</strong><br />
County<br />
General<br />
Mining /<br />
Dewatering<br />
Limestone<br />
Phosphate<br />
Sand /Shell<br />
/Gravel<br />
Total GW +<br />
SW<br />
Total Groundwater<br />
Total Surface<br />
<strong>Water</strong><br />
*Charlotte 0.021 0.000 0.000 0.004 0.026 0.000 0.026<br />
Citrus 0.006 0.000 0.000 0.000 0.006 0.000 0.006<br />
Desoto 0.000 0.000 0.000 0.000 0.000 0.000 0.000<br />
Hardee 0.000 0.000 0.333 0.000 0.333 0.333 0.000<br />
Hernando 0.000 4.637 0.000 0.000 4.637 4.637 0.000<br />
*Highlands 0.000 0.000 0.000 0.000 0.000 0.000 0.000<br />
Hillsborough 0.003 0.000 0.807 0.063 0.873 0.855 0.018<br />
*Lake 0.000 0.000 0.000 0.000 0.000 0.000 0.000<br />
*Levy 0.000 0.000 0.000 0.000 0.000 0.000 0.000<br />
Manatee 0.009 0.000 3.539 0.000 3.548 3.539 0.009<br />
*Marion 0.000 0.000 0.000 0.000 0.000 0.000 0.000<br />
Pasco 0.011 0.000 0.000 0.000 0.011 0.011 0.000<br />
Pinellas 0.000 0.000 0.000 0.000 0.000 0.000 0.000<br />
*Polk 0.037 0.000 9.901 1.304 11.242 11.116 0.126<br />
Sarasota 0.000 0.000 0.000 0.000 0.000 0.000 0.000<br />
Sumter 0.029 0.000 0.000 0.000 0.029 0.008 0.022<br />
District 0.116 4.637 14.580 1.371 20.705 20.499 0.207<br />
% Of Total 1% 22% 70% 7% 100% 99% 1%<br />
Total Groundwater<br />
<strong>Use</strong><br />
Total Surface <strong>Water</strong><br />
<strong>Use</strong><br />
0.049 4.637 14.439 1.367<br />
0.070 0.000 0.141 0.004<br />
Data source: <strong>Estimated</strong> <strong>Water</strong> <strong>Use</strong> Tables derived from the WMIS WUP database, <strong>2011</strong><br />
* Data is only for the portion of the county within the District.<br />
.<br />
<strong>Southwest</strong> <strong>Florida</strong> <strong>Water</strong> <strong>Management</strong> District Page | 43
<strong>2011</strong> ESTIMATED WATER USE REPORT<br />
Percent of Total Mining/Dewatering Consumptive <strong>Use</strong> by County<br />
Other = *Charlotte, Citrus,<br />
DeSoto, *Highlands,<br />
*Lake, *Levy, *Marion,<br />
Pasco,'Pinellas, Sarasota,<br />
Sumter<br />
Other<br />
0.3%<br />
Hardee<br />
2%<br />
Hernando<br />
22%<br />
* Data is only for<br />
the portion of<br />
the county<br />
within the<br />
District.<br />
*Polk<br />
56%<br />
Hillsborough<br />
4%<br />
Manatee<br />
16%<br />
Total Consumptive <strong>Use</strong> = 22 mgd<br />
Figure 10. Metered + <strong>Estimated</strong> Mining / Dewatering <strong>Water</strong> <strong>Use</strong> by County (mgd) (Data<br />
source: <strong>Estimated</strong> <strong>Water</strong> <strong>Use</strong> Tables derived from the WMIS WUP database, <strong>2011</strong>)<br />
Pumpage (mgd/month)<br />
30.0<br />
25.0<br />
20.0<br />
15.0<br />
10.0<br />
5.0<br />
0.0<br />
Pumpage<br />
;jkjkjk<br />
Mining/Dewatering Consumptive <strong>Use</strong> and Rainfall<br />
Jan Feb Mar Apr May Jun Jul Aug Sep Oct Nov Dec<br />
Total Monthly Pumpage<br />
Rainfall<br />
Total Monthly Rainfall<br />
10.0<br />
9.0<br />
8.0<br />
7.0<br />
6.0<br />
5.0<br />
4.0<br />
3.0<br />
2.0<br />
1.0<br />
0.0<br />
Rainfall (inches/month)<br />
Figure 11. Metered + <strong>Estimated</strong> Monthly Mining / Dewatering <strong>Water</strong> <strong>Use</strong> (mgd/month)<br />
and District Regional Total Rainfall (inches/month), <strong>2011</strong> (Data sources: <strong>Estimated</strong><br />
<strong>Water</strong> <strong>Use</strong> Tables derived from the WMIS WUP database & District rainfall data, <strong>2011</strong>)<br />
<strong>Southwest</strong> <strong>Florida</strong> <strong>Water</strong> <strong>Management</strong> District Page | 44
INDUSTRIAL/COMMERCIAL USE = 54<br />
MGD<br />
Approximately 54.3 mgd were withdrawn from<br />
the groundwater and surface water resources for<br />
industrial/commercial water use in the District<br />
during <strong>2011</strong>. This is up from the 52 mgd of<br />
water estimated to have been withdrawn for<br />
industrial/commercial in 2010.<br />
GENERAL INFORMATION<br />
The industrial/commercial water use category<br />
includes product manufacturing, food<br />
processing, commercial and specialty businesses,<br />
power plants, water used in the drink industry<br />
(including bottled water), and water provided<br />
for institutional use (prisons, nursing homes,<br />
etc.). “Product Manufacturing” has replaced the<br />
category “Chemical Manufacturing,” found in<br />
previous reports. The industrial/commercial<br />
water use category does not include water used<br />
for industrial/commercial customers of public<br />
supply systems. It also does not include<br />
seawater that is used for cooling in power plants.<br />
<strong>2011</strong> DATA<br />
Most of the water used in the industrial/<br />
commercial use category was from groundwater<br />
as shown in the table below. Appendix B gives<br />
this information by county and by water use<br />
caution area (WUCA)<br />
Industrial/Commercial<br />
Total <strong>Water</strong> <strong>Use</strong> by Source<br />
Groundwater Surface <strong>Water</strong><br />
Quantity<br />
(mgd) 46 8<br />
Percent of<br />
Total 85% 15%<br />
Table 6 presents county‐level water use by the<br />
following industry groups:<br />
Power Plants: <strong>Water</strong> use at power plants totaled<br />
to 19.1 mgd, and was the highest industrial/<br />
commercial water use in the District in <strong>2011</strong>. It<br />
included water used for steam cooling and oncethrough<br />
cooling (excluding seawater), emission<br />
control, boiler feed and makeup water,<br />
personal/sanitary needs for visitors and<br />
employees, and other small uses related to a<br />
power plant. Power plant water use decreased<br />
<strong>2011</strong> ESTIMATED WATER USE REPORT<br />
from 23 mgd in 2009 to 7 mgd in 2010. It<br />
appeared to have recovered despite the fact that<br />
the anticipated reopening of Duke Energy’s<br />
nuclear power plant at Crystal River, scheduled<br />
for April <strong>2011</strong>, did not happen. (In February<br />
2013, Duke Energy announced that the nuclear<br />
part of this power plant would be permanently<br />
shut down. The coal‐fired units at this plant are<br />
not affected.)<br />
Phosphate Processing: The second highest water<br />
use (12.2 mgd) in the industrial/ commercial use<br />
category was for phosphate processing. If the<br />
phosphate processing is done away from the<br />
mine site, it is classified as an industrial/<br />
commercial water use. Processing of mined<br />
materials that is done at the mine site is<br />
classified as mining/ dewatering water use. The<br />
phosphate processing done by CF Industries, Inc.<br />
was done on site, so it was included in the<br />
mining/ dewatering category at the District.<br />
General Industrial/ Commercial: This<br />
industrial/commercial water use included a<br />
large number of varied industrial/ commercial<br />
enterprises, each of which was small but which<br />
together added to 9.7 mgd. This group included<br />
water for air conditioners and chillers, nonpower<br />
plant boiler feed and makeup water,<br />
cleaning and maintenance, emission control,<br />
refrigeration, water well contracting, product<br />
dilution, lawn and landscape irrigation,<br />
equipment cooling, and heat exchangers.<br />
Product Manufacturing: This group included 8.4<br />
mgd used for asphalt manufacturing, biofuel<br />
generation, cement manufacturing, cement or<br />
concrete batch plants, cement or concrete<br />
products, chemical manufacturing, lime<br />
processing for fertilizers and other general<br />
product manufacturing. It also included water<br />
withdrawn from the aquifer or springs for the<br />
bottled water industry (2 mgd) and water used<br />
and included in other beverages.<br />
Food Processing and Packing: The smallest group<br />
in industrial/commercial use was for food<br />
processing and packing for 4.7 mgd. Most of this<br />
industry is in Polk County where it is<br />
predominantly used for citrus processing and<br />
packing.<br />
<strong>Southwest</strong> <strong>Florida</strong> <strong>Water</strong> <strong>Management</strong> District Page | 45
Figure 12 shows that Polk County accounted for<br />
55% of the total industrial/commercial water<br />
use in the District.<br />
Table 6 shows that most of the water used for<br />
Industrial/Commercial use in Polk County (9.7<br />
mgd) was used in phosphate processing and<br />
power plants (8.5 mgd). The second highest<br />
industrial/commercial water use was in<br />
Hillsborough County (17%), which used 9.3 mgd.<br />
This was expected because of the large number<br />
of businesses in the greater Tampa Bay area.<br />
Figure 13 shows that there was no discernable<br />
relationship between industrial/ commercial<br />
water use and rainfall.<br />
Table 10 shows that 34% of the total water<br />
permitted for industrial/commercial use (159.8<br />
mgd) was actually used. It also shows that 92%<br />
of the permitted quantities are permitted to<br />
metered withdrawal points.<br />
Table A‐11 in Appendix A gives pumpage<br />
information by WUP number. It also gives the<br />
source of the water, how much is permitted to<br />
the WUP and how much is permitted for<br />
industrial/commercial water use on the WUP.<br />
Table A‐12 in Appendix A shows total metered<br />
plus estimated monthly industrial/ commercial<br />
water use.<br />
Table B‐1 shows that 85% of the water pumped<br />
for industrial/commercial use was from<br />
groundwater.<br />
Table C‐1 shows that 90% of the water<br />
permitted for industrial/commercial use was<br />
from groundwater.<br />
<strong>2011</strong> ESTIMATED WATER USE REPORT<br />
<strong>Southwest</strong> <strong>Florida</strong> <strong>Water</strong> <strong>Management</strong> District Page | 46
<strong>2011</strong> ESTIMATED WATER USE REPORT<br />
Table 6. Summary of Metered + <strong>Estimated</strong> Annual Average Industrial/Commercial <strong>Use</strong> (mgd) by County and<br />
<strong>Water</strong> Source by <strong>Use</strong> Type, <strong>2011</strong><br />
County<br />
Food<br />
Processing &<br />
Packing<br />
Phosphate<br />
Processing<br />
Power<br />
Plants<br />
Product<br />
Manufacturing<br />
General<br />
Industrial /<br />
Commercial 2<br />
Total GW<br />
+ SW<br />
Total<br />
Groundwater<br />
Total<br />
Surface<br />
<strong>Water</strong><br />
*Charlotte 0.000 0.000 0.000 0.027 0.000 0.027 0.027 0.000<br />
Citrus 0.000 0.000 2.800 0.009 0.556 3.364 3.361 0.004<br />
Desoto 0.000 0.000 0.027 0.000 0.574 0.601 0.601 0.000<br />
Hardee 0.007 0.000 1 0.000 0.000 1.634 1.641 1.641 0.000<br />
Hernando 0.000 0.000 2.586 0.022 0.001 2.608 2.608 0.000<br />
*Highlands 0.005 0.000 0.000 0.024 0.010 0.039 0.039 0.000<br />
Hillsborough 0.663 2.563 0.000 5.090 1.027 9.344 6.484 2.859<br />
*Lake 0.000 0.000 0.000 0.000 0.000 0.000 0.000 0.000<br />
*Levy 0.000 0.000 0.000 0.000 0.004 0.004 0.004 0.000<br />
Manatee 0.006 0.000 4.792 0.074 0.035 4.908 0.127 4.780<br />
*Marion 0.000 0.000 0.000 0.010 0.055 0.064 0.064 0.000<br />
Pasco 0.006 0.000 0.394 0.564 0.284 1.249 0.686 0.563<br />
Pinellas 0.000 0.000 0.000 0.023 0.014 0.037 0.029 0.009<br />
*Polk 3.996 9.673 8.461 2.283 5.238 29.652 29.502 0.150<br />
Sarasota 0.000 0.000 0.000 0.044 0.015 0.059 0.059 0.000<br />
Sumter 0.039 0.000 0.000 0.227 0.298 0.563 0.563 0.000<br />
District 4.722 12.236 19.060 8.397 9.745 54.160 45.795 8.365<br />
% of Total 9% 23% 35% 16% 18% 100% 85% 15%<br />
Total Groundwater <strong>Use</strong> 4.721 12.203 14.28 4.957 9.635<br />
Total Surface <strong>Water</strong> <strong>Use</strong> 0.000 0.033 4.780 3.439 0.111<br />
Data source: <strong>Estimated</strong> <strong>Water</strong> <strong>Use</strong> Tables derived from the WMIS WUP database, <strong>2011</strong>.<br />
* Data is only for the portion of the county within the District.<br />
1 CFI phosphate processing in Hardee County is captured in the mining/dewatering category.<br />
2 General industrial/commercial includes water for air conditioners and chillers, boiler feed and makeup water (non‐power plant), cleaning and maintenance,<br />
emission control, refrigeration, water well contracting, product dilution, lawn and landscape irrigation, equipment cooling, and heat exchangers.<br />
<strong>Southwest</strong> <strong>Florida</strong> <strong>Water</strong> <strong>Management</strong> District Page | 47
<strong>2011</strong> ESTIMATED WATER USE REPORT<br />
Percent of Total Industrial/Commerical Pumpage & <strong>Use</strong> by County<br />
Other =<br />
*Charlotte,<br />
DeSoto,<br />
*Hoghlands,<br />
*Lake, *Levy,<br />
*Marion, Pinellas ,<br />
Sarasota, Sumter<br />
Other<br />
3%<br />
Citrus<br />
6% Hardee<br />
3% Hernando<br />
5%<br />
Hillsborough<br />
17%<br />
* Data is only from<br />
the portion of the<br />
county within the<br />
District.<br />
Polk<br />
55%<br />
Manatee<br />
9%<br />
Pasco<br />
2%<br />
Total Pumpage/<strong>Use</strong> = 54 mgd<br />
Figure 12. Metered + <strong>Estimated</strong> Industrial/Commercial <strong>Water</strong> <strong>Use</strong> (mgd) by County,<br />
<strong>2011</strong> (Data source: <strong>Estimated</strong> <strong>Water</strong> <strong>Use</strong> Tables derived from the WMIS WUP database, <strong>2011</strong>)<br />
Pumpage (mgd/month)<br />
120<br />
100<br />
80<br />
60<br />
40<br />
20<br />
0<br />
Industrial/Commercial Pumpage and Rainfall<br />
Rainfall <br />
Pumpage<br />
Jan Feb Mar Apr May Jun Jul Aug Sep Oct Nov Dec<br />
10.0<br />
9.0<br />
8.0<br />
7.0<br />
6.0<br />
5.0<br />
4.0<br />
3.0<br />
2.0<br />
1.0<br />
0.0<br />
Rainfall (inches/month)<br />
Total Monthly Pumpage<br />
Total Monthly Rainfall<br />
Figure 13. Metered + <strong>Estimated</strong> Monthly Industrial/Commercial <strong>Water</strong> <strong>Use</strong><br />
(mgd/month) and District Regional Total Rainfall (inches/month), <strong>2011</strong><br />
(Data sources: <strong>Estimated</strong> <strong>Water</strong> <strong>Use</strong> Tables derived from the WMIS WUP database and District rainfall<br />
data, <strong>2011</strong>)<br />
.<br />
<strong>Southwest</strong> <strong>Florida</strong> <strong>Water</strong> <strong>Management</strong> District Page | 48
<strong>2011</strong> ESTIMATED WATER USE REPORT<br />
TOTAL WATER WITHDRAWN = 1,048 MGD<br />
TOTAL WATER USED = 1,022 MGD<br />
The total water withdrawn 1 in the District in<br />
<strong>2011</strong> under the authority of District WUPs<br />
was 1,048.3 mgd. After public supply<br />
treatment losses, and imports and exports are<br />
accounted for, the total water used under the<br />
authority of District WUPs was 1,022.0 mgd.<br />
Including 36.7 mgd for domestic self‐supplied<br />
water, total water withdrawn was calculated<br />
to have been 1,085.0 mgd, and total water<br />
used was 1,058.7. At the end of <strong>2011</strong>, the<br />
District had permitted 1,911 mgd on an<br />
annual average basis for use on 7,745 WUPs.<br />
<strong>2011</strong> DATA<br />
The majority of data found in this report was<br />
extracted from the WUP database in the<br />
District <strong>Water</strong> <strong>Management</strong> Information<br />
System (WMIS). A series of SAS programs<br />
created by District staff were used to<br />
recompile the data by permit type, use<br />
category, water source, whether it is metered<br />
use or not, and to analyze and categorize data<br />
on metered WUPs in order to make estimates<br />
for the pumpage on unmetered WUPs.<br />
Of the 7,745 WUPs in active status during<br />
<strong>2011</strong>, only 22% were metered. However,<br />
these 1,689 metered WUPs had 86% of the<br />
total permitted annual average quantity<br />
(1,636 mgd) permitted to them (Table 7).<br />
Only 14% of the total annual average<br />
quantities permitted in <strong>2011</strong> were to<br />
unmetered WUPs (274.7 mgd).<br />
Table 8 identifies metered versus estimated<br />
water use quantities by county and category<br />
of use in the District. Including domestic self<br />
supply, of the 1,058.8 mgd used in <strong>2011</strong>,<br />
883.6 mgd (83%) were metered (domestic<br />
self supply is not metered). Excluding<br />
domestic self supply, over 86% of the 1,022.0<br />
mgd of water used under the authority of<br />
WUPs were metered.<br />
1To help avoid confusion for the reader about<br />
quantities quoted in this section, the terms “use” (used<br />
as a noun rather than an adjective) and “used” to<br />
indicate how much went to the end use, and<br />
“withdrawn” or “pumpage” to indicate removals from<br />
the resource, and “permitted” to indicate potential use,<br />
will be in italics.<br />
Table 9 is a summary of the totals for water<br />
used and water withdrawn in the District in<br />
<strong>2011</strong>. The water use category having the<br />
highest quantity withdrawn was public<br />
supply for 519.6 mgd, and Hillsborough<br />
County had the highest public supply<br />
pumpage (190.0 mgd). Public supply is also<br />
the water use category with the highest use<br />
(497.1 mgd), and Hillsborough County had<br />
the highest public supply water use. (136.4<br />
mgd). The second highest quantity of water<br />
withdrawn (and used) was for agriculture for<br />
390.4 mgd, Most of the agricultural water<br />
withdrawn and used took place in Polk County<br />
(80.3 mgd).<br />
Tables 10, 11, and 12 are newly added to the<br />
EWU reports so that a quick comparison of<br />
used quantities to permitted quantities can be<br />
made. Domestic self‐supply is not included.<br />
Table 10 shows that overall, 55% (1,048.3<br />
mgd) of the 1,911.0 mgd quantities permitted<br />
were used. The 45% difference between<br />
these two totals is because the District<br />
permits quantities for the intended activities<br />
of the permittee during the entire term of the<br />
permit. WUP terms range from 6 years to 20<br />
years, and unless the permittee is at<br />
maximum build‐out, the permitted quantity<br />
includes future water needs. Tables 11 and<br />
12 do the same type of comparison for<br />
metered (Table 11) and estimated (Table 12)<br />
quantities.<br />
Figure 14 provides a visual comparison of<br />
quantities permitted and quantities used by<br />
county. The cause of the difference between<br />
the amount of water withdrawn in a county<br />
with the water used in a county is the<br />
counties’ public supply use. Public supply<br />
water incurs losses during treatment to make<br />
it potable, and during transfer from county to<br />
county in regional water supply distributions.<br />
The pie charts show that although 25% of the<br />
water withdrawn in the District was in<br />
Hillsborough County, only 20% of the water<br />
used in the District was in Hillsborough<br />
County. <strong>Water</strong> use in Polk and Manatee<br />
counties stayed at the same percentage as<br />
water withdrawn. DeSoto County’s use<br />
decreased from 10% of the total quantity<br />
<strong>Southwest</strong> <strong>Florida</strong> <strong>Water</strong> <strong>Management</strong> District Page | 49
<strong>2011</strong> ESTIMATED WATER USE REPORT<br />
withdrawn to 7% of the total quantity used.<br />
Pinellas County’s used 9% of the total District<br />
use even though only 2% of the water pumped<br />
in the District was in Pinellas County.<br />
Figure 15 illustrates the amount of<br />
groundwater versus surface water withdrawn<br />
in each county. In <strong>2011</strong>, the most<br />
groundwater was withdrawn in Polk County<br />
(193.1 mgd), and the most surface water was<br />
withdrawn in Hillsborough County (131.9<br />
mgd). Appendix B, Table B‐1 has the numbers<br />
for the data presented in this graph.<br />
Figure 16 shows that overall, water pumpage<br />
was generally inverse to the amount of rainfall.<br />
This is to be expected because the two highest<br />
water uses, public supply and agriculture, are<br />
affected by rainfall because they include<br />
irrigation use. Recreation/aesthetic pumpage<br />
for irrigation use also depends upon rainfall.<br />
Import/Exports A total of 292.3 mgd were<br />
imported by District utilities from other<br />
utilities in the District (1.6 mgd was imported<br />
from South <strong>Florida</strong> <strong>Water</strong> <strong>Management</strong><br />
District (SFWMD)). A total of 291.2 mgd were<br />
exported by District utilities to other District<br />
utilities, and 2.7 mgd were exported to<br />
SFWMD utilities. See Table A‐3, Appendix A.<br />
DeSoto County exports water to Charlotte and<br />
Sarasota counties from the Peace River‐<br />
Manasota Regional <strong>Water</strong> Supply Authority’s<br />
WUP on the Peace River. Pasco County is a<br />
water exporter via Tampa Bay <strong>Water</strong>, and this<br />
is shown as a 1% decrease from quantities<br />
withdrawn to quantities used.<br />
Historically, Pinellas County had to import<br />
most of its public supply water. Fresh water is<br />
not plentiful in Pinellas County due to it being<br />
bordered on three sides by seawater. There<br />
are upcoming changes to this practice as more<br />
utilities leave the regional water supply<br />
system. Many utilities in Pinellas County are<br />
drilling brackish groundwater wells locally<br />
and building reverse osmosis (RO) water<br />
treatment plants. Using funding available<br />
under the District’s Cooperative Funding<br />
Initiative, the City of Oldsmar just completed<br />
an RO water treatment plant that began<br />
producing 1.5 mgd of potable water from 2<br />
mgd of brackish groundwater in October 2012.<br />
The Cities of Clearwater and Tarpon Springs<br />
are doing likewise under Cooperative Funding<br />
Agreements. Polk County is considering the<br />
creation of a regional water supply system<br />
between themselves and 17 municipalities in<br />
Polk County, each of which currently has their<br />
own public supply WUP.<br />
SUMMARY<br />
In <strong>2011</strong>, 1,911.0 mgd was permitted under<br />
active permits. Of this quantity, approximately<br />
55% (1,048.3 mgd) was withdrawn from the<br />
resource. Of the total quantity withdrawn,<br />
97% (1,022.0 mgd) was used. The remaining<br />
3% was lost during treatment to make water<br />
potable for public supply, during transporting<br />
the water long distances through pipelines as<br />
public supply utilities imported and exported<br />
to each other and to exports to utilities outside<br />
of the District. Including domestic self‐supply,<br />
the total water withdrawn was 1,085.0 mgd,<br />
and the total water used in the District was<br />
1,058.7 mgd.<br />
Public supply was the use category with the<br />
highest pumpage (519.6 mgd) with agriculture<br />
being second (390.4 mgd). With respect to the<br />
amount of water used, public supply was also<br />
the highest use category (497.1 mgd) with<br />
agricultural use again being second (390.4<br />
mgd). <strong>Water</strong> users in Polk County pumped the<br />
most water (203.2 mgd) to support its diverse<br />
agricultural operations (80.3 mgd), industries<br />
(29.7 mgd), population (66.2 mgd), and<br />
mining/dewatering operations (12.1 mgd).<br />
Most of the water withdrawals/uses remained<br />
at about the same level as the 2010<br />
withdrawals/uses, with the exception of<br />
agriculture. <strong>Water</strong> withdrawals for agriculture<br />
decreased by 77 mgd from 2010 to <strong>2011</strong> in<br />
part due to a wetter planting time for<br />
strawberries, to a much milder winter, and to<br />
the loss or abandonment of viable groves due<br />
to the HLB greening virus.<br />
Tables A‐1, A‐2 and A‐3 in Appendix A reflect<br />
the complicated nature of public supply water<br />
use and water withdrawal transactions within<br />
the District. <strong>Water</strong> can be withdrawn and<br />
stored either in an aquifer or reservoir rather<br />
<strong>Southwest</strong> <strong>Florida</strong> <strong>Water</strong> <strong>Management</strong> District Page | 50
<strong>2011</strong> ESTIMATED WATER USE REPORT<br />
than being transported for use, as was done at<br />
the Peace River‐Manasota Regional <strong>Water</strong><br />
Supply Authority and at Manatee County<br />
Public Works. The Peace River Manasota<br />
Regional <strong>Water</strong> Supply Authority does not<br />
have its own service area, because it only<br />
exports water to other utilities that do have<br />
service areas. Tampa Bay <strong>Water</strong> (TBW) has a<br />
service area but also has many wellfields in<br />
Hillsborough and Pasco counties delivering<br />
water to a central location from which the<br />
water is parceled out to customers in multiple<br />
service areas in multiple counties besides to<br />
their own. Tampa Bay <strong>Water</strong> also has other<br />
public supply WUPs that deliver water to their<br />
own service area in addition to supplying<br />
other utilities’ service areas as the need arises.<br />
It is very difficult to portray these regional<br />
water supply systems in the conventional way<br />
of withdrawals minus treatment losses going<br />
to a set service area to generate a per capita<br />
water use rate for that service area.<br />
Appendix D gives the last 10 years history of<br />
the larger WUPs (those permitted for<br />
1,000,000 gpd or more on an annual average<br />
basis) for each use category. Some of the use<br />
categories have large numbers of WUPs while<br />
some, like recreation/aesthetic, have few<br />
WUPs in the “big” WUP category.<br />
Appendix E gives the uniform per capita rate<br />
per the <strong>Florida</strong> Department of Environmental<br />
Protection. This rate allows comparison of<br />
water use efficiency among the five water<br />
management districts.<br />
Appendix F gives details on the methodology<br />
used to make the EWU reports and the<br />
improvements to the quality of the data used.<br />
This EWU report has refined data because<br />
“withdrawal points” that do not withdraw<br />
water from the resource were eliminated from<br />
consideration prior to running the SAS<br />
programs. Also, water use codes that are<br />
merely for categorization of water after it is<br />
withdrawn and have nothing to do with water<br />
use were eliminated prior to running the SAS<br />
programs. This resulted in fewer assumptions<br />
having to be made on each WUP as well as less<br />
scaling of permitted quantities per withdrawal<br />
point to match the permit total quantity. The<br />
data was also heavily quality controlled and<br />
checked to remove as many data point errors<br />
as possible, again before the data was put into<br />
the SAS programs. Finally, the SAS programs<br />
were improved and expanded to provide more<br />
compilations with which to check for the<br />
reasonableness of the results.<br />
<strong>Southwest</strong> <strong>Florida</strong> <strong>Water</strong> <strong>Management</strong> District Page | 51
<strong>2011</strong> ESTIMATED WATER USE REPORT<br />
Table 7a. Summary of 10 Years Metered <strong>Water</strong> <strong>Use</strong> Data in the <strong>Water</strong> <strong>Management</strong> Information<br />
System, 2002 <strong>2011</strong><br />
Pumpage from Metered Withdrawal Points, 2002 to <strong>2011</strong>, mgd/year<br />
<strong>Use</strong> type Year 2002 2003 2004 2005 2006 2007 2008 2009 2010 <strong>2011</strong><br />
Agricultural 273 227 246 199 298 273 240 291 304 272<br />
Industrial/Commercial 69 64 55 51 61 57 57 57 50 52<br />
Mining/Dewatering 47 58 64 46 37 45 37 31 24 21<br />
Public Supply 497 481 513 562 522 472 492 522 441 494<br />
Recreational/Aesthetic 32 28 33 28 37 33 30 33 48 50<br />
District Total 918 859 912 886 955 880 857 934 867 889<br />
Number of Metered <strong>Water</strong> <strong>Use</strong> Permits, 2002 to <strong>2011</strong> 1<br />
<strong>Use</strong> type Year 2002 2003 2004 2005 2006 2007 2008 2009 2010 <strong>2011</strong><br />
Agricultural 1,186 1,422 1,427 1,285 1,257 1,243 1,240 1,244 1,180 1,182<br />
Industrial/Commercial 89 107 104 84 79 80 83 83 77 80<br />
Mining/Dewatering 33 47 52 30 30 32 29 26 19 17<br />
Public Supply 268 128 277 246 237 239 264 228 220 205<br />
Recreational/Aesthetic 287 365 340 249 239 235 217 217 305 299<br />
District Total 1,863 2,069 2,200 1,894 1,842 1,829 1,833 1,798 1,801 1,783<br />
Table 7b. Comparison of Annual Average Permitted Quantities, Metered and Unmetered WUPs,<br />
<strong>2011</strong><br />
<strong>Use</strong> Type<br />
Annual Average Quantities Permitted to Metered and NonMetered WUPs in <strong>2011</strong><br />
Total<br />
Quantities<br />
Permitted<br />
Total<br />
Number<br />
of WUPs 1<br />
Total Quantities<br />
Permitted to<br />
Metered WUPs<br />
Total<br />
Number of<br />
Metered<br />
WUPs<br />
(mgd) (mgd) (mgd)<br />
Total Quantities<br />
Permitted to Total Number<br />
Non‐Metered of Non‐Metered<br />
WUPs<br />
WUPs<br />
Agricultural 760 6,109 542 1,182 218 4,927<br />
Industrial/Commercial 160 299 148 80 12 219<br />
Mining/Dewatering 98 98 92 17 6 81<br />
Public Supply 772 496 761 205 11 291<br />
Recreational/Aesthetic 122 1,020 94 299 27 721<br />
District Total 1,911 8,022 2 1,636 1,783 3 275 6,239 4<br />
Data Source: District <strong>Water</strong> <strong>Use</strong> Permit Database, Calendar Year <strong>2011</strong><br />
1 The number of permits in this table reflects duplicate counts for permits that have more than one use.<br />
2 There are 7,745 active water use permits in <strong>2011</strong>. The additional "277 permits" are actually multiple uses on<br />
some of the 7,745 permits.<br />
3 There are 1,689 active water use permits that have a metering condition in <strong>2011</strong>. The additional "94 permits"<br />
are actually multiple uses on the 1,689 permits.<br />
4 There are 6,056 active water use permits that do not have a metering condition. The additional 183 permits<br />
are a reflection of WUPs having multiple uses.<br />
<strong>Southwest</strong> <strong>Florida</strong> <strong>Water</strong> <strong>Management</strong> District Page | 52
<strong>2011</strong> ESTIMATED WATER USE REPORT<br />
Table 8. Total Metered and <strong>Estimated</strong> <strong>Water</strong> <strong>Use</strong> (mgd) by Predominant <strong>Use</strong> Category and County,<br />
<strong>2011</strong><br />
County<br />
*Charlotte<br />
Citrus<br />
DeSoto<br />
Hardee<br />
Hernando<br />
*Highlands<br />
Hillsborough<br />
*Lake<br />
*Levy<br />
Manatee<br />
*Marion<br />
Pasco<br />
Pinellas<br />
*Polk<br />
Sarasota<br />
Sumter<br />
District<br />
Via<br />
Meter or<br />
Estimate Agriculture<br />
Industrial/<br />
Commercial<br />
Mining/<br />
Dewatering<br />
Public<br />
Supply<br />
<strong>Use</strong><br />
Domestic<br />
Self<br />
Supply<br />
Recreation/<br />
Aesthetic<br />
Total <strong>Water</strong><br />
<strong>Use</strong>d<br />
Estimate 0.559 0.027 0.005 0.025 0.172 0.744 1.532<br />
Meter 10.411 0.000 0.021 15.038 0.985 26.455<br />
Estimate 1.431 0.017 0.006 0.458 3.790 0.336 6.038<br />
Meter 0.000 3.347 0.000 14.679 4.918 22.944<br />
Estimate 6.368 0.224 0.000 0.011 1.966 0.241 8.810<br />
Meter 61.134 0.377 0.000 0.822 0.115 62.448<br />
Estimate 14.607 0.046 0.000 0.121 0.480 0.123 15.377<br />
Meter 23.285 1.595 0.333 1.092 0.178 26.483<br />
Estimate 1.747 0.018 0.000 0.209 2.913 0.601 5.488<br />
Meter 0.031 2.590 4.637 20.570 4.462 32.290<br />
Estimate 9.521 0.034 0.000 0.168 1.198 0.385 11.306<br />
Meter 31.045 0.005 0.000 7.198 2.045 40.123<br />
Estimate 19.562 0.293 0.003 1.209 2.375 1.755 25.179<br />
Meter 30.975 9.238 0.869 131.620 6.895 183.175<br />
Estimate 0.782 0.000 0.000 0.000 0.075 0.000 0.857<br />
Meter 0.394 0.000 0.000 0.000 0.000 0.394<br />
Estimate 4.850 0.004 0.000 0.030 1.208 0.247 6.339<br />
Meter 1.682 0.000 0.000 0.684 0.000 2.366<br />
Estimate 6.516 0.107 0.009 0.005 0.000 1.673 8.310<br />
Meter 59.092 4.801 3.539 37.499 8.728 113.659<br />
Estimate 3.396 0.018 0.000 0.310 4.888 0.335 8.947<br />
Meter 0.580 0.046 0.000 10.645 3.489 14.760<br />
Estimate 6.475 0.057 0.003 0.862 7.576 1.203 16.176<br />
Meter 3.229 1.192 0.008 42.678 3.032 50.139<br />
Estimate 0.103 0.016 0.000 0.083 0.000 0.903 1.105<br />
Meter 0.000 0.021 0.000 88.768 1.086 89.875<br />
Estimate 36.665 0.675 0.101 1.584 6.517 2.405 47.947<br />
Meter 43.681 28.977 12.048 65.213 5.932 156.091<br />
Estimate 1.071 0.059 0.000 0.038 1.942 1.469 4.579<br />
Meter 3.501 0.000 0.000 30.620 5.371 39.492<br />
Estimate 5.199 0.080 0.023 0.082 1.583 0.165 7.087<br />
Meter 2.556 0.483 0.008 21.006 2.491 26.554<br />
Estimate 118.852 1.675 0.150 5.195 36.664 12.585 175.712<br />
Meter 271.596 52.672 21.463 488.133 0.000 49.727 883.591<br />
Total Both 390.448 54.347 21.611 493.327 36.664 63.312 1,058.712<br />
Percent <strong>Estimated</strong> 30% 3% 1% 1% 100% 20% 17%<br />
Percent Metered 70% 97% 99% 99% 0% 80% 83%<br />
This table is water use and not water withdrawal quantities. They are different due to public supply<br />
treatment and transportation losses.<br />
* Data is only for the portion of the county within the District.<br />
Data Sources: Data source: <strong>Estimated</strong> <strong>Water</strong> <strong>Use</strong> Tables derived from the WMIS WUP database, <strong>2011</strong> and the<br />
Public Supply Annual Reports, <strong>2011</strong>.<br />
<strong>Southwest</strong> <strong>Florida</strong> <strong>Water</strong> <strong>Management</strong> District Page | 53
<strong>2011</strong> ESTIMATED WATER USE REPORT<br />
Table 9. Summary of Total Reported + <strong>Estimated</strong> <strong>Water</strong> Withdrawal and <strong>Use</strong> (mgd) Quantities by Predominant <strong>Use</strong> Category and County,<br />
<strong>2011</strong><br />
County<br />
Agriculture Industrial/ Mining/ Public Domestic Self Recreation/<br />
Total Public<br />
Withdrawal Commercial Dewatering Supply Supply<br />
Aesthetic<br />
Total <strong>Use</strong><br />
Withdrawal Supply <strong>Use</strong><br />
& <strong>Use</strong> Withdrawal & Withdrawal & Withdrawal Withdrawal & Withdrawal &<br />
Quantity<br />
Quantity<br />
Quantity <strong>Use</strong> Quantity <strong>Use</strong> Quantity Quantity <strong>Use</strong> Quantity <strong>Use</strong> Quantity<br />
Quantity 2<br />
*Charlotte 10.970 0.027 0.026 7.074 0.172 1.729 19.998 15.063 27.987<br />
Citrus 1.431 3.364 0.006 15.310 3.790 5.254 29.155 15.137 28.983<br />
DeSoto 67.502 0.601 0.000 31.735 1.966 0.356 102.160 0.833 71.258<br />
Hardee 37.892 1.641 0.333 1.217 0.480 0.301 41.864 1.213 41.860<br />
Hernando 1.778 2.608 4.637 20.779 2.913 5.063 37.778 20.779 37.778<br />
Highlands 40.566 0.039 0.000 7.478 1.198 2.430 51.711 7.366 51.599<br />
Hillsborough 50.537 9.531 0.872 189.983 2.357 8.650 261.930 132.829 204.776<br />
*Lake 1.176 0.000 0.000 0.000 0.075 0.000 1.251 0.000 1.251<br />
*Levy 6.532 0.004 0.000 0.721 1.208 0.247 8.712 0.714 8.705<br />
Manatee 65.608 4.908 3.548 44.621 0.000 10.401 129.086 37.504 121.969<br />
*Marion 3.976 0.064 0.000 11.412 4.888 3.824 24.164 10.955 23.707<br />
Pasco 9.704 1.249 0.011 58.654 7.576 4.235 81.429 43.540 66.315<br />
Pinellas 0.103 0.037 0.000 22.340 0.000 1.989 24.469 88.851 90.980<br />
*Polk 80.346 29.652 12.149 66.211 6.517 8.337 203.211 66.797 203.798<br />
Sarasota 4.572 0.059 0.000 20.783 1.942 6.840 34.195 30.658 44.071<br />
Sumter 7.755 0.563 0.029 21.275 1.583 2.656 33.861 21.088 33.674<br />
Totals 390.448 54.347 21.611 519.593 36.664 62.312 1084.975 493.328 1058.710<br />
% of Withdrawal<br />
Total<br />
37% 5% 2% 48% 4% 6% 100% NA 98%<br />
% of <strong>Use</strong> Total 37% 5% 2% 49% 4% 6% NA 47% 100%<br />
Data collection is based on calendar year <strong>2011</strong><br />
* Data is for only the portion of the county located within the District boundaries.<br />
1 Total (Withdrawal) ‐ Represents the sum of the preceding six columns and represents total water withdrawal by county for all categories.<br />
2 Public Supply (<strong>Use</strong>) ‐ Represents total consumptive use of public supply water within a county. When compared to Public Supply (Withdrawal) column, the difference represents<br />
treatment losses, imports or exports of publicly supplied water from one county to another, and aquifer storage and recovery losses.<br />
3 Total (<strong>Use</strong>) = The sum of "Total (Withdrawal)" minus "Public Supply (Withdrawal)" plus "Public Supply (<strong>Use</strong>)."<br />
4 Tampa Bay <strong>Water</strong> Consolidated Permit withdrawals are shown in the county in which they occurred (Hillsborough, Pasco, and Pinellas Counties).<br />
<strong>Southwest</strong> <strong>Florida</strong> <strong>Water</strong> <strong>Management</strong> District Page | 54
<strong>2011</strong> ESTIMATED WATER USE REPORT<br />
Table 10. <strong>2011</strong> Total Permitted and Pumped (mgd) Annual Average Quantities (mgd)<br />
County/<strong>Use</strong><br />
Agriculture<br />
Industrial/<br />
Commercial<br />
Mining/<br />
Dewatering<br />
Public<br />
Supply<br />
Recreation/<br />
Aesthetic<br />
County<br />
Total<br />
Permitted Quantities<br />
*Charlotte 26.593 0.069 1.381 13.722 5.016 46.780<br />
Citrus 2.964 5.775 0.167 19.924 5.706 34.536<br />
Desoto 106.458 1.600 0.501 34.145 1.396 144.099<br />
Hardee 78.156 4.662 6.390 3.171 0.702 93.082<br />
Hernando 3.766 20.298 6.902 29.812 7.921 68.699<br />
*Highlands 59.727 0.650 0.047 12.598 2.941 75.962<br />
Hillsborough 105.733 23.273 1.039 254.471 20.601 405.118<br />
*Lake 1.900 0.000 0.000 0.000 0.000 1.900<br />
*Levy 18.353 1.628 0.123 1.221 0.362 21.686<br />
Manatee 161.035 9.438 6.851 59.876 23.512 260.712<br />
*Marion 11.214 0.266 0.000 15.350 5.322 32.153<br />
Pasco 26.903 6.341 0.425 113.908 9.335 156.913<br />
Pinellas 0.404 0.451 0.000 20.246 7.167 28.269<br />
*Polk 117.504 83.39 72.912 117.926 13.165 404.896<br />
Sarasota 23.416 0.138 0.402 45.606 14.526 84.087<br />
Sumter 15.787 1.870 0.928 29.688 3.832 52.106<br />
District 759.913 159.849 98.068 771.664 121.504 1910.998<br />
Pumped Quantities<br />
*Charlotte 10.970 0.027 0.026 7.074 1.729 19.826<br />
Citrus 1.431 3.364 0.006 15.310 5.254 25.365<br />
Desoto 67.502 0.601 0.000 31.735 0.356 100.194<br />
Hardee 37.892 1.641 0.333 1.217 0.301 41.384<br />
Hernando 1.778 2.608 4.637 20.779 5.063 34.865<br />
*Highlands 40.566 0.039 0.000 7.478 2.430 50.513<br />
Hillsborough 50.537 9.531 0.872 189.983 8.650 259.573<br />
*Lake 1.176 0.000 0.000 0.000 0.000 1.176<br />
*Levy 6.532 0.004 0.000 0.721 0.247 7.504<br />
Manatee 65.608 4.908 3.548 44.621 10.401 129.086<br />
*Marion 3.976 0.064 0.000 11.412 3.824 19.276<br />
Pasco 9.704 1.249 0.011 58.654 4.235 73.853<br />
Pinellas 0.103 0.037 0.000 22.340 1.989 24.469<br />
*Polk 80.346 29.652 12.149 66.211 8.337 196.695<br />
Sarasota 4.572 0.059 0.000 20.783 6.840 32.254<br />
Sumter 7.755 0.563 0.029 21.275 2.656 32.278<br />
District 390.448 54.347 21.611 519.593 62.312 1048.311<br />
* Data is for only the portion of the county located within the District boundaries.<br />
Data source: <strong>Estimated</strong> <strong>Water</strong> <strong>Use</strong> Tables derived from the WMIS WUP database, <strong>2011</strong>.<br />
<strong>Southwest</strong> <strong>Florida</strong> <strong>Water</strong> <strong>Management</strong> District Page | 55
<strong>2011</strong> ESTIMATED WATER USE REPORT<br />
Table 11. <strong>2011</strong> Permitted and Pumped Annual Average Quantities (mgd), Metered WUPs<br />
County/<strong>Use</strong><br />
Agriculture<br />
Industrial/<br />
Commercial<br />
Mining/<br />
Dewatering<br />
Public<br />
Supply<br />
Recreation/<br />
Aesthetic<br />
County<br />
Total<br />
Permitted Quantities<br />
*Charlotte 25.288 0.000 0.032 13.653 3.286 42.259<br />
Citrus 0.497 5.509 0.000 19.256 5.056 30.318<br />
Desoto 94.764 0.822 0.000 33.975 0.372 129.933<br />
Hardee 52.622 4.547 6.390 2.945 0.488 66.992<br />
Hernando 0.148 20.251 6.785 29.440 6.055 62.679<br />
*Highlands 43.361 0.388 0.000 12.273 2.252 58.274<br />
Hillsborough 68.460 17.565 0.189 252.498 15.779 354.492<br />
*Lake 0.565 0.000 0.000 0.000 0.000 0.565<br />
*Levy 8.808 0.000 0.000 1.179 0.000 9.987<br />
Manatee 145.121 8.701 6.410 59.866 19.675 239.773<br />
*Marion 5.166 0.105 0.000 14.259 4.756 24.286<br />
Pasco 15.877 6.195 0.254 112.058 7.359 141.743<br />
Pinellas 0.199 0.377 0.000 20.127 5.381 26.084<br />
*Polk 56.359 81.532 71.469 114.219 9.060 332.639<br />
Sarasota 20.127 0.000 0.000 45.514 11.699 77.339<br />
Sumter 4.272 1.585 0.099 29.435 3.521 38.912<br />
District 541.634 147.576 91.627 760.696 94.741 1,636.276<br />
Pumped Quantities<br />
*Charlotte 10.411 0.000 0.021 7.049 0.985 18.466<br />
Citrus 0.000 3.347 0.000 14.852 4.918 23.117<br />
Desoto 61.134 0.377 0.000 31.724 0.115 93.350<br />
Hardee 23.285 1.595 0.333 1.096 0.178 26.487<br />
Hernando 0.031 2.590 4.637 20.570 4.462 32.290<br />
*Highlands 31.045 0.005 0.000 7.310 2.045 40.405<br />
Hillsborough 30.975 9.051 0.064 188.774 6.895 235.759<br />
*Lake 0.394 0.000 0.000 0.000 0.000 0.394<br />
*Levy 1.682 0.000 0.000 0.691 0.000 2.373<br />
Manatee 59.092 4.801 3.539 44.616 8.728 120.776<br />
*Marion 0.580 0.046 0.000 11.102 3.489 15.217<br />
Pasco 3.229 1.192 0.008 57.792 3.032 65.253<br />
Pinellas 0.000 0.021 0.000 22.257 1.086 23.364<br />
*Polk 43.681 28.977 12.048 64.627 5.932 155.265<br />
Sarasota 3.501 0.000 0.000 20.745 5.371 29.617<br />
Sumter 2.556 0.483 0.008 21.193 2.491 26.731<br />
District 271.596 52.485 20.658 514.398 49.727 908.864<br />
* Data is for only the portion of the county located within the District boundaries.<br />
Data source: <strong>Estimated</strong> <strong>Water</strong> <strong>Use</strong> Tables derived from the WMIS WUP database, <strong>2011</strong>.<br />
Note: The pumpage in Pasco and Pinellas counties includes quantities supplied via the TBW regional supply<br />
system.<br />
<strong>Southwest</strong> <strong>Florida</strong> <strong>Water</strong> <strong>Management</strong> District Page | 56
<strong>2011</strong> ESTIMATED WATER USE REPORT<br />
Table 12. <strong>2011</strong> Permitted and <strong>Estimated</strong> Pumped Annual Average Quantities (mgd) via Non<br />
Metered WUPs<br />
County/<strong>Use</strong><br />
Agriculture<br />
Industrial/<br />
Commercial<br />
Mining/<br />
Dewatering<br />
Public<br />
Supply<br />
Recreation/<br />
Aesthetic<br />
County<br />
Total<br />
Permitted Quantities<br />
*Charlotte 1.305 0.069 1.349 0.069 1.730 4.521<br />
Citrus 2.467 0.266 0.167 0.668 0.650 4.218<br />
Desoto 11.694 0.778 0.501 0.170 1.024 14.166<br />
Hardee 25.534 0.115 0.000 0.226 0.214 26.090<br />
Hernando 3.618 0.047 0.117 0.372 1.866 6.020<br />
*Highlands 16.366 0.262 0.047 0.325 0.689 17.688<br />
Hillsborough 37.273 5.708 0.850 1.973 4.822 50.626<br />
*Lake 1.335 0.000 0.000 0.000 0.000 1.335<br />
*Levy 9.545 1.628 0.123 0.042 0.362 11.699<br />
Manatee 15.914 0.737 0.441 0.010 3.837 20.939<br />
*Marion 6.048 0.161 0.000 1.091 0.566 7.867<br />
Pasco 11.026 0.146 0.171 1.850 1.976 15.170<br />
Pinellas 0.205 0.074 0.000 0.119 1.786 2.185<br />
*Polk 61.145 1.858 1.443 3.707 4.105 72.257<br />
Sarasota 3.289 0.138 0.402 0.092 2.827 6.748<br />
Sumter 11.515 0.285 0.829 0.253 0.311 13.194<br />
District 218.279 12.272 6.440 10.967 26.765 274.723<br />
Pumped Quantities<br />
*Charlotte 0.559 0.027 0.005 0.025 0.744 1.358<br />
Citrus 1.431 0.017 0.006 0.458 0.336 2.275<br />
Desoto 6.368 0.224 0.000 0.011 0.241 6.956<br />
Hardee 14.607 0.046 0.000 0.121 0.123 14.898<br />
Hernando 1.747 0.018 0.000 0.209 0.601 2.584<br />
*Highlands 9.521 0.034 0.000 0.168 0.385 10.103<br />
Hillsborough 19.562 0.480 0.808 1.209 1.755 31.744<br />
*Lake 0.782 0.000 0.000 0.000 0.000 0.782<br />
*Levy 4.850 0.004 0.000 0.030 0.247 5.131<br />
Manatee 6.516 0.107 0.009 0.005 1.673 13.034<br />
*Marion 3.396 0.018 0.000 0.310 0.335 4.793<br />
Pasco 6.475 0.057 0.003 0.862 1.203 8.918<br />
Pinellas 0.103 0.016 0.000 0.083 0.903 1.105<br />
*Polk 36.665 0.675 0.101 1.584 2.405 42.811<br />
Sarasota 1.071 0.059 0.000 0.038 1.469 3.250<br />
Sumter 5.199 0.080 0.021 0.082 0.165 6.615<br />
District 118.852 1.862 0.953 5.195 12.585 156.357<br />
* Data is for only the portion of the county located within the District boundaries.<br />
Data source: <strong>Estimated</strong> <strong>Water</strong> <strong>Use</strong> Tables derived from the WMIS WUP database, <strong>2011</strong>.<br />
<strong>Southwest</strong> <strong>Florida</strong> <strong>Water</strong> <strong>Management</strong> District Page | 57
<strong>2011</strong> ESTIMATED WATER USE REPORT<br />
Percentage Total <strong>Water</strong> Pumped by County<br />
Other = *Charlotte,<br />
Citrus, *Lake,<br />
*Levy, *Marion,<br />
Pinellas counties<br />
Pinellas<br />
2% Sarasota<br />
3%<br />
*Polk<br />
19%<br />
Sumter<br />
3%<br />
Other<br />
7%<br />
DeSoto<br />
10% Hardee<br />
4%<br />
Hernando<br />
3%<br />
*Highlands<br />
5%<br />
* Data only for the<br />
portion of the<br />
county within the<br />
District.<br />
Pasco<br />
7%<br />
Manatee<br />
12%<br />
Hillsborough<br />
25%<br />
Total Pumpage = 1,048<br />
Percentage Total <strong>Water</strong> <strong>Use</strong>d by County<br />
Other = *Charlotte,<br />
Citrus, *Lake, *Levy,<br />
*Marion counties<br />
Sarasota<br />
4%<br />
Pinellas<br />
9%<br />
Other<br />
11%<br />
DeSoto<br />
7% Hardee<br />
4%<br />
Hernando<br />
3%<br />
*Highlands<br />
5%<br />
*<br />
Data only for the<br />
portion of the<br />
county within the<br />
District.<br />
*Polk<br />
19%<br />
Pasco<br />
6%<br />
Manatee<br />
12%<br />
Hillsborough<br />
20%<br />
Total <strong>Use</strong> = 1,026 mgd<br />
Figure 14. Charts Comparing Distribution of Total Pumpage and Total <strong>Use</strong> by County,<br />
<strong>2011</strong> (Data Source: WMIS WUP database and Public Supply Annual Reports)<br />
<strong>Southwest</strong> <strong>Florida</strong> <strong>Water</strong> <strong>Management</strong> District Page | 58
<strong>2011</strong> ESTIMATED WATER USE REPORT<br />
Total Pumpage of Groundwater and<br />
Surface <strong>Water</strong> by County , <strong>2011</strong><br />
MGD/Year<br />
200.0<br />
180.0<br />
160.0<br />
140.0<br />
120.0<br />
100.0<br />
80.0<br />
60.0<br />
40.0<br />
20.0<br />
0.0<br />
* Data only for the portion of the<br />
county within the District<br />
Groundwater<br />
Surface <strong>Water</strong><br />
Figure 15. Total Groundwater and Surface <strong>Water</strong> Pumpage by County, <strong>2011</strong> (Data Source: WMIS<br />
WUP database)<br />
Total Groundwater and Total Surface <strong>Water</strong><br />
Pumpage by Month<br />
Pumpage (mgd/month)<br />
1200<br />
1000<br />
800<br />
600<br />
400<br />
200<br />
0<br />
Pumpage <br />
Rainfall<br />
Jan Feb Mar Apr May Jun Jul Aug Sep Oct Nov Dec<br />
Groundwater Surface <strong>Water</strong> Total Monthly Rainfall<br />
10.00<br />
9.00<br />
8.00<br />
7.00<br />
6.00<br />
5.00<br />
4.00<br />
3.00<br />
2.00<br />
1.00<br />
0.00<br />
Figure 16. Total Groundwater and Surface <strong>Water</strong> Pumpage by Month and Total Monthly<br />
Rainfall , <strong>2011</strong> (Data Source: WMIS WUP database<br />
<strong>Southwest</strong> <strong>Florida</strong> <strong>Water</strong> <strong>Management</strong> District Page | 59
<strong>2011</strong> ESTIMATED WATER USE REPORT<br />
APPENDIX A<br />
SUMMARIES OF WATER METERED PUMPAGE<br />
PER USE CATEGORY<br />
BY WATER USE PERMIT<br />
<strong>Southwest</strong> <strong>Florida</strong> <strong>Water</strong> <strong>Management</strong> District Page | 60
<strong>2011</strong> ESTIMATED WATER USE REPORT<br />
IMPORTANT INFORMATION REGARDING TABLE A1<br />
Table A‐1 presents a detailed list of the larger public supply WUPs throughout the District. The intent is to portray a snapshot of the<br />
water uses and per capita rates for these permits. A permittee having a public supply water use permit (WUP) issued for 100,000 gpd or<br />
greater is required under the <strong>Florida</strong> Administrative Code, Chapter 40D‐2, to submit a completed Public Supply Annual Report (PSAR ) by<br />
April 1 of each year. The PSAR forms are mailed to these permittees in November or early December each year. The water use<br />
information required on the form that is used for Table A‐1 follows:<br />
Pumpage,<br />
Imports from any source,<br />
Exports to any receiver,<br />
Imports from and exports to other public supply permittees<br />
Treatment plant losses,<br />
Significant use,<br />
Environmental mitigation,<br />
Golf course irrigation use,<br />
Service population estimates (both permanent and seasonal),<br />
Alternative <strong>Water</strong> Supply (AWS) supplied to customers,<br />
Desalination information, if any,<br />
Quantifiable water losses such as those for fire suppression,<br />
An estimate of the non‐quantifiable losses that may have occurred in distributing the water to customers, and<br />
Percentage breakout of water supplied by customer‐type.<br />
If a PSAR was not received, District staff estimates the requested data using the District database (WMIS) for pumpage and the Bureau of<br />
Economic and Business Research (BEBR) population estimates.<br />
This year, both the pumpage information submitted to the District on the PSAR forms and the pumpage on record in the WMIS are shown.<br />
The pumpage on record in the WMIS was used to calculate the gross water use and per capita rates in most cases. This is indicated by the<br />
WMIS pumpage being bolded in the table. Where a significant discrepancy existed, the file of record was extensively reviewed to support<br />
the pumpage quantity used in the table.<br />
It is important to note that compliance checks of the information submitted to the District are independent of this report. Also, if the<br />
pumpage submitted on the PSAR form is different from that contained in the WMIS database, the files were reviewed and the best data is<br />
offered in this report. All quantities given are in million gallons per day (mgd) to the nearest thousand gallons.<br />
<strong>Southwest</strong> <strong>Florida</strong> <strong>Water</strong> <strong>Management</strong> District Page | 61
Per Capita:<br />
<strong>2011</strong> ESTIMATED WATER USE REPORT<br />
The “Unadjusted Gross Per Capita” (UGPC) rate is the result of dividing the permittee’s gross use by the population and<br />
gives the first portrayal on water use per person.<br />
The District adopted rules that allow a better comparison of water use per person between other public supply permittees<br />
by allowing them to subtract quantities supplied for non‐residential uses, such as commercial industries, and large health<br />
care or educational facilities, in the service area before calculating a per capita rate. Documentation is required to claim<br />
these deductions, and once they are made, the per capita rate is called the “Adjusted Gross Per Capita” (AGPC). If there are<br />
no allowable non‐residential uses in the service area, the UGPC and the AGPC are the same.<br />
If the public supply permittee contributes to the lessening of water demand from the natural resources by providing AWS<br />
supplies to customers outside of their service area, they are allowed to make deductions for those resource savings. This is<br />
the “Compliance Per Capita” (CPC) rate. If the permittee does not supply AWS to customers outside of their service area,<br />
the CPC rate is the same as the AGPC.<br />
The reason there are three methods of calculating per capita rates is because the District adopted a rule that all public supply permittees<br />
must attain a per capita rate of no more than 150 gpd by December 31, 2019. Further, any permittee having a per capita rate calculated as<br />
the average of the lowest rate per year for the years 2005 through 2009 that was above 150 gpd/person has to be halfway to the 2019<br />
goal of 150 gpd/person by December 31, 2014.<br />
As mentioned above, the <strong>Estimated</strong> <strong>Water</strong> <strong>Use</strong> Report for any year does not result in compliance or enforcement activity from the<br />
Regulation Division. Such activity is conducted separately<br />
<strong>Southwest</strong> <strong>Florida</strong> <strong>Water</strong> <strong>Management</strong> District Page | 62
<strong>2011</strong> ESTIMATED WATER USE REPORT<br />
TABLE A1, PART 1. <strong>2011</strong> PUBLIC SUPPLY ANNUAL REPORT (PSAR )WATER USE DATA<br />
PSAR Gross Gross Significant Golf Environ.<br />
Adjusted<br />
Gross Storm Reclaimed Compliance<br />
<strong>Water</strong> Pumpage Pumpage Rec. <strong>Water</strong> Treatment <strong>Water</strong> Population Per <strong>Use</strong> Course Mitigation Per <strong>Water</strong> <strong>Water</strong> Per<br />
<strong>Use</strong><br />
PSAR WMIS Y/N Source Imports Exports Loss <strong>Use</strong> Served Capita Deduct. Deduct. Deduct. Capita Deduct. Deduct. Capita<br />
Permit PERMITTEE<br />
(1) (2) (3) (4) (5) (6) (7) (8) (9) (10) (11) (12) (13) (14) (15) (16) (17)<br />
Number NAME(S) mgd mgd mgd mgd mgd mgd (Functional) gpcd mgd mgd mgd gpcd mgd mgd gpcd<br />
CHARLOTTE COUNTY<br />
718<br />
GASPARILLA ISLAND<br />
WATER ASSOC. INC.<br />
1.286 1.286 Y GW/DS 0.034 0.000 0.288 1.032 5,658 182.4 0.000 0.000 0.000 182.4 0.000 0.160 154.118<br />
871 CITY OF PUNTA GORDA 4.700 4.700 Y SW 0.000 0.000 0.536 4.164 36,305 114.7 0.000 0.000 0.000 114.7 0.000 0.000 114.701<br />
CHARLOTTE HARBOR<br />
1512<br />
WATER ASSOC.<br />
0.441 0.441 Y GW/DS 0.000 0.000 0.090 0.351 4,380 80.0 0.000 0.000 0.000 80.0 0.000 0.000 80.026<br />
CHARLOTTE COUNTY<br />
3522<br />
UTILITIES<br />
0.551 0.551 Y GW/DS 0.000 0.000 0.154 0.397 6,153 64.6 0.000 0.000 0.000 64.6 0.000 0.000 64.583<br />
7104 19 CHARLOTTE CO B0CC 0.000 0.000 Y GW/SW 9.470 0.447 0.000 9.022 119,992 75.2 0.000 0.000 0.000 75.2 0.000 0.000 75.192<br />
ISL. HARBOR BCH CLB<br />
LTD & CHAR HARBOR<br />
7768<br />
LAND CO & KNIGHT<br />
0.071 N GW/DS 0.000 0.000 0.000 0.071 460 154.5 0.000 0.000 0.000 154.5 0.000 0.000 154.478<br />
ISL.<br />
CHARLOTTE COUNTY<br />
TOTALS<br />
6.978 7.049 9.504 0.447 1.068 15.038 172,948 86.9 0.000 0.000 0.000 86.9 0.000 0.160 86.0<br />
CITRUS COUNTY<br />
CITY OF CRYSTAL<br />
207<br />
RIVER<br />
0.779 0.779 Y GW 0.000 0.000 0.000 0.779 6,138 126.9 0.000 0.000 0.000 126.9 0.000 0.000 126.9<br />
419 CITY OF INVERNESS 1.132 N GW 0.000 0.000 0.000 1.132 24,309 46.6 0.000 0.000 0.000 46.6 0.000 0.000 46.6<br />
FLORAL CITY WATER<br />
1118<br />
ASSOCIATION INC<br />
0.273 0.273 Y GW 0.000 0.000 0.012 0.261 4,716 55.4 0.000 0.000 0.000 55.4 0.000 0.000 55.4<br />
2842 CITRUS COUNTY WR 2.700 2.700 Y GW 0.000 0.000 0.056 2.644 17,737 149.1 0.000 0.000 0.000 149.1 0.000 0.000 149.1<br />
4153<br />
4406<br />
6691<br />
7121<br />
ROLLING OAKS<br />
UTILITIES INC<br />
HOMOSASSA SPECIAL<br />
WATER DISTRICT<br />
GULF HIGHWAY LAND<br />
CORPORATION<br />
CITRUS COUNTY &<br />
WITHLACOOCHEE<br />
RWSA<br />
1.741 1.741 Y GW 0.000 0.000 0.000 1.741 11,395 152.8 0.000 0.000 0.000 152.8 0.000 0.000 152.8<br />
0.783 0.783 Y GW 0.000 0.000 0.008 0.775 5,329 145.4 0.000 0.000 0.000 145.4 0.000 0.000 145.4<br />
0.097 0.097 Y GW 0.000 0.000 0.000 0.097 524 184.2 0.000 0.000 0.000 184.2 0.000 0.000 184.2<br />
4.552 4.552 Y GW 0.000 0.492 0.032 4.028 25,560 157.6 0.000 0.000 0.000 157.6 0.000 0.015 157.0<br />
7879 CITRUS COUNTY WR 0.038 0.038 Y GW 0.000 0.000 0.000 0.038 446 85.9 0.000 0.000 0.000 85.9 0.000 0.000 85.9<br />
9791 CITRUS COUNTY WR 2.442 2.442 Y GW 0.000 0.000 0.037 2.405 10,877 221.1 0.000 0.000 0.000 221.1 0.000 0.000 221.1<br />
11839<br />
GCP WALDEN WOODS<br />
ONE AND TWO, LLCS<br />
0.158 Y GW 0.000 0.000 0.000 0.158 942 167.7 0.000 0.000 0.000 167.7 0.000 0.000 167.7<br />
<strong>Southwest</strong> <strong>Florida</strong> <strong>Water</strong> <strong>Management</strong> District Page | 63
<strong>2011</strong> ESTIMATED WATER USE REPORT<br />
TABLE A1, PART 1. <strong>2011</strong> PUBLIC SUPPLY ANNUAL REPORT (PSAR )WATER USE DATA<br />
PSAR Gross Gross Significant Golf Environ.<br />
Adjusted<br />
Gross Storm Reclaimed Compliance<br />
<strong>Water</strong> Pumpage Pumpage Rec. <strong>Water</strong> Treatment <strong>Water</strong> Population Per <strong>Use</strong> Course Mitigation Per <strong>Water</strong> <strong>Water</strong> Per<br />
<strong>Use</strong><br />
PSAR WMIS Y/N Source Imports Exports Loss <strong>Use</strong> Served Capita Deduct. Deduct. Deduct. Capita Deduct. Deduct. Capita<br />
Permit PERMITTEE<br />
(1) (2) (3) (4) (5) (6) (7) (8) (9) (10) (11) (12) (13) (14) (15) (16) (17)<br />
Number NAME(S) mgd mgd mgd mgd mgd mgd (Functional) gpcd mgd mgd mgd gpcd mgd mgd gpcd<br />
20230 19 OZELLO WATER ASSOC. 0.000 0.000 Y GW 0.464 0.000 0.000 0.464 3,956 117.3 0.000 0.000 0.000 117.3 0.000 0.000 117.3<br />
CITRUS COUNTY TOTALS 13.404 14.695 0.464 0.492 0.145 14.522 111,929 129.7 0.000 0.000 0.000 129.7 0.000 0.015 129.7<br />
DeSoto County<br />
4725 ARCADIA WTP 0.832 0.830 Y GW 0.000 0.000 0.012 0.820 8,576 95.6 0.000 0.000 0.000 95.6 0.000 0.000 95.6<br />
PEACE RIVER<br />
10420 18<br />
MANASOTA RWSA<br />
30.233 30.892 Y SW/GW 0.013 23.437 0.566 NA* NA NA 0.000 0.000 0.000 NA 0.000 0.000 NA<br />
DESOTO COUNTY TOTALS 31.065 31.722 0.013 23.437 0.578 0.820 8,576 95.6 0.000 0.000 0.000 95.6 0.000 0.000 95.6<br />
* Approximately 6.248 mgd were put into storage.<br />
Hardee County<br />
CITY OF BOWLING<br />
30 GREEN MUNICPLE 0.251 0.251 Y GW 0.000 0.000 0.000 0.251 4,818 52.1 0.000 0.000 0.000 52.1 0.000 0.000 52.1<br />
WATER SYS<br />
4461 CITY OF WAUCHULA 0.730 0.445 Y GW 0.000 0.040 0.000 0.405 6,206 65.2 0.000 0.000 0.000 65.2 0.000 0.000 65.2<br />
TOWN OF ZOLFO<br />
7658<br />
SPRINGS<br />
0.149 0.149 Y GW 0.000 0.000 0.000 0.149 2,530 58.9 0.000 0.000 0.000 58.9 0.000 0.000 58.9<br />
13026 HARDEE COUNTY BOCC 0.025 0.023 Y GW 0.040 0.000 0.004 0.059 796 74.6 0.000 0.000 0.000 74.6 0.000 0.000 74.6<br />
HARDEE COUNTY TOTALS 1.155 0.868 0.040 0.040 0.004 0.864 14,350 60.2 0.000 0.000 0.000 60.2 0.000 0.000 60.2<br />
2179<br />
2983<br />
5789<br />
HERNANDO CO<br />
UTILITIES<br />
HERNANDO CO<br />
UTILITIES<br />
HERNANDO CO<br />
UTILITIES<br />
Hernando County<br />
0.104 0.104 Y GW 0.000 0.000 0.000 0.104 739 140.7 0.000 0.000 0.000 140.7 0.000 0.000 140.7<br />
18.232 18.232 Y GW 0.000 0.000 0.000 18.232 126,040 144.7 0.000 0.000 0.000 144.7 0.000 0.000 144.7<br />
0.990 0.990 Y GW 0.000 0.000 0.000 0.990 7,784 127.2 0.000 0.000 0.000 127.2 0.000 0.000 127.2<br />
7627 CITY OF BROOKSVILLE 1.236 1.236 Y GW 0.000 0.000 0.000 1.236 14,710 84.0 0.000 0.000 0.000 84.0 0.000 0.387 84.0<br />
1<strong>2011</strong><br />
HERNANDO CO<br />
UTILITIES<br />
0.008 0.008 Y GW 0.000 0.000 0.000 0.008 50 160.0 0.000 0.000 0.000 160.0 0.000 0.000 160.0<br />
<strong>Southwest</strong> <strong>Florida</strong> <strong>Water</strong> <strong>Management</strong> District Page | 64
<strong>2011</strong> ESTIMATED WATER USE REPORT<br />
TABLE A1, PART 1. <strong>2011</strong> PUBLIC SUPPLY ANNUAL REPORT (PSAR )WATER USE DATA<br />
PSAR Gross Gross Significant Golf Environ.<br />
Adjusted<br />
Gross Storm Reclaimed Compliance<br />
<strong>Water</strong> Pumpage Pumpage Rec. <strong>Water</strong> Treatment <strong>Water</strong> Population Per <strong>Use</strong> Course Mitigation Per <strong>Water</strong> <strong>Water</strong> Per<br />
<strong>Use</strong><br />
PSAR WMIS Y/N Source Imports Exports Loss <strong>Use</strong> Served Capita Deduct. Deduct. Deduct. Capita Deduct. Deduct. Capita<br />
Permit PERMITTEE<br />
(1) (2) (3) (4) (5) (6) (7) (8) (9) (10) (11) (12) (13) (14) (15) (16) (17)<br />
Number NAME(S) mgd mgd mgd mgd mgd mgd (Functional) gpcd mgd mgd mgd gpcd mgd mgd gpcd<br />
HERNANDO COUNTY<br />
TOTALS<br />
20.571 20.570 0.000 0.000 0.000 20.570 149,323 137.8 0.000 0.000 0.000 137.8 0.000 0.387 135.2<br />
Highlands County<br />
AQUA UTILITIES FL.<br />
4167<br />
INC.<br />
0.170 0.012 Y GW 0.000 0.000 0.046 0.124 1,374 90.2 0.000 0.000 0.000 90.2 0.000 0.000 90.2<br />
4492 CITY OF SEBRING 3.302 3.302 Y GW 0.000 0.000 0.000 3.302 33,229 99.4 0.000 0.000 0.000 99.4 0.000 0.000 99.4<br />
LAKE PLACID HOLDING<br />
4980<br />
CO<br />
0.289 0.289 Y GW 0.000 0.000 0.000 0.289 4,377 66.0 0.000 0.000 0.000 66.0 0.000 0.000 66.0<br />
TOWN OF LAKE<br />
5270<br />
PLACID<br />
0.444 0.444 Y GW 0.000 0.000 0.000 0.444 3,168 140.2 0.000 0.000 0.000 140.2 0.000 0.000 140.2<br />
6029 CITY OF AVON PARK 1.737 1.737 Y GW 0.000 0.000 0.045 1.692 19,065 88.8 0.000 0.000 0.000 88.8 0.000 0.000 88.8<br />
HIGHLANDS COUNTY<br />
6326<br />
BOCC<br />
0.161 0.161 Y GW 0.000 0.000 0.000 0.161 2,352 68.5 0.000 0.000 0.000 68.5 0.000 0.000 68.5<br />
BUTTONWOOD BAY<br />
7139<br />
UTILITIES<br />
0.176 0.176 Y GW 0.000 0.000 0.002 0.174 1,610 108.2 0.000 0.000 0.000 108.2 0.000 0.000 108.2<br />
COUNTRY CLUB UTIL.<br />
7704<br />
INC<br />
0.259 0.259 Y GW 0.000 0.000 0.004 0.255 897 284.8 0.000 0.000 0.000 284.8 0.000 0.000 284.8<br />
9140 20 EAGLE LAKE EST LLC 0.000 N GW 0.000 0.000 0.000 0.000 NA NA 0.000 0.000 0.000 NA 0.000 0.000 NA<br />
9490 LP UTILITIES CORP. 0.049 0.049 Y GW 0.000 0.000 0.000 0.049 729 67.0 0.000 0.000 0.000 67.0 0.000 0.000 67.0<br />
HIGHLANDS COUNTY<br />
11609<br />
BOCC<br />
0.047 0.047 Y GW 0.000 0.000 0.000 0.047 902 52.1 0.000 0.000 0.000 52.1 0.000 0.000 52.1<br />
SUN N LAKE OF<br />
13099<br />
SEBRING IMPR DIST<br />
0.576 0.576 Y GW 0.000 0.000 0.016 0.560 7,060 79.3 0.000 0.000 0.000 79.3 0.000 0.000 79.3<br />
SILVER LAKE<br />
13367<br />
UTILITIES<br />
0.012 Y GW 0.000 0.000 0.000 0.012 104 115.2 0.000 0.000 0.000 115.2 0.000 0.000 115.2<br />
HIGHLANDS COUNTY<br />
TOTALS 7.224 7.222* 0.000 0.000 0.112 7.110 74,867 95.0 0.000 0.000 0.000 95.0 0.000 0.000 95.0<br />
* <strong>Use</strong>d PSAR ‐submitted pumpage for WUP Nos. 4167 and 13367<br />
450<br />
CITY OF TEMPLE<br />
TERRACE DEPT OF<br />
PUBLIC WORKS<br />
Hillsborough County<br />
3.707 3.707 Y GW 0.000 0.000 0.418 3.289 30,465 108.0 0.000 0.000 0.000 108.0 0.000 0.000 108.0<br />
<strong>Southwest</strong> <strong>Florida</strong> <strong>Water</strong> <strong>Management</strong> District Page | 65
<strong>2011</strong> ESTIMATED WATER USE REPORT<br />
TABLE A1, PART 1. <strong>2011</strong> PUBLIC SUPPLY ANNUAL REPORT (PSAR )WATER USE DATA<br />
PSAR Gross Gross Significant Golf Environ.<br />
Adjusted<br />
Gross Storm Reclaimed Compliance<br />
<strong>Water</strong> Pumpage Pumpage Rec. <strong>Water</strong> Treatment <strong>Water</strong> Population Per <strong>Use</strong> Course Mitigation Per <strong>Water</strong> <strong>Water</strong> Per<br />
<strong>Use</strong><br />
PSAR WMIS Y/N Source Imports Exports Loss <strong>Use</strong> Served Capita Deduct. Deduct. Deduct. Capita Deduct. Deduct. Capita<br />
Permit PERMITTEE<br />
(1) (2) (3) (4) (5) (6) (7) (8) (9) (10) (11) (12) (13) (14) (15) (16) (17)<br />
Number NAME(S) mgd mgd mgd mgd mgd mgd (Functional) gpcd mgd mgd mgd gpcd mgd mgd gpcd<br />
1776 CITY OF PLANT CITY 5.021 4.957 Y GW 0.005 0.041 0.000 4.921 38,497 127.8 0.610 0.000 0.000 112.0 0.000 1.170 81.6<br />
2062<br />
2285<br />
CITY OF TAMPA<br />
WATER DEPT<br />
DAVPAM MOBILE<br />
HOME ASSOC. LLC<br />
67.745 70.115 Y SW/GW 3.477 3.054 6.125 64.412 587,684 109.6 0.000 0.000 0.000 109.6 0.000 0.000 109.6<br />
0.115 0.115 Y GW 0.000 0.000 0.000 0.115 1,135 101.3 0.000 0.000 0.000 101.3 0.000 0.000 101.3<br />
2707 PLURIS EASTLAKE LLC 0.224 0.127 Y GW 0.000 0.000 0.002 0.125 2,975 41.9 0.000 0.000 0.000 41.9 0.000 0.000 41.9<br />
4352 18 TAMPA BAY WATER 22.225 22.209 Y GW 0.000 22.209 0.000 0.000 NA NA NA NA NA NA NA NA NA<br />
4757 WILDER<br />
CORPORATION<br />
0.045 0.022 Y GW 0.000 0.000 0.000 0.022 1,422 15.5 0.000 0.000 0.000 15.5 0.000 0.000 15.5<br />
6312 18 TAMPA BAY WATER 0.183 0.183 Y GW 0.000 0.183 0.000 0.000 NA NA NA NA NA NA NA NA NA<br />
MHC THE MEADOWS<br />
6879 AT COUNTRYWOOD<br />
LLC<br />
0.205 0.201 Y GW 0.000 0.000 0.000 0.201 2,023 99.4 0.000 0.000 0.000 99.4 0.000 0.000 99.4<br />
7002 MALCO INDUSTRIES 0.098 0.093 Y GW 0.000 0.000 0.000 0.093 916 101.5 0.000 0.000 0.000 101.5 0.000 0.000 101.5<br />
RIVERSIDE GOLF<br />
7637<br />
COURSE COMM LLC<br />
0.220 N GW 0.000 0.000 0.000 0.220 1,036 212.4 0.000 0.000 0.000 212.4 0.000 0.000 212.4<br />
PARADISE VILLAGE<br />
7790<br />
MHC, LLC<br />
0.052 N GW 0.000 0.000 0.000 0.052 1,087 47.8 0.000 0.000 0.000 47.8 0.000 0.000 47.8<br />
WINDEMERE UTILITY<br />
10443<br />
COMPANY<br />
0.312 0.312 Y GW 0.000 0.000 0.000 0.312 2,732 114.2 0.000 0.000 0.000 114.2 0.000 0.000 114.2<br />
11771 18 TAMPA BAY WATER 25.705 25.709 Y SW/GW 108.137 133.684 0.000 0.162 NA NA NA NA NA NA NA NA NA<br />
11732 18 TAMPA BAY WATER 4.192 4.192 Y GW 0.000 4.192 0.000 0.000 NA NA NA NA NA NA NA NA NA<br />
11794 18 TAMPA BAY WATER 7.186 2.978 Y SW 0.000 7.186 0.000 0.000 NA NA NA NA NA NA NA NA NA<br />
11796 18 TAMPA BAY WATER 43.680 15.687 Y SW 0.000 43.680 0.000 0.000 NA NA NA NA NA NA NA NA NA<br />
12994 19 PLURIS PCU, INC. 0.000 0.000 Y GW 0.424 0.000 0.000 0.423 3,468 122.1 0.000 0.158 23 0.000 122.1 0.000 0.000 122.1<br />
HILLSBOROUGH<br />
20141 19<br />
COUNTY BOCC<br />
0.000 0.000 Y SW/GW 50.947 0.000 0.000 50.947 534,982 95.2 0.000 0.000 0.000 95.2 0.000 0.000 95.2<br />
HILLSBOROUGH COUNTY<br />
TOTALS<br />
180.642 183.080* 162.990 214.228 6.546 125.296 1,208,422 103.7 0.610 0.000 0.000 103.2 0.000 1.170 102.2<br />
* <strong>Use</strong>d PSAR submitted pumpage for WUP Nos. 11794 and 11796.<br />
Lake County<br />
THERE ARE NO PERMITTED OR SIGNIFICANT PUBLIC SUPPLY USES IN THE SWFWMD PORTION OF LAKE COUNTY<br />
<strong>Southwest</strong> <strong>Florida</strong> <strong>Water</strong> <strong>Management</strong> District Page | 66
<strong>2011</strong> ESTIMATED WATER USE REPORT<br />
TABLE A1, PART 1. <strong>2011</strong> PUBLIC SUPPLY ANNUAL REPORT (PSAR )WATER USE DATA<br />
PSAR Gross Gross Significant Golf Environ.<br />
Adjusted<br />
Gross Storm Reclaimed Compliance<br />
<strong>Water</strong> Pumpage Pumpage Rec. <strong>Water</strong> Treatment <strong>Water</strong> Population Per <strong>Use</strong> Course Mitigation Per <strong>Water</strong> <strong>Water</strong> Per<br />
<strong>Use</strong><br />
PSAR WMIS Y/N Source Imports Exports Loss <strong>Use</strong> Served Capita Deduct. Deduct. Deduct. Capita Deduct. Deduct. Capita<br />
Permit PERMITTEE<br />
(1) (2) (3) (4) (5) (6) (7) (8) (9) (10) (11) (12) (13) (14) (15) (16) (17)<br />
Number NAME(S) mgd mgd mgd mgd mgd mgd (Functional) gpcd mgd mgd mgd gpcd mgd mgd gpcd<br />
Levy County<br />
5640 CITY OF WILLISTON 0.483 N GW 0.000 0.000 0.000 0.483 3,236 149.3 0.000 0.000 0.000 149.3 0.000 0.000 149.3<br />
7755<br />
TOWN OF<br />
YANKEETOWN<br />
0.058 0.058 Y GW 0.000 0.000 0.007 0.051 870 58.5 0.000 0.000 0.000 58.5 0.000 0.000 58.5<br />
8953 TOWN OF INGLIS 0.150 N GW 0.000 0.000 0.000 0.150 1,501 99.9 0.000 0.000 0.000 99.9 0.000 0.000 99.9<br />
LEVY COUNTY TOTALS 0.058 0.691 0.000 0.000 0.007 0.684 5,607 122.0 0.000 0.000 0.000 122.0 0.000 0.000 122.0<br />
Manatee County<br />
6392 CITY OF BRADENTON 5.221 5.221 Y SW 0.192 0.013 0.052 5.348 62,913 85.0 0.000 0.000 0.000 85.0 0.000 0.076 83.8<br />
MANATEE COUNTY<br />
538722 UTILITY OPERATIONS<br />
MOSAIC FERTILIZER<br />
7345 22 LLC & MANATEE<br />
COUNTY<br />
MANATEE COUNTY<br />
747022 BOCC<br />
1096319 TOWN OF LONGBOAT<br />
KEY<br />
24.49<br />
8<br />
24.898 Y SW/GW 15.449 8.922 2.214 29.211 358,845 81.4 0.000 1.619 23 0.000 81.4 0.000 3.017 73.0<br />
0.924 1.719 Y SW/GW 0.000 1.719 0.000 0.000 NA NA 0.000 0.000 0.000 NA 0.000 0.000 NA<br />
12.74<br />
8<br />
12.748 Y SW/GW 0.000 12.748 0.000 0.000 NA NA 0.000 0.000 0.000 NA 0.000 0.000 NA<br />
0.000 0.000 Y SW 1.658 0.000 0.000 1.658 16,810 98.7 0.000 0.000 0.000 98.7 0.000 0.000 98.7<br />
12443 19 CITY OF PALMETTO 0.000 N SW/GW 1.265 0.000 0.013 1.252 16,987 73.7 0.000 0.000 0.000 73.7 0.000 0.000 73.7<br />
MANATEE COUNTY<br />
TOTALS<br />
43.39<br />
1<br />
44.586 18.564 23.402 2.279 37.469 455,555 82.2 0.000 0.000 0.000 82.2 0.000 3.093 75.5<br />
Marion County<br />
377 MARION CO UTILITIES 1.914 1.914 Y GW 0.000 0.000 0.235 1.679 18,963 88.6 0.000 0.000 0.000 88.6 0.000 0.004 88.3<br />
BAY LAUREL<br />
COMMUNITY<br />
1156<br />
DEVELOPMENT<br />
3.031 3.009 Y GW 0.000 0.000 0.135 2.874 10,732 267.8 0.000 0.000 0.000 267.8 0.000 0.053 267.8<br />
DISTRICT<br />
MARION UTILITIES<br />
2999<br />
INC<br />
0.096 0.096 Y GW 0.000 0.000 0.000 0.096 1,090 88.1 0.000 0.000 0.000 88.1 0.000 0.000 88.1<br />
4257 CITY OF DUNNELLON 0.749 N GW 0.000 0.000 0.000 0.749<br />
5,824<br />
128.6 0.000 0.000 0.000 128.6 0.000 0.000 128.6<br />
UTILITIES INC OF<br />
5643<br />
FLORIDA<br />
0.185 0.185 Y GW 0.000 0.000 0.000 0.185 1,076 171.9 0.000 0.000 0.000 171.9 0.000 0.000 171.9<br />
6151 24 MARION CO UTILITIES 2.420 2.778 Y GW 0.000 0.000 0.021 2.757 16,718 164.9 0.000 0.000 0.000 164.9 0.000 0.076 160.4<br />
<strong>Southwest</strong> <strong>Florida</strong> <strong>Water</strong> <strong>Management</strong> District Page | 67
<strong>2011</strong> ESTIMATED WATER USE REPORT<br />
TABLE A1, PART 1. <strong>2011</strong> PUBLIC SUPPLY ANNUAL REPORT (PSAR )WATER USE DATA<br />
PSAR Gross Gross Significant Golf Environ.<br />
Adjusted<br />
Gross Storm Reclaimed Compliance<br />
<strong>Water</strong> Pumpage Pumpage Rec. <strong>Water</strong> Treatment <strong>Water</strong> Population Per <strong>Use</strong> Course Mitigation Per <strong>Water</strong> <strong>Water</strong> Per<br />
<strong>Use</strong><br />
PSAR WMIS Y/N Source Imports Exports Loss <strong>Use</strong> Served Capita Deduct. Deduct. Deduct. Capita Deduct. Deduct. Capita<br />
Permit PERMITTEE<br />
(1) (2) (3) (4) (5) (6) (7) (8) (9) (10) (11) (12) (13) (14) (15) (16) (17)<br />
Number NAME(S) mgd mgd mgd mgd mgd mgd (Functional) gpcd mgd mgd mgd gpcd mgd mgd gpcd<br />
SUN COMMUNITIES<br />
6792<br />
OPERATING LP<br />
0.113 0.113 Y GW 0.000 0.000 0.001 0.112 747 149.8 0.000 0.000 0.000 149.8 0.000 0.000 149.8<br />
MARION UTILITIES<br />
7849<br />
INC<br />
0.161 0.161 Y GW 0.000 0.000 0.000 0.161 1,282 125.2 0.000 0.000 0.000 125.2 0.000 0.000 125.2<br />
CENTURY FAIRFIELD<br />
8005<br />
VILLAGE LTD<br />
0.067 N GW 0.000 0.000 0.000 0.067 755 88.7 0.000 0.000 0.000 88.7 0.000 0.000 88.7<br />
ASSOC. OF MARION<br />
8020 LANDING OWNERS, 0.185 0.185 Y GW 0.000 0.000 0.000 0.185 1,178 156.6 0.000 0.000 0.000 156.6 0.000 0.000 156.6<br />
INC<br />
8165 MARION CO UTILITIES 0.125 0.125 Y GW 0.000 0.000 0.016 0.109 1,293 84.5 0.000 0.000 0.000 84.5 0.000 0.000 84.5<br />
8339 CITY OF DUNNELLON 0.300 N GW 0.000 0.000 0.000 0.300 1,843 162.8 0.000 0.000 0.000 162.8 0.000 0.000 162.8<br />
MARION UTILITIES.<br />
8481 INC & SPRUCE CREEK 0.626 0.626 Y GW 0.000 0.000 0.000 0.626 5,369 116.6 0.000 0.000 0.000 116.6 0.000 0.000 116.6<br />
DEV. CO.<br />
9360 WINDSTREAM<br />
UTILITIES COMPANY<br />
0.549 0.588 Y GW 0.000 0.000 0.034 0.554 2,110 262.6 0.000 0.000 0.000 262.6 0.000 0.000 262.6<br />
11752 MARION CO UTILITIES 0.116 0.116 Y GW 0.000 0.000 0.015 0.101 211 478.8 0.000 0.000 0.000 478.8 0.000 0.000 478.8<br />
12218 24 MARION CO UTILITIES 0.314 0.232 21 Y GW 0.000 0.000 0.018 21 1250 21 NA NA NA NA NA NA NA NA<br />
MARION COUNTY TOTALS 9.834 11.012 0.000 0.000 0.457 10.555 69,191 152.5 0.000 0.000 0.000 152.5 0.000 0.133 150.6<br />
279<br />
540<br />
543<br />
590<br />
AQUA UTILITIES FL.<br />
INC.<br />
HOLIDAY GARDENS<br />
UTILITIES, INC.<br />
CRESTRIDGE UTILITY<br />
CORP.<br />
MAD HATTER UTILITY<br />
INC.<br />
Pasco County<br />
0.270 0.270 Y GW 0.000 0.000 0.020 0.250 3,311 75.378 0.000 0.000 0.000 75.378 0.000 0.000 75.3<br />
0.075 0.075 Y GW 0.000 0.000 0.008 0.067 991 67.420 0.000 0.000 0.000 67.420 0.000 0.000 67.4<br />
0.083 0.083 Y GW 0.000 0.000 0.007 0.076 1,325 57.509 0.000 0.000 0.000 57.509 0.000 0.000 57.5<br />
0.910 0.910 Y GW 0.000 0.000 0.047 0.863 7,364<br />
117.22<br />
0<br />
0.000 0.000 0.000 117.220 0.000 0.000 117.2<br />
964 C S WATER CO. INC. 0.075 0.075 Y GW 0.000 0.000 0.000 0.075 869 86.662 0.000 0.000 0.000 86.662 0.000 0.000 86.7<br />
1631 CITY OF DADE CITY 1.311 1.311 Y GW 0.000 0.000 0.012 1.299 11,164 116.3 0.000 0.000 0.000 116.3 0.000 0.000 116.3<br />
2043<br />
ORANGEWOOD LAKES<br />
MOBILE HOME COMM.<br />
INC.<br />
0.070 0.048 Y GW 0.000 0.000 0.000 0.048 1,040 46.1 0.000 0.000 0.000 46.1 0.000 0.000 46.1<br />
2978 FL. GOV. UTILITY AUTH. 0.623 0.623 Y GW 0.000 0.000 0.006 0.617 5,711 108.1 0.000 0.000 0.000 108.1 0.000 0.000 108.1<br />
<strong>Southwest</strong> <strong>Florida</strong> <strong>Water</strong> <strong>Management</strong> District Page | 68
<strong>2011</strong> ESTIMATED WATER USE REPORT<br />
TABLE A1, PART 1. <strong>2011</strong> PUBLIC SUPPLY ANNUAL REPORT (PSAR )WATER USE DATA<br />
PSAR Gross Gross Significant Golf Environ.<br />
Adjusted<br />
Gross Storm Reclaimed Compliance<br />
<strong>Water</strong> Pumpage Pumpage Rec. <strong>Water</strong> Treatment <strong>Water</strong> Population Per <strong>Use</strong> Course Mitigation Per <strong>Water</strong> <strong>Water</strong> Per<br />
<strong>Use</strong><br />
PSAR WMIS Y/N Source Imports Exports Loss <strong>Use</strong> Served Capita Deduct. Deduct. Deduct. Capita Deduct. Deduct. Capita<br />
Permit PERMITTEE<br />
(1) (2) (3) (4) (5) (6) (7) (8) (9) (10) (11) (12) (13) (14) (15) (16) (17)<br />
Number NAME(S) mgd mgd mgd mgd mgd mgd (Functional) gpcd mgd mgd mgd gpcd mgd mgd gpcd<br />
3182 FL. GOV. UTILITY AUTH. 2.589 2.589 Y GW 0.199 0.000 0.026 2.762 29,198 94.6 0.000 0.000 0.000 94.6 0.000 0.000 94.6<br />
3590 UTILITIES INC. OF FL. 0.126 0.126 Y GW 0.000 0.000 0.000 0.126 2,130 59.3 0.000 0.000 0.000 59.3 0.000 0.000 59.3<br />
3668 UTILITIES INC. OF FL. 0.180 0.180 Y GW 0.000 0.000 0.012 0.168 3,148 53.5 0.000 0.000 0.000 53.5 0.000 0.000 53.5<br />
3677 19 FL. GOV. UTILITY AUTH 0.000 0.000 Y GW 0.089 0.000 0.001 0.088 1,593 55.4 0.000 0.000 0.000 55.4 0.000 0.000 55.4<br />
3692 CITY OF PORT RICHEY 0.779 0.779 Y GW 0.000 0.000 0.000 0.779 14,719 52.9 0.000 0.000 0.000 52.9 0.000 0.000 52.9<br />
4550 CITY OF SAN ANTONIO 0.140 0.162 Y GW 0.000 0.000 0.000 0.162 1,309 123.8 0.000 0.000 0.000 123.8 0.000 0.000 123.8<br />
4668 UTILITIES INC OF FL 0.087 0.087 Y GW 0.000 0.000 0.000 0.087 1,762 49.3 0.000 0.000 0.000 49.3 0.000 0.000 49.3<br />
4669<br />
4734<br />
HUDSON WATER<br />
WORKS INC<br />
CITY OF NEW PORT<br />
RICHEY<br />
0.618 0.635 Y GW 0.000 0.000 0.000 0.635 6,881 92.3 0.000 0.000 0.000 92.3 0.000 0.000 92.3<br />
0.462 0.462 Y GW 4.400 2.050 0.050 2.762 31,100 88.8 0.000 0.000 0.000 88.8 0.000 0.000 88.8<br />
6040 CITY OF ZEPHYRHILLS 2.462 2.462 Y GW 0.000 0.000 0.029 2.433 21,738 111.9 0.000 0.000 0.000 111.9 0.000 0.178 103.7<br />
LABRADOR UTILITIES<br />
6867<br />
INC.<br />
0.066 0.066 Y GW 0.000 0.000 0.000 0.066 1,631 40.4 0.000 0.000 0.000 40.4 0.000 0.000 40.4<br />
7299 L W V UTILITIES INC 0.076 N GW 0.000 0.000 0.000 0.076 889 85.5 0.000 0.000 0.000 85.5 0.000 0.000 85.5<br />
7999<br />
8417<br />
FL. GOV. UTILITY<br />
AUTH<br />
0.124 0.124 Y GW 0.000 0.000 0.001 0.123 1,914 64.4 0.000 0.000 0.000 64.4 0.000 0.000 64.4<br />
FL. GOV. UTILITY<br />
AUTH<br />
0.072 0.072 Y GW 0.286 0.000 0.003 0.355 7,307 48.5 0.000 0.000 0.000 48.5 0.000 0.000 48.5<br />
8491 PARRISH PROP. V LLC 0.022 0.022 Y GW 0.000 0.000 0.000 0.022 958 23.1 0.000 0.000 0.000 23.1 0.000 0.000 23.1<br />
11771 18 TAMPA BAY WATER 40.848 40.848 Y GW 0.000 40.848 0.000 0.000 NA NA NA NA NA NA NA NA NA<br />
11863 PASCO CO UTILITIES 3.896 4.297 Y GW 23.601 0.517 0.052 27.329 212,260 128.8 0.000 0.000 0.000 128.8 0.000 0.550 126.2<br />
PASCO COUNTY TOTALS 55.887 56.383 28.576 43.415 0.275 41.269 370,313 111.4 0.000 0.000 0.000 111.4 0.000 0.728 109.5<br />
742<br />
CITY OF TARPON<br />
SPRINGS<br />
Pinellas County<br />
0.495 0.511 Y GW 1.720 0.042 0.000 2.189 30,355 72.1 0.000 0.000 0.000 72.1 0.000 0.000 72.1<br />
2980 CITY OF DUNEDIN 4.308 4.308 Y GW/DS 0.000 0.000 0.979 3.329 39,910 83.4 0.000 0.000 0.000 83.4 0.000 0.000 83.4<br />
<strong>Southwest</strong> <strong>Florida</strong> <strong>Water</strong> <strong>Management</strong> District Page | 69
<strong>2011</strong> ESTIMATED WATER USE REPORT<br />
TABLE A1, PART 1. <strong>2011</strong> PUBLIC SUPPLY ANNUAL REPORT (PSAR )WATER USE DATA<br />
PSAR Gross Gross Significant Golf Environ.<br />
Adjusted<br />
Gross Storm Reclaimed Compliance<br />
<strong>Water</strong> Pumpage Pumpage Rec. <strong>Water</strong> Treatment <strong>Water</strong> Population Per <strong>Use</strong> Course Mitigation Per <strong>Water</strong> <strong>Water</strong> Per<br />
<strong>Use</strong><br />
PSAR WMIS Y/N Source Imports Exports Loss <strong>Use</strong> Served Capita Deduct. Deduct. Deduct. Capita Deduct. Deduct. Capita<br />
Permit PERMITTEE<br />
(1) (2) (3) (4) (5) (6) (7) (8) (9) (10) (11) (12) (13) (14) (15) (16) (17)<br />
Number NAME(S) mgd mgd mgd mgd mgd mgd (Functional) gpcd mgd mgd mgd gpcd mgd mgd gpcd<br />
2981 CITY OF CLEARWATER 4.588 4.750 Y GW/DS 6.371 0.000 0.390 10.731 122,709 87.5 0.000 0.000 0.000 87.5 0.000 1.549 74.8<br />
7692 TOWN OF BELLEAIR 0.769 0.769 Y GW 0.000 0.000 0.040 0.729 6,013 121.2 0.000 0.000 0.000 121.2 0.000 0.235 82.2<br />
10350<br />
UTILITIES INC OF<br />
FLORIDA<br />
0.051 0.051 Y GW 0.000 0.000 0.001 0.050 826 60.7 0.000 0.000 0.000 60.7 0.000 0.000 60.7<br />
10795 19 CITY OF GULFPORT 0.000 0.000 Y GW 0.975 0.000 0.000 0.975 14,393 67.8 0.000 0.000 0.000 67.8 0.000 0.000 67.8<br />
11218 20 CITY OF OLDSMAR 0.000 0.000 Y GW 1.364 0.000 0.000 1.364 15,369 88.8 0.000 0.000 0.000 88.8 0.000 0.000 88.8<br />
1124519 CITY OF SAFETY<br />
HARBOR<br />
0.000 N GW 1.347 0.000 0.000 1.347 16,509 81.6 0.000 0.000 0.000 81.6 0.000 0.000 81.6<br />
11771 18 TAMPA BAY WATER 11.868 Y GW 0.000 11.868 0.000 0.000 NA NA NA NA NA NA NA NA NA<br />
1235119 CITY OF PINELLAS<br />
PARK<br />
0.000 0.000 Y GW 4.280 0.000 0.000 4.280 74,767 57.2 0.000 0.000 0.000 57.2 0.000 0.000 57.2<br />
20142 19 PINELLAS COUNTY 0.000 0.000 Y GW 52.965 14.525 0.649 37.792 466,139 81.1 0.000 0.000 0.000 81.1 0.000 0.000 81.1<br />
CITY OF ST.<br />
2014319 PETERSBURG<br />
PINELLAS COUNTY<br />
TOTALS<br />
0.000 0.000 Y GW 27.714 1.215 0.516 25.983 271,838 95.6 0.000 0.000 0.000 95.6 0.000 0.000 95.6<br />
10.211 22.257 96.737 27.650 2.575 88.769 1,058,828 83.8 0.000 0.000 0.000 83.8 0.000 1.784 82.2<br />
Polk County<br />
341 CITY OF BARTOW 2.977 2.977 Y GW 0.000 0.000 0.638 2.339 21,395 109.3 0.159 0.000 0.000 101.9 0.000 0.676 70.3<br />
645 CITY OF FORT MEADE 0.544 0.544 Y GW 0.000 0.000 0.000 0.544 5,659 96.2 0.000 0.000 0.000 96.2 0.000 0.196 61.5<br />
1616<br />
LAKE REGION MOBILE<br />
HOME OWNERS INC<br />
0.095 N GW 0.000 0.000 0.000 0.095 1,066 89.1 0.000 0.000 0.000 89.1 0.000 0.000 89.1<br />
FOUR LAKES GOLF<br />
1625<br />
CLUB LTD<br />
0.381 0.419 Y GW 0.000 0.000 0.000 0.419 1,494 280.5 0.000 0.143 0.000 184.6 0.000 0.000 184.6<br />
TOWN OF LAKE<br />
2332<br />
HAMILTON<br />
0.221 0.221 Y GW 0.000 0.000 0.002 0.219 1,712 127.7 0.000 0.000 0.000 127.7 0.000 0.000 127.7<br />
ORCHID SPRINGS DEV.<br />
3415<br />
CORP<br />
0.069 0.069 Y GW 0.002 0.000 0.000 0.071 910 78.0 0.000 0.000 0.000 78.0 0.000 0.000 78.0<br />
CROOKED LAKE PARK<br />
4005<br />
WATER CO.<br />
0.233 0.233 Y GW 0.000 0.000 0.004 0.229 2,544 90.0 0.000 0.000 0.000 90.0 0.000 0.000 90.0<br />
CITY OF WINTER<br />
4607<br />
HAVEN<br />
8.610 8.610 Y GW 0.000 0.000 0.159 8.451 67,066 126.0 0.000 0.000 0.000 126.0 0.000 0.000 126.0<br />
4658 CITY OF LAKE WALES 2.550 2.550 Y GW 0.000 0.002 0.000 2.548 20,909 121.9 0.000 0.000 0.000 121.9 0.000 0.000 121.9<br />
<strong>Southwest</strong> <strong>Florida</strong> <strong>Water</strong> <strong>Management</strong> District Page | 70
<strong>2011</strong> ESTIMATED WATER USE REPORT<br />
TABLE A1, PART 1. <strong>2011</strong> PUBLIC SUPPLY ANNUAL REPORT (PSAR )WATER USE DATA<br />
PSAR Gross Gross Significant Golf Environ.<br />
Adjusted<br />
Gross Storm Reclaimed Compliance<br />
<strong>Water</strong> Pumpage Pumpage Rec. <strong>Water</strong> Treatment <strong>Water</strong> Population Per <strong>Use</strong> Course Mitigation Per <strong>Water</strong> <strong>Water</strong> Per<br />
<strong>Use</strong><br />
PSAR WMIS Y/N Source Imports Exports Loss <strong>Use</strong> Served Capita Deduct. Deduct. Deduct. Capita Deduct. Deduct. Capita<br />
Permit PERMITTEE<br />
(1) (2) (3) (4) (5) (6) (7) (8) (9) (10) (11) (12) (13) (14) (15) (16) (17)<br />
Number NAME(S) mgd mgd mgd mgd mgd mgd (Functional) gpcd mgd mgd mgd gpcd mgd mgd gpcd<br />
CITY OF LAKELAND<br />
4912 WATER UTIL WATER 22.258 21.892 Y GW 0.000 0.507 0.076 21.309 167,777 127.0 0.000 0.010 23 0.000 127.0 0.000 2.213 113.8<br />
ADM.<br />
GRENELEFE RESORT<br />
5251<br />
LLC<br />
0.991 0.991 Y GW 0.000 0.000 0.000 0.991 1,872 529.5 0.000 0.406 0.000 312.8 0.000 0.000 312.8<br />
5750 CITY OF DAVENPORT 0.449 0.449 Y GW 0.000 0.000 0.000 0.449 4,929 91.0 0.000 0.000 0.000 91.0 0.000 0.000 91.0<br />
5870 CITY OF FROSTPROOF 0.303 0.327 Y GW 0.000 0.000 0.000 0.327 2,983 109.6 0.029 0.000 0.000 99.8 0.000 0.000 99.8<br />
5893<br />
TOWN OF DUNDEE<br />
PUBLIC WORKS DEPT<br />
0.538 0.296 Y GW 0.000 0.000 0.000 0.296 5,048 58.6 0.000 0.000 0.000 58.6 0.000 0.000 58.6<br />
6124 CITY OF MULBERRY 0.455 0.455 Y GW 0.000 0.000 0.000 0.455 4,826 94.3 0.000 0.000 0.000 94.3 0.000 0.000 94.3<br />
SADDLEBAG LAKE<br />
6174<br />
OWNERS ASSOC INC.<br />
0.084 0.084 Y GW 0.000 0.000 0.001 0.083 619 134.9 0.000 0.000 0.000 134.9 0.000 0.000 134.9<br />
6505 POLK CO BOCC 2.829 2.829 Y GW 0.192 0.000 0.070 2.952 30,534 96.7 0.000 0.000 0.000 96.7 0.000 0.000 96.7<br />
6506 POLK CO BOCC 3.379 3.379 Y GW 0.052 0.000 0.057 3.373 39,230 86.0 0.000 0.000 0.000 86.0 0.000 0.000 86.0<br />
6507 POLK CO BOCC 0.794 0.981 Y GW 0.000 0.000 0.030 0.951 13,779 69.0 0.000 0.000 0.000 69.0 0.000 0.000 69.0<br />
6508 POLK CO BOCC 0.509 0.509 Y GW 0.000 0.000 0.027 0.482 4,674 103.1 0.145 0.000 0.000 72.1 0.000 0.000 72.1<br />
6509 POLK CO BOCC 4.493 4.493 Y GW 2.708 0.000 0.197 7.004 53,256 131.5 0.102 0.000 0.000 129.6 0.000 0.000 129.6<br />
6624 CITY OF LAKE ALFRED 0.973 0.953 Y GW 0.000 0.001 0.000 0.952 6,595 144.4 0.000 0.000 0.000 144.4 0.000 0.050 136.8<br />
6920 CITY OF EAGLE LAKE 0.362 0.362 Y GW 0.000 0.000 0.000 0.362 3,227 112.3 0.000 0.000 0.000 112.3 0.000 0.000 112.3<br />
7119 CITY OF AUBURNDALE 4.466 4.466 Y GW 0.000 0.000 0.000 4.466 26,073 171.3 0.944 0.000 0.000 135.1 0.000 0.320 122.8<br />
7187<br />
7328<br />
CHC VII LTD CENTURY<br />
REALTY FUND<br />
CAREFREE RV CC OF<br />
WINTER HAVEN INC<br />
AQUA UTILITIES FL.<br />
7653<br />
INC.<br />
7878<br />
AQUA UTILITIES FL.<br />
INC.<br />
0.386 0.386 Y GW 0.000 0.000 0.000 0.386 1,694 227.7 0.000 0.142 0.000 144.0 0.000 0.000 144.0<br />
0.124 0.130 Y GW 0.000 0.000 0.000 0.130 1,058 122.8 0.000 0.061 0.000 65.2 0.000 0.014 52.0<br />
0.037 Y GW 0.000 0.000 0.000 0.036 687 52.6 0.000 0.000 0.000 52.6 0.000 0.000 52.6<br />
0.142 0.155 Y GW 0.000 0.000 0.001 0.154 2,015 76.4 0.000 0.000 0.000 76.4 0.000 0.000 76.4<br />
8054 POLK CO BOCC 0.524 0.524 Y GW 0.000 0.000 0.008 0.516 5,995 86.1 0.000 0.000 0.000 86.1 0.000 0.000 86.1<br />
8344 S V UTILITIES LTD 0.200 0.200 Y GW 0.000 0.000 0.000 0.200 1,420 140.7 0.000 0.000 0.000 140.7 0.000 0.000 140.7<br />
8468 CITY OF POLK CITY 0.339 0.339 Y GW 0.000 0.000 0.000 0.339 5,894 57.4 0.000 0.000 0.000 57.4 0.000 0.000 57.4<br />
8522 CITY OF HAINES CITY 3.727 3.727 Y GW 0.000 0.000 0.280 3.446 30,223 114.0 0.109 0.000 0.000 110.4 0.000 0.489 94.2<br />
<strong>Southwest</strong> <strong>Florida</strong> <strong>Water</strong> <strong>Management</strong> District Page | 71
<strong>2011</strong> ESTIMATED WATER USE REPORT<br />
TABLE A1, PART 1. <strong>2011</strong> PUBLIC SUPPLY ANNUAL REPORT (PSAR )WATER USE DATA<br />
PSAR Gross Gross Significant Golf Environ.<br />
Adjusted<br />
Gross Storm Reclaimed Compliance<br />
<strong>Water</strong> Pumpage Pumpage Rec. <strong>Water</strong> Treatment <strong>Water</strong> Population Per <strong>Use</strong> Course Mitigation Per <strong>Water</strong> <strong>Water</strong> Per<br />
<strong>Use</strong><br />
PSAR WMIS Y/N Source Imports Exports Loss <strong>Use</strong> Served Capita Deduct. Deduct. Deduct. Capita Deduct. Deduct. Capita<br />
Permit PERMITTEE<br />
(1) (2) (3) (4) (5) (6) (7) (8) (9) (10) (11) (12) (13) (14) (15) (16) (17)<br />
Number NAME(S) mgd mgd mgd mgd mgd mgd (Functional) gpcd mgd mgd mgd gpcd mgd mgd gpcd<br />
8753 PLANTATION<br />
LANDINGS LTD<br />
8967 SWEETWATER<br />
COMMUNITY INC<br />
0.066 0.066 Y GW 0.000 0.000 0.000 0.066 719 91.2 0.000 0.000 0.000 91.2 0.000 0.000 91.2<br />
0.138 0.138 Y GW 0.000 0.000 0.000 0.138 720 191.7 0.000 0.006 0.000 182.8 0.000 0.008 171.7<br />
10141 21 POLK COUNTY BOCC 0.000 0.000 Y GW 0.000 0.000 0.000 0.000 NA NA 0.000 0.000 0.000 NA 0.000 0.000 NA<br />
ALAFIA PRESERVE LLC,<br />
12964 21 EAGLE RIDGE LLC, AND<br />
DONALDSON KNOLL<br />
0.000 0.000 Y GW 0.000 0.000 0.000 0.000 NA NA 0.000 0.000 0.000 NA 0.000 0.000 NA<br />
LLC<br />
CYPRESS LAKES<br />
13043<br />
UTILITIES INC<br />
0.201 0.201 Y GW 0.000 0.000 0.067 0.134 3,129 43.0 0.000 0.000 0.000 43.0 0.000 0.000 43.0<br />
POLK COUNTY TOTALS 64.352 64.328* 2.954 0.509 1.619 64.912 541,731 119.8 1.489 0.758 0.000 115.7 0.000 3.966 108.4<br />
*PSAR pumpage was used for WUP Nos. 7653 and 5893<br />
Sarasota County<br />
2923 CITY OF NORTH PORT 2.029 2.029 Y SW 1.068 0.000 0.036 3.060 44,323 69.0 0.000 0.000 0.000 69.0 0.000 0.000 69.0<br />
CITY OF SARSOTA<br />
431822 PUBLIC WORKS<br />
4866<br />
ENGLEWOOD WATER<br />
DISTRICT<br />
7.644 3.035 Y GW 4.613 0.000 1.504 6.143 77,444 79.3 0.000 0.000 0.000 79.3 0.000 0.560 72.1<br />
3.560 3.566 Y GW/DS 0.000 0.012 0.888 2.666 34,413 77.5 0.000 0.000 0.000 77.5 0.000 0.475 63.7<br />
5393 CITY OF VENICE 3.672 4.066 Y GW/DS 0.000 0.000 2.102 1.964 29,924 65.6 0.000 0.000 0.000 65.6 0.000 0.000 65.6<br />
CAMELOT<br />
5807 COMMUNITIES MHP, 0.266 0.253 Y GW/DS 0.000 0.000 0.032 0.221 1,668 132.5 0.000 0.000 0.000 132.5 0.000 0.000 132.5<br />
LLC<br />
ROYALTY RESORT<br />
7448<br />
CORPORATION<br />
0.104 0.104 Y GW/DS 0.000 0.000 0.012 0.092 3,198 28.7 0.000 0.000 0.000 28.7 0.000 0.000 28.7<br />
SARASOTA COUNTY<br />
8836<br />
BOCC<br />
3.079 3.079 Y GW/DS 15.794 1.608 0.790 16.474 209,043 78.8 0.000 0.000 0.000 78.8 0.000 0.000 78.8<br />
9638 PALMER ENTERPRISES 0.000 0.000 Y GW 0.000 0.000 0.000 0.000 NA NA 0.000 0.000 0.000 NA 0.000 0.000 NA<br />
10224 22 CITY OF SARASOTA 4.613 Y GW 0.000 4.613 0.000 0.000 NA NA 0.000 0.000 0.000 NA 0.000 0.000 NA<br />
SARASOTA COUNTY<br />
TOTAL<br />
20.353 20.745 21.474 6.234 5.365 30.620 400,013 76.5 0.000 0.000 0.000 76.5 0.000 1.035 74.0<br />
Sumter County<br />
<strong>Southwest</strong> <strong>Florida</strong> <strong>Water</strong> <strong>Management</strong> District Page | 72
<strong>2011</strong> ESTIMATED WATER USE REPORT<br />
TABLE A1, PART 1. <strong>2011</strong> PUBLIC SUPPLY ANNUAL REPORT (PSAR )WATER USE DATA<br />
PSAR Gross Gross Significant Golf Environ.<br />
Adjusted<br />
Gross Storm Reclaimed Compliance<br />
<strong>Water</strong> Pumpage Pumpage Rec. <strong>Water</strong> Treatment <strong>Water</strong> Population Per <strong>Use</strong> Course Mitigation Per <strong>Water</strong> <strong>Water</strong> Per<br />
<strong>Use</strong><br />
PSAR WMIS Y/N Source Imports Exports Loss <strong>Use</strong> Served Capita Deduct. Deduct. Deduct. Capita Deduct. Deduct. Capita<br />
Permit PERMITTEE<br />
(1) (2) (3) (4) (5) (6) (7) (8) (9) (10) (11) (12) (13) (14) (15) (16) (17)<br />
Number NAME(S) mgd mgd mgd mgd mgd mgd (Functional) gpcd mgd mgd mgd gpcd mgd mgd gpcd<br />
1368<br />
LAKE PANASOFFKEE<br />
WATER ASSOC INC<br />
0.251 0.251 Y GW 0.000 0.000 0.008 0.243 3,724 65.3 0.000 0.000 0.000 65.3 0.000 0.000 65.3<br />
2622 CONTINENTAL<br />
COUNTRY CLUB RD INC<br />
0.421 0.421 Y GW 0.000 0.000 0.000 0.421 1,640 256.7 0.000 0.213 0.000 127.1 0.000 0.000 127.1<br />
6519 CITY OF BUSHNELL 0.365 0.365 Y GW 0.000 0.000 0.000 0.365 2,644 138.0 0.198 0.000 0.000 63.1 0.000 0.000 63.1<br />
7185 CITY OF WEBSTER 0.188 0.087 Y GW 0.000 0.000 0.000 0.087 1,035 84.1 0.000 0.000 0.000 84.1 0.000 0.000 84.1<br />
7799 CEDAR ACRES, INC. 0.006 N GW 0.000 0.000 0.000 0.006 729 8.2 0.000 0.000 0.000 8.2 0.000 0.000 8.2<br />
CITY OF WILDWOOD<br />
8135<br />
CITY<br />
2.047 2.047 Y GW 0.000 0.000 0.000 2.047 15,269 134.1 0.000 0.000 0.000 134.1 0.000 0.051 130.7<br />
MADISON FLORIDA<br />
13123<br />
GRANDE, LLC<br />
0.017 N GW/SW 0.000 0.000 0.000 0.017 NA NA 0.000 0.000 0.000 NA 0.000 0.000 NA<br />
VILLAGE CENTER<br />
13005<br />
COMM. DEV. DIST.<br />
20.098 17.880 Y GW/SW 0.000 0.000 0.179 17.701 65,882 268.7 0.253 1.113 0.000 247.9 3.291 2.083 166.4<br />
SUMTER COUNTY TOTAL 23.370 21.074 0.000 0.000 0.187 20.887 90,923 229.7 0.451 1.326 0.000 210.2 3.291 2.134 150.5<br />
DISTRICT TOTALS a 488.493 506.282 341.316 335.647 21.216 479.384 4,732,577 101.3 2.549 2.084 0.000 100.2 3.291 14.471 96.5<br />
gpcd: gallons per capita day (gallons per day per person)<br />
mgd: million gallons per day<br />
<strong>Southwest</strong> <strong>Florida</strong> <strong>Water</strong> <strong>Management</strong> District Page | 73
<strong>2011</strong> ESTIMATED WATER USE REPORT<br />
Please note that data in these tables may not exactly match what was reported in the public supply annual reports due to rule requirements and supporting documentation conditions<br />
required in Rule 40D‐2 ‐ Part B ‐ Basis of Review Chapter 3.6, Annual Reports. In addition, the December 31, <strong>2011</strong> data from the <strong>Water</strong> <strong>Management</strong> Information System (WMIS) was<br />
corrected where found to be in error. Further, the <strong>Estimated</strong> <strong>Water</strong> <strong>Use</strong> process includes scaling and fractioning withdrawal point and use data where necessary to adhere to the annual<br />
average quantity that is permitted on each water use permit. Such scaling and fractioning has a de minimus affect on pumpage totals.<br />
a<br />
The gross use total is the sum of the individual WUP gross uses. Not shown is the sum of the individual WUP adjusted gross use of 474.425 mgd and the sum of individual compliance use<br />
of 456.531 mgd. Division by the stated population gives the District Adjusted Gross Per Capita and Compliance Per Capita rates shown above.<br />
Record of Public Supply Annual Reports Received and Number of WUPs in compliance with the 150 gpcd compliance per capita requirement. (Those not in compliance may<br />
have interim compliance per capita rate allowed.)<br />
No.<br />
No. WUPs<br />
WUPs No. WUPs No WUPs<br />
PSAR Received 160 Unadjusted Gross PC < 150: 136 Adjusted Gross PC < 150: 139 Compliance PC < 150: 139<br />
PSAR Not Received * 17 Unadjusted Gross PC > 150: 23 Adjusted Gross PC > 150: 20 Compliance PC > 150: 20<br />
Total Due 177 Unadjusted Gross PS = NA 18 Adjusted Gross PS = NA 18 Compliance PS = NA 18<br />
Total<br />
17<br />
7 Total<br />
177 Total 177<br />
* If the Public Supply Annual Report was not received, the gallons pumped was derived from District metering data. The populations served are based on 2010<br />
dwelling units (if available) or 2010 Census households.<br />
(1)<br />
(2)<br />
(3)<br />
(4)<br />
(5)<br />
(6)<br />
(7)<br />
(8)<br />
(9)<br />
Pumpage that was reported on the Public Supply Annual Report for <strong>2011</strong> (PSAR <strong>2011</strong>) .<br />
Pumpage that was reported by the Permittee on a monthly (or daily) basis and was input to the <strong>Water</strong> <strong>Management</strong> Information System. This is the pumpage<br />
quantity used in most instances to calculate water use parameters in this table.<br />
A PSAR for <strong>2011</strong> was received by the District. If a PSAR was required but not received, “N” is noted in this column and the District’s data and demographics<br />
were used. Only WUPs that were required to submit a PSAR in <strong>2011</strong> are listed.<br />
GW = Groundwater, SW = Surface <strong>Water</strong>, DS = Brackish or saline groundwater or surface water treated for potablility via Reverse Osmosis or Electrodialysis<br />
Reversal (EDR)<br />
IMPORT = <strong>Water</strong> purchased or transferred in bulk from another utility<br />
EXPORT = <strong>Water</strong> sold or transferred in bulk to another utility<br />
TREATMENT LOSS = Annual average gallons per day which are lost in routine treatment for potability. This includes, but is not limited to, desalination reject<br />
water, sand filtration backwash, and quantities used to maintain appropriate water quality in pipelines or tanks. Treatment losses are calculated as raw water<br />
into the plant minus treated water out of the plant. In addition, this can include no more than 1% of treated water volume delivered to the distribution system<br />
for flushing distribution lines for potability.<br />
GROSS USE [Also called "finished water"] = (Withdrawal + Import) ‐ (Export + Treatment Loss)<br />
FUNCTIONAL POPULATION = The permanent population adjusted for seasonal variation, tourists, and commuters if documented by the Permittee<br />
<strong>Southwest</strong> <strong>Florida</strong> <strong>Water</strong> <strong>Management</strong> District Page | 74
<strong>2011</strong> ESTIMATED WATER USE REPORT<br />
(10) UNADJUSTED GROSS PER CAPITA = (Gross <strong>Use</strong>) ÷ (Functional Population). Population‐related withdrawals associated with residential, business, institutional,<br />
industrial, miscellaneous metered, and unaccounted water uses are applicable to all public supply benefits.<br />
(11)<br />
SIGNIFICANT USE = A Significant <strong>Use</strong> is a substantial amount of water provided for industrial/commercial (I/C) use and that is not related to population.<br />
Permittees are allowed to deduct significant use under five options: A: Single significant <strong>Use</strong>; B: District‐wide percent I/C use; C: Combined regional<br />
government and higher education facilities; D: Individual regional health facilities; E: Individual I/C facilities where water is the primary ingredient or the<br />
final product. Definitions and exclusions of each type are given in the Basis of Review for <strong>Water</strong> <strong>Use</strong> Permit Applications, Chapter 3, Section 3.6.<br />
(12)<br />
GOLF COURSE DEDUCTION = Separately metered golf course irrigation quantities from ground water, surface water, reclaimed water, or storm water provided<br />
to golf courses inside the service area. The permitted quantities for the service area and reported as withdrawals (WD) in the Annual Report. The "GC"<br />
withdrawal quantities deducted shall not exceed those actually provided, or those that would be permitted for use by the District, whichever is less. Quantities<br />
provided may be deducted only if they are included in the permit.<br />
(13)<br />
ENVIRONMENTAL MITIGATION = Annual average quantities used by a utility to mitigate withdrawal‐related stress to a specified environmental feature as<br />
required by the utility's <strong>Water</strong> <strong>Use</strong> Permit (WUP)<br />
(14)<br />
ADJUSTED GROSS PER CAPITA = ((Gross <strong>Use</strong>) ‐ (Significant <strong>Use</strong>s + Golf Course Deduction + Environmental Mitigation) ÷ Functional Population).<br />
(15) STORMWATER DEDUCTION = Separately metered and reported stormwater quantities captured by the permittee that are included in the utility's permitted<br />
quantities for uses inside the service area and are used for uses other than for golf course irrigation. The stormwater withdrawal quantities deducted shall not<br />
exceed the quantities actually provided, or those that would be permitted for the use by the District, whichever is less. Stormwater quantities deducted as golf<br />
course (GC) use above may not be included in this deduction for stormwater. The surface withdrawal points from the stormwater catchments shall be<br />
permitted on the provider's water use permit and must be reported as withdrawals in the Public Supply Annual Report to be deducted.<br />
(16)<br />
RECLAIMED WATER DEDUCTION = A deduction from the gross per capita that is applicable if the utility provides reclaimed water for beneficial use to an area<br />
as set forth in the Basis of Review for<br />
<strong>Water</strong> <strong>Use</strong> Permit Applications, Chapter 3, Section 3.1.<br />
(17) COMPLIANCE PER CAPITA = ((gross use) ‐ (significant use + golf course deduction + environmental mitigation + stormwater deduction + reclaimed water<br />
deduction)) / (Functional Population). This is a rate that is calculated for compliance with the 150 gpd per person limit.<br />
The following footnotes pertain to specified water use permits (WUPs)<br />
18 Regional <strong>Water</strong> Supply Supplier. In the case of WUP No. 11771, the total pumped quantity is divided into the counties from which the pumpage occurred<br />
(Hillsborough, Pasco and Pinellas).<br />
19<br />
Wholesale Public Supply <strong>Water</strong> Receiver<br />
20<br />
Public Supply pumpage on WUP Nos. 9140 and 11218 had not begun in <strong>2011</strong>.<br />
21<br />
WUP No. 10141 and WUP No. 12964 did not have any withdrawals in <strong>2011</strong>. Construction of the development had not been initiated.<br />
22<br />
WUP Nos. 7345 and 7470 are reported on WUP No. 5387; WUP No. 10224 is reported on WUP No. 4318<br />
23<br />
The golf course pumpage was not separately metered; not accepted<br />
24<br />
WUP No. 12218 was combined into WUP No. 6151 on 9/7/<strong>2011</strong>. Pumpage, treatment loss and population for WUP No. 12218 is included in data for WUP No.<br />
6151.<br />
<strong>Southwest</strong> <strong>Florida</strong> <strong>Water</strong> <strong>Management</strong> District Page | 75
<strong>2011</strong> ESTIMATED WATER USE REPORT<br />
The following section of Table A‐1 gives information for public supply WUPs that are not required to submit a Public Supply Annual<br />
Report. The WUPs in the following table are metered, and actual pumpage is provided. Detains on WUPs for which the annual average<br />
use was estimated are in the version of this report on the District website.<br />
TABLE A1, PART 2. METERED & ESTIMATED PUBLIC SUPPLY WUPS THAT ARE NOT REQUIRED TO SUBMIT A PUBLIC SUPPLY ANNUAL REPORT<br />
PUMPAGE, PERMITTED QUANTITIES AND PERMITTED PUBLIC SUPPLY QUANTITIES (MGD), <strong>2011</strong><br />
County<br />
WUP<br />
Number<br />
Permittee <strong>Use</strong> Code 1 Source 2<br />
Annual<br />
Average<br />
Pumpage<br />
(mgd)<br />
Total<br />
Permitted<br />
Annual<br />
Average<br />
Quantity<br />
(mgd)<br />
Quantity<br />
Attributed to<br />
Public Supply<br />
<strong>Water</strong> <strong>Use</strong><br />
Category 3<br />
(mgd)<br />
There are no metered public supply WUPs in Charlotte County that do not submit the Public Supply Annual Report<br />
CITRUS 729 Citrus County <strong>Water</strong> Resources P130 G 0.074 0.080 0.080<br />
CITRUS 1345 Royal Oaks Of Citrus HOA, Inc. P130 G 0.083 0.068 0.068<br />
Total Pumpage for Citrus County 0.157 0.148 0.148<br />
DESOTO 3160 C & H Groves Inc P060 G 0.001 0.136 0.001<br />
DESOTO 8935 V C Hollingsworth Sr. Estate P100 G 0.001 0.131 0.002<br />
Total Pumpage for DeSoto County 0.002 0.267 0.003<br />
HARDEE 1912 V & W Farms Inc of Delray Beach P135 G 0.000 1.236 0.002<br />
HARDEE 1912 V & W Farms Inc of Delray Beach P135 S 0.000 1.236 0.002<br />
HARDEE 9390 Windmill Farms Nurseries Inc P100 G 0.000 0.187 0.000<br />
HARDEE 9550 Hardee Correctional Institution P100 G 0.228 0.301 0.285<br />
HARDEE 11858 FINR II Inc. P040 G 0.000 0.431 0.421<br />
Total Pumpage for Hardee County 0.228 2.985 1.010<br />
There are no public supply WUPs in Hernando County that do not submit the Public Supply Annual Report<br />
HIGHLANDS 7811 Mink Associates II LLC P130 G 0.088 0.288 0.147<br />
Total Pumpage for Highlands County 0.088 0.288 0.147<br />
<strong>Southwest</strong> <strong>Florida</strong> <strong>Water</strong> <strong>Management</strong> District Page | 76
<strong>2011</strong> ESTIMATED WATER USE REPORT<br />
TABLE A1, PART 2. METERED & ESTIMATED PUBLIC SUPPLY WUPS THAT ARE NOT REQUIRED TO SUBMIT A PUBLIC SUPPLY ANNUAL REPORT<br />
PUMPAGE, PERMITTED QUANTITIES AND PERMITTED PUBLIC SUPPLY QUANTITIES (MGD), <strong>2011</strong><br />
County<br />
WUP<br />
Number<br />
Permittee <strong>Use</strong> Code 1 Source 2<br />
Annual<br />
Average<br />
Pumpage<br />
(mgd)<br />
Total<br />
Permitted<br />
Annual<br />
Average<br />
Quantity<br />
(mgd)<br />
Quantity<br />
Attributed to<br />
Public Supply<br />
<strong>Water</strong> <strong>Use</strong><br />
Category 3<br />
(mgd)<br />
HILLSBOROUGH 689 School Board of Hillsborough Co P100 G 0.027 0.142 0.083<br />
HILLSBOROUGH 1444 Charles G. Grimes, Trustee and Betty J. Grimes, Trustee P135 G 0.003 0.245 0.010<br />
HILLSBOROUGH 1444 Charles G. Grimes, Trustee and Betty J. Grimes, Trustee P135 S 0.000 0.245 0.010<br />
HILLSBOROUGH 5886 Tampa Bay <strong>Water</strong> P105 G 0.608 0.820 0.820<br />
HILLSBOROUGH 6420 Linda Lawton DKL Properties, LLC P130 G 0.005 0.106 0.005<br />
HILLSBOROUGH 6420 Linda Lawton DKL Properties, LLC P130 S 0.000 0.106 0.005<br />
HILLSBOROUGH 6675 Tampa Bay <strong>Water</strong> P105 S 5.017 20.000 20.000<br />
HILLSBOROUGH 8873 Sam Jr. & Betty Astin P130 G 0.001 0.179 0.002<br />
HILLSBOROUGH 8873 Sam Jr. & Betty Astin P130 S 0.000 0.179 0.002<br />
HILLSBOROUGH 9418 Fancy Farms Inc. P060 G 0.001 0.185 0.001<br />
HILLSBOROUGH 10654 Ellel Ministries USA Inc P135 G 0.000 0.235 0.002<br />
HILLSBOROUGH 10654 Ellel Ministries USA Inc P135 S 0.000 0.235 0.002<br />
HILLSBOROUGH 12523 University Of <strong>Florida</strong> IFAS Facility & Planning Operations P060 G 0.000 0.345 0.000<br />
HILLSBOROUGH 12957 NHC‐FL 8‐LP David W Fell P131 G 0.032 0.347 0.045<br />
Total Pumpage for Hillsborough County 5.694 22.604 20.968<br />
There are no public supply WUPs in Lake County within the District.<br />
There are no public supply WUPs in Levy County that do not submit the Public Supply Annual Report<br />
MANATEE 503 J T Reeder Part LLLP & Snell Family LP Of SW <strong>Florida</strong> P131 G 0.004 0.875 0.004<br />
MANATEE 3837 John Falkner Classie Growers LLC P135 G 0.006 4.232 0.020<br />
MANATEE 4467 John Falkner P131 G 0.001 11.278 0.005<br />
MANATEE 9089 FFD Land Co Inc P135 G 0.006 2.791 0.012<br />
MANATEE 11105 Farm‐Op Inc P100 G 0.009 3.016 0.024<br />
<strong>Southwest</strong> <strong>Florida</strong> <strong>Water</strong> <strong>Management</strong> District Page | 77
<strong>2011</strong> ESTIMATED WATER USE REPORT<br />
TABLE A1, PART 2. METERED & ESTIMATED PUBLIC SUPPLY WUPS THAT ARE NOT REQUIRED TO SUBMIT A PUBLIC SUPPLY ANNUAL REPORT<br />
PUMPAGE, PERMITTED QUANTITIES AND PERMITTED PUBLIC SUPPLY QUANTITIES (MGD), <strong>2011</strong><br />
County<br />
WUP<br />
Number<br />
Permittee <strong>Use</strong> Code 1 Source 2<br />
Annual<br />
Average<br />
Pumpage<br />
(mgd)<br />
Total<br />
Permitted<br />
Annual<br />
Average<br />
Quantity<br />
(mgd)<br />
Quantity<br />
Attributed to<br />
Public Supply<br />
<strong>Water</strong> <strong>Use</strong><br />
Category 3<br />
(mgd)<br />
MANATEE 11536 John Falkner Classie Growers LLC P115 G 0.004 2.426 0.005<br />
Total Pumpage for Manatee County 0.030 24.618 0.070<br />
MARION 5731 MHC Foxwood Farms LLC & MHC FF Utility Systems LLC P130 G 0.069 0.085 0.085<br />
MARION 6585 Ocala Jockey Club Inc. P090 G 0.003 0.191 0.007<br />
MARION 6674 Golden Ocala Golf Course and Country Club P130 G 0.017 0.449 0.053<br />
MARION 11475 Arbor Springs Dev LLC P130 G 0.001 0.655 0.020<br />
Total Pumpage for Marion County 0.090 1.380 0.165<br />
PASCO 279 Aqua Utilities <strong>Florida</strong> Incorporated P130 G 0.270 0.330 0.330<br />
PASCO 923 Travelers Rest Resort Inc. P100 G 0.073 0.065 0.065<br />
PASCO 2296 Saint Leo University Inc. P100 G 0.100 0.241 0.185<br />
PASCO 6231 NHC‐FL 115 LLC P090 G 0.005 0.023 0.023<br />
PASCO 9666 Alfred Heiler P131 G 0.093 0.061 0.061<br />
PASCO 11082 Aqua Utilities <strong>Florida</strong> Incorporated P130 G 0.015 0.029 0.029<br />
PASCO 11127 Tampa Bay <strong>Water</strong>/Pinellas Co <strong>Water</strong> System P020 G 0.301 0.498 0.498<br />
PASCO 11129 Tampa Bay <strong>Water</strong> P020 G 0.302 0.416 0.416<br />
PASCO 11131 Tampa Bay <strong>Water</strong> P020 G 0.058 0.084 0.084<br />
PASCO 11132 Tampa Bay <strong>Water</strong> & Dan R & Patricia A Dempsey P020 G 0.173 0.200 0.200<br />
12784 Order of Saint Benedict Of <strong>Florida</strong> A/K/A/ Saint Leo<br />
PASCO<br />
P100 G 0.019 0.175 0.030<br />
Abbey<br />
Total Pumpage for Pasco County 1.409 2.122 1.921<br />
PINELLAS 12905 City of St Petersburg P070 G 0.000 0.070 0.070<br />
Total Pumpage for Pinellas County 0.000 0.070 0.070<br />
<strong>Southwest</strong> <strong>Florida</strong> <strong>Water</strong> <strong>Management</strong> District Page | 78
<strong>2011</strong> ESTIMATED WATER USE REPORT<br />
TABLE A1, PART 2. METERED & ESTIMATED PUBLIC SUPPLY WUPS THAT ARE NOT REQUIRED TO SUBMIT A PUBLIC SUPPLY ANNUAL REPORT<br />
PUMPAGE, PERMITTED QUANTITIES AND PERMITTED PUBLIC SUPPLY QUANTITIES (MGD), <strong>2011</strong><br />
County<br />
WUP<br />
Number<br />
Permittee <strong>Use</strong> Code 1 Source 2<br />
Annual<br />
Average<br />
Pumpage<br />
(mgd)<br />
Total<br />
Permitted<br />
Annual<br />
Average<br />
Quantity<br />
(mgd)<br />
Quantity<br />
Attributed to<br />
Public Supply<br />
<strong>Water</strong> <strong>Use</strong><br />
Category 3<br />
(mgd)<br />
POLK 143 Mountain Lake Corp P130 G 0.058 3.380 0.096<br />
POLK 494 <strong>Florida</strong> Dept of Corrections P100 G 0.241 0.470 0.470<br />
Total Pumpage for Polk County 0.299 3.850 0.566<br />
SARASOTA 10225 City of Sarasota P130 G 0.000 0.043 0.043<br />
Total Pumpage for Sarasota County 0.000 0.043 0.043<br />
SUMTER 6793 Rainforest RV Inc P130 G 0.002 0.135 0.016<br />
SUMTER 8193 City of Center Hill P130 G 0.062 0.087 0.087<br />
SUMTER 11259 Sumter County BOCC P100 G 0.000 0.125 0.000<br />
SUMTER 11778 Village Center CDD P040 G 0.029 0.170 0.114<br />
SUMTER 12584 Orange Blossom Utilities & Villa GE Park Center Property P100 G 0.026 0.088 0.088<br />
Total Pumpage for Sumter County 0.119 0.605 0.305<br />
Data source: <strong>Estimated</strong> <strong>Water</strong> <strong>Use</strong> Tables derived from the WMIS WUP database, Calendar Year <strong>2011</strong><br />
1 <strong>Use</strong> Code: The following use codes are given on the table above:<br />
Total Pumpage for the District 8.028 58.692 25.269<br />
P020 – Augmentation for Environmental P090 – Unmetered Other P130 – Residential Single Family Dwellings<br />
P040 – Industrial/Commercial customer P100 – Personal/Sanitary (non‐utility) P131 – Residential Mobile Homes<br />
P060 – Fire Fighting and Testing P105 – Regional Public Supply System P135 – Temporary Employee Housing<br />
P070 ‐ Lawn/Landscape Irrigation<br />
P115 – Residential Provided by Non‐utility Entity<br />
2 Source: G = Groundwater; S = Surface <strong>Water</strong><br />
3 Public Supply portion of the total permitted annual average quantity.<br />
<strong>Southwest</strong> <strong>Florida</strong> <strong>Water</strong> <strong>Management</strong> District Page | 79
TABLE A2<br />
<strong>2011</strong> ESTIMATED WATER USE REPORT<br />
Table A‐2 presents information given by permittees on Part B of the PSAR form regarding the end use of water for different categories. The Gross <strong>Use</strong><br />
is the same amount as given on Table A‐1. The percentage given for residential use are for the proportion of water supplied to single‐family and<br />
multi‐family dwellings units as well as to mobile homes and RV parks. The percentages shown for the various use categories of<br />
industrial/commercial use (I/C), agricultural use (AG), and recreation/aesthetic use, excluding golf course, (R/A), and that for golf course irrigation<br />
(GC) are the proportion of water that is supplied for these end uses. Percentages are also shown for the proportion of their gross water supply that is<br />
used for fire suppression and testing as well as for other ancillary water needs, such as line flushing, that can be quantified (F&O). Any differences<br />
between the amount of water leaving the treatment plant and the amount recorded at the customers’ meters are non‐quantified water losses (WL).<br />
Such water losses are the result of leaking pipelines, pipeline breaks, users tapping into the supply illegally, and under‐registering customer meters.<br />
The quantities supplied for residences only is divided by the functional population that was provided to generate a residential per capita rate. This<br />
rate is not included in the rates used to determine compliance with the required per capita rate of 150 gpd. The exclamation point after the WUP<br />
Number indicates that a PSAR form was not received.<br />
TABLE A2. <strong>2011</strong> PUBLIC SUPPLY ANNUAL REPORT TOTAL USE AND RESIDENTIAL PER CAPITA<br />
<strong>Water</strong><br />
County <strong>Use</strong><br />
Permit<br />
Number Permittee Name(s)<br />
CHARLOTTE 718<br />
GASPARILLA ISLAND<br />
WATER ASSOC, INC.<br />
PSAR<br />
Rec.<br />
Y/N<br />
Gross<br />
<strong>Use</strong><br />
(mgd)<br />
(1)<br />
% RES<br />
(2)<br />
% I/C<br />
(3)<br />
%<br />
AG<br />
(4)<br />
%<br />
R/A<br />
(5)<br />
%<br />
GC<br />
(6)<br />
%<br />
F&O<br />
(7)<br />
% WL<br />
(8)<br />
Resident.<br />
<strong>Use</strong><br />
(mgd)<br />
(9)<br />
Population<br />
Served<br />
(Funct.)<br />
(10)<br />
Resident.<br />
Per<br />
Capita<br />
(11)<br />
Y 1.03 77.30 13.80 0.00 0.00 0.00 5.50 3.40 0.80 5,658 140.99 0.14 0.00 0.00 0.00 0.06 0.04<br />
CHARLOTTE 871 CITY OF PUNTA GORDA Y 4.16 69.32 11.80 0.00 5.35 0.00 3.72 9.81 2.89 36,305 79.51 0.49 0.00 0.22 0.00 0.16 0.41<br />
CHARLOTTE 1512<br />
CHARLOTTE HARBOR<br />
WATER ASSOCIATION<br />
Y 0.35 76.00 20.00 0.00 0.25 0.25 2.00 1.75 0.27 4,380 60.82 0.07 0.00 0.00 0.00 0.01 0.01<br />
CHARLOTTE 3522 CHARLOTTE CO UTIL Y 0.40 68.00 7.00 0.00 0.00 0.00 16.00 8.00 0.27 6,153 43.92 0.03 0.00 0.00 0.00 0.06 0.03<br />
CHARLOTTE 7104 CHARLOTTE CO BOCC Y 9.02 73.00 12.00 0.00 1.00 0.00 12.00 3.00 6.59 119,992 54.89 1.08 0.00 0.09 0.00 1.08 0.27<br />
I/C<br />
<strong>Use</strong><br />
(mgd)<br />
(12)<br />
AG<br />
<strong>Use</strong><br />
(mgd)<br />
(13)<br />
R/A<br />
<strong>Use</strong><br />
(mgd)<br />
(14)<br />
GC <strong>Use</strong><br />
(mgd)<br />
(15)<br />
F & O<br />
<strong>Use</strong><br />
(mgd)<br />
(16)<br />
WL<br />
<strong>Use</strong><br />
(mgd)<br />
(17)<br />
CHARLOTTE 7768<br />
ISLAND HARBOR BCH CLB<br />
LTD, CHAR HARBOR LAND<br />
CO, KNIGHT ISLAND<br />
N 0.07 56.90 15.70 0.00 0.00 0.00 0.00 9.40 0.04 460 87.90 0.01 0.00 0.00 0.00 0.00 0.01<br />
REPORTING CHARLOTTE COUNTY PERMITS 15.04 10.85 172,948 62.72 1.83 0.00 0.31 0.00 1.37 0.76<br />
CITRUS 207 CITY OF CRYSTAL RIVER Y 0.78 58.00 24.00 3.00 0.00 0.00 0.00 15.00 0.45 6,138 73.61 0.19 0.02 0.00 0.00 0.00 0.12<br />
CITRUS 419 CITY OF INVERNESS N 1.13 85.00 12.00 0.00 0.00 0.00 0.00 2.00 0.96 24,309 39.58 0.14 0.00 0.00 0.00 0.00 0.02<br />
CITRUS 1118<br />
FLORAL CITY WATER<br />
ASSOCIATION INC<br />
Y 0.26 79.40 7.00 0.90 0.40 0.00 5.30 7.10 0.21 4,716 43.93 0.02 0.00 0.00 0.00 0.01 0.02<br />
<strong>Southwest</strong> <strong>Florida</strong> <strong>Water</strong> <strong>Management</strong> District Page | 80
<strong>2011</strong> ESTIMATED WATER USE REPORT<br />
TABLE A2. <strong>2011</strong> PUBLIC SUPPLY ANNUAL REPORT TOTAL USE AND RESIDENTIAL PER CAPITA<br />
County<br />
<strong>Water</strong><br />
<strong>Use</strong><br />
Permit<br />
Number Permittee Name(s)<br />
PSAR<br />
Rec.<br />
Y/N<br />
Gross<br />
<strong>Use</strong><br />
(mgd)<br />
(1)<br />
% RES<br />
(2)<br />
% I/C<br />
(3)<br />
%<br />
AG<br />
(4)<br />
%<br />
R/A<br />
(5)<br />
%<br />
GC<br />
(6)<br />
%<br />
F&O<br />
(7)<br />
% WL<br />
(8)<br />
Resident.<br />
<strong>Use</strong><br />
(mgd)<br />
(9)<br />
Population<br />
Served<br />
(Funct.)<br />
(10)<br />
CITRUS 2842 CITRUS COUNTY WRD Y 2.64 75.11 1.47 0.00 0.00 0.00 7.34 18.10 1.99 17,737 111.98 0.04 0.00 0.00 0.00 0.19 0.48<br />
CITRUS 4153<br />
CITRUS 4406<br />
CITRUS 6691<br />
CITRUS 7121<br />
ROLLING OAKS<br />
UTILITIES INC<br />
HOMOSASSA SPECIAL<br />
WATER DISTRICT<br />
GULF HIGHWAY LAND<br />
CORPORATION<br />
CITRUS CO. &<br />
WITHLACOOCHEE REG<br />
WATER SUPPLY AUTH<br />
Resident.<br />
Per<br />
Capita<br />
(11)<br />
Y 1.74 79.30 1.60 0.00 5.00 0.00 8.94 5.20 1.38 11,395 121.16 0.03 0.00 0.09 0.00 0.16 0.09<br />
Y 0.77 58.00 24.00 0.00 0.00 0.00 1.00 17.00 0.45 5,329 84.33 0.19 0.00 0.00 0.00 0.01 0.13<br />
Y 0.10 100.00 0.00 0.00 0.00 0.00 0.00 0.00 0.10 524 185.06 0.00 0.00 0.00 0.00 0.00 0.00<br />
Y 4.03 81.00 2.57 0.00 8.68 0.00 4.85 2.90 3.26 25,560 127.66 0.10 0.00 0.35 0.00 0.20 0.12<br />
CITRUS 7879 CITRUS COUNTY WRD Y 0.04 89.10 0.00 0.00 0.00 0.00 2.38 8.50 0.03 446 75.86 0.00 0.00 0.00 0.00 0.00 0.00<br />
CITRUS 9791 CITRUS COUNTY WRD Y 2.40 80.33 1.04 0.00 0.00 0.00 15.10 3.53 1.93 10,877 177.61 0.03 0.00 0.00 0.00 0.36 0.08<br />
I/C<br />
<strong>Use</strong><br />
(mgd)<br />
(12)<br />
AG<br />
<strong>Use</strong><br />
(mgd)<br />
(13)<br />
R/A<br />
<strong>Use</strong><br />
(mgd)<br />
(14)<br />
GC <strong>Use</strong><br />
(mgd)<br />
(15)<br />
F & O<br />
<strong>Use</strong><br />
(mgd)<br />
(16)<br />
WL<br />
<strong>Use</strong><br />
(mgd)<br />
(17)<br />
CITRUS 11839<br />
CITRUS 20230<br />
GCP WALDEN WOODS<br />
ONE, LLC & GCP WALDEN<br />
WOODS TWO, LLC<br />
OZELLO WATER<br />
ASSOCIATION INC<br />
Y 0.16 79.80 0.00 0.00 0.00 0.00 4.30 15.90 0.13 1,073 117.56 0.00 0.00 0.00 0.00 0.01 0.03<br />
Y 0.46 50.50 24.00 1.74 0.00 0.00 0.27 23.49 0.23 3,956 59.25 0.11 0.01 0.00 0.00 0.00 0.11<br />
REPORTING CITRUS COUNTY PERMITS 14.52 11.12 112,060 99.27 0.83 0.03 0.44 0.00 0.94 1.20<br />
DESOTO 4725 CITY OF ARCADIA<br />
DESOTO 10420 PRMRWSA ‐ LAKE SUZY<br />
Y<br />
Y<br />
0.82 73.53 4.78 0.00 0.00 0.00 9.86 9.95 0.60 8,357 72.14 0.04 0.00 0.00 0.00 0.08 0.08<br />
NA NA NA NA NA NA NA NA NA NA NA NA NA NA NA NA NA<br />
REPORTING DESOTO COUNTY PERMITS 0.82 0.60 8,357 68.85 0.04 0.00 0.00 0.00 0.08 0.08<br />
HARDEE 30<br />
CITY OF BOWLING<br />
GREEN MUNICIPAL Y 0.25 99.00 0.00 0.00 0.00 0.00 0.00 1.00 0.25 4,818 51.58 0.00 0.00 0.00 0.00 0.00 0.00<br />
WATER SYSTEM<br />
HARDEE 4461 CITY OF WAUCHULA Y 0.40 53.00 30.00 0.00 3.00 0.00 2.00 12.00 0.21 6,206 34.56 0.12 0.00 0.01 0.00 0.01 0.05<br />
HARDEE 7658<br />
TOWN OF ZOLFO<br />
SPRINGS<br />
HARDEE 13026 HARDEE COUNTY BOCC Y 0.06 59.00 22.00 0.00<br />
Y 0.15 54.00 46.00 0.00 0.00 0.00 0.00 0.00 0.08 2,530 31.80 0.07 0.00 0.00 0.00 0.00 0.00<br />
11.0<br />
0<br />
0.00 4.00 4.00 0.04 796 44.01 0.01 0.00 0.01 0.00 0.00 0.00<br />
REPORTING HARDEE COUNTY PERMITS 0.86 0.58 14,350 50.90 0.20 0.00 0.02 0.00 0.01 0.05<br />
<strong>Southwest</strong> <strong>Florida</strong> <strong>Water</strong> <strong>Management</strong> District Page | 81
<strong>2011</strong> ESTIMATED WATER USE REPORT<br />
TABLE A2. <strong>2011</strong> PUBLIC SUPPLY ANNUAL REPORT TOTAL USE AND RESIDENTIAL PER CAPITA<br />
County<br />
HERNANDO 2179<br />
HERNANDO 2983<br />
HERNANDO 5789<br />
<strong>Water</strong><br />
<strong>Use</strong><br />
Permit<br />
Number Permittee Name(s)<br />
HERNANDO CO<br />
UTILITIES DEPT<br />
HERNANDO CO<br />
UTILITIES DEPT<br />
HERNANDO CO<br />
UTILITIES DEPT<br />
PSAR<br />
Rec.<br />
Y/N<br />
Gross<br />
<strong>Use</strong><br />
(mgd)<br />
(1)<br />
% RES<br />
(2)<br />
% I/C<br />
(3)<br />
%<br />
AG<br />
(4)<br />
%<br />
R/A<br />
(5)<br />
%<br />
GC<br />
(6)<br />
%<br />
F&O<br />
(7)<br />
% WL<br />
(8)<br />
Resident.<br />
<strong>Use</strong><br />
(mgd)<br />
(9)<br />
Population<br />
Served<br />
(Funct.)<br />
(10)<br />
Resident.<br />
Per<br />
Capita<br />
(11)<br />
Y 0.10 79.00 4.00 0.00 0.00 0.00 7.00 10.00 0.08 739 111.18 0.00 0.00 0.00 0.00 0.01 0.01<br />
Y 18.23 79.32 7.10 0.00 1.30 0.00 1.60 10.60 14.46 126,040 114.74 1.29 0.00 0.24 0.00 0.29 1.93<br />
Y 0.99 67.48 9.70 0.00 1.00 0.00 12.30 9.50 0.67 7,784 85.82 0.10 0.00 0.01 0.00 0.12 0.09<br />
HERNANDO 7627 CITY OF BROOKSVILLE Y 1.24 61.36 24.30 0.00 0.00 0.00 3.51 10.83 0.76 14,710 51.56 0.30 0.00 0.00 0.00 0.04 0.13<br />
HERNANDO 1<strong>2011</strong><br />
HERNANDO CO<br />
UTILITIES DEPT<br />
Y 0.01 83.00 9.36 0.00 0.00 0.00 0.00 7.80 0.01 50 132.80 0.00 0.00 0.00 0.00 0.00 0.00<br />
REPORTING HERNANDO COUNTY PERMITS 20.57 15.98 149,323 107.00 1.70 0.00 0.25 0.00 0.46 2.17<br />
I/C<br />
<strong>Use</strong><br />
(mgd)<br />
(12)<br />
AG<br />
<strong>Use</strong><br />
(mgd)<br />
(13)<br />
R/A<br />
<strong>Use</strong><br />
(mgd)<br />
(14)<br />
GC <strong>Use</strong><br />
(mgd)<br />
(15)<br />
F & O<br />
<strong>Use</strong><br />
(mgd)<br />
(16)<br />
WL<br />
<strong>Use</strong><br />
(mgd)<br />
(17)<br />
HIGHLANDS 4167 AQUA UTILITIES FL INC Y 0.12 37.37 4.38 0.00 0.00 0.00 27.03 31.22 0.05 1,374 33.72 0.01 0.00 0.00 0.00 0.03 0.04<br />
HIGHLANDS 4492 CITY OF SEBRING Y 3.30 65.00 26.00 0.00 0.00 0.00 7.00 2.00 2.15 33,229 64.59 0.86 0.00 0.00 0.00 0.23 0.07<br />
HIGHLANDS 4980 LAKE PLACID HOLD. CO Y 0.29 100.20 0.00 0.00 0.00 0.00 0.00 0.00 0.29 4,377 66.16 0.00 0.00 0.00 0.00 0.00 0.00<br />
HIGHLANDS 5270 TOWN OF LAKE PLACID Y 0.44 51.75 39.89 0.00 3.49 0.00 1.87 3.03 0.23 3,168 72.53 0.18 0.00 0.02 0.00 0.01 0.01<br />
HIGHLANDS 6029 CITY OF AVON PARK Y 1.69 64.10 15.90 0.00 5.10 0.00 5.90 9.00 1.08 19,065 56.90 0.27 0.00 0.09 0.00 0.10 0.15<br />
HIGHLANDS 6326<br />
HIGHLANDS COUNTY<br />
BOCC<br />
Y 0.16 50.30 23.20 0.00 0.10 0.00 10.40 16.00 0.08 2,352 34.43 0.04 0.00 0.00 0.00 0.02 0.03<br />
HIGHLANDS 7139<br />
BUTTONWOOD BAY<br />
UTILITIES<br />
Y 0.17 91.53 4.52 0.00 0.00 0.00 1.00 2.94 0.16 1,610 99.08 0.01 0.00 0.00 0.00 0.00 0.01<br />
HIGHLANDS 7704<br />
COUNTRY CLUB<br />
UTILITIES INC<br />
Y 0.26 94.00 5.00 0.00 0.00 0.00 0.00 1.00 0.24 897 267.67 0.01 0.00 0.00 0.00 0.00 0.00<br />
HIGHLANDS 9140 EAGLE LAKE EST LLC N 0.00 0.00 NA NA NA NA NA NA 0.00 0 NA NA NA NA NA NA NA<br />
HIGHLANDS 9490 LP UTILITIES CORP Y 0.05 83.10 11.30 0.00 0.00 0.00 0.20 5.40 0.04 729 55.66 0.01 0.00 0.00 0.00 0.00 0.00<br />
HIGHLANDS 11609<br />
HIGHLANDS 13099<br />
HIGHLANDS COUNTY<br />
BOCC<br />
SUN N LAKE OF<br />
SEBRING IMPR DIST<br />
Y 0.05 83.50 4.10 0.00 0.00 0.00 6.20 6.20 0.04 902 43.51 0.00 0.00 0.00 0.00 0.00 0.00<br />
Y 0.56 64.00 34.00 0.00 3.00 0.00 3.00 0.00 0.36 7,060 50.77 0.19 0.00 0.02 0.00 0.02 0.00<br />
HIGHLANDS 13367 SILVER LAKE UTILITIES Y 0.01 100.00 0.00 0.00 0.00 0.00 0.00 0.00 0.01 104 115.60 0.00 0.00 0.00 0.00 0.00 0.00<br />
REPORTING HIGHLANDS COUNTY PERMITS 7.11 4.73 74,867 63.15 1.57 0.00 0.12 0.00 0.41 0.31<br />
HILLSBOROUGH 450<br />
CITY OF TEMPLE<br />
TERRACE DEPT OF<br />
PUBLIC WORKS<br />
Y 3.29 67.99 19.94 0.00 4.29 0.00 2.88 4.90 2.24 30,465 73.40 0.66 0.00 0.14 0.00 0.09 0.16<br />
<strong>Southwest</strong> <strong>Florida</strong> <strong>Water</strong> <strong>Management</strong> District Page | 82
<strong>2011</strong> ESTIMATED WATER USE REPORT<br />
TABLE A2. <strong>2011</strong> PUBLIC SUPPLY ANNUAL REPORT TOTAL USE AND RESIDENTIAL PER CAPITA<br />
County<br />
<strong>Water</strong><br />
<strong>Use</strong><br />
Permit<br />
Number Permittee Name(s)<br />
PSAR<br />
Rec.<br />
Y/N<br />
Gross<br />
<strong>Use</strong><br />
(mgd)<br />
(1)<br />
% RES<br />
(2)<br />
% I/C<br />
(3)<br />
%<br />
AG<br />
(4)<br />
%<br />
R/A<br />
(5)<br />
%<br />
GC<br />
(6)<br />
%<br />
F&O<br />
(7)<br />
% WL<br />
(8)<br />
Resident.<br />
<strong>Use</strong><br />
(mgd)<br />
(9)<br />
Population<br />
Served<br />
(Funct.)<br />
(10)<br />
HILLSBOROUGH 1776 CITY OF PLANT CITY Y 4.92 56.32 40.81 0.00 1.05 0.00 0.38 1.44 2.77 38,497 72.00 2.01 0.00 0.05 0.00 0.02 0.07<br />
HILLSBOROUGH 2062<br />
HILLSBOROUGH 2285<br />
CITY OF TAMPA WATER<br />
DEPT<br />
DAVPAM MOBILE HOME<br />
ASSOC. LLC<br />
Resident.<br />
Per<br />
Capita<br />
(11)<br />
Y 64.41 58.80 31.10 0.00 1.20 0.00 1.40 9.68 37.87 587,684 64.45 20.03 0.00 0.77 0.00 0.90 6.24<br />
Y 0.12 100.00 0.00 0.00 0.00 0.00 0.00 0.00 0.12 1,135 101.32 0.00 0.00 0.00 0.00 0.00 0.00<br />
HILLSBOROUGH 2707 PLURIS EASTLAKE LLC Y 0.12 92.00 2.00 0.00 5.00 0.00 0.00 0.00 0.11 2,975 38.56 0.00 0.00 0.01 0.00 0.00 0.00<br />
HILLSBOROUGH 4757 WILDER CORPORATION Y 0.02 100.00 0.00 0.00 0.00 0.00 0.00 0.00 0.02 1,422 15.47 0.00 0.00 0.00 0.00 0.00 0.00<br />
HILLSBOROUGH 6879<br />
MHC THE MEADOWS AT<br />
COUNTRYWOOD LLC<br />
Y 0.20 100.00 0.00 0.00 0.00 0.00 0.00 0.00 0.20 2,023 99.38 0.00 0.00 0.00 0.00 0.00 0.00<br />
HILLSBOROUGH 7002 MALCO INDUSTRIES INC Y 0.10 100.00 0.00 0.00 0.00 0.00 0.00 0.00 0.10 916 107.08 0.00 0.00 0.00 0.00 0.00 0.00<br />
HILLSBOROUGH 7637<br />
HILLSBOROUGH 7790<br />
HILLSBOROUGH 10443<br />
RIVERSIDE GOLF<br />
COURSE COMM LLC<br />
PARADISE VILLAGE<br />
MHC, LLC<br />
WINDEMERE UTILITY<br />
COMPANY<br />
N 0.22 66.40 0.00 0.00 0.00 0.00 33.60 0.00 0.15 1,036 141.01 0.00 0.00 0.00 0.00 0.07 0.00<br />
N 0.05 100.00 0.00 0.00 0.00 0.00 0.00 0.00 0.05 1,087 47.84 0.00 0.00 0.00 0.00 0.00 0.00<br />
Y 0.31 100.00 0.00 0.00 0.00 0.00 0.00 0.00 0.31 2,732 114.21 0.00 0.00 0.00 0.00 0.00 0.00<br />
HILLSBOROUGH 12994 PLURIS PCU, INC. Y 0.42 93.55 6.45 0.00 0.00 0.00 0.00 0.00 0.40 3,468 114.24 0.03 0.00 0.00 0.00 0.00 0.00<br />
HILLSBOROUGH 20141<br />
HILLSBOROUGH<br />
COUNTY BOCC<br />
Y 50.95 78.90 12.90 0.00 0.00 0.00 1.40 6.90 40.20 534,982 75.14 6.57 0.00 0.00 0.00 0.71 3.52<br />
REPORTING HILLSBOROUGH COUNTY PERMITS 125.14 84.54 1,208,422 69.96 29.30 0.00 0.97 0.00 1.80 9.98<br />
I/C<br />
<strong>Use</strong><br />
(mgd)<br />
(12)<br />
AG<br />
<strong>Use</strong><br />
(mgd)<br />
(13)<br />
R/A<br />
<strong>Use</strong><br />
(mgd)<br />
(14)<br />
GC <strong>Use</strong><br />
(mgd)<br />
(15)<br />
F & O<br />
<strong>Use</strong><br />
(mgd)<br />
(16)<br />
WL<br />
<strong>Use</strong><br />
(mgd)<br />
(17)<br />
There are no significant public supply use in the SWFWMD portion of Lake County<br />
LEVY 5640 CITY OF WILLISTON N 0.48 59.00 40.00 0.00 0.00 0.50 0.00 0.00 0.28 3,236 88.06 0.19 0.00 0.00 0.00 0.00 0.00<br />
LEVY 7755<br />
TOWN OF<br />
YANKEETOWN<br />
Y 0.05 51.00 0.05 0.00 0.00 0.00 0.04 40.00 0.03 870 29.86 0.00 0.00 0.00 0.00 0.00 0.02<br />
LEVY 8953 TOWN OF INGLIS N 0.15 61.00 8.00 0.00 0.00 0.00 0.00 31.00 0.09 1,501 60.86 0.01 0.00 0.00 0.00 0.00 0.05<br />
REPORTING LEVY COUNTY PERMITS 0.68 0.40 5,607 71.75 0.21 0.00 0.00 0.00 0.00 0.07<br />
MANATEE 5387<br />
MANATEE COUNTY<br />
UTILITY OPERATIONS<br />
Y 29.21 71.02 17.23 0.03 0.85 0.00 3.38 6.79 20.75 358,845 57.81 5.03 0.01 0.25 0.00 0.99 1.98<br />
MANATEE 6392 CITY OF BRADENTON Y 5.35 68.70 21.00 0.00 2.50 0.00 6.30 1.50 3.67 62,913 58.40 1.12 0.00 0.13 0.00 0.34 0.08<br />
<strong>Southwest</strong> <strong>Florida</strong> <strong>Water</strong> <strong>Management</strong> District Page | 83
<strong>2011</strong> ESTIMATED WATER USE REPORT<br />
TABLE A2. <strong>2011</strong> PUBLIC SUPPLY ANNUAL REPORT TOTAL USE AND RESIDENTIAL PER CAPITA<br />
County<br />
MANATEE 7345*<br />
<strong>Water</strong><br />
<strong>Use</strong><br />
Permit<br />
Number Permittee Name(s)<br />
MOSAIC FERTILIZER<br />
LLC & MANATEE CO<br />
PSAR<br />
Rec.<br />
Y/N<br />
Gross<br />
<strong>Use</strong><br />
(mgd)<br />
(1)<br />
% RES<br />
(2)<br />
% I/C<br />
(3)<br />
%<br />
AG<br />
(4)<br />
%<br />
R/A<br />
(5)<br />
%<br />
GC<br />
(6)<br />
%<br />
F&O<br />
(7)<br />
% WL<br />
(8)<br />
Resident.<br />
<strong>Use</strong><br />
(mgd)<br />
(9)<br />
Population<br />
Served<br />
(Funct.)<br />
(10)<br />
Resident.<br />
Per<br />
Capita<br />
(11)<br />
Y NA NA NA NA NA NA NA NA NA NA NA NA NA NA NA NA NA<br />
MANATEE 7470* MANATEE CO BOCC Y NA NA NA NA NA NA NA NA NA NA NA NA NA NA NA NA NA<br />
MANATEE 10963 TWN OF LONGBOAT KEY Y 1.66 84.42 4.61 0.00 0.00 0.00 0.63 10.34 1.40 16,810 83.28 0.08 0.00 0.00 0.00 0.01 0.17<br />
MANATEE 12443 CITY OF PALMETTO N 1.25 85.00 15.00 0.00 0.00 0.00 0.00 0.00 1.06 17,048 62.42 0.19 0.00 0.00 0.00 0.00 0.00<br />
* The data for WUP Nos. 7345 and 7470 are including in WUP No. 5387.<br />
I/C<br />
<strong>Use</strong><br />
(mgd)<br />
(12)<br />
AG<br />
<strong>Use</strong><br />
(mgd)<br />
(13)<br />
R/A<br />
<strong>Use</strong><br />
(mgd)<br />
(14)<br />
GC <strong>Use</strong><br />
(mgd)<br />
(15)<br />
F & O<br />
<strong>Use</strong><br />
(mgd)<br />
(16)<br />
WL<br />
<strong>Use</strong><br />
(mgd)<br />
(17)<br />
REPORTING MANATEE COUNTY PERMITS 37.47 26.88 455,616 59.01 6.42 0.01 0.38 0.00 1.33 2.24<br />
MARION 377<br />
MARION 1156<br />
MARION CO UTILITIES<br />
DEPT<br />
BAY LAUREL COM DEV<br />
DISTRICT<br />
Y 1.68 87.00 8.00 0.00 0.00 0.00 1.00 4.00 1.46 18,963 77.04 0.13 0.00 0.00 0.00 0.02 0.07<br />
Y 2.87 89.70 4.20 0.00 0.00 0.40 1.40 4.30 2.58 9,294 277.40 0.12 0.00 0.00 0.01 0.04 0.12<br />
MARION 2999 MARION UTILITIES INC Y 0.10 100.00 0.00 0.00 0.00 0.00 0.00 0.00 0.10 1,090 88.06 0.00 0.00 0.00 0.00 0.00 0.00<br />
MARION 4257 CITY OF DUNNELLON N 0.75 69.10 1.10 0.00 0.00 0.00 0.00 27.70 0.52 5,824 88.87 0.01 0.00 0.00 0.00 0.00 0.21<br />
MARION 5643 UTILITIES INC OF FL Y 0.19 90.00 0.00 0.00 0.00 0.00 0.00 10.00 0.17 1,076 154.74 0.00 0.00 0.00 0.00 0.00 0.02<br />
MARION 6151<br />
MARION CO UTILITIES<br />
DEPT<br />
Y 2.76 62.10 15.40 0.00 0.00 0.00 0.00 22.00 1.71 16,718 102.41 0.42 0.00 0.00 0.00 0.00 0.61<br />
MARION 6792 SUN COM OPERATING Y 0.11 89.76 3.63 0.00 0.00 0.00 1.00 5.60 0.10 747 134.42 0.00 0.00 0.00 0.00 0.00 0.01<br />
MARION 7849 MARION UTILITIES INC Y 0.16 100.00 0.00 0.00 0.00 0.00 0.00 0.00 0.16 1,282 125.25 0.00 0.00 0.00 0.00 0.00 0.00<br />
MARION 8005<br />
MARION 8020<br />
CENTURY FAIRFIELD<br />
VILLAGE LTD<br />
ASSOC OF MARION<br />
LANDING OWNERS, INC<br />
N 0.07 100.00 0.00 0.00 0.00 0.00 0.00 0.00 0.07 755 88.69 0.00 0.00 0.00 0.00 0.00 0.00<br />
Y 0.18 100.00 0.00 0.00 0.00 0.00 0.00 0.00 0.18 1,107 166.67 0.00 0.00 0.00 0.00 0.00 0.00<br />
MARION 8165 MARION CO UTILITIES Y 0.13 90.00 0.60 0.00 0.00 0.00 0.40 9.00 0.11 1,293 87.35 0.00 0.00 0.00 0.00 0.00 0.01<br />
MARION 8339 CITY OF DUNNELLON N 0.30 45.00 24.00 0.00 0.00 7.00 0.00 21.00 0.14 1,843 73.26 0.07 0.00 0.00 0.02 0.00 0.06<br />
MARION 8481<br />
MARION 9360<br />
MARION 11752<br />
MARION 12218<br />
MARION UTILITIES INC,<br />
SPRUCE CREEK DEV CO<br />
WINDSTREAM<br />
UTILITIES COMPANY<br />
MARION CO UTILITIES<br />
DEPT<br />
MARION CO UTILITIES<br />
DEPT<br />
Y 0.63 100.00 0.00 0.00 0.00 0.00 0.00 0.00 0.63 5,369 116.60 0.00 0.00 0.00 0.00 0.00 0.00<br />
Y 0.55 91.00 4.00 0.00 0.00 0.00 0.00 5.00 0.50 2,110 238.96 0.02 0.00 0.00 0.00 0.00 0.03<br />
Y 0.10 87.00 6.00 0.00 0.00 0.00 0.07 6.00 0.09 211 416.53 0.01 0.00 0.00 0.00 0.00 0.01<br />
Y 0.232* 94.00 0.50 0.00 4.50 0.00 0.20 0.50 0.218* 1,250* 174* 0.001* 0.000* 0.013* 0.000* 0.001* 0.001*<br />
<strong>Southwest</strong> <strong>Florida</strong> <strong>Water</strong> <strong>Management</strong> District Page | 84
<strong>2011</strong> ESTIMATED WATER USE REPORT<br />
TABLE A2. <strong>2011</strong> PUBLIC SUPPLY ANNUAL REPORT TOTAL USE AND RESIDENTIAL PER CAPITA<br />
County<br />
<strong>Water</strong><br />
<strong>Use</strong><br />
Permit<br />
Number Permittee Name(s)<br />
PSAR<br />
Rec.<br />
Y/N<br />
Gross<br />
<strong>Use</strong><br />
(mgd)<br />
(1)<br />
% RES<br />
(2)<br />
% I/C<br />
(3)<br />
%<br />
AG<br />
(4)<br />
%<br />
R/A<br />
(5)<br />
%<br />
GC<br />
(6)<br />
* The data for 12218 is combined into WUP No. 6151.<br />
%<br />
F&O<br />
(7)<br />
% WL<br />
(8)<br />
Resident.<br />
<strong>Use</strong><br />
(mgd)<br />
(9)<br />
Population<br />
Served<br />
(Funct.)<br />
(10)<br />
REPORTING MARION COUNTY PERMITS 10.57 8.51 67,682 125.73 0.79 0.00 0.00 0.03 0.06 1.14<br />
Resident.<br />
Per<br />
Capita<br />
(11)<br />
I/C<br />
<strong>Use</strong><br />
(mgd)<br />
(12)<br />
AG<br />
<strong>Use</strong><br />
(mgd)<br />
(13)<br />
R/A<br />
<strong>Use</strong><br />
(mgd)<br />
(14)<br />
GC <strong>Use</strong><br />
(mgd)<br />
(15)<br />
F & O<br />
<strong>Use</strong><br />
(mgd)<br />
(16)<br />
WL<br />
<strong>Use</strong><br />
(mgd)<br />
(17)<br />
PASCO 279 AQUA UTILITIES FL INC Y 0.25 77.04 4.46 0.00 0.00 0.00 0.00 18.50 0.19 3,311 58.07 0.01 0.00 0.00 0.00 0.00 0.05<br />
PASCO 540<br />
PASCO 543<br />
PASCO 590<br />
HOLIDAY GARDENS<br />
UTILITIES, INC.<br />
CRESTRIDGE UTILITY<br />
CORPORATION<br />
MAD HATTER UTILITY<br />
INC<br />
Y 0.07 81.00 3.00 0.00 0.00 0.00 11.00 5.00 0.05 991 54.61 0.00 0.00 0.00 0.00 0.01 0.00<br />
Y 0.08 84.00 0.00 0.00 0.00 0.00 8.70 7.30 0.06 1,325 48.31 0.00 0.00 0.00 0.00 0.01 0.01<br />
Y 0.86 82.00 13.60 0.00 0.00 0.00 3.40 1.00 0.71 7,364 96.12 0.12 0.00 0.00 0.00 0.03 0.01<br />
PASCO 964 C S WATER CO. INC. Y 0.08 95.78 4.07 0.15 0.00 0.00 0.00 0.00 0.07 869 83.01 0.00 0.00 0.00 0.00 0.00 0.00<br />
PASCO 1631 CITY OF DADE CITY Y 1.30 75.00 23.00 0.00 0.00 0.00 0.00 2.00 0.97 11,164 87.24 0.30 0.00 0.00 0.00 0.00 0.03<br />
PASCO 2043<br />
ORANGEWOOD LAKES<br />
MOBILE HOME<br />
Y 0.05 97.00 0.00 0.00 0.00 0.00 0.00 3.00 0.05 1,040 44.77 0.00 0.00 0.00 0.00 0.00 0.00<br />
COMMUNITY INC<br />
PASCO 2978 FL GOV UTILITY AUTH Y 0.62 86.00 2.88 0.00 0.00 0.00 1.00 10.10 0.53 5,711 92.93 0.02 0.00 0.00 0.00 0.01 0.06<br />
PASCO 3182 FL GOV UTILITY AUTH Y 2.76 75.59 10.33 0.00 0.00 0.00 4.46 9.48 2.09 29,198 71.51 0.29 0.00 0.00 0.00 0.12 0.26<br />
PASCO 3590 UTILITIES INC OF FL Y 0.13 100.00 0.00 0.00 0.00 0.00 0.00 0.00 0.13 2,130 59.25 0.00 0.00 0.00 0.00 0.00 0.00<br />
PASCO 3668 UTILITIES INC OF FL Y 0.17 98.00 0.00 0.00 2.00 0.00 0.00 0.00 0.16 3,148 52.39 0.00 0.00 0.00 0.00 0.00 0.00<br />
PASCO 3677 FL GOV UTILITY AUTH Y 0.09 90.72 1.45 0.00 0.00 0.00 1.00 6.82 0.08 1,593 50.27 0.00 0.00 0.00 0.00 0.00 0.01<br />
PASCO 3692 CITY OF PORT RICHEY Y 0.78 86.00 6.00 0.00 0.00 0.00 0.00 6.56 0.67 14,719 45.50 0.05 0.00 0.00 0.00 0.00 0.05<br />
PASCO 4550 CITY OF SAN ANTONIO Y 0.16 90.30 9.40 0.30 0.00 0.00 0.00 0.00 0.15 1,309 111.78 0.02 0.00 0.00 0.00 0.00 0.00<br />
PASCO 4668 UTILITIES INC OF FL Y 0.09 99.00 0.00 0.00 1.00 0.00 0.00 0.00 0.09 1,762 48.81 0.00 0.00 0.00 0.00 0.00 0.00<br />
PASCO 4669<br />
PASCO 4734<br />
HUDSON WATER<br />
WORKS INC<br />
CITY OF NEW PORT<br />
RICHEY<br />
Y 0.64 69.00 13.00 0.00 0.00 0.00 18.00 0.00 0.44 6,881 63.68 0.08 0.00 0.00 0.00 0.11 0.00<br />
Y 2.76 71.50 20.00 0.00 0.00 0.00 2.00 6.50 1.97 31,100 63.50 0.55 0.00 0.00 0.00 0.06 0.18<br />
PASCO 6040 CITY OF ZEPHYRHILLS Y 2.43 53.30 29.60 0.00 4.10 0.00 1.20 11.80 1.30 21,738 59.65 0.72 0.00 0.10 0.00 0.03 0.29<br />
PASCO 6867<br />
LABRADOR UTILITIES<br />
INC<br />
Y 0.07 100.00 0.00 0.00 0.00 0.00 0.00 0.13 0.07 1,631 40.41 0.00 0.00 0.00 0.00 0.00 0.00<br />
PASCO 7299 L W V UTILITIES INC N 0.08 97.00 0.00 0.00 0.00 0.00 1.00 2.00 0.07 889 82.94 0.00 0.00 0.00 0.00 0.00 0.00<br />
PASCO 7999 FL GOV UTILITY AUTH Y 0.12 97.40 0.00 0.00 0.00 0.00 1.00 1.59 0.12 1,914 62.70 0.00 0.00 0.00 0.00 0.00 0.00<br />
PASCO 8417 FL GOV UTILITY AUTH Y 0.35 87.93 6.38 0.00 0.00 0.00 1.00 4.66 0.31 7,307 42.68 0.02 0.00 0.00 0.00 0.00 0.02<br />
<strong>Southwest</strong> <strong>Florida</strong> <strong>Water</strong> <strong>Management</strong> District Page | 85
<strong>2011</strong> ESTIMATED WATER USE REPORT<br />
TABLE A2. <strong>2011</strong> PUBLIC SUPPLY ANNUAL REPORT TOTAL USE AND RESIDENTIAL PER CAPITA<br />
County<br />
<strong>Water</strong><br />
<strong>Use</strong><br />
Permit<br />
Number Permittee Name(s)<br />
PSAR<br />
Rec.<br />
Y/N<br />
Gross<br />
<strong>Use</strong><br />
(mgd)<br />
(1)<br />
% RES<br />
(2)<br />
% I/C<br />
(3)<br />
%<br />
AG<br />
(4)<br />
%<br />
R/A<br />
(5)<br />
%<br />
GC<br />
(6)<br />
%<br />
F&O<br />
(7)<br />
% WL<br />
(8)<br />
Resident.<br />
<strong>Use</strong><br />
(mgd)<br />
(9)<br />
Population<br />
Served<br />
(Funct.)<br />
(10)<br />
PASCO 8491 PARRISH PROP V LLC Y 0.02 100.00 0.00 0.00 0.00 0.00 0.00 0.00 0.02 958 23.07 0.00 0.00 0.00 0.00 0.00 0.00<br />
PASCO 11863 PASCO CO UTILITIES Y 27.33 68.41 7.77 0.00 2.88 0.00 12.66 8.20 18.70 212,260 88.08 2.12 0.00 0.79 0.00 3.46 2.24<br />
Resident.<br />
Per<br />
Capita<br />
(11)<br />
I/C<br />
<strong>Use</strong><br />
(mgd)<br />
(12)<br />
AG<br />
<strong>Use</strong><br />
(mgd)<br />
(13)<br />
R/A<br />
<strong>Use</strong><br />
(mgd)<br />
(14)<br />
GC <strong>Use</strong><br />
(mgd)<br />
(15)<br />
F & O<br />
<strong>Use</strong><br />
(mgd)<br />
(16)<br />
WL<br />
<strong>Use</strong><br />
(mgd)<br />
(17)<br />
REPORTING PASCO COUNTY PERMITS 41.27 29.00 370,313 78.32 4.30 0.00 0.89 0.00 3.84 3.20<br />
PINELLAS 742<br />
CITY OF TARPON<br />
SPRINGS<br />
Y 2.19 77.00 17.00 0.00 6.00 0.00 0.16 0.00 1.69 30,355 55.53 0.37 0.00 0.13 0.00 0.00 0.00<br />
PINELLAS 2980 CITY OF DUNEDIN Y 3.33 73.10 17.94 0.00 0.30 0.00 0.16 8.49 2.43 39,910 60.98 0.60 0.00 0.01 0.00 0.01 0.28<br />
PINELLAS 2981 CITY OF CLEARWATER Y 10.73 64.60 23.20 0.00 0.00 0.00 8.60 3.90 6.93 122,709 56.49 2.49 0.00 0.00 0.00 0.92 0.42<br />
PINELLAS 7692 TOWN OF BELLEAIR Y 0.73 83.30 2.00 0.00 4.39 0.00 7.34 3.00 0.61 6,013 100.99 0.01 0.00 0.03 0.00 0.05 0.02<br />
PINELLAS 10350 UTILITIES INC OF FL Y 0.05<br />
100.0<br />
0<br />
0.00 0.00 0.00 0.00 0.00 0.00 0.05 826 60.66 0.00 0.00 0.00 0.00 0.00 0.00<br />
PINELLAS 10795 CITY OF GULFPORT Y 0.98 83.58 10.58 0.00 0.00 0.00 0.64 5.20 0.82 14,393 56.63 0.10 0.00 0.00 0.00 0.01 0.05<br />
PINELLAS 11218 CITY OF OLDSMAR Y 1.36 60.35 27.26 0.00 0.00 0.00 2.30 10.09 0.82 15,369 53.58 0.37 0.00 0.00 0.00 0.03 0.14<br />
PINELLAS 11245<br />
CITY OF SAFETY<br />
HARBOR<br />
N 1.35 66.00 28.00 0.00 0.00 0.00 4.00 2.00 0.89 15,316 58.03 0.38 0.00 0.00 0.00 0.05 0.03<br />
PINELLAS 12351<br />
CITY OF PINELLAS<br />
PARK<br />
Y 4.28 70.00 26.70 0.00 0.00 0.00 1.00 2.30 3.00 74,767 40.07 1.14 0.00 0.00 0.00 0.04 0.10<br />
PINELLAS 20142 PINELLAS COUNTY Y 37.79 72.70 18.90 0.00 0.00 0.00 0.20 8.20 27.47 466,139 58.94 7.14 0.00 0.00 0.00 0.08 3.10<br />
PINELLAS 20143<br />
CITY OF ST.<br />
PETERSBURG<br />
Y 25.98 64.28 23.45 0.00 0.00 0.00 6.27 6.00 16.70 271,838 61.44 6.09 0.00 0.00 0.00 1.63 1.56<br />
REPORTING PINELLAS COUNTY PERMITS 88.77 61.41 1,057,634 58.06 18.70 0.00 0.17 0.00 2.82 5.69<br />
POLK 341 CITY OF BARTOW Y 2.34 62.47 30.60 0.00 4.06 0.00 0.00 2.76 1.46 21,395 68.29 0.72 0.00 0.09 0.00 0.00 0.06<br />
POLK 645 CITY OF FORT MEADE Y 0.54 68.00 32.00 0.00 0.00 0.00 0.00 0.00 0.37 5,659 65.39 0.17 0.00 0.00 0.00 0.00 0.00<br />
POLK 1616<br />
POLK 1625<br />
POLK 2332<br />
POLK 3415<br />
LAKE REGION MOBILE<br />
HOME OWNERS INC<br />
FOUR LAKES GOLF<br />
CLUB LTD<br />
TOWN OF LAKE<br />
HAMILTON<br />
ORCHID SPRINGS<br />
DEVELOPMENT CORP<br />
N 0.10 98.00 1.00 0.00 0.00 0.00 0.00 1.00 0.09 666 139.79 0.00 0.00 0.00 0.00 0.00 0.00<br />
Y 0.42 62.00 0.00 0.00 0.00 38.00 0.01 0.01 0.26 1,494 173.88 0.00 0.00 0.00 0.16 0.00 0.00<br />
Y 0.22 84.71 14.00 0.00 0.00 0.00 0.30 1.00 0.19 1,712 108.17 0.03 0.00 0.00 0.00 0.00 0.00<br />
Y 0.07 96.88 3.12 0.00 0.00 0.00 0.00 0.00 0.07 910 75.55 0.00 0.00 0.00 0.00 0.00 0.00<br />
<strong>Southwest</strong> <strong>Florida</strong> <strong>Water</strong> <strong>Management</strong> District Page | 86
<strong>2011</strong> ESTIMATED WATER USE REPORT<br />
TABLE A2. <strong>2011</strong> PUBLIC SUPPLY ANNUAL REPORT TOTAL USE AND RESIDENTIAL PER CAPITA<br />
County<br />
POLK 4005<br />
POLK 4607<br />
<strong>Water</strong><br />
<strong>Use</strong><br />
Permit<br />
Number Permittee Name(s)<br />
CROOKED LAKE PARK<br />
WATER COMPANY<br />
CITY OF WINTER<br />
HAVEN<br />
PSAR<br />
Rec.<br />
Y/N<br />
Gross<br />
<strong>Use</strong><br />
(mgd)<br />
(1)<br />
% RES<br />
(2)<br />
% I/C<br />
(3)<br />
%<br />
AG<br />
(4)<br />
%<br />
R/A<br />
(5)<br />
%<br />
GC<br />
(6)<br />
%<br />
F&O<br />
(7)<br />
% WL<br />
(8)<br />
Resident.<br />
<strong>Use</strong><br />
(mgd)<br />
(9)<br />
Population<br />
Served<br />
(Funct.)<br />
(10)<br />
Resident.<br />
Per<br />
Capita<br />
(11)<br />
Y 0.23 65.28 31.62 0.00 0.00 0.00 1.53 1.89 0.15 2,544 58.72 0.07 0.00 0.00 0.00 0.00 0.00<br />
Y 8.45 61.00 18.00 0.00 9.00 0.00 1.00 11.00 5.16 67,066 76.87 1.52 0.00 0.76 0.00 0.08 0.93<br />
POLK 4658 CITY OF LAKE WALES Y 2.55 68.10 13.70 0.00 1.90 0.00 7.10 9.20 1.74 20,909 83.00 0.35 0.00 0.05 0.00 0.18 0.23<br />
POLK 4912<br />
POLK 5251<br />
CITY OF LAKELAND<br />
WATER UTILITIES<br />
GRENELEFE RESORT<br />
LLC<br />
Y 21.31 66.44 23.25 0.00 2.27 0.05 0.28 7.72 14.16 167,777 84.38 4.95 0.00 0.48 0.01 0.06 1.65<br />
Y 0.99 12.42 1.80 0.00 24.27 58.14 0.00 3.00 0.12 1,872 65.75 0.02 0.00 0.24 0.58 0.00 0.03<br />
POLK 5750 CITY OF DAVENPORT Y 0.45 84.72 4.92 0.00 2.61 0.00 0.00 7.53 0.38 4,929 77.14 0.02 0.00 0.01 0.00 0.00 0.03<br />
POLK 5870 CITY OF FROSTPROOF Y 0.33 52.00 25.00 4.00 1.00 0.00 12.00 6.00 0.17 2,983 57.00 0.08 0.01 0.00 0.00 0.04 0.02<br />
POLK 5893<br />
TOWN OF DUNDEE<br />
PUBLIC WORKS DEPT<br />
Y 0.54 54.00 26.30 0.00 4.00 0.00 9.60 6.10 0.29 5,048 57.52 0.14 0.00 0.02 0.00 0.05 0.03<br />
POLK 6124 CITY OF MULBERRY Y 0.46 86.00 13.00 0.00 0.00 0.00 0.50 0.50 0.39 4,826 81.08 0.06 0.00 0.00 0.00 0.00 0.00<br />
POLK 6174<br />
SADDLEBAG LAKE<br />
OWNERS ASSOC INC.<br />
Y 0.08 78.80 0.00 0.00 0.00 0.00 0.00 21.20 0.07 1,340 49.09 0.00 0.00 0.00 0.00 0.00 0.02<br />
POLK 6505 POLK CO BOCC UTIL DIV Y 2.95 83.41 5.11 0.00 0.00 0.00 2.40 9.08 2.46 30,534 80.63 0.15 0.00 0.00 0.00 0.07 0.27<br />
POLK 6506 POLK CO BOCC UTIL DIV Y 3.37 92.07 3.73 0.00 0.00 0.00 1.69 2.52 3.11 39,230 79.17 0.13 0.00 0.00 0.00 0.06 0.09<br />
POLK 6507 POLK CO BOCC UTIL DIV Y 0.95 84.44 7.12 0.00 0.00 0.00 3.09 5.36 0.80 13,779 58.26 0.07 0.00 0.00 0.00 0.03 0.05<br />
POLK 6508 POLK CO BOCC UTIL DIV Y 0.48 51.09 37.67 0.00 0.00 0.00 5.66 5.57 0.25 4,674 52.66 0.18 0.00 0.00 0.00 0.03 0.03<br />
POLK 6509 POLK CO BOCC UTIL DIV Y 7.00 81.90 6.39 0.00 0.00 0.00 2.86 8.86 5.74 53,256 107.71 0.45 0.00 0.00 0.00 0.20 0.62<br />
POLK 6624 CITY OF LAKE ALFRED Y 0.95 95.00 3.00 0.00 1.00 0.00 0.00 1.00 0.90 6,595 137.15 0.03 0.00 0.01 0.00 0.00 0.01<br />
POLK 6920 CITY OF EAGLE LAKE Y 0.36 93.00 6.00 0.00 1.00 0.00 0.00 0.00 0.34 3,227 104.41 0.02 0.00 0.00 0.00 0.00 0.00<br />
POLK 7119 CITY OF AUBURNDALE Y 4.47 47.60 31.30 0.00 9.10 0.00 0.01 12.00 2.13 26,073 81.54 1.40 0.00 0.41 0.00 0.00 0.54<br />
POLK 7187<br />
CHC VII LTD CENTURY<br />
REALTY FUND<br />
Y 0.39 54.00 0.00 0.00 0.00 0.00 46.00 0.00 0.21 1,694 122.98 0.00 0.00 0.00 0.00 0.18 0.00<br />
POLK 7328<br />
CAREFREE RV CC OF<br />
WINTER HAVEN INC<br />
Y 0.13 55.00 0.00 0.00 0.00 44.00 0.00 0.00 0.07 1,058 67.55 0.00 0.00 0.00 0.06 0.00 0.00<br />
POLK 7653<br />
ORANGE HILL/SUGAR<br />
CREEK<br />
Y 0.04 93.10 0.00 0.00 0.00 0.00 0.00 6.90 0.03 687 48.99 0.00 0.00 0.00 0.00 0.00 0.00<br />
POLK 7878 AQUA UTILITIES FL INC Y 0.15 81.82 4.11 0.00 0.00 0.00 0.00 13.11 0.13 2,015 62.53 0.01 0.00 0.00 0.00 0.00 0.02<br />
POLK 8054 POLK CO BOCC UTIL DIV Y 0.52 63.52 2.35 0.00 0.00 0.00 1.50 32.63 0.33 5,995 54.72 0.01 0.00 0.00 0.00 0.01 0.17<br />
POLK 8344 S V UTILITIES LTD Y 0.20 99.98 0.00 0.00 0.00 0.00 0.00 0.01 0.20 1,420 140.69 0.00 0.00 0.00 0.00 0.00 0.00<br />
POLK 8468 CITY OF POLK CITY Y 0.34 94.00 6.00 0.00 0.00 0.00 0.00 0.00 0.32 5,894 54.00 0.02 0.00 0.00 0.00 0.00 0.00<br />
I/C<br />
<strong>Use</strong><br />
(mgd)<br />
(12)<br />
AG<br />
<strong>Use</strong><br />
(mgd)<br />
(13)<br />
R/A<br />
<strong>Use</strong><br />
(mgd)<br />
(14)<br />
GC <strong>Use</strong><br />
(mgd)<br />
(15)<br />
F & O<br />
<strong>Use</strong><br />
(mgd)<br />
(16)<br />
WL<br />
<strong>Use</strong><br />
(mgd)<br />
(17)<br />
<strong>Southwest</strong> <strong>Florida</strong> <strong>Water</strong> <strong>Management</strong> District Page | 87
<strong>2011</strong> ESTIMATED WATER USE REPORT<br />
TABLE A2. <strong>2011</strong> PUBLIC SUPPLY ANNUAL REPORT TOTAL USE AND RESIDENTIAL PER CAPITA<br />
County<br />
<strong>Water</strong><br />
<strong>Use</strong><br />
Permit<br />
Number Permittee Name(s)<br />
PSAR<br />
Rec.<br />
Y/N<br />
Gross<br />
<strong>Use</strong><br />
(mgd)<br />
(1)<br />
% RES<br />
(2)<br />
% I/C<br />
(3)<br />
%<br />
AG<br />
(4)<br />
%<br />
R/A<br />
(5)<br />
%<br />
GC<br />
(6)<br />
%<br />
F&O<br />
(7)<br />
% WL<br />
(8)<br />
Resident.<br />
<strong>Use</strong><br />
(mgd)<br />
(9)<br />
Population<br />
Served<br />
(Funct.)<br />
(10)<br />
POLK 8522 CITY OF HAINES CITY Y 3.45 92.00 4.79 0.70 0.90 0.00 0.01 1.60 3.17 30,223 104.91 0.17 0.02 0.03 0.00 0.00 0.06<br />
Resident.<br />
Per<br />
Capita<br />
(11)<br />
I/C<br />
<strong>Use</strong><br />
(mgd)<br />
(12)<br />
AG<br />
<strong>Use</strong><br />
(mgd)<br />
(13)<br />
R/A<br />
<strong>Use</strong><br />
(mgd)<br />
(14)<br />
GC <strong>Use</strong><br />
(mgd)<br />
(15)<br />
F & O<br />
<strong>Use</strong><br />
(mgd)<br />
(16)<br />
WL<br />
<strong>Use</strong><br />
(mgd)<br />
(17)<br />
POLK 8753<br />
POLK 8967<br />
POLK 10141<br />
PLANTATION<br />
LANDINGS LTD<br />
SWEETWATER<br />
COMMUNITY INC<br />
POLK COUNTY<br />
BOCC/UTILITIES DIV.<br />
Y 0.07 99.67 0.00 0.00 0.00 0.00 0.08 0.25 0.07 719 90.88 0.00 0.00 0.00 0.00 0.00 0.00<br />
Y 0.14 80.00 0.00 0.00 0.00 20.00 0.00 0.00 0.11 720 153.33 0.00 0.00 0.00 0.03 0.00 0.00<br />
Y 0.00 0.00 NA NA NA NA NA NA 0.00 NA NA NA NA NA NA NA NA<br />
POLK 12800 JORDANS GROVE LLC Y 0.00 0.00 NA NA NA NA NA NA 0.00 0 NA NA NA NA NA NA NA<br />
POLK 12964<br />
POLK 13043<br />
ALAFIA PRESERVE LLC,<br />
EAGLE RIDGE LLC,<br />
DONALDSON KNOLL LLC<br />
CYPRESS LAKES<br />
UTILITIES INC<br />
Y 0.00 NA NA NA NA NA NA NA NA 0 NA NA NA NA NA NA NA<br />
Y 0.13 100.00 0.00 0.00 0.00 0.00 0.00 0.00 0.13 3,129 42.96 0.00 0.00 0.00 0.00 0.00 0.00<br />
REPORTING POLK COUNTY PERMITS 65.15 45.54 542,052 84.02 10.77 0.04 2.12 0.83 0.99 4.86<br />
SARASOTA 2923 CITY OF NORTH PORT Y 3.06 67.67 11.50 0.00 0.00 0.00 19.36 1.46 2.07 44,323 46.72 0.35 0.00 0.00 0.00 0.59 0.04<br />
SARASOTA 4318<br />
SARASOTA 4866<br />
CITY OF SARSOTA<br />
PUBLIC WORKS<br />
ENGLEWOOD WATER<br />
DISTRICT<br />
Y 6.14 52.33 37.39 0.00 0.00 0.00 0.42 9.86 3.21 77,444 41.51 2.30 0.00 0.00 0.00 0.03 0.61<br />
Y 2.67 77.00 13.00 0.00 0.49 0.00 0.00 9.00 2.05 34,413 59.65 0.35 0.00 0.01 0.00 0.00 0.24<br />
SARASOTA 5393 CITY OF VENICE Y 1.96 69.63 30.37 0.00 0.00 0.00 0.00 0.00 1.37 29,924 45.70 0.60 0.00 0.00 0.00 0.00 0.00<br />
SARASOTA 5807<br />
SARASOTA 7448<br />
CAMELOT COMMUNITIES<br />
MHP, LLC<br />
ROYALTY RESORT<br />
CORPORATION<br />
Y 0.22 100.00 0.00 0.00 0.00 0.00 0.00 0.00 0.22 1,668 132.53 0.00 0.00 0.00 0.00 0.00 0.00<br />
Y 0.09 100.00 0.00 0.00 0.00 0.00 0.00 0.00 0.09 3,198 28.67 0.00 0.00 0.00 0.00 0.00 0.00<br />
SARASOTA 8836 SARASOTA CO BOCC Y 16.47 75.02 14.86 0.00 0.00 0.00 0.16 9.96 12.36 209,043 59.12 2.45 0.00 0.00 0.00 0.03 1.64<br />
SARASOTA 9638 PALMER ENTERPRISES Y 0.00 0.00 0.00 0.00 0.00 0.00 0.00 0.00 0.00 0 NA 0.00 0.00 0.00 0.00 0.00 0.00<br />
REPORTING SARASOTA COUNTY PERMITS 30.62 21.38 400,013 53.44 6.04 0.00 0.01 0.00 0.64 2.53<br />
SUMTER 1368<br />
SUMTER 2622<br />
LAKE PANASOFFKEE<br />
WATER ASSOC INC<br />
CONTINENTAL<br />
COUNTRY CLUB RD INC<br />
Y 0.24 87.60 12.40 0.00 0.00 0.00 0.00 0.00 0.21 3,724 57.21 0.03 0.00 0.00 0.00 0.00 0.00<br />
Y 0.42 38.12 3.72 0.03 0.38 53.71 0.00 4.05 0.16 1,640 97.86 0.02 0.00 0.00 0.23 0.00 0.02<br />
<strong>Southwest</strong> <strong>Florida</strong> <strong>Water</strong> <strong>Management</strong> District Page | 88
<strong>2011</strong> ESTIMATED WATER USE REPORT<br />
TABLE A2. <strong>2011</strong> PUBLIC SUPPLY ANNUAL REPORT TOTAL USE AND RESIDENTIAL PER CAPITA<br />
County<br />
<strong>Water</strong><br />
<strong>Use</strong><br />
Permit<br />
Number Permittee Name(s)<br />
PSAR<br />
Rec.<br />
Y/N<br />
Gross<br />
<strong>Use</strong><br />
(mgd)<br />
(1)<br />
% RES<br />
(2)<br />
% I/C<br />
(3)<br />
%<br />
AG<br />
(4)<br />
%<br />
R/A<br />
(5)<br />
%<br />
GC<br />
(6)<br />
%<br />
F&O<br />
(7)<br />
% WL<br />
(8)<br />
Resident.<br />
<strong>Use</strong><br />
(mgd)<br />
(9)<br />
Population<br />
Served<br />
(Funct.)<br />
(10)<br />
SUMTER 6519 CITY OF BUSHNELL Y 0.36 26.00 58.50 0.00 0.00 0.00 5.50 10.00 0.09 2,644 35.87 0.21 0.00 0.00 0.00 0.02 0.04<br />
SUMTER 7185 CITY OF WEBSTER Y 0.09 57.00 25.00 0.00 0.00 0.00 13.50 4.50 0.05 1,035 47.91 0.02 0.00 0.00 0.00 0.01 0.00<br />
SUMTER 7799 CEDAR ACRES, INC. N 0.01 86.00 8.00 0.00 0.00 0.00 1.00 5.00 0.01 729 7.08 0.00 0.00 0.00 0.00 0.00 0.00<br />
SUMTER 8135<br />
CITY OF WILDWOOD<br />
CITY MNG<br />
Resident.<br />
Per<br />
Capita<br />
(11)<br />
Y 2.05 22.80 66.30 0.00 3.10 0.00 4.20 3.70 0.47 15,269 30.57 1.36 0.00 0.06 0.00 0.09 0.08<br />
SUMTER 13005 VILLAGE CENTER CDD Y 17.70 74.20 2.48 0.00 14.97 0.00 1.93 6.42 13.13 59,588 220.40 0.44 0.00 2.65 0.00 0.34 1.14<br />
SUMTER 13123<br />
MADISON FLORIDA<br />
GRANDE, LLC<br />
N 0.02 100.00 0.00 0.00 0.00 0.00 0.00 0.00 0.02 NA NA 0.00 0.00 0.00 0.00 0.00 0.00<br />
REPORTING SUMTER COUNTY PERMITS 20.89 11.70 84,629 138.24 2.00 0.00 2.22 0.23 0.40 1.06<br />
I/C<br />
<strong>Use</strong><br />
(mgd)<br />
(12)<br />
AG<br />
<strong>Use</strong><br />
(mgd)<br />
(13)<br />
R/A<br />
<strong>Use</strong><br />
(mgd)<br />
(14)<br />
GC <strong>Use</strong><br />
(mgd)<br />
(15)<br />
F & O<br />
<strong>Use</strong><br />
(mgd)<br />
(16)<br />
WL<br />
<strong>Use</strong><br />
(mgd)<br />
(17)<br />
DISTRICT TOTALS & AVERAGES FOR REPORTING PERMITS 479.48 335.66 4,723,874 71.06 84.77 0.08 8.40 1.09 15.22 35.55<br />
NOTES:<br />
(GPCD)<br />
(MGD)<br />
PSAR<br />
RECEIVED<br />
GALLONS PER CAPITA PER DAY<br />
MILLION GALLONS PER DAY<br />
Public Supply Annual Report was received.<br />
<strong>Southwest</strong> <strong>Florida</strong> <strong>Water</strong> <strong>Management</strong> District Page | 89
<strong>2011</strong> ESTIMATED WATER USE REPORT<br />
PSAR NOT<br />
RECEIVED<br />
Public Supply Annual Report was not received. Withdrawal amount was metered and gpd was calculated from the District Database. Population served is based on 2010 dwelling units (if<br />
available) or 2010 Census households.<br />
The totals for Gross <strong>Use</strong>, Population Served, and Gross Per Capita listed in Table A‐2 will not match those listed in Table A‐1. This is because not all of the permittees are listed in Table A‐2, either they have<br />
never submitted Part B of the PSAR form, or they only export water wholesale to other public supply utilities.<br />
(1) Gross <strong>Use</strong> is taken directly from Table A‐1, column 10, and represents the total amount of water withdrawn plus imports minus exports and treatment loss.<br />
(2) Percent of water supplied that is used for residential purposes only.<br />
(3) Percent of water supplied that is used for industrial/commercial purposes only.<br />
(4) Percent of water supplied that is used for agricultural purposes only.<br />
(5) Percent of water supplied that is used for recreational/aesthetic purposes only.<br />
(6) Percent of water supplied that is used for Golf Course irrigation only.<br />
(7) Percent of water supplied that is used for fire fighting, line flushing, and other accountable (F&O) purposes only.<br />
(8) Percent of water supplied that is considered lost or unaccounted for due to system leaks, illegal connections, etc.<br />
(9) Residential <strong>Use</strong> = (Gross <strong>Use</strong>) X (% Residential). This number represents the total amount of water that is used for residential purposes only.<br />
(10) Population Served is taken directly from Table A‐1, column 11, and represents the served population for the permittee listed.<br />
(11) (Residential per capita = (residential water use) / (population served). This number represents the average quantity of water used per person per day for residential ses only.<br />
(12) I/C <strong>Use</strong> (Industrial/Commercial <strong>Water</strong> <strong>Use</strong>) = (Gross <strong>Use</strong>) X (% I/C). This number represents the amount of Public Supply water that is used for Industrial/Commercial purposes only.<br />
(13) AG <strong>Use</strong> (Agriculture <strong>Use</strong>) = (Gross <strong>Use</strong>) X (% AG). This number represents the amount of Public Supply water that is used for Agriculture purposes only.<br />
(14) REC/AES <strong>Use</strong> (Recreational/Aesthetic <strong>Use</strong>) = (Gross <strong>Use</strong>) X (% REC/AES). This number represents the amount of Public Supply water that is used for Recreational purposes only.<br />
(15) GC <strong>Use</strong> (Golf Course <strong>Use</strong>) = (Gross <strong>Use</strong>) X (% GC). This number represents the amount of Public Supply water that is used for Golf Course purposes only.<br />
(16) F & O <strong>Use</strong> (Fire and Other) = (Gross <strong>Use</strong> ) X (% F&O). This number represents the amont of Public Supply <strong>Water</strong> that is used for Fire Supply and Other purposes only.<br />
(17) WL (<strong>Water</strong> Loss) = (Gross <strong>Use</strong>) X (% WL). This number represents the amount of water that is lost or unaccounted for each day by the permittee listed.<br />
<strong>Southwest</strong> <strong>Florida</strong> <strong>Water</strong> <strong>Management</strong> District Page | 90
<strong>2011</strong> ESTIMATED WATER USE REPORT<br />
Table A3. This table shows the transfers of water among and between public supply permittees in the District as well as to communities outside of<br />
the District. The chart is organized by county into which water is imported. The quantity imported is given, and the identity of the exporter in the<br />
same county is read across the chart. Note, there are cross‐county transfers, so individual permittees will be listed more than once if appropriate. If<br />
the importing community did not need a wholesale water use permit, the Importing WUP number is shown as “NA”.<br />
TABLE A3. <strong>2011</strong> PUBLIC SUPPLY ANNUAL REPORT PERMIT TO PERMIT WATER TRANSFERS<br />
Importing<br />
County<br />
Importing<br />
WUP #<br />
Import Details (Destinations)<br />
Importer<br />
Permittee Name<br />
Imported<br />
Quantity<br />
(mgd)<br />
Exporting<br />
County<br />
Exporting<br />
WUP #<br />
Export Details (Sources)<br />
Exporter<br />
Permittee Name<br />
Exported<br />
Quantity<br />
(mgd)<br />
Charlotte 718 Gasparilla Island 0.034 Charlotte 7104 Charlotte County 0.034<br />
Charlotte 1512 Charlotte Harbor <strong>Water</strong> Assoc. 0.000 Charlotte 7104 Charlotte County 0.000<br />
Charlotte 7104 Charlotte County 9.964 Desoto 10420 PRMRWSA ‐ DeSoto Portion 9.964<br />
Charlotte NA El Jobean <strong>Water</strong> Assoc. 0.018 Charlotte 7104 Charlotte County 0.018<br />
Charlotte NA Riverwood Development Inc 0.111 Charlotte 7104 Charlotte County 0.111<br />
Charlotte NA Encore Super Park Port Charlotte 0.021 Charlotte 7104 Charlotte County 0.021<br />
Total Charlotte County Imports: 10.148 Total Exports To Charlotte County 10.148<br />
Citrus NA Forest Hills 0.016 Citrus 7121 Citrus Co/WRWSA ‐ Charles A. Black 0.016<br />
Citrus 20230 Ozello <strong>Water</strong> Association 0.464 Citrus 7121 Citrus Co/WRWSA ‐ Charles A. Black 0.464<br />
Total Citrus County Imports: 0.480 Total Exports To Citrus County 0.480<br />
DeSoto 6841 DeSoto County Utilties 0.607 DeSoto 10420 PRMRWSA ‐ DeSoto Portion 0.607<br />
DeSoto 10420 PRMRWSA ‐ DeSoto Portion 0.013 Charlotte 4866 Englewood <strong>Water</strong> Dist. 0.013<br />
Total Desoto County Imports: 0.620 Total Exports To Desoto County 0.620<br />
Hardee 13026 Hardee County BOCC 0.040 Hardee 4461 City of Wauchula 0.040<br />
Total Hardee County Imports: 0.040 Total Exports To Hardee County 0.040<br />
Hillsborough 1776 Plant City 0.005 Polk 4912 City of Lakeland 0.005<br />
Hillsborough 2062 City of Tampa 3.477 Hillsborough 11771 Tampa Bay <strong>Water</strong> Consolidated 3.477<br />
Hillsborough 11771 Tampa Bay <strong>Water</strong> Consolidated 1.096 Hillsborough 2062 City of Tampa 1.096<br />
Hillsborough 11771 Tampa Bay <strong>Water</strong> Consolidated 0.183 Hillsborough 6312 Tampa Bay <strong>Water</strong> / Eagles 0.183<br />
Hillsborough 11771 Tampa Bay <strong>Water</strong> Consolidated 4.192 Hillsborough 11732 Tampa Bay <strong>Water</strong> / Brandon Urban WF 4.192<br />
Hillsborough 11771 Tampa Bay <strong>Water</strong> Consolidated 7.186 Hillsborough 11794 Tampa Bay <strong>Water</strong> / Alafia River 7.186<br />
<strong>Southwest</strong> <strong>Florida</strong> <strong>Water</strong> <strong>Management</strong> District Page | 91
<strong>2011</strong> ESTIMATED WATER USE REPORT<br />
TABLE A3. <strong>2011</strong> PUBLIC SUPPLY ANNUAL REPORT PERMIT TO PERMIT WATER TRANSFERS<br />
Importing<br />
County<br />
Importing<br />
WUP #<br />
Import Details (Destinations)<br />
Importer<br />
Permittee Name<br />
Imported<br />
Quantity<br />
(mgd)<br />
Exporting<br />
County<br />
Exporting<br />
WUP #<br />
Export Details (Sources)<br />
Exporter<br />
Permittee Name<br />
Exported<br />
Quantity<br />
(mgd)<br />
Hillsborough 11771 Tampa Bay <strong>Water</strong> Consolidated 43.680 Hillsborough 11796 Tampa Bay <strong>Water</strong> / Bypass Canal 43.680<br />
Hillsborough 11771 Tampa Bay <strong>Water</strong> Consolidated 3.712 Hillsborough 11796 Desalination Effluent 3.712<br />
Hillsborough 12994 Pebble Creek Utilities 0.424 Hillsborough 2062 City of Tampa 0.424<br />
Hillsborough 20141 Hillsborough County 0.784 Hillsborough 2062 City of Tampa 0.784<br />
Hillsborough 20141 Hillsborough County 0.041 Hillsborough 1776 Plant City 0.041<br />
Hillsborough 20141 Hillsborough County 22.225 Hillsborough 4352<br />
Tampa Bay <strong>Water</strong> / Hills. Co. South.<br />
Central<br />
22.225<br />
Hillsborough 20141 Hillsborough County 28.723 Hillsborough 11771 Tampa Bay <strong>Water</strong> Consolidated 28.723<br />
Total Hillsborough County Imports: 115.726 Total Exports To Hillsborough County 115.726<br />
Manatee 5387 Manatee County 0.924 Manatee 7345 Mosaic / Manatee County 0.924<br />
Manatee 5387 Manatee County 12.748 Manatee 7471 Manatee County / East Wellfield 12.748<br />
Manatee 5387 Manatee County 0.013 Manatee 6392 City of Bradenton 0.013<br />
Manatee 6392 City of Bradenton 0.192 Manatee 5387 Manatee County 0.192<br />
Manatee 7345 Mosaic / Manatee County 1.088 Manatee 5387 ASR System 1.088<br />
Manatee 10963 Longboat Key 1.658 Manatee 5387 Manatee County 1.658<br />
Manatee 12443 City of Palmetto 1.265 Manatee 5387 Manatee County 1.265<br />
Total Manatee County Imports: 17.888 Total Exports To Manatee County 17.888<br />
Pasco 279 Jasmine Lakes 0.000 Pasco 11863 Pasco County Utilities 0.000<br />
Pasco 3182 FGUA / Seven Springs <strong>Water</strong> 0.199 Pasco 11863 Pasco County Utilities 0.199<br />
Pasco 3677 Colonial Manor 0.094 Pasco 11863 Pasco County Utilities 0.094<br />
Pasco 3677 FGUA / Colonial Manor 0.089 Pasco 11863 Pasco County Utilities 0.089<br />
Pasco 4734 City of New Port Richey 4.406 Pasco 11771 Tampa Bay <strong>Water</strong> Consolidated 4.406<br />
Pasco 7745 Virginia City 0.000 Pasco 11863 Pasco County Utilities 0.000<br />
Pasco 8417 FGUA/ Aloha Gardens 0.286 Pasco 11863 Pasco County Utilities 0.286<br />
Pasco 11771 Tampa Bay <strong>Water</strong> Consolidated 1.199 Pasco 4734 City of New Port Richey 1.199<br />
Pasco 11863 Pasco County Utilities 23.601 Pasco 11771 Tampa Bay <strong>Water</strong> Consolidated 23.601<br />
Pasco NA Orchid Lake 0.017 Pasco 11863 Pasco County Utilities 0.017<br />
<strong>Southwest</strong> <strong>Florida</strong> <strong>Water</strong> <strong>Management</strong> District Page | 92
<strong>2011</strong> ESTIMATED WATER USE REPORT<br />
TABLE A3. <strong>2011</strong> PUBLIC SUPPLY ANNUAL REPORT PERMIT TO PERMIT WATER TRANSFERS<br />
Importing<br />
County<br />
Importing<br />
WUP #<br />
Import Details (Destinations)<br />
Importer<br />
Permittee Name<br />
Imported<br />
Quantity<br />
(mgd)<br />
Exporting<br />
County<br />
Exporting<br />
WUP #<br />
Export Details (Sources)<br />
Exporter<br />
Permittee Name<br />
<strong>Southwest</strong> <strong>Florida</strong> <strong>Water</strong> <strong>Management</strong> District Page | 93<br />
Exported<br />
Quantity<br />
(mgd)<br />
Pasco 540 Aqua Utilities 0.143 Pasco 11863 Pasco County Utilities 0.143<br />
Pasco N/A Aripeka West 0.007 Pasco 11863 Pasco County Utilities 0.007<br />
Pasco 8417 FGUA Interconnect 0.012 Pasco 11863 Pasco County Utilities 0.012<br />
Pasco N/A Shalimar 0.015 Pasco 11863 Pasco County Utilities 0.015<br />
Pasco N/A Silver Fox Utilities 0.010 Pasco 11863 Pasco County Utilities 0.010<br />
Pasco N/A Tropical Acres 0.022 Pasco 11863 Pasco County Utilities 0.022<br />
Total Pasco County Imports: 30.100 Total Exports To Manatee County 30.100<br />
Pinellas 742 City of Tarpon Springs 1.733 Pinellas 20142 Pinellas County Utilities 1.733<br />
Pinellas 2319 Holiday Utilities/Fgua 0.042 Pinellas 742 City of Tarpon Springs 0.042<br />
Pinellas 2981 City of Clearwater 6.371 Pinellas 20142 Pinellas County Utilities 6.371<br />
Pinellas 7692 Town of Belleair 0.0001 Pinellas 20142 Pinellas County Utilities 0.0001<br />
Pinellas 10795 City of Gulfport 0.975 Pinellas 20143 City of St. Petersburg 0.975<br />
Pinellas 10350 Utilities Of <strong>Florida</strong>/Lake Tarpon MHP 0.0003 Pinellas 20142 Pinellas County Utilities 0.0003<br />
Pinellas 11218 City of Oldsmar 1.364 Pinellas 20142 Pinellas County Utilities 1.364<br />
Pinellas 11245 City of Safety Harbor 1.347 Pinellas 20142 Pinellas County Utilities 1.347<br />
Pinellas 12351 City of Pinellas Park 4.268 Pinellas 20142 Pinellas County Utilities 4.268<br />
Pinellas 12351 City of Pinellas Park 0.011 Pinellas 20143 City of St. Petersburg 0.011<br />
Pinellas 20142 Pinellas County Utilities 0.240 Pinellas 20143 City of St. Petersburg 0.240<br />
Pinellas 20142 Pinellas County Utilities 52.965 Pinellas 11771 Tampa Bay <strong>Water</strong> Consolidated 52.965<br />
Pinellas 20143 City of St. Petersburg 27.714 Pinellas 11771 Tampa Bay <strong>Water</strong> Consolidated 27.714<br />
Total Pinellas County Imports: 97.032 Total Exports To Pinellas County 97.032<br />
Polk 3415 Orchid Springs Development Corp 0.002 Polk 4607 City of Winter Haven 0.002<br />
Polk 8344 Skyview Utilities 0.167 Polk 4912 City of Lakeland 0.167<br />
Polk 7878 Aquasource Utilities 0.092 Polk 4912 City of Lakeland 0.092<br />
Polk 6505 Polk County Utilities ‐ NWRUSA 0.192 Polk 4912 City of Lakeland 0.192<br />
Polk 6506 Polk County Utilities ‐ SWRUSA 0.052 Polk 4912 City of Lakeland 0.052<br />
Polk 7119 City of Auburndale 0.000 Polk 4912 City of Lakeland 0.000
<strong>2011</strong> ESTIMATED WATER USE REPORT<br />
TABLE A3. <strong>2011</strong> PUBLIC SUPPLY ANNUAL REPORT PERMIT TO PERMIT WATER TRANSFERS<br />
Importing<br />
County<br />
Importing<br />
WUP #<br />
Import Details (Destinations)<br />
Importer<br />
Permittee Name<br />
Imported<br />
Quantity<br />
(mgd)<br />
Exporting<br />
County<br />
Exporting<br />
WUP #<br />
Export Details (Sources)<br />
Exporter<br />
Permittee Name<br />
Exported<br />
Quantity<br />
(mgd)<br />
Polk 6508 Polk County Utilities ‐ SERUSA 0.001 Polk 6624 City of Lake Alfred 0.001<br />
Polk 6509 Polk County Utilities ‐ NERUSA 1.158 Osceola 2 49‐00103‐W Toho <strong>Water</strong> Authority 1.158<br />
Polk 6509 Polk County Utilities ‐ NERUSA 1.049 Polk 2 53‐00126‐W Polk Co. Utilities, Oak Hill Estates 1.049<br />
Polk 6509 Polk County Utilities ‐ NERUSA 0.020 Polk 2 53‐00126‐W Polk County Utilities ‐ Oak Hill Estates 0.020<br />
Polk 6509 Polk County Utilities ‐ NERUSA 0.021 Polk 2 53‐00126‐W Polk County Utilities ‐ Oak Hill Estates 0.021<br />
Polk 6509 Polk County Utilities ‐ NERUSA 0.417 Polk 2 53‐00126‐W Polk County Utilities ‐ Oak Hill Estates 0.417<br />
Polk 6509 Polk County Utilities ‐ NERUSA 0.042 Polk 2 53‐00126‐W Polk County Utilities ‐ Oak Hill Estates 0.042<br />
Polk 8054 Polk County Utilities ‐ ERUSA 0.000 Polk 4658 City of Lake Wales 0.000<br />
Total Polk County Imports: 3.214 Total Exports To Polk County 0.506<br />
Sarasota 2923 City of Northport 1.032 DeSoto 10420 PRMRWSA ‐ DeSoto Portion 1.032<br />
Sarasota 8836 Sarasota County 4.719 Manatee 5387 Manatee County 4.719<br />
Sarasota 8836 Sarasota County 11.319 DeSoto 10420 PRMRWSA ‐ DeSoto Portion 11.319<br />
Sarasota 1 6583035 Aqua Utilities (SFWMD) 0.785 Sarasota 8836 Sarasota County 0.785<br />
Sarasota 1 6588003 Southgate (SFWMD) 0.823 Sarasota 8836 Sarasota County 0.823<br />
Total Sarasota County Imports: 17.069 Total Exports To Sarasota County 18.678<br />
Total District Imports: 292.318 Total District Exports: 291.218<br />
Data Source: Public Supply Annual Reports, <strong>2011</strong><br />
1 Imports by utilities in the South <strong>Florida</strong> <strong>Water</strong> <strong>Management</strong> District are not included in the District totals.<br />
2 Exports from utilities in the South <strong>Florida</strong> <strong>Water</strong> <strong>Management</strong> District are not included in the District totals.<br />
<strong>Southwest</strong> <strong>Florida</strong> <strong>Water</strong> <strong>Management</strong> District Page | 94
<strong>2011</strong> ESTIMATED WATER USE REPORT<br />
TABLE A4. <strong>2011</strong> METERED + ESTIMATED PUBLIC SUPPLY MONTHLY AVERAGE PUMPAGE (MGD/MONTH) BY COUNTY<br />
County Jan Feb Mar Apr May Jun Jul Aug Sep Oct Nov Dec<br />
*Charlotte 6.617 7.077 7.306 7.763 7.195 5.970 5.457 5.770 5.673 8.532 9.776 7.777<br />
Citrus 12.238 13.191 16.237 17.079 18.896 18.678 15.465 14.697 14.465 14.895 14.152 13.398<br />
Desoto 15.781 14.371 3.558 38.433 1.916 0.827 75.977 85.869 61.827 35.241 36.253 9.418<br />
Hardee 2.216 1.069 1.090 1.207 1.192 1.264 1.030 0.986 1.074 1.062 1.160 1.239<br />
Hernando 16.414 17.853 20.394 22.166 25.453 24.811 21.031 19.730 21.155 20.620 20.367 19.247<br />
*Highlands 7.449 7.743 7.874 7.734 7.935 7.409 6.683 6.604 7.095 6.808 7.366 7.055<br />
Hillsborough 121.514 139.167 132.347 255.606 126.322 139.280 147.399 121.573 117.232 128.523 119.209 113.099<br />
*Lake 0.000 0.000 0.000 0.000 0.000 0.000 0.000 0.000 0.000 0.000 0.000 0.000<br />
*Levy 0.758 0.777 0.727 0.741 0.816 0.826 0.675 0.686 0.685 0.585 0.529 0.847<br />
Manatee 39.196 37.367 38.767 34.082 40.935 36.839 36.366 38.100 45.083 49.565 44.663 37.805<br />
*Marion 7.723 8.677 10.945 12.743 13.880 15.167 10.220 10.435 11.283 9.487 9.080 8.495<br />
Pasco 83.655 80.497 86.932 90.680 111.193 116.769 94.725 89.343 98.320 89.830 87.825 83.564<br />
Pinellas 11.154 11.045 12.049 12.194 11.534 12.584 5.723 13.724 15.843 9.042 11.737 10.908<br />
*Polk 56.573 61.598 69.660 73.978 76.169 75.174 63.598 59.883 59.814 58.628 61.752 61.140<br />
Sarasota 19.110 21.916 21.487 23.379 20.486 21.465 17.183 19.306 18.535 20.266 20.423 18.481<br />
Sumter 11.237 11.933 17.594 15.293 27.467 24.740 13.722 12.730 14.953 18.063 20.252 15.012<br />
District Total 411.635 434.281 446.967 613.078 491.389 501.803 515.254 499.436 493.037 471.147 464.544 407.485<br />
Groundwater 281.310 286.513 315.368 331.882 380.966 373.783 301.672 306.183 325.273 310.142 316.820 292.074<br />
Surface <strong>Water</strong> 130.325 147.768 131.599 281.196 110.423 128.020 213.582 193.253 167.764 161.005 147.724 115.411<br />
* Data is only from the portion of the county within the District<br />
Data source: <strong>Estimated</strong> <strong>Water</strong> <strong>Use</strong> Tables derived from the WMIS WUP database, <strong>2011</strong>.<br />
<strong>Southwest</strong> <strong>Florida</strong> <strong>Water</strong> <strong>Management</strong> District Page | 95
<strong>2011</strong> ESTIMATED WATER USE REPORT<br />
Table A5. Metered and <strong>Estimated</strong> Recreation/Aesthetic WUPs, Withdrawals and Permitted <strong>Use</strong> (mgd), <strong>2011</strong><br />
County<br />
WUP<br />
Number<br />
Permittee<br />
<strong>Southwest</strong> <strong>Florida</strong> <strong>Water</strong> <strong>Management</strong> District Page | 96<br />
<strong>Use</strong><br />
Code 1<br />
Source<br />
2<br />
Annual<br />
Average<br />
Pumpage 3<br />
Total<br />
Permitted<br />
Annual Average<br />
Quantity<br />
Permitted<br />
Quantity<br />
Attributed to<br />
R/A <strong>Use</strong><br />
Category 4<br />
Charlotte 3523 David Emmons R250 G 0.049 0.256 0.256 M<br />
Charlotte 3656 Maple Leaf Estates Home Owners Corp R240 S 0.023 0.369 0.369 M<br />
Charlotte 6709 Port Charlotte Golf Course LLC R250 S 0.009 0.060 0.060 M<br />
Charlotte 7602 St. Andrews South Golf Club, Inc R250 G 0.072 0.144 0.144 M<br />
Charlotte 7815 Deep Creek Golf Inc R250 G 0.064 0.195 0.195 M<br />
Charlotte 9223 Linda Milton R250 G 0.030 0.145 0.145 M<br />
Charlotte 9223 Linda Milton R250 S 0.000 0.145 0.145 M<br />
Charlotte 9335 Rotonda Golf Partners LLC R250 S 0.000 0.190 0.190 M<br />
Charlotte 10169 Centex Homes, Inc & Riverwood Golf Club, LLC R250 S 0.452 0.462 0.462 M<br />
Charlotte 10890 Coral Creek Burnt Store LLC & Charlotte Orange Grove LLC R240 G 0.000 0.200 0.200 M<br />
Charlotte 10932 Rotonda Golf Partners LLC R250 S 0.000 0.290 0.290 M<br />
Charlotte 11687 Rotonda Golf Partners Ii LLC R250 S 0.015 0.078 0.078 M<br />
Charlotte 11688 Rotonda Golf Partners Ii LLC R250 S 0.000 0.078 0.078 M<br />
Charlotte 11979 Community Blue Heron Pines Joint Venture R250 G 0.004 0.094 0.094 M<br />
Charlotte 11979 Community Blue Heron Pines Joint Venture R250 S 0.015 0.094 0.094 M<br />
Charlotte 11997 CCC Dr LLC R250 S 0.019 0.184 0.184 M<br />
Charlotte 12335 Rotonda Golf Partners LP R250 S 0.055 0.234 0.234 M<br />
Charlotte 12543 Charlotte Co BOCC Attn Parks & Recreation Dept R245 G 0.052 0.088 0.088 M<br />
Charlotte 12907 Stephan Kohlmeier R240 G 0.045 0.092 0.092 M<br />
Charlotte 12969 Rotonda Golf Partners LLC R250 S 0.082 0.129 0.129 M<br />
Charlotte 6426 Lemon Bay Golf Club Inc R250 S 0.064 0.183 0.183 E<br />
Charlotte 6569 Kent C. & Nora Lynette Connell R250 G 0.000 0.136 0.136 E<br />
Charlotte 8477 Charlotte County Public Works Department R245 G 0.021 0.032 0.032 E<br />
Charlotte 9066 Klas Etcetera LLC R250 G 0.139 0.200 0.200 E<br />
Charlotte 9613 Punta Gorda of Charlotte County LLC R240 G 0.007 0.018 0.018 E<br />
Charlotte 9613 Punta Gorda of Charlotte County LLC R240 S 0.005 0.018 0.018 E<br />
Charlotte 9798 Rotonda Golf Partners LLC R250 S 0.002 0.003 0.003 E<br />
Charlotte 10006 Seminole Lakes Inc R250 G 0.000 0.130 0.130 E<br />
Charlotte 10006 Seminole Lakes Inc R250 S 0.045 0.130 0.130 E<br />
Charlotte 10167 Restlawn Memorial Park & Mausoleum R230 G 0.007 0.011 0.011 E<br />
Charlotte 10481 Wildflower Country Club R250 S 0.036 0.082 0.082 E<br />
Charlotte 11462 Edison Community College R240 G 0.022 0.063 0.063 E<br />
Charlotte 11462 Edison Community College R240 S 0.000 0.063 0.063 E<br />
Charlotte 11701 Duffy'S Golf Center Inc R250 S 0.027 0.062 0.062 E<br />
M/E 5
<strong>2011</strong> ESTIMATED WATER USE REPORT<br />
Table A5. Metered and <strong>Estimated</strong> Recreation/Aesthetic WUPs, Withdrawals and Permitted <strong>Use</strong> (mgd), <strong>2011</strong><br />
County<br />
WUP<br />
Number<br />
Permittee<br />
<strong>Southwest</strong> <strong>Florida</strong> <strong>Water</strong> <strong>Management</strong> District Page | 97<br />
<strong>Use</strong><br />
Code 1<br />
Source<br />
2<br />
Annual<br />
Average<br />
Pumpage 3<br />
Total<br />
Permitted<br />
Annual Average<br />
Quantity<br />
Permitted<br />
Quantity<br />
Attributed to<br />
R/A <strong>Use</strong><br />
Category 4<br />
Charlotte 11792 Charlotte County School Board R245 G 0.007 0.020 0.020 E<br />
Charlotte 12019 KB Home Fort Myer LLC R240 S 0.014 0.021 0.021 E<br />
Charlotte 12285 South Port Square LLC c/o Horizon Bay Retirement Living R240 G 0.030 0.047 0.047 E<br />
Charlotte 12337 Rotonda Golf Partners LLC R250 S 0.085 0.129 0.123 E<br />
Charlotte 12586 Tern Bay CDD R250 G 0.068 0.445 0.445 E<br />
Charlotte 12586 Tern Bay CDD R250 S 0.120 0.445 0.445 E<br />
Charlotte 12848 <strong>Florida</strong> Power & Light Co R240 G 0.011 0.017 0.017 E<br />
Charlotte 12984 Charlotte County BOCC Environmental Services Department R240 G 0.008 0.012 0.012 E<br />
Charlotte 13110 SWw <strong>Florida</strong> Land Fifteen LLC R240 G 0.000 0.085 0.085 E<br />
Charlotte 13317 Calusa Creek Master Assoc Inc R240 G 0.026 0.040 0.040 E<br />
Charlotte County Totals<br />
0.986 Metered, mgd<br />
0.744 <strong>Estimated</strong> , mgd<br />
1.730 Total, mgd<br />
Citrus 419 City of Inverness R245 G 0.018 1.535 0.025 M<br />
Citrus 2851 Seven Rivers Golf & Country Club Inc R250 G 0.175 0.214 0.214 M<br />
Citrus 2851 Seven Rivers Golf & Country Club Inc R250 S 0.000 0.214 0.214 M<br />
Citrus 3228 Citrus Hills Investment Prop Inc R250 G 0.357 0.614 0.614 M<br />
Citrus 3673 Suntacc & Company, Inc. R250 G 0.417 0.456 0.456 M<br />
Citrus 7805 Hampton Hills Partnership R250 G 1.142 1.229 1.229 M<br />
Citrus 8785 Escalante‐Black Diamond Golf Club LLC R250 G 0.951 0.557 0.557 M<br />
Citrus 8785 Escalante‐Black Diamond Golf Club LLC R250 S 0.212 0.557 0.557 M<br />
Citrus 8970 Scout Plantation Owner LLC R250 G 0.074 0.400 0.400 M<br />
Citrus 8970 Scout Plantation Owner LLC R250 S 0.234 0.400 0.400 M<br />
Citrus 8997 Inverness Golf & Country Club R250 G 0.232 0.254 0.254 M<br />
Citrus 9574 Twisted Oaks Golf Course LLC R250 G 0.264 0.322 0.322 M<br />
Citrus 9964 Pine Ridge Community Golf and Country Club, LLC R250 G 0.155 0.224 0.224 M<br />
Citrus 10260 Brassboys Enterprises, Inc.; Dba Citrus Springs Golf & CC R250 G 0.177 0.222 0.222 M<br />
Citrus 10404 Flovicc & Company, Inc. R250 G 0.230 0.261 0.261 M<br />
Citrus 13103 Deltona Corporation R250 G 0.277 0.279 0.279 M<br />
Citrus 872 Inverness Village Condominium Association R320 G 0.003 0.036 0.004 E<br />
Citrus 1928 Brassboys Enterprises Inc R250 G 0.093 0.133 0.133 E<br />
Citrus 3467 Gibraltar Mausoleum Of <strong>Florida</strong> R230 G 0.029 0.045 0.045 E<br />
Citrus 4368 Citrus County School Board / Attn: Michael Billings R240 G 0.039 0.087 0.078 E<br />
Citrus 4853 City Of Crystal River R230 G 0.009 0.015 0.015 E<br />
M/E 5
<strong>2011</strong> ESTIMATED WATER USE REPORT<br />
Table A5. Metered and <strong>Estimated</strong> Recreation/Aesthetic WUPs, Withdrawals and Permitted <strong>Use</strong> (mgd), <strong>2011</strong><br />
County<br />
WUP<br />
Number<br />
Permittee<br />
<strong>Southwest</strong> <strong>Florida</strong> <strong>Water</strong> <strong>Management</strong> District Page | 98<br />
<strong>Use</strong><br />
Code 1<br />
Source<br />
2<br />
Annual<br />
Average<br />
Pumpage 3<br />
Total<br />
Permitted<br />
Annual Average<br />
Quantity<br />
Permitted<br />
Quantity<br />
Attributed to<br />
R/A <strong>Use</strong><br />
Category 4<br />
Citrus 6291 Citrus County <strong>Water</strong> Resources De c/o Robert Knight R240 G 0.000 0.052 0.000 E<br />
Director<br />
Citrus 7662 Champs Software Inc R212 G 0.003 0.031 0.009 E<br />
Citrus 7662 Champs Software Inc R212 S 0.000 0.031 0.009 E<br />
Citrus 8562 Gulf To Lakes Associates Ltd R240 G 0.023 0.036 0.036 E<br />
Citrus 8627 Charles D. Tuttle R250 G 0.018 0.030 0.028 E<br />
Citrus 8758 Diocese Of St Petersburg R240 G 0.009 0.014 0.014 E<br />
Citrus 8874 GTE Federal Credit Union/Stephen A Foster R240 G 0.001 0.002 0.001 E<br />
Citrus 8894 CMC Real Estate Program 1988‐1 R240 G 0.003 0.005 0.005 E<br />
Citrus 10370 Beverly Hills Memorial Gardens, Inc. ATTN: SCI<br />
R240 G 0.031 0.048 0.048 E<br />
<strong>Management</strong>, LP<br />
Citrus 10544 Ruth B. Hooper R240 G 0.003 0.005 0.005 E<br />
Citrus 10937 Gulf To Lakes Associates Ltd R250 G 0.000 0.073 0.073 E<br />
Citrus 11931 Citrus Hills Investment Prop Inc R240 G 0.021 0.033 0.033 E<br />
Citrus 12059 Moorings At Point O Woods HOA & Gary F Queen Trustee‐ R240 G 0.000 0.028 0.028 E<br />
Citrus 12059 Moorings At Point O Woods HOA & Gary F Queen Trustee‐ R240 S 0.005 0.028 0.028 E<br />
Citrus 12390 Greenbrier Two Condominium Owners Assoc R240 G 0.017 0.027 0.027 E<br />
Citrus 12506 Ellie Schiller & FDEP Office Of Greenways & Trails R240 G 0.000 0.004 0.002 E<br />
Citrus 12633 Randy & Sara Wirkus R250 G 0.029 0.067 0.067 E<br />
Citrus County Totals<br />
4.915 Metered, mgd<br />
0.336 <strong>Estimated</strong> , mgd<br />
5.251 Total, mgd<br />
DeSoto 2746 Sunnybreeze Palms Golf Course Bill Baker R250 G 0.115 0.333 0.333 M<br />
DeSoto 6697 Kingsway Club R250 G 0.000 0.039 0.039 M<br />
DeSoto 2230 Ft Ogden Ten LLC R240 G 0.003 0.004 0.004 E<br />
DeSoto 3318 Cross Creek Of Arcadia LLC R310 G 0.027 0.060 0.059 E<br />
DeSoto 5928 School Board Of Desoto Co R245 G 0.004 0.007 0.007 E<br />
DeSoto 6458 School Board Of Desoto Co R240 G 0.019 0.077 0.042 E<br />
DeSoto 9105 Jerry Cordes R250 G 0.033 0.076 0.076 E<br />
DeSoto 9429 River Oaks Rv Inc R240 G 0.020 0.032 0.032 E<br />
DeSoto 10200 Oak Stone LLC R240 G 0.000 0.477 0.477 E<br />
DeSoto 10200 Oak Stone LLC R240 S 0.000 0.477 0.477 E<br />
DeSoto 12569 Parker DeSoto, LLC R240 G 0.000 0.259 0.259 E<br />
DeSoto 12569 Parker DeSoto, LLC R240 S 0.090 0.259 0.259 E<br />
M/E 5
<strong>2011</strong> ESTIMATED WATER USE REPORT<br />
Table A5. Metered and <strong>Estimated</strong> Recreation/Aesthetic WUPs, Withdrawals and Permitted <strong>Use</strong> (mgd), <strong>2011</strong><br />
County<br />
WUP<br />
Number<br />
Permittee<br />
<strong>Southwest</strong> <strong>Florida</strong> <strong>Water</strong> <strong>Management</strong> District Page | 99<br />
<strong>Use</strong><br />
Code 1<br />
Source<br />
2<br />
Annual<br />
Average<br />
Pumpage 3<br />
Total<br />
Permitted<br />
Annual Average<br />
Quantity<br />
Permitted<br />
Quantity<br />
Attributed to<br />
R/A <strong>Use</strong><br />
Category 4<br />
DeSoto 13223 Tara Preserve CDD R240 G 0.044 0.068 0.068 E<br />
DeSoto County Totals 0.115 Metered, mgd<br />
0.240 <strong>Estimated</strong> , mgd<br />
0.355 Total, mgd<br />
Hardee 1672 Adrian R Chapman R240 G 0.004 0.175 0.004 M<br />
Hardee 2715 Mosaic Fertilizer LLC and South Fort Meade Partnership LP R250 G 0.143 5.097 0.475 M<br />
Hardee 2715 Mosaic Fertilizer LLC and South Fort Meade Partnership LP R250 S 0.032 5.097 0.475 M<br />
Hardee 11858 FINR II INC R240 G 0.000 0.431 0.009 M<br />
Hardee 6471 Torrey Oaks Golf Course Inc R250 G 0.057 0.089 0.089 E<br />
Hardee 6850 First Baptist Church Of Wauchula R240 G 0.003 0.005 0.005 E<br />
Hardee 7073 Bouldin Holdings 2 Inc R240 G 0.004 0.006 0.006 E<br />
Hardee 7946 Irdia Raj & Angela Desai & R240 G 0.000 0.003 0.001 E<br />
Hardee 8746 Winn‐Dixie Stores Inc R240 G 0.003 0.004 0.004 E<br />
Hardee 11236 John Paul & Phyllis A Barker R250 G 0.006 0.009 0.009 E<br />
Hardee 11357 Hardee Co Dept Of Public Works R290 G 0.004 0.006 0.006 E<br />
Hardee 12055 THE BLUFFS GOLF COURSE ,INC. R250 G 0.044 0.069 0.069 E<br />
Hardee 12529 South <strong>Florida</strong> Community College R240 G 0.001 0.035 0.002 E<br />
Hardee 13368 Russell & Stephanie R Adams & R320 S 0.000 0.024 0.024 E<br />
Hardee County Totals<br />
0.179 Metered, mgd<br />
0.122 <strong>Estimated</strong> , mgd<br />
0.301 Total, mgd<br />
Hernando 368 TCGC, LLC R250 G 0.050 0.061 0.061 M<br />
Hernando 2982 Brookridge Country Club R240 G 0.260 0.281 0.281 M<br />
Hernando 3726 High Point Golf Club, Inc. R250 G 0.122 0.149 0.149 M<br />
Hernando 4893 Weekie Wachee Springs R310 G 0.037 0.132 0.132 M<br />
Hernando 6592 Lemkco <strong>Florida</strong> Inc R250 G 0.214 0.409 0.409 M<br />
Hernando 6873 Brooksville Golf & Country Club R250 G 0.201 0.206 0.206 M<br />
Hernando 7852 Ridge Manor Oaks LLC R250 G 0.142 0.265 0.265 M<br />
Hernando 8124 Oak Hills Golf Course R250 G 0.611 0.300 0.300 M<br />
Hernando 8639 Timber Pines Community Assoc Inc R240 G 0.022 0.020 0.020 M<br />
Hernando 8833 Seville LLC R250 G 0.321 0.307 0.307 M<br />
Hernando 9060 Lemkco <strong>Florida</strong> Inc R250 G 0.262 0.393 0.393 M<br />
Hernando 9344 Glen Lakes Partnership Inc R250 G 0.279 0.238 0.238 M<br />
M/E 5
<strong>2011</strong> ESTIMATED WATER USE REPORT<br />
Table A5. Metered and <strong>Estimated</strong> Recreation/Aesthetic WUPs, Withdrawals and Permitted <strong>Use</strong> (mgd), <strong>2011</strong><br />
County<br />
WUP<br />
Number<br />
Permittee<br />
<strong>Southwest</strong> <strong>Florida</strong> <strong>Water</strong> <strong>Management</strong> District Page | 100<br />
<strong>Use</strong><br />
Code 1<br />
Source<br />
2<br />
Annual<br />
Average<br />
Pumpage 3<br />
Total<br />
Permitted<br />
Annual Average<br />
Quantity<br />
Permitted<br />
Quantity<br />
Attributed to<br />
R/A <strong>Use</strong><br />
Category 4<br />
Hernando 10199 Sherman Hills Golf Club Inc R250 G 0.269 0.360 0.360 M<br />
Hernando 10760 Dollar Gulf Inc R250 G 0.041 0.178 0.178 M<br />
Hernando 11059 Glen Lakes Partnership Inc R240 G 0.418 0.402 0.402 M<br />
Hernando 12233 Hernando Oaks, LLC R250 G 0.166 0.307 0.307 M<br />
Hernando 12517 Silverthorn LLC R250 G 0.293 0.584 0.584 M<br />
Hernando 12545 Landmar Group LLC R250 G 0.111 0.682 0.682 M<br />
Hernando 13279 World Woods Corp R250 G 0.643 0.782 0.782 M<br />
Hernando 351 Hernando County Airport R280 G 0.006 0.009 0.009 E<br />
Hernando 441 Hernando Co School Board R240 G 0.014 0.022 0.022 E<br />
Hernando 2101 <strong>Florida</strong> Hills Memorial Gardens, Inc. R230 G 0.035 0.080 0.080 E<br />
Hernando 2688 Hallmark Land Trust & Ridge Manor Poa Inc R210 S 0.345 0.495 0.495 E<br />
Hernando 4430 Hernando County Airport, Robert L. Mills, Airport<br />
R240 G 0.028 0.064 0.064 E<br />
Supervisor<br />
Hernando 4998 Atria Communities Inc R244 G 0.007 0.011 0.011 E<br />
Hernando 8506 The <strong>Water</strong>s Of Weeki Wachee Poa Inc R240 G 0.001 0.001 0.001 E<br />
Hernando 8820 Hernando Co School Board R230 G 0.013 0.020 0.020 E<br />
Hernando 9247 Hernando Co School Board R245 G 0.042 0.065 0.065 E<br />
Hernando 10412 Sams East Inc R240 G 0.024 0.055 0.055 E<br />
Hernando 10493 Lykes Springhill Foundation Inc. R240 G 0.001 0.002 0.001 E<br />
Hernando 11187 Masaryktown Community Center Inc R230 G 0.001 0.004 0.004 E<br />
Hernando 12310 Hernando Co School Board R240 G 0.047 0.073 0.073 E<br />
Hernando 12387 The Greens At The Heather Condo Assoc Inc R240 G 0.004 0.006 0.006 E<br />
Hernando 12450 Brooksville Mini Storage Inc R240 G 0.001 0.001 0.001 E<br />
Hernando 12626 Hernando Christian Private Academy Inc R240 G 0.004 0.006 0.006 E<br />
Hernando 12809 Charles M Sasser Jr R240 G 0.018 0.028 0.028 E<br />
Hernando 12917 Levitt & Sons R240 G 0.000 0.151 0.151 E<br />
Hernando 12963 City Of Brooksville Dept Of Public Works R250 G 0.011 0.017 0.017 E<br />
Hernando County Totals<br />
4.462 Metered, mgd<br />
0.602 <strong>Estimated</strong> , mgd<br />
5.064 Total, mgd<br />
Highlands 4637 P E H Enterprises Dba Harder Hall Country Club Inc R250 G 0.119 0.253 0.253 M<br />
Highlands 4708 Sun n Lake Of Sebring Impr. Dist. R250 G 0.537 0.543 0.543 M<br />
Highlands 4980 Lake Placid Holding Co. R240 G 0.001 0.401 0.001 M<br />
Highlands 5107 City of Sebring R250 G 0.105 0.130 0.130 M<br />
M/E 5
<strong>2011</strong> ESTIMATED WATER USE REPORT<br />
Table A5. Metered and <strong>Estimated</strong> Recreation/Aesthetic WUPs, Withdrawals and Permitted <strong>Use</strong> (mgd), <strong>2011</strong><br />
County<br />
WUP<br />
Number<br />
Permittee<br />
<strong>Southwest</strong> <strong>Florida</strong> <strong>Water</strong> <strong>Management</strong> District Page | 101<br />
<strong>Use</strong><br />
Code 1<br />
Source<br />
2<br />
Annual<br />
Average<br />
Pumpage 3<br />
Total<br />
Permitted<br />
Annual Average<br />
Quantity<br />
Permitted<br />
Quantity<br />
Attributed to<br />
R/A <strong>Use</strong><br />
Category 4<br />
Highlands 5646 Pinecrest on Lotela Inc R250 G 0.199 0.147 0.147 M<br />
Highlands 6498 River Greens South Golf Course Inc R250 G 0.168 0.196 0.196 M<br />
Highlands 7811 Mink Associates II LLC R250 G 0.085 0.288 0.141 M<br />
Highlands 8327 Laman Land Development LLC R250 G 0.267 0.203 0.203 M<br />
Highlands 9140 Eagle Lake Est LLC R250 G 0.000 0.316 0.147 M<br />
Highlands 9626 Sebring Land Limited Partnership R250 G 0.325 0.327 0.327 M<br />
Highlands 12265 CCS Golf Club, Inc. R250 G 0.239 0.165 0.165 M<br />
Highlands 3748 South <strong>Florida</strong> Community College R240 G 0.016 0.058 0.051 E<br />
Highlands 3748 South <strong>Florida</strong> Community College R240 S 0.000 0.058 0.051 E<br />
Highlands 4198 Highlands County BOCCc R240 G 0.020 0.033 0.031 E<br />
Highlands 5242 Keatley‐Lakeview Memorial Gardens Inc R230 G 0.020 0.031 0.031 E<br />
Highlands 5316 Publix Super Markets Inc & John F Jr & Edward L Smoak R240 G 0.002 0.003 0.003 E<br />
Highlands 5907 Lake Rachard Estates Ltd R240 G 0.024 0.054 0.054 E<br />
Highlands 5985 Highlands Co School Board R240 G 0.008 0.013 0.013 E<br />
Highlands 5988 Highlands Co School Board R240 G 0.006 0.009 0.009 E<br />
Highlands 7556 Fountainhead Condominium Apts Inc R240 G 0.001 0.001 0.001 E<br />
Highlands 7736 Dist. Advis. Bd. Southern FL Dist., Church of The Nazarene, R244 G 0.008 0.013 0.013 E<br />
Inc.<br />
Highlands 8089 Highlands Co School Board R240 G 0.007 0.011 0.011 E<br />
Highlands 8455 Highlands Co School Board R240 G 0.015 0.024 0.024 E<br />
Highlands 9144 Highlands Co School Board R240 G 0.012 0.025 0.019 E<br />
Highlands 9149 Highlands Co School Board R240 G 0.053 0.087 0.087 E<br />
Highlands 9195 Country Club Villas Assoc Inc R244 G 0.003 0.004 0.004 E<br />
Highlands 9494 Highlands Co School Board R240 G 0.006 0.010 0.010 E<br />
Highlands 9912 Country Club Villas Ii Association Inc R240 G 0.000 0.003 0.003 E<br />
Highlands 10005 Highlands Co School Board R244 G 0.000 0.004 0.004 E<br />
Highlands 10184 Highlands Co School Board R240 G 0.011 0.017 0.017 E<br />
Highlands 10256 John J. Nevins, As Bishop of the Diocese of Venice R240 G 0.007 0.011 0.011 E<br />
Highlands 10357 Bluffs of Sebring Condominium Association, Inc. R240 G 0.021 0.033 0.033 E<br />
Highlands 10503 Lakeshore Sebring Ltd Partnership R240 G 0.023 0.053 0.053 E<br />
Highlands 11193 Fairhaven South Inc R240 G 0.005 0.007 0.007 E<br />
Highlands 11408 Highlands Co School Board R240 G 0.020 0.031 0.031 E<br />
Highlands 12257 City of Sebring Attn: Kenneth Fields R240 G 0.024 0.037 0.037 E<br />
Highlands 12425 Mavis Development Corp. R250 S 0.037 0.078 0.078 E<br />
M/E 5
<strong>2011</strong> ESTIMATED WATER USE REPORT<br />
Table A5. Metered and <strong>Estimated</strong> Recreation/Aesthetic WUPs, Withdrawals and Permitted <strong>Use</strong> (mgd), <strong>2011</strong><br />
County<br />
WUP<br />
Number<br />
Permittee<br />
<strong>Southwest</strong> <strong>Florida</strong> <strong>Water</strong> <strong>Management</strong> District Page | 102<br />
<strong>Use</strong><br />
Code 1<br />
Source<br />
2<br />
Annual<br />
Average<br />
Pumpage 3<br />
Total<br />
Permitted<br />
Annual Average<br />
Quantity<br />
Permitted<br />
Quantity<br />
Attributed to<br />
R/A <strong>Use</strong><br />
Category 4<br />
Highlands 12846 Wayne Rickert R240 G 0.005 0.096 0.008 E<br />
Highlands 12846 Wayne Rickert R240 S 0.000 0.096 0.008 E<br />
Highlands 12877 Sebring Firemen Inc R245 G 0.007 0.012 0.012 E<br />
Highlands 13128 Lake Placid Church Of Christ R240 G 0.007 0.010 0.010 E<br />
Highlands 20071 Town Of Lake Placid R230 G 0.016 0.025 0.025 E<br />
Highlands County Totals<br />
2.045 Metered, mgd<br />
0.384 <strong>Estimated</strong> , mgd<br />
2.429 Total, mgd<br />
Hillsborough 139 Lutz Lake Association R220 G 0.000 0.042 0.042 M<br />
Hillsborough 354 Pinellas County Utilities R220 G 0.000 0.325 0.325 M<br />
Hillsborough 620 NittanyTrails LLC R250 G 0.142 0.295 0.295 M<br />
Hillsborough 689 School Board of Hillsborough Co R245 G 0.019 0.142 0.059 M<br />
Hillsborough 707 Clublink US Corporation R250 G 0.054 0.119 0.119 M<br />
Hillsborough 1098 Garden of Memories, Inc. R230 G 0.192 0.506 0.506 M<br />
Hillsborough 1532 Mosaic Fertilizer LLC R310 S 0.007 5.985 0.015 M<br />
Hillsborough 1640 Bahia Lakes CDD R240 G 0.016 0.143 0.143 M<br />
Hillsborough 1857 Hillsborough County School Board R240 G 0.007 0.082 0.082 M<br />
Hillsborough 1946 Hills Co Assoc II III IV LLP R240 G 0.000 0.230 0.230 M<br />
Hillsborough 1960 University of South <strong>Florida</strong>. R245 G 0.536 2.364 0.960 M<br />
Hillsborough 2177 Buckhorn Properties, Inc. R250 G 0.000 0.113 0.113 M<br />
Hillsborough 2320 Seaworld Parks & Entertainment, LLC R240 G 1.329 1.810 1.810 M<br />
Hillsborough 2705 Sano Corp Dba Westchase Golf Course R250 S 0.002 0.079 0.079 M<br />
Hillsborough 3024 Lake Magdalene Restoration Assoc R220 G 0.001 0.426 0.426 M<br />
Hillsborough 3582 City of Temple Terrace R250 G 0.140 0.256 0.256 M<br />
Hillsborough 3685 Vision Golf LLC R250 G 0.109 0.417 0.417 M<br />
Hillsborough 3685 Vision Golf LLC R250 S 0.000 0.417 0.417 M<br />
Hillsborough 4526 Hillsborough County Aviation Authority R240 G 0.003 0.121 0.121 M<br />
Hillsborough 4874 Avila Golf and C.C. R250 G 0.041 0.346 0.346 M<br />
Hillsborough 5327 Lake Byrd Improvement Association R220 G 0.000 0.050 0.050 M<br />
Hillsborough 6091 Caloosa Golf & Country Club Inc R250 G 0.043 0.336 0.336 M<br />
Hillsborough 6091 Caloosa Golf & Country Club Inc R250 S 0.000 0.336 0.336 M<br />
Hillsborough 6092 Clublink US Corporation R250 G 1.485 2.470 2.470 M<br />
Hillsborough 6100 City of Tampa & Tampa Sports Authority R250 G 0.126 0.179 0.179 M<br />
Hillsborough 6101 Tampa Sports Authority & City Of Tampa R250 G 0.044 0.148 0.148 M<br />
M/E 5
<strong>2011</strong> ESTIMATED WATER USE REPORT<br />
Table A5. Metered and <strong>Estimated</strong> Recreation/Aesthetic WUPs, Withdrawals and Permitted <strong>Use</strong> (mgd), <strong>2011</strong><br />
County<br />
WUP<br />
Number<br />
Permittee<br />
<strong>Southwest</strong> <strong>Florida</strong> <strong>Water</strong> <strong>Management</strong> District Page | 103<br />
<strong>Use</strong><br />
Code 1<br />
Source<br />
2<br />
Annual<br />
Average<br />
Pumpage 3<br />
Total<br />
Permitted<br />
Annual Average<br />
Quantity<br />
Permitted<br />
Quantity<br />
Attributed to<br />
R/A <strong>Use</strong><br />
Category 4<br />
Hillsborough 6217 Palma Ceia Golf & Country Club R250 G 0.098 0.211 0.211 M<br />
Hillsborough 7038 Bloomingdale Golf LLC R250 G 0.021 0.087 0.087 M<br />
Hillsborough 7637 Riverside Golf Course Comm LLC R250 G 0.110 0.514 0.223 M<br />
Hillsborough 7637 Riverside Golf Course Comm LLC R250 S 0.056 0.514 0.223 M<br />
Hillsborough 7774 Lake Carlton Arms Partnership R244 G 0.145 0.270 0.270 M<br />
Hillsborough 7883 Tampa Palms Community Dev Dist R244 G 0.075 0.313 0.313 M<br />
Hillsborough 8126 Brighton Golf Partners LLC Summerfield Crossings Golf Club R250 G 0.048 0.325 0.325 M<br />
Hillsborough 8126 Brighton Golf Partners LLC Summerfield Crossings Golf Club R250 S 0.000 0.325 0.325 M<br />
Hillsborough 8137 <strong>Florida</strong> College Inc R250 G 0.203 0.170 0.170 M<br />
Hillsborough 8621 Susan E & Sumesh Chandra R220 G 0.011 0.036 0.036 M<br />
Hillsborough 8641 Old Memorial Golf Club R250 G 0.033 0.083 0.083 M<br />
Hillsborough 9042 Arbor Greene Community Development District R240 G 0.020 0.066 0.066 M<br />
Hillsborough 9137 Samuel Falletta R240 G 0.037 0.200 0.200 M<br />
Hillsborough 9260 John Keen R250 G 0.001 0.064 0.064 M<br />
Hillsborough 10161 City of Tampa Real Estate Div & Lowry Park Zoological R290 G 0.256 0.300 0.300 M<br />
Society<br />
Hillsborough 10398 Rivercrest LLC & Rivercrest CDD R240 G 0.104 0.115 0.115 M<br />
Hillsborough 10724 DF Golf, LLC R250 G 0.016 0.237 0.237 M<br />
Hillsborough 10724 DF Golf, LLC R250 S 0.128 0.237 0.237 M<br />
Hillsborough 10819 Arc Sun City Golf Course Inc R250 G 0.000 0.079 0.079 M<br />
Hillsborough 10819 Arc Sun City Golf Course Inc R250 S 0.000 0.079 0.079 M<br />
Hillsborough 11076 Lake Stemper Civic Association R220 G 0.000 0.281 0.281 M<br />
Hillsborough 11086 Alain & Luz Juvert R220 G 0.000 0.060 0.060 M<br />
Hillsborough 11139 John D & Jillian W Lockaby R220 G 0.000 0.134 0.134 M<br />
Hillsborough 11194 Heritage Golf Tampa Bay LLC R250 G 0.001 0.264 0.264 M<br />
Hillsborough 11425 Round Lake Association Inc and John and Christine Romer R220 G 0.208 0.215 0.215 M<br />
Hillsborough 11428 Hunters Green Acquistion Corp R250 G 0.140 0.324 0.324 M<br />
Hillsborough 11429 Hunter's Green Comm Assoc Inc R240 G 0.150 0.274 0.274 M<br />
Hillsborough 11435 Saddleback Improvement Association, Inc. R220 G 0.000 0.392 0.392 M<br />
Hillsborough 11540 Heritage Isles CDD R250 G 0.061 0.327 0.327 M<br />
Hillsborough 11830 Tampa Bay Downs, Inc. R300 G 0.047 0.156 0.156 M<br />
Hillsborough 12024 City of Tampa R250 G 0.016 0.323 0.323 M<br />
Hillsborough 12274 Tramonett Enterprises Inc. R250 G 0.143 0.103 0.103 M<br />
Hillsborough 12957 NHC‐FL8‐LP David W Fell R250 G 0.212 0.347 0.302 M<br />
M/E 5
<strong>2011</strong> ESTIMATED WATER USE REPORT<br />
Table A5. Metered and <strong>Estimated</strong> Recreation/Aesthetic WUPs, Withdrawals and Permitted <strong>Use</strong> (mgd), <strong>2011</strong><br />
County<br />
WUP<br />
Number<br />
Permittee<br />
<strong>Southwest</strong> <strong>Florida</strong> <strong>Water</strong> <strong>Management</strong> District Page | 104<br />
<strong>Use</strong><br />
Code 1<br />
Source<br />
2<br />
Annual<br />
Average<br />
Pumpage 3<br />
Total<br />
Permitted<br />
Annual Average<br />
Quantity<br />
Permitted<br />
Quantity<br />
Attributed to<br />
R/A <strong>Use</strong><br />
Category 4<br />
Hillsborough 12967 Centex Real Estate Corp & South Shore Falls HOA Inc R240 G 0.126 0.213 0.213 M<br />
Hillsborough 12967 Centex Real Estate Corp & South Shore Falls HOA Inc R240 S 0.000 0.213 0.213 M<br />
Hillsborough 13356 South Shore Corporate Park LLC R240 G 0.001 0.110 0.110 M<br />
Hillsborough 13356 South Shore Corporate Park LLC R240 S 0.004 0.110 0.110 M<br />
Hillsborough 26 First Baptist Church Of Plant City R240 G 0.003 0.004 0.004 E<br />
Hillsborough 254 301 Cypress Creek LLC C.O Metro Development LLC R240 G 0.000 0.120 0.120 E<br />
Hillsborough 254 301 Cypress Creek LLC C.O Metro Development LLC R240 S 0.000 0.120 0.120 E<br />
Hillsborough 538 Transcend Development Corp& Lumsden Pointe HOA Inc R240 G 0.003 0.005 0.005 E<br />
Hillsborough 658 Church Of Jesus Christ of Latter Day Saints R244 G 0.000 0.001 0.001 E<br />
Hillsborough 811 <strong>Southwest</strong> Fla <strong>Water</strong> Mgt District R240 G 0.003 0.004 0.004 E<br />
Hillsborough 877 Meralex Farm Inc R245 G 0.033 0.087 0.069 E<br />
Hillsborough 922 NNN Netpark 25, LLC R240 G 0.019 0.029 0.029 E<br />
Hillsborough 1036 Riverglen Homeowners Association R240 G 0.021 0.033 0.033 E<br />
Hillsborough 1119 Harbour Isles Community Development District R240 G 0.030 0.067 0.067 E<br />
Hillsborough 1123 Artesian Farms LLC & River Bend LLC R240 G 0.000 0.058 0.058 E<br />
Hillsborough 1450 Wilder Property Development Inc R406 G 0.002 0.010 0.010 E<br />
Hillsborough 1848 Steve & Sharon B Linton & Church Lake POA R220 G 0.031 0.076 0.070 E<br />
Hillsborough 1881 Manatee Bay Assoc LLC‐Bahia Riv Assoc LLC‐South Bay Cdd R240 G 0.000 0.053 0.053 E<br />
Et Al<br />
Hillsborough 1969 Wyndgate Homeowners Association, Inc. R240 G 0.026 0.041 0.041 E<br />
Hillsborough 2414 Ronald W Tindle R240 G 0.001 0.002 0.002 E<br />
Hillsborough 2533 Mira Lago HOA R240 G 0.047 0.073 0.073 E<br />
Hillsborough 2639 Emerald Greens‐Carrollwood LLC R250 G 0.002 0.089 0.089 E<br />
Hillsborough 2845 South Crystal Lake Improvement Assoc Inc R220 G 0.026 0.060 0.060 E<br />
Hillsborough 2866 Riverranch Preserve Homeowners Association, Inc. R244 G 0.014 0.022 0.022 E<br />
Hillsborough 3132 Ace Golf Inc R250 G 0.070 0.203 0.203 E<br />
Hillsborough 3383 Brentwood Hills Homeowners Association, Inc. R240 G 0.015 0.023 0.023 E<br />
Hillsborough 3406 <strong>Florida</strong> State Fair Authority R320 G 0.024 0.045 0.045 E<br />
Hillsborough 3406 <strong>Florida</strong> State Fair Authority R320 S 0.005 0.045 0.045 E<br />
Hillsborough 3621 United States Postal Service Carrollwood Station R240 G 0.002 0.003 0.003 E<br />
Hillsborough 3679 Tree Tops Well LLC R240 G 0.027 0.062 0.062 E<br />
Hillsborough 3732 Strawberry Ridge Ltd R240 G 0.003 0.004 0.004 E<br />
Hillsborough 3733 Narayan Assoc R240 G 0.001 0.005 0.005 E<br />
Hillsborough 3807 First Tampa Oakwood LLC R240 G 0.005 0.008 0.008 E<br />
M/E 5
<strong>2011</strong> ESTIMATED WATER USE REPORT<br />
Table A5. Metered and <strong>Estimated</strong> Recreation/Aesthetic WUPs, Withdrawals and Permitted <strong>Use</strong> (mgd), <strong>2011</strong><br />
County<br />
WUP<br />
Number<br />
Permittee<br />
<strong>Southwest</strong> <strong>Florida</strong> <strong>Water</strong> <strong>Management</strong> District Page | 105<br />
<strong>Use</strong><br />
Code 1<br />
Source<br />
2<br />
Annual<br />
Average<br />
Pumpage 3<br />
Total<br />
Permitted<br />
Annual Average<br />
Quantity<br />
Permitted<br />
Quantity<br />
Attributed to<br />
R/A <strong>Use</strong><br />
Category 4<br />
Hillsborough 3994 Hillsborough Co Parks, Rec & Conservation/Mark Thornton R230 G 0.012 0.019 0.019 E<br />
Hillsborough 4028 Hillsborough Co Public Works R245 G 0.012 0.018 0.018 E<br />
Hillsborough 4029 Hillsborough County Board of County Commissioners R240 G 0.022 0.034 0.034 E<br />
Hillsborough 4079 Hillsborough Co Parks, Rec & Conservation/Mark Thornton R230 G 0.026 0.041 0.041 E<br />
Hillsborough 4416 Fred Godley R240 G 0.002 0.075 0.014 E<br />
Hillsborough 4416 Fred Godley R240 S 0.000 0.075 0.014 E<br />
Hillsborough 4428 City Of Tampa Real Estate Division R245 G 0.008 0.025 0.025 E<br />
Hillsborough 4468 Hillsborough Co School Board R245 G 0.002 0.015 0.003 E<br />
Hillsborough 4549 Lake Charles Improvement Association R220 G 0.202 0.290 0.290 E<br />
Hillsborough 5278 Oaks Community Assoc Inc R240 G 0.007 0.012 0.012 E<br />
Hillsborough 6334 Lake Morley Improvement Assoc Committee Ronald McCrea R210 G 0.003 0.004 0.004 E<br />
Hillsborough 6422 Shirley Roberts R240 G 0.005 0.008 0.007 E<br />
Hillsborough 6527 Lincoln Garden, LLC R244 G 0.002 0.003 0.003 E<br />
Hillsborough 6626 Hillsborough Co Parks, Rec & Conservation/Mark Thornton R310 G 0.005 0.010 0.008 E<br />
Hillsborough 7019 Lindell Independence Land, LLC & Lindell Independence R244 G 0.033 0.051 0.051 E<br />
Office, LLC<br />
Hillsborough 7213 Bay Hills Village Condo Assoc R240 G 0.001 0.032 0.001 E<br />
Hillsborough 7238 Hopewell Memorial Gardens & Mausoleums R230 G 0.026 0.041 0.041 E<br />
Hillsborough 7366 Victor Meyer R310 G 0.000 0.016 0.001 E<br />
Hillsborough 7449 Northdale Maintenance District R240 G 0.012 0.018 0.018 E<br />
Hillsborough 7816 Publix Super Markets Inc., Attn Ann Batts R240 G 0.003 0.005 0.005 E<br />
Hillsborough 7920 State of Fl Botii Trust Fund And FDEP‐Division Of<br />
R310 G 0.003 0.015 0.015 E<br />
Recreation & Parks<br />
Hillsborough 7942 Hillsborough Community College R240 G 0.026 0.041 0.041 E<br />
Hillsborough 7970 South Bay Hospital R240 G 0.006 0.010 0.009 E<br />
Hillsborough 7971 Ambassador X Limited Partnership R240 G 0.019 0.052 0.052 E<br />
Hillsborough 8132 Hillsborough Co School Board R240 G 0.002 0.014 0.004 E<br />
Hillsborough 8166 Plantain Products Company Attn: Nick Fatolitis R310 G 0.000 0.000 0.000 E<br />
Hillsborough 8276 Raintree Manor Homes Property R240 G 0.015 0.023 0.023 E<br />
Hillsborough 8358 Hillsborough Co School Board R240 G 0.004 0.007 0.007 E<br />
Hillsborough 8381 Providence Lakes Master Assoc R240 G 0.014 0.033 0.033 E<br />
Hillsborough 8381 Providence Lakes Master Assoc R240 S 0.007 0.033 0.033 E<br />
Hillsborough 8419 Hillsborough Co School Board R240 G 0.005 0.007 0.007 E<br />
Hillsborough 8544 Seminole Tribe Of <strong>Florida</strong> Dale Joy R300 G 0.010 0.117 0.014 E<br />
M/E 5
<strong>2011</strong> ESTIMATED WATER USE REPORT<br />
Table A5. Metered and <strong>Estimated</strong> Recreation/Aesthetic WUPs, Withdrawals and Permitted <strong>Use</strong> (mgd), <strong>2011</strong><br />
County<br />
WUP<br />
Number<br />
Permittee<br />
<strong>Southwest</strong> <strong>Florida</strong> <strong>Water</strong> <strong>Management</strong> District Page | 106<br />
<strong>Use</strong><br />
Code 1<br />
Source<br />
2<br />
Annual<br />
Average<br />
Pumpage 3<br />
Total<br />
Permitted<br />
Annual Average<br />
Quantity<br />
Permitted<br />
Quantity<br />
Attributed to<br />
R/A <strong>Use</strong><br />
Category 4<br />
Hillsborough 8673 Belmont LLC R240 G 0.000 0.133 0.133 E<br />
Hillsborough 8701 Hillsborough Co School Board R245 G 0.014 0.027 0.022 E<br />
Hillsborough 8703 Hillsborough Co School Board R300 G 0.006 0.009 0.009 E<br />
Hillsborough 8704 Hillsborough Co School Board R245 G 0.007 0.011 0.011 E<br />
Hillsborough 8705 Hillsborough Co School Board R245 G 0.027 0.048 0.042 E<br />
Hillsborough 8708 School Board of Hillsborough County R245 G 0.032 0.075 0.074 E<br />
Hillsborough 8709 Hillsborough Co School Board R230 G 0.012 0.018 0.018 E<br />
Hillsborough 8710 Hillsborough Co School Board R245 G 0.013 0.046 0.021 E<br />
Hillsborough 8712 Hillsborough Co School Board R240 G 0.002 0.013 0.002 E<br />
Hillsborough 8713 Hillsborough Co School Board R245 G 0.005 0.016 0.007 E<br />
Hillsborough 8714 Hillsborough Co School Board R240 G 0.006 0.009 0.009 E<br />
Hillsborough 8715 Hillsborough Co School Board R240 G 0.010 0.020 0.016 E<br />
Hillsborough 8716 Hillsborough Co School Board R230 G 0.033 0.054 0.051 E<br />
Hillsborough 8722 Hillsborough Co School Board R240 G 0.007 0.025 0.010 E<br />
Hillsborough 8818 CL Realty LLC R244 G 0.000 0.315 0.315 E<br />
Hillsborough 8883 Hillsborough Co School Board R245 G 0.036 0.058 0.057 E<br />
Hillsborough 8931 TC Venture 1, LLC R240 G 0.008 0.315 0.315 E<br />
Hillsborough 8955 Lone Oak Baptist Missionary Baptist Church Inc R240 G 0.001 0.027 0.001 E<br />
Hillsborough 9219 Grande Oasis At Carrolwood Condo & Carrollwood 26 R240 G 0.005 0.025 0.025 E<br />
Holdings LLC<br />
Hillsborough 9354 Georgia Venture (Fulton) II, L.P. R240 G 0.017 0.027 0.027 E<br />
Hillsborough 9598 BIG BEND HOLDINGS LLP, and DUKE REALTY LIMITED R310 G 0.000 0.003 0.000 E<br />
PARTNERSHIP<br />
Hillsborough 9621 H. William Neyland R240 G 0.014 0.022 0.022 E<br />
Hillsborough 9635 Bausch And Lomb Incorporated R240 G 0.010 0.015 0.015 E<br />
Hillsborough 9635 Bausch And Lomb Incorporated R240 S 0.000 0.015 0.015 E<br />
Hillsborough 9816 Brussels Boy Homeowners' Association, Inc. R240 G 0.009 0.014 0.014 E<br />
Hillsborough 9819 School District of Hillsborough County R240 G 0.010 0.016 0.016 E<br />
Hillsborough 9875 Grace Community Church Of Brandon Inc R240 G 0.004 0.047 0.006 E<br />
Hillsborough 9992 Robert J. and Sylvia Rowell R240 G 0.008 0.021 0.012 E<br />
Hillsborough 10162 Joseph V & Patricia Linzalone R240 G 0.000 0.001 0.001 E<br />
Hillsborough 10182 Gilbraltar Mausoleum Corporation R230 G 0.030 0.065 0.065 E<br />
Hillsborough 10190 City of Temple Terrace Park & Recreation Dept R240 G 0.051 0.096 0.096 E<br />
Hillsborough 10383 Edward T & Carol J Hubbell R240 G 0.001 0.004 0.001 E<br />
M/E 5
<strong>2011</strong> ESTIMATED WATER USE REPORT<br />
Table A5. Metered and <strong>Estimated</strong> Recreation/Aesthetic WUPs, Withdrawals and Permitted <strong>Use</strong> (mgd), <strong>2011</strong><br />
County<br />
WUP<br />
Number<br />
Permittee<br />
<strong>Southwest</strong> <strong>Florida</strong> <strong>Water</strong> <strong>Management</strong> District Page | 107<br />
<strong>Use</strong><br />
Code 1<br />
Source<br />
2<br />
Annual<br />
Average<br />
Pumpage 3<br />
Total<br />
Permitted<br />
Annual Average<br />
Quantity<br />
Permitted<br />
Quantity<br />
Attributed to<br />
R/A <strong>Use</strong><br />
Category 4<br />
Hillsborough 10516 Hillsborough County R245 G 0.000 0.103 0.103 E<br />
Hillsborough 10543 Cici Trailer Town Mobile Home Park, Louis R240 G 0.001 0.015 0.002 E<br />
Hillsborough 10550 Brandon Shopping Center Partners R240 G 0.024 0.055 0.055 E<br />
Hillsborough 10641 Society Park Apartments R210 G 0.003 0.009 0.009 E<br />
Hillsborough 10641 Society Park Apartments R210 S 0.003 0.009 0.009 E<br />
Hillsborough 10964 School District of Hillsborough County R240 G 0.021 0.063 0.030 E<br />
Hillsborough 11030 Performance Food Group Of <strong>Florida</strong> LLC R240 G 0.004 0.006 0.006 E<br />
Hillsborough 11103 Tampa Jewish Federation Inc Attn Peter Pateracki R240 G 0.005 0.008 0.008 E<br />
Hillsborough 11157 Terrabrook Apollo Beach LP R240 G 0.040 0.090 0.090 E<br />
Hillsborough 11263 Hillsborough Co Parks, Rec & Conservation/Mark Thornton R245 G 0.009 0.015 0.015 E<br />
Hillsborough 11319 Hillsborough Co Real Estate Dept R230 G 0.029 0.067 0.067 E<br />
Hillsborough 11320 Hillsborough Co School Board R240 G 0.010 0.016 0.016 E<br />
Hillsborough 11335 I‐4 Land Holding Ltd Co R240 G 0.055 0.085 0.085 E<br />
Hillsborough 11477 Hillsborough Co Aviation Auth R240 G 0.001 0.009 0.003 E<br />
Hillsborough 11477 Hillsborough Co Aviation Auth R240 S 0.001 0.009 0.003 E<br />
Hillsborough 11489 Margie Willis & Glenda Haney R230 G 0.011 0.018 0.018 E<br />
Hillsborough 11573 Elad National Properties LLC R240 S 0.050 0.078 0.078 E<br />
Hillsborough 11615 Hillsborough Co School Board R240 G 0.017 0.027 0.027 E<br />
Hillsborough 11707 Sunridge Of Tampa Bay Condo Assoc R240 G 0.005 0.008 0.008 E<br />
Hillsborough 11739 <strong>Florida</strong> Cemeteries Inc Dba Serenity Meadows R230 G 0.013 0.020 0.020 E<br />
Hillsborough 11750 Tampa Sports Auth & Hills Co Aviation Auth & Hills Co R240 G 0.016 0.024 0.024 E<br />
Hillsborough 11782 Hillsborough Co School Board R240 G 0.011 0.016 0.016 E<br />
Hillsborough 11804 Little Manatee Housing Corp/John Scheller R240 G 0.015 0.023 0.023 E<br />
Hillsborough 11845 HOA At Westwood Lakes Inc R240 G 0.029 0.045 0.045 E<br />
Hillsborough 11940 Lake Chase Condominium Assoc. Inc. Attn: Vernon June R244 G 0.023 0.035 0.035 E<br />
Hillsborough 11950 Highwoods Preserve POA Inc R240 G 0.000 0.082 0.082 E<br />
Hillsborough 11950 Highwoods Preserve POA Inc R240 S 0.026 0.082 0.082 E<br />
Hillsborough 12013 Tampa Preparatory School Inc R245 G 0.006 0.010 0.010 E<br />
Hillsborough 12219 Aston Gardens at Tampa Bay R240 G 0.000 0.033 0.033 E<br />
Hillsborough 12219 Aston Gardens at Tampa Bay R240 S 0.000 0.033 0.033 E<br />
Hillsborough 12294 Lake Strawberry Spec Dep Dist & R220 G 0.000 0.030 0.030 E<br />
Hillsborough 12295 Sam Morrow Samuels R250 G 0.000 0.146 0.146 E<br />
Hillsborough 12359 Gary M & Linda R Terrell R240 G 0.001 0.003 0.001 E<br />
Hillsborough 12419 Dennis Lee & Sun Ok Lee R310 G 0.012 0.019 0.019 E<br />
M/E 5
<strong>2011</strong> ESTIMATED WATER USE REPORT<br />
Table A5. Metered and <strong>Estimated</strong> Recreation/Aesthetic WUPs, Withdrawals and Permitted <strong>Use</strong> (mgd), <strong>2011</strong><br />
County<br />
WUP<br />
Number<br />
Permittee<br />
<strong>Use</strong><br />
Code 1<br />
Source<br />
2<br />
Annual<br />
Average<br />
Pumpage 3<br />
Total<br />
Permitted<br />
Annual Average<br />
Quantity<br />
Permitted<br />
Quantity<br />
Attributed to<br />
R/A <strong>Use</strong><br />
Category 4<br />
Hillsborough 13374 Hillsborough Co <strong>Water</strong> Resource Services R290 G 0.000 0.146 0.146 E<br />
Hillsborough 13375 Hillsborough Co <strong>Water</strong> Resource Services R290 G 0.000 0.146 0.146 E<br />
Hillsborough 20002 Bayport Colony Apartments LLC R240 G 0.014 0.022 0.022 E<br />
Hillsborough 20022 Countryway Golf Club Inc R250 G 0.000 0.034 0.034 E<br />
Hillsborough 20022 Countryway Golf Club Inc R250 S 0.014 0.034 0.034 E<br />
Hillsborough County Totals<br />
There are no recreation/aesthetic uses that require a water use permit in Lake County<br />
6.767 Metered, mgd<br />
1.754 <strong>Estimated</strong> , mgd<br />
8.521 Total, mgd<br />
Levy 5606 Glen Robinson R240 G 0.006 0.009 0.009 E<br />
Levy 6586 Corrie Bell R406 G 0.007 0.654 0.012 E<br />
Levy 9479 Levy Co BOCC R230 G 0.010 0.015 0.015 E<br />
Levy 9610 Solera, LLC R240 G 0.002 0.003 0.003 E<br />
Levy 10657 Levy Co School Board R244 G 0.018 0.028 0.028 E<br />
Levy 11581 Williston Highland Golf & Country Club R250 G 0.205 0.294 0.294 E<br />
Levy 12497 <strong>Florida</strong> Sheriffs Youth Ranches Inc R240 G 0.001 0.006 0.001 E<br />
Levy County Totals<br />
0.000 Metered, mgd<br />
0.249 <strong>Estimated</strong> , mgd<br />
0.249 Total, mgd<br />
Manatee 503 J T Reeder Part LLLP & Snell Family LP of SW <strong>Florida</strong> R240 G 0.004 0.875 0.004 M<br />
Manatee 3744 Taylor Woodrow Communities at Artisan Lake, LLC R240 G 0.000 0.459 0.459 M<br />
Manatee 3956 G & D FARMS INC and 2 P Cattle Co. R240 G 0.000 0.710 0.000 M<br />
Manatee 4443 Harbourvest LLC R240 G 1.120 2.753 2.753 M<br />
Manatee 4507 The Links Partnership, Ltd R250 G 0.143 0.306 0.306 M<br />
Manatee 5592 River Plantation HOA Inc R245 G 0.141 0.122 0.122 M<br />
Manatee 5656 <strong>Water</strong>lefe CDD R250 G 0.107 0.255 0.255 M<br />
Manatee 6293 Palm‐Aire Country Club R250 G 0.165 0.399 0.399 M<br />
Manatee 6590 Copperstone Master Assoc. and Copperstone Townhome R240 G 0.054 0.125 0.125 M<br />
HOA, Inc.<br />
Manatee 7031 Adamatmar LLC R240 G 0.000 0.318 0.000 M<br />
Manatee 7235 Gamble Creek LC & Manatee Co & Twin Rivers II LC R240 G 0.000 0.231 0.231 M<br />
M/E 5<br />
<strong>Southwest</strong> <strong>Florida</strong> <strong>Water</strong> <strong>Management</strong> District Page | 108
<strong>2011</strong> ESTIMATED WATER USE REPORT<br />
Table A5. Metered and <strong>Estimated</strong> Recreation/Aesthetic WUPs, Withdrawals and Permitted <strong>Use</strong> (mgd), <strong>2011</strong><br />
County<br />
WUP<br />
Number<br />
Permittee<br />
<strong>Southwest</strong> <strong>Florida</strong> <strong>Water</strong> <strong>Management</strong> District Page | 109<br />
<strong>Use</strong><br />
Code 1<br />
Source<br />
2<br />
Annual<br />
Average<br />
Pumpage 3<br />
Total<br />
Permitted<br />
Annual Average<br />
Quantity<br />
Permitted<br />
Quantity<br />
Attributed to<br />
R/A <strong>Use</strong><br />
Category 4<br />
Manatee 7632 Cascades At Sarasota Res Assoc R240 G 0.161 0.157 0.157 M<br />
Manatee 7846 Schroeder‐Manatee Ranch Inc R240 G 4.752 #### 12.057 M<br />
Manatee 7846 Schroeder‐Manatee Ranch Inc R240 S 0.736 #### 12.057 M<br />
Manatee 8012 Sara Bay Country Club Inc R250 G 0.001 0.152 0.152 M<br />
Manatee 8012 Sara Bay Country Club Inc R250 S 0.137 0.152 0.152 M<br />
Manatee 8508 Peridia Property Owners Assoc Inc R250 G 0.053 0.118 0.118 M<br />
Manatee 8965 River Club Golf Course Inc R250 G 0.290 0.213 0.213 M<br />
Manatee 8965 River Club Golf Course Inc R250 S 0.000 0.213 0.213 M<br />
Manatee 9379 Tara Golf & Country Club R250 G 0.088 0.262 0.262 M<br />
Manatee 9400 Recie Putnal R440 G 0.000 0.156 0.003 M<br />
Manatee 9400 Recie Putnal R440 S 0.000 0.156 0.003 M<br />
Manatee 9808 Woolridge Investment LLC R250 G 0.118 0.484 0.484 M<br />
Manatee 10450 River Wilderness Yacht & CC R250 G 0.000 0.330 0.330 M<br />
Manatee 11881 Preserve Golf LLC R250 G 0.030 0.258 0.258 M<br />
Manatee 12290 Lakeridge Falls Community Association R240 G 0.147 0.133 0.133 M<br />
Manatee 12613 Wilmington Land Co R240 G 0.135 0.065 0.065 M<br />
Manatee 12613 Wilmington Land Co R240 S 0.000 0.065 0.065 M<br />
Manatee 12630 The Concession Land Develop LLC R250 G 0.224 0.493 0.493 M<br />
Manatee 13035 Oakleaf Hammock HOA and Ryland Group Inc. R240 G 0.120 0.154 0.154 M<br />
Manatee 20088 IMG Academies, LLP R290 G 0.000 0.143 0.143 M<br />
Manatee 3791 Ruben‐Holland Development LLC R240 G 0.000 0.026 0.026 E<br />
Manatee 3812 Gibraltar‐Nottingham Heights LLC R240 G 0.024 0.037 0.037 E<br />
Manatee 3911 Paul Micherdzinski R240 G 0.003 0.004 0.004 E<br />
Manatee 4033 Palm Lake Condominium Assoc Inc R240 G 0.004 0.012 0.012 E<br />
Manatee 4056 Duke & Benedict Inc Dba Plantation Grove Limited R240 G 0.004 0.006 0.006 E<br />
Manatee 4513 Laurel Oak Park HOA R240 G 0.011 0.016 0.016 E<br />
Manatee 4601 Key Royale Club Inc R250 G 0.030 0.068 0.068 E<br />
Manatee 4605 Meadowcroft Condominium Association Inc R240 G 0.033 0.051 0.051 E<br />
Manatee 4645 Harrison Ranch Community Development District R240 G 0.000 0.051 0.051 E<br />
Manatee 4656 Whitfield Gardens HOA R240 G 0.004 0.006 0.006 E<br />
Manatee 4763 Taylor Morrison of FL Inc. and Crystal Lakes HOA of<br />
R244 G 0.029 0.044 0.044 E<br />
Manatee Inc.<br />
Manatee 5075 Village Green of Bradenton R240 G 0.000 0.024 0.024 E<br />
Manatee 5234 Carlton Arms of Bradenton R240 G 0.047 0.072 0.072 E<br />
M/E 5
<strong>2011</strong> ESTIMATED WATER USE REPORT<br />
Table A5. Metered and <strong>Estimated</strong> Recreation/Aesthetic WUPs, Withdrawals and Permitted <strong>Use</strong> (mgd), <strong>2011</strong><br />
County<br />
WUP<br />
Number<br />
Permittee<br />
<strong>Southwest</strong> <strong>Florida</strong> <strong>Water</strong> <strong>Management</strong> District Page | 110<br />
<strong>Use</strong><br />
Code 1<br />
Source<br />
2<br />
Annual<br />
Average<br />
Pumpage 3<br />
Total<br />
Permitted<br />
Annual Average<br />
Quantity<br />
Permitted<br />
Quantity<br />
Attributed to<br />
R/A <strong>Use</strong><br />
Category 4<br />
Manatee 5444 School District of Manatee County R245 G 0.015 0.271 0.027 E<br />
Manatee 5454 Palm View Golf Corporation R250 G 0.021 0.033 0.033 E<br />
Manatee 5520 Winding River Developments LLC R240 G 0.029 0.082 0.082 E<br />
Manatee 5534 River Isles Golf Association Inc R250 G 0.024 0.038 0.038 E<br />
Manatee 5617 Medallion Homes R240 G 0.044 0.332 0.216 E<br />
Manatee 5641 Sugar Mill Developers LLC R240 G 0.004 0.012 0.012 E<br />
Manatee 5655 Villa Del Sol Associates LP R240 G 0.014 0.021 0.021 E<br />
Manatee 5762 Aurora Ministries Inc (The Aurora Foundation) R240 G 0.000 0.056 0.056 E<br />
Manatee 5762 Aurora Ministries Inc (The Aurora Foundation) R240 S 0.018 0.056 0.056 E<br />
Manatee 5889 River Oaks Apartments Condominium Owners Assoc Inc R240 G 0.001 0.001 0.001 E<br />
Manatee 6387 School District of Manatee County R240 G 0.004 0.006 0.006 E<br />
Manatee 6610 School District of Manatee County R245 G 0.013 0.020 0.020 E<br />
Manatee 6611 Manatee County School Board R240 G 0.004 0.012 0.012 E<br />
Manatee 7179 School District of Manatee County R240 G 0.010 0.016 0.016 E<br />
Manatee 7480 North Manatee Industrial Park Condo Association, Inc. R240 G 0.003 0.010 0.010 E<br />
Manatee 7554 Lakeside Preserve Homeowners Association, Inc R240 G 0.019 0.086 0.086 E<br />
Manatee 7651 City Of Bradenton R250 G 0.159 0.231 0.231 E<br />
Manatee 7684 Windward Bay Inc. / Attn: Fred Gholson R240 G 0.020 0.031 0.031 E<br />
Manatee 7897 Manatee County School Board R245 G 0.012 0.018 0.018 E<br />
Manatee 7898 School District of Manatee County R240 G 0.009 0.028 0.028 E<br />
Manatee 7901 School District of Manatee County R240 G 0.004 0.006 0.006 E<br />
Manatee 7903 School District of Manatee County R240 G 0.001 0.001 0.001 E<br />
Manatee 7905 School District of Manatee County R240 G 0.008 0.012 0.012 E<br />
Manatee 7908 School District of Manatee County R240 G 0.016 0.025 0.025 E<br />
Manatee 7911 School District of Manatee County R240 G 0.009 0.021 0.015 E<br />
Manatee 7912 School District of Manatee County R240 G 0.003 0.004 0.004 E<br />
Manatee 7913 School District of Manatee County R240 G 0.001 0.002 0.002 E<br />
Manatee 7917 School District of Manatee County R244 G 0.001 0.001 0.001 E<br />
Manatee 7995 Cambridge Village Association Inc R244 G 0.034 0.053 0.053 E<br />
Manatee 8029 Clarence L Love Sr R240 G 0.005 0.016 0.016 E<br />
Manatee 8029 Clarence L Love Sr R240 S 0.005 0.016 0.016 E<br />
Manatee 8064 Manatee County Board Of County Commissioners R240 G 0.015 0.024 0.024 E<br />
Manatee 8385 Perico Bay Club Association Inc R240 G 0.029 0.066 0.066 E<br />
Manatee 8389 Presbyterian Retirement R240 G 0.002 0.004 0.004 E<br />
M/E 5
<strong>2011</strong> ESTIMATED WATER USE REPORT<br />
Table A5. Metered and <strong>Estimated</strong> Recreation/Aesthetic WUPs, Withdrawals and Permitted <strong>Use</strong> (mgd), <strong>2011</strong><br />
County<br />
WUP<br />
Number<br />
Permittee<br />
<strong>Southwest</strong> <strong>Florida</strong> <strong>Water</strong> <strong>Management</strong> District Page | 111<br />
<strong>Use</strong><br />
Code 1<br />
Source<br />
2<br />
Annual<br />
Average<br />
Pumpage 3<br />
Total<br />
Permitted<br />
Annual Average<br />
Quantity<br />
Permitted<br />
Quantity<br />
Attributed to<br />
R/A <strong>Use</strong><br />
Category 4<br />
Manatee 8447 Village Green Of Bradenton Condo R240 G 0.011 0.018 0.018 E<br />
Manatee 8479 Gospel Crusade Inc R240 G 0.010 0.015 0.015 E<br />
Manatee 8588 JMC Development Corp R250 G 0.015 0.079 0.079 E<br />
Manatee 8588 JMC Development Corp R250 S 0.021 0.079 0.079 E<br />
Manatee 8608 Mote Ranch Homeowners Association Inc R240 G 0.016 0.029 0.029 E<br />
Manatee 9118 Cypress Creek Est R240 S 0.008 0.012 0.012 E<br />
Manatee 9187 Westwinds Village Inc R240 G 0.030 0.047 0.047 E<br />
Manatee 9755 Simon Capital Limited Partnership R240 G 0.006 0.009 0.009 E<br />
Manatee 10033 MML LI, LLC R250 G 0.079 0.186 0.186 E<br />
Manatee 10033 MML LI, LLC R250 S 0.006 0.186 0.186 E<br />
Manatee 10064 Manatee County School Board; Attn: Michael Pendley R240 G 0.028 0.043 0.043 E<br />
Manatee 10160 Benderson 85‐1 Trust R240 G 0.001 0.002 0.002 E<br />
Manatee 10164 Riggs National Property Co LLC R240 G 0.017 0.084 0.084 E<br />
Manatee 10164 Riggs National Property Co LLC R240 S 0.000 0.084 0.084 E<br />
Manatee 10433 Greens of Manatee R250 G 0.011 0.017 0.017 E<br />
Manatee 10434 Parkwood Professional Land Trust #2, C/O Kent Burnside R244 G 0.012 0.019 0.019 E<br />
Manatee 10445 Imperial Lakes Golf Club R250 G 0.000 0.069 0.069 E<br />
Manatee 10445 Imperial Lakes Golf Club R250 S 0.000 0.069 0.069 E<br />
Manatee 10690 Port Manatee Industrial Park LLC R240 G 0.003 0.061 0.004 E<br />
Manatee 10988 Manatee County School Board R240 G 0.007 0.011 0.011 E<br />
Manatee 11109 Shawn Sheridan R290 G 0.000 0.002 0.002 E<br />
Manatee 11306 Manatee Co School Board R245 G 0.020 0.031 0.031 E<br />
Manatee 11356 Mount Vernon Condominium Association Inc R240 G 0.000 0.082 0.082 E<br />
Manatee 11356 Mount Vernon Condominium Association Inc R240 S 0.000 0.082 0.082 E<br />
Manatee 11423 Manatee County Board Of County Commissioners R240 G 0.005 0.008 0.008 E<br />
Manatee 11459 Hi‐Stat Manufacturing R240 G 0.004 0.013 0.013 E<br />
Manatee 11464 Golf Pointe At Palm Aire Cc Association Inc R240 S 0.000 0.006 0.006 E<br />
Manatee 11465 <strong>Southwest</strong> <strong>Florida</strong> Council‐Boy Scouts Of America R310 G 0.003 0.007 0.007 E<br />
Manatee 11514 Cove Sound Moorings Inc R240 G 0.002 0.004 0.004 E<br />
Manatee 11530 Harbour Pointe Apt & Jerry Hasara R240 G 0.007 0.011 0.011 E<br />
Manatee 11537 Maple Leaf Development LLC R240 G 0.016 0.025 0.025 E<br />
Manatee 11627 Cambridge Village West R240 G 0.011 0.020 0.020 E<br />
Manatee 11633 Jack Younker R240 G 0.001 0.002 0.002 E<br />
Manatee 11648 Manatee Co Port Authority & Sheriff Department R240 G 0.002 0.004 0.004 E<br />
M/E 5
<strong>2011</strong> ESTIMATED WATER USE REPORT<br />
Table A5. Metered and <strong>Estimated</strong> Recreation/Aesthetic WUPs, Withdrawals and Permitted <strong>Use</strong> (mgd), <strong>2011</strong><br />
County<br />
WUP<br />
Number<br />
Permittee<br />
<strong>Southwest</strong> <strong>Florida</strong> <strong>Water</strong> <strong>Management</strong> District Page | 112<br />
<strong>Use</strong><br />
Code 1<br />
Source<br />
2<br />
Annual<br />
Average<br />
Pumpage 3<br />
Total<br />
Permitted<br />
Annual Average<br />
Quantity<br />
Permitted<br />
Quantity<br />
Attributed to<br />
R/A <strong>Use</strong><br />
Category 4<br />
Manatee 11660 University Medical Park Inc R310 G 0.003 0.009 0.009 E<br />
Manatee 11666 Terra Ceia Manor HOA Inc R245 G 0.007 0.021 0.021 E<br />
Manatee 11666 Terra Ceia Manor HOA Inc R245 S 0.000 0.021 0.021 E<br />
Manatee 11678 Hr Acquisition I Corp R240 G 0.001 0.002 0.002 E<br />
Manatee 11686 ASAP Motorcars Inc R240 G 0.000 0.001 0.001 E<br />
Manatee 11736 Krizmanich Manatee Holdings Inc R240 G 0.018 0.027 0.027 E<br />
Manatee 11760 Juerg Ragaz R240 G 0.011 0.018 0.018 E<br />
Manatee 11817 Skyway Memorial Gardens R240 G 0.019 0.029 0.029 E<br />
Manatee 11848 Foxbrook Homeowner's Association, Inc. R240 G 0.037 0.084 0.084 E<br />
Manatee 11865 Bay Hollow Condo Assoc Inc R240 G 0.003 0.005 0.005 E<br />
Manatee 11870 School District of Manatee County R240 G 0.035 0.054 0.054 E<br />
Manatee 11895 Barret Bradenton Inc R240 G 0.001 0.001 0.001 E<br />
Manatee 12042 H.Q. Properties, Inc. R200 G 0.004 0.007 0.007 E<br />
Manatee 12065 Greyhawk Landing CDD R244 G 0.026 0.041 0.041 E<br />
Manatee 12078 Marina Palms 299 LLC R240 G 0.003 0.005 0.005 E<br />
Manatee 12124 Manatee County School Board R244 G 0.013 0.020 0.020 E<br />
Manatee 12139 Cortez Avenue LLC R244 G 0.004 0.006 0.006 E<br />
Manatee 12222 Longboat Harbour Owners Association, Inc. R244 G 0.018 0.027 0.027 E<br />
Manatee 12227 Care Net Manasota Crisis Pregnancy Center, Inc. R240 G 0.000 0.000 0.000 E<br />
Manatee 12321 Sheridan Place Of Bradenton Ltd R240 G 0.000 0.013 0.013 E<br />
Manatee 12322 Quail Run HOA R240 G 0.001 0.002 0.002 E<br />
Manatee 12376 Centex Homes A Nevada General Partnership R240 G 0.003 0.027 0.027 E<br />
Manatee 12435 School District of Manatee County R240 G 0.037 0.057 0.057 E<br />
Manatee 12436 Manatee County School Board R240 G 0.007 0.021 0.021 E<br />
Manatee 12436 Manatee County School Board R240 S 0.000 0.021 0.021 E<br />
Manatee 12463 Williams Herold Communities LLC R240 G 0.025 0.052 0.052 E<br />
Manatee 12499 B W General Contractors Inc R240 G 0.006 0.009 0.009 E<br />
Manatee 12556 Wilmington Land Co R240 G 0.009 0.059 0.059 E<br />
Manatee 12556 Wilmington Land Co R240 S 0.000 0.059 0.059 E<br />
Manatee 12594 Desoto Square Villas Condo R240 G 0.015 0.023 0.023 E<br />
Manatee 12623 Walmart Stores East Incorporated R240 G 0.012 0.018 0.018 E<br />
Manatee 12632 WR‐I Associates, Ltd. R240 G 0.000 0.086 0.086 E<br />
Manatee 12638 Diocese Of Venice R240 G 0.004 0.006 0.006 E<br />
Manatee 12753 Compass Property Holdings R240 G 0.037 0.086 0.086 E<br />
M/E 5
<strong>2011</strong> ESTIMATED WATER USE REPORT<br />
Table A5. Metered and <strong>Estimated</strong> Recreation/Aesthetic WUPs, Withdrawals and Permitted <strong>Use</strong> (mgd), <strong>2011</strong><br />
County<br />
WUP<br />
Number<br />
Permittee<br />
<strong>Southwest</strong> <strong>Florida</strong> <strong>Water</strong> <strong>Management</strong> District Page | 113<br />
<strong>Use</strong><br />
Code 1<br />
Source<br />
2<br />
Annual<br />
Average<br />
Pumpage 3<br />
Total<br />
Permitted<br />
Annual Average<br />
Quantity<br />
Permitted<br />
Quantity<br />
Attributed to<br />
R/A <strong>Use</strong><br />
Category 4<br />
Manatee 12753 Compass Property Holdings R240 S 0.000 0.086 0.086 E<br />
Manatee 12895 Alfred & Velma Cassick‐Wilma & Steve Whidden R240 G 0.000 0.049 0.049 E<br />
Manatee 12900 Minto Bradenton, LLC R240 G 0.045 0.131 0.131 E<br />
Manatee 12932 CL Realty LLC R240 G 0.025 0.038 0.038 E<br />
Manatee 13017 Greens At El Conquistador HOA R240 G 0.006 0.018 0.018 E<br />
Manatee 13017 Greens At El Conquistador HOA R240 S 0.006 0.018 0.018 E<br />
Manatee 13089 University Place HOA R240 G 0.055 0.085 0.085 E<br />
Manatee 13107 William Vernon‐River Wilderness Assoc Ltd R240 G 0.015 0.036 0.036 E<br />
Manatee 13125 Sanctuary Cove (Bradenton) ASLI VI, LLLP R240 G 0.045 0.070 0.070 E<br />
Manatee 13168 Southern Hospitality Assoc LLC & Bradenton Land Co LLC R240 G 0.000 0.076 0.076 E<br />
Manatee 13300 Palm‐Aire At Sarasota Condo Asso D R240 G 0.007 0.018 0.018 E<br />
Manatee 13345 Manatee Co Property Mng R240 G 0.000 0.019 0.019 E<br />
Manatee 13355 The Oaks Owners Assoc Inc R240 G 0.004 0.006 0.006 E<br />
Manatee 20001 Pinehurst Association Inc R240 G 0.004 0.014 0.014 E<br />
Manatee 20003 Business Park at Washington Crossing LLC R240 G 0.000 0.008 0.008 E<br />
Manatee 20162 River Club Homeowners Association R244 G 0.001 0.002 0.002 E<br />
Manatee 20191 Arbor Oaks Property Owners Association R244 G 0.004 0.007 0.007 E<br />
Manatee County Totals<br />
8.726 Metered, mgd<br />
1.673 <strong>Estimated</strong> , mgd<br />
10.399 Total, mgd<br />
Marion 1156 Bay Laurel Community Development District R250 G 0.607 2.555 0.515 M<br />
Marion 2697 Charlotte Weber R240 G 0.057 1.028 0.180 M<br />
Marion 5642 Golden Hills Golf & Turf Club R250 G 0.153 0.223 0.223 M<br />
Marion 6585 Ocala Jockey Club Inc R240 G 0.035 0.191 0.079 M<br />
Marion 6674 Golden Ocala Golf Course and Country Club R250 G 0.127 0.449 0.396 M<br />
Marion 7178 Development & Construction Corp Of America R250 G 0.329 0.363 0.363 M<br />
Marion 10266 Pulte Homes Corp R250 G 0.351 0.369 0.369 M<br />
Marion 10266 Pulte Homes Corp R250 S 0.000 0.369 0.369 M<br />
Marion 10476 Pulte Homes (Spruce Creek Preserve) R250 G 0.318 0.392 0.392 M<br />
Marion 10861 Warrior Acquisitions LLC R250 G 0.001 0.338 0.338 M<br />
Marion 12843 Vikings LLC R250 G 0.299 0.311 0.311 M<br />
Marion 12843 Vikings LLC R250 S 0.000 0.311 0.311 M<br />
Marion 12911 Ocala 623 Land Development LLC R250 G 0.000 0.221 0.221 M<br />
M/E 5
<strong>2011</strong> ESTIMATED WATER USE REPORT<br />
Table A5. Metered and <strong>Estimated</strong> Recreation/Aesthetic WUPs, Withdrawals and Permitted <strong>Use</strong> (mgd), <strong>2011</strong><br />
County<br />
WUP<br />
Number<br />
Permittee<br />
<strong>Southwest</strong> <strong>Florida</strong> <strong>Water</strong> <strong>Management</strong> District Page | 114<br />
<strong>Use</strong><br />
Code 1<br />
Source<br />
2<br />
Annual<br />
Average<br />
Pumpage 3<br />
Total<br />
Permitted<br />
Annual Average<br />
Quantity<br />
Permitted<br />
Quantity<br />
Attributed to<br />
R/A <strong>Use</strong><br />
Category 4<br />
Marion 12966 Stone Creek Community Assoc Inc R240 G 0.181 0.205 0.205 M<br />
Marion 12966 Stone Creek Community Assoc Inc R240 S 0.000 0.205 0.205 M<br />
Marion 12993 Summerglen Partners LLC R210 G 0.314 0.374 0.374 M<br />
Marion 12993 Summerglen Partners LLC R210 S 0.172 0.374 0.374 M<br />
Marion 20120 Kasmark, Inc R250 G 0.261 0.192 0.192 M<br />
Marion 20121 Rainbow's End Golf Club, Inc. R250 G 0.090 0.108 0.108 M<br />
Marion 20173 Sidney Colen and Associates LTD R250 G 0.195 0.489 0.489 M<br />
Marion 20174 On Top of the World Communities Inc R240 G 0.000 0.664 0.000 M<br />
Marion 4892 James J Crupi R230 G 0.003 0.005 0.005 E<br />
Marion 4913 Ocala Breeders Sales Co R230 G 0.029 0.065 0.065 E<br />
Marion 6373 Sumter Electric Cooperative Inc R240 G 0.002 0.003 0.003 E<br />
Marion 6888 Marion County School Board R240 G 0.028 0.088 0.040 E<br />
Marion 6935 Herman Heinlein R290 G 0.010 0.016 0.016 E<br />
Marion 6989 Carl Allen R230 G 0.002 0.126 0.003 E<br />
Marion 7664 Patrick & Elizabeth Everard R290 G 0.008 0.014 0.014 E<br />
Marion 7709 Joseph B. Greeley R230 G 0.003 0.004 0.004 E<br />
Marion 8075 Domenic And Marianna Martelli R240 G 0.003 0.046 0.005 E<br />
Marion 8139 Falls Of Ocala R320 G 0.001 0.040 0.002 E<br />
Marion 8763 <strong>Florida</strong> Dept Of Transportation District V R310 G 0.018 0.028 0.028 E<br />
Marion 10110 The Centers Inc R244 G 0.001 0.015 0.001 E<br />
Marion 10419 Jajolo LP R240 G 0.000 0.016 0.006 E<br />
Marion 10502 Marion County School Board R244 G 0.013 0.029 0.020 E<br />
Marion 10685 State of <strong>Florida</strong> Board R310 G 0.017 0.037 0.037 E<br />
Marion 10685 State of <strong>Florida</strong> Board R310 S 0.002 0.037 0.037 E<br />
Marion 11153 The Deltona Corporation R240 G 0.007 0.012 0.012 E<br />
Marion 11765 Hits Inc R240 G 0.060 0.093 0.093 E<br />
Marion 11799 Carlton Arms Of Ocala William Mahaffey R240 G 0.047 0.081 0.081 E<br />
Marion 11873 Farnsworth Farms Inc R300 G 0.005 0.009 0.009 E<br />
Marion 11998 Marion County School Board R240 G 0.003 0.009 0.009 E<br />
Marion 12029 Good Shepherd Memorial Gardens Inc R240 G 0.023 0.036 0.036 E<br />
Marion 12323 Spruce Creek Preserve Homeowners Association Inc R240 G 0.020 0.031 0.031 E<br />
Marion 13206 Jess S Jackson R230 G 0.007 0.014 0.011 E<br />
Marion 20167 CCW of Marion County LLC R244 G 0.001 0.002 0.002 E<br />
Marion 20175 Circle Square Ranch Master Association Inc R240 G 0.014 0.022 0.022 E<br />
M/E 5
<strong>2011</strong> ESTIMATED WATER USE REPORT<br />
Table A5. Metered and <strong>Estimated</strong> Recreation/Aesthetic WUPs, Withdrawals and Permitted <strong>Use</strong> (mgd), <strong>2011</strong><br />
County<br />
WUP<br />
Number<br />
Permittee<br />
<strong>Southwest</strong> <strong>Florida</strong> <strong>Water</strong> <strong>Management</strong> District Page | 115<br />
<strong>Use</strong><br />
Code 1<br />
Source<br />
2<br />
Annual<br />
Average<br />
Pumpage 3<br />
Total<br />
Permitted<br />
Annual Average<br />
Quantity<br />
Permitted<br />
Quantity<br />
Attributed to<br />
R/A <strong>Use</strong><br />
Category 4<br />
Marion 20176 Horticultural Arts and Park Institute Inc R260 G 0.008 0.013 0.013 E<br />
Marion County Totals<br />
3.490 Metered, mgd<br />
0.335 <strong>Estimated</strong> , mgd<br />
3.825 Total, mgd<br />
Pasco 347 Connerton Holdings LLC R240 G 0.017 0.419 0.419 M<br />
Pasco 2296 Saint Leo University Inc R240 G 0.030 0.241 0.056 M<br />
Pasco 3389 MJS Golf Group LLC R250 G 0.138 0.077 0.077 M<br />
Pasco 3389 MJS Golf Group LLC R250 S 0.000 0.077 0.077 M<br />
Pasco 4550 City of San Antonio R240 G 0.035 0.229 0.041 M<br />
Pasco 4649 Pinellas County Utilities R220 G 0.459 0.800 0.800 M<br />
Pasco 5054 JES Investments Inc R250 G 0.041 0.147 0.147 M<br />
Pasco 6113 Saddlebrook Resorts Inc R250 G 0.260 0.619 0.619 M<br />
Pasco 6113 Saddlebrook Resorts Inc R250 S 0.000 0.619 0.619 M<br />
Pasco 6129 <strong>Florida</strong> Fish & Wildlife Conservation Commission R220 G 0.000 0.269 0.269 M<br />
Pasco 7450 Peter M & Helen K Lenhardt Tst R250 G 0.000 0.001 0.001 M<br />
Pasco 7672 Ron & Nancy‐Andy & Chris Padova Mat & Bev Lowman R250 G 0.178 0.322 0.322 M<br />
Pasco 7733 The Links Of Lake Bernadette, Inc. R250 G 0.171 0.231 0.231 M<br />
Pasco 8561 S & R Development LLC dba Silverado Golf & C C R250 G 0.052 0.219 0.219 M<br />
Pasco 8561 S & R Development LLC dba Silverado Golf & C C R250 S 0.141 0.219 0.219 M<br />
Pasco 8892 Southport Springs I LP R250 G 0.113 0.111 0.111 M<br />
Pasco 9525 Lowman Links Inc R250 G 0.000 0.115 0.115 M<br />
Pasco 10039 Rexbo Realty R250 G 0.023 0.001 0.001 M<br />
Pasco 10366 Seven Springs Golf & Country Club R250 G 0.102 0.402 0.402 M<br />
Pasco 10366 Seven Springs Golf & Country Club R250 S 0.000 0.402 0.402 M<br />
Pasco 10870 Betmar Acres Club, Inc. R250 G 0.132 0.155 0.155 M<br />
Pasco 11275 TBG & CC Recreation LLC R250 G 0.000 0.100 0.100 M<br />
Pasco 11275 TBG & CC Recreation LLC R250 S 0.069 0.100 0.100 M<br />
Pasco 11589 Lex Oaks Golf 54 LLC R250 G 0.012 0.310 0.310 M<br />
Pasco 11650 Heritage Pines HOA R290 G 0.002 0.001 0.001 M<br />
Pasco 11773 Little Everglades Ranch Inc R245 G 0.048 0.452 0.168 M<br />
Pasco 11773 Little Everglades Ranch Inc R245 S 0.000 0.452 0.168 M<br />
Pasco 11898 Pasco County School Board R244 G 0.111 0.181 0.181 M<br />
Pasco 11913 Heritage Springs Comm Assoc R250 G 0.004 0.428 0.428 M<br />
Pasco 12044 The Groves CDD R250 G 0.006 0.184 0.184 M<br />
M/E 5
<strong>2011</strong> ESTIMATED WATER USE REPORT<br />
Table A5. Metered and <strong>Estimated</strong> Recreation/Aesthetic WUPs, Withdrawals and Permitted <strong>Use</strong> (mgd), <strong>2011</strong><br />
County<br />
WUP<br />
Number<br />
Permittee<br />
<strong>Southwest</strong> <strong>Florida</strong> <strong>Water</strong> <strong>Management</strong> District Page | 116<br />
<strong>Use</strong><br />
Code 1<br />
Source<br />
2<br />
Annual<br />
Average<br />
Pumpage 3<br />
Total<br />
Permitted<br />
Annual Average<br />
Quantity<br />
Permitted<br />
Quantity<br />
Attributed to<br />
R/A <strong>Use</strong><br />
Category 4<br />
Pasco 12044 The Groves CDD R250 S 0.189 0.184 0.184 M<br />
Pasco 12346 La Hacienda Del Cielo LLC R240 G 0.001 0.327 0.006 M<br />
Pasco 12754 The Ryland Group Inc R240 G 0.206 0.249 0.249 M<br />
Pasco 12754 The Ryland Group Inc R240 S 0.177 0.249 0.249 M<br />
Pasco 12784 Order Of Saint Benedict Of <strong>Florida</strong> A/K/A/ Saint Leo Abbey R250 G 0.089 0.175 0.144 M<br />
Pasco 13048 Pasco County Utilities Division R210 G 0.000 0.001 0.001 M<br />
Pasco 13247 Sundance Golf Corp R250 G 0.226 0.260 0.260 M<br />
Pasco 479 Spring Haven Condo Association R240 G 0.006 0.010 0.010 E<br />
Pasco 720 Golf View Villas Association Inc R240 G 0.001 0.002 0.002 E<br />
Pasco 779 <strong>Florida</strong> Hospital Zephyrhills R240 G 0.016 0.025 0.025 E<br />
Pasco 1597 SCI Funeral Services Of <strong>Florida</strong> Property Tax Dept R240 G 0.031 0.047 0.047 E<br />
Pasco 1821 Pasco Co Facilities Mgmt Dept R245 G 0.037 0.085 0.085 E<br />
Pasco 3577 Winters Mobile Home Park, Inc. R240 G 0.015 0.023 0.023 E<br />
Pasco 3819 American Condominium Park R240 G 0.004 0.007 0.007 E<br />
Pasco 3896 MHC Crystal Lakes LLC R240 G 0.013 0.020 0.020 E<br />
Pasco 4722 District School Board of Pasco County R240 G 0.002 0.027 0.011 E<br />
Pasco 4781 Ponderosa Park Civic Association Inc. R240 G 0.003 0.005 0.005 E<br />
Pasco 4800 Pasco County School Board R240 G 0.035 0.055 0.055 E<br />
Pasco 4802 Pasco County School Board (Gulf High School Well) R240 G 0.026 0.060 0.060 E<br />
Pasco 4803 Pasco Co School Board R240 G 0.006 0.034 0.014 E<br />
Pasco 4805 Pasco County School Board R240 G 0.007 0.012 0.012 E<br />
Pasco 5121 Willow Bend/Pasco HOA Inc R240 G 0.013 0.040 0.040 E<br />
Pasco 6648 KAK Ltd Stone Gate Of Pasco HOA Inc R240 G 0.005 0.007 0.007 E<br />
Pasco 6821 Suncoast Golf Inc R250 G 0.041 0.093 0.086 E<br />
Pasco 7576 Cannon Ranch LLC R250 G 0.251 0.360 0.360 E<br />
Pasco 7620 Pasco County School Board / Attn: Richard Graziano R240 G 0.058 0.090 0.090 E<br />
Pasco 7881 Valle Oaks Corporation (Valley R250 G 0.027 0.060 0.060 E<br />
Pasco 8018 Brentwood Estates R310 G 0.009 0.029 0.029 E<br />
Pasco 8510 Pasco Co BOCC W Pasco Government Center R245 G 0.025 0.039 0.039 E<br />
Pasco 8676 Carlton Arms Of Magnolia Valley R240 G 0.051 0.078 0.078 E<br />
Pasco 9602 District School Board Of Pasco Co. R244 G 0.055 0.086 0.086 E<br />
Pasco 9747 Gene E. Pike & Sandra K. Pike R310 G 0.001 0.002 0.002 E<br />
Pasco 9867 Henry H And Helen N Sanders Revo Cable Trust R406 G 0.000 0.000 0.000 E<br />
Pasco 9967 Quail Hollow Golf & Country Club R250 G 0.244 0.352 0.352 E<br />
M/E 5
<strong>2011</strong> ESTIMATED WATER USE REPORT<br />
Table A5. Metered and <strong>Estimated</strong> Recreation/Aesthetic WUPs, Withdrawals and Permitted <strong>Use</strong> (mgd), <strong>2011</strong><br />
County<br />
WUP<br />
Number<br />
Permittee<br />
<strong>Southwest</strong> <strong>Florida</strong> <strong>Water</strong> <strong>Management</strong> District Page | 117<br />
<strong>Use</strong><br />
Code 1<br />
Source<br />
2<br />
Annual<br />
Average<br />
Pumpage 3<br />
Total<br />
Permitted<br />
Annual Average<br />
Quantity<br />
Permitted<br />
Quantity<br />
Attributed to<br />
R/A <strong>Use</strong><br />
Category 4<br />
Pasco 10499 Jeffrey Jackson R250 G 0.038 0.086 0.086 E<br />
Pasco 11133 <strong>Southwest</strong> Fla <strong>Water</strong> Mgt District R270 G 0.032 0.072 0.072 E<br />
Pasco 11774 Sunden Tampa LLC R250 G 0.064 0.184 0.184 E<br />
Pasco 11774 Sunden Tampa LLC R250 S 0.064 0.184 0.184 E<br />
Pasco 11836 Tabcav Inc R240 G 0.000 0.000 0.000 E<br />
Pasco 11852 Burdge, Chris R310 G 0.006 0.009 0.009 E<br />
Pasco 12383 River Country Properties Inc Attn: S Champion R240 G 0.001 0.001 0.001 E<br />
Pasco 12397 Simpson, Wilton R240 G 0.002 0.003 0.003 E<br />
Pasco 12863 Pasco County School Board R245 G 0.012 0.019 0.019 E<br />
Pasco 20148 Thomas Edwards III R406 G 0.000 0.001 0.001 E<br />
Pasco County Totals<br />
3.032 Metered, mgd<br />
1.201 <strong>Estimated</strong> , mgd<br />
4.233 Total, mgd<br />
Pinellas 288 Countryside Country Club, Inc. R250 G 0.056 0.435 0.435 M<br />
Pinellas 288 Countryside Country Club, Inc. R250 S 0.000 0.435 0.435 M<br />
Pinellas 339 Clearwater Country Club R250 G 0.000 0.035 0.035 M<br />
Pinellas 708 Belleview Biltmore Country Club R250 G 0.002 0.100 0.100 M<br />
Pinellas 1155 Salamander Innisbrook LLC R250 G 0.000 0.174 0.174 M<br />
Pinellas 2215 Memorial Park Cemetery Inc R240 G 0.054 0.285 0.285 M<br />
Pinellas 2731 City of Largo, Largo Golf Course R250 G 0.026 0.104 0.104 M<br />
Pinellas 2731 City of Largo, Largo Golf Course R250 S 0.000 0.104 0.104 M<br />
Pinellas 3657 Mainlands of Tamarac R240 G 0.000 0.043 0.043 M<br />
Pinellas 3657 Mainlands of Tamarac R240 S 0.000 0.043 0.043 M<br />
Pinellas 3707 Bayou Golf LLC R250 G 0.218 0.512 0.512 M<br />
Pinellas 4555 Pinellas Co Parks & Conservation Department R240 S 0.000 0.234 0.234 M<br />
Pinellas 6701 Cypress Run of <strong>Florida</strong> LLC R250 G 0.093 0.135 0.135 M<br />
Pinellas 7362 Pinellas Co Parks & Conservation Department R240 G 0.000 0.177 0.109 M<br />
Pinellas 7362 Pinellas Co Parks & Conservation Department R240 S 0.000 0.177 0.109 M<br />
Pinellas 7437 Club Corp Golf of <strong>Florida</strong> LLC R240 G 0.057 1.300 1.300 M<br />
Pinellas 7437 Club Corp Golf of <strong>Florida</strong> LLC R240 S 0.000 1.300 1.300 M<br />
Pinellas 8142 Sylvan Abbey Memorial Park R230 G 0.086 0.175 0.175 M<br />
Pinellas 8959 Highland Lakes Homeowners Association R250 G 0.033 0.081 0.081 M<br />
Pinellas 9065 Lansbrook Master Association R240 G 0.000 0.219 0.219 M<br />
Pinellas 9065 Lansbrook Master Association R240 S 0.112 0.219 0.219 M<br />
M/E 5
<strong>2011</strong> ESTIMATED WATER USE REPORT<br />
Table A5. Metered and <strong>Estimated</strong> Recreation/Aesthetic WUPs, Withdrawals and Permitted <strong>Use</strong> (mgd), <strong>2011</strong><br />
County<br />
WUP<br />
Number<br />
Permittee<br />
<strong>Southwest</strong> <strong>Florida</strong> <strong>Water</strong> <strong>Management</strong> District Page | 118<br />
<strong>Use</strong><br />
Code 1<br />
Source<br />
2<br />
Annual<br />
Average<br />
Pumpage 3<br />
Total<br />
Permitted<br />
Annual Average<br />
Quantity<br />
Permitted<br />
Quantity<br />
Attributed to<br />
R/A <strong>Use</strong><br />
Category 4<br />
Pinellas 9551 Ace Wentworth, Inc. R250 G 0.039 0.191 0.191 M<br />
Pinellas 9670 Ace Crescent Oaks, Inc R250 G 0.010 0.286 0.286 M<br />
Pinellas 10318 Homeowners of Palm Hill Inc. R244 G 0.037 0.149 0.149 M<br />
Pinellas 10694 CT‐Tides, LLC R250 G 0.005 0.172 0.172 M<br />
Pinellas 10694 CT‐Tides, LLC R250 S 0.000 0.172 0.172 M<br />
Pinellas 10882 Pinellas Co Parks & Conservation Department R240 S 0.008 0.306 0.306 M<br />
Pinellas 11816 Clearwater Golf Assoc Inc R250 G 0.085 0.156 0.156 M<br />
Pinellas 11995 Seminole Lake Golf Course Inc R250 G 0.167 0.180 0.180 M<br />
Pinellas 121 Pinellas County School Board R240 G 0.024 0.054 0.054 E<br />
Pinellas 193 Pinellas Co Parks & Conservation Department R240 S 0.000 0.031 0.031 E<br />
Pinellas 334 Belleview Biltmore Golf Club R250 G 0.000 0.072 0.072 E<br />
Pinellas 346 Dunedin Country Club R250 G 0.000 0.035 0.035 E<br />
Pinellas 585 Seminole Gardens LLC R240 S 0.026 0.059 0.059 E<br />
Pinellas 1814 Seventieth Somerset Place C/O Sterling Mgmt R240 G 0.003 0.005 0.005 E<br />
Pinellas 3158 Lake Valencia Homeowners' Association R244 G 0.001 0.002 0.002 E<br />
Pinellas 3158 Lake Valencia Homeowners' Association R244 S 0.000 0.002 0.002 E<br />
Pinellas 3694 City Of St Petersburg R230 G 0.008 0.012 0.012 E<br />
Pinellas 4316 Pinellas Co Parks Dept R240 G 0.014 0.063 0.063 E<br />
Pinellas 4489 Pinellas County School Board R244 G 0.019 0.030 0.030 E<br />
Pinellas 5236 Florin Golf Investors LLC R250 G 0.000 0.038 0.038 E<br />
Pinellas 5236 Florin Golf Investors LLC R250 S 0.000 0.038 0.038 E<br />
Pinellas 5896 Willowood Homeowner'S Association R240 G 0.012 0.018 0.018 E<br />
Pinellas 6076 Pinellas County School Board R240 G 0.007 0.011 0.011 E<br />
Pinellas 6084 N A & R P Scherer R240 G 0.001 0.001 0.001 E<br />
Pinellas 6567 Pinellas Co Parks & Conservation Department R240 G 0.011 0.017 0.017 E<br />
Pinellas 6575 Curlew Hills Memory Gardens Inc R230 G 0.036 0.056 0.056 E<br />
Pinellas 6652 Hammock Pine POA R240 G 0.023 0.036 0.036 E<br />
Pinellas 7300 Innisbrook Condominium Assoc Inc R240 G 0.000 0.033 0.033 E<br />
Pinellas 7323 Pinellas County School Board R240 G 0.015 0.023 0.023 E<br />
Pinellas 7537 Pinellas County School Board R240 G 0.012 0.019 0.019 E<br />
Pinellas 7677 Webbs Nursery Inc R240 G 0.000 0.093 0.002 E<br />
Pinellas 7677 Webbs Nursery Inc R240 S 0.001 0.093 0.002 E<br />
Pinellas 7980 Pinellas County School Board R230 G 0.025 0.058 0.058 E<br />
Pinellas 8055 Leisure Associates Limited D/B/A Oak Crest/Acorn MHC R240 G 0.036 0.077 0.077 E<br />
M/E 5
<strong>2011</strong> ESTIMATED WATER USE REPORT<br />
Table A5. Metered and <strong>Estimated</strong> Recreation/Aesthetic WUPs, Withdrawals and Permitted <strong>Use</strong> (mgd), <strong>2011</strong><br />
County<br />
WUP<br />
Number<br />
Permittee<br />
<strong>Southwest</strong> <strong>Florida</strong> <strong>Water</strong> <strong>Management</strong> District Page | 119<br />
<strong>Use</strong><br />
Code 1<br />
Source<br />
2<br />
Annual<br />
Average<br />
Pumpage 3<br />
Total<br />
Permitted<br />
Annual Average<br />
Quantity<br />
Permitted<br />
Quantity<br />
Attributed to<br />
R/A <strong>Use</strong><br />
Category 4<br />
Pinellas 9319 Aimco/Brandywine LP R240 G 0.006 0.009 0.009 E<br />
Pinellas 9424 Tarponaire Mobile Resort R240 S 0.003 0.005 0.005 E<br />
Pinellas 10358 Regency Oaks LLC R240 G 0.036 0.056 0.056 E<br />
Pinellas 10375 Pinellas County School Board R240 G 0.018 0.028 0.028 E<br />
Pinellas 10395 Chateaux De Bardmoor Condominium Owners Association R240 G 0.023 0.035 0.035 E<br />
Inc<br />
Pinellas 10732 Lansbrook Golf Club Corp R250 G 0.034 0.347 0.347 E<br />
Pinellas 10732 Lansbrook Golf Club Corp R250 S 0.188 0.347 0.347 E<br />
Pinellas 10787 Mainlands Of Tamarac By The Gulf Unit Six Association Inc R240 S 0.023 0.052 0.052 E<br />
Pinellas 10860 Pinellas Co Parks & Conservation Department R240 G 0.025 0.039 0.039 E<br />
Pinellas 10951 Brown, Kennedy & Roberts R240 G 0.011 0.077 0.077 E<br />
Pinellas 10951 Brown, Kennedy & Roberts R240 S 0.000 0.077 0.077 E<br />
Pinellas 11000 CCC Investments I LLC R240 G 0.013 0.021 0.021 E<br />
Pinellas 11446 Gardens Domicurculum R240 S 0.029 0.044 0.044 E<br />
Pinellas 12099 St. Petersburg College R244 G 0.007 0.011 0.011 E<br />
Pinellas 12339 Palm Harbor Community Services Agency Inc R245 G 0.013 0.020 0.020 E<br />
Pinellas 12771 Cfc Pasadena Golf LLC Dba Pasadena Yacht & Country Club R240 G 0.024 0.038 0.038 E<br />
Pinellas 20030 Feather Sound Golf, LLC R250 S 0.176 0.253 0.253 E<br />
Pinellas 20033 Gregory A. Lewis and Julie L. Burd R240 G 0.001 0.002 0.002 E<br />
Pinellas County Totals<br />
1.088 Metered, mgd<br />
0.904 <strong>Estimated</strong> , mgd<br />
1.992 Total, mgd<br />
Polk 143 Mountain Lake Corp R220 G 1.539 3.380 2.542 M<br />
Polk 1625 Four Lakes Golf Club Ltd R250 G 0.166 0.406 0.160 M<br />
Polk 3150 KC Industries LLC & KC Industries Properties LLC R290 G 0.027 0.192 0.050 M<br />
Polk 4345 Mixon Family Farm Inc R240 G 0.000 0.568 0.000 M<br />
Polk 4403 Clarence J & Delores Socia R250 G 0.113 0.267 0.267 M<br />
Polk 4403 Clarence J & Delores Socia R250 S 0.000 0.267 0.267 M<br />
Polk 4698 Bok Tower Gardens Foundation Inc R260 G 0.130 0.200 0.200 M<br />
Polk 5251 Grenelefe Resort LLC R250 G 0.460 1.278 0.592 M<br />
Polk 5524 Robert Weaver R250 G 0.110 0.135 0.135 M<br />
Polk 6128 Ben Hill Griffin, Inc. R250 G 0.372 0.313 0.307 M<br />
Polk 7187 CHC VII Ltd Century Realty Fund R250 G 0.155 0.429 0.173 M<br />
Polk 7187 CHC VII Ltd Century Realty Fund R250 S 0.000 0.429 0.173 M<br />
M/E 5
<strong>2011</strong> ESTIMATED WATER USE REPORT<br />
Table A5. Metered and <strong>Estimated</strong> Recreation/Aesthetic WUPs, Withdrawals and Permitted <strong>Use</strong> (mgd), <strong>2011</strong><br />
County<br />
WUP<br />
Number<br />
Permittee<br />
<strong>Southwest</strong> <strong>Florida</strong> <strong>Water</strong> <strong>Management</strong> District Page | 120<br />
<strong>Use</strong><br />
Code 1<br />
Source<br />
2<br />
Annual<br />
Average<br />
Pumpage 3<br />
Total<br />
Permitted<br />
Annual Average<br />
Quantity<br />
Permitted<br />
Quantity<br />
Attributed to<br />
R/A <strong>Use</strong><br />
Category 4<br />
Polk 7328 Carefree RV Country Club of Winter Haven Inc R250 G 0.051 0.131 0.052 M<br />
Polk 7489 Merlin Entertainments Group <strong>Florida</strong> LLC R240 G 0.061 0.242 0.242 M<br />
Polk 7489 Merlin Entertainments Group <strong>Florida</strong> LLC R240 S 0.000 0.242 0.242 M<br />
Polk 8467 City of Lakeland <strong>Water</strong> Utilities <strong>Water</strong> Administration R250 G 0.150 0.313 0.313 M<br />
Polk 8472 Cypress Lakes Associates LTD R250 G 0.077 0.152 0.152 M<br />
Polk 8553 Cypresswood Golf & Country Club R250 G 0.116 0.280 0.280 M<br />
Polk 8565 Imperial Lakes Land Corp R250 G 0.002 0.337 0.337 M<br />
Polk 8967 Sweetwater Community Inc R250 G 0.041 0.146 0.043 M<br />
Polk 9007 Schalamar Creek Golf & Country Club Community Ltd R250 G 0.117 0.158 0.158 M<br />
Polk 9123 Carlton Arms of Lakeland R240 G 0.026 0.099 0.099 M<br />
Polk 9234 City of Bartow R250 G 0.143 0.155 0.155 M<br />
Polk 9961 The Drummond Co Inc R250 G 0.061 0.285 0.285 M<br />
Polk 9961 The Drummond Co Inc R250 S 0.146 0.285 0.285 M<br />
Polk 9985 J L Land Development Inc R240 G 0.232 0.363 0.363 M<br />
Polk 10392 Milmack Inc R250 G 0.307 0.260 0.260 M<br />
Polk 10392 Milmack Inc R250 S 0.000 0.260 0.260 M<br />
Polk 10559 Polk Co BOCC‐ Parks & Natural Resources Division R245 G 0.091 0.118 0.118 M<br />
Polk 10656 Lake Marion Development Group LLC R250 G 0.179 0.180 0.180 M<br />
Polk 10826 Lone Palm Golf Club R250 G 0.009 0.260 0.260 M<br />
Polk 10826 Lone Palm Golf Club R250 S 0.083 0.260 0.260 M<br />
Polk 11693 City of Lakeland Parks & Recreation Department R230 G 0.075 0.176 0.159 M<br />
Polk 12172 Lake Ashton Golf Club LTD R250 G 0.133 0.248 0.248 M<br />
Polk 12636 Lake Region Yacht & Country Club R250 G 0.141 0.176 0.176 M<br />
Polk 12636 Lake Region Yacht & Country Club R250 S 0.000 0.176 0.176 M<br />
Polk 12652 Kitson & Partners Orlando Golf L LC Dba Highlands Reserve R250 G 0.300 0.241 0.241 M<br />
G C<br />
Polk 12689 Southern Dunes Golf & Country Club Inc R250 G 0.093 0.242 0.242 M<br />
Polk 12801 Golf Club at Bridgewater LLC R250 G 0.225 0.228 0.228 M<br />
Polk 12801 Golf Club at Bridgewater LLC R250 S 0.000 0.228 0.228 M<br />
Polk 13330 City of Winter Haven, Willowbrook R250 G 0.000 0.043 0.043 M<br />
Polk 137 Oakbridge Properties Inc C/O Durham & Assoc Inc R240 G 0.001 0.002 0.002 E<br />
Polk 418 Hunters Ridge HOA R240 G 0.002 0.003 0.003 E<br />
Polk 454 Sutton Place Of Auburndale Inc R200 G 0.003 0.005 0.005 E<br />
Polk 484 Polk Co School Board ‐ Attn Porcha Williams R240 G 0.022 0.034 0.034 E<br />
M/E 5
<strong>2011</strong> ESTIMATED WATER USE REPORT<br />
Table A5. Metered and <strong>Estimated</strong> Recreation/Aesthetic WUPs, Withdrawals and Permitted <strong>Use</strong> (mgd), <strong>2011</strong><br />
County<br />
WUP<br />
Number<br />
Permittee<br />
<strong>Southwest</strong> <strong>Florida</strong> <strong>Water</strong> <strong>Management</strong> District Page | 121<br />
<strong>Use</strong><br />
Code 1<br />
Source<br />
2<br />
Annual<br />
Average<br />
Pumpage 3<br />
Total<br />
Permitted<br />
Annual Average<br />
Quantity<br />
Permitted<br />
Quantity<br />
Attributed to<br />
R/A <strong>Use</strong><br />
Category 4<br />
Polk 509 Osprey Pointe Of Winter Haven R240 G 0.006 0.009 0.009 E<br />
Polk 648 Donald Drawdy R240 G 0.017 0.026 0.026 E<br />
Polk 679 Lake Bess Golf Club Inc R250 G 0.028 0.063 0.063 E<br />
Polk 782 Sun Lake Juliana LLC R240 G 0.021 0.032 0.032 E<br />
Polk 792 Marjorie H Roe R240 G 0.002 0.022 0.004 E<br />
Polk 861 Robert And Sara Rosinsky R240 G 0.000 0.001 0.001 E<br />
Polk 881 School Board Of Polk Co Construc R240 G 0.029 0.045 0.045 E<br />
Polk 1164 Polk Co School Board R245 G 0.014 0.022 0.022 E<br />
Polk 1165 Polk County School Board R240 G 0.015 0.024 0.024 E<br />
Polk 1181 Speedway Superamerica LLC R240 G 0.013 0.020 0.020 E<br />
Polk 1247 Sandpiper Golf & Country Club R250 G 0.215 0.309 0.309 E<br />
Polk 1262 George P Telfer R245 G 0.000 0.001 0.001 E<br />
Polk 1288 James Gold R240 G 0.001 0.007 0.001 E<br />
Polk 1291 Lawrence & Mary Hebble R240 G 0.000 0.001 0.001 E<br />
Polk 1364 Robert Hernandez R245 G 0.000 0.000 0.000 E<br />
Polk 1421 Riverlake Properties Inc R240 G 0.004 0.006 0.006 E<br />
Polk 1522 Faith Baptist Church Of Winter R240 G 0.007 0.010 0.010 E<br />
Polk 1735 Silver Lakes Of Lakeland HOA Inc R240 G 0.004 0.006 0.006 E<br />
Polk 1825 Country Crossing Owners Assoc Inc R240 G 0.001 0.002 0.002 E<br />
Polk 1862 Danon Moxley R310 G 0.000 0.098 0.003 E<br />
Polk 1862 Danon Moxley R310 S 0.000 0.098 0.003 E<br />
Polk 1990 Clear Springs Land Company, LLC R244 G 0.055 0.085 0.085 E<br />
Polk 1999 Polk County School Board R245 G 0.002 0.013 0.004 E<br />
Polk 2090 Polk County School Board R245 G 0.007 0.025 0.012 E<br />
Polk 2092 Polk County School Board R240 G 0.001 0.006 0.001 E<br />
Polk 2093 Polk County School Board R240 G 0.006 0.009 0.009 E<br />
Polk 2094 Board Of Public Inst R240 G 0.032 0.050 0.049 E<br />
Polk 2096 Polk County School Board R240 G 0.004 0.040 0.007 E<br />
Polk 2097 Polk County School Board R270 G 0.001 0.001 0.001 E<br />
Polk 2100 Polk Co School Board R240 G 0.020 0.035 0.031 E<br />
Polk 2111 Railroad Distribution Services R240 G 0.001 0.018 0.004 E<br />
Polk 2446 Pentecostal Church of God R240 S 0.002 0.030 0.003 E<br />
Polk 2449 Sweetwater East Investment Co R250 G 0.018 0.084 0.026 E<br />
Polk 2462 P&K USA Inc R320 G 0.000 0.032 0.000 E<br />
M/E 5
<strong>2011</strong> ESTIMATED WATER USE REPORT<br />
Table A5. Metered and <strong>Estimated</strong> Recreation/Aesthetic WUPs, Withdrawals and Permitted <strong>Use</strong> (mgd), <strong>2011</strong><br />
County<br />
WUP<br />
Number<br />
Permittee<br />
<strong>Southwest</strong> <strong>Florida</strong> <strong>Water</strong> <strong>Management</strong> District Page | 122<br />
<strong>Use</strong><br />
Code 1<br />
Source<br />
2<br />
Annual<br />
Average<br />
Pumpage 3<br />
Total<br />
Permitted<br />
Annual Average<br />
Quantity<br />
Permitted<br />
Quantity<br />
Attributed to<br />
R/A <strong>Use</strong><br />
Category 4<br />
Polk 2507 St Anthony's Catholic Church R240 G 0.004 0.006 0.006 E<br />
Polk 2651 First Presbyterian Church Of Haines City <strong>Florida</strong> Inc R240 G 0.015 0.023 0.023 E<br />
Polk 3042 Feld Development Corporation R300 G 0.030 0.106 0.106 E<br />
Polk 3146 Snoop Development Ltd R240 G 0.002 0.004 0.003 E<br />
Polk 3233 Bramble Ridge Golf Course Inc R250 G 0.017 0.049 0.049 E<br />
Polk 3233 Bramble Ridge Golf Course Inc R250 S 0.015 0.049 0.049 E<br />
Polk 3252 Wynona Norton R240 G 0.000 0.001 0.001 E<br />
Polk 3291 Carriage Services Of <strong>Florida</strong> Inc R240 G 0.027 0.042 0.042 E<br />
Polk 3542 Polk Co BOCC Leisure Services Division R245 G 0.014 0.022 0.022 E<br />
Polk 4174 Robbins Rest HOA Inc R240 G 0.002 0.004 0.004 E<br />
Polk 4259 Polk Co BOCC‐ Parks & Natural Resources Division R240 G 0.021 0.032 0.032 E<br />
Polk 4384 Frankie R Revette R240 G 0.002 0.006 0.003 E<br />
Polk 4551 Moody Five JV LLC R245 G 0.000 0.010 0.000 E<br />
Polk 4739 Polk Co School Board R240 G 0.040 0.075 0.075 E<br />
Polk 4745 Mitco <strong>Water</strong> Laboratories Inc R240 G 0.003 0.005 0.005 E<br />
Polk 5208 William S & Regina J M Dundore R245 G 0.003 0.006 0.004 E<br />
Polk 5808 Publix Super Markets Inc. R245 G 0.001 0.002 0.002 E<br />
Polk 5932 The District Board Of Trustees R240 G 0.023 0.036 0.036 E<br />
Polk 6066 Center Crest Rv Lot Owners Assoc Inc R240 G 0.004 0.006 0.006 E<br />
Polk 6155 Turkey Hill Golf LLC R250 G 0.043 0.212 0.212 E<br />
Polk 6155 Turkey Hill Golf LLC R250 S 0.080 0.212 0.212 E<br />
Polk 6332 Polk County School Board R240 G 0.004 0.007 0.007 E<br />
Polk 6597 John Wood R240 G 0.004 0.089 0.006 E<br />
Polk 6625 Circle F Dude Ranch Camp LLC & F Lorida Rock Industries R240 G 0.002 0.081 0.004 E<br />
Inc<br />
Polk 6704 Enrique Puig R244 G 0.000 0.000 0.000 E<br />
Polk 6717 Sun K. Shin, Christina H. Shin and Marcus S. Shin R250 G 0.118 0.169 0.169 E<br />
Polk 6815 Dennis And Elizabeth Hansen R240 G 0.002 0.003 0.003 E<br />
Polk 6912 Webber International University Inc R240 G 0.015 0.068 0.068 E<br />
Polk 6931 Ridge Assembly Of God R240 G 0.003 0.004 0.004 E<br />
Polk 7234 Ronald R Hartman Jr & Mary McClurkan Hartman R240 G 0.004 0.006 0.006 E<br />
Polk 7283 Winterset Masters Association, Inc. R244 G 0.032 0.049 0.049 E<br />
Polk 7318 Mark J & Donna M Helms R240 G 0.000 0.001 0.001 E<br />
Polk 7337 Richard Steve & Cara J Michalec II R240 G 0.000 0.000 0.000 E<br />
M/E 5
<strong>2011</strong> ESTIMATED WATER USE REPORT<br />
Table A5. Metered and <strong>Estimated</strong> Recreation/Aesthetic WUPs, Withdrawals and Permitted <strong>Use</strong> (mgd), <strong>2011</strong><br />
County<br />
WUP<br />
Number<br />
Permittee<br />
<strong>Southwest</strong> <strong>Florida</strong> <strong>Water</strong> <strong>Management</strong> District Page | 123<br />
<strong>Use</strong><br />
Code 1<br />
Source<br />
2<br />
Annual<br />
Average<br />
Pumpage 3<br />
Total<br />
Permitted<br />
Annual Average<br />
Quantity<br />
Permitted<br />
Quantity<br />
Attributed to<br />
R/A <strong>Use</strong><br />
Category 4<br />
Polk 7379 Kennwood On The Lake POA Inc R240 G 0.002 0.042 0.003 E<br />
Polk 7393 Polk County School Board R240 G 0.003 0.021 0.006 E<br />
Polk 7539 Park Lake Master Association R240 G 0.015 0.023 0.023 E<br />
Polk 7562 <strong>Florida</strong> Baptist Children's Homes , Inc. R240 G 0.010 0.015 0.015 E<br />
Polk 7590 Polk State College R240 G 0.018 0.028 0.028 E<br />
Polk 7824 City of Lakeland Parks & Recreation Department R245 G 0.013 0.027 0.020 E<br />
Polk 7963 Highland Fairways Golf Club Inc R250 G 0.051 0.106 0.106 E<br />
Polk 7972 McNeil Investments C/O William G Roe & Sons Inc R240 G 0.001 0.008 0.001 E<br />
Polk 8116 Diocese Of Orlando R240 G 0.014 0.021 0.021 E<br />
Polk 8283 Robinson Callen Trustee R240 G 0.002 0.005 0.003 E<br />
Polk 8301 Publix Super Markets Inc. R250 G 0.016 0.047 0.047 E<br />
Polk 8301 Publix Super Markets Inc. R250 S 0.014 0.047 0.047 E<br />
Polk 8464 Century Realty Funds R250 G 0.076 0.217 0.217 E<br />
Polk 8464 Century Realty Funds R250 S 0.076 0.217 0.217 E<br />
Polk 8466 Lakes Committee R210 G 0.023 0.051 0.051 E<br />
Polk 8691 Ashland Inc R240 G 0.001 0.014 0.003 E<br />
Polk 8796 H‐D Lakeland Mall Joint Venture R240 G 0.022 0.033 0.033 E<br />
Polk 8976 Pepperidge Farm Inc R240 G 0.010 0.015 0.015 E<br />
Polk 9010 Chalet Suzanne Properties R245 G 0.010 0.061 0.035 E<br />
Polk 9010 Chalet Suzanne Properties R245 S 0.001 0.061 0.035 E<br />
Polk 9220 Abbey Lane Apartments R240 G 0.004 0.006 0.006 E<br />
Polk 9225 Imperial Southgate Villas Condo Association Inc R245 G 0.006 0.010 0.010 E<br />
Polk 9664 Bethel Baptist Church, Inc. R240 G 0.013 0.020 0.020 E<br />
Polk 9825 Jerry C Scarborough R250 S 0.021 0.033 0.033 E<br />
Polk 9911 Griffins Green LLC R240 G 0.005 0.019 0.019 E<br />
Polk 9929 Ariana Harbor Home Owners Assoc R240 G 0.003 0.005 0.005 E<br />
Polk 9993 CHC VI Ltd R250 S 0.021 0.032 0.032 E<br />
Polk 10098 Chemical Containers, Inc. R270 G 0.001 0.002 0.002 E<br />
Polk 10220 Polk Co School Board R240 G 0.013 0.021 0.021 E<br />
Polk 10235 Helen Latrell Marshall R245 G 0.000 0.003 0.003 E<br />
Polk 10353 The Hamptons Golf Associates R250 G 0.032 0.050 0.050 E<br />
Polk 10418 Polk County School Board R240 G 0.028 0.069 0.061 E<br />
Polk 10651 City Of Winter Haven‐Public Works Dept R240 G 0.011 0.018 0.018 E<br />
Polk 10655 Robert Bregler R240 G 0.000 0.001 0.001 E<br />
M/E 5
<strong>2011</strong> ESTIMATED WATER USE REPORT<br />
Table A5. Metered and <strong>Estimated</strong> Recreation/Aesthetic WUPs, Withdrawals and Permitted <strong>Use</strong> (mgd), <strong>2011</strong><br />
County<br />
WUP<br />
Number<br />
Permittee<br />
<strong>Southwest</strong> <strong>Florida</strong> <strong>Water</strong> <strong>Management</strong> District Page | 124<br />
<strong>Use</strong><br />
Code 1<br />
Source<br />
2<br />
Annual<br />
Average<br />
Pumpage 3<br />
Total<br />
Permitted<br />
Annual Average<br />
Quantity<br />
Permitted<br />
Quantity<br />
Attributed to<br />
R/A <strong>Use</strong><br />
Category 4<br />
Polk 10680 Keith A & Sherron E Kohlhof R240 G 0.001 0.001 0.001 E<br />
Polk 10704 <strong>Florida</strong> Rangers, Inc. R310 G 0.001 0.002 0.002 E<br />
Polk 10704 <strong>Florida</strong> Rangers, Inc. R310 S 0.000 0.002 0.002 E<br />
Polk 10828 New Life Worshipping Center Inc R240 G 0.002 0.003 0.003 E<br />
Polk 10828 New Life Worshipping Center Inc R240 S 0.000 0.003 0.003 E<br />
Polk 10865 Reservation Golf Course R250 G 0.001 0.004 0.004 E<br />
Polk 10865 Reservation Golf Course R250 S 0.002 0.004 0.004 E<br />
Polk 10916 James Chit Chan & Ya Ping Chan & R240 G 0.004 0.006 0.006 E<br />
Polk 11070 South <strong>Florida</strong> Woodmen Of The World R310 G 0.003 0.006 0.006 E<br />
Polk 11070 South <strong>Florida</strong> Woodmen Of The World R310 S 0.001 0.006 0.006 E<br />
Polk 11113 Highland Fairways POA Inc R210 G 0.005 0.017 0.017 E<br />
Polk 11113 Highland Fairways POA Inc R210 S 0.000 0.017 0.017 E<br />
Polk 11120 Michael P McIntee R240 G 0.005 0.009 0.009 E<br />
Polk 11363 Eagle Ridge Mall LP R240 G 0.028 0.043 0.043 E<br />
Polk 11394 All Saints Academy Inc R240 G 0.009 0.015 0.015 E<br />
Polk 11456 Publix Super Markets Inc. R240 G 0.003 0.004 0.004 E<br />
Polk 11600 Polk Co BOCC‐Leisure Services Division R310 G 0.001 0.001 0.001 E<br />
Polk 11669 R Warnock J Tedder S Watson & The Century Group Inc R250 S 0.000 0.027 0.027 E<br />
Polk 11671 Sleepy Hill Partners LLP R240 S 0.020 0.031 0.031 E<br />
Polk 11737 Hart Lake Hills HOA R240 G 0.004 0.006 0.006 E<br />
Polk 11740 Polk Co School Board R240 G 0.025 0.057 0.057 E<br />
Polk 11878 Carlton Arms Of North Lakeland R240 G 0.046 0.072 0.072 E<br />
Polk 11912 Geico R240 G 0.005 0.008 0.008 E<br />
Polk 11923 Ace Storage Facilities LLC R240 G 0.003 0.005 0.004 E<br />
Polk 11962 Serenity Gardens, LLC R240 G 0.014 0.022 0.022 E<br />
Polk 11984 Polk Co School Board R240 G 0.011 0.018 0.018 E<br />
Polk 12027 Tuscany Of Winterset HOA R240 G 0.001 0.001 0.001 E<br />
Polk 12132 Polk County School Board R240 G 0.002 0.004 0.003 E<br />
Polk 12251 Polk Co School Board R240 G 0.010 0.015 0.015 E<br />
Polk 12254 Polk Co School Board R240 G 0.007 0.012 0.012 E<br />
Polk 12268 Polk Co School Board R240 G 0.004 0.006 0.006 E<br />
Polk 12292 Cemex Const Materials LP & Don R240 G 0.000 0.493 0.004 E<br />
Polk 12292 Cemex Const Materials LP & Don R240 S 0.000 0.493 0.004 E<br />
Polk 12426 Donald W & Melinda S Wright R240 G 0.012 0.018 0.018 E<br />
M/E 5
<strong>2011</strong> ESTIMATED WATER USE REPORT<br />
Table A5. Metered and <strong>Estimated</strong> Recreation/Aesthetic WUPs, Withdrawals and Permitted <strong>Use</strong> (mgd), <strong>2011</strong><br />
County<br />
WUP<br />
Number<br />
Permittee<br />
<strong>Southwest</strong> <strong>Florida</strong> <strong>Water</strong> <strong>Management</strong> District Page | 125<br />
<strong>Use</strong><br />
Code 1<br />
Source<br />
2<br />
Annual<br />
Average<br />
Pumpage 3<br />
Total<br />
Permitted<br />
Annual Average<br />
Quantity<br />
Permitted<br />
Quantity<br />
Attributed to<br />
R/A <strong>Use</strong><br />
Category 4<br />
Polk 12462 Southeastern University Inc R245 G 0.026 0.041 0.041 E<br />
Polk 12489 <strong>Florida</strong> Central Park Poa R240 G 0.002 0.004 0.003 E<br />
Polk 12548 Winter Haven Corp R240 G 0.015 0.023 0.023 E<br />
Polk 12582 Circle 3 Investments Inc R245 G 0.001 0.002 0.002 E<br />
Polk 12607 Dunson Harvesting Inc R240 G 0.000 0.000 0.000 E<br />
Polk 12648 Wise Seed Co Inc R245 G 0.000 0.000 0.000 E<br />
Polk 12699 Polo Park East Ro Associates Inc R240 G 0.066 0.102 0.102 E<br />
Polk 12704 Holly Hill Village Resort LLC R240 G 0.031 0.071 0.071 E<br />
Polk 12715 Health <strong>Management</strong> Associates R240 G 0.025 0.038 0.038 E<br />
Polk 12720 Buckenoogen Homes Inc R250 G 0.012 0.022 0.022 E<br />
Polk 12721 Polk BOCC R240 G 0.043 0.099 0.099 E<br />
Polk 12795 Polk Co School Board R245 G 0.010 0.024 0.015 E<br />
Polk 12830 Board Of Trustees Of The Internal Improvement Fund R270 G 0.060 0.093 0.093 E<br />
Polk 12832 Lake Ashton Development Group Ii LLC R250 G 0.145 0.220 0.220 E<br />
Polk 12850 Ridge Live Steamers Inc R240 G 0.001 0.002 0.002 E<br />
Polk 13076 Swfwmd & FDEP State Lands R270 G 0.001 0.091 0.001 E<br />
Polk 13081 Ledra Holdings LC R240 G 0.001 0.001 0.001 E<br />
Polk 13092 PEC Investments Inc & KPG Investments Inc R240 G 0.001 0.001 0.001 E<br />
Polk 13102 Plaza Funding Inc R240 G 0.006 0.009 0.009 E<br />
Polk 13105 YMCA of Lake Wales Inc R245 G 0.006 0.009 0.009 E<br />
Polk 13159 Cc Calhoun Inc R240 G 0.012 0.062 0.016 E<br />
Polk 13165 Westridge Community Dev District R320 G 0.028 0.100 0.100 E<br />
Polk 13183 R T Investments Inc R240 G 0.001 0.001 0.001 E<br />
Polk 13280 City Of Lakeland R245 S 0.010 0.015 0.015 E<br />
Polk 13361 Finlay Interest 37 Ltd R240 G 0.004 0.006 0.006 E<br />
Polk 20096 Armstrong Reunion LLC R244 G 0.017 0.026 0.026 E<br />
Polk 20122 City Of Lakeland ‐ Lakeland Linder Regional Airport R240 G 0.000 0.007 0.007 E<br />
Polk 20124 Polk County School Board R240 G 0.010 0.016 0.016 E<br />
Polk 20146 City of Lake Wales R244 G 0.024 0.038 0.038 E<br />
Polk County Totals<br />
5.931 Metered, mgd<br />
2.408 <strong>Estimated</strong> , mgd<br />
8.339 Total, mgd<br />
Sarasota 3897 Civix Sarasota GC LLC R250 G 0.000 0.108 0.108 M<br />
Sarasota 3941 Mission Valley Golf & Country Club Inc R250 G 0.186 0.313 0.313 M<br />
M/E 5
<strong>2011</strong> ESTIMATED WATER USE REPORT<br />
Table A5. Metered and <strong>Estimated</strong> Recreation/Aesthetic WUPs, Withdrawals and Permitted <strong>Use</strong> (mgd), <strong>2011</strong><br />
County<br />
WUP<br />
Number<br />
Permittee<br />
<strong>Southwest</strong> <strong>Florida</strong> <strong>Water</strong> <strong>Management</strong> District Page | 126<br />
<strong>Use</strong><br />
Code 1<br />
Source<br />
2<br />
Annual<br />
Average<br />
Pumpage 3<br />
Total<br />
Permitted<br />
Annual Average<br />
Quantity<br />
Permitted<br />
Quantity<br />
Attributed to<br />
R/A <strong>Use</strong><br />
Category 4<br />
Sarasota 5385 CT‐Rolling Green LLC c/o Rolling Green Golf Club R250 G 0.093 0.196 0.196 M<br />
Sarasota 5517 Capri Isles Golf Inc R250 G 0.009 0.040 0.040 M<br />
Sarasota 5648 Gator Creek Golf Club Inc R250 G 0.027 0.259 0.259 M<br />
Sarasota 5807 Camelot Communities MHP, LLC R240 G 0.078 0.390 0.202 M<br />
Sarasota 5807 Camelot Communities MHP, LLC R240 S 0.053 0.390 0.202 M<br />
Sarasota 6364 Advanced <strong>Management</strong> Inc R250 G 0.468 1.275 1.275 M<br />
Sarasota 6364 Advanced <strong>Management</strong> Inc R250 S 0.466 1.275 1.275 M<br />
Sarasota 6770 Janice Robbins R240 G 0.053 0.166 0.166 M<br />
Sarasota 6863 Key Club Assoc Dba Longboat Key R250 G 0.270 0.309 0.309 M<br />
Sarasota 6954 The Oaks Club Corporation R250 G 0.390 0.530 0.530 M<br />
Sarasota 6954 The Oaks Club Corporation R250 S 0.000 0.530 0.530 M<br />
Sarasota 7448 Royalty Resort Corp R320 G 0.007 0.237 0.016 M<br />
Sarasota 7873 Myakka Pines Golf Club Inc R420 G 0.000 0.212 0.212 M<br />
Sarasota 7873 Myakka Pines Golf Club Inc R420 S 0.012 0.212 0.212 M<br />
Sarasota 7893 Heritage Golf Prestancia LLC R250 G 0.022 0.249 0.249 M<br />
Sarasota 8109 Misty Creek Country Club Inc R250 G 0.000 0.122 0.122 M<br />
Sarasota 8109 Misty Creek Country Club Inc R250 S 0.000 0.122 0.122 M<br />
Sarasota 8782 Tatum Ridge Golf Links Inc R250 G 0.001 0.137 0.137 M<br />
Sarasota 8900 Meadows Country Club Inc R250 G 0.044 0.144 0.144 M<br />
Sarasota 9079 Civix Sunrise GC LLC R250 G 0.000 0.037 0.037 M<br />
Sarasota 9079 Civix Sunrise GC LLC R250 S 0.000 0.037 0.037 M<br />
Sarasota 9114 Sorrento Valley Golf Inc R250 G 0.242 0.259 0.259 M<br />
Sarasota 9458 Susan Hentz R250 G 0.001 0.399 0.399 M<br />
Sarasota 9517 Laurel Oak Country Club R250 G 0.118 0.132 0.132 M<br />
Sarasota 9667 Cabot Investment Properties LLC, Pelican Point Golf & CC R250 G 0.147 0.264 0.264 M<br />
Sarasota 9839 Venice Golf & Country Club Ltd R250 G 0.002 0.446 0.446 M<br />
Sarasota 10407 Serenoa Golf Club LLC R250 G 0.148 0.275 0.275 M<br />
Sarasota 10407 Serenoa Golf Club LLC R250 S 0.000 0.275 0.275 M<br />
Sarasota 10606 Key Club Assoc Dba Longboat R250 G 0.211 0.498 0.498 M<br />
Sarasota 10823 Calusa Lakes Community Assoc Inc R240 G 0.335 0.387 0.387 M<br />
Sarasota 10877 Stoneybrook Golf and Country Club of Sarasota Inc R250 G 0.149 0.348 0.348 M<br />
Sarasota 10880 Southbay Yacht & Racquet Club Owner's Association Inc R240 G 0.198 0.206 0.206 M<br />
Sarasota 11417 Heritage Oaks Golf & Country Club Inc R250 G 0.127 0.407 0.407 M<br />
Sarasota 11438 Capri Isle Golf Inc R250 G 0.200 0.293 0.293 M<br />
M/E 5
<strong>2011</strong> ESTIMATED WATER USE REPORT<br />
Table A5. Metered and <strong>Estimated</strong> Recreation/Aesthetic WUPs, Withdrawals and Permitted <strong>Use</strong> (mgd), <strong>2011</strong><br />
County<br />
WUP<br />
Number<br />
Permittee<br />
<strong>Southwest</strong> <strong>Florida</strong> <strong>Water</strong> <strong>Management</strong> District Page | 127<br />
<strong>Use</strong><br />
Code 1<br />
Source<br />
2<br />
Annual<br />
Average<br />
Pumpage 3<br />
Total<br />
Permitted<br />
Annual Average<br />
Quantity<br />
Permitted<br />
Quantity<br />
Attributed to<br />
R/A <strong>Use</strong><br />
Category 4<br />
Sarasota 11638 Marsh Creek Holdings Ltd R250 G 0.049 0.451 0.451 M<br />
Sarasota 11699 Bobcat Trail Golf Club LLC R250 G 0.019 0.339 0.339 M<br />
Sarasota 11871 City Of Venice Utilities Dept R250 G 0.027 0.202 0.202 M<br />
Sarasota 12075 WCI Communities Inc R240 G 0.327 0.308 0.308 M<br />
Sarasota 12145 Village Walk of Sarasota Homeowners Association, Inc. R240 G 0.047 0.184 0.184 M<br />
Sarasota 12590 Aquaterra Utilities Inc R240 G 0.319 0.237 0.237 M<br />
Sarasota 12634 Centex Homes R240 G 0.000 0.171 0.171 M<br />
Sarasota 12750 Ventura Village HOA Inc, S & S Golf Mgmt R240 G 0.203 0.115 0.115 M<br />
Sarasota 12759 Panacea Gulf Coast Investments R240 G 0.063 0.476 0.476 M<br />
Sarasota 12759 Panacea Gulf Coast Investments R240 S 0.000 0.476 0.476 M<br />
Sarasota 12772 Divosta LP R240 S 0.215 1.092 0.650 M<br />
Sarasota 13347 Dept of Veterans Affairs Natl R230 G 0.044 0.340 0.340 M<br />
Sarasota 4181 School Board Of Sarasota Co R240 G 0.006 0.010 0.010 E<br />
Sarasota 4405 The Field Club Inc R240 G 0.006 0.010 0.010 E<br />
Sarasota 4709 Sarasota Co. BOCC, Attn: Patricia Nihart R245 G 0.012 0.019 0.019 E<br />
Sarasota 4834 State of <strong>Florida</strong> Dept Of Environmental Protection R320 G 0.013 0.020 0.020 E<br />
Sarasota 4959 Terraces of Forest Lakes Condominium Association, Inc. R240 G 0.002 0.003 0.003 E<br />
Sarasota 5335 Tallywood Condominium Association Inc R240 G 0.009 0.015 0.015 E<br />
Sarasota 5336 Oakhurst Condominium Assoc Inc R244 G 0.032 0.050 0.050 E<br />
Sarasota 5399 Marie Selby Botanical Gardens R260 G 0.016 0.028 0.028 E<br />
Sarasota 5456 Jerome & Frederick Ellis R240 G 0.008 0.060 0.035 E<br />
Sarasota 5456 Jerome & Frederick Ellis R240 S 0.011 0.060 0.035 E<br />
Sarasota 5507 Englewood Isles I Association Inc R240 G 0.009 0.014 0.014 E<br />
Sarasota 5511 Village Green Condominium Section 15 Inc R290 G 0.008 0.012 0.012 E<br />
Sarasota 5547 Southgate Plaza LLC Dba Westfield Southgate R240 G 0.006 0.009 0.009 E<br />
Sarasota 5661 Southgate Village Green Condominium Association Sec 8 R240 G 0.006 0.009 0.009 E<br />
Sarasota 5662 Southgate Village Green Condominium Section 10<br />
R240 G 0.009 0.014 0.014 E<br />
Association, Inc.<br />
Sarasota 5663 South Gate Village Green Condo Section Seven R240 G 0.003 0.005 0.005 E<br />
Sarasota 5664 Village Green Section 14 Assoc R240 G 0.003 0.005 0.005 E<br />
Sarasota 5665 Village Green Condo Assoc Section 17 R240 G 0.004 0.006 0.006 E<br />
Sarasota 5687 Thomas Kelly R250 G 0.001 0.001 0.001 E<br />
Sarasota 5727 Village Green Condo Section 16 R240 G 0.005 0.008 0.008 E<br />
Sarasota 5730 Southgate Village Green Condominium Association Sect 11 R240 G 0.008 0.012 0.012 E<br />
M/E 5
<strong>2011</strong> ESTIMATED WATER USE REPORT<br />
Table A5. Metered and <strong>Estimated</strong> Recreation/Aesthetic WUPs, Withdrawals and Permitted <strong>Use</strong> (mgd), <strong>2011</strong><br />
County<br />
WUP<br />
Number<br />
Permittee<br />
<strong>Southwest</strong> <strong>Florida</strong> <strong>Water</strong> <strong>Management</strong> District Page | 128<br />
<strong>Use</strong><br />
Code 1<br />
Source<br />
2<br />
Annual<br />
Average<br />
Pumpage 3<br />
Total<br />
Permitted<br />
Annual Average<br />
Quantity<br />
Permitted<br />
Quantity<br />
Attributed to<br />
R/A <strong>Use</strong><br />
Category 4<br />
Sarasota 5752 South Gate Village Green Sect, 3 & 4 R244 G 0.004 0.006 0.006 E<br />
Sarasota 5784 Southgate Village Green Sect 6 R240 G 0.006 0.010 0.010 E<br />
Sarasota 5970 Inn On The Beach HOA Inc R240 G 0.000 0.020 0.020 E<br />
Sarasota 6710 Charlotte Golf Partners LP R250 S 0.039 0.083 0.083 E<br />
Sarasota 7288 Ringling Museum Of Art/FSU R240 G 0.049 0.086 0.086 E<br />
Sarasota 7488 Foxfire Properties LLC R240 G 0.059 0.173 0.169 E<br />
Sarasota 7488 Foxfire Properties LLC R240 S 0.058 0.173 0.169 E<br />
Sarasota 7490 School Board Of Sarasota County R260 G 0.006 0.009 0.009 E<br />
Sarasota 7674 Promenade Condominium Owners Association Inc R240 G 0.006 0.009 0.009 E<br />
Sarasota 8282 Chip Powell R244 G 0.005 0.016 0.016 E<br />
Sarasota 8359 South Gate Village Green Condo Assoc Section 1‐2 R240 G 0.006 0.009 0.009 E<br />
Sarasota 8382 Coyote Sarasota Mall LLC R240 G 0.030 0.047 0.047 E<br />
Sarasota 8398 Grosvenor Square Cadillac LLC R250 G 0.062 0.178 0.178 E<br />
Sarasota 8819 Golf Club Of Englewood Inc R250 G 0.012 0.145 0.145 E<br />
Sarasota 8819 Golf Club Of Englewood Inc R250 S 0.082 0.145 0.145 E<br />
Sarasota 8831 City Of Sarasota R240 G 0.004 0.006 0.006 E<br />
Sarasota 8898 Seaplace Association Inc R240 G 0.023 0.035 0.035 E<br />
Sarasota 8938 Sarasota Memorial Park Cemetery R230 G 0.030 0.046 0.046 E<br />
Sarasota 8972 The Landings Treehouse Condo Assoc Inc R240 G 0.005 0.008 0.008 E<br />
Sarasota 9268 Courtside Tennis Club R280 G 0.001 0.004 0.004 E<br />
Sarasota 9268 Courtside Tennis Club R280 S 0.001 0.004 0.004 E<br />
Sarasota 9382 City of Sarasota Public Works R240 G 0.025 0.039 0.039 E<br />
Sarasota 9406 Sarasota Manatee Airport Authority R240 G 0.027 0.042 0.042 E<br />
Sarasota 9483 School Board Of Sarasota County R240 G 0.007 0.011 0.011 E<br />
Sarasota 9560 Preserve At Heron Lake Home Owner Assoc Inc R240 G 0.027 0.060 0.060 E<br />
Sarasota 9582 Sarasota County School Board R240 G 0.017 0.027 0.027 E<br />
Sarasota 9583 Sarasota County School Board R240 G 0.014 0.021 0.021 E<br />
Sarasota 9786 The Sanctuary At Longboat Key Club Community Assoc Inc R244 G 0.010 0.015 0.015 E<br />
Sarasota 9818 City of Sarasota Public Works R408 G 0.010 0.015 0.015 E<br />
Sarasota 10522 School Board of Sarasota County R240 G 0.013 0.020 0.020 E<br />
Sarasota 10605 Marina Bay Assoc Inc R240 G 0.009 0.014 0.014 E<br />
Sarasota 10640 <strong>Florida</strong> Land Trust No V1 R240 G 0.007 0.011 0.011 E<br />
Sarasota 10691 Venice East Golf Association R250 G 0.018 0.063 0.063 E<br />
Sarasota 10705 Winding Oaks Association Inc R240 G 0.010 0.015 0.015 E<br />
M/E 5
<strong>2011</strong> ESTIMATED WATER USE REPORT<br />
Table A5. Metered and <strong>Estimated</strong> Recreation/Aesthetic WUPs, Withdrawals and Permitted <strong>Use</strong> (mgd), <strong>2011</strong><br />
County<br />
WUP<br />
Number<br />
Permittee<br />
<strong>Southwest</strong> <strong>Florida</strong> <strong>Water</strong> <strong>Management</strong> District Page | 129<br />
<strong>Use</strong><br />
Code 1<br />
Source<br />
2<br />
Annual<br />
Average<br />
Pumpage 3<br />
Total<br />
Permitted<br />
Annual Average<br />
Quantity<br />
Permitted<br />
Quantity<br />
Attributed to<br />
R/A <strong>Use</strong><br />
Category 4<br />
Sarasota 10946 Lynne C Massey R240 G 0.000 0.001 0.001 E<br />
Sarasota 10969 Osprey Driving Range R240 G 0.013 0.019 0.019 E<br />
Sarasota 11044 Village Brooke Condominium R240 G 0.019 0.030 0.030 E<br />
Sarasota 11080 Diocese of Venice in <strong>Florida</strong> R240 G 0.018 0.028 0.028 E<br />
Sarasota 11224 Fairway Bay Association Inc & II And III R240 G 0.025 0.039 0.039 E<br />
Sarasota 11325 Xcel Investment Co LLP R240 G 0.000 0.042 0.042 E<br />
Sarasota 11325 Xcel Investment Co LLP R240 S 0.005 0.042 0.042 E<br />
Sarasota 11360 Willow Springs HOA R240 S 0.022 0.035 0.035 E<br />
Sarasota 11370 Sarasota Jungle Gardens R260 G 0.030 0.047 0.047 E<br />
Sarasota 11391 Bath & Racquet Club R290 G 0.012 0.018 0.018 E<br />
Sarasota 11414 City Of Sarasota R250 G 0.003 0.005 0.005 E<br />
Sarasota 11528 Pelican Cove Condo Assoc Bay Village of Sarasota Inc R240 G 0.036 0.055 0.055 E<br />
Sarasota 11532 Longwood Villas Of Sarasota HOA Inc & Longwood Run R240 S 0.038 0.058 0.058 E<br />
Comm. Assoc<br />
Sarasota 11556 Shrine Of The Master Church R240 G 0.003 0.004 0.004 E<br />
Sarasota 11596 Sharon Cornell R240 G 0.001 0.001 0.001 E<br />
Sarasota 11612 Jacaranda Trace Master Assoc Inc R240 G 0.013 0.021 0.021 E<br />
Sarasota 11677 Queens Harbor Owner Assoc Inc R240 G 0.022 0.052 0.052 E<br />
Sarasota 11784 Forest Pines Condo Assoc Inc R240 G 0.017 0.026 0.026 E<br />
Sarasota 11787 Sun And Surf Colony Inc R240 G 0.000 0.000 0.000 E<br />
Sarasota 11797 Bird Bay Executive Golf Course R250 G 0.000 0.050 0.050 E<br />
Sarasota 11797 Bird Bay Executive Golf Course R250 S 0.019 0.050 0.050 E<br />
Sarasota 11827 Gulf Coast Heritage Assoc Inc R240 G 0.001 0.002 0.002 E<br />
Sarasota 11934 Maxfield Property Ltd & Maxfield Medical Building LLC R240 G 0.005 0.008 0.008 E<br />
Sarasota 11960 Wyndham Home Owners Association Inc R240 G 0.004 0.011 0.011 E<br />
Sarasota 11960 Wyndham Home Owners Association Inc R240 S 0.000 0.011 0.011 E<br />
Sarasota 11988 Hidden Oaks Estates Assoc Inc R240 G 0.001 0.001 0.001 E<br />
Sarasota 12002 Laurel Oak Community Assoc R240 G 0.007 0.011 0.011 E<br />
Sarasota 12016 Villa Rosa Sarasota HOA Inc R244 G 0.024 0.037 0.037 E<br />
Sarasota 12073 Deer Hollow Home Owners Association Inc R244 G 0.006 0.009 0.009 E<br />
Sarasota 12100 Mira Lago Community Association Inc R244 G 0.011 0.017 0.017 E<br />
Sarasota 12177 Boca Royale Golf Property Owners Association R240 G 0.022 0.037 0.037 E<br />
Sarasota 12177 Boca Royale Golf Property Owners Association R240 S 0.002 0.037 0.037 E<br />
Sarasota 12250 North Shell & Higel, LLC. R244 G 0.002 0.003 0.003 E<br />
M/E 5
<strong>2011</strong> ESTIMATED WATER USE REPORT<br />
Table A5. Metered and <strong>Estimated</strong> Recreation/Aesthetic WUPs, Withdrawals and Permitted <strong>Use</strong> (mgd), <strong>2011</strong><br />
County<br />
WUP<br />
Number<br />
Permittee<br />
<strong>Southwest</strong> <strong>Florida</strong> <strong>Water</strong> <strong>Management</strong> District Page | 130<br />
<strong>Use</strong><br />
Code 1<br />
Source<br />
2<br />
Annual<br />
Average<br />
Pumpage 3<br />
Total<br />
Permitted<br />
Annual Average<br />
Quantity<br />
Permitted<br />
Quantity<br />
Attributed to<br />
R/A <strong>Use</strong><br />
Category 4<br />
Sarasota 12291 Willowbend Community Assoc Inc R245 G 0.049 0.076 0.076 E<br />
Sarasota 12300 Las Palmas Of Sarasota Condo R240 G 0.009 0.013 0.013 E<br />
Sarasota 12334 Kleppinger Homes Inc R240 G 0.000 0.000 0.000 E<br />
Sarasota 12357 Southgate Village Greens Sect 9 R240 G 0.006 0.010 0.010 E<br />
Sarasota 12473 Foxwood Condo Assoc R240 S 0.023 0.036 0.036 E<br />
Sarasota 12483 Arielle On Palmer Ranch Community Association Inc R240 G 0.007 0.023 0.023 E<br />
Sarasota 12483 Arielle On Palmer Ranch Community Association Inc R240 S 0.000 0.023 0.023 E<br />
Sarasota 12492 School Board of Sarasota County R240 G 0.004 0.016 0.007 E<br />
Sarasota 12542 Capri Isles LLC R245 G 0.008 0.013 0.013 E<br />
Sarasota 12555 Caribbean Bay Mortgage Lender LLC Attn Mr. Alex Nobile R240 S 0.000 0.074 0.074 E<br />
Sarasota 12796 Divosta Homes, LP R240 G 0.044 0.100 0.100 E<br />
Sarasota 12797 San Palermo At Sarasota HOA Inc R240 G 0.017 0.027 0.027 E<br />
Sarasota 12816 Bay Isles Bayou Association Inc R240 G 0.000 0.065 0.065 E<br />
Sarasota 12873 White Oak Development R240 G 0.000 0.015 0.015 E<br />
Sarasota 12954 Taylor Morrison of <strong>Florida</strong> Inc R240 G 0.011 0.017 0.017 E<br />
Sarasota 12970 Stillwater HOA Inc & Stillwater Unit Three HOA Inc R240 G 0.017 0.052 0.052 E<br />
Sarasota 12970 Stillwater HOA Inc & Stillwater Unit Three HOA Inc R240 S 0.000 0.052 0.052 E<br />
Sarasota 12995 Southwood Property Owners Association Inc R240 G 0.025 0.039 0.039 E<br />
Sarasota 13009 Desoto Preserve LLC R240 G 0.002 0.006 0.006 E<br />
Sarasota 13239 Lowes Home Centers Inc R240 G 0.000 0.011 0.011 E<br />
Sarasota 13301 Gulf Coast Strategic Investments Inc R245 G 0.000 0.033 0.033 E<br />
Sarasota 13301 Gulf Coast Strategic Investments Inc R245 S 0.000 0.033 0.033 E<br />
Sarasota 13344 Horizons West Assoc Inc R240 G 0.003 0.005 0.005 E<br />
Sarasota County Totals<br />
5.370 Metered, mgd<br />
1.471 <strong>Estimated</strong> , mgd<br />
6.841 Total, mgd<br />
Sumter 2622 Continental Country Club Rd Inc R250 G 0.200 0.451 0.213 M<br />
Sumter 3206 Villages Operating Company R250 G 0.439 0.616 0.616 M<br />
Sumter 6793 Rainforest RV Inc R250 G 0.016 0.135 0.119 M<br />
Sumter 8675 USA Veterans Administration R240 G 0.468 0.420 0.420 M<br />
Sumter 10923 Spruce Creek Golf LLC R250 G 0.436 0.446 0.446 M<br />
Sumter 10923 Spruce Creek Golf LLC R250 S 0.000 0.446 0.446 M<br />
Sumter 11566 The Villages of Lake Sumter, Inc. R245 G 0.005 0.066 0.066 M<br />
Sumter 11624 Village Community Dev Dist 2 R240 G 0.017 0.100 0.100 M<br />
M/E 5
<strong>2011</strong> ESTIMATED WATER USE REPORT<br />
Table A5. Metered and <strong>Estimated</strong> Recreation/Aesthetic WUPs, Withdrawals and Permitted <strong>Use</strong> (mgd), <strong>2011</strong><br />
County<br />
WUP<br />
Number<br />
Permittee<br />
<strong>Use</strong><br />
Code 1<br />
Source<br />
2<br />
Annual<br />
Average<br />
Pumpage 3<br />
Total<br />
Permitted<br />
Annual Average<br />
Quantity<br />
Permitted<br />
Quantity<br />
Attributed to<br />
R/A <strong>Use</strong><br />
Category 4<br />
Sumter 11778 Village Center CDD R250 G 0.014 0.170 0.056 M<br />
Sumter 11856 Brassboys Enterprises Inc; Miona Lake Golf Course R310 G 0.000 0.003 0.003 M<br />
Sumter 13005 Village Center Community Development District R250 G 0.848 #### 1.343 M<br />
Sumter 13005 Village Center Community Development District R250 S 0.000 #### 1.343 M<br />
Sumter 13123 Madison <strong>Florida</strong> Grande, LLC R240 G 0.046 0.191 0.139 M<br />
Sumter 1811 Speedling Inc R240 G 0.001 0.099 0.002 E<br />
Sumter 3152 Graham Contracting, Inc. R320 G 0.097 0.490 0.168 E<br />
Sumter 4295 Sumter County Board Of Public Instruction R230 G 0.005 0.041 0.009 E<br />
Sumter 5055 City Of Wildwood City Mgmt R240 G 0.025 0.058 0.058 E<br />
Sumter 11779 Village Community Development R240 G 0.025 0.058 0.058 E<br />
Sumter 12604 Wildwood Gardens Ltd R240 G 0.011 0.018 0.018 E<br />
Sumter County Totals<br />
District Totals<br />
2.489 Metered, mgd<br />
0.164 <strong>Estimated</strong> , mgd<br />
2.653 Total, mgd<br />
49.595 Metered, mgd<br />
12.338 <strong>Estimated</strong> , mgd<br />
61.933 Total, mgd<br />
Information is given only for the portion of the county within the District.<br />
Source: <strong>Water</strong> <strong>Use</strong> Permit Database (WMIS), Calendar year <strong>2011</strong>.<br />
<strong>Use</strong> Code: Alpha‐numeric number given to the use that has the highest quantity attributed to the permit. The first letter indicates the “Predominant <strong>Use</strong>” on<br />
1<br />
the permit. (R = Recreation/Aesthetic). Descriptions of the use codes in this table are on the next page.<br />
2 Source = G for groundwater; S for surface water<br />
3 The metered annual average amount pumped (aka used, withdrawn) in 2010. Details on the WUPs for which the use was estimated are on the website version<br />
of this document.<br />
4 This value gives an indication if the issued WUP is entirely for recreation/aesthetic use (the quantities in the 7 th and 8 th columns are equal), or has water<br />
permitted under another predominant use (quantity in 7 th column > quantity in 8 th column).<br />
M/E 5<br />
<strong>Southwest</strong> <strong>Florida</strong> <strong>Water</strong> <strong>Management</strong> District Page | 131
<strong>2011</strong> ESTIMATED WATER USE REPORT<br />
Descriptions for the use codes given in this table.<br />
R200 Aesthetic <strong>Use</strong> Other than Augmentation R244 Irrigation Of Community Common Areas R280 Maintenance & Cooling<br />
R210 Augmentation for Aesthetic R245 Sports Playing Fields R290 Other <strong>Use</strong>s<br />
R220 Augmentation for Environmental R250 Golf Course Irrigation R300 Recreational Animal <strong>Water</strong>ing <strong>Use</strong><br />
R230 Cemetery/Parks/Playgrounds R260 Botanical Specimen Irrigation R310 Personal Sanitary <strong>Use</strong><br />
R240 Lawn & Landscape Irrigation R270 Fire Fighting/Testing R320 <strong>Water</strong>‐Based Recreation<br />
R420 Public Drinking, Fountains, Restrooms<br />
<strong>Southwest</strong> <strong>Florida</strong> <strong>Water</strong> <strong>Management</strong> District Page | 132
<strong>2011</strong> ESTIMATED WATER USE REPORT<br />
TABLE A6. <strong>2011</strong> METERED + ESTIMATED RECREATION/AESTHETIC MONTHLY AVERAGE PUMPAGE (MGD/MONTH) BY COUNTY)<br />
County Jan Feb Mar Apr May Jun Jul Aug Sep Oct Nov Dec<br />
*Charlotte 1.303 1.419 2.233 2.090 2.503 2.760 1.408 0.856 1.333 1.106 1.622 2.116<br />
Citrus 3.226 3.682 5.249 5.717 7.128 7.021 5.394 4.712 4.801 4.577 7.685 3.860<br />
Desoto 0.199 0.363 0.433 0.607 0.594 0.500 0.217 0.175 0.197 0.324 0.344 0.315<br />
Hardee 0.222 0.257 0.168 0.196 0.319 0.332 0.096 0.096 0.969 0.124 0.177 0.654<br />
Hernando 2.297 6.085 5.265 5.778 6.996 5.705 3.752 4.213 4.435 5.107 5.802 5.324<br />
*Highlands 1.596 2.960 2.862 2.830 3.105 3.199 2.001 2.485 2.228 1.980 2.680 1.229<br />
Hillsborough 9.885 8.492 9.492 9.175 13.218 12.915 5.106 5.401 7.167 9.237 6.475 7.238<br />
*Lake 0.000 0.000 0.000 0.000 0.000 0.000 0.000 0.000 0.000 0.000 0.000 0.000<br />
*Levy 0.122 0.209 0.283 0.306 0.420 0.406 0.193 0.156 0.159 0.199 0.287 0.228<br />
Manatee 6.840 8.985 13.334 8.592 14.800 18.011 6.824 4.981 4.177 17.884 11.039 9.350<br />
*Marion 1.666 2.721 3.411 4.259 5.204 4.753 3.324 3.633 4.318 4.722 4.369 3.509<br />
Pasco 2.941 3.097 4.239 4.484 6.637 6.062 3.613 3.656 3.354 3.412 4.920 4.400<br />
Pinellas 1.397 2.196 2.595 2.589 3.609 3.123 1.568 0.811 0.985 1.686 1.900 1.407<br />
*Polk 5.381 8.070 10.333 9.301 13.593 12.945 8.487 5.302 5.600 5.778 8.025 7.231<br />
Sarasota 5.593 6.580 8.739 7.222 8.936 11.366 5.973 3.712 4.422 5.528 8.471 5.542<br />
Sumter 1.445 1.512 3.679 3.261 3.462 4.891 1.999 1.478 2.513 2.939 2.819 1.880<br />
District 44.113 56.628 72.315 66.407 90.524 93.989 49.955 41.667 46.658 64.603 66.615 54.283<br />
Groundwater 40.537 51.072 64.764 59.486 81.306 85.365 44.958 36.819 41.611 59.087 59.153 47.910<br />
Surface<br />
<strong>Water</strong><br />
3.573 5.556 7.551 6.921 9.219 8.625 4.995 4.851 5.046 5.516 7.462 6.372<br />
* Data is only from the portion of the county within the District<br />
Source: <strong>Estimated</strong> <strong>Water</strong> <strong>Use</strong> Tables derived from the WMIS WUP database, <strong>2011</strong>.<br />
<strong>Southwest</strong> <strong>Florida</strong> <strong>Water</strong> <strong>Management</strong> District Page | 133
<strong>2011</strong> ESTIMATED WATER USE REPORT<br />
Table A7. Metered and <strong>Estimated</strong> Agricultural WUPs, Withdrawals and Permitted <strong>Use</strong> (mgd), <strong>2011</strong><br />
County<br />
WUP<br />
Number<br />
<strong>Southwest</strong> <strong>Florida</strong> <strong>Water</strong> <strong>Management</strong> District<br />
Permittee<br />
<strong>Use</strong><br />
Code 1<br />
Source 2<br />
Annual<br />
Average<br />
Pumpage 3<br />
Total<br />
Permitted<br />
Annual<br />
Average<br />
Quantity<br />
Permitted<br />
Quantity<br />
Attributed<br />
to AG <strong>Use</strong><br />
Category 4<br />
Charlotte 608 The Bryan W Paul Family Limited Partnership A415 G 0.000 0.136 0.136 M<br />
Charlotte 608 The Bryan W Paul Family Limited Partnership A415 S 0.000 0.136 0.136 M<br />
Charlotte 1019 Ryals Citrus & Cattle Co A470 G 0.000 0.386 0.386 M<br />
Charlotte 1759 Diner Citrus and Cattle Company A490 G 0.343 2.461 2.461 M<br />
Charlotte 1759 Diner Citrus and Cattle Company A490 S 0.008 2.461 2.461 M<br />
Charlotte 1882 Punta Riverside Inc and Seamans Sunset Inc A415 S 0.000 0.121 0.121 M<br />
Charlotte 2588 Daniel Kelly A515 G 0.811 0.226 0.226 M<br />
Charlotte 2589 Park Drive Gardens Trust, A Karim Khudairi Trustee A490 G 0.000 0.075 0.075 M<br />
Charlotte 2593 Charlotte 650 LLC A415 G 0.191 0.524 0.524 M<br />
Charlotte 2593 Charlotte 650 LLC A415 S 0.000 0.524 0.524 M<br />
Charlotte 2689 East Charlotte Drainage District A415 G 1.262 2.920 2.920 M<br />
Charlotte 2689 East Charlotte Drainage District A415 S 0.017 2.920 2.920 M<br />
Charlotte 3070 American Citrus Products A415 G 0.285 0.442 0.442 M<br />
Charlotte 3530 Kenny Grace A415 G 0.443 0.911 0.911 M<br />
Charlotte 3530 Kenny Grace A415 S 0.144 0.911 0.911 M<br />
Charlotte 4217 Wright Cattle Company Julian W Wright A490 G 0.000 0.274 0.274 M<br />
Charlotte 4589 Hudson Land and Cattle, LLC A470 G 0.000 0.648 0.648 M<br />
Charlotte 5936 Schwartz Charlotte Grove Properties, LLC A495 G 0.320 1.001 1.001 M<br />
Charlotte 7240 Iowa International Inv Inc A415 G 0.000 0.118 0.118 M<br />
Charlotte 8224 Spanish Trail Land & Cattle Company LLC A56S G 0.181 2.534 2.534 M<br />
Charlotte 8388 Jacks Branch Grove LLP A415 G 0.000 0.147 0.147 M<br />
Charlotte 9011 CalUSA Growers L.C. A415 G 0.034 0.199 0.199 M<br />
Charlotte 9052 Ben Hill Griffin, Inc. A470 G 0.014 1.396 1.396 M<br />
Charlotte 9052 Ben Hill Griffin, Inc. A470 S 0.726 1.396 1.396 M<br />
Charlotte 9173 CalUSA LC A415 G 0.021 0.105 0.105 M<br />
Charlotte 9398 TRB Groves LLC Wesley W Brumback A415 G 0.560 1.258 1.258 M<br />
Charlotte 9398 TRB Groves LLC Wesley W Brumback A415 S 0.784 1.258 1.258 M<br />
Charlotte 9417 Kye & Deborah Bishop A415 G 0.001 0.171 0.171 M<br />
Charlotte 9476 Citrus Creek Grove LLC A415 G 0.379 0.679 0.679 M<br />
Charlotte 9552 CalUSA Growers L.C. A415 G 0.069 0.218 0.218 M<br />
Charlotte 9552 CalUSA Growers L.C. A415 S 0.000 0.218 0.218 M<br />
M/E 5<br />
Page | 134
<strong>2011</strong> ESTIMATED WATER USE REPORT<br />
Table A7. Metered and <strong>Estimated</strong> Agricultural WUPs, Withdrawals and Permitted <strong>Use</strong> (mgd), <strong>2011</strong><br />
County<br />
WUP<br />
Number<br />
<strong>Southwest</strong> <strong>Florida</strong> <strong>Water</strong> <strong>Management</strong> District<br />
Permittee<br />
<strong>Use</strong><br />
Code 1<br />
Source 2<br />
Annual<br />
Average<br />
Pumpage 3<br />
Total<br />
Permitted<br />
Annual<br />
Average<br />
Quantity<br />
Permitted<br />
Quantity<br />
Attributed<br />
to AG <strong>Use</strong><br />
Category 4<br />
Charlotte 9648 Thomas Beddard A56F G 0.507 1.491 1.491 M<br />
Charlotte 9648 Thomas Beddard A56F S 0.299 1.491 1.491 M<br />
Charlotte 9687 Williams Farms Partnership A56F G 0.000 1.571 1.539 M<br />
Charlotte 9687 Williams Farms Partnership A56F S 1.024 1.571 1.539 M<br />
Charlotte 9727 Friedrich Schiller A415 G 0.353 0.492 0.492 M<br />
Charlotte 9926 R & D Cattle Ranch LLC A415 G 0.000 0.888 0.888 M<br />
Charlotte 10726 JDI Farms Inc A56F G 0.000 0.387 0.387 M<br />
Charlotte 10726 JDI Farms Inc A56F S 0.022 0.387 0.387 M<br />
Charlotte 10874 Charlotte <strong>Florida</strong> Part A415 G 0.329 0.221 0.221 M<br />
Charlotte 10959 M Lewis Hall Protective Test Tst For W Hall, Beneficiary A470 G 0.000 0.127 0.127 M<br />
Charlotte 11715<br />
Coral Creek Burnt Store LLC & Charlotte Orange Grove<br />
LLC<br />
A490 G 0.000 0.252 0.252 M<br />
Charlotte 11982 Bethel Farms LLLP A525 G 0.612 0.715 0.715 M<br />
Charlotte 12111 Kenny Grace A415 G 0.165 0.219 0.219 M<br />
Charlotte 12541 Cora Battista/Battista Sod Farms A525 G 0.000 0.350 0.350 M<br />
Charlotte 13027 James Williams A470 G 0.000 0.246 0.246 M<br />
Charlotte 13027 James Williams A470 S 0.048 0.246 0.246 M<br />
Charlotte 13096 T J And Mary Chastain A415 G 0.365 0.476 0.476 M<br />
Charlotte 13349 Ryals Citrus & Cattle Co A470 G 0.000 0.312 0.312 M<br />
Charlotte 20053 Hudson Hammocks, LLC And Jmh Tr A470 G 0.056 0.363 0.363 M<br />
Charlotte 20204 Thomas Chastain A470 G 0.040 0.260 0.260 M<br />
Charlotte 48 The Martha Moore Rockwell Trust Agreement A415 S 0.021 0.035 0.035 E<br />
Charlotte 153 Frederick H & Rachel M Walters A415 S 0.010 0.017 0.017 E<br />
Charlotte 154 Fred Schiller & Prairie Groves LLC A415 S 0.026 0.042 0.042 E<br />
Charlotte 609 Roy & Carrie Broyles A490 G 0.023 0.037 0.037 E<br />
Charlotte 1117 Kenny Grace A415 G 0.039 0.063 0.063 E<br />
Charlotte 3243 Bermont Grove, LLC A56S G 0.000 0.368 0.368 E<br />
Charlotte 4404 Jonathan Sargent A415 G 0.003 0.005 0.005 E<br />
Charlotte 5213 Idell Richardson Biel A58S S 0.006 0.010 0.010 E<br />
6641 Burdette Coward & Co., Inc / Hawks Landing of Punta A485<br />
0.066 0.094 0.094<br />
Charlotte<br />
Gorda, LLC<br />
G<br />
E<br />
M/E 5<br />
Page | 135
<strong>2011</strong> ESTIMATED WATER USE REPORT<br />
Table A7. Metered and <strong>Estimated</strong> Agricultural WUPs, Withdrawals and Permitted <strong>Use</strong> (mgd), <strong>2011</strong><br />
County<br />
WUP<br />
Number<br />
Permittee<br />
<strong>Use</strong><br />
Code 1<br />
Source 2<br />
Annual<br />
Average<br />
Pumpage 3<br />
Total<br />
Permitted<br />
Annual<br />
Average<br />
Quantity<br />
Permitted<br />
Quantity<br />
Attributed<br />
to AG <strong>Use</strong><br />
Category 4<br />
6641 Burdette Coward & Co., Inc / Hawks Landing of Punta A485<br />
0.000 0.094 0.094<br />
Charlotte<br />
Gorda, LLC<br />
S<br />
E<br />
Charlotte 8067 Alfred M & Mary Anne Johns A415 G 0.002 0.056 0.056 E<br />
Charlotte 8067 Alfred M & Mary Anne Johns A415 S 0.002 0.056 0.056 E<br />
Charlotte 8444 David & Pamela D'Amore A415 G 0.005 0.008 0.008 E<br />
Charlotte 9077 John David & John Henry McQueen A415 G 0.029 0.060 0.060 E<br />
Charlotte 9077 John David & John Henry McQueen A415 S 0.010 0.060 0.060 E<br />
Charlotte 10065 Paige Kreegel A415 G 0.041 0.056 0.056 E<br />
Charlotte 10307 Sharon Rutzke L610 G 0.002 0.004 0.004 E<br />
Charlotte 10416 Sunkiss & E P Safron A415 G 0.006 0.021 0.021 E<br />
Charlotte 10416 Sunkiss & E P Safron A415 S 0.007 0.021 0.021 E<br />
Charlotte 10636 Pace Tropicals Inc A415 G 0.028 0.046 0.046 E<br />
Charlotte 10872 <strong>Water</strong>way Group Inc & Tim Berti A43F G 0.061 0.111 0.111 E<br />
Charlotte 10885 Jimmy L Branch & John J Nevins A57F G 0.026 0.043 0.043 E<br />
Charlotte 10886 Skycrest Coach Club Inc A56S G 0.058 0.096 0.096 E<br />
Charlotte 11001 Triple D Investment Group LLC A415 S 0.023 0.038 0.038 E<br />
Charlotte 12872 Worden Farm A58S G 0.003 0.011 0.011 E<br />
Charlotte 12872 Worden Farm A58S S 0.000 0.011 0.011 E<br />
Charlotte 20186 Burnt Store Ranch, LLC A415 G 0.059 0.085 0.085 E<br />
10.413 Metered, mgd<br />
Charlotte County Totals<br />
0.556 <strong>Estimated</strong> , mgd<br />
10.969 Total, mgd<br />
Citrus 12288 M & B Products A495 G 0.000 0.497 0.497 M<br />
Citrus 191 Howard B. Banes, Jr. & Hanna E. Banes A415 G 0.009 0.014 0.014 E<br />
Citrus 204 Evn Road LLC A490 G 0.024 0.039 0.039 E<br />
Citrus 208 G. William Wilde A535 G 0.192 0.297 0.297 E<br />
Citrus 296 Ray A Morris A415 G 0.007 0.011 0.011 E<br />
Citrus 355 L Norman And Linda L Adams A415 G 0.014 0.023 0.023 E<br />
Citrus 1108 Z2F Citrus & Cattle LLC A415 G 0.069 0.099 0.099 E<br />
Citrus 1267 Estate Of Clinton E Marsh James E Marsh‐Personal Rep A495 G 0.019 0.031 0.031 E<br />
M/E 5<br />
<strong>Southwest</strong> <strong>Florida</strong> <strong>Water</strong> <strong>Management</strong> District<br />
Page | 136
<strong>2011</strong> ESTIMATED WATER USE REPORT<br />
Table A7. Metered and <strong>Estimated</strong> Agricultural WUPs, Withdrawals and Permitted <strong>Use</strong> (mgd), <strong>2011</strong><br />
County<br />
WUP<br />
Number<br />
<strong>Southwest</strong> <strong>Florida</strong> <strong>Water</strong> <strong>Management</strong> District<br />
Permittee<br />
<strong>Use</strong><br />
Code 1<br />
Source 2<br />
Annual<br />
Average<br />
Pumpage 3<br />
Total<br />
Permitted<br />
Annual<br />
Average<br />
Quantity<br />
Permitted<br />
Quantity<br />
Attributed<br />
to AG <strong>Use</strong><br />
Category 4<br />
Citrus 1272 C and E Landholdings and Citrus LLC A495 G 0.039 0.054 0.054 E<br />
Citrus 1273 Post Oak Ranch LLC A490 G 0.044 0.062 0.062 E<br />
Citrus 1491 Fred S Johnston Jr A490 G 0.062 0.086 0.086 E<br />
Citrus 2226 Edwin O'Neal A525 G 0.017 0.027 0.027 E<br />
Citrus 4368 Citrus County School Board / Attn: Michael Billings A58S G 0.005 0.087 0.009 E<br />
Citrus 4582 Thomas W. & Mary L. Harrison A415 G 0.019 0.032 0.032 E<br />
Citrus 4975 Van Ness Groves A415 G 0.022 0.089 0.089 E<br />
Citrus 4975 Van Ness Groves A415 S 0 0.089 0.089 E<br />
Citrus 5091 Toby John & Joanna Caulfeild L600 G 0 0 0 E<br />
Citrus 6798 Gerrits Citrus Inc A495 G 0.209 0.352 0.352 E<br />
Citrus 6965 Joane H Miller A470 G 0.046 0.064 0.064 E<br />
Citrus 6971 John W & Margaret R White A415 G 0.019 0.031 0.031 E<br />
Citrus 7687 Crystal River Quarries Inc L600 G 0 0.062 0.002 E<br />
Citrus 8747 William Hunt L610 G 0 0.003 0 E<br />
Citrus 8834 Ronnie D. Cannon & Edsel Rowan, Trustee A415 G 0.052 0.072 0.072 E<br />
Citrus 8863 Rosemary S McAteer A402 G 0.001 0.002 0.002 E<br />
Citrus 9222 Steve D & Kathie L Atkinson L600 G 0 0 0 E<br />
Citrus 9370 RaLPh Windham Jr L605 G 0.001 0.001 0.001 E<br />
Citrus 10192 Hollinswood Tree Nurseries A485 G 0.035 0.098 0.098 E<br />
Citrus 10306 Timothy E and Julie E Moffitt A415 G 0.008 0.022 0.022 E<br />
Citrus 10621 Snell A. Mills, Jr. A415 S 0 0.024 0.024 E<br />
Citrus 10842 Citrus Co BOCC & Dept Of Public A485 G 0.001 0.006 0.003 E<br />
Citrus 11746 Citrus Co BOCC L630 G 0.009 0.014 0.014 E<br />
Citrus 12149 Donna G Miller, Trustee A410 G 0.003 0.011 0.011 E<br />
Citrus 12565 Professional Horticultural Services A485 G 0.213 0.386 0.386 E<br />
Citrus 12865 Anthony L Russ A480 G 0.054 0.078 0.078 E<br />
Citrus 12901 William M & Rhonda J Scheiterle II A410 G 0.012 0.019 0.019 E<br />
Citrus 12974 Donna Miller Trustee A410 G 0.006 0.02 0.02 E<br />
Citrus 13136 Brian Busby A410 G 0.014 0.023 0.023 E<br />
Citrus 13252 David Tomczak A410 G 0.011 0.018 0.018 E<br />
Citrus 13360 Throgmartin‐Henke Ranch & A470 G 0.128 0.232 0.232 E<br />
M/E 5<br />
Page | 137
<strong>2011</strong> ESTIMATED WATER USE REPORT<br />
Table A7. Metered and <strong>Estimated</strong> Agricultural WUPs, Withdrawals and Permitted <strong>Use</strong> (mgd), <strong>2011</strong><br />
County<br />
WUP<br />
Number<br />
Permittee<br />
<strong>Use</strong><br />
Code 1<br />
Source 2<br />
Annual<br />
Average<br />
Pumpage 3<br />
Total<br />
Permitted<br />
Annual<br />
Average<br />
Quantity<br />
Permitted<br />
Quantity<br />
Attributed<br />
to AG <strong>Use</strong><br />
Category 4<br />
Citrus 20046 Pinewoods Plantation Nursery Inc A465 G 0.068 0.123 0.123 E<br />
0.000 Metered, mgd<br />
Citrus County Totals<br />
1.432 <strong>Estimated</strong> , mgd<br />
1.432 Total, mgd<br />
DeSoto 164 Citrus Pride A415 G 0.046 0.156 0.156 M<br />
DeSoto 572 Sorrells Groves Inc. A415 G 0.177 0.233 0.233 M<br />
DeSoto 898 Garner Groves & Cattle Co Inc A415 G 0.003 0.138 0.138 M<br />
DeSoto 898 Garner Groves & Cattle Co Inc A415 S 0.000 0.138 0.138 M<br />
DeSoto 940 James Bickett A415 G 1.061 0.330 0.330 M<br />
DeSoto 1018 Tland LLC A415 G 0.000 0.076 0.076 M<br />
DeSoto 1020 Ryals Citrus and Cattle Co. and Ann Ryals A470 G 0.000 0.330 0.330 M<br />
DeSoto 1176 Brian T & Mary Kathryn Burns A415 G 0.096 0.109 0.109 M<br />
DeSoto 1240 Rod R Sweet A415 G 0.036 0.074 0.074 M<br />
DeSoto 1379 Robert C,Lenora P & James Brewer A415 G 0.137 0.095 0.095 M<br />
DeSoto 1381 Sorrells of Manatee Inc A415 G 0.167 0.141 0.141 M<br />
DeSoto 1390 Sorrells Groves Inc. A415 G 0.509 0.394 0.394 M<br />
DeSoto 1547 Virginia J & James Albritton A470 G 0.000 0.306 0.306 M<br />
DeSoto 1568 Len Hazen A415 G 0.053 0.186 0.186 M<br />
DeSoto 1635 Bethel Farms, LLLP A525 G 1.792 2.578 2.578 M<br />
DeSoto 1711 Sunny South Packing Co A415 G 0.197 0.239 0.239 M<br />
DeSoto 1719 Sunny South Packing Co A415 G 0.130 0.174 0.174 M<br />
DeSoto 1722 Sunny South Packing Co A415 G 0.075 0.079 0.079 M<br />
DeSoto 1723 Sunny South Packing Co A415 G 0.220 0.317 0.317 M<br />
DeSoto 1754 DeSoto 310 Land Trust A415 G 0.000 0.114 0.114 M<br />
DeSoto 1755 V C Hollingsworth Jr A415 G 0.000 0.097 0.097 M<br />
DeSoto 1766 V C Hollingsworth Jr A415 G 0.039 0.080 0.080 M<br />
DeSoto 1771 Diner Citrus and Cattle Company A415 G 0.000 0.132 0.132 M<br />
DeSoto 1774 Sunny South Packing Co A415 G 0.068 0.063 0.063 M<br />
DeSoto 2125 Horse Creek Partnership et al A470 G 0.052 0.607 0.607 M<br />
DeSoto 2125 Horse Creek Partnership et al A470 S 0.000 0.607 0.607 M<br />
M/E 5<br />
<strong>Southwest</strong> <strong>Florida</strong> <strong>Water</strong> <strong>Management</strong> District<br />
Page | 138
<strong>2011</strong> ESTIMATED WATER USE REPORT<br />
Table A7. Metered and <strong>Estimated</strong> Agricultural WUPs, Withdrawals and Permitted <strong>Use</strong> (mgd), <strong>2011</strong><br />
County<br />
WUP<br />
Number<br />
<strong>Southwest</strong> <strong>Florida</strong> <strong>Water</strong> <strong>Management</strong> District<br />
Permittee<br />
<strong>Use</strong><br />
Code 1<br />
Source 2<br />
Annual<br />
Average<br />
Pumpage 3<br />
Total<br />
Permitted<br />
Annual<br />
Average<br />
Quantity<br />
Permitted<br />
Quantity<br />
Attributed<br />
to AG <strong>Use</strong><br />
Category 4<br />
DeSoto 2193 The Phillip W Turner Family Partnership LTD A490 G 0.488 3.967 3.967 M<br />
DeSoto 2240 Eugene H Turner Family Partnership Ltd A415 G 0.270 0.239 0.239 M<br />
DeSoto 2240 Eugene H Turner Family Partnership Ltd A415 S 0.000 0.239 0.239 M<br />
DeSoto 2386 Joshua <strong>Water</strong> Control District A415 G 11.337 14.353 14.353 M<br />
DeSoto 2390 Alfred G & Mary J Parker A490 G 0.080 0.265 0.265 M<br />
DeSoto 2452 <strong>Florida</strong> Power & Light Co & OCF 27 Corp A58S G 0.944 4.301 4.301 M<br />
DeSoto 2613 Sorrells Groves Inc. A415 G 0.147 0.132 0.132 M<br />
DeSoto 2665 M & V LLC A415 G 0.059 0.677 0.677 M<br />
DeSoto 2665 M & V LLC A415 S 0.623 0.677 0.677 M<br />
DeSoto 2703 VCH Citrus A415 G 0.364 0.473 0.473 M<br />
DeSoto 2740 Eugene H Turner & Eugene H Turner and Son Inc A415 G 0.449 0.573 0.573 M<br />
DeSoto 2790 Heritage Farms A415 G 0.064 0.150 0.150 M<br />
DeSoto 2791 John Burtscher A415 G 0.044 0.086 0.086 M<br />
DeSoto 2793 DeSoto Land Holdings LLLP A415 G 0.085 0.226 0.226 M<br />
DeSoto 2890 E & D Ranch LLP A495 G 0.090 0.116 0.116 M<br />
DeSoto 2906 Ben Hill Griffin, Inc. A416 G 0.060 0.121 0.121 M<br />
DeSoto 3069 DeSoto Land Investment, LLC A415 G 0.305 0.498 0.498 M<br />
DeSoto 3160 C & H Groves Inc A415 G 0.180 0.136 0.135 M<br />
DeSoto 3216 DeSoto Groves & Development Inc A415 G 0.157 0.345 0.345 M<br />
DeSoto 3275 Adrian R Chapman A415 G 1.458 1.102 1.102 M<br />
DeSoto 3322 Sorrells Groves Inc. A415 G 0.060 0.081 0.081 M<br />
DeSoto 3474 John W Parker Jr A415 G 0.049 0.070 0.070 M<br />
DeSoto 4396 Sorrells Groves Inc. A415 G 0.150 0.154 0.154 M<br />
DeSoto 4606 Spanish Trail Land & Cattle Company LLC A525 G 0.130 3.398 3.398 M<br />
DeSoto 4606 Spanish Trail Land & Cattle Company LLC A525 S 0.000 3.398 3.398 M<br />
DeSoto 4611 Cary Mercer A415 G 0.035 0.133 0.133 M<br />
DeSoto 4641 Roper Growers Cooperative A415 G 0.382 1.167 1.167 M<br />
DeSoto 4726 Ridgeback Grove LLC A415 G 0.103 0.171 0.171 M<br />
DeSoto 4806 Sorrells Groves Inc. A415 G 0.251 0.241 0.241 M<br />
DeSoto 4899 Agregy Two of <strong>Florida</strong> LLC L632 G 2.124 0.352 0.352 M<br />
DeSoto 5060 Charlee LLC A470 G 2.018 2.203 2.203 M<br />
M/E 5<br />
Page | 139
<strong>2011</strong> ESTIMATED WATER USE REPORT<br />
Table A7. Metered and <strong>Estimated</strong> Agricultural WUPs, Withdrawals and Permitted <strong>Use</strong> (mgd), <strong>2011</strong><br />
County<br />
WUP<br />
Number<br />
<strong>Southwest</strong> <strong>Florida</strong> <strong>Water</strong> <strong>Management</strong> District<br />
Permittee<br />
<strong>Use</strong><br />
Code 1<br />
Source 2<br />
Annual<br />
Average<br />
Pumpage 3<br />
Total<br />
Permitted<br />
Annual<br />
Average<br />
Quantity<br />
Permitted<br />
Quantity<br />
Attributed<br />
to AG <strong>Use</strong><br />
Category 4<br />
DeSoto 5875 James Bickett A415 G 0.659 0.773 0.773 M<br />
DeSoto 5951 Dan C Shelfer A415 G 0.020 0.158 0.158 M<br />
DeSoto 6064 James D & Robert C Brewer A415 G 0.053 0.144 0.144 M<br />
DeSoto 6122 V C Hollingsworth Sr Estate A415 G 0.158 0.247 0.247 M<br />
DeSoto 6134 Robert M & Barbara G Tiffany A415 G 0.087 0.109 0.109 M<br />
DeSoto 6274 Premier Citrus LLC A415 G 0.925 0.523 0.523 M<br />
DeSoto 6275 Premier Citrus LLC A415 G 1.230 0.876 0.876 M<br />
DeSoto 6410 Charles Harrison A415 G 0.078 0.110 0.110 M<br />
DeSoto 6411 DeSoto Land Trust A415 G 0.133 0.217 0.217 M<br />
DeSoto 6669 FLM, Inc. A415 G 1.713 1.516 1.516 M<br />
DeSoto 6669 FLM, Inc. A415 S 0.014 1.516 1.516 M<br />
DeSoto 6765 LD Hancock Marital Trust A415 G 0.399 1.313 1.313 M<br />
DeSoto 6765 LD Hancock Marital Trust A415 S 0.684 1.313 1.313 M<br />
DeSoto 6871 Davis Enterprises Inc A415 G 0.452 0.421 0.421 M<br />
DeSoto 6872 Bob Paul Inc A415 G 0.182 1.585 1.585 M<br />
DeSoto 6968 Calvin Boggess A51S G 0.227 0.932 0.932 M<br />
DeSoto 7134 Margaret Hollingsworth A495 G 0.010 0.145 0.145 M<br />
DeSoto 7236 Firedog Farms Partnership A415 G 0.033 0.474 0.474 M<br />
DeSoto 7262 Sorrells Groves Inc. A415 G 0.073 0.088 0.088 M<br />
DeSoto 7269 Michael Boran A525 G 0.050 0.931 0.931 M<br />
DeSoto 7290 James D. Brewer and E. Coleman Brewer A415 G 0.048 0.307 0.307 M<br />
DeSoto 7291 V.C. Hollingsworth Sr. Estate A415 G 0.187 0.117 0.117 M<br />
DeSoto 7292 Charles Harrison A415 G 0.060 0.080 0.080 M<br />
DeSoto 7331 L. I. Smith A415 G 0.000 0.254 0.254 M<br />
DeSoto 7434 DeSoto Land Holdings LLLP A415 G 0.042 0.223 0.223 M<br />
DeSoto 7462 Bright Hour Ranch A525 G 0.399 1.246 1.246 M<br />
DeSoto 7463 3 F Ranch LLC A490 G 0.000 0.168 0.168 M<br />
DeSoto 7475 Pelican Groves Inc A415 G 0.130 0.248 0.248 M<br />
DeSoto 7506 Schwartz DeSoto Properties LLC A415 G 0.001 0.152 0.152 M<br />
DeSoto 7535 Desoto Land Holdings LLLP A415 G 0.000 0.090 0.090 M<br />
DeSoto 7748 David W & Marion Kitchen Trust L660 G 0.105 0.488 0.488 M<br />
M/E 5<br />
Page | 140
<strong>2011</strong> ESTIMATED WATER USE REPORT<br />
Table A7. Metered and <strong>Estimated</strong> Agricultural WUPs, Withdrawals and Permitted <strong>Use</strong> (mgd), <strong>2011</strong><br />
County<br />
WUP<br />
Number<br />
<strong>Southwest</strong> <strong>Florida</strong> <strong>Water</strong> <strong>Management</strong> District<br />
Permittee<br />
<strong>Use</strong><br />
Code 1<br />
Source 2<br />
Annual<br />
Average<br />
Pumpage 3<br />
Total<br />
Permitted<br />
Annual<br />
Average<br />
Quantity<br />
Permitted<br />
Quantity<br />
Attributed<br />
to AG <strong>Use</strong><br />
Category 4<br />
DeSoto 7775 Sorrells Groves Inc. A415 G 0.119 0.118 0.118 M<br />
DeSoto 7776 E & D Ranch LLP A415 G 0.003 0.068 0.068 M<br />
DeSoto 7783 Premier Citrus LLC A415 G 0.531 0.456 0.456 M<br />
Marcus A. Rosin, Matthew L. Rosin, and Andrew W.<br />
G<br />
DeSoto 7854 Rosin<br />
A415<br />
0.177 0.137 0.137<br />
M<br />
DeSoto 7870 Hester/Norris Partnership A490 G 0.000 0.198 0.198 M<br />
DeSoto 7957 Turner Groves Citrus Limited Partnership A415 G 2.648 3.166 3.166 M<br />
DeSoto 8154 Emerald Packing Company Inc A415 G 0.061 0.071 0.071 M<br />
DeSoto 8155 DeSoto Land Partners, LLC A58S G 0.000 0.149 0.149 M<br />
DeSoto 8159 John W Parker Jr A415 G 0.086 0.227 0.227 M<br />
DeSoto 8186 DeSoto Land Holdings LLLP A415 G 0.073 0.323 0.323 M<br />
DeSoto 8287 Keystone Grove LLC A415 G 0.131 0.174 0.174 M<br />
DeSoto 8299 William Marsh A415 G 0.152 0.104 0.104 M<br />
DeSoto 8348 William Head A415 G 0.077 0.473 0.473 M<br />
DeSoto 8461 Desoto Land Holdings LLLP A415 G 0.104 0.136 0.136 M<br />
DeSoto 8480 Hawthorne Creek Groves LLC A415 G 0.616 0.941 0.941 M<br />
DeSoto 8551 Desoto Land Holdings LLLP A490 G 0.000 0.126 0.126 M<br />
DeSoto 8566 Eugene H Turner Family Partnership Ltd A470 G 1.717 3.576 3.576 M<br />
DeSoto 8589 Desoto Land Holdings LLLP A415 G 0.094 0.092 0.092 M<br />
DeSoto 8660 Desoto 451 Land Trust A415 G 0.233 0.356 0.356 M<br />
DeSoto 8670 Citrus Pride A415 G 0.082 0.211 0.211 M<br />
DeSoto 8757 Premier Citrus LLC A415 G 0.698 0.425 0.425 M<br />
DeSoto 8773 Charlotte Harbor Landing LLC A415 G 0.262 0.158 0.158 M<br />
DeSoto 8801 Calvin Boggess A415 G 0.037 0.104 0.104 M<br />
DeSoto 8801 Calvin Boggess A415 S 0.000 0.104 0.104 M<br />
DeSoto 8860 Estate Of V C Hollingsworth Sr A415 G 0.309 0.504 0.504 M<br />
DeSoto 8935 V C Hollingsworth Sr Estate A415 G 0.047 0.131 0.130 M<br />
DeSoto 8985 Gaylon Lawrence A415 G 3.063 2.603 2.603 M<br />
DeSoto 9031 Sorrells Groves Inc A415 G 0.075 0.127 0.127 M<br />
DeSoto 9073 Anita J. Diaz Revocable Trust L661 G 0.215 0.325 0.325 M<br />
DeSoto 9127 SunRiver Citrus <strong>Florida</strong> LLC A415 G 0.012 0.350 0.350 M<br />
M/E 5<br />
Page | 141
<strong>2011</strong> ESTIMATED WATER USE REPORT<br />
Table A7. Metered and <strong>Estimated</strong> Agricultural WUPs, Withdrawals and Permitted <strong>Use</strong> (mgd), <strong>2011</strong><br />
County<br />
WUP<br />
Number<br />
<strong>Southwest</strong> <strong>Florida</strong> <strong>Water</strong> <strong>Management</strong> District<br />
Permittee<br />
<strong>Use</strong><br />
Code 1<br />
Source 2<br />
Annual<br />
Average<br />
Pumpage 3<br />
Total<br />
Permitted<br />
Annual<br />
Average<br />
Quantity<br />
Permitted<br />
Quantity<br />
Attributed<br />
to AG <strong>Use</strong><br />
Category 4<br />
DeSoto 9154 J Bar C Inc A415 G 0.418 0.453 0.453 M<br />
DeSoto 9185 C & H Groves, Inc A415 G 0.374 0.382 0.382 M<br />
DeSoto 9226 Bluehead Farms, LLC A535 G 0.813 1.267 1.267 M<br />
DeSoto 9254 Turner Kids Grove LLP A415 G 0.300 0.310 0.310 M<br />
DeSoto 9279 Sorrells Groves Inc. A415 G 0.069 0.076 0.076 M<br />
DeSoto 9373 Far‐Lo Groves A415 G 0.017 0.123 0.123 M<br />
DeSoto 9469 Sorrells Groves Inc. A415 G 0.171 0.259 0.259 M<br />
DeSoto 9471 Orange‐Co, LP A415 G 1.470 0.642 0.642 M<br />
DeSoto 9478 Michael Boran A525 G 0.112 0.954 0.954 M<br />
DeSoto 9492 Premier Citrus LLC A415 G 0.335 0.253 0.253 M<br />
DeSoto 9567 L.I. Smith A415 G 0.338 0.291 0.291 M<br />
DeSoto 9571 Robert H Barben, Robert J Barben A415 G 0.157 0.160 0.160 M<br />
DeSoto 9715 James D. and Robert C. Brewer A415 G 0.103 0.188 0.188 M<br />
DeSoto 9716 Island Grove LLC A410 G 0.073 0.089 0.089 M<br />
DeSoto 9732 The Garrett Ranch Partnership LL LP A490 G 0.005 0.139 0.139 M<br />
DeSoto 9734 Ryals Citrus & Cattle A470 G 0.051 0.227 0.227 M<br />
DeSoto 9741 Mosaic Fertilizer LLC & CMI Family Dynamics Inc A470 G 0.785 1.482 1.482 M<br />
DeSoto 9782 Peace Valley Groves Inc A415 G 0.786 0.648 0.648 M<br />
DeSoto 9789 Kristie And Daniel Via A415 G 0.005 0.079 0.079 M<br />
DeSoto 10067 Ed Watson A415 G 0.136 0.137 0.137 M<br />
DeSoto 10233 C T & Maxcine Adams A415 G 0.000 0.116 0.116 M<br />
DeSoto 10251 Robert Tiffany A415 G 0.058 0.076 0.076 M<br />
DeSoto 10379 King Enterprises A415 G 0.070 0.164 0.164 M<br />
DeSoto 10505 Orange‐Co, LP A415 G 0.403 0.486 0.486 M<br />
DeSoto 10553 James D & E Coleman Brewer A415 G 0.070 0.115 0.115 M<br />
DeSoto 10719 The Phillip W Turner Family Partnership LTD A416 G 0.150 0.293 0.293 M<br />
DeSoto 10722 Orange‐Co, LP A415 G 0.508 0.765 0.765 M<br />
DeSoto 10744 James D & Walter L Brewer A415 G 0.034 0.076 0.076 M<br />
DeSoto 10778 Orange‐Co, LP A415 G 0.323 0.229 0.229 M<br />
DeSoto 10790 Orange‐Co, LP A415 G 0.188 0.218 0.218 M<br />
DeSoto 10791 Orange‐Co, LP A415 G 0.447 0.612 0.612 M<br />
M/E 5<br />
Page | 142
<strong>2011</strong> ESTIMATED WATER USE REPORT<br />
Table A7. Metered and <strong>Estimated</strong> Agricultural WUPs, Withdrawals and Permitted <strong>Use</strong> (mgd), <strong>2011</strong><br />
County<br />
WUP<br />
Number<br />
<strong>Southwest</strong> <strong>Florida</strong> <strong>Water</strong> <strong>Management</strong> District<br />
Permittee<br />
<strong>Use</strong><br />
Code 1<br />
Source 2<br />
Annual<br />
Average<br />
Pumpage 3<br />
Total<br />
Permitted<br />
Annual<br />
Average<br />
Quantity<br />
Permitted<br />
Quantity<br />
Attributed<br />
to AG <strong>Use</strong><br />
Category 4<br />
DeSoto 10793 Orange‐Co, LP A415 G 0.344 0.463 0.463 M<br />
Eugene H. Turner & Philip W. Turner Family<br />
G<br />
DeSoto 10844 Partnership, Ltd.<br />
A535<br />
0.662 0.334 0.334<br />
M<br />
Eugene H. Turner & Philip W. Turner Family<br />
S<br />
DeSoto 10844 Partnership, Ltd.<br />
A535<br />
0.000 0.334 0.334<br />
M<br />
DeSoto 10892 Desoto 310 Land Trust L630 G 0.000 0.190 0.190 M<br />
DeSoto 10971 William Marsh A415 G 0.233 0.116 0.116 M<br />
DeSoto 11124 Dimare Ruskin #2 LLC A56F G 1.769 2.259 2.259 M<br />
DeSoto 11256 Esther Fuhrer A470 G 0.000 0.240 0.240 M<br />
DeSoto 11261 Peace River Development Corp A470 G 0.000 0.665 0.665 M<br />
DeSoto 11549 Premiere Agricultural Properties A415 G 0.992 0.873 0.873 M<br />
DeSoto 11599 JRC Groves Inc A415 G 0.129 0.093 0.093 M<br />
DeSoto 11604 Isaac F Albritton Groves Ltd A470 G 0.000 0.398 0.398 M<br />
DeSoto 11665 4 N 1 Grove LLC A415 G 0.188 0.262 0.262 M<br />
DeSoto 11718 Bermont Properties LLC A415 G 0.059 0.151 0.151 M<br />
DeSoto 12004 Department of Corrections A58H G 0.217 0.252 0.252 M<br />
DeSoto 12179 Owens Enterprises Inc A415 G 0.075 0.073 0.073 M<br />
DeSoto 12195 CB Landholdings II LLC A415 G 0.075 0.287 0.287 M<br />
DeSoto 12253 Citrus Grove Inc A415 G 0.136 0.120 0.120 M<br />
DeSoto 12340 Orange‐Co, LP A415 G 0.134 0.417 0.417 M<br />
DeSoto 12453 Desoto Land Holdings LLLP A415 G 0.022 0.127 0.127 M<br />
DeSoto 12503 VCH Citrus A525 G 0.000 0.496 0.496 M<br />
DeSoto 12562 James Albritton A415 G 0.000 0.131 0.131 M<br />
DeSoto 12814 Tiger Bay Ranch LLC A490 G 0.000 1.749 1.749 M<br />
DeSoto 12818 Island Grove LLC A410 G 0.054 0.110 0.110 M<br />
DeSoto 12866 V.C. Hollingsworth Sr. Estate A415 G 0.000 0.206 0.206 M<br />
DeSoto 13000 Lynnhart Citrus LLC A470 G 0.000 0.199 0.199 M<br />
DeSoto 13025 RCB DeSoto, LLC A415 G 0.008 0.087 0.087 M<br />
DeSoto 13151 Navum Valley Farms 35, LLC A415 G 0.132 0.469 0.469 M<br />
DeSoto 13225 Evelyn I. Collins A525 G 0.000 0.160 0.160 M<br />
DeSoto 13225 Evelyn I. Collins A525 S 0.000 0.160 0.160 M<br />
M/E 5<br />
Page | 143
<strong>2011</strong> ESTIMATED WATER USE REPORT<br />
Table A7. Metered and <strong>Estimated</strong> Agricultural WUPs, Withdrawals and Permitted <strong>Use</strong> (mgd), <strong>2011</strong><br />
County<br />
WUP<br />
Number<br />
Permittee<br />
<strong>Use</strong><br />
Code 1<br />
Source 2<br />
Annual<br />
Average<br />
Pumpage 3<br />
Total<br />
Permitted<br />
Annual<br />
Average<br />
Quantity<br />
Permitted<br />
Quantity<br />
Attributed<br />
to AG <strong>Use</strong><br />
Category 4<br />
DeSoto 117 Zeb N & Betty E Parker A415 G 0.007 0.011 0.011 E<br />
DeSoto 209 JRC Groves Inc A415 G 0.023 0.038 0.038 E<br />
DeSoto 457 Lawrence Coleman & Leonas Dicks A415 G 0.013 0.022 0.022 E<br />
DeSoto 481 George T Dees A415 G 0.044 0.061 0.061 E<br />
DeSoto 895 Gwendolyn Johnson A415 G 0.009 0.014 0.014 E<br />
DeSoto 896 McClain Grove Corporation A415 G 0.02 0.033 0.033 E<br />
DeSoto 897 Sorrells Groves Inc. A415 G 0.046 0.064 0.064 E<br />
DeSoto 899 Samuel Jones Godfrey III A415 G 0.01 0.017 0.017 E<br />
DeSoto 900 Estate Of Richard Burnett A415 G 0.009 0.031 0.031 E<br />
DeSoto 976 Eugene H Turner III LLC A415 G 0.038 0.053 0.053 E<br />
DeSoto 1017 Hutson Waltire Graveyard Grove & Calvin C Boggess A415 G 0.037 0.052 0.052 E<br />
DeSoto 1048 Benjamin K Norris A415 G 0.024 0.039 0.039 E<br />
DeSoto 1097 Donald G & Linda Brewer A415 G 0.015 0.025 0.025 E<br />
DeSoto<br />
1237 Samuel D Jr & Helen I Kyle Tst Revoc Tst Samuel D Kyle L600 G 0.001 0.001 0.001 E<br />
DeSoto 1280 Geraldine Barnwell A415 G 0.029 0.048 0.048 E<br />
DeSoto 1376 Rw And Marie Patterson A415 G 0.011 0.018 0.018 E<br />
DeSoto 1380 Sorrells Groves Inc. A415 G 0.031 0.05 0.05 E<br />
DeSoto 1382 Sorrells Groves Inc. A415 G 0.004 0.007 0.007 E<br />
DeSoto 1383 Sorrells Groves Inc. A415 G 0.009 0.015 0.015 E<br />
DeSoto 1384 Sorrells Groves Inc. A415 G 0.03 0.05 0.05 E<br />
DeSoto 1385 Sorrells Groves Inc. A415 G 0.023 0.038 0.038 E<br />
DeSoto 1386 Sorrells Groves Inc. A415 G 0.013 0.022 0.022 E<br />
DeSoto 1387 Sorrells Groves Inc. A415 G 0.025 0.042 0.042 E<br />
DeSoto 1388 Sorrells Groves Inc. A415 G 0.019 0.054 0.054 E<br />
DeSoto 1389 Sorrells Groves Inc. A415 G 0.038 0.053 0.053 E<br />
DeSoto 1391 Down South Blues Corp A410 G 0.017 0.056 0.056 E<br />
DeSoto 1392 Sorrells Groves Inc. A415 G 0.039 0.054 0.054 E<br />
DeSoto 1393 Robert E & Delynne M Pitts A415 G 0.015 0.025 0.025 E<br />
DeSoto 1399 E Donald & Dona R Gant A415 G 0.01 0.017 0.017 E<br />
DeSoto 1419 Neill & Sherry P Tyree A415 G 0.01 0.017 0.017 E<br />
M/E 5<br />
<strong>Southwest</strong> <strong>Florida</strong> <strong>Water</strong> <strong>Management</strong> District<br />
Page | 144
<strong>2011</strong> ESTIMATED WATER USE REPORT<br />
Table A7. Metered and <strong>Estimated</strong> Agricultural WUPs, Withdrawals and Permitted <strong>Use</strong> (mgd), <strong>2011</strong><br />
County<br />
WUP<br />
Number<br />
<strong>Southwest</strong> <strong>Florida</strong> <strong>Water</strong> <strong>Management</strong> District<br />
Permittee<br />
<strong>Use</strong><br />
Code 1<br />
Source 2<br />
Annual<br />
Average<br />
Pumpage 3<br />
Total<br />
Permitted<br />
Annual<br />
Average<br />
Quantity<br />
Permitted<br />
Quantity<br />
Attributed<br />
to AG <strong>Use</strong><br />
Category 4<br />
1434 Sue G Parker‐Trustee Under Declaration Of Trst<br />
A415<br />
0.02 0.032 0.032<br />
G<br />
DeSoto<br />
9/27/94<br />
E<br />
DeSoto 1436 James T Mizell Sr & Juanita M Mi A495 G 0.03 0.049 0.049 E<br />
DeSoto 1452 John Edward & Ann Lorine Johnson A415 G 0.011 0.017 0.017 E<br />
DeSoto 1462 Wallace D Hope A415 G 0.016 0.027 0.027 E<br />
DeSoto 1471 Tara Welles Jones A415 G 0.003 0.005 0.005 E<br />
DeSoto 1564 Je Fletcher A415 G 0.011 0.018 0.018 E<br />
1573 Raymond Stewart‐William Mercer William Wise‐Kay A415<br />
0.019 0.031 0.031<br />
DeSoto<br />
Wise<br />
G<br />
E<br />
DeSoto 1578 Hao S & Tuong M Tran L600 G 0.001 0.001 0.001 E<br />
DeSoto 1604 Sunny South Packing Co A415 G 0.014 0.024 0.024 E<br />
DeSoto 1687 Cary Mike Mercer & Eugene H Jr & Jane Turner A415 G 0.067 0.092 0.092 E<br />
DeSoto 1710 Sunny South Packing Co A415 G 0.017 0.028 0.028 E<br />
DeSoto 1712 Sunny South Packing Co A415 G 0.025 0.041 0.041 E<br />
DeSoto 1714 Sunny South Packing Co A415 G 0.046 0.064 0.064 E<br />
DeSoto 1715 Sunny South Packing Co A415 G 0.028 0.046 0.046 E<br />
DeSoto 1716 Sunny South Packing Co A415 G 0.026 0.043 0.043 E<br />
DeSoto 1718 James B & Mary Jo Rummer A415 G 0.008 0.013 0.013 E<br />
DeSoto 1721 Sunny South Packing Co A415 G 0.014 0.024 0.024 E<br />
DeSoto 1756 Emmanuel K Christophel A415 G 0.018 0.03 0.03 E<br />
DeSoto 1758 Cary & Charlie & Louise Mercer A415 G 0.018 0.029 0.029 E<br />
DeSoto 1767 Geraci‐King Ranch Trust L610 G 0.007 0.012 0.012 E<br />
DeSoto 1769 FGK A415 G 0.019 0.031 0.031 E<br />
DeSoto 1770 Diner Citrus & Cattle Co A415 G 0.005 0.008 0.008 E<br />
DeSoto 1772 V C Hollingsworth Jr & III A415 G 0.028 0.046 0.046 E<br />
DeSoto 1773 C W Harrison Inc A415 G 0.011 0.019 0.019 E<br />
DeSoto 1775 Diner Citrus & Cattle Co A415 G 0.039 0.054 0.054 E<br />
DeSoto 1879 Charles W & Josephine J Snedeker A490 G 0.004 0.007 0.007 E<br />
DeSoto 1909 Raymond Dodds Jr A415 G 0.034 0.055 0.055 E<br />
DeSoto 2036 Sorrells Groves Inc. A415 G 0.027 0.045 0.045 E<br />
DeSoto 2075 Susie E Hayden & RaLPh M & Sue Ann Eagleton A415 G 0.01 0.016 0.016 E<br />
M/E 5<br />
Page | 145
<strong>2011</strong> ESTIMATED WATER USE REPORT<br />
Table A7. Metered and <strong>Estimated</strong> Agricultural WUPs, Withdrawals and Permitted <strong>Use</strong> (mgd), <strong>2011</strong><br />
County<br />
WUP<br />
Number<br />
<strong>Southwest</strong> <strong>Florida</strong> <strong>Water</strong> <strong>Management</strong> District<br />
Permittee<br />
<strong>Use</strong><br />
Code 1<br />
Source 2<br />
Annual<br />
Average<br />
Pumpage 3<br />
Total<br />
Permitted<br />
Annual<br />
Average<br />
Quantity<br />
Permitted<br />
Quantity<br />
Attributed<br />
to AG <strong>Use</strong><br />
Category 4<br />
DeSoto 2078 Molzan Enterprises Ltd A415 G 0.018 0.03 0.03 E<br />
DeSoto 2079 Susie E Hayden A415 G 0.017 0.028 0.028 E<br />
DeSoto 2080 Susie E Hayden A415 G 0.009 0.015 0.015 E<br />
DeSoto 2138 Mary E Dow A490 G 0.019 0.031 0.031 E<br />
DeSoto 2194 B & J Thornton Creek LLC & Djf Thornton Creek LLC A415 G 0.005 0.008 0.008 E<br />
DeSoto 2203 Bill E. Blocker A415 G 0.034 0.075 0.075 E<br />
DeSoto 2228 Turner Kids Grove LLP A415 G 0.012 0.02 0.02 E<br />
DeSoto 2231 B & J Thornton Creek LLC & Djf Thornton Creek LLC A415 G 0.002 0.004 0.004 E<br />
DeSoto 2233 Price Citrus Lc A415 G 0.025 0.042 0.042 E<br />
DeSoto 2237 Charles W & Fay T Harrison A415 G 0.028 0.046 0.046 E<br />
DeSoto 2243 Eugene Turner III A415 G 0.039 0.054 0.054 E<br />
2401 MC Buck Land and Cattle Co., LLC, Dallas Land Co., LLC, A470<br />
0.06 0.083 0.083<br />
DeSoto<br />
Smith<br />
G<br />
E<br />
DeSoto 2418 Island Grove LLC A410 G 0 0.056 0.056 E<br />
DeSoto 2418 Island Grove LLC A410 S 0 0.056 0.056 E<br />
DeSoto 2419 W H Trawick L610 G 0.002 0.004 0.004 E<br />
DeSoto 2435 Estate Groves Inc A415 G 0.014 0.046 0.046 E<br />
DeSoto 2455 McSweeney & Co Inc A415 G 0.014 0.023 0.023 E<br />
DeSoto 2577 John And Jeannette Reynolds L610 G 0.001 0.001 0.001 E<br />
DeSoto 2578 Robert C, Lenora P & James Brewer A415 G 0.006 0.02 0.02 E<br />
DeSoto 2726 Betty L Martin & Kitty G Coleman A415 G 0.008 0.014 0.014 E<br />
DeSoto 2741 James S & Frances Parker A490 G 0.025 0.07 0.07 E<br />
DeSoto 2771 Brian Campbell A415 G 0.037 0.055 0.055 E<br />
DeSoto 2787 Robert A Thomas A415 G 0.026 0.043 0.043 E<br />
DeSoto 2891 Hollidale Farms, Inc. A415 G 0.01 0.017 0.017 E<br />
DeSoto 2892 Barbara Tiffany A415 G 0.019 0.031 0.031 E<br />
DeSoto 2894 Tintagel Holdings Of <strong>Florida</strong> Inc L600 G 0.007 0.012 0.012 E<br />
DeSoto 2895 J.W. Hasty and Jerrill Wayne Hasty L600 G 0 0.001 0.001 E<br />
DeSoto 2896 Douglas & Linda Oefinger A490 G 0.01 0.016 0.016 E<br />
DeSoto 2898 RaLPh M Hamilton A415 G 0.011 0.018 0.018 E<br />
DeSoto 2899 Kings Ranch III LLC A415 G 0.025 0.041 0.041 E<br />
M/E 5<br />
Page | 146
<strong>2011</strong> ESTIMATED WATER USE REPORT<br />
Table A7. Metered and <strong>Estimated</strong> Agricultural WUPs, Withdrawals and Permitted <strong>Use</strong> (mgd), <strong>2011</strong><br />
County<br />
WUP<br />
Number<br />
<strong>Southwest</strong> <strong>Florida</strong> <strong>Water</strong> <strong>Management</strong> District<br />
Permittee<br />
<strong>Use</strong><br />
Code 1<br />
Source 2<br />
Annual<br />
Average<br />
Pumpage 3<br />
Total<br />
Permitted<br />
Annual<br />
Average<br />
Quantity<br />
Permitted<br />
Quantity<br />
Attributed<br />
to AG <strong>Use</strong><br />
Category 4<br />
DeSoto 2912 Woodson, James L610 G 0 0.001 0.001 E<br />
DeSoto 2915 Jerry L Bayne L600 G 0 0 0 E<br />
DeSoto 2958 Boggess Family Partnership A490 G 0.061 0.089 0.089 E<br />
DeSoto 2959 Boggess Family Partnership A415 G 0.038 0.062 0.062 E<br />
DeSoto 2966 Sorrells Groves, Inc A490 G 0.025 0.04 0.04 E<br />
DeSoto 2988 Jefferson D. Fort and Barbara A. Fort A490 G 0.006 0.011 0.011 E<br />
DeSoto 2996 Sorrells Grove Care Inc A415 G 0.023 0.037 0.037 E<br />
DeSoto 3010 Milton C Moore A415 G 0.024 0.039 0.039 E<br />
DeSoto 3165 Heritage Farms A415 G 0.01 0.032 0.032 E<br />
DeSoto 3166 Magnolia Land Estates LLC A415 G 0.042 0.058 0.058 E<br />
DeSoto 3320 Desoto Land Holdings LLLP A415 G 0.011 0.018 0.018 E<br />
DeSoto 3323 Sorrells Groves Inc. A415 G 0 0.059 0.059 E<br />
DeSoto 3325 Avesta Properties, LLC A415 G 0.014 0.023 0.023 E<br />
DeSoto 3363 Thomas B Lipe A490 G 0.026 0.085 0.085 E<br />
DeSoto 3471 Parker‐Maust Grove Inc A415 G 0.042 0.069 0.069 E<br />
DeSoto 3472 Parker‐Maust Grove Inc A415 G 0.014 0.023 0.023 E<br />
DeSoto 3473 John W Parker Jr A415 G 0.02 0.033 0.033 E<br />
DeSoto 3475 John W Parker Jr A415 G 0.029 0.048 0.048 E<br />
DeSoto 3476 John W Parker Jr A415 G 0.004 0.006 0.006 E<br />
DeSoto 3503 James M O’Leary A490 G 0.021 0.035 0.035 E<br />
DeSoto 3717 Billie Ray & Patricia Barber A415 G 0.019 0.031 0.031 E<br />
DeSoto 4032 4 L'S Ranch, LLC A56F G 0.018 0.029 0.029 E<br />
DeSoto 4436 Nandraj & Sage Oudhraj A415 G 0.021 0.034 0.034 E<br />
DeSoto 4576 Sorrells Groves Inc. A415 G 0.011 0.017 0.017 E<br />
DeSoto 4621 James A Stark A425 G 0.023 0.038 0.038 E<br />
DeSoto 4692 Allyene Brownsberger A415 G 0.023 0.037 0.037 E<br />
DeSoto 4724 Mohan Narayanan A415 G 0.015 0.024 0.024 E<br />
DeSoto 4727 Theron Provau A415 G 0.015 0.025 0.025 E<br />
DeSoto 4747 Charles Harrison A415 G 0.05 0.07 0.07 E<br />
DeSoto 4905 NFC Dairy, LLP L615 G 0.053 0.096 0.096 E<br />
DeSoto 4938 Melanie Coker A415 G 0.012 0.02 0.02 E<br />
M/E 5<br />
Page | 147
<strong>2011</strong> ESTIMATED WATER USE REPORT<br />
Table A7. Metered and <strong>Estimated</strong> Agricultural WUPs, Withdrawals and Permitted <strong>Use</strong> (mgd), <strong>2011</strong><br />
County<br />
WUP<br />
Number<br />
<strong>Southwest</strong> <strong>Florida</strong> <strong>Water</strong> <strong>Management</strong> District<br />
Permittee<br />
<strong>Use</strong><br />
Code 1<br />
Source 2<br />
Annual<br />
Average<br />
Pumpage 3<br />
Total<br />
Permitted<br />
Annual<br />
Average<br />
Quantity<br />
Permitted<br />
Quantity<br />
Attributed<br />
to AG <strong>Use</strong><br />
Category 4<br />
DeSoto 4987 TrUSA Realty, LLC A415 G 0.028 0.046 0.046 E<br />
DeSoto 5166 Sunny South Packing Co A415 G 0.015 0.043 0.041 E<br />
DeSoto 5174 Murl J Coker A415 G 0.031 0.05 0.05 E<br />
DeSoto 5305 Cary Mercer A415 G 0.008 0.026 0.026 E<br />
DeSoto 5913 Desoto Land Holdings, LLLP A415 G 0.028 0.045 0.045 E<br />
DeSoto 5997 Estate Of George Hayden Jr A415 G 0.009 0.015 0.015 E<br />
DeSoto 6061 Scarborough Ranch Inc A415 G 0.049 0.067 0.067 E<br />
DeSoto 6216 Jan Robert & Lenora Brewer A415 G 0.013 0.022 0.022 E<br />
DeSoto 6458 School Board Of Desoto Co A495 G 0.015 0.077 0.034 E<br />
DeSoto 6472 Firoza Properties LLC A415 G 0.015 0.025 0.025 E<br />
DeSoto 6544 Walker Collier Real Estate Holdings Limited A415 G 0.018 0.029 0.029 E<br />
DeSoto 6551 Edna M Coker A415 G 0.017 0.028 0.028 E<br />
DeSoto 6564 Dennis J Fullenkamp A415 G 0.016 0.026 0.026 E<br />
DeSoto 6739 Samuel D Jr & Helen I Kyle Trust A415 G 0.05 0.069 0.069 E<br />
DeSoto 6757 Sorrells Groves Inc. A415 G 0.023 0.037 0.037 E<br />
DeSoto 6901 Maggie Simmons Messana A415 G 0.044 0.06 0.06 E<br />
DeSoto 6908 Boggess Family Partnership A415 G 0.01 0.016 0.016 E<br />
DeSoto 6996 Tom Edward And Dennis Pella A490 G 0.038 0.052 0.052 E<br />
DeSoto 6997 William B Mann Jr A415 G 0.021 0.034 0.034 E<br />
DeSoto 7041 John Edward & Ann Lorine Johnson A490 G 0.019 0.032 0.032 E<br />
DeSoto 7065 Glenn Padgett A415 G 0.011 0.018 0.018 E<br />
7128 William I & Robert D Boggess, Lewis E Williams & A415<br />
0.004 0.006 0.006<br />
DeSoto<br />
James D Brewer<br />
G<br />
E<br />
DeSoto 7201 Intent Prop 1/2 Int & R USA Better Homes Inc 1/2 Int A415 G 0.014 0.023 0.023 E<br />
DeSoto 7298 Cjt Groves A415 G 0.009 0.014 0.014 E<br />
DeSoto 7312 Desoto Land Holdings LLLP A415 G 0.023 0.063 0.063 E<br />
DeSoto 7369 Frank and Valerie Cho Chung Hing A415 G 0.027 0.044 0.044 E<br />
DeSoto 7399 Island Grove, LLC A470 G 0.07 0.097 0.097 E<br />
DeSoto 7452 Alvin And Henrietta Wilhelm A415 G 0.005 0.008 0.008 E<br />
7461 Bailey Branch Inc., Michael & Lavenia Carter and Clara A415<br />
0.018 0.05 0.05<br />
DeSoto<br />
C & Edmon<br />
G<br />
E<br />
M/E 5<br />
Page | 148
<strong>2011</strong> ESTIMATED WATER USE REPORT<br />
Table A7. Metered and <strong>Estimated</strong> Agricultural WUPs, Withdrawals and Permitted <strong>Use</strong> (mgd), <strong>2011</strong><br />
County<br />
WUP<br />
Number<br />
<strong>Southwest</strong> <strong>Florida</strong> <strong>Water</strong> <strong>Management</strong> District<br />
Permittee<br />
<strong>Use</strong><br />
Code 1<br />
Source 2<br />
Annual<br />
Average<br />
Pumpage 3<br />
Total<br />
Permitted<br />
Annual<br />
Average<br />
Quantity<br />
Permitted<br />
Quantity<br />
Attributed<br />
to AG <strong>Use</strong><br />
Category 4<br />
DeSoto 7521 Trey Barnwell A415 G 0.002 0.004 0.004 E<br />
DeSoto 7528 Steve Sorrells and LeDane Soria A415 G 0.041 0.057 0.057 E<br />
DeSoto 7612 John E & Joann M Burtscher A415 G 0.005 0.009 0.009 E<br />
DeSoto 7636 Jerome J Ali Jr & Caroline J Ali A415 G 0.005 0.008 0.008 E<br />
7706 Harold D. Garner II, Michelle G. Montgomery, Austin D. A415<br />
0.022 0.035 0.035<br />
DeSoto<br />
Garner<br />
G<br />
E<br />
DeSoto 7707 RCB DeSoto LLC A415 G 0.014 0.06 0.06 E<br />
DeSoto 7728 Double D Trading Company A415 G 0.007 0.011 0.011 E<br />
7735 Carr Christopher D & <strong>Water</strong>s Angela C & Setnor<br />
A415<br />
0.02 0.032 0.032<br />
G<br />
DeSoto<br />
Suzanne S<br />
E<br />
DeSoto 7792 Hollidale Farms, Inc. A415 G 0.017 0.027 0.027 E<br />
DeSoto 7829 DeSoto Land Partners, LLC A415 G 0.019 0.032 0.032 E<br />
DeSoto 7859 Howard E & Steven D Sorrells A415 G 0.023 0.037 0.037 E<br />
DeSoto 7868 Jerrill Hasty A415 G 0.017 0.028 0.028 E<br />
DeSoto 7876 Bailey Branch Inc A415 G 0.026 0.043 0.043 E<br />
DeSoto 7892 Eugene H Turner III‐Custodian Of Eugene H Turner IV A415 G 0.009 0.015 0.015 E<br />
DeSoto 8059 Martin A Hollingsworth Jr A415 G 0.01 0.016 0.016 E<br />
DeSoto 8062 Kevin & Lynn Shelfer A415 G 0.007 0.012 0.012 E<br />
DeSoto 8082 V C Hollingsworth Sr Estate A415 G 0 0.009 0.009 E<br />
DeSoto 8084 Estate Of V C Hollingsworth Sr A415 G 0.026 0.043 0.043 E<br />
DeSoto 8091 Highway 72, LLC A415 G 0.022 0.037 0.037 E<br />
DeSoto 8145 John E & Ann L Johnson A415 G 0.027 0.045 0.045 E<br />
DeSoto 8148 John E & Ann L Johnson A415 G 0.02 0.032 0.032 E<br />
DeSoto 8153 Estate Of William E McAnly James H McAnly A415 G 0.025 0.041 0.041 E<br />
DeSoto 8164 Four Q‐Capital, LLC A415 G 0.005 0.009 0.009 E<br />
DeSoto 8177 Calvin C Boggess A415 G 0.032 0.052 0.052 E<br />
DeSoto 8178 Calvin Boggess A415 G 0.014 0.024 0.024 E<br />
DeSoto 8181 Robert Brewer A415 G 0.02 0.032 0.032 E<br />
DeSoto 8182 Diane B Nichols A415 G 0.012 0.02 0.02 E<br />
DeSoto 8207 W I Boggess A415 G 0.008 0.012 0.012 E<br />
DeSoto 8216 V C Hollingsworth Sr Estate A415 G 0.02 0.033 0.033 E<br />
M/E 5<br />
Page | 149
<strong>2011</strong> ESTIMATED WATER USE REPORT<br />
Table A7. Metered and <strong>Estimated</strong> Agricultural WUPs, Withdrawals and Permitted <strong>Use</strong> (mgd), <strong>2011</strong><br />
County<br />
WUP<br />
Number<br />
<strong>Southwest</strong> <strong>Florida</strong> <strong>Water</strong> <strong>Management</strong> District<br />
Permittee<br />
<strong>Use</strong><br />
Code 1<br />
Source 2<br />
Annual<br />
Average<br />
Pumpage 3<br />
Total<br />
Permitted<br />
Annual<br />
Average<br />
Quantity<br />
Permitted<br />
Quantity<br />
Attributed<br />
to AG <strong>Use</strong><br />
Category 4<br />
DeSoto 8302 Jeanne S Pascal A415 G 0.011 0.018 0.018 E<br />
DeSoto 8303 Eugene H Turner Trust A415 G 0.025 0.041 0.041 E<br />
DeSoto 8436 RCB DESOTO, LLC A415 G 0.006 0.011 0.011 E<br />
DeSoto 8489 Pat Mercer A415 G 0.024 0.039 0.039 E<br />
DeSoto 8520 Desoto Land Holdings LLLP A415 G 0.047 0.065 0.065 E<br />
DeSoto 8644 Brady & Patricia Pfeil A415 G 0.015 0.024 0.024 E<br />
DeSoto 8669 Bob Brewer A415 G 0.016 0.026 0.026 E<br />
DeSoto 8671 James Brewer A415 G 0.021 0.034 0.034 E<br />
DeSoto 8760 AMR Group Inc A415 G 0.014 0.024 0.024 E<br />
DeSoto 8770 Sorrells Groves Inc. A415 G 0.016 0.026 0.026 E<br />
DeSoto 8774 Sorrells Groves Inc. A415 G 0 0.051 0.051 E<br />
DeSoto 8790 Lakeland Properties LLC A490 G 0.008 0.013 0.013 E<br />
DeSoto 8805 So‐So Groves A415 G 0.016 0.027 0.027 E<br />
DeSoto 8806 H & S Groves A415 G 0.046 0.064 0.064 E<br />
DeSoto 8814 J W Crews A415 G 0.012 0.019 0.019 E<br />
DeSoto 8878 Eugene H Turner Family Partnership Ltd A415 G 0.041 0.067 0.067 E<br />
DeSoto 8909 Orange‐Co, LP A415 G 0.024 0.04 0.04 E<br />
DeSoto 9059 Debra Hollingsworth A415 G 0.005 0.008 0.008 E<br />
DeSoto 9098 J W Crews Jr & Tommy Johnson A415 G 0.005 0.008 0.008 E<br />
DeSoto 9100 Darryl & Cindy Trawick A415 G 0.008 0.013 0.013 E<br />
DeSoto 9145 Mary H Smith Inc A415 G 0.018 0.029 0.029 E<br />
DeSoto 9147 John Maassen III A410 G 0.01 0.017 0.017 E<br />
DeSoto 9163 Tim Barnwell A415 G 0.005 0.009 0.009 E<br />
DeSoto 9310 V C Hollingsworth Jr & III A415 G 0.032 0.052 0.052 E<br />
DeSoto 9314 Sorrells Groves Inc. A415 G 0.018 0.03 0.03 E<br />
DeSoto 9353 Brian Hoopingarner A415 G 0.013 0.021 0.021 E<br />
DeSoto 9441 Desoto 310 Land Trust A415 G 0.021 0.035 0.035 E<br />
DeSoto 9529 Cary & Kaye Mercer A415 G 0 0.01 0.01 E<br />
DeSoto 9565 Desoto Land Holdings LLLP A415 G 0.135 0.246 0.246 E<br />
DeSoto 9588 A C Citrus & Cattle Inc A415 G 0.02 0.033 0.033 E<br />
DeSoto 9600 Eugene H Turner & Son Inc A415 G 0.048 0.067 0.067 E<br />
M/E 5<br />
Page | 150
<strong>2011</strong> ESTIMATED WATER USE REPORT<br />
Table A7. Metered and <strong>Estimated</strong> Agricultural WUPs, Withdrawals and Permitted <strong>Use</strong> (mgd), <strong>2011</strong><br />
County<br />
WUP<br />
Number<br />
<strong>Southwest</strong> <strong>Florida</strong> <strong>Water</strong> <strong>Management</strong> District<br />
Permittee<br />
<strong>Use</strong><br />
Code 1<br />
Source 2<br />
Annual<br />
Average<br />
Pumpage 3<br />
Total<br />
Permitted<br />
Annual<br />
Average<br />
Quantity<br />
Permitted<br />
Quantity<br />
Attributed<br />
to AG <strong>Use</strong><br />
Category 4<br />
DeSoto 9622 Jack Wilcoxen A525 G 0.053 0.073 0.073 E<br />
DeSoto 9628 Orange Co LP A415 G 0.018 0.029 0.029 E<br />
DeSoto 9678 Dees‐Grose Family Partnership Ltd A415 G 0.013 0.022 0.022 E<br />
DeSoto 9707 Walter L & Robert C Brewer A415 G 0.015 0.025 0.025 E<br />
DeSoto 9757 AMR Group Inc A415 G 0.014 0.022 0.022 E<br />
9775 Philip & Shirley Turner, Timothy Heine & Libby<br />
A415<br />
0.011 0.018 0.018<br />
DeSoto<br />
McKettrick<br />
G<br />
E<br />
DeSoto 9779 Sunny South Packing Co A415 G 0.021 0.035 0.035 E<br />
DeSoto 9785 Cary Mercer A415 G 0.007 0.012 0.012 E<br />
DeSoto 9910 Miami Trace, LLC A415 G 0.014 0.022 0.022 E<br />
DeSoto 9933 JDM Partnership A415 G 0.051 0.07 0.07 E<br />
DeSoto 9958 Sorrells Groves Inc. A415 G 0.014 0.023 0.023 E<br />
DeSoto 9962 Kevin P & Catherine Sugrue A415 G 0.008 0.013 0.013 E<br />
DeSoto 10046 V C Hollingsworth Jr A415 G 0.006 0.02 0.02 E<br />
DeSoto 10094 Frank Cho Chung Hing A415 G 0.017 0.029 0.029 E<br />
DeSoto 10180 D A Bennett Company A415 G 0 0.011 0.011 E<br />
DeSoto 10197 Louis H. Kirschner and Veronica W. Kirschner Trust A415 G 0.004 0.006 0.006 E<br />
DeSoto 10216 Sorrells Groves Inc. A415 G 0.023 0.038 0.038 E<br />
DeSoto 10290 Hollidale Farms, Inc. A415 G 0.021 0.035 0.035 E<br />
DeSoto 10301 Susie E Hayden A415 G 0.004 0.007 0.007 E<br />
DeSoto 10302 Susie E Hayden A415 G 0.006 0.009 0.009 E<br />
DeSoto 10304 Cary Mike Charlie P & Louise H Mercer A415 G 0.017 0.028 0.028 E<br />
DeSoto 10305 Harriet K & William P Wise A415 G 0 0.011 0.011 E<br />
DeSoto 10317 John Burtscher A415 G 0.01 0.016 0.016 E<br />
DeSoto 10530 O J Investments A415 G 0 0.016 0.016 E<br />
DeSoto 10537 Sorrells Groves Inc. A415 G 0.012 0.019 0.019 E<br />
DeSoto 10538 Three L Groves A415 G 0.01 0.016 0.016 E<br />
10562 Faye Wood, Et Al; Donald & James Langford; James A415<br />
0.02 0.033 0.033<br />
DeSoto<br />
Langford, Et Al<br />
G<br />
E<br />
DeSoto 10567 Teresa D. Broadus, Trustee A415 G 0.01 0.027 0.027 E<br />
DeSoto 10586 Three L Groves A415 G 0.017 0.028 0.028 E<br />
M/E 5<br />
Page | 151
<strong>2011</strong> ESTIMATED WATER USE REPORT<br />
Table A7. Metered and <strong>Estimated</strong> Agricultural WUPs, Withdrawals and Permitted <strong>Use</strong> (mgd), <strong>2011</strong><br />
County<br />
WUP<br />
Number<br />
<strong>Southwest</strong> <strong>Florida</strong> <strong>Water</strong> <strong>Management</strong> District<br />
Permittee<br />
<strong>Use</strong><br />
Code 1<br />
Source 2<br />
Annual<br />
Average<br />
Pumpage 3<br />
Total<br />
Permitted<br />
Annual<br />
Average<br />
Quantity<br />
Permitted<br />
Quantity<br />
Attributed<br />
to AG <strong>Use</strong><br />
Category 4<br />
DeSoto 10622 William M & Margaret A Mardis A415 G 0.013 0.022 0.022 E<br />
DeSoto 10660 James Brewer A415 G 0 0.031 0.031 E<br />
DeSoto 10661 James Brewer A415 G 0.015 0.042 0.042 E<br />
DeSoto 10662 James D & E Coleman Brewer A415 G 0 0.017 0.017 E<br />
DeSoto 10663 Bob Brewer A415 G 0.033 0.054 0.054 E<br />
DeSoto 10664 James Brewer A415 G 0 0.057 0.057 E<br />
DeSoto 10666 James D & E Coleman Brewer A415 G 0.022 0.037 0.037 E<br />
DeSoto 10702 Eugene H Turner Trust A415 G 0.024 0.039 0.039 E<br />
DeSoto 10734 W Hollis Jr & Linda Albritton A415 G 0.007 0.011 0.011 E<br />
DeSoto 10737 E Coleman Brewer A415 G 0.03 0.05 0.05 E<br />
DeSoto 10782 Billy Ray Barber A415 G 0.013 0.021 0.021 E<br />
DeSoto 10830 James D & Walter L Brewer A415 G 0.014 0.023 0.023 E<br />
DeSoto 10834 Orange‐Co, LP A415 G 0.058 0.106 0.106 E<br />
DeSoto 10845 M & J Partnership A415 G 0.013 0.022 0.022 E<br />
DeSoto 10875 Sunny South Packing Co A415 G 0.01 0.016 0.016 E<br />
DeSoto 10909 Bruce A Pinto A415 G 0.004 0.006 0.006 E<br />
DeSoto 10968 Dennis Carlton A470 G 0.176 0.318 0.318 E<br />
DeSoto 10998 Jerrill Hasty A415 G 0.011 0.017 0.017 E<br />
DeSoto 11016 Suss‐Rueckel, LLC A415 G 0.009 0.016 0.016 E<br />
DeSoto 11017 William Keith & Candis Jahna Davis A415 G 0.017 0.028 0.028 E<br />
DeSoto 11056 E & D Ranch LLP A415 G 0.027 0.045 0.045 E<br />
DeSoto 11110 William Keith & Candis Jahna Davis A415 G 0.019 0.03 0.03 E<br />
DeSoto 11159 Samuel D Kyle Jr A415 G 0.023 0.038 0.038 E<br />
DeSoto 11190 R Tom Chapman Jr A415 G 0 0.087 0.087 E<br />
DeSoto 11197 John W & Sue G Parker Jr A415 G 0.008 0.013 0.013 E<br />
DeSoto 11200 Dees‐Grose Family Partnership Ltd A415 G 0.022 0.036 0.036 E<br />
DeSoto 11201 Sorrells Groves Inc. A415 G 0.039 0.054 0.054 E<br />
DeSoto 11202 Sorrells Groves Inc. A415 G 0.02 0.033 0.033 E<br />
DeSoto 11207 Martin Family Groves LLC A415 G 0.017 0.027 0.027 E<br />
DeSoto 11214 Dees‐Grose Family Partnership Ltd A415 G 0.019 0.032 0.032 E<br />
DeSoto 11249 Triple E Groves Inc A415 G 0.029 0.047 0.047 E<br />
M/E 5<br />
Page | 152
<strong>2011</strong> ESTIMATED WATER USE REPORT<br />
Table A7. Metered and <strong>Estimated</strong> Agricultural WUPs, Withdrawals and Permitted <strong>Use</strong> (mgd), <strong>2011</strong><br />
County<br />
WUP<br />
Number<br />
<strong>Southwest</strong> <strong>Florida</strong> <strong>Water</strong> <strong>Management</strong> District<br />
Permittee<br />
<strong>Use</strong><br />
Code 1<br />
Source 2<br />
Annual<br />
Average<br />
Pumpage 3<br />
Total<br />
Permitted<br />
Annual<br />
Average<br />
Quantity<br />
Permitted<br />
Quantity<br />
Attributed<br />
to AG <strong>Use</strong><br />
Category 4<br />
DeSoto 11288 Matt Harrison L600 G 0.003 0.005 0.005 E<br />
DeSoto 11373 James D & Walter L Brewer A415 G 0.026 0.043 0.043 E<br />
DeSoto 11375 R T & E Doris Callahan L610 G 0.001 0.002 0.002 E<br />
DeSoto 11443 Estate Of Walter L Brewer A415 G 0.008 0.025 0.025 E<br />
DeSoto 11449 J W Crews Jr & Tommy Johnson A415 G 0.011 0.017 0.017 E<br />
DeSoto 11509 William Grant Revocable Trust A415 G 0.013 0.022 0.022 E<br />
DeSoto 11534 Vermon Hollingsworth Ill A415 G 0.003 0.005 0.005 E<br />
DeSoto 11559 Vincent Hall A490 G 0.066 0.091 0.091 E<br />
DeSoto 11567 Becker Trading Company Inc A402 G 0 0.004 0.004 E<br />
DeSoto 11574 Phillip W Turner Jr A415 G 0.013 0.021 0.021 E<br />
DeSoto 11585 E Coleman & James D Brewer A415 G 0.007 0.022 0.022 E<br />
DeSoto 11616 JDM Partnership A415 G 0.011 0.018 0.018 E<br />
DeSoto 11673 J W Crews Jr & Tommy Johnson A415 G 0.005 0.008 0.008 E<br />
DeSoto 11674 Orange‐Co, LP A415 G 0.009 0.014 0.014 E<br />
DeSoto 11689 C S Farrar A495 G 0 0.213 0.213 E<br />
DeSoto 11729 J W Crews Jr & Tommy Johnson A415 G 0.006 0.01 0.01 E<br />
DeSoto 11788 C‐Hack LLC A490 G 0.047 0.077 0.077 E<br />
DeSoto 11809 John E & Joann M Burtscher A415 G 0.018 0.029 0.029 E<br />
DeSoto 11829 Merit Groves Inc A415 G 0.019 0.031 0.031 E<br />
DeSoto 11857 John Burtscher A415 G 0.027 0.044 0.044 E<br />
DeSoto 11924 Driggers & Davis A415 G 0.019 0.032 0.032 E<br />
DeSoto 11929 Citrus Pride A415 G 0 0.03 0.03 E<br />
DeSoto 11947 Renzo & Gina Fantasia A415 G 0.029 0.047 0.047 E<br />
DeSoto 11952 Rhia Sheehan A415 G 0.01 0.017 0.017 E<br />
DeSoto 11980 Arcadia Acreages, Inc. A415 G 0.01 0.017 0.017 E<br />
DeSoto 12001 John E & Joann M Burtscher A415 G 0.01 0.016 0.016 E<br />
12082 Sunny South Packing Co., Pamela Ann Vowels, Timothy A415<br />
0.02 0.033 0.033<br />
DeSoto<br />
Wayne Vowels<br />
G<br />
E<br />
DeSoto 12109 Steven C and Linda L. Calcagino A415 G 0.018 0.029 0.029 E<br />
DeSoto 12116 Cary M & Kaye E Mercer A415 G 0.029 0.048 0.048 E<br />
DeSoto 12118 Edward G. Kessler and Donna S. Kessler A415 G 0.004 0.007 0.007 E<br />
M/E 5<br />
Page | 153
<strong>2011</strong> ESTIMATED WATER USE REPORT<br />
Table A7. Metered and <strong>Estimated</strong> Agricultural WUPs, Withdrawals and Permitted <strong>Use</strong> (mgd), <strong>2011</strong><br />
County<br />
WUP<br />
Number<br />
Permittee<br />
<strong>Use</strong><br />
Code 1<br />
Source 2<br />
Annual<br />
Average<br />
Pumpage 3<br />
Total<br />
Permitted<br />
Annual<br />
Average<br />
Quantity<br />
Permitted<br />
Quantity<br />
Attributed<br />
to AG <strong>Use</strong><br />
Category 4<br />
DeSoto 12141 Orange‐Co, LP A415 G 0.016 0.026 0.026 E<br />
DeSoto 12176 Hilda Barajas A410 G 0.01 0.017 0.017 E<br />
DeSoto 12247 Bermont Properties LLC A415 G 0.004 0.007 0.007 E<br />
DeSoto 12328 Dees‐Grose Family Partnership Ltd A415 G 0.014 0.023 0.023 E<br />
DeSoto 12348 Christopher C Stevenson L600 G 0.001 0.002 0.002 E<br />
DeSoto 12370 Desoto Land Holdings LLLP A415 G 0.029 0.047 0.047 E<br />
DeSoto 12391 Desoto Land Holdings LLLP A415 G 0.037 0.051 0.051 E<br />
DeSoto 12438 Albritton Grove A415 G 0.036 0.054 0.054 E<br />
DeSoto 12494 Orange‐Co, LP A415 G 0.004 0.007 0.007 E<br />
DeSoto 12533 Jason C & Holly J Clark A415 G 0.041 0.056 0.056 E<br />
DeSoto 12535 Sorrells Groves Inc. A470 G 0.066 0.091 0.091 E<br />
DeSoto 12537 Thomas H & Sheila R Fifield A415 G 0.016 0.027 0.027 E<br />
DeSoto 12539 Lucinda B Kuehnel A415 G 0.024 0.039 0.039 E<br />
DeSoto 12546 Leon E And Leon J Levasseur A415 G 0.003 0.005 0.005 E<br />
DeSoto 12558 Harlan & Dorathea McCall A415 G 0.012 0.019 0.019 E<br />
DeSoto 12568 Renzo & Gina Fantasia A415 G 0.02 0.033 0.033 E<br />
DeSoto 12575 F H Hanson Inc A415 G 0.01 0.017 0.017 E<br />
DeSoto 12580 Quitmon & Adella B Brown A490 G 0.019 0.031 0.031 E<br />
DeSoto 12596 Hollidale Farms, Inc. A415 G 0.011 0.018 0.018 E<br />
DeSoto 12601 Alfred L & Dollie M Russ A415 G 0.014 0.022 0.022 E<br />
DeSoto 12747 John S III & Emily S Maassen A410 G 0.009 0.015 0.015 E<br />
DeSoto 12817 Sorrells Groves Inc. A415 G 0.032 0.053 0.053 E<br />
DeSoto 12875 JRC Groves Inc A415 G 0.018 0.029 0.029 E<br />
DeSoto 12950 Frank Cho Chung Hing A455 G 0.066 0.091 0.091 E<br />
DeSoto 12997 Anthony R & Summer M Yacovetti A480 G 0.042 0.059 0.059 E<br />
DeSoto 13039 Jdm Partnership A415 G 0.01 0.017 0.017 E<br />
DeSoto 13370 Jack Paul Properties Inc A415 G 0.042 0.548 0.548 E<br />
DeSoto 13370 Jack Paul Properties Inc A415 S 0 0.548 0.548 E<br />
DeSoto 20017 Gary & Mary Jo Hickman A415 G 0 0.045 0.045 E<br />
DeSoto 20070 Bradford Burtscher A415 G 0 0.026 0.026 E<br />
M/E 5<br />
<strong>Southwest</strong> <strong>Florida</strong> <strong>Water</strong> <strong>Management</strong> District<br />
Page | 154
<strong>2011</strong> ESTIMATED WATER USE REPORT<br />
Table A7. Metered and <strong>Estimated</strong> Agricultural WUPs, Withdrawals and Permitted <strong>Use</strong> (mgd), <strong>2011</strong><br />
County<br />
WUP<br />
Number<br />
Permittee<br />
<strong>Use</strong><br />
Code 1<br />
Source 2<br />
Annual<br />
Average<br />
Pumpage 3<br />
Total<br />
Permitted<br />
Annual<br />
Average<br />
Quantity<br />
Permitted<br />
Quantity<br />
Attributed<br />
to AG <strong>Use</strong><br />
Category 4<br />
20103 WM & L Marsh, W & H Gossett, G & K Straney and EC A415<br />
0.008 0.013 0.013<br />
DeSoto<br />
Burkhead<br />
G<br />
E<br />
DeSoto <strong>2011</strong>4 Bailey Branch Inc A415 G 0.017 0.028 0.028 E<br />
DeSoto <strong>2011</strong>9 Candido Alonso A535 G 0.029 0.047 0.047 E<br />
61.136 Metered, mgd<br />
DeSoto County Totals<br />
6.361 <strong>Estimated</strong> , mgd<br />
67.497 Total, mgd<br />
Hardee 51 Floyd Smith Groves, Inc. A415 G 0.000 0.066 0.066 M<br />
Hardee 56 Maddox Groves Limited A415 G 0.073 0.105 0.105 M<br />
Hardee 131 Ballantyne Groves Inc A415 G 0.038 0.087 0.087 M<br />
Hardee 455 J A Clark III & Linda G Clark A415 G 0.046 0.066 0.066 M<br />
Hardee 456 Barlow Family Partnership A415 G 0.051 0.115 0.115 M<br />
Hardee 480 Dale Johnson Johnson A415 G 0.038 0.124 0.124 M<br />
Donald E & SUSAn C Smith& Stephen M & Jennifer S<br />
G<br />
Hardee 527 Palmer<br />
A415<br />
0.132 0.259 0.259<br />
M<br />
Adrian R Chapman Trst Of The A R Chapman Palm Bch<br />
G<br />
Hardee 558 Gr & Gloria J<br />
A415<br />
0.074 0.102 0.102<br />
M<br />
Hardee 560 Dorothy Campbell et al Trustee A415 G 0.053 0.101 0.101 M<br />
Hardee 614 Schwartz Hardee Properties, LLC A415 G 0.026 0.143 0.143 M<br />
Hardee 690 Gerald J Mclean Trust A415 G 0.053 0.119 0.119 M<br />
Hardee 775 SLB & B of Wauchula LLC A415 G 0.050 0.089 0.089 M<br />
Hardee 784 Mosaic Fertilizer LLC A415 G 0.286 0.404 0.404 M<br />
Hardee 785 Mosaic Fertilizer LLC A415 G 0.769 1.255 1.255 M<br />
Hardee 834 E Milton Lanier A415 G 0.087 0.117 0.117 M<br />
Hardee 1088 John L Beck, Andrew D Beck, Jose A415 G 0.083 0.132 0.132 M<br />
Hardee 1089 Double Six Inc A490 G 0.000 0.281 0.281 M<br />
Hardee 1102 Peace River Investments A415 G 0.037 0.119 0.119 M<br />
Hardee 1103 Burton‐Bostick Groves, Inc. A415 G 0.089 0.144 0.144 M<br />
Hardee 1148 Paul Mislevy Living Trust A415 G 0.040 0.134 0.134 M<br />
Hardee 1242 Barben Group A415 G 0.289 0.263 0.263 M<br />
M/E 5<br />
<strong>Southwest</strong> <strong>Florida</strong> <strong>Water</strong> <strong>Management</strong> District<br />
Page | 155
<strong>2011</strong> ESTIMATED WATER USE REPORT<br />
Table A7. Metered and <strong>Estimated</strong> Agricultural WUPs, Withdrawals and Permitted <strong>Use</strong> (mgd), <strong>2011</strong><br />
County<br />
WUP<br />
Number<br />
<strong>Southwest</strong> <strong>Florida</strong> <strong>Water</strong> <strong>Management</strong> District<br />
Permittee<br />
<strong>Use</strong><br />
Code 1<br />
Source 2<br />
Annual<br />
Average<br />
Pumpage 3<br />
Total<br />
Permitted<br />
Annual<br />
Average<br />
Quantity<br />
Permitted<br />
Quantity<br />
Attributed<br />
to AG <strong>Use</strong><br />
Category 4<br />
Hardee 1245 Ronald F & Sharon D Moye A415 G 0.000 0.129 0.129 M<br />
Hardee 1257 Carlton & Carlton Ranches A56S G 0.000 0.303 0.303 M<br />
Hardee 1259 Leffie M Carlton III & Charles D Carlton A415 G 0.248 0.171 0.171 M<br />
Hardee 1283 J W Crews A415 G 0.040 0.103 0.103 M<br />
Hardee 1339 Sharon LC A415 G 0.000 0.086 0.086 M<br />
Hardee 1454 Crewsville Groves LLC A415 G 0.166 0.955 0.955 M<br />
Hardee 1472 Margaret S Henderson A415 G 0.042 0.096 0.096 M<br />
Hardee 1655 T & C Investments Inc A415 G 0.119 0.269 0.269 M<br />
Hardee 1672 Adrian R Chapman A415 G 0.163 0.175 0.171 M<br />
Hardee 1709 Sunny South Packing Co A415 G 0.040 0.079 0.079 M<br />
Hardee 1809 Putnam Groves Inc A470 G 0.000 2.034 2.034 M<br />
Hardee 1875 Mosaic Fertilizer LLC A415 G 0.096 0.065 0.065 M<br />
Hardee 1906 Dopler Groves Inc A415 G 0.190 0.190 0.190 M<br />
Hardee 1912 V & W Farms Inc Of Delray Beach L615 G 0.132 1.236 1.234 M<br />
Hardee 1912 V & W Farms Inc Of Delray Beach L615 S 0.000 1.236 1.234 M<br />
Hardee 2158 Carlton Melear and Son Dairy, Inc. L615 G 0.238 0.468 0.468 M<br />
Hardee 2164 Carlton Melear and Son Dairy, Inc. A415 G 0.277 0.371 0.371 M<br />
Hardee 2270 Prescott Brothers A415 G 0.081 0.158 0.158 M<br />
Hardee 2358 Adams & Skipper A415 G 0.082 0.120 0.120 M<br />
Hardee 2382 D H Ranch Inc A490 G 0.006 0.149 0.149 M<br />
Hardee 2467 Ben Hill Griffin, Inc. A455 G 0.427 1.271 1.271 M<br />
Hardee 2584 John L Matz & Adrian R Chapman A415 G 0.059 0.073 0.073 M<br />
Hardee 2614 Vernon Clyde Hollingsworth Jr & Betty Jo Hollingsworth A415 G 0.202 0.166 0.166 M<br />
Hardee 2626 Latt Maxcy Corp. A415 G 0.227 0.324 0.324 M<br />
Hardee 2647 Martin Roberts Trust A490 G 0.045 0.214 0.214 M<br />
Hardee 2648 Willard K & Gloria R Durrance A455 G 0.132 0.437 0.437 M<br />
Mosaic Fertilizer LLC and South Fort Meade<br />
G<br />
Hardee 2715 Partnership LP<br />
A525<br />
1.389 5.097 4.622<br />
M<br />
Mosaic Fertilizer LLC and South Fort Meade<br />
S<br />
Hardee 2715 Partnership LP<br />
A525<br />
0.309 5.097 4.622<br />
M<br />
Hardee 2774 Story Groves Inc A415 G 0.080 0.099 0.099 M<br />
M/E 5<br />
Page | 156
<strong>2011</strong> ESTIMATED WATER USE REPORT<br />
Table A7. Metered and <strong>Estimated</strong> Agricultural WUPs, Withdrawals and Permitted <strong>Use</strong> (mgd), <strong>2011</strong><br />
County<br />
WUP<br />
Number<br />
<strong>Southwest</strong> <strong>Florida</strong> <strong>Water</strong> <strong>Management</strong> District<br />
Permittee<br />
<strong>Use</strong><br />
Code 1<br />
Source 2<br />
Annual<br />
Average<br />
Pumpage 3<br />
Total<br />
Permitted<br />
Annual<br />
Average<br />
Quantity<br />
Permitted<br />
Quantity<br />
Attributed<br />
to AG <strong>Use</strong><br />
Category 4<br />
Hardee 2870 Holly Hill Fruit Products Co Inc A415 G 0.033 0.123 0.123 M<br />
Hardee 2871 Holly Hill Fruit Products Co Inc & James M Shearer A415 G 0.028 0.099 0.099 M<br />
Hardee 2875 Holly Hill Fruit Products Co Inc A415 G 0.116 0.680 0.680 M<br />
Hardee 2876 Holly Hill Fruit Products Co Inc A415 G 0.028 0.126 0.126 M<br />
Hardee 2879 Holly Hill Fruit Products Co Inc A415 G 0.020 0.078 0.078 M<br />
Hardee 2880 Holly Hill Fruit Products Co Inc A415 G 0.038 0.114 0.114 M<br />
Hardee 2927 Carl M & Betty A Wilburn Co‐Tst Lvg Trst A415 G 0.118 0.347 0.347 M<br />
Hardee 2930 McCarlton Partners Ltd A415 G 0.111 0.171 0.171 M<br />
Hardee 2932 McCarlton Partners Ltd A470 G 0.000 0.423 0.423 M<br />
Hardee 3065 Steve Smith A470 G 0.001 0.370 0.370 M<br />
Hardee 3076 The Mosaic Co A415 G 0.103 0.224 0.224 M<br />
Hardee 3096 FLM Inc A415 G 0.118 0.200 0.200 M<br />
Hardee 3119 Sweetwater Citrus Inc A415 G 0.060 0.125 0.125 M<br />
Hardee 3134 Crews Groves Inc A415 G 0.305 0.244 0.244 M<br />
Hardee 3135 Crews Groves Inc A415 G 0.390 0.441 0.441 M<br />
Hardee 3154 Durrance Groves Limited Partnership A415 G 0.054 0.104 0.104 M<br />
Hardee 3207 Crews Groves Inc A415 G 0.070 0.088 0.088 M<br />
Hardee 3235 Steve Smith A415 G 0.050 0.123 0.123 M<br />
Hardee 3258 South Fort Meade Partnership & Parker Farms Inc A470 G 0.000 1.171 1.171 M<br />
Hardee 3292 Joe L Davis Sr & J W Crews Jr A415 G 0.100 0.117 0.117 M<br />
Hardee 3321 Mosaic Fertilizer LLC A415 G 0.127 0.173 0.173 M<br />
Hardee 3341 George N Beck & Glenn Elliott Beck A415 G 0.213 0.128 0.128 M<br />
Hardee 3478 Jed Groves Inc A415 G 0.031 0.077 0.077 M<br />
Hardee 3508 Mosaic Fertilizer LLC & Graham Farms Melons Sales Inc A470 G 0.000 0.277 0.277 M<br />
Hardee 3592 David S Daniels A490 G 0.101 0.335 0.335 M<br />
Hardee 3599 Glenn Rucks A495 G 0.066 0.432 0.432 M<br />
Hardee 3626 South Property Holdings LLC A415 G 0.289 0.221 0.221 M<br />
Hardee 3669 CF Industries Inc A415 G 0.000 6.392 0.002 M<br />
Hardee 3695 3‐C Ranch Ltd A56S G 0.171 0.594 0.594 M<br />
Hardee 3697 R. Ward A490 G 0.000 0.124 0.124 M<br />
Hardee 3940 Shorewood Corporation A490 G 0.000 0.425 0.425 M<br />
M/E 5<br />
Page | 157
<strong>2011</strong> ESTIMATED WATER USE REPORT<br />
Table A7. Metered and <strong>Estimated</strong> Agricultural WUPs, Withdrawals and Permitted <strong>Use</strong> (mgd), <strong>2011</strong><br />
County<br />
WUP<br />
Number<br />
<strong>Southwest</strong> <strong>Florida</strong> <strong>Water</strong> <strong>Management</strong> District<br />
Permittee<br />
<strong>Use</strong><br />
Code 1<br />
Source 2<br />
Annual<br />
Average<br />
Pumpage 3<br />
Total<br />
Permitted<br />
Annual<br />
Average<br />
Quantity<br />
Permitted<br />
Quantity<br />
Attributed<br />
to AG <strong>Use</strong><br />
Category 4<br />
Hardee 4041 Ninfa Davis A415 G 0.009 0.142 0.142 M<br />
Hardee 4091 Bentley‐Brahman Ranch Inc A525 G 1.288 2.518 2.518 M<br />
Hardee 4091 Bentley‐Brahman Ranch Inc A525 S 0.091 2.518 2.518 M<br />
Hardee 4197 Krause Groves LLC A415 G 0.085 0.114 0.114 M<br />
Hardee 4229 Peace Valley Groves Inc A415 G 0.113 0.145 0.145 M<br />
Hardee 4487 Ben Hill Griffin, Inc. A415 G 0.213 0.302 0.302 M<br />
Hardee 4525 Sunshine Foliage World, Inc A480 G 0.299 0.256 0.256 M<br />
Hardee 4554 FLM, Inc. A415 G 0.147 0.131 0.131 M<br />
Rolfe G Thompson Indiv & Trstee Thompson Family<br />
G<br />
Hardee 4660 Trust<br />
A56S<br />
0.015 0.391 0.391<br />
M<br />
Hardee 4719 Lamb Groves Inc A415 G 0.086 0.142 0.142 M<br />
Hardee 4769 Joe & Johnna Mae Himrod A415 G 0.106 0.201 0.201 M<br />
Hardee 4817 Peaceful Horse LLC A470 G 0.000 0.590 0.590 M<br />
Hardee 4972 Wiley T & Nancy J McCall A415 G 0.000 0.070 0.070 M<br />
Hardee 4994 Maggie Simmons Messana A525 G 0.204 0.192 0.192 M<br />
Hardee 5024 Double M Ranch A415 G 0.014 0.117 0.117 M<br />
Hardee 5048 FLM, Inc. A415 G 0.159 0.131 0.131 M<br />
Hardee 5264 Mosaic Fertilizer LLC A415 G 0.199 0.183 0.183 M<br />
Hardee 5274 Sandy Groves LLC A415 G 0.074 0.090 0.090 M<br />
Hardee 5912 Ninfa Davis A415 G 0.043 0.108 0.108 M<br />
Hardee 5942 Roland L & Carolyn Skipper A415 G 0.219 0.408 0.408 M<br />
Hardee 6093 Brent & Betsy Monk A415 G 0.075 0.069 0.069 M<br />
Hardee 6368 Donnis A & Kathleen A Barber A480 G 0.238 0.185 0.185 M<br />
Hardee 6393 Heart of <strong>Florida</strong> Greenhouses Inc A480 G 0.058 0.171 0.171 M<br />
Hardee 6550 Zolfo Springs Grove, LLC A415 G 0.092 0.114 0.114 M<br />
Hardee 6579 John Henderson A415 G 0.020 0.077 0.077 M<br />
Hardee 6925 Farr Groves LLC A415 G 0.078 0.096 0.096 M<br />
Hardee 7025 Ridge Resources Inc A56S G 0.000 1.301 1.301 M<br />
Hardee 7040 Holly Hill Fruit Products Co Inc A415 G 0.014 0.076 0.076 M<br />
Hardee 7332 CF Industries A415 G 0.037 0.123 0.123 M<br />
Hardee 7341 Cornerstone Grove LLC A415 G 0.123 0.163 0.163 M<br />
M/E 5<br />
Page | 158
<strong>2011</strong> ESTIMATED WATER USE REPORT<br />
Table A7. Metered and <strong>Estimated</strong> Agricultural WUPs, Withdrawals and Permitted <strong>Use</strong> (mgd), <strong>2011</strong><br />
County<br />
WUP<br />
Number<br />
<strong>Southwest</strong> <strong>Florida</strong> <strong>Water</strong> <strong>Management</strong> District<br />
Permittee<br />
<strong>Use</strong><br />
Code 1<br />
Source 2<br />
Annual<br />
Average<br />
Pumpage 3<br />
Total<br />
Permitted<br />
Annual<br />
Average<br />
Quantity<br />
Permitted<br />
Quantity<br />
Attributed<br />
to AG <strong>Use</strong><br />
Category 4<br />
Hardee 7376 Sorrells Groves Inc. A415 G 0.124 0.135 0.135 M<br />
Hardee 7408 Southern Sisters Family LP A415 G 0.103 0.108 0.108 M<br />
Hardee 7447 Robert C & Robin E Abbott A415 G 0.064 0.081 0.081 M<br />
Hardee 7483 Carlton Melear and Son Dairy, Inc. L615 G 0.061 0.375 0.375 M<br />
Hardee 7505 Kahn Citrus <strong>Management</strong> LLC A415 G 0.207 0.133 0.133 M<br />
Hardee 7522 Putnam Groves Inc A490 G 0.000 0.410 0.410 M<br />
Hardee 7743 Wauchula Farms LLC A480 G 0.127 0.168 0.168 M<br />
Hardee 7759 Edgar L Davis Jr. A415 G 0.067 0.074 0.074 M<br />
Hardee 7785 William <strong>Water</strong> A415 G 0.000 0.075 0.075 M<br />
Hardee 7863 3 N Groves LLP A415 G 0.030 0.076 0.076 M<br />
Hardee 7954 Mosaic Fertilizer LLC A415 G 0.043 0.066 0.066 M<br />
Hardee 8007 Peter Goldstein A415 G 0.026 0.075 0.075 M<br />
Hardee 8017 Norris Groves Inc A415 G 0.063 0.068 0.068 M<br />
Hardee 8057 Charles Bass A535 G 0.090 0.459 0.459 M<br />
Hardee 8057 Charles Bass A535 S 0.000 0.459 0.459 M<br />
Hardee 8234 Royce & Martha Tyson A415 G 0.074 0.105 0.105 M<br />
Hardee 8372 SUSAn C Smith Hardee LLC A415 G 0.066 0.104 0.104 M<br />
Hardee 8695 Peter Goldstein A415 G 0.156 0.125 0.125 M<br />
Hardee 8696 LallyMix LLP A410 G 0.168 0.166 0.166 M<br />
Hardee 8734 Mosaic Fertilizer LLC A525 G 0.000 0.383 0.383 M<br />
Hardee 8839 Miles & Doris Schweighofer A415 G 0.066 0.100 0.100 M<br />
Hardee 8845 C Elton Crews Family LP LLL P A415 G 0.123 0.134 0.134 M<br />
Hardee 8895 V C Hollingsworth Jr & Estate Of V C Hollingwworth Sr A415 G 0.301 0.574 0.574 M<br />
Hardee 8907 Joe L Davis Groves Inc A415 G 0.214 0.169 0.169 M<br />
Hardee 8917 V.C. Hollingsworth Sr. Estate A415 G 0.089 0.243 0.243 M<br />
Hardee 8963 Eleanor Henderson A415 G 0.320 0.228 0.228 M<br />
Hardee 8964 David M & Jane C Durando A470 G 0.000 0.367 0.367 M<br />
Hardee 8974 Mosaic Fertilizer A415 G 0.156 0.195 0.195 M<br />
Hardee 8975 Harold Prewitt Cbiz Dba Prewitt Groves A415 G 0.186 0.224 0.224 M<br />
Hardee 9027 Davis Enterprises Inc A415 G 0.221 0.251 0.251 M<br />
Hardee 9038 William Harrison A490 G 0.073 0.163 0.163 M<br />
M/E 5<br />
Page | 159
<strong>2011</strong> ESTIMATED WATER USE REPORT<br />
Table A7. Metered and <strong>Estimated</strong> Agricultural WUPs, Withdrawals and Permitted <strong>Use</strong> (mgd), <strong>2011</strong><br />
County<br />
WUP<br />
Number<br />
<strong>Southwest</strong> <strong>Florida</strong> <strong>Water</strong> <strong>Management</strong> District<br />
Permittee<br />
<strong>Use</strong><br />
Code 1<br />
Source 2<br />
Annual<br />
Average<br />
Pumpage 3<br />
Total<br />
Permitted<br />
Annual<br />
Average<br />
Quantity<br />
Permitted<br />
Quantity<br />
Attributed<br />
to AG <strong>Use</strong><br />
Category 4<br />
Hardee 9171 Stevens Land & Citrus LLC A415 G 0.126 0.246 0.246 M<br />
James H Prine Trustee of Prine Trust James & Carroll<br />
G<br />
Hardee 9208 Parker<br />
A415<br />
0.155 0.057 0.057<br />
M<br />
Hardee 9352 3 N Groves LLP A415 G 0.274 0.305 0.305 M<br />
Hardee 9390 Windmill Farms Nurseries Inc A480 G 0.119 0.187 0.187 M<br />
Hardee 9460 Ken Stuart A415 G 0.161 0.187 0.187 M<br />
Hardee 9486 CF Industries Inc A415 G 0.305 0.539 0.539 M<br />
Hardee 9550 Hardee Correctional Institution A58S G 0.013 0.301 0.016 M<br />
Hardee 9673 Debra‐Thomas S‐Thomas C & Kara Watkins A415 G 0.467 0.725 0.725 M<br />
Hardee 9683 Thelma C Raley Inc A415 G 0.241 0.295 0.295 M<br />
Hardee 9689 T & T Environmental LLC A415 G 0.219 0.138 0.138 M<br />
Hardee 9691 Crewsville Sweetwater Limited I A415 G 0.149 0.128 0.128 M<br />
Hardee 9901 Smoak Groves Inc A415 G 0.458 0.497 0.497 M<br />
Hardee 9901 Smoak Groves Inc A415 S 0.013 0.497 0.497 M<br />
Hardee 10009 E L Davis Jr A495 G 0.066 0.223 0.223 M<br />
Hardee 10052 Limestone Ranch LLC A470 G 0.000 0.181 0.181 M<br />
Hardee 10309 F L Revell Jr A480 G 0.000 0.162 0.162 M<br />
Hardee 10324 The Carlton Group LLC A415 G 0.008 0.064 0.064 M<br />
Hardee 10671 Mosaic Fertilizer LLC A415 G 0.507 1.208 1.208 M<br />
Hardee 10771 Carl Wilburn A415 G 0.056 0.140 0.140 M<br />
Hardee 10934 Hrs Real Estate Trust A470 G 0.000 0.266 0.266 M<br />
Hardee 11032 Donnis A & Kathleen A Barber A495 G 0.000 0.077 0.077 M<br />
Hardee 11147 W Kelly Jr Elizabeth & W Kelly Durrance A470 G 0.000 0.208 0.208 M<br />
Hardee 11151 Peter Stevens A490 G 0.000 0.099 0.099 M<br />
Hardee 11182 R M D Properties LLC A535 G 0.194 0.301 0.301 M<br />
Hardee 11189 Harvill Groves Ltd A415 G 0.126 0.319 0.319 M<br />
Hardee 11240 Joe L Davis Sr A490 G 0.091 0.325 0.325 M<br />
Hardee 11244 Dixie Belle Groves Partnership A415 G 0.090 0.090 0.090 M<br />
Hardee 11395 Mosaic Fertilizer LLC A470 G 0.162 0.238 0.238 M<br />
Hardee 11412 Mosaic Fertilizer LLC & Graham Farms Melons Sales Inc A470 G 0.000 0.277 0.277 M<br />
Hardee 11639 Buckhorn Nursery Ltd A480 G 0.313 0.277 0.277 M<br />
M/E 5<br />
Page | 160
<strong>2011</strong> ESTIMATED WATER USE REPORT<br />
Table A7. Metered and <strong>Estimated</strong> Agricultural WUPs, Withdrawals and Permitted <strong>Use</strong> (mgd), <strong>2011</strong><br />
County<br />
WUP<br />
Number<br />
<strong>Southwest</strong> <strong>Florida</strong> <strong>Water</strong> <strong>Management</strong> District<br />
Permittee<br />
<strong>Use</strong><br />
Code 1<br />
Source 2<br />
Annual<br />
Average<br />
Pumpage 3<br />
Total<br />
Permitted<br />
Annual<br />
Average<br />
Quantity<br />
Permitted<br />
Quantity<br />
Attributed<br />
to AG <strong>Use</strong><br />
Category 4<br />
Hardee 11639 Buckhorn Nursery Ltd A480 S 0.000 0.277 0.277 M<br />
Hardee 11714 Ninfa C Davis A415 G 0.123 0.182 0.182 M<br />
Hardee 11840 Glen Elliot Beck A415 G 0.164 0.104 0.104 M<br />
Hardee 11993 Roberto,Salvador, Aniceto Estrada A56S G 0.001 0.290 0.290 M<br />
Hardee 12199 Ida Mae Kipp / Triangle K Ranch, Inc. A410 G 0.011 0.131 0.131 M<br />
Hardee 12331 Classic Caladiums Inc & Smoak Groves Inc A486 G 0.361 0.860 0.774 M<br />
Hardee 12509 Steve & Monica Reas A470 G 0.000 0.224 0.224 M<br />
Hardee 12643 James Bickett A416 G 0.135 0.414 0.414 M<br />
Hardee 12757 New Port Groves Partnership A415 G 0.144 0.131 0.131 M<br />
Hardee 12881 Stephanie S Davidson And Stephen A Herring A535 G 0.000 0.490 0.490 M<br />
Hardee 13145 Blue Fields USA LLC A410 G 0.080 0.112 0.112 M<br />
Hardee 13184 Mosaic Fertilizer LLC A470 G 0.000 0.295 0.295 M<br />
Hardee 13188 Germantown Citrus Partnership A415 G 0.418 0.129 0.129 M<br />
Hardee 13248 Groves of Peace River Inc A415 G 0.269 0.360 0.360 M<br />
Hardee 20194 Southern Sisters Family Ltd. Partnership A415 G 0.104 0.040 0.040 M<br />
Hardee 8 Heairs of Robert E & Dorothy C Campbell A415 G 0.029 0.048 0.048 E<br />
Hardee 10 University Of Fl Agri Research A520 G 0.06 0.088 0.088 E<br />
Hardee 11 Ren Groves A415 G 0.029 0.047 0.047 E<br />
Hardee 12 Roe Groves, Inc. A415 G 0.038 0.053 0.053 E<br />
Hardee 17 Kenneth De Vane Groves Inc A415 G 0.028 0.046 0.046 E<br />
24 Gary W. and J. Timothy Blackman and Dan Dorrell CPA A415<br />
0.045 0.062 0.062<br />
Hardee<br />
as Trustees<br />
G<br />
E<br />
Hardee 44 Sweet Peach Farms Inc A415 G 0.039 0.055 0.055 E<br />
Hardee 46 Steve Reas A470 G 0.062 0.086 0.086 E<br />
Hardee 52 Floyd Smith Groves, Inc. A415 G 0.044 0.061 0.061 E<br />
Hardee 57 Maddox Groves Limited A415 G 0.008 0.013 0.013 E<br />
Hardee 64 Jack L Smith A415 G 0.04 0.055 0.055 E<br />
Hardee 82 Leighton D Mildred L & H Eric Bennett A490 G 0.014 0.023 0.023 E<br />
Hardee 116 Leonard Perry Taylor Jr A415 G 0.05 0.069 0.069 E<br />
Hardee 122 Ballantyne Groves Inc A415 G 0.051 0.071 0.071 E<br />
Hardee 123 Tweedes LLC A415 G 0.009 0.015 0.015 E<br />
M/E 5<br />
Page | 161
<strong>2011</strong> ESTIMATED WATER USE REPORT<br />
Table A7. Metered and <strong>Estimated</strong> Agricultural WUPs, Withdrawals and Permitted <strong>Use</strong> (mgd), <strong>2011</strong><br />
County<br />
WUP<br />
Number<br />
<strong>Southwest</strong> <strong>Florida</strong> <strong>Water</strong> <strong>Management</strong> District<br />
Permittee<br />
<strong>Use</strong><br />
Code 1<br />
Source 2<br />
Annual<br />
Average<br />
Pumpage 3<br />
Total<br />
Permitted<br />
Annual<br />
Average<br />
Quantity<br />
Permitted<br />
Quantity<br />
Attributed<br />
to AG <strong>Use</strong><br />
Category 4<br />
Hardee 124 Janelle L Knight A415 G 0.006 0.01 0.01 E<br />
Hardee 125 Mulcay & Pyle A415 G 0.019 0.031 0.031 E<br />
Hardee 126 K Jams Properties LLC A415 G 0.028 0.046 0.046 E<br />
Hardee 127 Tweedes LLC A415 G 0.045 0.062 0.062 E<br />
Hardee 128 Ballantyne Groves Inc A415 G 0.019 0.031 0.031 E<br />
Hardee 129 Mulcay & Pyle A415 G 0.028 0.046 0.046 E<br />
Hardee 130 Tweedes LLC A415 G 0.022 0.036 0.036 E<br />
Hardee 145 COCC Inc A415 G 0.008 0.014 0.014 E<br />
Hardee 149 Edward & Irma Parker A415 G 0.022 0.036 0.036 E<br />
Hardee 150 Triple H Groves Corp A415 G 0.024 0.039 0.039 E<br />
Hardee 151 Ten‐Fold Talents Llc Robert A Krause A415 G 0.019 0.031 0.031 E<br />
Hardee 171 Daniel H & Linda M Smith A415 G 0.044 0.063 0.063 E<br />
Hardee 197 BHRGU Avon Prop LLC A415 G 0.016 0.027 0.027 E<br />
Hardee 198 CLA DOR Enterprises Inc A415 G 0.038 0.053 0.053 E<br />
Hardee 205 Joe Skitka A415 G 0.024 0.04 0.04 E<br />
Hardee 365 Douglas H Foster A415 G 0.006 0.009 0.009 E<br />
Hardee 385 Agri‐Citrus LLC A415 G 0.009 0.015 0.015 E<br />
Hardee 403 Kenneth Baker And Alicia Baker A415 G 0.005 0.008 0.008 E<br />
Hardee 461 John W & Roberta H Beattie A415 G 0.017 0.028 0.028 E<br />
Hardee 539 Wilmer White A415 G 0.017 0.028 0.028 E<br />
Hardee 547 Kenneth A & June A Abbott A415 G 0.01 0.017 0.017 E<br />
Hardee 561 Stephen M & Jennifer S Palmer A415 G 0.015 0.024 0.024 E<br />
Hardee 570 T C Underwood A415 G 0.026 0.043 0.043 E<br />
Hardee 592 Carl E Weis A415 G 0.025 0.04 0.04 E<br />
Hardee 603 Petteway Growers A415 G 0.051 0.071 0.071 E<br />
Hardee 604 Roy L Petteway A415 G 0.01 0.017 0.017 E<br />
Hardee 651 Danny Arnold & Jewel M Skitka A415 G 0.009 0.015 0.015 E<br />
Hardee 652 Peter Goldstein A415 G 0.01 0.016 0.016 E<br />
Hardee 682 Ten‐Fold Talents Llc Robert A Krause A415 G 0.04 0.056 0.056 E<br />
Hardee 695 Mark & Nancy Lambert A415 G 0.019 0.031 0.031 E<br />
Hardee 712 R A Cracker Partnership Ltd & Stallings Shirley Bess A415 G 0.003 0.007 0.007 E<br />
M/E 5<br />
Page | 162
<strong>2011</strong> ESTIMATED WATER USE REPORT<br />
Table A7. Metered and <strong>Estimated</strong> Agricultural WUPs, Withdrawals and Permitted <strong>Use</strong> (mgd), <strong>2011</strong><br />
County<br />
WUP<br />
Number<br />
Permittee<br />
<strong>Use</strong><br />
Code 1<br />
Source 2<br />
Annual<br />
Average<br />
Pumpage 3<br />
Total<br />
Permitted<br />
Annual<br />
Average<br />
Quantity<br />
Permitted<br />
Quantity<br />
Attributed<br />
to AG <strong>Use</strong><br />
Category 4<br />
Allen<br />
712 R A Cracker Partnership Ltd & Stallings Shirley Bess A415<br />
0 0.007 0.007<br />
S<br />
Hardee<br />
Allen<br />
E<br />
Hardee 724 Happy Acre Groves A415 G 0.038 0.052 0.052 E<br />
Hardee 725 John M & Virginia K Ullrich Sr, As Trustees A415 G 0.007 0.011 0.011 E<br />
Hardee 754 Shawn Pollard A415 G 0.02 0.032 0.032 E<br />
Hardee 769 Hardee Wauchula Farms, LLC A480 G 0.054 0.075 0.075 E<br />
Hardee 807 Gary Lamar Crawford A415 G 0.009 0.014 0.014 E<br />
Hardee 813 Annette E Gill A415 G 0.009 0.015 0.015 E<br />
Hardee 832 Causey Land Trust A415 G 0.014 0.023 0.023 E<br />
Hardee 833 COCC Inc A415 G 0.015 0.024 0.024 E<br />
Hardee 846 Justin K Durrance A415 G 0.009 0.015 0.015 E<br />
Hardee 876 Joe L. Davis, Jr. A415 G 0.019 0.031 0.031 E<br />
Hardee 882 Corby Crawford A415 G 0.017 0.027 0.027 E<br />
Hardee 883 Bruce Crawford A415 G 0.008 0.014 0.014 E<br />
Hardee 916 Terraventures LLC A490 G 0.028 0.046 0.046 E<br />
Hardee 946 Carl Stenstrom A415 G 0.027 0.044 0.044 E<br />
Hardee 970 Mary Ruth Allred as Trustee A415 G 0.037 0.051 0.051 E<br />
Hardee 1001 John E Or Tito R Terrell A415 G 0.027 0.044 0.044 E<br />
Hardee 1041 Frances W Davis A415 G 0.013 0.021 0.021 E<br />
Hardee 1070 Dewey M & Judith A Terrell as Trustee A415 G 0.027 0.044 0.044 E<br />
Hardee 1071 Kenneth A & Eileen M Lambert A415 G 0.009 0.015 0.015 E<br />
1091 M Lafon Trstee and JW & J Crews Jr And Phyllis & J A415<br />
0.022 0.036 0.036<br />
Hardee<br />
Smoak Jr Trstee<br />
G<br />
E<br />
Hardee 1116 James W Bryant Walter M Roland A415 G 0.019 0.031 0.031 E<br />
Hardee 1144 Mosaic Fertilizer LLC L600 G 0.003 0.006 0.006 E<br />
Hardee 1146 John D & Jerikay C Walker A415 G 0.009 0.014 0.014 E<br />
Hardee 1157 Dana Citrus Fruit A415 G 0.026 0.043 0.043 E<br />
1183 Luanne S Collins Trustee & Walter C & Janet L Shultz A415<br />
0.01 0.016 0.016<br />
G<br />
Hardee<br />
Trsts<br />
E<br />
Hardee 1184 Walter C Schultz A415 G 0.008 0.014 0.014 E<br />
M/E 5<br />
<strong>Southwest</strong> <strong>Florida</strong> <strong>Water</strong> <strong>Management</strong> District<br />
Page | 163
<strong>2011</strong> ESTIMATED WATER USE REPORT<br />
Table A7. Metered and <strong>Estimated</strong> Agricultural WUPs, Withdrawals and Permitted <strong>Use</strong> (mgd), <strong>2011</strong><br />
County<br />
WUP<br />
Number<br />
<strong>Southwest</strong> <strong>Florida</strong> <strong>Water</strong> <strong>Management</strong> District<br />
Permittee<br />
<strong>Use</strong><br />
Code 1<br />
Source 2<br />
Annual<br />
Average<br />
Pumpage 3<br />
Total<br />
Permitted<br />
Annual<br />
Average<br />
Quantity<br />
Permitted<br />
Quantity<br />
Attributed<br />
to AG <strong>Use</strong><br />
Category 4<br />
Hardee 1244 Willard Kelly Jr & Elizabeth A Durrance A415 G 0.001 0.037 0.037 E<br />
Hardee 1263 GRIMSLEY JO ANN TRUSTEE ET AL A415 G 0.036 0.059 0.059 E<br />
Hardee 1302 Kenneth Knapp Trustee of The RHC A415 G 0.025 0.041 0.041 E<br />
Hardee 1324 Mosaic Fertilizer LLC A415 G 0.044 0.061 0.061 E<br />
Hardee 1395 Shorewood Corporation A415 G 0.017 0.028 0.028 E<br />
1438 George T & Cynthia G Dees & James L Myers & William A415<br />
0.038 0.062 0.062<br />
Hardee<br />
Trawick<br />
G<br />
E<br />
Hardee 1439 Edwin Sasser A415 G 0.018 0.029 0.029 E<br />
Hardee 1460 J W Crews A415 G 0.013 0.021 0.021 E<br />
Hardee 1461 J W Crews A415 G 0.037 0.051 0.051 E<br />
Hardee 1487 Roberta Beattie A415 G 0.037 0.055 0.055 E<br />
Hardee 1500 J Henry Groves Inc A415 G 0.03 0.049 0.049 E<br />
Hardee 1574 Burton Cattle Co A415 G 0.02 0.034 0.034 E<br />
Hardee 1576 W & S Duncan LP A415 G 0.029 0.048 0.048 E<br />
Hardee 1583 Beatty Groves Inc A415 G 0.029 0.047 0.047 E<br />
Hardee 1620 Wayne A & Illa Jean Jernigan A415 G 0.018 0.029 0.029 E<br />
Hardee 1638 Glenda C Best A415 G 0.01 0.016 0.016 E<br />
Hardee 1674 Adrian R Chapman A415 G 0.048 0.066 0.066 E<br />
Hardee 1705 Ronald L Gillard A415 G 0.02 0.032 0.032 E<br />
Hardee 1706 Greg & Adele Reints A415 G 0.038 0.063 0.063 E<br />
Hardee 1738 Greenscapes Of <strong>Florida</strong> LLC A415 G 0.021 0.034 0.034 E<br />
Hardee 1746 Howard C Pritchett Jr & Howard Chad Pritchett A415 G 0.038 0.053 0.053 E<br />
Hardee 1887 Ernestine B Durrance A415 G 0.01 0.016 0.016 E<br />
Hardee 1962 Edward Schontag Et Al A415 G 0.04 0.066 0.066 E<br />
Hardee 1980 Claude C Saunders A415 G 0.042 0.061 0.061 E<br />
Hardee 2009 New Hope Baptist Church Of Hardee County A460 G 0.016 0.026 0.026 E<br />
Hardee 2071 Burton D & Mary Jane McLeod A415 G 0.018 0.029 0.029 E<br />
Hardee 2102 Adamson, Rivera and Browstein A415 G 0.01 0.017 0.017 E<br />
Hardee 2149 Diehl Family LP A56S G 0.067 0.093 0.093 E<br />
Hardee 2211 Wendell M Smith A415 G 0.048 0.066 0.066 E<br />
Hardee 2229 Malcome William Turner A415 G 0.005 0.008 0.008 E<br />
M/E 5<br />
Page | 164
<strong>2011</strong> ESTIMATED WATER USE REPORT<br />
Table A7. Metered and <strong>Estimated</strong> Agricultural WUPs, Withdrawals and Permitted <strong>Use</strong> (mgd), <strong>2011</strong><br />
County<br />
WUP<br />
Number<br />
<strong>Southwest</strong> <strong>Florida</strong> <strong>Water</strong> <strong>Management</strong> District<br />
Permittee<br />
<strong>Use</strong><br />
Code 1<br />
Source 2<br />
Annual<br />
Average<br />
Pumpage 3<br />
Total<br />
Permitted<br />
Annual<br />
Average<br />
Quantity<br />
Permitted<br />
Quantity<br />
Attributed<br />
to AG <strong>Use</strong><br />
Category 4<br />
Hardee 2261 Louisa Eldredge A415 G 0.04 0.055 0.055 E<br />
Hardee 2271 Sandra Beth Clark A415 G 0.045 0.063 0.063 E<br />
Hardee 2328 Roland L & Carolyn Skipper A415 G 0.008 0.013 0.013 E<br />
Hardee 2329 G Perry Mason A415 G 0.046 0.064 0.064 E<br />
Hardee 2340 Wayne Collier A51S G 0.043 0.059 0.059 E<br />
Hardee 2362 S David Conerly A535 G 0.053 0.127 0.127 E<br />
Hardee 2362 S David Conerly A535 S 0.025 0.127 0.127 E<br />
Hardee 2366 Arthur Womack As Trustee Of The Womack Family Tr A415 G 0.019 0.031 0.031 E<br />
Hardee 2373 T & G Groves Inc A415 G 0.026 0.042 0.042 E<br />
Hardee 2375 Ronald F & Sharon D Moye A415 G 0.018 0.029 0.029 E<br />
Hardee 2383 Smoak Groves Inc A415 G 0.03 0.048 0.048 E<br />
Hardee 2405 James Livingston A490 G 0.065 0.09 0.09 E<br />
Hardee 2411 Jmj Citrus LLC A415 G 0.012 0.02 0.02 E<br />
Hardee 2412 Citra Lee Partnership A415 G 0.041 0.066 0.066 E<br />
Hardee 2417 Williams Grove/Tom Chapman & Associates A415 G 0.026 0.042 0.042 E<br />
Hardee 2485 Glen O Douglas A490 G 0.06 0.083 0.083 E<br />
2489 Walter S & Carol M Farr‐Trustees Walter S Farr‐<br />
A415<br />
0.036 0.05 0.05<br />
Hardee<br />
Malcolm Farr‐Et A<br />
G<br />
E<br />
Hardee 2552 Patricia C Grimsley as Tstee of P C Grimisley Rev Trust A415 G 0.035 0.057 0.057 E<br />
Hardee 2561 Cader William Altman A415 G 0.025 0.041 0.041 E<br />
Hardee 2579 Joyce Watkins C/O Bill H Paul A415 G 0.043 0.064 0.064 E<br />
Hardee 2583 Arthur S & Wanda H Womack As Tst A415 G 0.025 0.041 0.041 E<br />
Hardee 2585 Rogers & Mallett & Crews Jr A415 G 0.02 0.034 0.034 E<br />
Hardee 2591 Edgar L & Ruth G Davis A415 G 0.019 0.031 0.031 E<br />
Hardee 2607 Elliot Roberts A415 G 0.042 0.068 0.068 E<br />
Hardee 2623 Donald Davis A490 G 0.068 0.095 0.095 E<br />
2635 Edgar L. Davis,Sr. Trustee of the Edgar L. Davis Sr A415<br />
0.024 0.04 0.04<br />
Hardee<br />
Family Trust<br />
G<br />
E<br />
Hardee 2643 W D Frederick Jr A415 G 0.02 0.032 0.032 E<br />
Hardee 2645 Willard K Durrance A415 G 0.008 0.014 0.014 E<br />
Hardee 2649 Faye D Shackleford A415 G 0.007 0.012 0.012 E<br />
M/E 5<br />
Page | 165
<strong>2011</strong> ESTIMATED WATER USE REPORT<br />
Table A7. Metered and <strong>Estimated</strong> Agricultural WUPs, Withdrawals and Permitted <strong>Use</strong> (mgd), <strong>2011</strong><br />
County<br />
WUP<br />
Number<br />
<strong>Southwest</strong> <strong>Florida</strong> <strong>Water</strong> <strong>Management</strong> District<br />
Permittee<br />
<strong>Use</strong><br />
Code 1<br />
Source 2<br />
Annual<br />
Average<br />
Pumpage 3<br />
Total<br />
Permitted<br />
Annual<br />
Average<br />
Quantity<br />
Permitted<br />
Quantity<br />
Attributed<br />
to AG <strong>Use</strong><br />
Category 4<br />
Hardee 2727 C Elton Crews Family LP LLLP A415 G 0.057 0.079 0.079 E<br />
Hardee 2742 Rafter C Ranch Inc A415 G 0.009 0.015 0.015 E<br />
Hardee 2766 Walter S & Carol M Farr A415 G 0.012 0.02 0.02 E<br />
Hardee 2831 Crews Groves Inc A415 G 0.013 0.022 0.022 E<br />
Hardee 2872 James M & Winifred Shearer A415 G 0.019 0.03 0.03 E<br />
Hardee 2878 Sally Winton Fletcher A415 G 0.028 0.046 0.046 E<br />
Hardee 2936 Tri Ben Groves, Inc. A415 G 0.024 0.04 0.04 E<br />
Hardee 2968 Stephen M & Jennifer S Palmer A415 G 0.016 0.026 0.026 E<br />
Hardee 2986 Ra Cracker Partnership Ltd & Bes S A Stallings A415 G 0.017 0.028 0.028 E<br />
2987 Kenneth M Von Hahmann & Norman O Warren & Jeff J A415<br />
0.007 0.012 0.012<br />
Hardee<br />
& Jan F McKibbe<br />
G<br />
E<br />
Hardee 3035 Village Oaks Of Wauchula LLC A415 G 0.017 0.027 0.027 E<br />
Hardee 3137 C Elton Crews Inc A415 G 0.019 0.032 0.032 E<br />
Hardee 3162 Nickerson Brothers LLC L615 G 0.053 0.091 0.091 E<br />
Hardee 3164 Davis Enterprises Inc A415 G 0.011 0.032 0.032 E<br />
Hardee 3173 James D & Walter L Brewer A415 G 0.038 0.053 0.053 E<br />
Hardee 3174 G & T Holding Co LLC A415 G 0.016 0.027 0.027 E<br />
Hardee 3176 Joesph Gilliard A415 G 0.015 0.025 0.025 E<br />
Hardee 3177 Daisey Barnett Estate A415 G 0.038 0.053 0.053 E<br />
Hardee 3178 T & G Partnership A415 G 0.016 0.025 0.025 E<br />
Hardee 3179 3 N Groves A415 G 0.021 0.034 0.034 E<br />
Hardee 3180 Joesph Gilliard A415 G 0.011 0.017 0.017 E<br />
Hardee 3198 James A & Charles Alan & Inez Bliss A490 G 0.067 0.092 0.092 E<br />
Hardee 3256 John S & Bennie L Platt L600 G 0.003 0.005 0.005 E<br />
Hardee 3259 Patricia M & Grady Johnson Sr A415 G 0.009 0.015 0.015 E<br />
Hardee 3300 Davis Enterprises Inc A415 G 0.021 0.034 0.034 E<br />
Hardee 3331 W D Frederick Jr A415 G 0.016 0.026 0.026 E<br />
Hardee 3338 CF Industries Inc A415 G 0.017 0.028 0.028 E<br />
Hardee 3345 Benny Jr Malissa Benny Sr Albritton A415 G 0 0.025 0.025 E<br />
Hardee 3349 Robert M Helm Sr A415 G 0.036 0.05 0.05 E<br />
Hardee 3365 Peace River Commission Company Inc L625 G 0.059 0.082 0.082 E<br />
M/E 5<br />
Page | 166
<strong>2011</strong> ESTIMATED WATER USE REPORT<br />
Table A7. Metered and <strong>Estimated</strong> Agricultural WUPs, Withdrawals and Permitted <strong>Use</strong> (mgd), <strong>2011</strong><br />
County<br />
WUP<br />
Number<br />
<strong>Southwest</strong> <strong>Florida</strong> <strong>Water</strong> <strong>Management</strong> District<br />
Permittee<br />
<strong>Use</strong><br />
Code 1<br />
Source 2<br />
Annual<br />
Average<br />
Pumpage 3<br />
Total<br />
Permitted<br />
Annual<br />
Average<br />
Quantity<br />
Permitted<br />
Quantity<br />
Attributed<br />
to AG <strong>Use</strong><br />
Category 4<br />
Hardee 3373 Ernest <strong>Water</strong>s & Others Trustee A415 G 0.031 0.056 0.056 E<br />
Hardee 3435 Wilbur E Robertson A415 G 0.017 0.03 0.03 E<br />
Hardee 3436 Davis Enterprises Inc A490 G 0.065 0.09 0.09 E<br />
Hardee 3451 Minor L Bryant A415 G 0.017 0.028 0.028 E<br />
Hardee 3452 Robert C & Robin E Abbott A415 G 0.01 0.016 0.016 E<br />
Hardee 3477 Edwin C & Joanne E Harlan A415 G 0.011 0.017 0.017 E<br />
Hardee 3489 Robert C & Robin E Abbott A415 G 0.021 0.035 0.035 E<br />
Hardee 3490 Carol A & John W Brown A415 G 0.008 0.012 0.012 E<br />
Hardee 3509 Doyle E & Debra H Carlton III A415 G 0.044 0.061 0.061 E<br />
3512 Jane C Durando & Doyle E Carlton III & Limestone A415<br />
0.049 0.068 0.068<br />
Hardee<br />
Ranch LLC<br />
G<br />
E<br />
Hardee 3513 SUSAn C Smith A415 G 0.038 0.052 0.052 E<br />
Hardee 3514 Quail Creek Farms Inc A415 G 0.011 0.017 0.017 E<br />
Hardee 3551 Martin And Karen McKenna A415 G 0.029 0.047 0.047 E<br />
Hardee 3588 Citra Lee Partnership A415 G 0.013 0.022 0.022 E<br />
Hardee 3602 Burton D & Mary Jane McLeod A415 G 0.001 0.015 0.015 E<br />
Hardee 3612 Willard Kelly Jr & Elizabeth A Durrance A415 G 0.017 0.028 0.028 E<br />
Hardee 3625 George M & Vicki L Parnell A415 G 0.051 0.07 0.07 E<br />
Hardee 3627 George M & Vicki L Parnell A415 G 0.02 0.033 0.033 E<br />
Hardee 3648 Grass Valley Ranch Inc A490 G 0.038 0.053 0.053 E<br />
Hardee 3756 Richard C & Elizabeth Grantham Sr A415 G 0.005 0.008 0.008 E<br />
Hardee 3789 Scarborough & Sons Ranch Inc A415 G 0.029 0.047 0.047 E<br />
Hardee 3843 Nicholas A Sannella A415 G 0.01 0.016 0.016 E<br />
Hardee 3961 Harold F Guerndt Jr A415 G 0.02 0.034 0.034 E<br />
Hardee 4039 Benny W & Pamela Albritton & Ardis M See A415 G 0.01 0.016 0.016 E<br />
Hardee 4145 Sheldon & Melody Toews A415 G 0.02 0.032 0.032 E<br />
Hardee 4200 R‐7 Properties Inc A <strong>Florida</strong> Corp A415 G 0.017 0.027 0.027 E<br />
Hardee 4210 Kenneth W II & Kathryn Valentine A415 G 0.007 0.012 0.012 E<br />
Hardee 4224 Ninfa C Davis A415 G 0.018 0.03 0.03 E<br />
Hardee 4274 Gary Wyatt A415 G 0.009 0.015 0.015 E<br />
Hardee 4292 Leonard & Mary Lois Crawley A415 G 0.019 0.031 0.031 E<br />
M/E 5<br />
Page | 167
<strong>2011</strong> ESTIMATED WATER USE REPORT<br />
Table A7. Metered and <strong>Estimated</strong> Agricultural WUPs, Withdrawals and Permitted <strong>Use</strong> (mgd), <strong>2011</strong><br />
County<br />
WUP<br />
Number<br />
<strong>Southwest</strong> <strong>Florida</strong> <strong>Water</strong> <strong>Management</strong> District<br />
Permittee<br />
<strong>Use</strong><br />
Code 1<br />
Source 2<br />
Annual<br />
Average<br />
Pumpage 3<br />
Total<br />
Permitted<br />
Annual<br />
Average<br />
Quantity<br />
Permitted<br />
Quantity<br />
Attributed<br />
to AG <strong>Use</strong><br />
Category 4<br />
Hardee 4420 John Updike Jr A445 G 0.022 0.061 0.061 E<br />
Hardee 4471 Clinton J Sr & Eunice P Manley A415 G 0.01 0.017 0.017 E<br />
Hardee 4515 John C Barnett Sr A415 G 0.003 0.005 0.005 E<br />
Hardee 4521 ELEANOR Henderson A415 G 0.039 0.064 0.064 E<br />
Hardee 4533 Lannie James Cooper A415 G 0.028 0.046 0.046 E<br />
Hardee 4583 Smith, Robert Ray A415 G 0.022 0.035 0.035 E<br />
Hardee 4600<br />
Frank E Menke III‐Trstee of DBT Lnd Trst &<br />
Sweetwater Ranch<br />
A490 G 0.149 0.269 0.269 E<br />
Hardee 4602 H Shawn Pollard A415 G 0.01 0.016 0.016 E<br />
Hardee 4613 Michael McKenzie A415 G 0.039 0.095 0.095 E<br />
Hardee 4707 Emory L Burnett A415 G 0.004 0.006 0.006 E<br />
Hardee 4731 John D & Jerikay C Walker A415 G 0.025 0.04 0.04 E<br />
Hardee 4768 Karen Elizabeth Drake A415 G 0.01 0.016 0.016 E<br />
Hardee 4772 Geiger Bowling Green Grove Inc A415 G 0.035 0.058 0.058 E<br />
Hardee 4816 Marion E & Annette E Gill A415 G 0.005 0.008 0.008 E<br />
Hardee 4841 Ninfa C Davis L700 G 0.001 0.001 0.001 E<br />
Hardee 4882 Opal S Knight Trustee A415 G 0.023 0.038 0.038 E<br />
Hardee 5020 Live Oak Ventures LLC A415 G 0.005 0.009 0.009 E<br />
Hardee 5044 Victor B Story Sr A415 G 0.025 0.04 0.04 E<br />
Hardee 5142 Elliot A Roberts And Lance Rober Ts A415 G 0.014 0.023 0.023 E<br />
Hardee 5144 Calvin & Pamela Roberts, Milton & Kim Roberts A415 G 0.017 0.029 0.029 E<br />
Hardee 5183 B & L Citrus Inc A415 G 0.017 0.028 0.028 E<br />
Hardee 5194 Wendell And Annette Cole A415 G 0.011 0.019 0.019 E<br />
Hardee 5197 Richard G Ellis A415 G 0.008 0.014 0.014 E<br />
Hardee 5199 Joe Skitka L610 G 0.002 0.004 0.004 E<br />
Hardee 5255 F L Revell Jr A415 G 0.03 0.048 0.048 E<br />
Hardee 5262 Elliot A Roberts A415 G 0.008 0.013 0.013 E<br />
Hardee 5263 Jacqueline & Michael Hendry A415 G 0.01 0.016 0.016 E<br />
Hardee 5282 Martin And Karen McKenna A415 G 0.028 0.046 0.046 E<br />
Hardee 5428 Elaine Himrod A415 G 0.014 0.022 0.022 E<br />
Hardee 5858 Frank D Albritton A415 G 0.02 0.032 0.032 E<br />
M/E 5<br />
Page | 168
<strong>2011</strong> ESTIMATED WATER USE REPORT<br />
Table A7. Metered and <strong>Estimated</strong> Agricultural WUPs, Withdrawals and Permitted <strong>Use</strong> (mgd), <strong>2011</strong><br />
County<br />
WUP<br />
Number<br />
Permittee<br />
<strong>Use</strong><br />
Code 1<br />
Source 2<br />
Annual<br />
Average<br />
Pumpage 3<br />
Total<br />
Permitted<br />
Annual<br />
Average<br />
Quantity<br />
Permitted<br />
Quantity<br />
Attributed<br />
to AG <strong>Use</strong><br />
Category 4<br />
Hardee 5869<br />
Marian S & W S Martin‐Trustees of The M S Martin<br />
Living Trust<br />
A415 G 0.013 0.022 0.022 E<br />
Hardee 5992 Robert L & Barbara A Hambrick A415 G 0.018 0.029 0.029 E<br />
Hardee 6019 William Keith & Candis Jahna Davis A415 G 0.03 0.049 0.049 E<br />
Hardee 6080 Joe Skitka A415 G 0.022 0.051 0.051 E<br />
Hardee 6090 Beattie Holt A415 G 0.015 0.025 0.025 E<br />
Hardee 6116 Terry Shackelford A415 G 0.013 0.021 0.021 E<br />
Hardee 6225 Jedina Justesen A490 G 0.01 0.016 0.016 E<br />
Hardee 6241 Herbert Waldron A415 G 0.031 0.051 0.051 E<br />
Hardee 6244 Dale E Chlumsky Trust L630 G 0.005 0.008 0.008 E<br />
Hardee 6261 Lillian M Hendry C/O Joyce Kenmamer A415 G 0.008 0.027 0.027 E<br />
Hardee 6318 James S & Ninfa D Skipper A415 G 0.005 0.008 0.008 E<br />
Hardee 6325 James And Emily Sasser A415 G 0.026 0.043 0.043 E<br />
6385 Mary Kathleen Moseley and Dennis Burton as Co‐ A415<br />
0.021 0.035 0.035<br />
G<br />
Hardee<br />
Trustees<br />
E<br />
6386 James and Evelyn Bryant, Walter M. Rowland, Boyd A415<br />
0.014 0.023 0.023<br />
G<br />
Hardee<br />
Hyder<br />
E<br />
Hardee 6398 Roe Groves, Inc. A415 G 0.014 0.023 0.023 E<br />
Hardee 6408 Jack C Hayman A415 G 0.01 0.017 0.017 E<br />
Hardee 6417 Gregory Reints & Others A415 G 0.011 0.019 0.019 E<br />
Hardee 6418 Herman & Frank Keller A415 G 0.009 0.015 0.015 E<br />
Hardee 6454 Albritton Development LLC A415 G 0.019 0.03 0.03 E<br />
Hardee 6475 Mark L Manuel A415 G 0.012 0.02 0.02 E<br />
Hardee 6522 Brix Investments LLC A415 G 0.018 0.029 0.029 E<br />
Hardee 6531 Andrew T Pace L600 G 0 0 0 E<br />
Hardee 6549 David A‐Linda M & James A Thompson A415 G 0.007 0.012 0.012 E<br />
Hardee 6557 H S Jones Jr A415 G 0.009 0.016 0.016 E<br />
Hardee 6568 3 N Groves LLP A415 G 0.019 0.031 0.031 E<br />
Hardee 6598 Joseph L Discipio A415 G 0.02 0.032 0.032 E<br />
6601 Robert L Fletcher, Douglas L Fletcher & Matthew W A415<br />
0.026 0.043 0.043<br />
G<br />
Hardee<br />
Perry<br />
E<br />
M/E 5<br />
<strong>Southwest</strong> <strong>Florida</strong> <strong>Water</strong> <strong>Management</strong> District<br />
Page | 169
<strong>2011</strong> ESTIMATED WATER USE REPORT<br />
Table A7. Metered and <strong>Estimated</strong> Agricultural WUPs, Withdrawals and Permitted <strong>Use</strong> (mgd), <strong>2011</strong><br />
County<br />
WUP<br />
Number<br />
<strong>Southwest</strong> <strong>Florida</strong> <strong>Water</strong> <strong>Management</strong> District<br />
Permittee<br />
<strong>Use</strong><br />
Code 1<br />
Source 2<br />
Annual<br />
Average<br />
Pumpage 3<br />
Total<br />
Permitted<br />
Annual<br />
Average<br />
Quantity<br />
Permitted<br />
Quantity<br />
Attributed<br />
to AG <strong>Use</strong><br />
Category 4<br />
Hardee 6608 Myrtis Guerndt Trustee & Cheryl L & John Dunning A415 G 0.02 0.032 0.032 E<br />
Hardee 6612 Khaled Gebarin A415 G 0.008 0.013 0.013 E<br />
Hardee 6615 Charles E & Gail D Best A415 G 0.02 0.032 0.032 E<br />
Hardee 6616 Tyrone Chapman A415 G 0.008 0.012 0.012 E<br />
Hardee 6617 Carlos Bailey/The Groves of Peace River A415 G 0.02 0.033 0.033 E<br />
Hardee 6645 Ronald McCall A415 G 0.018 0.03 0.03 E<br />
Hardee 6651 Ronald F & Sharon D Moye A645 G 0 0 0 E<br />
Hardee 6662 Marjo Inc A415 G 0.011 0.018 0.018 E<br />
Hardee 6686 Ronald & Harriet Senger A460 G 0.001 0.002 0.002 E<br />
Hardee 6716 Carl Stenstrom A415 G 0.006 0.01 0.01 E<br />
Hardee 6719 Thompson & Davis Groves A415 G 0.023 0.038 0.038 E<br />
Hardee 6726 Great Harvest Corporation A415 G 0.013 0.022 0.022 E<br />
Hardee 6727 Peter A Goldstein A415 G 0.019 0.031 0.031 E<br />
Hardee 6744 Joseph L Discipio A415 G 0.007 0.012 0.012 E<br />
Hardee 6833 Juvenal Calvillo A415 G 0.007 0.012 0.012 E<br />
Hardee 6845 James Bruce & Joni H Crawford A415 G 0.007 0.012 0.012 E<br />
Hardee 6865 Buckhorn Groves Inc A415 G 0.038 0.053 0.053 E<br />
Hardee 6921 Roy Brown Pe A415 G 0.013 0.022 0.022 E<br />
Hardee 7003 J Ragon Barnett Jr A415 G 0.01 0.016 0.016 E<br />
Hardee 7012 Charles Knight A490 G 0.026 0.042 0.042 E<br />
Hardee 7029 Luther D,Carol Sapp & Matthew D A415 G 0.017 0.027 0.027 E<br />
Hardee 7030 Paul Mislevy A415 G 0.025 0.041 0.041 E<br />
Hardee 7047 E & D Ranch LLP A490 G 0.008 0.013 0.013 E<br />
Hardee 7050 G Lamar & Joy A. Gilliard A415 G 0.014 0.024 0.024 E<br />
Hardee 7051 Wendell And Annette Cole A415 G 0.049 0.068 0.068 E<br />
Hardee 7064 Kim Rueter Co A415 G 0.043 0.07 0.07 E<br />
Hardee 7099 J. R. Paul, Jr. Family Limited Partnership A415 G 0.097 0.145 0.145 E<br />
Hardee 7109 Rowland & Helga Shackelford A415 G 0.005 0.008 0.008 E<br />
Hardee 7165 CMSs Groves & Mel Butt A415 G 0.028 0.046 0.046 E<br />
Hardee 7166 ATP Groves, LLC A415 G 0.024 0.039 0.039 E<br />
Hardee 7209 Roberto & Margarita Estrada A56F G 0.038 0.053 0.053 E<br />
M/E 5<br />
Page | 170
<strong>2011</strong> ESTIMATED WATER USE REPORT<br />
Table A7. Metered and <strong>Estimated</strong> Agricultural WUPs, Withdrawals and Permitted <strong>Use</strong> (mgd), <strong>2011</strong><br />
County<br />
WUP<br />
Number<br />
Permittee<br />
<strong>Use</strong><br />
Code 1<br />
Source 2<br />
Annual<br />
Average<br />
Pumpage 3<br />
Total<br />
Permitted<br />
Annual<br />
Average<br />
Quantity<br />
Permitted<br />
Quantity<br />
Attributed<br />
to AG <strong>Use</strong><br />
Category 4<br />
Hardee 7248 Schwartz Hardee Properties LLC A415 G 0.057 0.137 0.137 E<br />
Hardee 7249 Milton Flint A415 G 0.017 0.028 0.028 E<br />
Hardee 7254 Tri‐Ben Groves LLC and J. Welborn Bentley Inc. A415 G 0.044 0.061 0.061 E<br />
Hardee 7277 Grimsley Groves Inc A415 G 0.029 0.047 0.047 E<br />
Hardee 7279 Roberto & Salvador Estrada A535 G 0.018 0.029 0.029 E<br />
Hardee 7293 Henry E. & Judy Davis A415 G 0.003 0.005 0.005 E<br />
Hardee 7343 University of Miami‐Norman I. Weil Successor/Trustee A415 G 0.047 0.065 0.065 E<br />
Hardee 7346 Ernest <strong>Water</strong>s & Sons Inc A415 G 0.028 0.046 0.046 E<br />
Hardee 7420 Edward S Schontag Jr A415 G 0.008 0.014 0.014 E<br />
Hardee 7421 Stevens Land & Citrus, LLC / Attn: Peter J. Stevens A415 G 0.037 0.052 0.052 E<br />
Hardee 7430 3 N Groves A415 G 0.021 0.035 0.035 E<br />
Hardee 7440<br />
Ivan Reddington Tr Of The Ivan & Doris Reddington Rev<br />
Living Trust<br />
A415 G 0.005 0.008 0.008 E<br />
Hardee 7503 Earl L & Lynn M Denney Jr A415 G 0.026 0.043 0.043 E<br />
Hardee 7507 Herbert W Kay Jr A490 G 0.024 0.039 0.039 E<br />
Hardee 7518 Paul Irvin A415 G 0.029 0.048 0.048 E<br />
Hardee 7519 3 N Groves A415 G 0.01 0.016 0.016 E<br />
Hardee 7545 Smith & Sons Citrus LLC A415 G 0.041 0.056 0.056 E<br />
Hardee 7546 J H JEAN, D J NED and TAMMY HANCOCK A415 G 0.02 0.033 0.033 E<br />
Hardee 7559 Kenneth Thompson A415 G 0.021 0.034 0.034 E<br />
Hardee 7583 Toledo Investment Group Inc A415 G 0.023 0.038 0.038 E<br />
Hardee 7597 Gary W Blackman A415 G 0.007 0.011 0.011 E<br />
Hardee 7605 Ronald F. and Sharon Moye L600 G 0 0 0 E<br />
Hardee 7661 Dunn Groves Corporation A415 G 0.046 0.064 0.064 E<br />
Hardee 7688 Gayle E & Georgia F Murdock A415 G 0.006 0.01 0.01 E<br />
Hardee 7713 Frank Snell A415 G 0.04 0.055 0.055 E<br />
Hardee 7742 James And Emily Sasser A415 G 0.013 0.022 0.022 E<br />
Hardee 7762 Grady Sr & Patricia Johnson A490 G 0.015 0.025 0.025 E<br />
Hardee 7800 Benny Albritton & Vernon See A415 G 0.022 0.036 0.036 E<br />
Hardee 7831 Carl & Ladonna Weis A470 G 0.097 0.176 0.176 E<br />
M/E 5<br />
<strong>Southwest</strong> <strong>Florida</strong> <strong>Water</strong> <strong>Management</strong> District<br />
Page | 171
<strong>2011</strong> ESTIMATED WATER USE REPORT<br />
Table A7. Metered and <strong>Estimated</strong> Agricultural WUPs, Withdrawals and Permitted <strong>Use</strong> (mgd), <strong>2011</strong><br />
County<br />
WUP<br />
Number<br />
<strong>Southwest</strong> <strong>Florida</strong> <strong>Water</strong> <strong>Management</strong> District<br />
Permittee<br />
<strong>Use</strong><br />
Code 1<br />
Source 2<br />
Annual<br />
Average<br />
Pumpage 3<br />
Total<br />
Permitted<br />
Annual<br />
Average<br />
Quantity<br />
Permitted<br />
Quantity<br />
Attributed<br />
to AG <strong>Use</strong><br />
Category 4<br />
7833 Walter S & Carol M Farr And Steven Keith H Malcolm S A415<br />
0.03 0.05 0.05<br />
Hardee<br />
Farr<br />
G<br />
E<br />
Hardee 7841 Pioneer Groves Inc A415 G 0.012 0.02 0.02 E<br />
Hardee 7855 Danny & Brenda Terrell A415 G 0.009 0.015 0.015 E<br />
Hardee 7869 W Reynolds Allen A415 G 0.018 0.029 0.029 E<br />
Hardee 7872 J. R. Paul, Jr. Family Limited Partnership A415 G 0.01 0.016 0.016 E<br />
Hardee 7884 Reson L Holt Trust A415 G 0.005 0.008 0.008 E<br />
7900 Martha Moore Rockwell Trustee Of Frank E Rockwell Jr A485<br />
0.043 0.071 0.071<br />
Hardee<br />
Trust<br />
G<br />
E<br />
Hardee 7945 Geneva Mae Beavers A415 G 0.011 0.018 0.018 E<br />
Hardee 7946 Irdia Raj & Angela Desai & A58S G 0.001 0.003 0.002 E<br />
Hardee 7962 Marjo Inc A415 G 0.005 0.008 0.008 E<br />
7967 Gregory L Tate & Katherine L Beeson & James A & A415<br />
0.009 0.015 0.015<br />
Hardee<br />
Pamela Neff<br />
G<br />
E<br />
Hardee 7974 Charles A Bliss A415 G 0.042 0.058 0.058 E<br />
Hardee 7981 Julio & Maria Labrador A415 G 0.007 0.012 0.012 E<br />
Hardee 7985 Jack D Soles Inc A415 G 0.007 0.011 0.011 E<br />
Hardee 8003 Daniel W & Karen M Dodrill A490 G 0.022 0.036 0.036 E<br />
Hardee 8013 Doyle E Carlton III A415 G 0.01 0.016 0.016 E<br />
Hardee 8019 Ronald F. and Sharon Moye A415 G 0.011 0.017 0.017 E<br />
Hardee 8026 Dora S Wingo Trustee Of RaLPh D Wingotrust A415 G 0.048 0.067 0.067 E<br />
Hardee 8030 John Roy Gough A416 G 0.022 0.051 0.051 E<br />
Hardee 8042 Citruspact Inc A415 G 0.01 0.016 0.016 E<br />
Hardee 8051 Charles E & Kathleen Whaley A415 G 0.02 0.033 0.033 E<br />
8058 Kenneth R Sanders III & Roberta G Sanders & Higdon A415<br />
0.043 0.06 0.06<br />
Hardee<br />
Enterpr Ltd<br />
G<br />
E<br />
Hardee 8068 Hugh Arnold & Delena Rivers A485 G 0.017 0.028 0.028 E<br />
Hardee 8071 Robert C & Robin E Abbott & Arthur B Avery Jr A415 G 0.015 0.024 0.024 E<br />
Hardee 8083 Estate Of V C Hollingsworth Sr A415 G 0.021 0.034 0.034 E<br />
Hardee 8104 Causey Land Trust A415 G 0.025 0.042 0.042 E<br />
Hardee 8105 Lamar Gilliard A415 G 0.017 0.027 0.027 E<br />
M/E 5<br />
Page | 172
<strong>2011</strong> ESTIMATED WATER USE REPORT<br />
Table A7. Metered and <strong>Estimated</strong> Agricultural WUPs, Withdrawals and Permitted <strong>Use</strong> (mgd), <strong>2011</strong><br />
County<br />
WUP<br />
Number<br />
<strong>Southwest</strong> <strong>Florida</strong> <strong>Water</strong> <strong>Management</strong> District<br />
Permittee<br />
<strong>Use</strong><br />
Code 1<br />
Source 2<br />
Annual<br />
Average<br />
Pumpage 3<br />
Total<br />
Permitted<br />
Annual<br />
Average<br />
Quantity<br />
Permitted<br />
Quantity<br />
Attributed<br />
to AG <strong>Use</strong><br />
Category 4<br />
Hardee 8106 Fred & Ilene Hash A415 G 0.009 0.015 0.015 E<br />
Hardee 8128 Adele Reints A415 G 0.005 0.008 0.008 E<br />
Hardee 8130 Norman & Phyllis Nickerson L625 G 0.025 0.051 0.051 E<br />
Hardee 8131 Robert D Quigley A415 G 0.004 0.007 0.007 E<br />
Hardee 8146 Joe L Davis Sr Groves & Ranch A485 G 0 0.195 0.195 E<br />
Hardee 8167 Reaphook, Inc. Attn: Carl Weis A415 G 0.026 0.042 0.042 E<br />
Hardee 8185 Thomas & Kay Bloom A490 G 0.018 0.03 0.03 E<br />
Hardee 8201 Harold Edward & Joyce M McClelland Jr L610 G 0.001 0.002 0.002 E<br />
Hardee 8203 Carrol Moye A415 G 0.005 0.016 0.016 E<br />
Hardee 8204 Ridobel And Adriana Gonzalez A415 G 0.018 0.03 0.03 E<br />
Hardee 8212 James H Albritton A415 G 0.008 0.021 0.021 E<br />
Hardee 8220 Abbott Elizabeth; Abbott Albert Getchell & A415 G 0.02 0.033 0.033 E<br />
Hardee 8225 Walter S Farr Trst , Carol Farr Trst A415 G 0.014 0.023 0.023 E<br />
Hardee 8236 Frank Callahan A415 G 0.028 0.046 0.046 E<br />
Hardee 8237 Martha Garza A415 G 0.046 0.064 0.064 E<br />
Hardee 8288 Benjamin K Norris A415 G 0.01 0.016 0.016 E<br />
Hardee 8315 Shackelford Family Ltd Partnership A415 G 0.005 0.008 0.008 E<br />
Hardee 8316 Emmett & Arost Groves c/o Parnell Road LLC A415 G 0.034 0.066 0.066 E<br />
Hardee 8376 John E Terrell A415 G 0.009 0.015 0.015 E<br />
Hardee 8379 Davis Bros Inc A415 G 0.046 0.063 0.063 E<br />
Hardee 8380 Eva Bonita Moye A415 G 0.008 0.027 0.027 E<br />
Hardee 8386 J. R. Paul, Jr. Family Limited Partnership A415 G 0.016 0.026 0.026 E<br />
8387 Suntrust Bank Mid Fl Trusteeof Jernigan Latosi By‐Pass A415<br />
0.019 0.031 0.031<br />
Hardee<br />
Trust<br />
G<br />
E<br />
Hardee 8402 John W & Jean B Burton A415 G 0.022 0.037 0.037 E<br />
Hardee 8449 J. R. Paul, Jr. Family Limited Partnership A415 G 0.019 0.031 0.031 E<br />
Hardee 8475 Gail Crews A415 G 0.015 0.025 0.025 E<br />
Hardee 8486 Zoe L & Michael J Richardson L600 G 0 0 0 E<br />
Hardee 8494 Charles H Lambert A415 G 0.019 0.031 0.031 E<br />
Hardee 8502 Theo & Christina Bryant A415 G 0.016 0.027 0.027 E<br />
Hardee 8516 Gregory D Reints A415 G 0.016 0.027 0.027 E<br />
M/E 5<br />
Page | 173
<strong>2011</strong> ESTIMATED WATER USE REPORT<br />
Table A7. Metered and <strong>Estimated</strong> Agricultural WUPs, Withdrawals and Permitted <strong>Use</strong> (mgd), <strong>2011</strong><br />
County<br />
WUP<br />
Number<br />
<strong>Southwest</strong> <strong>Florida</strong> <strong>Water</strong> <strong>Management</strong> District<br />
Permittee<br />
<strong>Use</strong><br />
Code 1<br />
Source 2<br />
Annual<br />
Average<br />
Pumpage 3<br />
Total<br />
Permitted<br />
Annual<br />
Average<br />
Quantity<br />
Permitted<br />
Quantity<br />
Attributed<br />
to AG <strong>Use</strong><br />
Category 4<br />
Hardee 8534 3c Enterprises A415 G 0.02 0.032 0.032 E<br />
Hardee 8537 G E M Developers LLC A415 G 0.03 0.084 0.084 E<br />
Hardee 8538 3c Enterprises L610 G 0 0 0 E<br />
Hardee 8545 Don W & Mary F Swanson A415 G 0.01 0.016 0.016 E<br />
Hardee 8572 3c Enterprises A415 G 0.03 0.049 0.049 E<br />
Hardee 8592 Claude C Saunders A415 G 0.004 0.007 0.007 E<br />
Hardee 8596 Friendship Foliage A480 G 0.046 0.076 0.076 E<br />
Hardee 8616 Orange Enterprises Inc A415 G 0.018 0.03 0.03 E<br />
Hardee 8637 Thomas S Cook A415 G 0.005 0.008 0.008 E<br />
Hardee 8659 3c Enterprises A415 G 0.02 0.032 0.032 E<br />
Hardee 8689 Robert V. & Brenda K Roberts, Trustees A415 G 0.032 0.067 0.067 E<br />
Hardee 8730 Pioneer Groves Inc J Ned Hancock Pres A415 G 0.01 0.016 0.016 E<br />
Hardee 8742 Robert C Abbott Sr& Edward S Schontag Jr A415 G 0.008 0.013 0.013 E<br />
Hardee 8743 Andrea Sue Birge & Lavon & Linda A Cobb A415 G 0.009 0.015 0.015 E<br />
Hardee 8752 Dasher Groves Inc A495 G 0.023 0.038 0.038 E<br />
Hardee 8756 Shawn Pollard A415 G 0.02 0.034 0.034 E<br />
Hardee 8795 John S Platt A415 G 0.003 0.005 0.005 E<br />
Hardee 8838 Harriet R Schontag A415 G 0.047 0.065 0.065 E<br />
Hardee 8843 Peter A Goldstein A415 G 0.029 0.047 0.047 E<br />
Hardee 8844 C Elton Crews Family LP LLLP A415 G 0.024 0.039 0.039 E<br />
Hardee 8862 4c Partnership A415 G 0.027 0.045 0.045 E<br />
Hardee 8869 Lexan Investments LLC A480 G 0.051 0.071 0.071 E<br />
Hardee 8897 Durrance Grove Ltd Partnership A415 G 0.015 0.025 0.025 E<br />
Hardee 8899 H Shawn Pollard & Zenybie Pollard A415 G 0.009 0.015 0.015 E<br />
Hardee 8903 Daniel B Duke A415 G 0.005 0.009 0.009 E<br />
Hardee 8905 Bryan E Ingram A415 G 0.014 0.024 0.024 E<br />
Hardee 8922 Michael D Colding & Amanda M Colding A420 G 0.014 0.024 0.024 E<br />
Hardee 8949 Tyrone M & Margie M Chapman A415 G 0.004 0.007 0.007 E<br />
Hardee 8952 Danny Durrance A415 G 0.016 0.026 0.026 E<br />
Hardee 8969 German <strong>Florida</strong> Citrus LLC A415 G 0.146 0.376 0.293 E<br />
Hardee 8973 Mosaic Fertilizer LLC A470 G 0.068 0.094 0.094 E<br />
M/E 5<br />
Page | 174
<strong>2011</strong> ESTIMATED WATER USE REPORT<br />
Table A7. Metered and <strong>Estimated</strong> Agricultural WUPs, Withdrawals and Permitted <strong>Use</strong> (mgd), <strong>2011</strong><br />
County<br />
WUP<br />
Number<br />
Permittee<br />
<strong>Use</strong><br />
Code 1<br />
Source 2<br />
Annual<br />
Average<br />
Pumpage 3<br />
Total<br />
Permitted<br />
Annual<br />
Average<br />
Quantity<br />
Permitted<br />
Quantity<br />
Attributed<br />
to AG <strong>Use</strong><br />
Category 4<br />
Hardee 8991 Billy T & Joyce A Grace A415 G 0.01 0.017 0.017 E<br />
Hardee 8994 Larry M & Imogene Barwick A415 G 0.003 0.005 0.005 E<br />
Hardee 8995 William K & Candis J Davis A415 G 0.009 0.014 0.014 E<br />
Hardee 9008 Sunny South Packing Co A415 G 0.044 0.061 0.061 E<br />
Hardee 9041 Robert E Bobby E & Mattie G Buckley A415 G 0.012 0.02 0.02 E<br />
Hardee 9045 Dees & Trawick A415 G 0.014 0.023 0.023 E<br />
Hardee 9058 Crews Groves Inc A490 G 0.06 0.086 0.086 E<br />
Hardee 9061 Jmj Citrus LLC A415 G 0.01 0.017 0.017 E<br />
9064 Kenneth R Sanders III & Roberta G Sanders & Higdon A415<br />
0.017 0.027 0.027<br />
Hardee<br />
Enterpr Ltd<br />
G<br />
E<br />
Hardee 9067 Opal Knight A415 G 0.007 0.012 0.012 E<br />
Hardee 9070 Durrance Grove Ltd Partnership A415 G 0.01 0.017 0.017 E<br />
Hardee 9078 Guenter A and Maria Dill A415 G 0.003 0.004 0.004 E<br />
Hardee 9088 Martha L Martin A415 G 0.005 0.009 0.009 E<br />
Hardee 9091 Robert R Norris Inc A415 G 0.007 0.012 0.012 E<br />
Hardee 9094 Daniel H Smith A415 G 0.02 0.033 0.033 E<br />
Hardee 9103 Buford E & Sammie W Long A415 G 0.02 0.032 0.032 E<br />
Hardee 9158 Stevens Land & Citrus LLC A415 G 0.028 0.045 0.045 E<br />
Hardee 9161 Marion E Gill A415 G 0.008 0.014 0.014 E<br />
Hardee 9168 J Paul English A415 G 0.013 0.022 0.022 E<br />
Hardee 9172 Ray V & Alice J Grimes A415 G 0.008 0.013 0.013 E<br />
Hardee 9182 Elaine Mcfarland Cynthia Beatty L600 G 0.002 0.004 0.004 E<br />
Hardee 9196 John W Parker Jr Trustee Of The Declaration Trust A415 G 0.016 0.027 0.027 E<br />
Hardee 9203 Henry Crosby Jr A415 G 0.003 0.005 0.005 E<br />
Hardee 9218 Douglas Citrus A415 G 0.035 0.057 0.057 E<br />
Hardee 9243 Stella Repetosky A415 G 0.006 0.009 0.009 E<br />
Hardee 9244 J. R. Paul, Jr. Family Limited Partnership A415 G 0.023 0.038 0.038 E<br />
Hardee 9251 Susie K Paras L610 G 0 0.001 0.001 E<br />
Hardee 9264 Inti Inc A415 G 0.026 0.042 0.042 E<br />
Hardee 9273 Allen L. & Nancy L. Warnimont A490 G 0.013 0.021 0.021 E<br />
M/E 5<br />
<strong>Southwest</strong> <strong>Florida</strong> <strong>Water</strong> <strong>Management</strong> District<br />
Page | 175
<strong>2011</strong> ESTIMATED WATER USE REPORT<br />
Table A7. Metered and <strong>Estimated</strong> Agricultural WUPs, Withdrawals and Permitted <strong>Use</strong> (mgd), <strong>2011</strong><br />
County<br />
WUP<br />
Number<br />
<strong>Southwest</strong> <strong>Florida</strong> <strong>Water</strong> <strong>Management</strong> District<br />
Permittee<br />
<strong>Use</strong><br />
Code 1<br />
Source 2<br />
Annual<br />
Average<br />
Pumpage 3<br />
Total<br />
Permitted<br />
Annual<br />
Average<br />
Quantity<br />
Permitted<br />
Quantity<br />
Attributed<br />
to AG <strong>Use</strong><br />
Category 4<br />
9281 Michael & Lynda Wilkinson And C C & E Wilkinson And A415<br />
0.005 0.008 0.008<br />
Hardee<br />
Judson & *<br />
G<br />
E<br />
Hardee 9293 Robert C Crews II A415 G 0.018 0.059 0.059 E<br />
Hardee 9295 Bernadette Albritton A415 G 0.01 0.017 0.017 E<br />
Hardee 9296 Elliot A Roberts A415 G 0.01 0.016 0.016 E<br />
Hardee 9298 Martin And Karen McKenna A415 G 0.012 0.019 0.019 E<br />
Hardee 9301 Willard Kelly Jr & Elizabeth A Durrance A415 G 0.01 0.016 0.016 E<br />
Hardee 9308 Wendell And Annette Cole A415 G 0.012 0.02 0.02 E<br />
Hardee 9317 Roy F & Maxine D Albritton A415 G 0.006 0.01 0.01 E<br />
Hardee 9327 Mrs E S Prescott A415 G 0.006 0.009 0.009 E<br />
Hardee 9332 Opal Knight A415 G 0.005 0.008 0.008 E<br />
9343 The Groves Of Peace River LLC & Martin J & Patrick T A415<br />
0.041 0.067 0.067<br />
Hardee<br />
McKenna<br />
G<br />
E<br />
9345 A Kurian & M Kurian & U Varghese & A Ulahannan & G A415<br />
0.013 0.021 0.021<br />
Hardee<br />
Peter & Y Pet<br />
G<br />
E<br />
Hardee 9363 Mineral Branch Ranch LLC A415 G 0.035 0.062 0.062 E<br />
Hardee 9366 William, Wayne, And Illa Jean Jernigan A415 G 0.013 0.022 0.022 E<br />
Hardee 9389 Lois E. Brown, Trustee A415 G 0 0.024 0.024 E<br />
Hardee 9416 Causey Land Trust A415 G 0.01 0.017 0.017 E<br />
9428 Walter & Sharon McCrary As Trust Of The McCrary Joint A415<br />
0.007 0.012 0.012<br />
Hardee<br />
Tr 1/7/200<br />
G<br />
E<br />
Hardee 9440 Ma‐King Oranges Inc A415 G 0.022 0.036 0.036 E<br />
Hardee 9442 Avanti Groves LLC A415 G 0.018 0.03 0.03 E<br />
Hardee 9464 James A And Pamela P Neff A415 G 0.018 0.03 0.03 E<br />
Hardee 9468 Khaldon F & Basil OHallah A415 G 0.01 0.016 0.016 E<br />
Hardee 9509 Dennis R & Mitzi H Powell A415 G 0.007 0.011 0.011 E<br />
Hardee 9520 Burley Groves Inc A415 G 0.01 0.016 0.016 E<br />
Hardee 9521 William W & Sarah P Wiggins Jr A415 G 0.008 0.013 0.013 E<br />
Hardee 9522 Vasta Elizabeth Hall Wood A415 G 0.015 0.024 0.024 E<br />
Hardee 9523 W Royce Tyson A415 G 0.01 0.016 0.016 E<br />
Hardee 9538 Security Groves Inc. A415 G 0.013 0.021 0.021 E<br />
M/E 5<br />
Page | 176
<strong>2011</strong> ESTIMATED WATER USE REPORT<br />
Table A7. Metered and <strong>Estimated</strong> Agricultural WUPs, Withdrawals and Permitted <strong>Use</strong> (mgd), <strong>2011</strong><br />
County<br />
WUP<br />
Number<br />
Permittee<br />
<strong>Use</strong><br />
Code 1<br />
Source 2<br />
Annual<br />
Average<br />
Pumpage 3<br />
Total<br />
Permitted<br />
Annual<br />
Average<br />
Quantity<br />
Permitted<br />
Quantity<br />
Attributed<br />
to AG <strong>Use</strong><br />
Category 4<br />
Hardee 9547 E H Blackmon Irrev. Tr & JB & JH Beckley, Jr. L610 G 0 0.001 0.001 E<br />
Hardee 9559 Wesley & Yvonne Redding A480 G 0.017 0.028 0.028 E<br />
Hardee 9573 Ironrock, LLC A415 G 0 0.02 0.02 E<br />
Hardee 9575 Courtney Earl Toole Revocable Trust A415 G 0.008 0.012 0.012 E<br />
Hardee 9616 Crews Groves Inc A415 G 0.015 0.025 0.025 E<br />
Hardee 9632 Ruby P Howze A415 G 0 0.006 0.006 E<br />
9642 Martha Carlton & Carlton Taylor And Michelle L<br />
A415<br />
0.008 0.013 0.013<br />
G<br />
Hardee<br />
Burtscher<br />
E<br />
Hardee 9659 Virginia & James Carlton A415 G 0.022 0.036 0.036 E<br />
Hardee 9663 Loren Albritton & Deborah Barker A415 G 0.003 0.005 0.005 E<br />
Hardee 9677 Malcolm S and Julie Farr A415 G 0.02 0.033 0.033 E<br />
9690 Crewsville Sweetwater Property Owners' Association, A415<br />
0.047 0.065 0.065<br />
G<br />
Hardee<br />
Inc.<br />
E<br />
Hardee 9708 Kenneth Thompson A415 G 0.012 0.02 0.02 E<br />
9711 William H Jr & Linda D Albritton & Circle 5 Bar Ranch A490<br />
0.029 0.079 0.079<br />
G<br />
Hardee<br />
Inc<br />
E<br />
Hardee 9721 Ken Sanders III A415 G 0 0.013 0.013 E<br />
Hardee 9743 Robert Charles & Robin Elaine Abbott A415 G 0.009 0.015 0.015 E<br />
Hardee 9744 Charles Abbott & Josephine Abbott As Tr Of Rev Trusts A415 G 0.007 0.011 0.011 E<br />
Hardee 9756 George M & Vicki L Parnell A415 G 0.014 0.023 0.023 E<br />
Hardee 9762 Barnes G & Lavada R Smith A415 G 0.006 0.009 0.009 E<br />
Hardee 9777 Groves of Peace River Inc A415 G 0.018 0.03 0.03 E<br />
Hardee 9809 Charles J & Josephine Abbott Trustees A415 G 0.038 0.052 0.052 E<br />
Hardee 9810 Robert, Robin, Michael, Charles J. and Josephine Abbott A415 G 0.023 0.037 0.037 E<br />
Hardee 9829 J Jim & Shirley Holmes A415 G 0.007 0.012 0.012 E<br />
Hardee 9838 Mosaic Fertilizer LLC A415 G 0.008 0.014 0.014 E<br />
Hardee 9850 Bentley Snyder A415 G 0.053 0.074 0.074 E<br />
Hardee 9858 Danny Skitka L600 G 0 0.001 0.001 E<br />
Hardee 9881 Rafter C Ranch Inc A415 G 0.005 0.008 0.008 E<br />
Hardee 9890 Verna T. Whitfield Crews as Trustee A415 G 0.026 0.043 0.043 E<br />
Hardee 9923 Carol Waller W‐6 Ranch A415 G 0 0.137 0.137 E<br />
M/E 5<br />
<strong>Southwest</strong> <strong>Florida</strong> <strong>Water</strong> <strong>Management</strong> District<br />
Page | 177
<strong>2011</strong> ESTIMATED WATER USE REPORT<br />
Table A7. Metered and <strong>Estimated</strong> Agricultural WUPs, Withdrawals and Permitted <strong>Use</strong> (mgd), <strong>2011</strong><br />
County<br />
WUP<br />
Number<br />
<strong>Southwest</strong> <strong>Florida</strong> <strong>Water</strong> <strong>Management</strong> District<br />
Permittee<br />
<strong>Use</strong><br />
Code 1<br />
Source 2<br />
Annual<br />
Average<br />
Pumpage 3<br />
Total<br />
Permitted<br />
Annual<br />
Average<br />
Quantity<br />
Permitted<br />
Quantity<br />
Attributed<br />
to AG <strong>Use</strong><br />
Category 4<br />
Hardee 9959 Janeth W. & Basil J. Bodenmiller A415 G 0.024 0.04 0.04 E<br />
Hardee 9965 Wilbur E Robertson A490 G 0.015 0.025 0.025 E<br />
Hardee 9979 Edna Stephens & Carolyn Conerly as Trustees A470 G 0.056 0.077 0.077 E<br />
Hardee 9982 Velva L. Deters, Trustee A415 G 0.006 0.009 0.009 E<br />
Hardee 9983 Myles E. Albritton Sr.; Myles E. Jr. and Anitia Albritton A415 G 0.014 0.024 0.024 E<br />
Hardee 9984 Roscoe Hilliard A415 G 0.01 0.016 0.016 E<br />
Hardee 9987 William H Jr & Pamela H Lovett A480 G 0.184 0.29 0.29 E<br />
Hardee 9990 Allan J Ludwig A470 G 0.095 0.313 0.313 E<br />
Hardee 10013 Carol Stone A415 G 0.025 0.042 0.042 E<br />
10022 Foster Family Trust ‐ Keith & Kenneth Foster &<br />
A415<br />
0.004 0.007 0.007<br />
Hardee<br />
Kimberly McGinnes<br />
G<br />
E<br />
Hardee 10030 Marovich Brothers LLC. A415 G 0.008 0.014 0.014 E<br />
Hardee 10048 Doyle E. Carlton, III, LLC A415 G 0.012 0.02 0.02 E<br />
Hardee 10049 Limestone Ranch LLC A415 G 0.008 0.014 0.014 E<br />
Hardee 10097 J W Crews A415 G 0.019 0.031 0.031 E<br />
10118 Gayle Gibbs Graham Trustee of Gayle Gibbs Graham A415<br />
0.008 0.014 0.014<br />
Hardee<br />
Rvcble Trust<br />
G<br />
E<br />
Hardee 10119 3N Groves LLP A415 G 0.017 0.028 0.028 E<br />
Hardee 10138 Willard K Durrance A415 G 0.004 0.007 0.007 E<br />
Hardee 10189 Charles J. Abbott and Josephine E. Abbott, Trustees A415 G 0 0.013 0.013 E<br />
Hardee 10213 F L Revell Jr A415 G 0 0.009 0.009 E<br />
Hardee 10232 Causey Land Trust A415 G 0.01 0.016 0.016 E<br />
Hardee 10242 Gail Rogers‐Smith A415 G 0.016 0.025 0.025 E<br />
10314 Causey John H Jr & Gough Gem C as Trustees of Causey A415<br />
0.01 0.016 0.016<br />
Hardee<br />
Land Trust<br />
G<br />
E<br />
Hardee 10335 Edith E Pettis A415 G 0.005 0.009 0.009 E<br />
Hardee 10348 Linda DeVane A415 G 0.003 0.004 0.004 E<br />
Hardee 10352 Philip & Sonya Rasmussen A415 G 0.01 0.016 0.016 E<br />
Hardee 10360 Kord Eugene Robertson A415 G 0.003 0.016 0.016 E<br />
Hardee 10369 Julie Paul Obney A415 G 0.015 0.024 0.024 E<br />
Hardee 10377 E L Davis Jr A415 G 0.041 0.068 0.068 E<br />
M/E 5<br />
Page | 178
<strong>2011</strong> ESTIMATED WATER USE REPORT<br />
Table A7. Metered and <strong>Estimated</strong> Agricultural WUPs, Withdrawals and Permitted <strong>Use</strong> (mgd), <strong>2011</strong><br />
County<br />
WUP<br />
Number<br />
<strong>Southwest</strong> <strong>Florida</strong> <strong>Water</strong> <strong>Management</strong> District<br />
Permittee<br />
<strong>Use</strong><br />
Code 1<br />
Source 2<br />
Annual<br />
Average<br />
Pumpage 3<br />
Total<br />
Permitted<br />
Annual<br />
Average<br />
Quantity<br />
Permitted<br />
Quantity<br />
Attributed<br />
to AG <strong>Use</strong><br />
Category 4<br />
Hardee 10391 Estate Of Mary Beeson Craig A415 G 0.005 0.008 0.008 E<br />
Hardee 10427 Courtney Earl Toole A415 G 0.013 0.021 0.021 E<br />
Hardee 10460 Theo & Christina Bryant A415 G 0.014 0.047 0.047 E<br />
Hardee 10473 W Kelly Jr & Elizabeth F Durrance A415 G 0.02 0.032 0.032 E<br />
10507 Patricia C Grimsley As Tstee Of P C Grimisley Rev Trust A415<br />
0.018 0.029 0.029<br />
Hardee<br />
9‐27/95<br />
G<br />
E<br />
Hardee 10509 Citrus Pact Inc A415 G 0 0.013 0.013 E<br />
Hardee 10560 Crews Groves Inc A490 G 0.135 0.244 0.244 E<br />
Hardee 10578 Mark V. McLean & Others as Trustees A415 G 0.009 0.015 0.015 E<br />
Hardee 10617 T & G Groves Inc A415 G 0.017 0.039 0.039 E<br />
Hardee 10644 The Carlton Group Jason Carlton A415 G 0.018 0.029 0.029 E<br />
Hardee 10648 Rogelio L & Carol S Carranco A415 G 0.011 0.017 0.017 E<br />
Hardee 10653 Old Glory Properties LLC A415 G 0 0.007 0.007 E<br />
Hardee 10667 Paul Mislevy as Trustee A415 G 0.007 0.012 0.012 E<br />
10689 Opal S Knight A Life Est & Carol K Stone & Martha K A415<br />
0.01 0.016 0.016<br />
Hardee<br />
Tyson<br />
G<br />
E<br />
Hardee 10701 Heartland Properties LLC A <strong>Florida</strong> Limited Liability Co A415 G 0.021 0.034 0.034 E<br />
Hardee 10710 WD <strong>Water</strong>s ET AL Trustees A56S G 0.177 0.32 0.32 E<br />
Hardee 10716 W D Parker, Trustee A415 G 0.007 0.011 0.011 E<br />
Hardee 10717 Adolf Margarete & Holger Buettner A415 G 0.007 0.012 0.012 E<br />
Hardee 10747 John C Barnett A415 G 0.005 0.008 0.008 E<br />
Hardee 10748 Theo & Christina Bryant A415 G 0.016 0.026 0.026 E<br />
Hardee 10765 F L Revell Jr A415 G 0 0.108 0.108 E<br />
Hardee 10798 A & S Grove A415 G 0 0.008 0.008 E<br />
Hardee 10814 Edward S Schontag Jr A415 G 0.017 0.028 0.028 E<br />
Hardee 10832 Peter Goldstein A415 G 0.014 0.023 0.023 E<br />
Hardee 10846 Marilyn Jean Durrance A415 G 0.02 0.033 0.033 E<br />
Hardee 10850 Webster B Geiger A415 G 0.01 0.016 0.016 E<br />
Hardee 10856 Stephen J & Leslie B Cantu A415 G 0.009 0.015 0.015 E<br />
Hardee 10940 Hardee Association For Retarded Citizens Inc A480 G 0.008 0.026 0.026 E<br />
Hardee 10984 David S & Elsona A Henderson A415 G 0.005 0.008 0.008 E<br />
M/E 5<br />
Page | 179
<strong>2011</strong> ESTIMATED WATER USE REPORT<br />
Table A7. Metered and <strong>Estimated</strong> Agricultural WUPs, Withdrawals and Permitted <strong>Use</strong> (mgd), <strong>2011</strong><br />
County<br />
WUP<br />
Number<br />
<strong>Southwest</strong> <strong>Florida</strong> <strong>Water</strong> <strong>Management</strong> District<br />
Permittee<br />
<strong>Use</strong><br />
Code 1<br />
Source 2<br />
Annual<br />
Average<br />
Pumpage 3<br />
Total<br />
Permitted<br />
Annual<br />
Average<br />
Quantity<br />
Permitted<br />
Quantity<br />
Attributed<br />
to AG <strong>Use</strong><br />
Category 4<br />
Hardee 10987 Philip H Parmelee & A George & Shirley J Fowler A415 G 0.01 0.016 0.016 E<br />
Hardee 11027 J A Clark III & Linda G Clark A415 G 0.019 0.031 0.031 E<br />
Hardee 11041 Paul & Annette P Mislevy A415 G 0.046 0.065 0.065 E<br />
Hardee 11052 LILY MN GROVE, LLC A415 G 0.02 0.033 0.033 E<br />
Hardee 11083 Charles M & Patricia C Grimsley A415 G 0.02 0.032 0.032 E<br />
Hardee 11117 Franklin D & Nadine P Albritton A415 G 0.025 0.041 0.041 E<br />
Hardee 11126 Ken Sanders III A415 G 0.014 0.023 0.023 E<br />
Hardee 11144 Pty Holding Co A485 G 0 0.065 0.065 E<br />
Hardee 11154 Albert Ray & Lea D Douglas A415 G 0 0.014 0.014 E<br />
Hardee 11162 Va‐Thai & Sy Vang Lo A56S G 0.143 0.259 0.259 E<br />
Hardee 11192 Roberta Beattie A415 G 0.009 0.015 0.015 E<br />
Hardee 11196 Joe L Davis Sr A415 G 0.01 0.016 0.016 E<br />
Hardee 11199 Paul & Annette P Mislevy A415 G 0.041 0.061 0.061 E<br />
Hardee 11208 Norman D Mallory Jr And Sara M Foreman A470 G 0 0.431 0.431 E<br />
Hardee 11213 Doshia M Pierce Intervivos A415 G 0.008 0.014 0.014 E<br />
Hardee 11225 Rowland & Helga Shackelford A415 G 0.011 0.017 0.017 E<br />
Hardee 11227 Herbert & Zona Waldron A415 G 0.01 0.017 0.017 E<br />
Hardee 11271 Tami J Saunders A410 G 0.007 0.012 0.012 E<br />
Hardee 11276 Robert J & Robert H Barben A415 G 0.016 0.027 0.027 E<br />
Hardee 11299 Greg C & Karla Jean Gilliard A485 G 0.009 0.014 0.014 E<br />
Hardee 11309 Ten‐Fold Talents Llc Robert A Krause A415 G 0.005 0.008 0.008 E<br />
Hardee 11328 Roy F Albritton A415 G 0.004 0.023 0.023 E<br />
Hardee 11330 Deonarain & Mohinee Gobardhan A415 G 0.018 0.029 0.029 E<br />
Hardee 11380 Harold Edward & Joyce M McClelland Jr A415 G 0.043 0.06 0.06 E<br />
Hardee 11392 Roy Brown Pe A415 G 0.03 0.049 0.049 E<br />
Hardee 11430 G Perry Mason III & Amanda Mason A415 G 0.03 0.049 0.049 E<br />
Hardee 11460 Hardee Co Industrial Dev Auth A415 G 0.01 0.016 0.016 E<br />
Hardee 11466 Joseph R & Melinda K Albritton A415 G 0.005 0.008 0.008 E<br />
Hardee 11478 H Shawn Pollard & Zenybie Pollard A415 G 0.009 0.015 0.015 E<br />
Hardee 11493 Maurice Ballard A490 G 0.026 0.042 0.042 E<br />
Hardee 11496 John H & Sandra K Shivers A415 G 0.005 0.008 0.008 E<br />
M/E 5<br />
Page | 180
<strong>2011</strong> ESTIMATED WATER USE REPORT<br />
Table A7. Metered and <strong>Estimated</strong> Agricultural WUPs, Withdrawals and Permitted <strong>Use</strong> (mgd), <strong>2011</strong><br />
County<br />
WUP<br />
Number<br />
<strong>Southwest</strong> <strong>Florida</strong> <strong>Water</strong> <strong>Management</strong> District<br />
Permittee<br />
<strong>Use</strong><br />
Code 1<br />
Source 2<br />
Annual<br />
Average<br />
Pumpage 3<br />
Total<br />
Permitted<br />
Annual<br />
Average<br />
Quantity<br />
Permitted<br />
Quantity<br />
Attributed<br />
to AG <strong>Use</strong><br />
Category 4<br />
Hardee 11517 J H Hancock Credit Trust SUSAnne Clemons Trustee A415 G 0.039 0.054 0.054 E<br />
Hardee 11522 Betty Jo Altman A415 G 0.019 0.032 0.032 E<br />
Hardee 11554 Robin Orban A495 G 0.001 0.042 0.042 E<br />
Hardee 11561 John Beck A415 G 0.048 0.067 0.067 E<br />
Hardee 11572 Elmer E White Jr & Gary Delatorre A415 G 0.018 0.029 0.029 E<br />
11587 Walter S Farr‐Walter S Farr Trst & Carol M Farr‐Carol A415<br />
0.023 0.037 0.037<br />
Hardee<br />
Farr Trst<br />
G<br />
E<br />
Hardee 11594 JJ & E Grove Inc A415 G 0.004 0.006 0.006 E<br />
Hardee 11607 Gilliard Groves Inc A415 G 0.01 0.017 0.017 E<br />
Hardee 11683 Orie Lee Trustee Of Ashton Trust A415 G 0.011 0.018 0.018 E<br />
Hardee 11703 John Bruce Klein A415 G 0.024 0.039 0.039 E<br />
Hardee 11727 Guenther Dill A415 G 0.024 0.04 0.04 E<br />
Hardee 11785 T & T Cattle & Grove A415 G 0.025 0.041 0.041 E<br />
Hardee 11790 Jack D Soles Inc A415 G 0.009 0.015 0.015 E<br />
Hardee 11800 WN Nicholson Cargill Fertilizer Inc A415 G 0.021 0.034 0.034 E<br />
Hardee 11806 Stephen J Cantu & Leslie B Cantu L600 G 0.001 0.001 0.001 E<br />
Hardee 11820 <strong>Florida</strong> Citrus International Dev LC A415 G 0.046 0.064 0.064 E<br />
Hardee 11821 Larry Davis Inc A415 G 0.056 0.077 0.077 E<br />
Hardee 11822 William D Wilkerson Sr & Patricia H Wilkerson A415 G 0.014 0.023 0.023 E<br />
Hardee 11835 Citra Lee Partnership A415 G 0.008 0.013 0.013 E<br />
Hardee 11846 Knights Certified Organics Inc A57F G 0.038 0.053 0.053 E<br />
Hardee 11860 Jimmie L & Lorraine M Smith A655 G 0.022 0.036 0.036 E<br />
Hardee 11862 Burton D & Mary Jane McLeod A415 G 0.01 0.016 0.016 E<br />
Hardee 11869 Heart Groves Inc A415 G 0.043 0.059 0.059 E<br />
Hardee 11883 Harvill Groves Ltd A415 G 0.006 0.01 0.01 E<br />
11887 Aurelia A McKinney Family Ltd. Partner. Rev. Living Tr. L610<br />
0 0.001 0.001<br />
Hardee<br />
10/22/91<br />
G<br />
E<br />
Hardee 11889 Ronald O Sevigny Trustee Of The A415 G 0.005 0.009 0.009 E<br />
Hardee 11892 Roscoe Hilliard A415 G 0.004 0.007 0.007 E<br />
Hardee 11893 Gary W & Regina Blackman A415 G 0.016 0.026 0.026 E<br />
Hardee 11896 Theo Bryant A415 G 0 0.053 0.053 E<br />
M/E 5<br />
Page | 181
<strong>2011</strong> ESTIMATED WATER USE REPORT<br />
Table A7. Metered and <strong>Estimated</strong> Agricultural WUPs, Withdrawals and Permitted <strong>Use</strong> (mgd), <strong>2011</strong><br />
County<br />
WUP<br />
Number<br />
<strong>Southwest</strong> <strong>Florida</strong> <strong>Water</strong> <strong>Management</strong> District<br />
Permittee<br />
<strong>Use</strong><br />
Code 1<br />
Source 2<br />
Annual<br />
Average<br />
Pumpage 3<br />
Total<br />
Permitted<br />
Annual<br />
Average<br />
Quantity<br />
Permitted<br />
Quantity<br />
Attributed<br />
to AG <strong>Use</strong><br />
Category 4<br />
Hardee 11914 Agri‐Citrus LLC A415 G 0.009 0.015 0.015 E<br />
Hardee 11925 Ino & Gloria Velazquez A490 G 0.009 0.015 0.015 E<br />
Hardee 11932 M & K Roberts & C & P Roberts & E Roberts A415 G 0.005 0.008 0.008 E<br />
Hardee 11957 Gary T Henderson A415 G 0 0.01 0.01 E<br />
Hardee 11958 Gilbert A & Magdalena Polk A415 G 0.008 0.013 0.013 E<br />
Hardee 11964 Wayne Rickert A415 G 0.023 0.037 0.037 E<br />
Hardee 11965 Clark C & Betty J Pearson A470 G 0.044 0.061 0.061 E<br />
11978 Peter & Kathleen Marovich Jr As An Estate With<br />
A415<br />
0.012 0.02 0.02<br />
Hardee<br />
Survivorship<br />
G<br />
E<br />
Hardee 11999 Robert And Robin Abbott A415 G 0.014 0.023 0.023 E<br />
Hardee 12015 Milton Flint A490 G 0.021 0.034 0.034 E<br />
Hardee 12069 Clay R & Gloria Ann Shrum Sr A415 G 0.018 0.029 0.029 E<br />
Hardee 12095 F L Revell & Oneita C Revell A415 G 0.02 0.065 0.065 E<br />
Hardee 12113 Durrance Grove Ltd Partnership A415 G 0.001 0.034 0.034 E<br />
Hardee 12143 James V See Jr & Linda C See A535 G 0.009 0.016 0.016 E<br />
Hardee 12185 Mosaic Fertilizer LLC A56S G 0 0.433 0.433 E<br />
Hardee 12200 Glen R and Freida M Bowen & Bow‐Tie Farms, Inc. A415 G 0.051 0.071 0.071 E<br />
Hardee 12201 Kea‐Bo Ranch, Inc.; William B. & Alice L. Keating A490 G 0.034 0.056 0.056 E<br />
Hardee 12224 Roy F. and Maxine D. Albritton A415 G 0.01 0.016 0.016 E<br />
Hardee 12244 Winston M Smith & Linda B Smith A415 G 0.025 0.04 0.04 E<br />
Hardee 12267 John C. & Tracy T. Baxter, ET AL A415 G 0.014 0.023 0.023 E<br />
Hardee 12270 Jaime Figueroa A520 G 0 0.009 0.009 E<br />
Hardee 12271 Roy & Wendy H Petteway A415 G 0.007 0.011 0.011 E<br />
Hardee 12282 Tortuga LLC A415 G 0.009 0.015 0.015 E<br />
Hardee 12308 Helena Chemical Company A415 G 0.008 0.013 0.013 E<br />
Hardee 12324 Richard E & Teresa Brandeberry A415 G 0.013 0.022 0.022 E<br />
Hardee 12371 Old Glory Properties LLC A415 G 0.01 0.016 0.016 E<br />
Hardee 12381 Melba & Roger Van Neece A415 S 0.011 0.018 0.018 E<br />
Hardee 12382 Wauchula Land Group LLC A415 G 0.001 0.017 0.017 E<br />
Hardee 12393 Winston M & Linda B Smith A415 G 0.021 0.035 0.035 E<br />
Hardee 12395 Charles E & Gail D Best A490 G 0.026 0.042 0.042 E<br />
M/E 5<br />
Page | 182
<strong>2011</strong> ESTIMATED WATER USE REPORT<br />
Table A7. Metered and <strong>Estimated</strong> Agricultural WUPs, Withdrawals and Permitted <strong>Use</strong> (mgd), <strong>2011</strong><br />
County<br />
WUP<br />
Number<br />
<strong>Southwest</strong> <strong>Florida</strong> <strong>Water</strong> <strong>Management</strong> District<br />
Permittee<br />
<strong>Use</strong><br />
Code 1<br />
Source 2<br />
Annual<br />
Average<br />
Pumpage 3<br />
Total<br />
Permitted<br />
Annual<br />
Average<br />
Quantity<br />
Permitted<br />
Quantity<br />
Attributed<br />
to AG <strong>Use</strong><br />
Category 4<br />
Hardee 12407 Randy S & Stacy A Crews A415 G 0.003 0.004 0.004 E<br />
Hardee 12410 Has‐Ben Groves A415 G 0.019 0.031 0.031 E<br />
Hardee 12455 Ro Len Properties Enterprises Inc A415 G 0.045 0.062 0.062 E<br />
Hardee 12479 Robert W Burnett Jr & Gail S Burnett A535 G 0.016 0.027 0.027 E<br />
Hardee 12529 South <strong>Florida</strong> Community College A415 G 0.02 0.035 0.032 E<br />
Hardee 12534 Daryl J & Willene Parks A56S G 0.063 0.088 0.088 E<br />
Hardee 12563 William R Monies II A415 G 0 0.032 0.032 E<br />
Hardee 12564 V C Hollingsworth Jr & III A415 G 0.027 0.044 0.044 E<br />
Hardee 12646 Donnis A & Kathleen A Barber A470 G 0.272 0.493 0.493 E<br />
Hardee 12735 Anthony C Lee A415 G 0.022 0.036 0.036 E<br />
Hardee 12780 Julia Hanusch A415 G 0.034 0.055 0.055 E<br />
Hardee 12781 3c Enterprises A415 G 0.03 0.049 0.049 E<br />
Hardee 12783 James L Estes Jr A490 G 0.053 0.074 0.074 E<br />
Hardee 12882 J A Clark III A415 G 0.059 0.082 0.082 E<br />
Hardee 12887 Alan Talmadge & Teresa Jean Hall A535 G 0.013 0.021 0.021 E<br />
Hardee 12889 Joseph J & Patricia M Froehlich A415 G 0.02 0.032 0.032 E<br />
Hardee 12928 Nicholson Grove Service Inc A415 G 0.011 0.031 0.031 E<br />
Hardee 12942 Jean D Hancock & Pioneer Grove Inc A415 G 0.02 0.034 0.034 E<br />
Hardee 12958 Brian D & Mary Lou Hoopingarner A415 G 0 0.025 0.025 E<br />
Hardee 12959 Connie Frazier & Terri Conley A415 G 0.024 0.039 0.039 E<br />
Hardee 12961 Guenter Marianne & Mathias Dill A415 G 0.006 0.01 0.01 E<br />
Hardee 12979 Wendell M & Wilma C Smith A415 G 0.012 0.02 0.02 E<br />
Hardee 12987 Juan Sr & Luciana Lopez A56S G 0.071 0.099 0.099 E<br />
Hardee 13003 Brian K Powell A415 G 0.009 0.016 0.016 E<br />
Hardee 13031 Burton Cattle Co A415 G 0.011 0.019 0.019 E<br />
Hardee 13033 Robert A & SUSAn M Krause A415 G 0.01 0.016 0.016 E<br />
Hardee 13056 Fernando&Juan&Jose L&Porfirio Castanon A415 G 0.005 0.008 0.008 E<br />
Hardee 13065 Irdia Raj & Angela Desai A415 G 0.001 0.002 0.002 E<br />
Hardee 13066 Charles E & Gail D Best A651 G 0.004 0.007 0.007 E<br />
Hardee 13070 T & G Partnership A415 G 0.008 0.012 0.012 E<br />
Hardee 13074 L G Clark A415 G 0.014 0.024 0.024 E<br />
M/E 5<br />
Page | 183
<strong>2011</strong> ESTIMATED WATER USE REPORT<br />
Table A7. Metered and <strong>Estimated</strong> Agricultural WUPs, Withdrawals and Permitted <strong>Use</strong> (mgd), <strong>2011</strong><br />
County<br />
WUP<br />
Number<br />
<strong>Southwest</strong> <strong>Florida</strong> <strong>Water</strong> <strong>Management</strong> District<br />
Permittee<br />
<strong>Use</strong><br />
Code 1<br />
Source 2<br />
Annual<br />
Average<br />
Pumpage 3<br />
Total<br />
Permitted<br />
Annual<br />
Average<br />
Quantity<br />
Permitted<br />
Quantity<br />
Attributed<br />
to AG <strong>Use</strong><br />
Category 4<br />
Hardee 13091 B & L Citrus Inc A44S G 0.005 0.008 0.008 E<br />
Hardee 13094 Milton L & Kim S Roberts A415 G 0.005 0.008 0.008 E<br />
Hardee 13117 George Chinatomby A415 G 0.018 0.029 0.029 E<br />
Hardee 13133 Charles Gerenis A415 G 0.01 0.016 0.016 E<br />
13134 Walter S & Carol M Farr‐Trustees Walter S Farr‐<br />
A415<br />
0.01 0.017 0.017<br />
Hardee<br />
Malcolm Farr‐Et A<br />
G<br />
E<br />
Hardee 13149 Ronald A & Linda K Laye A415 G 0.042 0.068 0.068 E<br />
Hardee 13150 Winston M & Linda B Smith A415 G 0.01 0.017 0.017 E<br />
Hardee 13152 Causey Land Trust A415 G 0.042 0.058 0.058 E<br />
Hardee 13161 Andrew Pace A415 G 0.033 0.054 0.054 E<br />
Hardee 13181 Robert C & Robin E Abbott A415 G 0.041 0.057 0.057 E<br />
Hardee 13194 Jerry Sr & Kathryn Melendy A470 G 0.051 0.071 0.071 E<br />
Hardee 13195 Milton L & Kim S Roberts A415 G 0.005 0.008 0.008 E<br />
13230 Erwin Hoefling & Edward Schontag Stine Family<br />
A415<br />
0.047 0.065 0.065<br />
Hardee<br />
Partnership Ltd<br />
G<br />
E<br />
Hardee 13231 M.Roberts & K.Roberts & C.Robert A415 G 0.012 0.02 0.02 E<br />
Hardee 13241 Orange & Blue Groves, Inc. A415 G 0.011 0.019 0.019 E<br />
13251 Roland L Skipper Trustee Under Agreement Dated June A415<br />
0.01 0.017 0.017<br />
Hardee<br />
14 1991<br />
G<br />
E<br />
Hardee 13256 Adam L & Keli Bunch A415 G 0.015 0.04 0.04 E<br />
Hardee 13259 Robert T Kenney Jr & Nicole Kenney A415 G 0.02 0.033 0.033 E<br />
13268 Arthur Womack As Trustee Of The Womack Family Tr A415<br />
0.05 0.069 0.069<br />
Hardee<br />
Dated 11/23/93<br />
G<br />
E<br />
Hardee 13275 Roy & Wendy H Petteway A415 G 0.026 0.042 0.042 E<br />
Hardee 13278 Durrance Groves Limited Partnership A415 G 0.01 0.016 0.016 E<br />
Hardee 13309 R R Smith Inc A455 G 0.005 0.017 0.017 E<br />
Hardee 13310 J Ned & Tammy J Hancock A415 G 0.024 0.039 0.039 E<br />
Hardee 13313 Phc Holdings LLC A415 G 0.01 0.016 0.016 E<br />
Hardee 13318 Gerald Lemar & Joy Annette A415 G 0.01 0.016 0.016 E<br />
Hardee 13319 John H Causey Jr & Gem C Gough As Trustees A415 G 0.026 0.043 0.043 E<br />
Hardee 13329 Farr Groves LLC A415 G 0.017 0.047 0.047 E<br />
M/E 5<br />
Page | 184
<strong>2011</strong> ESTIMATED WATER USE REPORT<br />
Table A7. Metered and <strong>Estimated</strong> Agricultural WUPs, Withdrawals and Permitted <strong>Use</strong> (mgd), <strong>2011</strong><br />
County<br />
WUP<br />
Number<br />
Permittee<br />
<strong>Use</strong><br />
Code 1<br />
Source 2<br />
Annual<br />
Average<br />
Pumpage 3<br />
Total<br />
Permitted<br />
Annual<br />
Average<br />
Quantity<br />
Permitted<br />
Quantity<br />
Attributed<br />
to AG <strong>Use</strong><br />
Category 4<br />
Hardee 13332 James A & Pamela J Timmons A480 G 0.017 0.028 0.028 E<br />
Hardee 13373 Live Oak Ventures LLC A415 G 0.019 0.031 0.031 E<br />
Hardee 20016 Rhcp Land Trust‐Frank E. Menke I II As Trustee A415 G 0.046 0.064 0.064 E<br />
Hardee 20099 Edward & Steven Schontag A415 G 0.048 0.067 0.067 E<br />
Hardee 20153 Keller Ranch Inc A470 G 0.067 0.093 0.093 E<br />
Hardee 20154 Hazel T Farwell A470 G 0.072 0.1 0.1 E<br />
Hardee 20209 Windmill Farms Nurseries Inc A480 G 0.001 0.056 0.056 E<br />
Hardee 20232 Ballantyne Groves, Inc. A415 G 0 E<br />
23.285 Metered, mgd<br />
Hardee County Totals<br />
14.604 <strong>Estimated</strong> , mgd<br />
37.889 Total, mgd<br />
Hernando 12203 Finest Farms Inc A485 G 0.031 0.148 0.148 M<br />
Hernando 214 <strong>Florida</strong> Crushed Stone Ranch L610 G 0.001 0.002 0.002 E<br />
Hernando 259 Eva Lou Medard Sterling House Apt 107 A415 G 0.063 0.088 0.088 E<br />
Hernando 850 George Alvarez L615 G 0.038 0.136 0.136 E<br />
Hernando 859 James & Barbara Lasseter Jr A415 G 0.014 0.022 0.022 E<br />
Hernando 967 Hickory Hills Land Company, ATTN: Robert Thomas A415 G 0.05 0.069 0.069 E<br />
Hernando 1009 Harold P Bruce A415 G 0.014 0.022 0.022 E<br />
Hernando 1609 V.J. Robinett L610 G 0 0.001 0.001 E<br />
Hernando 1643 L M Hawes Family Partnership L625 G 0 0 0 E<br />
Hernando 1967 Alfred A. Mckethan A415 G 0.062 0.113 0.113 E<br />
Hernando 1975 John C & Ruth W Bierley L600 G 0.001 0.001 0.001 E<br />
Hernando 2677 Hernando Groves Inc A415 G 0.039 0.054 0.054 E<br />
Hernando 2678 E S Mackenzie A415 G 0.042 0.058 0.058 E<br />
Hernando 2679 Marshall Crum And Max Crum A485 G 0.055 0.076 0.076 E<br />
Hernando 2836 United States Dept Of Agriculture L600 G 0.01 0.021 0.021 E<br />
Hernando 2882 Smith Family Llc & Tbf Partners Ltd A490 G 0.088 0.121 0.121 E<br />
Hernando 3376 Evans Properties Inc A415 G 0.089 0.123 0.123 E<br />
Hernando 3416 NRCS ‐ Brooksville Plant Materials Center A520 G 0.019 0.032 0.032 E<br />
Hernando 3993 Evans Properties Inc L600 G 0 0.001 0.001 E<br />
M/E 5<br />
<strong>Southwest</strong> <strong>Florida</strong> <strong>Water</strong> <strong>Management</strong> District<br />
Page | 185
<strong>2011</strong> ESTIMATED WATER USE REPORT<br />
Table A7. Metered and <strong>Estimated</strong> Agricultural WUPs, Withdrawals and Permitted <strong>Use</strong> (mgd), <strong>2011</strong><br />
County<br />
WUP<br />
Number<br />
<strong>Southwest</strong> <strong>Florida</strong> <strong>Water</strong> <strong>Management</strong> District<br />
Permittee<br />
<strong>Use</strong><br />
Code 1<br />
Source 2<br />
Annual<br />
Average<br />
Pumpage 3<br />
Total<br />
Permitted<br />
Annual<br />
Average<br />
Quantity<br />
Permitted<br />
Quantity<br />
Attributed<br />
to AG <strong>Use</strong><br />
Category 4<br />
Hernando 4139 Aam Family Ltd Partnership A415 G 0.042 0.059 0.059 E<br />
Hernando 4142 Jack Melton Family Inc A415 G 0.02 0.033 0.033 E<br />
Hernando 4231 Maryann B Stein A410 G 0.071 0.117 0.117 E<br />
Hernando 4231 Maryann B Stein A410 S 0 0.117 0.117 E<br />
Hernando 4325 Milk‐A‐Way Farms Inc L610 G 0.001 0.001 0.001 E<br />
Hernando 4490 Donald Mattingly & Spring Lake Grove Limited A485 G 0.145 0.2 0.2 E<br />
Hernando 4944 Aich & Aich Inc A415 G 0.024 0.039 0.039 E<br />
Hernando 4962 Aam Family Ltd Partnership A415 G 0.042 0.058 0.058 E<br />
Hernando 4997 Catherine C Mills A490 G 0.008 0.013 0.013 E<br />
Hernando 5205 Allison Ray L635 G 0 0 0 E<br />
Hernando 5266 Kalman W Pila L600 G 0 0.001 0.001 E<br />
Hernando 5833 George Alvarez A490 G 0.013 0.021 0.021 E<br />
Hernando 5939 Mark S & Linda S Barry A415 G 0.022 0.036 0.036 E<br />
Hernando 6110 Judith Ann Edwards & Barry Lynch As Co‐Trustees A415 G 0.023 0.037 0.037 E<br />
Hernando 6302 Avalon Development LLC L625 G 0 0.085 0 E<br />
Hernando 6797 S A Williams Trust A495 G 0.18 0.326 0.326 E<br />
Hernando 6956 Mark A. & Alice R. Mackinlay A410 G 0 0.001 0.001 E<br />
Hernando 6966 Larry W & Ruth A Davis A410 G 0.018 0.029 0.029 E<br />
Hernando 7018 Maryann Stein A410 G 0.041 0.057 0.057 E<br />
Hernando 7048 William Mason And Brenda Shawver A495 G 0.039 0.055 0.055 E<br />
Hernando 8060 Stewarts Tree Service Inc A485 G 0.052 0.116 0.116 E<br />
Hernando 8308 Richard F & Irene G Quirk A445 G 0.002 0.004 0.004 E<br />
Hernando 8337 James B. Williams A56S G 0.002 0.262 0.262 E<br />
Hernando 8453 Hernando Egg Producers Inc L650 G 0.024 0.041 0.04 E<br />
Hernando 8595 Fred J‐Betty G‐Randall H & Beverly G Snell A415 G 0.014 0.023 0.023 E<br />
Hernando 8725 John L Ayers Estate L610 G 0.002 0.004 0.004 E<br />
Hernando 9080 Evans Properties Inc L600 G 0.001 0.001 0.001 E<br />
Hernando 9444 Coy Viars A480 G 0.015 0.025 0.025 E<br />
Hernando 9531 Jack Melton Family Inc A415 G 0.039 0.063 0.063 E<br />
Hernando 9698 La Hacienda Del Cielo LLC A415 G 0.062 0.113 0.113 E<br />
Hernando 10493 Lykes Springhill Foundation Inc. L600 G 0 0.002 0 E<br />
M/E 5<br />
Page | 186
<strong>2011</strong> ESTIMATED WATER USE REPORT<br />
Table A7. Metered and <strong>Estimated</strong> Agricultural WUPs, Withdrawals and Permitted <strong>Use</strong> (mgd), <strong>2011</strong><br />
County<br />
WUP<br />
Number<br />
Permittee<br />
<strong>Use</strong><br />
Code 1<br />
Source 2<br />
Annual<br />
Average<br />
Pumpage 3<br />
Total<br />
Permitted<br />
Annual<br />
Average<br />
Quantity<br />
Permitted<br />
Quantity<br />
Attributed<br />
to AG <strong>Use</strong><br />
Category 4<br />
Hernando 10797 T K Hatten Dairy Inc L620 G 0.069 0.101 0.101 E<br />
Hernando 12146 Edwin E. and Barbara A. Harbour A415 G 0.006 0.009 0.009 E<br />
12208 Board Of Trst'S Improv'T Tst Fnd Fdep‐Div Of Rec & A652<br />
0.023 0.038 0.038<br />
Hernando<br />
Parks Bureau<br />
G<br />
E<br />
Hernando 12289 George & Joan Casey A410 G 0.043 0.06 0.06 E<br />
Hernando 12427 Joseph M Diventi & Valerie S Devine A415 G 0.01 0.017 0.017 E<br />
Hernando 12625 Daniel J Ebbecke III A410 G 0.005 0.024 0.024 E<br />
Hernando 12815 Milk A Way Farms Inc L600 G 0 0.001 0.001 E<br />
Hernando 12841 Anthony J & Margo L Murchio A410 G 0.013 0.022 0.022 E<br />
Hernando 12864 Daniel & SUSAn Ebbecke A410 G 0 0.037 0.037 E<br />
Hernando 12864 Daniel & SUSAn Ebbecke A410 S 0 0.037 0.037 E<br />
Hernando 12891 Enrique And Rosa Capote A480 G 0.027 0.048 0.048 E<br />
13100 Laurence W & Ruth A Davis & Brooksville Baptist A410<br />
0.009 0.015 0.015<br />
G<br />
Hernando<br />
Church<br />
E<br />
Hernando 13205 Lillian Reyes A410 G 0 0.073 0.073 E<br />
Hernando 20043 Joanne and Vance Wilder A410 G 0 0.02 0.02 E<br />
Hernando 20177 Dipti and Himanshu Patel A415 G 0.008 0.012 0.012 E<br />
Hernando 20178 Finest Farms Inc A550 G 0 0.056 0.056 E<br />
Hernando 20188 Bell Groves LLC A415 G 0.026 0.043 0.043 E<br />
Hernando 20189 Bell Fruit LLC A415 G 0.017 0.028 0.028 E<br />
Hernando 20216 Hickory Hills LLC A415 G 0 0.085 0.085 E<br />
Hernando 20223 Hunnicutt Farms LLC A455 G 0.001 0.067 0.067 E<br />
Hernando 20242 COWGIRL COMPANY I LLC A495 G 0 0.19 0.19 E<br />
0.031 Metered, mgd<br />
Hernando County Totals<br />
1.744 <strong>Estimated</strong> , mgd<br />
1.775 Total, mgd<br />
Highlands 3736 Feit <strong>Management</strong> A415 G 0.061 0.234 0.234 M<br />
Highlands 4075 Ward Family Ltd Partnership A415 G 0.211 0.307 0.307 M<br />
Highlands 4086 Cargill Juice North America Inc A415 G 0.001 0.439 0.051 M<br />
Highlands 4162 Macbeth Associates Ltd A415 G 0.108 0.084 0.084 M<br />
M/E 5<br />
<strong>Southwest</strong> <strong>Florida</strong> <strong>Water</strong> <strong>Management</strong> District<br />
Page | 187
<strong>2011</strong> ESTIMATED WATER USE REPORT<br />
Table A7. Metered and <strong>Estimated</strong> Agricultural WUPs, Withdrawals and Permitted <strong>Use</strong> (mgd), <strong>2011</strong><br />
County<br />
WUP<br />
Number<br />
<strong>Southwest</strong> <strong>Florida</strong> <strong>Water</strong> <strong>Management</strong> District<br />
Permittee<br />
<strong>Use</strong><br />
Code 1<br />
Source 2<br />
Annual<br />
Average<br />
Pumpage 3<br />
Total<br />
Permitted<br />
Annual<br />
Average<br />
Quantity<br />
Permitted<br />
Quantity<br />
Attributed<br />
to AG <strong>Use</strong><br />
Category 4<br />
Highlands 4219 S.Y. Hartt & Son, Inc. A415 G 1.373 1.297 1.297 M<br />
Highlands 4230 Peace Valley Groves Inc A415 G 0.109 0.098 0.098 M<br />
Highlands 4251 Gapway Groves A415 G 0.217 0.185 0.185 M<br />
Highlands 4253 Gapway Groves A415 G 0.227 0.225 0.225 M<br />
Highlands 4288 C Elton Crews Family LP LLLP A415 G 0.076 0.096 0.096 M<br />
Highlands 4393 Orange Creek Groves Inc A415 G 0.259 0.289 0.289 M<br />
Highlands 4527 John L Beck Trustee & Lou‐Beth A415 G 0.117 0.143 0.143 M<br />
Highlands 4557 Saxon Groves Inc Dba Reflections on Silver Lake A415 G 0.043 0.260 0.260 M<br />
Highlands 4557 Saxon Groves Inc Dba Reflections on Silver Lake A415 S 0.076 0.260 0.260 M<br />
Highlands 4677 Ben Hill Griffin, Inc. A415 G 0.073 0.106 0.106 M<br />
Highlands 4678 Ben Hill Griffin, Inc. A415 G 0.078 0.119 0.119 M<br />
Highlands 4679 Ben Hill Griffin, Inc. A415 G 1.364 1.593 1.593 M<br />
Highlands 4680 Ben Hill Griffin, Inc. A415 G 0.998 1.596 1.596 M<br />
Highlands 4681 Ben Hill Griffin, Inc. A415 G 0.076 0.104 0.104 M<br />
Highlands 4685 Ben Hill Griffin, Inc. A415 G 0.313 0.425 0.425 M<br />
Highlands 4746 Sebring Development Partners LLC A415 G 0.000 0.096 0.096 M<br />
Highlands 4896 Bonnet Lake Partnership A415 G 0.460 0.833 0.833 M<br />
Highlands 4941 Benjamin & Mala M Hinton A415 G 0.000 0.114 0.114 M<br />
Highlands 4941 Benjamin & Mala M Hinton A415 S 0.038 0.114 0.114 M<br />
Highlands 5009 Oak Groves Inc & John‐Edward & SUSAn Smoak A415 G 0.059 0.130 0.130 M<br />
Highlands 5073 H Earl & J. Thomas Crutchfield A415 G 0.202 0.195 0.195 M<br />
Highlands 5170 Dasher Groves Inc A415 G 0.000 0.139 0.139 M<br />
Highlands 5178 Lost Lake Groves, Inc. A415 S 0.634 0.464 0.464 M<br />
Highlands 5182 Charles L Reynolds A415 G 0.114 0.214 0.214 M<br />
Highlands 5232 C Elton Crews Family LP LLLP A415 G 0.088 0.107 0.107 M<br />
Highlands 5290 OC Farms, Inc. A415 G 0.359 0.196 0.196 M<br />
Highlands 5291 Davis Enterprises Inc A415 G 0.354 0.272 0.272 M<br />
Highlands 5292 Crutchfield Groves, Inc. A415 G 0.109 0.147 0.147 M<br />
Highlands 5293 Gary W & Regina Blackman A415 S 0.009 0.098 0.098 M<br />
Highlands 5322 Harshman Holdings Inc A415 G 0.066 0.153 0.153 M<br />
Highlands 5330 Priscilla S Seims Trustee Deed Stephen D Seims Trustee A490 G 0.119 0.185 0.185 M<br />
M/E 5<br />
Page | 188
<strong>2011</strong> ESTIMATED WATER USE REPORT<br />
Table A7. Metered and <strong>Estimated</strong> Agricultural WUPs, Withdrawals and Permitted <strong>Use</strong> (mgd), <strong>2011</strong><br />
County<br />
WUP<br />
Number<br />
<strong>Southwest</strong> <strong>Florida</strong> <strong>Water</strong> <strong>Management</strong> District<br />
Permittee<br />
<strong>Use</strong><br />
Code 1<br />
Source 2<br />
Annual<br />
Average<br />
Pumpage 3<br />
Total<br />
Permitted<br />
Annual<br />
Average<br />
Quantity<br />
Permitted<br />
Quantity<br />
Attributed<br />
to AG <strong>Use</strong><br />
Category 4<br />
Highlands 5337 Crutchfield Groves, Inc. A415 G 0.095 0.140 0.140 M<br />
Highlands 5354 Crutchfield Groves, Inc. A415 G 0.054 0.090 0.090 M<br />
Highlands 5445 Joe L Davis Jr A415 G 0.116 0.090 0.090 M<br />
Highlands 5464 C Elton Crews Family Limited A415 G 0.170 0.147 0.147 M<br />
Highlands 5516 Wabasso Road Dairy Inc & L C Dairy Inc A486 G 0.359 1.585 1.585 M<br />
Highlands 5522<br />
Crews Groves Inc & C Elton Crews Family Limited<br />
Partnership LLLP<br />
A415 G 0.281 0.224 0.224 M<br />
Highlands 5535 J W Yonce & Sons Farms Inc A415 G 0.137 0.300 0.300 M<br />
Highlands 5537 Joseph Macbeth A415 G 0.260 0.386 0.386 M<br />
Highlands 5563 Karen McKenna, Alton Rogers & JW Crews Jr A415 G 0.156 0.196 0.196 M<br />
Highlands 5566 Crews Groves Inc A415 G 0.143 0.139 0.139 M<br />
Highlands 5574 Joe L Davis Jr & Joe L Davis Sr A415 G 0.134 0.096 0.096 M<br />
Highlands 5583<br />
C Elton Crews Family Limited Partnership LLLP & Rl<br />
Padget Trust<br />
A415 G 0.192 0.231 0.231 M<br />
Highlands 5626 Robert J Barben Inc A415 G 0.574 0.459 0.459 M<br />
Highlands 5627 Robert H Barben, Robert J Barben Inc A415 G 0.320 0.468 0.468 M<br />
Highlands 5628 Running W Citrus Limited Partnership A415 G 0.074 0.100 0.100 M<br />
Highlands 5630 Macbeth Associates Ltd A415 G 0.084 0.107 0.107 M<br />
Highlands 5638 Running W Citrus Limited Partnership A415 G 1.062 1.756 1.756 M<br />
Highlands 5639 Latt Maxcy Corp. A415 G 0.448 0.731 0.731 M<br />
Highlands 5676 7l Lake Placid LLC A415 G 2.245 2.483 2.483 M<br />
Highlands 5719 W F Ward Residual Trust A415 G 0.130 0.285 0.285 M<br />
Highlands 5878 Charles & Anne D Reynolds Jr A415 S 0.086 0.107 0.107 M<br />
Highlands 5905 Perry Brothers A415 G 0.128 0.174 0.174 M<br />
Highlands 5906 Smoak Groves Inc A415 G 0.163 0.248 0.248 M<br />
Highlands 5920 Pioneer Grove Inc A415 G 0.615 0.266 0.266 M<br />
Highlands 5999 Malcolm C Jr & Joyce F Watters A415 S 0.062 0.100 0.100 M<br />
Highlands 6000 Lake Placid Groves 93 LLC A415 G 0.044 0.118 0.118 M<br />
Highlands 6031 Lake Placid Groves LLC A415 G 1.722 1.900 1.900 M<br />
Highlands 6147 Grady Smoak Groves Inc A415 G 0.066 0.162 0.162 M<br />
Highlands 6154 John F & Edward L Smoak‐Etal A415 G 0.113 0.160 0.160 M<br />
M/E 5<br />
Page | 189
<strong>2011</strong> ESTIMATED WATER USE REPORT<br />
Table A7. Metered and <strong>Estimated</strong> Agricultural WUPs, Withdrawals and Permitted <strong>Use</strong> (mgd), <strong>2011</strong><br />
County<br />
WUP<br />
Number<br />
<strong>Southwest</strong> <strong>Florida</strong> <strong>Water</strong> <strong>Management</strong> District<br />
Permittee<br />
<strong>Use</strong><br />
Code 1<br />
Source 2<br />
Annual<br />
Average<br />
Pumpage 3<br />
Total<br />
Permitted<br />
Annual<br />
Average<br />
Quantity<br />
Permitted<br />
Quantity<br />
Attributed<br />
to AG <strong>Use</strong><br />
Category 4<br />
Highlands 6162 Cow Slough Inc A415 G 0.419 0.472 0.472 M<br />
Highlands 6163 Smoak Groves Inc A415 G 0.239 0.322 0.322 M<br />
Highlands 6165 Smoak Groves Inc A415 G 0.200 0.243 0.243 M<br />
Highlands 6166 Smoak Groves Inc A415 G 0.192 0.217 0.217 M<br />
Highlands 6167 Edward L Smoak Revocable Trust A415 G 0.098 0.166 0.166 M<br />
Highlands 6169 J R Paul Properties Inc A415 G 0.031 0.080 0.080 M<br />
Highlands 6172 Bears Den Groves Inc A415 G 0.088 0.078 0.078 M<br />
Highlands 6172 Bears Den Groves Inc A415 S 0.000 0.078 0.078 M<br />
Highlands 6173 Thelma C Raley Inc A415 G 0.103 0.106 0.106 M<br />
Highlands 6173 Thelma C Raley Inc A415 S 0.000 0.106 0.106 M<br />
Highlands 6176 Smoak Groves Inc A415 G 0.280 0.315 0.315 M<br />
Highlands 6179 Grigsby Prop Llc & Alan Grigsby Trust of J E Grigsby Tst A415 G 0.242 0.225 0.225 M<br />
Highlands 6179 Grigsby Prop Llc & Alan Grigsby Trust of J E Grigsby Tst A415 S 0.000 0.225 0.225 M<br />
Highlands 6189 George P. Jr. & Marilyn S. Mason A415 G 0.134 0.117 0.117 M<br />
Highlands 6197 Turner Groves Citrus Limited Partnership A415 G 0.985 5.191 5.191 M<br />
Highlands 6197 Turner Groves Citrus Limited Partnership A415 S 2.810 5.191 5.191 M<br />
Highlands 6211 Ben Hill Griffin, Inc. A415 G 0.176 0.258 0.258 M<br />
Highlands 6234 Heartland National Bank A415 G 0.000 0.095 0.095 M<br />
Highlands 6320 Davis Enterprises Inc A415 G 0.332 0.297 0.297 M<br />
Highlands 6409 Perry Cattle LLC A415 G 0.175 0.198 0.198 M<br />
Highlands 6516 Carl Wilburn A415 G 0.110 0.198 0.198 M<br />
Highlands 6827 Lake Placid Groves LLC A415 G 0.050 0.236 0.236 M<br />
Highlands 7111 Griffin Family Ltd Partnership A415 G 0.118 0.173 0.173 M<br />
Highlands 7485 Denco Inc A415 G 0.000 0.269 0.269 M<br />
Highlands 7515 South <strong>Florida</strong> Sod Inc A525 G 0.000 0.496 0.496 M<br />
Highlands 7540<br />
Board Of Tst Internal Imp Trust Fund Of The State Of<br />
<strong>Florida</strong><br />
A415 G 0.225 0.306 0.306 M<br />
Highlands 7580 CLP Citrus Inc & Sebring Citrus Ranch LLC A415 G 0.293 0.469 0.469 M<br />
Highlands 7623 Santa Rosa Ranch Inc A525 G 0.000 0.496 0.496 M<br />
Highlands 7682 G Perry Mason III & Amanda Mason A415 G 0.105 0.139 0.139 M<br />
Highlands 8268 Crutchfield Groves, Inc. A415 G 0.105 0.130 0.130 M<br />
M/E 5<br />
Page | 190
<strong>2011</strong> ESTIMATED WATER USE REPORT<br />
Table A7. Metered and <strong>Estimated</strong> Agricultural WUPs, Withdrawals and Permitted <strong>Use</strong> (mgd), <strong>2011</strong><br />
County<br />
WUP<br />
Number<br />
<strong>Southwest</strong> <strong>Florida</strong> <strong>Water</strong> <strong>Management</strong> District<br />
Permittee<br />
<strong>Use</strong><br />
Code 1<br />
Source 2<br />
Annual<br />
Average<br />
Pumpage 3<br />
Total<br />
Permitted<br />
Annual<br />
Average<br />
Quantity<br />
Permitted<br />
Quantity<br />
Attributed<br />
to AG <strong>Use</strong><br />
Category 4<br />
Highlands 8298 Hidden Acres Nursery Inc A480 G 0.013 0.205 0.205 M<br />
Highlands 8298 Hidden Acres Nursery Inc A480 S 0.023 0.205 0.205 M<br />
Highlands 8394 Glenn O Murphy Partnership Ltd A415 G 0.128 0.173 0.173 M<br />
Highlands 8442 Tauchens Triangle T Ranch Inc A415 S 0.479 0.881 0.881 M<br />
Highlands 8557 L & C Groves Inc A415 G 0.003 0.068 0.068 M<br />
Highlands 8930 Albritton & Sons Ltd A490 G 0.000 0.394 0.394 M<br />
Highlands 8957 Dressel Groves A415 G 0.125 0.201 0.201 M<br />
Highlands 9124 Westby Corp A480 G 0.409 0.483 0.483 M<br />
Highlands 9167 Bob Paul Inc A415 G 0.203 0.193 0.193 M<br />
Highlands 9174 Crews & Davis A415 G 0.238 0.223 0.223 M<br />
Highlands 9211 Buddy Rogers A415 G 0.000 0.123 0.123 M<br />
Highlands 9302 Lake Placid Groves LLC A415 G 1.662 2.006 2.006 M<br />
Highlands 9380 J W Yonce & Sons Farms Inc A415 G 0.048 0.102 0.102 M<br />
Highlands 9627 Hauptmann & Thompson Company Inc A415 G 0.099 0.192 0.192 M<br />
Highlands 9710 Thelma C Raley Inc A415 G 0.103 0.188 0.188 M<br />
Highlands 10027 South <strong>Florida</strong> Sod Inc A525 G 0.003 0.409 0.409 M<br />
Highlands 10078 Bob Paul Inc A415 G 0.126 0.310 0.310 M<br />
Highlands 10628 Crews Land & Development Corp & Crews Groves Inc A415 G 0.071 0.098 0.098 M<br />
Highlands 11077 David McKenzie A415 G 0.076 0.118 0.118 M<br />
Highlands 11089 DP Partners Ltd & PGP Partners Ltd A415 G 0.084 0.186 0.186 M<br />
Highlands 11379 J Ned & Tammy J Hancock A415 G 0.170 0.119 0.119 M<br />
Highlands 11461<br />
Terry Reynolds & Barbara Bullard & Reynolds<br />
Properties<br />
A415 G 0.117 0.189 0.189 M<br />
Highlands 11652 Smoak Groves Inc A415 G 0.069 0.101 0.101 M<br />
Highlands 11724 Grigsby Properties LLC A415 G 0.172 0.124 0.124 M<br />
Highlands 11766 Michael E. & Arlene A. Brown A490 G 0.000 0.243 0.243 M<br />
Highlands 12025 Peter Goldstein A415 G 0.153 0.101 0.101 M<br />
Highlands 12737 Bear Pointe LLC A415 G 0.000 0.126 0.126 M<br />
Highlands 13258 Smoak Groves Inc A415 G 0.256 0.425 0.425 M<br />
Highlands 20054 Black Bear Citrus, LLC A415 G 0.228 0.205 0.205 M<br />
Highlands 20097 Robert Barben & Santa Rosa Ranch A410 G 0.051 0.084 0.084 M<br />
M/E 5<br />
Page | 191
<strong>2011</strong> ESTIMATED WATER USE REPORT<br />
Table A7. Metered and <strong>Estimated</strong> Agricultural WUPs, Withdrawals and Permitted <strong>Use</strong> (mgd), <strong>2011</strong><br />
County<br />
WUP<br />
Number<br />
<strong>Southwest</strong> <strong>Florida</strong> <strong>Water</strong> <strong>Management</strong> District<br />
Permittee<br />
<strong>Use</strong><br />
Code 1<br />
Source 2<br />
Annual<br />
Average<br />
Pumpage 3<br />
Total<br />
Permitted<br />
Annual<br />
Average<br />
Quantity<br />
Permitted<br />
Quantity<br />
Attributed<br />
to AG <strong>Use</strong><br />
Category 4<br />
Highlands 20097 Robert Barben & Santa Rosa Ranch A410 S 0.000 0.084 0.084 M<br />
Highlands 3705 John H ONeal A415 G 0.015 0.025 0.025 E<br />
Highlands 3737 Davis Citrus <strong>Management</strong> Inc. A415 G 0.03 0.049 0.049 E<br />
Highlands 3748 South <strong>Florida</strong> Community College A415 G 0.002 0.058 0.007 E<br />
Highlands 3748 South <strong>Florida</strong> Community College A415 S 0 0.058 0.007 E<br />
Highlands 3768 John S Langford A415 G 0.015 0.024 0.024 E<br />
Highlands 4043 Suncrest Citrus Inc C/O Olson Grove Caretaking A415 G 0.038 0.053 0.053 E<br />
Highlands 4061 H Earl & J. Thomas Crutchfield A415 G 0.058 0.08 0.08 E<br />
Highlands 4062 Regina Blackman A415 G 0.016 0.025 0.025 E<br />
Highlands 4063 Crutchfield Groves, Inc. A415 G 0.025 0.04 0.04 E<br />
Highlands 4064 H Earl & J. Thomas Crutchfield A415 G 0.004 0.006 0.006 E<br />
Highlands 4066 Isis Groves Inc A415 G 0.015 0.024 0.024 E<br />
Highlands 4067 Raymond & Lena Tubbs A460 G 0.025 0.04 0.04 E<br />
Highlands 4068 Raymond & Lena Tubbs A700 G 0.011 0.019 0.019 E<br />
Highlands 4071 Crutchfield Groves, Inc. A415 G 0.026 0.042 0.042 E<br />
Highlands 4072 Jeffrey Strange A415 G 0.023 0.038 0.038 E<br />
Highlands 4077 Hollenberg Farms Inc A415 G 0.052 0.072 0.072 E<br />
Highlands 4081 John L & Donna B Whittington A415 G 0.009 0.014 0.014 E<br />
Highlands 4119 James L Livingston A415 G 0.034 0.051 0.051 E<br />
Highlands 4130 Sandy Gully Dairy Inc L615 G 0.056 0.091 0.091 E<br />
Highlands 4150 L C Smith Jr A415 G 0.05 0.07 0.07 E<br />
4151 Bank Of America Na J T Blackman Etc‐J O Blackman Tst A415<br />
0.008 0.013 0.013<br />
Highlands<br />
12/7/99<br />
G<br />
E<br />
Highlands 4160 Mac Vail Inc A415 G 0.008 0.013 0.013 E<br />
Highlands 4161 Macbeth Associates Ltd A415 G 0.011 0.018 0.018 E<br />
Highlands 4163 Macbeth Associates Ltd A415 G 0.015 0.025 0.025 E<br />
Highlands 4191 Thurston Realty Inc & Harshman Holdings Inc A415 G 0.036 0.05 0.05 E<br />
Highlands 4192 Hardy Groves Inc A415 G 0.015 0.024 0.024 E<br />
Highlands 4194 H Earl & J. Thomas Crutchfield A415 G 0 0.017 0.017 E<br />
Highlands 4198 Highlands County BOCC L600 G 0.001 0.033 0.002 E<br />
Highlands 4204 Charles J Wilson III & Alton D Rogers A415 G 0.022 0.036 0.036 E<br />
M/E 5<br />
Page | 192
<strong>2011</strong> ESTIMATED WATER USE REPORT<br />
Table A7. Metered and <strong>Estimated</strong> Agricultural WUPs, Withdrawals and Permitted <strong>Use</strong> (mgd), <strong>2011</strong><br />
County<br />
WUP<br />
Number<br />
<strong>Southwest</strong> <strong>Florida</strong> <strong>Water</strong> <strong>Management</strong> District<br />
Permittee<br />
<strong>Use</strong><br />
Code 1<br />
Source 2<br />
Annual<br />
Average<br />
Pumpage 3<br />
Total<br />
Permitted<br />
Annual<br />
Average<br />
Quantity<br />
Permitted<br />
Quantity<br />
Attributed<br />
to AG <strong>Use</strong><br />
Category 4<br />
Highlands 4220 William Hartt A415 G 0.016 0.027 0.027 E<br />
Highlands 4221 William Hartt A415 G 0.016 0.027 0.027 E<br />
Highlands 4222 Sanford P Hartt Trustee & Joan H Hartt Trustee A415 G 0.018 0.03 0.03 E<br />
Highlands 4223 William Hartt A415 G 0.039 0.053 0.053 E<br />
Highlands 4254 Gapway Groves A415 G 0.027 0.044 0.044 E<br />
Highlands 4284 A R Chapman & Stephens Groves Inc A415 G 0.111 0.201 0.201 E<br />
Highlands 4300 Diner Citrus and Cattle Company A415 G 0.055 0.1 0.1 E<br />
Highlands 4310 Richard J Brown Family Trust A415 G 0.009 0.028 0.028 E<br />
Highlands 4311 Ben Hill Griffin, Inc. A415 G 0.054 0.074 0.074 E<br />
Highlands 4324 Dinner Lake Grove LLC A415 G 0.02 0.033 0.033 E<br />
Highlands 4347 C Elton Crews Inc A415 G 0.044 0.06 0.06 E<br />
4475 Wesley C Fisher Trustee Of The Wesley C Fisher Trst & A415<br />
0.01 0.016 0.016<br />
Highlands<br />
Eric Cord<br />
G<br />
E<br />
Highlands 4509 Crutchfield Groves, Inc. A415 G 0.015 0.024 0.024 E<br />
Highlands 4510 The Hardy Family Partnership A415 G 0.008 0.013 0.013 E<br />
Highlands 4514 Tony T Y Chen A415 G 0.007 0.011 0.011 E<br />
Highlands 4596 Joe L Davis & Bryan H Belcher A415 G 0.011 0.017 0.017 E<br />
Highlands 4597 Joe L Davis & Bryan H Belcher A415 G 0 0.018 0.018 E<br />
Highlands 4598 Lubear Futures Parnership A415 G 0.011 0.017 0.017 E<br />
Highlands 4604 Avon Park Lake Estates LLC A415 G 0.071 0.098 0.098 E<br />
Highlands 4682 Ben Hill Griffin, Inc. A415 G 0.039 0.054 0.054 E<br />
Highlands 4686 Ben Hill Griffin, Inc. A415 G 0.029 0.048 0.048 E<br />
Highlands 4690 Emmett & Arost Groves c/o Lake Lynn Groves LLC A415 G 0 0.031 0.031 E<br />
Highlands 4691 Harshman Holdings Inc A415 G 0.014 0.023 0.023 E<br />
Highlands 4694 Anne D Reynolds A415 G 0.016 0.026 0.026 E<br />
Highlands 4696 Mary K Strenth A415 G 0 0.025 0.025 E<br />
Highlands 4855 Pressley‐Davis Inc A415 G 0.016 0.027 0.027 E<br />
Highlands 4889 The Great Fruit Company Inc A415 G 0.007 0.012 0.012 E<br />
Highlands 4895 Davis Enterprises Inc A415 G 0.015 0.024 0.024 E<br />
Highlands 4903 Verna Macbeth Tr of The Joseph 0 Macbeth Family Trst A415 G 0.015 0.024 0.024 E<br />
Highlands 4916 EMW Associates LLC A415 S 0.06 0.083 0.083 E<br />
M/E 5<br />
Page | 193
<strong>2011</strong> ESTIMATED WATER USE REPORT<br />
Table A7. Metered and <strong>Estimated</strong> Agricultural WUPs, Withdrawals and Permitted <strong>Use</strong> (mgd), <strong>2011</strong><br />
County<br />
WUP<br />
Number<br />
<strong>Southwest</strong> <strong>Florida</strong> <strong>Water</strong> <strong>Management</strong> District<br />
Permittee<br />
<strong>Use</strong><br />
Code 1<br />
Source 2<br />
Annual<br />
Average<br />
Pumpage 3<br />
Total<br />
Permitted<br />
Annual<br />
Average<br />
Quantity<br />
Permitted<br />
Quantity<br />
Attributed<br />
to AG <strong>Use</strong><br />
Category 4<br />
Highlands 4917 Bob Paul Inc A415 G 0.012 0.025 0.025 E<br />
Highlands 4917 Bob Paul Inc A415 S 0.003 0.025 0.025 E<br />
Highlands 4918 McKay Fuss & Alderman Inc A415 G 0.028 0.045 0.045 E<br />
Highlands 4920 John H & Lois A & Michael C McKracken A415 G 0.036 0.05 0.05 E<br />
Highlands 4922 Crutchfield Groves, Inc. A415 G 0.043 0.06 0.06 E<br />
Highlands 4971 Martin J & Karen N McKenna A415 G 0 0.025 0.025 E<br />
Highlands 4983 Gary W Blackman & John F Drew A415 G 0.02 0.033 0.033 E<br />
Highlands 5023 C R & C J Schumacher & L S Koch Co‐Tst A415 G 0.021 0.034 0.034 E<br />
Highlands 5031 Thurston Realty Inc & Me Stephens IV A415 G 0.008 0.013 0.013 E<br />
Highlands 5068 Crutchfield Groves, Inc. A415 G 0.046 0.063 0.063 E<br />
Highlands 5069 Emery Etter, Jr. A415 G 0.008 0.013 0.013 E<br />
Highlands 5070 Thomas M & Marjorie R Wohl Tst Of T M Wohl Tst A415 G 0.051 0.071 0.071 E<br />
Highlands 5071 Joe L & Patricia M Davis Trust A415 G 0.014 0.023 0.023 E<br />
Highlands 5072 Withers & Harshman Inc A415 G 0.008 0.012 0.012 E<br />
Highlands 5077 Davis Enterprises Inc And Joe L Davis Sr A415 G 0.031 0.05 0.05 E<br />
Highlands 5080 Ben Hill Griffin, Inc. A415 G 0.022 0.036 0.036 E<br />
Highlands 5168 Loyd F & Juanita W Todd A415 G 0.016 0.026 0.026 E<br />
Highlands 5172 Smoak Groves Inc A415 G 0.015 0.024 0.024 E<br />
Highlands 5177 Crutchfield Groves, Inc. A415 G 0.03 0.048 0.048 E<br />
Highlands 5273 Zamin Investments LLC A415 G 0.215 0.388 0.388 E<br />
Highlands 5289 Sandy Ridge Groves, Inc A415 G 0.016 0.026 0.026 E<br />
Highlands 5320 James L & Barbara D Livingston A415 G 0.038 0.053 0.053 E<br />
Highlands 5323 Schu Inc A415 G 0.026 0.043 0.043 E<br />
Highlands 5324 Sandy Ridge Groves, Inc A415 G 0.015 0.025 0.025 E<br />
Highlands 5331 Polston Partnership A415 G 0.016 0.026 0.026 E<br />
Highlands 5339 H Earl & J. Thomas Crutchfield A415 G 0.051 0.071 0.071 E<br />
Highlands 5340 H Earl & J. Thomas Crutchfield A415 G 0.006 0.011 0.011 E<br />
Highlands 5342 H Earl & J. Thomas Crutchfield A415 G 0.045 0.074 0.074 E<br />
Highlands 5344 H Earl & J. Thomas Crutchfield A415 G 0.028 0.045 0.045 E<br />
Highlands 5345 Crutchfield & Sons Inc A415 G 0.014 0.024 0.024 E<br />
Highlands 5346 Lo Bros Enterprises Inc A415 G 0.008 0.013 0.013 E<br />
M/E 5<br />
Page | 194
<strong>2011</strong> ESTIMATED WATER USE REPORT<br />
Table A7. Metered and <strong>Estimated</strong> Agricultural WUPs, Withdrawals and Permitted <strong>Use</strong> (mgd), <strong>2011</strong><br />
County<br />
WUP<br />
Number<br />
Permittee<br />
<strong>Use</strong><br />
Code 1<br />
Source 2<br />
Annual<br />
Average<br />
Pumpage 3<br />
Total<br />
Permitted<br />
Annual<br />
Average<br />
Quantity<br />
Permitted<br />
Quantity<br />
Attributed<br />
to AG <strong>Use</strong><br />
Category 4<br />
Highlands 5347 Crutchfield Groves, Inc. A415 G 0.008 0.013 0.013 E<br />
Highlands 5348 Crutchfield Groves, Inc. A415 G 0.011 0.019 0.019 E<br />
Highlands 5349 Crutchfield Groves, Inc. A415 G 0.015 0.024 0.024 E<br />
Highlands 5350 Crutchfield Groves, Inc. A415 G 0.043 0.07 0.07 E<br />
Highlands 5352 Crutchfield Groves, Inc. A415 G 0.009 0.014 0.014 E<br />
Highlands 5353 Crutchfield Groves, Inc. A415 G 0.016 0.026 0.026 E<br />
Highlands 5357 Crutchfield Groves, Inc. A415 G 0.015 0.024 0.024 E<br />
Highlands 5358 Crutchfield Groves, Inc. A415 G 0.016 0.026 0.026 E<br />
Highlands 5359 Crutchfield Groves, Inc. A415 G 0.052 0.072 0.072 E<br />
Highlands 5360 Crutchfield Groves, Inc. A415 G 0.014 0.023 0.023 E<br />
Highlands 5361 Crutchfield Groves, Inc. A415 G 0.024 0.04 0.04 E<br />
Highlands 5363 Royce Family Properties LLC A415 G 0.024 0.04 0.04 E<br />
Highlands 5365 H Earl & J. Thomas Crutchfield A415 G 0.046 0.064 0.064 E<br />
Highlands 5367 Robert K Heffner A415 G 0.005 0.009 0.009 E<br />
Highlands 5368 Crutchfield Groves, Inc. A415 G 0.034 0.055 0.055 E<br />
Highlands 5369 Crutchfield Groves, Inc. A415 G 0.007 0.012 0.012 E<br />
Highlands 5370 Henry Earl Crutchfield III & Crutchfield Groves Inc A415 G 0.012 0.019 0.019 E<br />
Highlands 5381 Betty Fruit Co Inc A415 G 0.015 0.024 0.024 E<br />
Highlands 5389 C R & C J Schumacher & L S Koch Co‐Tst A415 G 0.008 0.013 0.013 E<br />
Highlands 5390 John H & Lois A McCracken A485 G 0.05 0.069 0.069 E<br />
Highlands 5391 C R & C J Schumacher & L S Koch Co‐Tst A415 G 0.012 0.019 0.019 E<br />
Highlands 5392 John H & Lois A McCracken A415 G 0.016 0.025 0.025 E<br />
Highlands 5401 Michael D & James S & John P Drury C/O 3d Groves Inc A415 G 0.021 0.037 0.037 E<br />
Highlands 5401 Michael D & James S & John P Drury C/O 3d Groves Inc A415 S 0.002 0.037 0.037 E<br />
Highlands 5426 Margaret & Dale Jones A415 G 0.029 0.047 0.047 E<br />
Highlands 5435 Baml Inc A <strong>Florida</strong> Corp A415 G 0.016 0.025 0.025 E<br />
Highlands 5437 Baml Inc A <strong>Florida</strong> Corp A415 G 0.015 0.024 0.024 E<br />
Highlands 5438 Baxter G Troutman A415 G 0.027 0.045 0.045 E<br />
Highlands 5439 Thomas L Scala Jr A415 G 0.013 0.022 0.022 E<br />
Highlands 5504 C & L Land Co LLP A415 G 0.025 0.04 0.04 E<br />
Highlands 5521 Crews Groves Inc A415 G 0.048 0.067 0.067 E<br />
M/E 5<br />
<strong>Southwest</strong> <strong>Florida</strong> <strong>Water</strong> <strong>Management</strong> District<br />
Page | 195
<strong>2011</strong> ESTIMATED WATER USE REPORT<br />
Table A7. Metered and <strong>Estimated</strong> Agricultural WUPs, Withdrawals and Permitted <strong>Use</strong> (mgd), <strong>2011</strong><br />
County<br />
WUP<br />
Number<br />
<strong>Southwest</strong> <strong>Florida</strong> <strong>Water</strong> <strong>Management</strong> District<br />
Permittee<br />
<strong>Use</strong><br />
Code 1<br />
Source 2<br />
Annual<br />
Average<br />
Pumpage 3<br />
Total<br />
Permitted<br />
Annual<br />
Average<br />
Quantity<br />
Permitted<br />
Quantity<br />
Attributed<br />
to AG <strong>Use</strong><br />
Category 4<br />
Highlands 5536 James M & Jeri B Wohl A415 G 0.006 0.01 0.01 E<br />
Highlands 5538 Rocking Cross Ranch Inc. A415 G 0.023 0.037 0.037 E<br />
Highlands 5541 Wilson Groves Inc A415 G 0.008 0.013 0.013 E<br />
5542 Marvin Kahn As Trustee Of Resid Tst Under Lw&T Of L A415<br />
0.007 0.012 0.012<br />
Highlands<br />
& M Kahn<br />
G<br />
E<br />
Highlands 5562 C Elton Crews Family Limted A415 G 0.023 0.038 0.038 E<br />
5580 Norma D Crews Trustee Of The Norma D Crews Rev A415<br />
0.015 0.025 0.025<br />
Highlands<br />
Trust<br />
G<br />
E<br />
Highlands 5581 Robert C Crews II A415 G 0.016 0.026 0.026 E<br />
Highlands 5603 Avon Park Lake Estates LLC A415 G 0 0.026 0.026 E<br />
Highlands 5622 Hayward H & Carol A Davis A415 G 0.023 0.037 0.037 E<br />
Highlands 5625 Norman T & Estrellita B Gensolin A415 G 0.016 0.026 0.026 E<br />
Highlands 5631 Zamin Investments LLC A415 G 0.071 0.128 0.128 E<br />
Highlands 5647 Kenneth R Heiring A415 G 0.007 0.012 0.012 E<br />
Highlands 5650 H Earl & J. Thomas Crutchfield A480 G 0.003 0.005 0.005 E<br />
Highlands 5696 Hazel M Brannen A415 G 0 0.035 0.035 E<br />
Highlands 5712 Robert T. Keller A415 G 0.027 0.044 0.044 E<br />
Highlands 5720 Emmett & Arost Groves A415 G 0.057 0.103 0.103 E<br />
Highlands 5721 R H Lawhon Groves Inc A415 S 0.019 0.031 0.031 E<br />
Highlands 5722 Gerald R & Barbara L Wicker A415 G 0.008 0.013 0.013 E<br />
Highlands 5723 Lake Ridge Groves Inc A415 G 0.026 0.043 0.043 E<br />
Highlands 5724 Robert H Barben A415 G 0.007 0.012 0.012 E<br />
Highlands 5811 Betty Fruit Co Inc A415 G 0.023 0.038 0.038 E<br />
Highlands 5815 Charles J Wilson & Doreen M A415 G 0.016 0.026 0.026 E<br />
Highlands 5819 Mary B Gremp & Grace T Bryant A415 G 0.007 0.012 0.012 E<br />
Highlands 5825 Thomas C Lanfier A415 G 0.018 0.029 0.029 E<br />
Highlands 5832 Norman T & Estrellita B Gensolin A415 G 0.007 0.011 0.011 E<br />
Highlands 5852 J Reed Family LLC A415 G 0.011 0.018 0.018 E<br />
Highlands 5853 Hartland Community Land Trust A415 G 0.016 0.027 0.027 E<br />
Highlands 5879 Vinod & Tarlika Thakkar A415 G 0.03 0.049 0.049 E<br />
Highlands 5969 Gillie C & Melissa P Russell A415 G 0 0.037 0.037 E<br />
M/E 5<br />
Page | 196
<strong>2011</strong> ESTIMATED WATER USE REPORT<br />
Table A7. Metered and <strong>Estimated</strong> Agricultural WUPs, Withdrawals and Permitted <strong>Use</strong> (mgd), <strong>2011</strong><br />
County<br />
WUP<br />
Number<br />
<strong>Southwest</strong> <strong>Florida</strong> <strong>Water</strong> <strong>Management</strong> District<br />
Permittee<br />
<strong>Use</strong><br />
Code 1<br />
Source 2<br />
Annual<br />
Average<br />
Pumpage 3<br />
Total<br />
Permitted<br />
Annual<br />
Average<br />
Quantity<br />
Permitted<br />
Quantity<br />
Attributed<br />
to AG <strong>Use</strong><br />
Category 4<br />
Highlands 5974 WA Williams Citrus Nursery & Services Inc A415 G 0.016 0.025 0.025 E<br />
Highlands 5980 WAWilliams Citrus Nursery & Services Inc A415 G 0.015 0.024 0.024 E<br />
Highlands 5998 Lake Henry Groves 70 LLC A415 S 0.058 0.08 0.08 E<br />
Highlands 6146 Chain Of Lakes LLC A415 G 0.032 0.088 0.088 E<br />
Highlands 6146 Chain Of Lakes LLC A415 S 0.032 0.088 0.088 E<br />
Highlands 6153 Cow Slough Inc A415 S 0.046 0.063 0.063 E<br />
Highlands 6158 Wilson Groves Inc A415 S 0.047 0.065 0.065 E<br />
Highlands 6160 L D Smith Jr A415 G 0.065 0.09 0.09 E<br />
Highlands 6171 Wesley R & Viola S Prillwitz A415 G 0.038 0.053 0.053 E<br />
Highlands 6178 Smoak Brothers Inc A415 G 0.029 0.048 0.048 E<br />
Highlands 6181 Griffin Family Ltd Partnership A415 G 0.029 0.048 0.048 E<br />
Highlands 6187 Placid Acres Groves Inc A415 G 0.009 0.015 0.015 E<br />
Highlands 6226 George P & Marilyn S Mason Jr A415 G 0.018 0.029 0.029 E<br />
6330 Wesley & Viola Prillwitz Gregory Rodney & Phillip A415<br />
0.01 0.016 0.016<br />
Highlands<br />
Prillwitz<br />
G<br />
E<br />
Highlands 6374 Ben Hill Griffin, Inc. A415 G 0.043 0.06 0.06 E<br />
Highlands 6399 H & P Group LLC A415 G 0.038 0.053 0.053 E<br />
Highlands 6432 Double R Citrus Corp A415 G 0.05 0.07 0.07 E<br />
Highlands 6439 Godwin & Howard Groves A415 G 0.021 0.035 0.035 E<br />
Highlands 6466 Grigsby Properties LLC A415 G 0.057 0.079 0.079 E<br />
Highlands 6595 Gary & Kathy Rapp A415 G 0.031 0.05 0.05 E<br />
Highlands 6638 John L & Donna B Whittington A415 G 0.031 0.051 0.051 E<br />
Highlands 6658 Walter & Pamela Farr A415 G 0.022 0.036 0.036 E<br />
Highlands 6715 Emile Dekel A415 G 0.022 0.036 0.036 E<br />
Highlands 6734 Stephen Dudley Seims & Joan Priscilla Seims A415 G 0.008 0.013 0.013 E<br />
Highlands 6816 MBR Ventures I LLC A700 G 0.026 0.042 0.042 E<br />
Highlands 6828 Theodore & Marie Wynn Kuhl Tr & A415 G 0.016 0.026 0.026 E<br />
Highlands 6877 Malcolm C Watters Jr A415 G 0.041 0.057 0.057 E<br />
Highlands 6916 7l Lake Placid LLC A415 G 0 0.08 0.08 E<br />
Highlands 6916 7l Lake Placid LLC A415 S 0.025 0.08 0.08 E<br />
Highlands 6957 Zamin Investments LLC A415 G 0.016 0.026 0.026 E<br />
M/E 5<br />
Page | 197
<strong>2011</strong> ESTIMATED WATER USE REPORT<br />
Table A7. Metered and <strong>Estimated</strong> Agricultural WUPs, Withdrawals and Permitted <strong>Use</strong> (mgd), <strong>2011</strong><br />
County<br />
WUP<br />
Number<br />
<strong>Southwest</strong> <strong>Florida</strong> <strong>Water</strong> <strong>Management</strong> District<br />
Permittee<br />
<strong>Use</strong><br />
Code 1<br />
Source 2<br />
Annual<br />
Average<br />
Pumpage 3<br />
Total<br />
Permitted<br />
Annual<br />
Average<br />
Quantity<br />
Permitted<br />
Quantity<br />
Attributed<br />
to AG <strong>Use</strong><br />
Category 4<br />
Highlands 6958 Henry Crutchfield Inc A415 G 0.007 0.012 0.012 E<br />
Highlands 6959 Henry Crutchfield Inc A415 G 0.013 0.022 0.022 E<br />
Highlands 7072 Martin J McKenna A415 G 0.015 0.024 0.024 E<br />
Highlands 7112 L C Smith III William L Peeples & Dimitri Artzibushev A415 G 0.073 0.101 0.101 E<br />
Highlands 7113 Jewell P Slade Trust A415 G 0.02 0.032 0.032 E<br />
Highlands 7114 Griffin Family Ltd Partnership A415 G 0.047 0.077 0.077 E<br />
Highlands 7115 Price Groves LLC A415 G 0.037 0.051 0.051 E<br />
Highlands 7168 Marcial Mendez A415 G 0.007 0.011 0.011 E<br />
Highlands 7169 Dale & SUSAn Bury A415 G 0.004 0.014 0.014 E<br />
Highlands 7196 Mac Vail Inc A415 G 0.008 0.014 0.014 E<br />
Highlands 7339 Joyce M Shriner A415 G 0.012 0.019 0.019 E<br />
7347 Charles S & Tamela C Cullens Tr Tamela C Cullens Rev A415<br />
0.003 0.006 0.006<br />
Highlands<br />
Tr<br />
G<br />
E<br />
Highlands 7484 Reynolds Farms, Inc. A415 G 0.056 0.078 0.078 E<br />
Highlands 7615 Boston Mining Company A415 G 0.055 0.077 0.077 E<br />
Highlands 7647 Lake Placid Groves LLC A415 G 0.044 0.074 0.074 E<br />
Highlands 7660 Leigh A Taylor A415 G 0.008 0.013 0.013 E<br />
Highlands 7693 Lo Brothers Enterprises A415 G 0.046 0.063 0.063 E<br />
Highlands 7694 Barbara OBannon A415 G 0.016 0.026 0.026 E<br />
Highlands 7720 Highlands Farms Inc A415 G 0.016 0.026 0.026 E<br />
Highlands 7731 W F Ward Residual Trust A415 G 0.01 0.017 0.017 E<br />
Highlands 7737 Center Ridge Fruit Co LLC A415 G 0.008 0.013 0.013 E<br />
Highlands 7738 Gregory Scott Reynolds A415 G 0.05 0.069 0.069 E<br />
Highlands 7858 Wards Nursery Inc A485 G 0.039 0.064 0.064 E<br />
Highlands 7875 Smoak Citrus Development Partnership A415 G 0.025 0.04 0.04 E<br />
Highlands 7961 James M & Jeri B Wohl A415 G 0.014 0.023 0.023 E<br />
Highlands 7988 Steven Hartt A415 G 0.021 0.035 0.035 E<br />
Highlands 7989 R L Dilley & Sons Inc A480 G 0.124 0.218 0.218 E<br />
Highlands 8006 Well‐Bred Real Estate Inc A415 G 0.057 0.079 0.079 E<br />
Highlands 8061 James W & Louise Miller A415 G 0.009 0.038 0.038 E<br />
Highlands 8061 James W & Louise Miller A415 S 0.014 0.038 0.038 E<br />
M/E 5<br />
Page | 198
<strong>2011</strong> ESTIMATED WATER USE REPORT<br />
Table A7. Metered and <strong>Estimated</strong> Agricultural WUPs, Withdrawals and Permitted <strong>Use</strong> (mgd), <strong>2011</strong><br />
County<br />
WUP<br />
Number<br />
<strong>Southwest</strong> <strong>Florida</strong> <strong>Water</strong> <strong>Management</strong> District<br />
Permittee<br />
<strong>Use</strong><br />
Code 1<br />
Source 2<br />
Annual<br />
Average<br />
Pumpage 3<br />
Total<br />
Permitted<br />
Annual<br />
Average<br />
Quantity<br />
Permitted<br />
Quantity<br />
Attributed<br />
to AG <strong>Use</strong><br />
Category 4<br />
Highlands 8074 Macbeth Associates Ltd A415 G 0.008 0.013 0.013 E<br />
Highlands 8079 Noel S & Nancy L Scott A415 G 0.009 0.015 0.015 E<br />
Highlands 8122 B H Griffin III‐Agent A415 G 0.008 0.013 0.013 E<br />
Highlands 8136 Crutchfield Groves, Inc. A415 G 0.008 0.013 0.013 E<br />
Highlands 8162 Jeffrey Strange A415 G 0.049 0.067 0.067 E<br />
Highlands 8163 Hardy Groves Inc A415 G 0.005 0.008 0.008 E<br />
Highlands 8256 Heartland National Bank A415 G 0.039 0.054 0.054 E<br />
Highlands 8257 Denton Groves Inc A415 G 0.007 0.012 0.012 E<br />
Highlands 8258 Latt Maxcy Corp. A415 G 0.021 0.035 0.035 E<br />
Highlands 8292 Crutchfield Groves Inc J Thomas Crutchfield A415 G 0.025 0.042 0.042 E<br />
Highlands 8293 Duane & Wanda Sue Kopta A415 G 0.014 0.024 0.024 E<br />
Highlands 8311 Jonathan H Jean D J Ned & Tammy J Hancock A415 G 0.039 0.053 0.053 E<br />
Highlands 8317 Joe L Davis Sr Groves & Ranch A415 G 0.01 0.016 0.016 E<br />
Highlands 8318 Joe L Davis Sr Groves & Ranch A415 G 0.006 0.016 0.016 E<br />
Highlands 8319 Joe L Davis Sr Groves & Ranch A415 G 0.03 0.048 0.048 E<br />
Highlands 8326 Joseph Macbeth A415 G 0.025 0.041 0.041 E<br />
Highlands 8329 Hammock Land & Cattle Co Inc A415 G 0.03 0.049 0.049 E<br />
Highlands 8365 Gary Lee Rapp A415 G 0.011 0.018 0.018 E<br />
Highlands 8413 Thomas & Kay Bloom A415 G 0.003 0.005 0.005 E<br />
Highlands 8424 William S Maxwell A415 G 0.02 0.033 0.033 E<br />
Highlands 8432 Ronald W & Vanessa A Beaty A415 G 0.007 0.012 0.012 E<br />
Highlands 8503 Keck Groves Inc A415 G 0.05 0.069 0.069 E<br />
8511 Bank Of America Na J T Blackman Etc‐J O Blackman Tst A415<br />
0.01 0.016 0.016<br />
Highlands<br />
12/7/99<br />
G<br />
E<br />
Highlands 8512 Joe L Davis Sr Groves & Ranch A415 G 0.005 0.015 0.015 E<br />
Highlands 8662 Joe L Davis Sr Groves & Ranch A415 G 0.008 0.013 0.013 E<br />
Highlands 8692 J Palmer Simmons Simmons Faily Groves Inc A415 G 0.02 0.032 0.032 E<br />
Highlands 8744 Dick Blydenstein Trustee A415 G 0 0.028 0.028 E<br />
Highlands 8787 A R Chapman & Stephens Groves Inc A415 G 0.145 0.262 0.262 E<br />
Highlands 8794 Lake Rachard Estates Ltd A415 G 0.004 0.006 0.006 E<br />
Highlands 8798 Sybil Laye & Layes Grove Inc A415 G 0.041 0.067 0.067 E<br />
M/E 5<br />
Page | 199
<strong>2011</strong> ESTIMATED WATER USE REPORT<br />
Table A7. Metered and <strong>Estimated</strong> Agricultural WUPs, Withdrawals and Permitted <strong>Use</strong> (mgd), <strong>2011</strong><br />
County<br />
WUP<br />
Number<br />
<strong>Southwest</strong> <strong>Florida</strong> <strong>Water</strong> <strong>Management</strong> District<br />
Permittee<br />
<strong>Use</strong><br />
Code 1<br />
Source 2<br />
Annual<br />
Average<br />
Pumpage 3<br />
Total<br />
Permitted<br />
Annual<br />
Average<br />
Quantity<br />
Permitted<br />
Quantity<br />
Attributed<br />
to AG <strong>Use</strong><br />
Category 4<br />
Highlands 8803 Alton D & Jason B & Amberlee P Rogers A415 G 0.016 0.027 0.027 E<br />
Highlands 8821 MBR Ventures I LLC A700 G 0.029 0.048 0.048 E<br />
Highlands 8822 Steve Harmer A415 G 0.008 0.013 0.013 E<br />
Highlands 8846 Robert C Crews II & Christy F Crews A490 G 0.02 0.033 0.033 E<br />
Highlands 8851 Jim Haynes Family Citrus Inc A415 G 0.037 0.051 0.051 E<br />
Highlands 8867 Eleanor F Griffin A415 G 0.015 0.024 0.024 E<br />
Highlands 8868 Rafter T Realty Inc A525 G 0.147 0.267 0.267 E<br />
Highlands 8887 Eugene S. Paul A415 G 0.037 0.051 0.051 E<br />
Highlands 8950 Lester Strange A415 G 0.016 0.027 0.027 E<br />
Highlands 8956 Mary B Gremp & Grace T Bryant A415 G 0.008 0.013 0.013 E<br />
Highlands 8979 J. R. Paul, Jr. Family Limited Partnership A415 S 0.048 0.067 0.067 E<br />
Highlands 8998 Loyd F & Juanita W Todd A415 G 0.016 0.026 0.026 E<br />
Highlands 9034 DP Partners Ltd & PGP Partners Ltd A415 G 0.006 0.01 0.01 E<br />
Highlands 9047 Charles & Anne D Reynolds Jr A415 G 0.045 0.064 0.064 E<br />
Highlands 9076 Mac Vail Inc A415 G 0.009 0.015 0.015 E<br />
Highlands 9108 Tombstone Groves Partnership Martin J McKenna A415 G 0.024 0.039 0.039 E<br />
Highlands 9109 Florisweet Ent Inc A415 G 0.034 0.055 0.055 E<br />
Highlands 9156 William F Hutchinson III A415 G 0.022 0.036 0.036 E<br />
Highlands 9165 Nora W Corbett & Charles Cobb A415 S 0.013 0.021 0.021 E<br />
9213 Ruth & Lionel Lagrow Co‐Trustees Of The Ruth Lagrow A415<br />
0.01 0.016 0.016<br />
Highlands<br />
Trust<br />
G<br />
E<br />
Highlands 9235 Paul E Thompson Trust A410 G 0.011 0.018 0.018 E<br />
Highlands 9261 Jacalyn Hansen A415 G 0.007 0.011 0.011 E<br />
Highlands 9262 Avon Park 38 LLC A415 G 0.014 0.036 0.036 E<br />
Highlands 9393 Frostproof Citrus Sales Inc A415 G 0.008 0.013 0.013 E<br />
Highlands 9395 Robert & Linda Hartman A415 G 0.023 0.038 0.038 E<br />
Highlands 9415 Anne D Reynolds A415 G 0.05 0.07 0.07 E<br />
Highlands 9431 StoLPmann Corporation A480 G 0.016 0.03 0.03 E<br />
Highlands 9437 WA Williams Citrus Nursery & Services Inc A415 G 0.015 0.024 0.024 E<br />
Highlands 9443 <strong>Florida</strong> Love Scott Trustee Of R & S Rev Mng Trust A415 G 0.047 0.065 0.065 E<br />
Highlands 9449 Mapeho Inc A415 G 0.029 0.048 0.048 E<br />
M/E 5<br />
Page | 200
<strong>2011</strong> ESTIMATED WATER USE REPORT<br />
Table A7. Metered and <strong>Estimated</strong> Agricultural WUPs, Withdrawals and Permitted <strong>Use</strong> (mgd), <strong>2011</strong><br />
County<br />
WUP<br />
Number<br />
<strong>Southwest</strong> <strong>Florida</strong> <strong>Water</strong> <strong>Management</strong> District<br />
Permittee<br />
<strong>Use</strong><br />
Code 1<br />
Source 2<br />
Annual<br />
Average<br />
Pumpage 3<br />
Total<br />
Permitted<br />
Annual<br />
Average<br />
Quantity<br />
Permitted<br />
Quantity<br />
Attributed<br />
to AG <strong>Use</strong><br />
Category 4<br />
Highlands 9477 J. R. Paul, Jr. Family Limited Partnership A415 G 0.022 0.037 0.037 E<br />
Highlands 9533 Walter E & Sharon D Bigbie A415 G 0.009 0.016 0.016 E<br />
Highlands 9590 Stephens Groves Inc A415 G 0.039 0.053 0.053 E<br />
Highlands 9591 Grigsby Family Partnership Ltd A415 G 0.006 0.009 0.009 E<br />
Highlands 9592 Drane Family Partnership Ltd & Stephens Groves Inc A415 G 0.021 0.034 0.034 E<br />
Highlands 9594 Stephens Groves Inc & M E Stephens IV A415 G 0.009 0.014 0.014 E<br />
Highlands 9595 Andrew & SUSAn Bible A415 G 0.006 0.01 0.01 E<br />
Highlands 9607 Vinces Airport Grove Inc A415 G 0.017 0.028 0.028 E<br />
Highlands 9608 Peace Citrus Investments LLC A415 G 0.058 0.08 0.08 E<br />
Highlands 9629 Home Trust Group Inc A415 G 0.004 0.006 0.006 E<br />
Highlands 9634 Marilyn Mason A415 G 0.018 0.03 0.03 E<br />
Highlands 9644 Sandy Ridge Groves, Inc A415 G 0.037 0.051 0.051 E<br />
Highlands 9679 William H. & Marjorie A. Jernigan A415 G 0.011 0.018 0.018 E<br />
Highlands 9737 Footman's Trail L.P. Family Trust A415 G 0.043 0.06 0.06 E<br />
Highlands 9746 Curtis & Laurie Slade II As Tr & Jewell Slade As Trustee A415 G 0.031 0.051 0.051 E<br />
Highlands 9760 W F Ward Residual Trust A415 G 0.016 0.027 0.027 E<br />
Highlands 9765 Deborah & Marcia Ward Groves A415 G 0.013 0.021 0.021 E<br />
Highlands 9783 Highlands Co Properties A415 G 0 0.037 0.037 E<br />
Highlands 9813 Charles S & Tamela C Cullens A415 G 0 0.013 0.013 E<br />
Highlands 9814 Lake Placid Holding Co A415 G 0.017 0.027 0.027 E<br />
Highlands 9832 Big Sky Growers Inc A480 G 0.048 0.067 0.067 E<br />
Highlands 9840 Ann & Leigh Ann Reynolds A415 G 0.012 0.02 0.02 E<br />
Highlands 9846 D Keith Emmett Thomas Cole Emmett A415 G 0.006 0.009 0.009 E<br />
Highlands 9854 William Hartt A415 G 0.016 0.025 0.025 E<br />
Highlands 9883 Paul E Thompson Trust A415 G 0.011 0.019 0.019 E<br />
Highlands 9935 G. Perry And Amanda E. Mason III A415 G 0.039 0.053 0.053 E<br />
Highlands 9969 Cow Slough Inc A415 G 0.014 0.024 0.024 E<br />
Highlands 9971 Alton D. Rogers A415 G 0.008 0.013 0.013 E<br />
Highlands 9988 Central <strong>Florida</strong> Palms Inc A485 G 0.038 0.053 0.053 E<br />
10008 Hardie B. Driggers TTEE of the Hardie B. Driggers Rev A415<br />
0.009 0.014 0.014<br />
Highlands<br />
Trust<br />
G<br />
E<br />
M/E 5<br />
Page | 201
<strong>2011</strong> ESTIMATED WATER USE REPORT<br />
Table A7. Metered and <strong>Estimated</strong> Agricultural WUPs, Withdrawals and Permitted <strong>Use</strong> (mgd), <strong>2011</strong><br />
County<br />
WUP<br />
Number<br />
<strong>Southwest</strong> <strong>Florida</strong> <strong>Water</strong> <strong>Management</strong> District<br />
Permittee<br />
<strong>Use</strong><br />
Code 1<br />
Source 2<br />
Annual<br />
Average<br />
Pumpage 3<br />
Total<br />
Permitted<br />
Annual<br />
Average<br />
Quantity<br />
Permitted<br />
Quantity<br />
Attributed<br />
to AG <strong>Use</strong><br />
Category 4<br />
Highlands 10016 W G Nichols A415 G 0.019 0.032 0.032 E<br />
Highlands 10024 Southridge Citrus Nursery, Inc. A415 G 0.028 0.045 0.045 E<br />
Highlands 10059 Patrick M Richart Revocable Trst Dated Sept 5 2000 A415 G 0.041 0.057 0.057 E<br />
Highlands 10060 J. R. Paul, Jr. Family Limited Partnership A415 G 0.016 0.026 0.026 E<br />
Highlands 10061 J. R. Paul, Jr. Family Limited Partnership A415 G 0.016 0.026 0.026 E<br />
Highlands 10062 Leigh Ann Taylor A415 G 0.014 0.023 0.023 E<br />
Highlands 10074 Gary L. Blackwell Trust A415 G 0.014 0.023 0.023 E<br />
Highlands 10081 J. Ned Hancock and Tammy J. Hancock A415 G 0.04 0.056 0.056 E<br />
Highlands 10107 Donna S. Thompson, Trustee A415 G 0.012 0.022 0.022 E<br />
Highlands 10125 Ben Hill Griffin, Inc. A415 G 0.016 0.027 0.027 E<br />
Highlands 10142 Horace Durrance A415 G 0.01 0.016 0.016 E<br />
Highlands 10144 Betsy Nichols Lowenstein, Trustee A415 G 0.058 0.081 0.081 E<br />
Highlands 10172 William J Holmes A415 G 0 0.014 0.014 E<br />
Highlands 10174 Leigh A Taylor A415 G 0.014 0.023 0.023 E<br />
Highlands 10204 Steven & Velva Hartt A415 G 0.03 0.049 0.049 E<br />
Highlands 10229 Russell Grove North Inc A415 G 0 0.006 0.006 E<br />
Highlands 10230 James L Livingston Trustee A415 G 0 0.011 0.011 E<br />
Highlands 10248 Lake Placid Holding Co A415 G 0 0.059 0.059 E<br />
Highlands 10275 Joseph Macbeth A415 G 0.008 0.013 0.013 E<br />
Highlands 10282 T G Durrance A415 G 0.018 0.03 0.03 E<br />
Highlands 10287 Lotela Groves Inc A415 G 0 0.065 0.065 E<br />
Highlands 10288 Carol & Jacalyn Hutchinson A415 G 0 0.038 0.038 E<br />
Highlands 10321 John P Barben A415 G 0.04 0.055 0.055 E<br />
Highlands 10330 Robert Hartman A415 G 0.014 0.023 0.023 E<br />
Highlands 10338 Marilyn Smoak Mason and Mapeho, Inc. A415 G 0.039 0.053 0.053 E<br />
Highlands 10342 Cow Slough Inc A415 G 0.014 0.023 0.023 E<br />
Highlands 10362 Mark L Lindner & William D Rapp S Co‐Trustees A415 G 0.056 0.078 0.078 E<br />
Highlands 10390 Leigh Anne Taylor, et al and Gregory S. Reynolds A415 G 0.03 0.048 0.048 E<br />
Highlands 10394 Kenneth W & Katherine M Jones A415 G 0.001 0.02 0.02 E<br />
Highlands 10394 Kenneth W & Katherine M Jones A415 S 0.011 0.02 0.02 E<br />
Highlands 10498 The Great Fruit Co & Patricia Martin A415 G 0.004 0.046 0.046 E<br />
M/E 5<br />
Page | 202
<strong>2011</strong> ESTIMATED WATER USE REPORT<br />
Table A7. Metered and <strong>Estimated</strong> Agricultural WUPs, Withdrawals and Permitted <strong>Use</strong> (mgd), <strong>2011</strong><br />
County<br />
WUP<br />
Number<br />
<strong>Southwest</strong> <strong>Florida</strong> <strong>Water</strong> <strong>Management</strong> District<br />
Permittee<br />
<strong>Use</strong><br />
Code 1<br />
Source 2<br />
Annual<br />
Average<br />
Pumpage 3<br />
Total<br />
Permitted<br />
Annual<br />
Average<br />
Quantity<br />
Permitted<br />
Quantity<br />
Attributed<br />
to AG <strong>Use</strong><br />
Category 4<br />
Highlands 10546 Benoit & Pat Grenier A415 G 0 0.015 0.015 E<br />
Highlands 10584 Franklin Hartzell A410 G 0.021 0.035 0.035 E<br />
10587 Paul E. Thompson TR; Donna S. Thompson TR; Paul & A415<br />
0.038 0.053 0.053<br />
Highlands<br />
Donna Thompson<br />
G<br />
E<br />
Highlands 10616 Grigsby Family Partnership Ltd A415 G 0.016 0.026 0.026 E<br />
Highlands 10619 Anne D Reynolds A415 G 0.008 0.013 0.013 E<br />
Highlands 10633 Holly Ruth Mason True A415 G 0.025 0.041 0.041 E<br />
Highlands 10642 Dennis Coulter A415 G 0.025 0.04 0.04 E<br />
Highlands 10645 Mary L Swaine A415 G 0.022 0.036 0.036 E<br />
Highlands 10676 Jerane Groves, Inc. A415 G 0.027 0.045 0.045 E<br />
Highlands 10711 W O Foster A415 G 0 0.024 0.024 E<br />
Highlands 10766 Cow Slough Inc A415 S 0.026 0.043 0.043 E<br />
Highlands 10805 Russell Grove North, Inc. A415 G 0.026 0.043 0.043 E<br />
Highlands 10806 Gillie C & Melissa P Russell A415 G 0.02 0.033 0.033 E<br />
Highlands 10807 William R & Clarice G Cannon Jr A415 G 0.019 0.032 0.032 E<br />
Highlands 10833 John Watson III Dba Gator Grove & Equipment A415 G 0.006 0.028 0.028 E<br />
Highlands 10854 Macbeth Associates Ltd A415 G 0 0.013 0.013 E<br />
Highlands 10943 Dennis M Walker A415 S 0.021 0.034 0.034 E<br />
Highlands 10945 Lost Lake Groves, Inc. A415 G 0.049 0.068 0.068 E<br />
Highlands 10952 Robert Payne A410 G 0.013 0.051 0.051 E<br />
Highlands 10952 Robert Payne A410 S 0.017 0.051 0.051 E<br />
Highlands 11018 Wa Williams Citrus Nursery & Services Inc A485 G 0.031 0.05 0.05 E<br />
Highlands 11033 Quad County Groves A415 G 0.028 0.045 0.045 E<br />
Highlands 11034 Quad County Groves A415 G 0.023 0.038 0.038 E<br />
Highlands 11047 Jeffrey Williams A415 G 0.007 0.024 0.024 E<br />
Highlands 11079 William R & Clarice G Cannon Jr A415 S 0.012 0.019 0.019 E<br />
Highlands 11111 Craig J Griffith, Trustee A415 G 0.03 0.048 0.048 E<br />
Highlands 11142 Perry Brothers A415 G 0.071 0.115 0.115 E<br />
Highlands 11165 Walter & Pamela Farr A415 G 0.003 0.006 0.006 E<br />
Highlands 11166 Marci‐Lou Corp A415 G 0.027 0.045 0.045 E<br />
Highlands 11168 Patrick M Richart Revocable Trst A415 G 0.007 0.011 0.011 E<br />
M/E 5<br />
Page | 203
<strong>2011</strong> ESTIMATED WATER USE REPORT<br />
Table A7. Metered and <strong>Estimated</strong> Agricultural WUPs, Withdrawals and Permitted <strong>Use</strong> (mgd), <strong>2011</strong><br />
County<br />
WUP<br />
Number<br />
<strong>Southwest</strong> <strong>Florida</strong> <strong>Water</strong> <strong>Management</strong> District<br />
Permittee<br />
<strong>Use</strong><br />
Code 1<br />
Source 2<br />
Annual<br />
Average<br />
Pumpage 3<br />
Total<br />
Permitted<br />
Annual<br />
Average<br />
Quantity<br />
Permitted<br />
Quantity<br />
Attributed<br />
to AG <strong>Use</strong><br />
Category 4<br />
Highlands 11220 Joanna Mae Jackson A415 G 0.044 0.061 0.061 E<br />
Highlands 11248 Lake Ridge Groves Inc A415 G 0.029 0.047 0.047 E<br />
Highlands 11253 John C Merritt A415 G 0.006 0.011 0.011 E<br />
Highlands 11283 Jean Lindemer A415 G 0.005 0.008 0.008 E<br />
Highlands 11317 Lawrence E III & Barbara B Ford A415 G 0 0.027 0.027 E<br />
Highlands 11337 Alton D Rogers Lester Mallett And J W Crews Jr A415 G 0.01 0.017 0.017 E<br />
Highlands 11338 Joseph O Macbeth A415 G 0.014 0.022 0.022 E<br />
11365 Grace T Bryant & Mary B Gremp & Carmel L Doney & A415<br />
0.009 0.015 0.015<br />
Highlands<br />
Mary E Walker<br />
S<br />
E<br />
Highlands 11442 J Ross Macbeth Successor Ttee Of J O Macbeth Fam Tr A415 G 0.016 0.025 0.025 E<br />
Highlands 11497 Lake Placid Groves LLC A415 G 0.02 0.032 0.032 E<br />
Highlands 11504 Joe L Davis Sr A415 G 0.016 0.027 0.027 E<br />
Highlands 11620 Francis W & Sandi W Burke A415 G 0.01 0.016 0.016 E<br />
Highlands 11713 W F Hutchinson III E A And S A & W F Hutchinson IV A415 G 0.007 0.031 0.031 E<br />
Highlands 11713 W F Hutchinson III E A And S A & W F Hutchinson IV A415 S 0.013 0.031 0.031 E<br />
Highlands 11791 Alton D Rogers & Rogers Investment A415 G 0.028 0.045 0.045 E<br />
Highlands 11900 Fidelia Jahna & Brady & Barbara Hopson A415 G 0.011 0.042 0.042 E<br />
Highlands 11900 Fidelia Jahna & Brady & Barbara Hopson A415 S 0.015 0.042 0.042 E<br />
Highlands 11956 Joe L Davis Groves Inc A415 G 0.007 0.021 0.021 E<br />
Highlands 11972 Kahn Citrus Inc A415 G 0.028 0.045 0.045 E<br />
Highlands 11992 John H ONeal A415 G 0.007 0.012 0.012 E<br />
Highlands 12022 Smoak Citrus Development Partnership A415 G 0.024 0.039 0.039 E<br />
Highlands 12031 E Floyd & Lela R Lilyquist A410 G 0.013 0.021 0.021 E<br />
Highlands 12086 Earl Crutchfield A415 G 0.011 0.019 0.019 E<br />
Highlands 12114 Christ Lutheran Church Of Avon Park Inc A415 G 0.006 0.011 0.01 E<br />
Highlands 12173 John H & Lois A McCracken A415 G 0.016 0.027 0.027 E<br />
Highlands 12191 Dennis Coulter A415 G 0 0.238 0.238 E<br />
Highlands 12221 Kahn Citrus Inc A415 G 0.008 0.013 0.013 E<br />
Highlands 12347 John H ONeal A415 G 0.016 0.026 0.026 E<br />
Highlands 12372 John H & Lois A McCracken A415 G 0 0.013 0.013 E<br />
Highlands 12379 Charles R & Sherri L Phypers A485 G 0.006 0.01 0.01 E<br />
M/E 5<br />
Page | 204
<strong>2011</strong> ESTIMATED WATER USE REPORT<br />
Table A7. Metered and <strong>Estimated</strong> Agricultural WUPs, Withdrawals and Permitted <strong>Use</strong> (mgd), <strong>2011</strong><br />
County<br />
WUP<br />
Number<br />
<strong>Southwest</strong> <strong>Florida</strong> <strong>Water</strong> <strong>Management</strong> District<br />
Permittee<br />
<strong>Use</strong><br />
Code 1<br />
Source 2<br />
Annual<br />
Average<br />
Pumpage 3<br />
Total<br />
Permitted<br />
Annual<br />
Average<br />
Quantity<br />
Permitted<br />
Quantity<br />
Attributed<br />
to AG <strong>Use</strong><br />
Category 4<br />
Highlands 12498 Meredith & Elizabeth Macbeth A415 G 0 0.05 0.05 E<br />
Highlands 12501 Jayprakash B & Kirti B Patel A415 G 0.03 0.049 0.049 E<br />
Highlands 12807 Van Kirk Investments II LLC A415 G 0.005 0.008 0.008 E<br />
Highlands 12820 <strong>Florida</strong> Ridge Properties LLC A480 G 0.012 0.041 0.041 E<br />
Highlands 12878 John H & Lois A & Michael C McCracken A415 G 0.016 0.026 0.026 E<br />
Highlands 12894 Ameb Inc A415 G 0.018 0.03 0.03 E<br />
Highlands 12908 Macbeth Associates Ltd A415 G 0 0.04 0.04 E<br />
Highlands 12913 Keith & Sonia Fairclough Adrian & Danielle Fairclough A655 G 0 0.01 0.01 E<br />
Highlands 12914 Keith Fairclough A655 G 0 0.056 0.056 E<br />
Highlands 12914 Keith Fairclough A655 S 0 0.056 0.056 E<br />
Highlands 12937 Jeffrey And Nancy McDongald A480 G 0 0.038 0.038 E<br />
Highlands 12938 Mac‐Vail Associates Ltd A415 G 0.008 0.013 0.013 E<br />
12996 Jack Paul Properties Inc. And Eugene Stuart Paul Ltd A415<br />
0.201 0.354 0.354<br />
Highlands<br />
Partnership<br />
G<br />
E<br />
Highlands 13032 Sapp Brothers Inc A480 G 0.042 0.058 0.058 E<br />
Highlands 13044 Atlas Partners Of <strong>Florida</strong> LLC A415 G 0.015 0.025 0.025 E<br />
Highlands 13051 Hickory Branch Ridge VI LLC A415 G 0 0.078 0.078 E<br />
Highlands 13052 Lake Placid Land Holdings VII A415 G 0.058 0.081 0.081 E<br />
13086 Bank Of America Na J T Blackman Etc‐J O Blackman Tst A415<br />
0.013 0.022 0.022<br />
Highlands<br />
12/7/99<br />
G<br />
E<br />
Highlands 13093 Ann Wood A415 G 0.037 0.051 0.051 E<br />
Highlands 13113 J. R. Paul, Jr. Family Limited Partnership A415 G 0.014 0.047 0.047 E<br />
Highlands 13164 TYL Inc Adrian & Sonia Fairclough A415 G 0.016 0.026 0.026 E<br />
Highlands 13177 Emaks Inc A415 G 0.03 0.048 0.048 E<br />
Highlands 13193 John F Jr & Edward L Smoak Partnership A415 G 0.007 0.011 0.011 E<br />
Highlands 13207 H & D Groves Inc. A415 G 0.016 0.027 0.027 E<br />
Highlands 13229 Alton D Rogers A415 G 0.025 0.04 0.04 E<br />
Highlands 13235 Rogers Investment Partnership A415 G 0.008 0.013 0.013 E<br />
Highlands 13245 Lawrence B Sr & Cynthia L Wells A485 S 0 0.04 0.04 E<br />
Highlands 13249 Paul E Thompson Trust A490 G 0.01 0.017 0.017 E<br />
Highlands 13254 Tombstone Groves Partnership Martin J McKenna A415 G 0.02 0.033 0.033 E<br />
M/E 5<br />
Page | 205
<strong>2011</strong> ESTIMATED WATER USE REPORT<br />
Table A7. Metered and <strong>Estimated</strong> Agricultural WUPs, Withdrawals and Permitted <strong>Use</strong> (mgd), <strong>2011</strong><br />
County<br />
WUP<br />
Number<br />
Permittee<br />
<strong>Use</strong><br />
Code 1<br />
Source 2<br />
Annual<br />
Average<br />
Pumpage 3<br />
Total<br />
Permitted<br />
Annual<br />
Average<br />
Quantity<br />
Permitted<br />
Quantity<br />
Attributed<br />
to AG <strong>Use</strong><br />
Category 4<br />
Highlands 13255 Ian & Leigh Anne Taylor A415 G 0.022 0.035 0.035 E<br />
Highlands 13263 The Great Fruit Company Inc A415 G 0.003 0.005 0.005 E<br />
13284 David L Harrison Tst 5/25/95 & Joyce L Harrison Tst A415<br />
0.008 0.013 0.013<br />
Highlands<br />
5/25/95<br />
G<br />
E<br />
Highlands 13288 Jason B & Alton D Rogers A415 G 0.014 0.024 0.024 E<br />
Highlands 13298 Macbeth Associates Ltd A415 G 0.008 0.013 0.013 E<br />
Highlands 13307 Stevens Groves Inc A415 G 0.024 0.039 0.039 E<br />
Highlands 20007 HTFL Inc A700 G 0.007 0.011 0.011 E<br />
Highlands 20015 John R Paul Jr Limited Partner A415 G 0.029 0.047 0.047 E<br />
Highlands <strong>2011</strong>7 Eugene S Paul A415 G 0.034 0.055 0.055 E<br />
Highlands 20135 Lubear Futures Partnership A415 G 0.02 0.033 0.033 E<br />
Highlands 20140 Center Ridge Caretaking Inc & Marion E. Stephens A415 G 0.012 0.019 0.019 E<br />
Highlands 20166 George P Mason Jr A415 G 0.009 0.015 0.015 E<br />
Highlands 20214 Charles Reynolds Jr A415 G 0 0.039 0.039 E<br />
Highlands 20226 Paul Fabry A415 G 0 0.026 0.026 E<br />
Highlands 20246 M.E. Stephens V and M.E. Stephens IV A415 G 0 0.012 0.012 E<br />
31.043 Metered, mgd<br />
Highlands County Totals<br />
9.532 <strong>Estimated</strong> , mgd<br />
40.575 Total, mgd<br />
Hillsborough 74 Samuel D Williamson A535 G 0.091 0.181 0.181 M<br />
Hillsborough 74 Samuel D Williamson A535 S 0.000 0.181 0.181 M<br />
Hillsborough 120 Grantham Epps A480 G 0.065 0.115 0.115 M<br />
Hillsborough 162 Loop Farms, LLC A535 G 0.144 0.160 0.160 M<br />
Hillsborough 180 Sam Astin III & Buffy S Astin A535 G 0.145 0.138 0.138 M<br />
Hillsborough 182 E. W. Simmons Farms, Inc. A58S G 0.146 0.179 0.179 M<br />
Hillsborough 201 Smith Ryals Road Holdings LLC A535 G 0.100 0.104 0.104 M<br />
Hillsborough 263 C Dennis Carlton A535 G 0.131 0.164 0.164 M<br />
Hillsborough 274 John D Lawrence Trustee A535 G 0.066 0.110 0.110 M<br />
Hillsborough 286 Kenneth Alred A535 G 0.033 0.103 0.103 M<br />
Hillsborough 297 Albritton & Sons Ltd A415 G 0.140 0.081 0.081 M<br />
M/E 5<br />
<strong>Southwest</strong> <strong>Florida</strong> <strong>Water</strong> <strong>Management</strong> District<br />
Page | 206
<strong>2011</strong> ESTIMATED WATER USE REPORT<br />
Table A7. Metered and <strong>Estimated</strong> Agricultural WUPs, Withdrawals and Permitted <strong>Use</strong> (mgd), <strong>2011</strong><br />
County<br />
WUP<br />
Number<br />
<strong>Southwest</strong> <strong>Florida</strong> <strong>Water</strong> <strong>Management</strong> District<br />
Permittee<br />
<strong>Use</strong><br />
Code 1<br />
Source 2<br />
Annual<br />
Average<br />
Pumpage 3<br />
Total<br />
Permitted<br />
Annual<br />
Average<br />
Quantity<br />
Permitted<br />
Quantity<br />
Attributed<br />
to AG <strong>Use</strong><br />
Category 4<br />
Hillsborough 360 Astin Strawberry Property <strong>Management</strong>, LLC, Trustee A470 G 0.025 2.271 2.271 M<br />
Hillsborough 360 Astin Strawberry Property <strong>Management</strong>, LLC, Trustee A470 S 0.000 2.271 2.271 M<br />
Hillsborough 390 Strawberry Station Inc A535 G 0.347 0.382 0.382 M<br />
Hillsborough 390 Strawberry Station Inc A535 S 0.004 0.382 0.382 M<br />
Hillsborough 526 Russell G Moll & Family Inc A535 G 0.179 0.195 0.195 M<br />
Hillsborough 526 Russell G Moll & Family Inc A535 S 0.000 0.195 0.195 M<br />
Hillsborough 636 Michael D Council‐William Spencer‐W E Currie III Etc A56S G 0.136 0.148 0.148 M<br />
Hillsborough 655 Farmland Reserve Inc. A56S G 0.639 1.744 1.744 M<br />
Hillsborough 656 Property Reserve Inc/CPB/NNP Southbend II A56S G 0.843 0.940 0.940 M<br />
Hillsborough 659 Farmland Reserve Inc. A56S G 0.600 1.033 1.033 M<br />
Hillsborough 660 Farmland Reserve Inc. A56S G 0.336 0.500 0.500 M<br />
Hillsborough 662 Donald & Mary Shuman Inc A415 G 0.129 0.206 0.206 M<br />
Hillsborough 739 Three Star Farms Inc A535 G 0.038 0.368 0.368 M<br />
Hillsborough 739 Three Star Farms Inc A535 S 0.000 0.368 0.368 M<br />
Hillsborough 770 Franklin Properties Of Hillsborough County LLC A44S G 0.083 0.181 0.181 M<br />
Hillsborough 865 Marcus Glenn & Sarah F Williamson A535 G 0.105 0.133 0.133 M<br />
Hillsborough 880 Sultenfuss Ltd A415 G 0.070 0.312 0.312 M<br />
Hillsborough 891 Sam Astin III & Buffy S Astin A535 G 0.125 0.149 0.149 M<br />
Hillsborough 969 Grace Chavez A535 G 0.004 0.112 0.112 M<br />
Hillsborough 985 Diehl Family LP A56S G 2.224 2.328 2.328 M<br />
Hillsborough 995 Julian B. Lane, Jr. A495 G 0.002 0.290 0.290 M<br />
Hillsborough 1067 M.D. Council and Sons, Inc. A535 G 0.068 0.264 0.264 M<br />
Hillsborough 1120 SR Ruskin Shell Point LLC A495 G 0.000 0.116 0.116 M<br />
Artesian Farms Inc/Dickman Investments LLC/South<br />
G<br />
Hillsborough 1124 Shore Corp Park<br />
A56S<br />
0.332 1.445 1.445<br />
M<br />
Hillsborough 1130 James Maring A535 G 0.092 0.107 0.107 M<br />
Hillsborough 1203 Leland F Carlton A415 G 0.068 0.078 0.078 M<br />
Hillsborough 1217 Scalare Hatchery Inc L660 G 0.003 0.145 0.145 M<br />
Hillsborough 1276 Ronnie E & Pamela D Young A535 G 0.078 0.235 0.235 M<br />
Hillsborough 1276 Ronnie E & Pamela D Young A535 S 0.060 0.235 0.235 M<br />
Hillsborough 1367 Hickory Hills Land Company A490 G 0.000 0.392 0.392 M<br />
M/E 5<br />
Page | 207
<strong>2011</strong> ESTIMATED WATER USE REPORT<br />
Table A7. Metered and <strong>Estimated</strong> Agricultural WUPs, Withdrawals and Permitted <strong>Use</strong> (mgd), <strong>2011</strong><br />
County<br />
WUP<br />
Number<br />
<strong>Southwest</strong> <strong>Florida</strong> <strong>Water</strong> <strong>Management</strong> District<br />
Permittee<br />
<strong>Use</strong><br />
Code 1<br />
Source 2<br />
Annual<br />
Average<br />
Pumpage 3<br />
Total<br />
Permitted<br />
Annual<br />
Average<br />
Quantity<br />
Permitted<br />
Quantity<br />
Attributed<br />
to AG <strong>Use</strong><br />
Category 4<br />
Hillsborough 1444 Charles G. Grimes, Trustee and Betty J. Grimes, Trustee A535 G 0.065 0.245 0.235 M<br />
Hillsborough 1444 Charles G. Grimes, Trustee and Betty J. Grimes, Trustee A535 S 0.000 0.245 0.235 M<br />
Hillsborough 1451 J A Clark III & Linda G Clark A415 G 0.022 0.067 0.067 M<br />
Hillsborough 1544 Kay D O'Rourke A415 G 0.000 0.147 0.147 M<br />
Hillsborough 1626 Albert M Quagliani & Amelia Ann Skolnick A535 G 0.000 0.107 0.107 M<br />
Hillsborough 1626 Albert M Quagliani & Amelia Ann Skolnick A535 S 0.000 0.107 0.107 M<br />
Hillsborough 1803 Jay Mar Farms Inc A535 G 0.174 0.471 0.471 M<br />
Hillsborough 1836 Rood Family Limited Partnership A56S G 0.909 1.873 1.873 M<br />
Hillsborough 1837 Forest Brooke <strong>Management</strong>, LLC A56S G 0.000 0.391 0.391 M<br />
Hillsborough 1838 Cardanell Farms A58S G 0.152 1.449 1.445 M<br />
Hillsborough 1839 Frank Diehl A410 G 0.045 0.112 0.112 M<br />
Hillsborough 1839 Frank Diehl A410 S 0.000 0.112 0.112 M<br />
Hillsborough 1840 Berry Bay Farms at Jaymar Inc A535 G 0.144 0.220 0.220 M<br />
Hillsborough 1840 Berry Bay Farms at Jaymar Inc A535 S 0.000 0.220 0.220 M<br />
Edward, Lawrence E.,Deborah J. Swindle,& Circle S<br />
G<br />
Hillsborough 1869 Farms, Ltd.<br />
A535<br />
0.144 0.181 0.181<br />
M<br />
Hillsborough 1872 Rubin Farms, LLC A415 G 0.000 0.063 0.063 M<br />
Hillsborough 1877 William A & Amelia R Mixon A535 G 0.000 0.176 0.176 M<br />
Hillsborough 1877 William A & Amelia R Mixon A535 S 0.000 0.176 0.176 M<br />
Hillsborough 1956 Conrad H., Sherry, Scott M. and Kay D. Varnum A535 G 0.000 0.179 0.179 M<br />
Hillsborough 1960 University Of South <strong>Florida</strong> A475 G 0.015 2.364 0.027 M<br />
Hillsborough 1960 University Of South <strong>Florida</strong> A475 S 0.000 2.364 0.027 M<br />
Hillsborough 1991 City Properties A415 G 0.000 0.150 0.150 M<br />
Hillsborough 2045 Midway Investment Company, Inc. A535 G 0.169 0.306 0.305 M<br />
Hillsborough 2045 Midway Investment Company, Inc. A535 S 0.000 0.306 0.305 M<br />
Hillsborough 2128 BVG Groves Inc A415 G 0.168 0.101 0.101 M<br />
Hillsborough 2136 C Dennis Carlton Sr & Lee F A415 G 0.248 0.194 0.194 M<br />
Hillsborough 2189 Epps Nursery Inc A475 G 0.060 0.126 0.126 M<br />
Hillsborough 2197 Young Farms A56F G 0.001 0.353 0.353 M<br />
Hillsborough 2258 Mosaic Fertilizer, LLC A525 G 0.065 0.414 0.414 M<br />
Hillsborough 2273 Lucille E. Reese Trustee, Rex Reese, and Rand Reese A415 G 0.087 0.072 0.072 M<br />
M/E 5<br />
Page | 208
<strong>2011</strong> ESTIMATED WATER USE REPORT<br />
Table A7. Metered and <strong>Estimated</strong> Agricultural WUPs, Withdrawals and Permitted <strong>Use</strong> (mgd), <strong>2011</strong><br />
County<br />
WUP<br />
Number<br />
<strong>Southwest</strong> <strong>Florida</strong> <strong>Water</strong> <strong>Management</strong> District<br />
Permittee<br />
<strong>Use</strong><br />
Code 1<br />
Source 2<br />
Annual<br />
Average<br />
Pumpage 3<br />
Total<br />
Permitted<br />
Annual<br />
Average<br />
Quantity<br />
Permitted<br />
Quantity<br />
Attributed<br />
to AG <strong>Use</strong><br />
Category 4<br />
Hillsborough 2314 John L Jr & Judith F McMullen A480 G 0.025 0.090 0.090 M<br />
Hillsborough 2486 Circle G Farm And Ranch, LLC A535 G 0.000 0.800 0.800 M<br />
Hillsborough 2486 Circle G Farm And Ranch, LLC A535 S 0.000 0.800 0.800 M<br />
Hillsborough 2516 Hopewell Business Center LLC A655 G 0.061 0.236 0.236 M<br />
Hillsborough 2516 Hopewell Business Center LLC A655 S 0.080 0.236 0.236 M<br />
Hillsborough 2581 Wayne Moss A535 G 0.213 0.296 0.296 M<br />
Hillsborough 2581 Wayne Moss A535 S 0.000 0.296 0.296 M<br />
Hillsborough 2619 Lucille E Reese A415 G 0.070 0.173 0.173 M<br />
Hillsborough 2654 S S Williams Jr A535 G 0.146 0.320 0.320 M<br />
Hillsborough 2654 S S Williams Jr A535 S 0.000 0.320 0.320 M<br />
Hillsborough 2670 Donald M & Deborah L Balaban A535 G 0.034 0.305 0.305 M<br />
Hillsborough 2714 Hillsborough County Public Utilities Department A415 G 0.000 0.684 0.684 M<br />
Hillsborough 2714 Hillsborough County Public Utilities Department A415 S 0.000 0.684 0.684 M<br />
Hillsborough 2881 Citrus Enterprises Inc A415 G 0.096 0.111 0.111 M<br />
Hillsborough 3002 Jack P. & Meribeth J. Sizemore A415 G 0.092 0.132 0.132 M<br />
Hillsborough 3055 Speedling Inc A485 G 0.105 0.302 0.291 M<br />
Hillsborough 3057 Ocean Breeze Properties LLC A56S G 0.067 0.280 0.280 M<br />
Hillsborough 3060 Lee Te Kim A480 G 0.018 0.146 0.146 M<br />
Hillsborough 3100 J A Clark III & Linda G Clark A415 G 0.066 0.085 0.085 M<br />
Hillsborough 3120 James Newsome, Trustee A535 G 0.074 0.146 0.146 M<br />
Hillsborough 3217 Strawberry Red Ranch LLC A535 G 0.145 0.304 0.304 M<br />
Hillsborough 3217 Strawberry Red Ranch LLC A535 S 0.152 0.304 0.304 M<br />
Hillsborough 3251 Glenn & Frances Williamson A535 G 0.339 0.494 0.494 M<br />
Hillsborough 3251 Glenn & Frances Williamson A535 S 0.000 0.494 0.494 M<br />
Hillsborough 3417 Ag‐Mart Produce Inc A56S G 0.675 1.177 1.177 M<br />
Hillsborough 3417 Ag‐Mart Produce Inc A56S S 0.174 1.177 1.177 M<br />
Hillsborough 3430 Young Farms A56F G 0.001 0.146 0.146 M<br />
Hillsborough 3455 Corporation Of The Presiding Bishop A56S G 0.208 0.499 0.499 M<br />
Hillsborough 3578 Charles & Jean Fulford A485 G 0.065 0.208 0.208 M<br />
Hillsborough 3578 Charles & Jean Fulford A485 S 0.000 0.208 0.208 M<br />
Hillsborough 3712 Sam Astin III & Buffy S Astin A535 G 0.097 0.136 0.136 M<br />
M/E 5<br />
Page | 209
<strong>2011</strong> ESTIMATED WATER USE REPORT<br />
Table A7. Metered and <strong>Estimated</strong> Agricultural WUPs, Withdrawals and Permitted <strong>Use</strong> (mgd), <strong>2011</strong><br />
County<br />
WUP<br />
Number<br />
<strong>Southwest</strong> <strong>Florida</strong> <strong>Water</strong> <strong>Management</strong> District<br />
Permittee<br />
<strong>Use</strong><br />
Code 1<br />
Source 2<br />
Annual<br />
Average<br />
Pumpage 3<br />
Total<br />
Permitted<br />
Annual<br />
Average<br />
Quantity<br />
Permitted<br />
Quantity<br />
Attributed<br />
to AG <strong>Use</strong><br />
Category 4<br />
Hillsborough 3712 Sam Astin III & Buffy S Astin A535 S 0.000 0.136 0.136 M<br />
Hillsborough 3716 Goodson Farms Inc A535 G 0.119 0.130 0.130 M<br />
Hillsborough 3718 Rick Chancey Farms Inc. A655 G 0.000 0.113 0.113 M<br />
Hillsborough 3718 Rick Chancey Farms Inc. A655 S 0.000 0.113 0.113 M<br />
Hillsborough 3997 Favorite Farms Inc A58H G 0.061 0.172 0.172 M<br />
Hillsborough 3997 Favorite Farms Inc A58H S 0.003 0.172 0.172 M<br />
Hillsborough 4004 S Williamson A535 G 0.000 0.092 0.092 M<br />
Hillsborough 4261 Loop Farms, LLC A535 G 0.000 0.386 0.386 M<br />
Hillsborough 4261 Loop Farms, LLC A535 S 0.000 0.386 0.386 M<br />
Hillsborough 4382 Jeff Powell A51S G 0.000 0.150 0.150 M<br />
Hillsborough 4536 C Dennis Carlton A535 G 0.069 0.216 0.216 M<br />
Hillsborough 4622 C.W. Dukes Trust A535 G 0.000 0.032 0.032 M<br />
Hillsborough 4689 Council Growers Inc A415 G 0.198 0.212 0.212 M<br />
Hillsborough 4723 Berkshire Investments A44S G 0.193 0.390 0.390 M<br />
Hillsborough 4748 William K. Keene And Mary Laverne Lett Keene A535 G 0.099 0.135 0.135 M<br />
Hillsborough 4821 Sydney Farms Inc A470 G 0.138 0.417 0.417 M<br />
Hillsborough 4829 Alafia Berry Farms, LLC A535 G 0.003 0.100 0.100 M<br />
Hillsborough 4870 Richard & Gwendolyn Landrigan A415 G 0.075 0.145 0.145 M<br />
Hillsborough 4870 Richard & Gwendolyn Landrigan A415 S 0.000 0.145 0.145 M<br />
Hillsborough 5204 Glenn & Frances Williamson A535 G 0.120 0.123 0.123 M<br />
Hillsborough 5258 Samuel D & Anne M Williamson A535 G 0.063 0.134 0.134 M<br />
Hillsborough 5318 Alan Jones A415 G 0.038 0.094 0.094 M<br />
Hillsborough 5386 Samuel D & Anne M Williamson A535 G 0.055 0.229 0.229 M<br />
Hillsborough 5386 Samuel D & Anne M Williamson A535 S 0.000 0.229 0.229 M<br />
Hillsborough 5800 Rand Reese A415 G 0.117 0.154 0.154 M<br />
Hillsborough 6007 Felton C Walker Jr A56F G 0.121 0.354 0.354 M<br />
Hillsborough 6020 Big Tree Nursery A480 G 0.084 0.243 0.243 M<br />
Hillsborough 6043 Sassy Fruit Company A415 G 0.012 0.062 0.062 M<br />
Hillsborough 6095 Bruce E White A535 G 0.012 0.158 0.158 M<br />
Hillsborough 6130 Samuel D & Anne M Williamson A535 G 0.045 0.095 0.095 M<br />
Hillsborough 6203 Wayne & Gerald Davis & Ml Davis Dba Davis Farms A56S G 0.080 0.839 0.839 M<br />
M/E 5<br />
Page | 210
<strong>2011</strong> ESTIMATED WATER USE REPORT<br />
Table A7. Metered and <strong>Estimated</strong> Agricultural WUPs, Withdrawals and Permitted <strong>Use</strong> (mgd), <strong>2011</strong><br />
County<br />
WUP<br />
Number<br />
<strong>Southwest</strong> <strong>Florida</strong> <strong>Water</strong> <strong>Management</strong> District<br />
Permittee<br />
<strong>Use</strong><br />
Code 1<br />
Source 2<br />
Annual<br />
Average<br />
Pumpage 3<br />
Total<br />
Permitted<br />
Annual<br />
Average<br />
Quantity<br />
Permitted<br />
Quantity<br />
Attributed<br />
to AG <strong>Use</strong><br />
Category 4<br />
Hillsborough 6259 Ag‐Mart Produce Inc A56S G 0.156 0.301 0.301 M<br />
Hillsborough 6313 BBS Farms Inc A535 S 0.188 0.207 0.207 M<br />
Hillsborough 6337 Favorite Farms Inc A535 G 0.179 0.249 0.249 M<br />
Hillsborough 6337 Favorite Farms Inc A535 S 0.000 0.249 0.249 M<br />
Hillsborough 6360 Hardy Huntley A56S G 0.000 0.104 0.104 M<br />
Hillsborough 6371 Summerfield Farms Inc/Thomas Miller A50F G 0.479 1.332 1.332 M<br />
Hillsborough 6413 Hillsborough Co Real Estate Dept A415 G 0.000 0.198 0.198 M<br />
Hillsborough 6413 Hillsborough Co Real Estate Dept A415 S 0.000 0.198 0.198 M<br />
Hillsborough 6420 Linda Lawton‐ DKL Properties, LLC A535 G 0.099 0.106 0.101 M<br />
Hillsborough 6420 Linda Lawton‐ DKL Properties, LLC A535 S 0.000 0.106 0.101 M<br />
Hillsborough 6443 Robert L & Gloria J Platt A480 G 0.122 0.187 0.187 M<br />
Hillsborough 6443 Robert L & Gloria J Platt A480 S 0.000 0.187 0.187 M<br />
Hillsborough 6449 Lowell Kinard A535 G 0.024 0.082 0.082 M<br />
Hillsborough 6480 Sam III A535 G 0.078 0.157 0.157 M<br />
Hillsborough 6480 Sam III A535 S 0.000 0.157 0.157 M<br />
Hillsborough 6523 Loop Farms, LLC, Attn: Jack P. Sizemore Jr. A415 G 0.091 0.085 0.085 M<br />
Hillsborough 6535 Mosaic Fertlizer LLC A525 G 0.106 0.274 0.274 M<br />
Hillsborough 6622 Marcus G & Sarah F Williamson A535 G 0.083 0.158 0.158 M<br />
Hillsborough 6661 Suburban Land Reserve Inc A465 G 0.120 0.442 0.442 M<br />
Hillsborough 6661 Suburban Land Reserve Inc A465 S 0.000 0.442 0.442 M<br />
Hillsborough 6678 Allison W Repetto A655 G 0.233 0.234 0.234 M<br />
Hillsborough 6749 Philip A. and Joyce E. Vinson A655 G 0.072 0.115 0.115 M<br />
Hillsborough 6851 Robert M & Mary Jane Rogers A480 G 0.185 0.276 0.276 M<br />
Hillsborough 6892 Andrew Dew Leung & Yeeho Chu A56S G 0.024 0.532 0.532 M<br />
Hillsborough 7035 BBS Farms Inc A535 G 0.120 0.176 0.176 M<br />
Hillsborough 7049 Carl Pippin A535 G 0.078 0.192 0.192 M<br />
Hillsborough 7058 Gerald Davis, Inc. A480 G 0.082 0.101 0.101 M<br />
Hillsborough 7059 Charlie Grimes Farms, LLC A535 G 0.175 0.130 0.130 M<br />
Hillsborough 7059 Charlie Grimes Farms, LLC A535 S 0.068 0.130 0.130 M<br />
Hillsborough 7082 Robert L and Barbara A Carter, Trustees A535 G 0.219 0.139 0.139 M<br />
Hillsborough 7082 Robert L and Barbara A Carter, Trustees A535 S 0.000 0.139 0.139 M<br />
M/E 5<br />
Page | 211
<strong>2011</strong> ESTIMATED WATER USE REPORT<br />
Table A7. Metered and <strong>Estimated</strong> Agricultural WUPs, Withdrawals and Permitted <strong>Use</strong> (mgd), <strong>2011</strong><br />
County<br />
WUP<br />
Number<br />
<strong>Southwest</strong> <strong>Florida</strong> <strong>Water</strong> <strong>Management</strong> District<br />
Permittee<br />
<strong>Use</strong><br />
Code 1<br />
Source 2<br />
Annual<br />
Average<br />
Pumpage 3<br />
Total<br />
Permitted<br />
Annual<br />
Average<br />
Quantity<br />
Permitted<br />
Quantity<br />
Attributed<br />
to AG <strong>Use</strong><br />
Category 4<br />
Hillsborough 7102 Robert E & Helen A Parke A535 G 0.193 0.200 0.200 M<br />
Hillsborough 7105 Riverview Grove LTD A415 G 0.244 0.184 0.184 M<br />
Hillsborough 7126 Mosaic Fertilizer LLC A525 G 0.048 0.263 0.263 M<br />
Hillsborough 7135 Balm Associates, Inc. A535 G 0.116 0.224 0.224 M<br />
Hillsborough 7190 Dennis & Linda L Spivey & William J Rushing Life Estate A535 G 0.009 0.171 0.171 M<br />
Hillsborough 7239 Riverview Flower Farm Partnership A480 G 0.040 0.140 0.140 M<br />
Hillsborough 7239 Riverview Flower Farm Partnership A480 S 0.000 0.140 0.140 M<br />
Hillsborough 7260 Apollo Beach Investments, LP A56S G 0.000 0.243 0.243 M<br />
Hillsborough 7286 Keith C. Simmons, Trustee A535 G 0.000 0.095 0.095 M<br />
Hillsborough 7405 John, Robert and Katherine St. Martin A535 G 0.000 0.037 0.037 M<br />
Hillsborough 7405 John, Robert and Katherine St. Martin A535 S 0.000 0.037 0.037 M<br />
Josiah W Willis, Linda Willis, Josiah E Willis & Margaret<br />
G<br />
Hillsborough 7451 Willis<br />
A56F<br />
0.254 0.621 0.621<br />
M<br />
Hillsborough 7466 W. A. and Lillie M. Greene A535 G 0.001 0.034 0.034 M<br />
Hillsborough 7512 Paul Elliott A480 G 0.000 0.130 0.130 M<br />
Hillsborough 7512 Paul Elliott A480 S 0.000 0.130 0.130 M<br />
Hillsborough 7513 Best Deal Blueberries LLC A410 G 0.000 0.076 0.076 M<br />
Hillsborough 7586 Hwy 92 Real Estate Investments LLC A480 G 0.022 0.150 0.150 M<br />
Hillsborough 7591 Corporation Of The Presiding Bishop A56S G 0.467 1.037 1.037 M<br />
Hillsborough 7607 Jaymar Farms Inc A535 G 0.524 0.444 0.444 M<br />
Hillsborough 7607 Jaymar Farms Inc A535 S 0.251 0.444 0.444 M<br />
Hillsborough 7622 Clark Farms Inc. A415 G 0.039 0.092 0.092 M<br />
Hillsborough 7640 Robert H. & Peggy E. Parke A535 G 0.179 0.277 0.277 M<br />
Hillsborough 7640 Robert H. & Peggy E. Parke A535 S 0.000 0.277 0.277 M<br />
Hillsborough 7681 Frank Diehl A56S G 0.230 0.397 0.397 M<br />
Hillsborough 7696 Glenn And Sarah Williamson A44S G 0.097 0.129 0.129 M<br />
Hillsborough 7697 Westlake Village LLC A415 G 0.000 0.076 0.076 M<br />
Hillsborough 7766 BBS Farms, Inc. A56S G 0.192 0.294 0.294 M<br />
Hillsborough 7770 Transcend Development Corp. A535 G 0.000 0.222 0.222 M<br />
Hillsborough 7770 Transcend Development Corp. A535 S 0.000 0.222 0.222 M<br />
Hillsborough 7895 Tami McKnight Trustee GDK Land Trust A480 G 0.269 0.386 0.386 M<br />
M/E 5<br />
Page | 212
<strong>2011</strong> ESTIMATED WATER USE REPORT<br />
Table A7. Metered and <strong>Estimated</strong> Agricultural WUPs, Withdrawals and Permitted <strong>Use</strong> (mgd), <strong>2011</strong><br />
County<br />
WUP<br />
Number<br />
<strong>Southwest</strong> <strong>Florida</strong> <strong>Water</strong> <strong>Management</strong> District<br />
Permittee<br />
<strong>Use</strong><br />
Code 1<br />
Source 2<br />
Annual<br />
Average<br />
Pumpage 3<br />
Total<br />
Permitted<br />
Annual<br />
Average<br />
Quantity<br />
Permitted<br />
Quantity<br />
Attributed<br />
to AG <strong>Use</strong><br />
Category 4<br />
Hillsborough 8016 Dooley Groves A415 G 0.017 0.126 0.126 M<br />
Hillsborough 8036 C. Dennis Carlton, Sr M Carlton III A470 G 0.271 0.440 0.440 M<br />
Hillsborough 8048 Roy Davis A485 G 0.171 0.282 0.282 M<br />
Hillsborough 8048 Roy Davis A485 S 0.000 0.282 0.282 M<br />
Hillsborough 8173 Sam Astin III & Sam Astin Jr & Betty Astin Trustees A535 G 0.000 0.190 0.190 M<br />
Hillsborough 8173 Sam Astin III & Sam Astin Jr & Betty Astin Trustees A535 S 0.124 0.190 0.190 M<br />
Hillsborough 8176 Albritton & Sons Ltd A415 G 0.196 0.158 0.158 M<br />
Hillsborough 8202 Sam Astin III & Buffy S Astin A535 G 0.013 0.144 0.144 M<br />
Hillsborough 8202 Sam Astin III & Buffy S Astin A535 S 0.000 0.144 0.144 M<br />
Hillsborough 8342 Loop Farms, LLC A470 G 0.340 0.489 0.489 M<br />
Hillsborough 8342 Loop Farms, LLC A470 S 0.000 0.489 0.489 M<br />
Hillsborough 8410 Russell Weiss and Kirk Weiss A487 G 0.169 0.156 0.156 M<br />
Hillsborough 8416 Plant City Investments A535 G 0.032 0.179 0.179 M<br />
Hillsborough 8416 Plant City Investments A535 S 0.000 0.179 0.179 M<br />
Hillsborough 8445 Douglas Holmbert A535 G 0.402 0.499 0.499 M<br />
Hillsborough 8450 Farmland Reserve Inc. A56F G 0.759 1.061 1.061 M<br />
Hillsborough 8687 William K & Mary L Keene, Trustee A535 G 0.002 0.101 0.101 M<br />
Hillsborough 8687 William K & Mary L Keene, Trustee A535 S 0.000 0.101 0.101 M<br />
Hillsborough 8729 Allison W Repetto A495 G 0.000 0.106 0.106 M<br />
Hillsborough 8748 G & D Farms Inc A535 G 0.159 0.245 0.245 M<br />
Hillsborough 8793 Joseph Jr & Anita Diaz & Damon C L660 G 0.354 0.481 0.481 M<br />
Hillsborough 8810 Roger Wright A525 G 0.000 0.317 0.317 M<br />
Hillsborough 8873 Sam Jr & Betty Astin A535 G 0.106 0.179 0.176 M<br />
Hillsborough 8873 Sam Jr & Betty Astin A535 S 0.000 0.179 0.176 M<br />
Hillsborough 9024 David P & Carole J Council A56S G 0.060 0.112 0.112 M<br />
Hillsborough 9194 R. P. Co., Inc L660 G 0.427 0.685 0.685 M<br />
Hillsborough 9224 Charles G & Betty Grimes A535 G 0.163 0.447 0.447 M<br />
Hillsborough 9368 Westlake Village LLC A56S G 0.000 0.341 0.341 M<br />
Hillsborough 9387 NNP Southbend II LLC A485 G 0.002 1.033 1.033 M<br />
Hillsborough 9418 Fancy Farms Inc A535 G 0.164 0.185 0.184 M<br />
Hillsborough 9489 Holmberg Farms Inc. A525 G 0.327 1.780 1.780 M<br />
M/E 5<br />
Page | 213
<strong>2011</strong> ESTIMATED WATER USE REPORT<br />
Table A7. Metered and <strong>Estimated</strong> Agricultural WUPs, Withdrawals and Permitted <strong>Use</strong> (mgd), <strong>2011</strong><br />
County<br />
WUP<br />
Number<br />
<strong>Southwest</strong> <strong>Florida</strong> <strong>Water</strong> <strong>Management</strong> District<br />
Permittee<br />
<strong>Use</strong><br />
Code 1<br />
Source 2<br />
Annual<br />
Average<br />
Pumpage 3<br />
Total<br />
Permitted<br />
Annual<br />
Average<br />
Quantity<br />
Permitted<br />
Quantity<br />
Attributed<br />
to AG <strong>Use</strong><br />
Category 4<br />
Hillsborough 9489 Holmberg Farms Inc. A525 S 0.407 1.780 1.780 M<br />
Hillsborough 9585 Ocean Breeze Properties LLC A525 G 0.158 0.435 0.435 M<br />
Hillsborough 9585 Ocean Breeze Properties LLC A525 S 0.000 0.435 0.435 M<br />
Hillsborough 9611 Carlos S. Ramirez, Trustee A535 G 0.147 0.186 0.186 M<br />
Hillsborough 9612 Loop Farms, LLC A495 G 0.000 0.261 0.261 M<br />
Hillsborough 9633 G & D Farms, Inc. A535 G 0.247 0.200 0.200 M<br />
Hillsborough 9633 G & D Farms, Inc. A535 S 0.000 0.200 0.200 M<br />
Hillsborough 9674 Charlie Grimes Farms, LLC A535 G 0.042 0.119 0.119 M<br />
Hillsborough 9915 S & J Farms Inc Attn Pete Beaty A415 G 0.416 0.293 0.293 M<br />
Hillsborough 9980 Ronnie and Betty Hall A535 G 0.000 0.029 0.029 M<br />
Hillsborough 10007 Steve McDonald A470 G 0.004 0.310 0.310 M<br />
Hillsborough 10007 Steve McDonald A470 S 0.009 0.310 0.310 M<br />
Hillsborough 10021 Eljay Properties, LLP L661 G 0.303 0.450 0.450 M<br />
Hillsborough 10140 Waste Services of <strong>Florida</strong> Inc A470 G 0.007 0.159 0.142 M<br />
Hillsborough 10140 Waste Services of <strong>Florida</strong> Inc A470 S 0.000 0.159 0.142 M<br />
Hillsborough 10345 S & H Mathis, LLC A535 G 0.000 0.097 0.097 M<br />
Hillsborough 10356 Sumner Cattle Company, LLC L600 G 0.001 0.122 0.122 M<br />
Hillsborough 10461 Wayne G. Moss A535 G 0.038 0.117 0.117 M<br />
Hillsborough 10461 Wayne G. Moss A535 S 0.000 0.117 0.117 M<br />
Hillsborough 10466 Sun City Tree Farms, A <strong>Florida</strong> General Partnership A480 G 0.101 0.281 0.281 M<br />
Hillsborough 10654 Ellel Ministries USA Inc A535 G 0.000 0.235 0.233 M<br />
Hillsborough 10654 Ellel Ministries USA Inc A535 S 0.000 0.235 0.233 M<br />
Hillsborough 10688 Ronald L. McClendon A535 G 0.100 0.235 0.235 M<br />
Hillsborough 10688 Ronald L. McClendon A535 S 0.000 0.235 0.235 M<br />
Hillsborough 10755 Aman Enterprises LLC A535 G 0.062 0.201 0.201 M<br />
Hillsborough 10755 Aman Enterprises LLC A535 S 0.002 0.201 0.201 M<br />
Hillsborough 10824 Donald O & Mary Ann Lloyd A535 G 0.053 0.203 0.203 M<br />
Hillsborough 10824 Donald O & Mary Ann Lloyd A535 S 0.000 0.203 0.203 M<br />
Hillsborough 10914 Allison W Repetto A535 G 0.014 0.148 0.148 M<br />
Hillsborough 10999 Hopewell Land Partners Limited A415 G 0.034 0.147 0.147 M<br />
Hillsborough 10999 Hopewell Land Partners Limited A415 S 0.066 0.147 0.147 M<br />
M/E 5<br />
Page | 214
<strong>2011</strong> ESTIMATED WATER USE REPORT<br />
Table A7. Metered and <strong>Estimated</strong> Agricultural WUPs, Withdrawals and Permitted <strong>Use</strong> (mgd), <strong>2011</strong><br />
County<br />
WUP<br />
Number<br />
<strong>Southwest</strong> <strong>Florida</strong> <strong>Water</strong> <strong>Management</strong> District<br />
Permittee<br />
<strong>Use</strong><br />
Code 1<br />
Source 2<br />
Annual<br />
Average<br />
Pumpage 3<br />
Total<br />
Permitted<br />
Annual<br />
Average<br />
Quantity<br />
Permitted<br />
Quantity<br />
Attributed<br />
to AG <strong>Use</strong><br />
Category 4<br />
Hillsborough 11164 Clifford Gude, Jr A535 G 0.096 0.134 0.134 M<br />
Hillsborough 11181 Batista & Evelyn Madonia A56S G 0.388 1.591 1.590 M<br />
Hillsborough 11181 Batista & Evelyn Madonia A56S S 0.000 1.591 1.590 M<br />
Hillsborough 11457 Futch Properties Inc A535 G 0.098 0.249 0.249 M<br />
Hillsborough 11457 Futch Properties Inc A535 S 0.000 0.249 0.249 M<br />
Hillsborough 11491 Hardy Huntley A535 G 0.001 0.122 0.122 M<br />
Hillsborough 11661 C Carlton A415 G 0.081 0.162 0.162 M<br />
Hillsborough 11726 Winfred M & Edna Sue Harrell A480 G 0.174 0.206 0.206 M<br />
Hillsborough 11726 Winfred M & Edna Sue Harrell A480 S 0.000 0.206 0.206 M<br />
Hillsborough 11810 Everett F & Sharon Prevatt Ttee A535 G 0.189 0.219 0.219 M<br />
Hillsborough 11810 Everett F & Sharon Prevatt Ttee A535 S 0.000 0.219 0.219 M<br />
Hillsborough 11916 Janet L Goodson A44S G 0.182 0.300 0.300 M<br />
Hillsborough 12287 Neville C Sr & Raynell S Davis Rev Living Tst A535 G 0.044 0.139 0.139 M<br />
Hillsborough 12315 Robert H Parke & Peggy E Parke A535 S 0.008 0.127 0.127 M<br />
Hillsborough 12329 Dover Real Estate Investments LLC A480 G 0.082 0.118 0.118 M<br />
Hillsborough 12350 John G And James Austin Maring A535 G 0.115 0.147 0.147 M<br />
Hillsborough 12361 Dimare Ruskin LLC., Attn: Ronald Folwell A56S G 0.315 0.604 0.604 M<br />
Hillsborough 12452 Goodson Farms Inc & Summerfield Farms Inc A44S G 0.438 0.792 0.792 M<br />
Hillsborough 12456 Agregy Renewables, LLC L660 G 0.002 0.171 0.171 M<br />
Hillsborough 12514 Dan S & Joani J Tillett A56S G 0.310 0.473 0.393 M<br />
Hillsborough 12514 Dan S & Joani J Tillett A56S S 0.000 0.473 0.393 M<br />
Hillsborough 12523 University Of <strong>Florida</strong> IFAS Fac & Planning Operations A520 G 0.091 0.345 0.345 M<br />
Hillsborough 12572 Mosaic Phosphates Co A56S G 0.808 1.344 1.344 M<br />
Hillsborough 12639 WHS Land LLC A480 G 0.091 0.306 0.306 M<br />
Hillsborough 12639 WHS Land LLC A480 S 0.000 0.306 0.306 M<br />
Hillsborough 12836 Tampa Groves LLC A415 G 0.000 0.247 0.155 M<br />
Hillsborough 12836 Tampa Groves LLC A415 S 0.000 0.247 0.155 M<br />
Hillsborough 12859 Carlos S. Ramirez, Trustee A535 G 0.000 0.028 0.028 M<br />
Hillsborough 13087 Bruce A & Marie C Rumph A480 G 0.004 0.120 0.120 M<br />
Hillsborough 20061 Tampa Electric Co A535 S 0.009 0.007 0.007 M<br />
Hillsborough 71 Charles Gordon Grimes Sr A56S G 0.049 0.085 0.07 E<br />
M/E 5<br />
Page | 215
<strong>2011</strong> ESTIMATED WATER USE REPORT<br />
Table A7. Metered and <strong>Estimated</strong> Agricultural WUPs, Withdrawals and Permitted <strong>Use</strong> (mgd), <strong>2011</strong><br />
County<br />
WUP<br />
Number<br />
<strong>Southwest</strong> <strong>Florida</strong> <strong>Water</strong> <strong>Management</strong> District<br />
Permittee<br />
<strong>Use</strong><br />
Code 1<br />
Source 2<br />
Annual<br />
Average<br />
Pumpage 3<br />
Total<br />
Permitted<br />
Annual<br />
Average<br />
Quantity<br />
Permitted<br />
Quantity<br />
Attributed<br />
to AG <strong>Use</strong><br />
Category 4<br />
Hillsborough 75 Glenn Williamson A535 G 0.023 0.063 0.063 E<br />
Hillsborough 85 J.C.Strickland Kocsis A415 G 0.02 0.033 0.033 E<br />
Hillsborough 86 Ferris S & Peggy Waller A415 G 0.058 0.097 0.097 E<br />
Hillsborough 88 Skewlee Road Nursery Inc A485 G 0.014 0.045 0.045 E<br />
Hillsborough 91 Spencer John Buzbee Jr L661 G 0.024 0.039 0.039 E<br />
Hillsborough 104 Lloyd & Linda D Ohara A480 G 0.012 0.02 0.02 E<br />
Hillsborough 106 Estate Of Carl F. Cowgill, Jr. A480 G 0.014 0.022 0.022 E<br />
Hillsborough 119 Alvin & Crea & Clinton Beauchamp & Betty Jean Felty A535 G 0.005 0.04 0.04 E<br />
Hillsborough 119 Alvin & Crea & Clinton Beauchamp & Betty Jean Felty A535 S 0.01 0.04 0.04 E<br />
Hillsborough 138 Brannan Living Trust A415 G 0.051 0.072 0.071 E<br />
Hillsborough 147 Lucille Harwell A535 G 0.017 0.037 0.037 E<br />
Hillsborough 147 Lucille Harwell A535 S 0 0.037 0.037 E<br />
Hillsborough 161 South Hills Grove, LLC A415 G 0.053 0.074 0.074 E<br />
Hillsborough 179 E W Simmons Jr Carol Simmons & E W Simmons III A535 G 0.037 0.06 0.06 E<br />
Hillsborough 181 Helen Geraldine Mitchell A535 G 0.03 0.049 0.049 E<br />
Hillsborough 192 Plant City Presbyterian Church, Inc. A415 G 0.01 0.02 0.017 E<br />
Hillsborough 200 N R Keene Groves Inc A415 G 0.04 0.055 0.055 E<br />
Hillsborough 202 N R Keene Groves Inc A415 G 0.047 0.077 0.077 E<br />
Hillsborough 243 Echo Lake Grove Corporation A415 G 0.047 0.065 0.065 E<br />
Hillsborough 277 Gary R & Terri L Parke A56S G 0.051 0.08 0.08 E<br />
Hillsborough 278 Jaymar Produce Inc A <strong>Florida</strong> Corp A415 G 0.039 0.064 0.064 E<br />
Hillsborough 281 William L Allen Trust A415 G 0.013 0.021 0.021 E<br />
Hillsborough 287 John Holland A415 G 0.005 0.008 0.008 E<br />
Hillsborough 289 Grantham Epps Revocable Trust Ua & Betty J Epps A480 G 0.013 0.041 0.041 E<br />
Hillsborough 362 James Redman A415 G 0.008 0.013 0.013 E<br />
Hillsborough 366 Wilbur A. Smith And Nelda B. Smith, Trustees A535 G 0.045 0.073 0.073 E<br />
Hillsborough 381 Charles G‐Betty J‐And Deborah Grimes A535 G 0.059 0.107 0.107 E<br />
Hillsborough 391 Brent Register A415 G 0.016 0.026 0.026 E<br />
Hillsborough 411 Hillsborough County BOCC, Attn:Kurt Gremley A495 G 0.187 0.305 0.305 E<br />
Hillsborough 412 Kay D O'Rourke L610 G 0.001 0.001 0.001 E<br />
Hillsborough 417 Benson O & Debbie Dukes A535 G 0.023 0.037 0.037 E<br />
M/E 5<br />
Page | 216
<strong>2011</strong> ESTIMATED WATER USE REPORT<br />
Table A7. Metered and <strong>Estimated</strong> Agricultural WUPs, Withdrawals and Permitted <strong>Use</strong> (mgd), <strong>2011</strong><br />
County<br />
WUP<br />
Number<br />
<strong>Southwest</strong> <strong>Florida</strong> <strong>Water</strong> <strong>Management</strong> District<br />
Permittee<br />
<strong>Use</strong><br />
Code 1<br />
Source 2<br />
Annual<br />
Average<br />
Pumpage 3<br />
Total<br />
Permitted<br />
Annual<br />
Average<br />
Quantity<br />
Permitted<br />
Quantity<br />
Attributed<br />
to AG <strong>Use</strong><br />
Category 4<br />
Hillsborough 433 Andrew P Gutierrez Trust A415 G 0.006 0.009 0.009 E<br />
Hillsborough 449 Florence Wilson Trust Agreement C/O Beverly Echardt A415 G 0.027 0.045 0.045 E<br />
Hillsborough 453 Thomas R. Townsend (Valley Fisheries) L660 G 0.044 0.072 0.072 E<br />
Hillsborough 462 Virginia Halbrook Little A495 G 0.003 0.006 0.006 E<br />
Hillsborough 477 David L Bryner A485 G 0.012 0.019 0.019 E<br />
Hillsborough 486 Winifred & Sue Harrell Investments LLLP A480 G 0.019 0.031 0.031 E<br />
Hillsborough 487 Douglas Holmberg A51S G 0.043 0.062 0.062 E<br />
Hillsborough 495 Bonnie F Wetherington Trustee A535 G 0.069 0.095 0.095 E<br />
Hillsborough 495 Bonnie F Wetherington Trustee A535 S 0 0.095 0.095 E<br />
Hillsborough 496 School Board of Hillsborough County A415 G 0.008 0.013 0.013 E<br />
Hillsborough 498 Joseph Di Gerlando A415 G 0.05 0.069 0.069 E<br />
500 D. Dianne Bryant, Trustee Herman Prosch Revocable A535<br />
0.011 0.035 0.035<br />
Hillsborough<br />
Trust<br />
G<br />
E<br />
Hillsborough 505 Allens Acres Inc A415 G 0.006 0.009 0.009 E<br />
Hillsborough 521 Esfandiar and Marian ShafII A415 G 0.009 0.015 0.015 E<br />
Hillsborough 522 Joyce T Wetherington A415 G 0.018 0.029 0.029 E<br />
Hillsborough 523 Joyce T Wetherington A415 G 0.017 0.028 0.028 E<br />
Hillsborough 524 Howell Alafia Groves Inc A415 G 0.013 0.021 0.021 E<br />
Hillsborough 530 Walter C. Pratt & Rosemarie Howell A415 G 0.038 0.052 0.052 E<br />
Hillsborough 534 Farkas Groves, Inc. A415 G 0.02 0.033 0.033 E<br />
Hillsborough 535 Farkas Groves, Inc. A415 G 0.022 0.037 0.037 E<br />
Hillsborough 536 Farkas Groves, Inc. A415 G 0.023 0.038 0.038 E<br />
Hillsborough 553 Dora N And William P Stokes A535 G 0.018 0.03 0.03 E<br />
Hillsborough 563 Howard Groff Tropical Fish Farm Inc L660 G 0.013 0.021 0.021 E<br />
Hillsborough 565 Medley Groves Inc A415 G 0.029 0.047 0.047 E<br />
Hillsborough 566 Medley Groves Inc A415 G 0.012 0.02 0.02 E<br />
Hillsborough 569 <strong>Southwest</strong> Fla <strong>Water</strong> Mgt District L660 G 0.01 0.031 0.031 E<br />
Hillsborough 571 Sam Astin, III A535 G 0 0.019 0.019 E<br />
Hillsborough 571 Sam Astin, III A535 S 0.006 0.019 0.019 E<br />
Hillsborough 583 Troy Puleo L600 G 0 0.001 0.001 E<br />
Hillsborough 605 Virginia A, Edward & Kim Zagar And Tampa Electric Co A415 G 0.019 0.031 0.031 E<br />
M/E 5<br />
Page | 217
<strong>2011</strong> ESTIMATED WATER USE REPORT<br />
Table A7. Metered and <strong>Estimated</strong> Agricultural WUPs, Withdrawals and Permitted <strong>Use</strong> (mgd), <strong>2011</strong><br />
County<br />
WUP<br />
Number<br />
<strong>Southwest</strong> <strong>Florida</strong> <strong>Water</strong> <strong>Management</strong> District<br />
Permittee<br />
<strong>Use</strong><br />
Code 1<br />
Source 2<br />
Annual<br />
Average<br />
Pumpage 3<br />
Total<br />
Permitted<br />
Annual<br />
Average<br />
Quantity<br />
Permitted<br />
Quantity<br />
Attributed<br />
to AG <strong>Use</strong><br />
Category 4<br />
Hillsborough 630 David R & Sheryl C Hummel A415 G 0.019 0.031 0.031 E<br />
Hillsborough 650 Gladys Brown Stanaland A415 G 0.003 0.005 0.005 E<br />
Hillsborough 654 Council Bay Farms LTD A56S G 0.165 0.299 0.299 E<br />
Hillsborough 657 Property Reserve, Inc. A490 G 0.02 0.033 0.033 E<br />
Hillsborough 704 Christopher W. & Jacqueline M. Sizemore A415 G 0 0.026 0.026 E<br />
Hillsborough 711 William Colby A415 G 0.009 0.015 0.015 E<br />
Hillsborough 760 Wilbur Brantley A415 G 0.048 0.066 0.066 E<br />
Hillsborough 786 William R McClelland A535 G 0.016 0.035 0.035 E<br />
Hillsborough 786 William R McClelland A535 S 0.006 0.035 0.035 E<br />
Hillsborough 788 Hinton Enterprises Of Sydney Inc A535 G 0.015 0.076 0.076 E<br />
Hillsborough 788 Hinton Enterprises Of Sydney Inc A535 S 0.031 0.076 0.076 E<br />
Hillsborough 836 Mella J Lewis Life Estate A535 G 0.041 0.071 0.071 E<br />
Hillsborough 836 Mella J Lewis Life Estate A535 S 0.009 0.071 0.071 E<br />
837 James, Myrtle, Joe, Jay, Carol, Juanita, Robert & Jenna L650<br />
0.011 0.018 0.018<br />
Hillsborough<br />
McCormick<br />
G<br />
E<br />
Hillsborough 840 Corrie L Lariscy A535 G 0.018 0.03 0.03 E<br />
Hillsborough 842 Maury & Carolyn Linkous A415 G 0.022 0.036 0.036 E<br />
857 <strong>Florida</strong> Strawberry Research & Education Foundation A535<br />
0.026 0.042 0.042<br />
G<br />
Hillsborough<br />
Inc<br />
E<br />
Hillsborough 870 Blanche Shore Oswald Trustee et al A50F G 0.018 0.03 0.03 E<br />
Hillsborough 873 Steve, Albert & Martha Lindsey And Betty Howard A535 G 0.027 0.086 0.086 E<br />
Hillsborough 873 Steve, Albert & Martha Lindsey And Betty Howard A535 S 0.001 0.086 0.086 E<br />
Hillsborough 877 Meralex Farm Inc A415 G 0.008 0.087 0.017 E<br />
Hillsborough 887 Henry Towery A415 G 0.003 0.005 0.005 E<br />
Hillsborough 906 E.S. Terry A535 G 0.026 0.042 0.042 E<br />
Hillsborough 908 Irene St. Martin, John F. St. Martin A655 G 0.039 0.064 0.064 E<br />
Hillsborough 927 Gregory C Prevatt L660 G 0.023 0.038 0.038 E<br />
Hillsborough 953 Sandra R. Cameron A415 G 0.059 0.082 0.082 E<br />
Hillsborough 979 D & L Land Partners Inc A415 G 0.017 0.027 0.027 E<br />
Hillsborough 980 Cardanell Farm L610 G 0 0 0 E<br />
Hillsborough 988 Mosaic Fertilizer, LLC A415 G 0.019 0.031 0.031 E<br />
M/E 5<br />
Page | 218
<strong>2011</strong> ESTIMATED WATER USE REPORT<br />
Table A7. Metered and <strong>Estimated</strong> Agricultural WUPs, Withdrawals and Permitted <strong>Use</strong> (mgd), <strong>2011</strong><br />
County<br />
WUP<br />
Number<br />
<strong>Southwest</strong> <strong>Florida</strong> <strong>Water</strong> <strong>Management</strong> District<br />
Permittee<br />
<strong>Use</strong><br />
Code 1<br />
Source 2<br />
Annual<br />
Average<br />
Pumpage 3<br />
Total<br />
Permitted<br />
Annual<br />
Average<br />
Quantity<br />
Permitted<br />
Quantity<br />
Attributed<br />
to AG <strong>Use</strong><br />
Category 4<br />
Hillsborough 989 Esfandiar ShafII A415 G 0.038 0.052 0.052 E<br />
Hillsborough 992 Be Viet Le & Hoang Thi‐Phan Le A58H G 0.015 0.025 0.025 E<br />
Hillsborough 993 Mosaic Fertilizer LLC A415 G 0 0.029 0.029 E<br />
Hillsborough 1035 Plant City Community Development Corp L660 G 0.039 0.055 0.055 E<br />
Hillsborough 1057 Dot Walden Farms, Inc. A415 G 0.05 0.081 0.081 E<br />
Hillsborough 1063 Joan L Sultenfuss Ltd A415 G 0.046 0.063 0.063 E<br />
Hillsborough 1064 Burnett‐Sultenfuss & Cutolo A415 G 0.029 0.047 0.047 E<br />
Hillsborough 1084 Hall Family Holdings Ltd A415 G 0.016 0.027 0.027 E<br />
Hillsborough 1121 Artesian Farms, Inc. A56S G 0 0.036 0.036 E<br />
Hillsborough 1137 Richard A. & Peggy F. Hall A415 G 0.007 0.012 0.012 E<br />
Hillsborough 1142 George Jr & Lisa Farkas A415 G 0.02 0.033 0.033 E<br />
Hillsborough 1145 IMC‐Agrico Company/Mosaic Phosphates Company A415 G 0.016 0.026 0.026 E<br />
Hillsborough 1162 Mac A & Eugene S Greco & Eleanor A415 G 0.028 0.046 0.046 E<br />
Hillsborough 1188 Cheung Wing Chan And Feng Ci Zhen A58S G 0.005 0.008 0.008 E<br />
Hillsborough 1223 N R Keene Groves Inc A415 G 0.024 0.04 0.04 E<br />
Hillsborough 1306 D & L Land Partners Inc A415 G 0.013 0.021 0.021 E<br />
Hillsborough 1333 Edward W. Netscher A415 S 0 0.067 0.067 E<br />
Hillsborough 1417 Joe C & Evelyn K Fouts A415 G 0.018 0.03 0.03 E<br />
Hillsborough 1432 Three Star Farms Inc A535 G 0.018 0.074 0.074 E<br />
Hillsborough 1432 Three Star Farms Inc A535 S 0 0.074 0.074 E<br />
Hillsborough 1440 Artesian Farms Inc A485 G 0.023 0.037 0.037 E<br />
Hillsborough 1441 Dale E & Patricia A Maggard & Kelly E Walker A415 G 0.014 0.023 0.023 E<br />
Hillsborough 1445 Lamar Varn A490 G 0.013 0.078 0.078 E<br />
Hillsborough 1446 Hite & Sacchi Partnership A415 G 0.013 0.021 0.021 E<br />
Hillsborough 1447 James L & Inez & Palmer Simmons A415 G 0.048 0.066 0.066 E<br />
Hillsborough 1464 Farkas Citrus Nursery Inc A485 G 0.026 0.043 0.043 E<br />
Hillsborough 1465 Farkas Citrus Nursery Inc A415 G 0.02 0.033 0.033 E<br />
Hillsborough 1489 A.E. and Leola Chancey A535 G 0.015 0.024 0.024 E<br />
Hillsborough 1493 Tampa Electric Co L610 G 0.002 0.003 0.003 E<br />
Hillsborough 1504 Freda Dukes Schofield As Trustee A535 G 0.05 0.07 0.07 E<br />
Hillsborough 1549 Joseph Larue Richter A415 G 0.019 0.031 0.031 E<br />
M/E 5<br />
Page | 219
<strong>2011</strong> ESTIMATED WATER USE REPORT<br />
Table A7. Metered and <strong>Estimated</strong> Agricultural WUPs, Withdrawals and Permitted <strong>Use</strong> (mgd), <strong>2011</strong><br />
County<br />
WUP<br />
Number<br />
<strong>Southwest</strong> <strong>Florida</strong> <strong>Water</strong> <strong>Management</strong> District<br />
Permittee<br />
<strong>Use</strong><br />
Code 1<br />
Source 2<br />
Annual<br />
Average<br />
Pumpage 3<br />
Total<br />
Permitted<br />
Annual<br />
Average<br />
Quantity<br />
Permitted<br />
Quantity<br />
Attributed<br />
to AG <strong>Use</strong><br />
Category 4<br />
Hillsborough 1557 Lee S. Cornelius And Eleanor T. A58S G 0.007 0.011 0.011 E<br />
Hillsborough 1575 Albert M Quagliani, Amelia & Richard Skolnik A535 G 0.02 0.058 0.058 E<br />
Hillsborough 1575 Albert M Quagliani, Amelia & Richard Skolnik A535 S 0 0.058 0.058 E<br />
Hillsborough 1577 Christopher P. Smith A535 G 0.02 0.094 0.094 E<br />
Hillsborough 1577 Christopher P. Smith A535 S 0.038 0.094 0.094 E<br />
Hillsborough 1628 Ray K Drawdy Trustee C/O Joel Drawdy A655 G 0.026 0.077 0.077 E<br />
Hillsborough 1628 Ray K Drawdy Trustee C/O Joel Drawdy A655 S 0.02 0.077 0.077 E<br />
Hillsborough 1629 Ruis L & Linda J Drawdy A56S G 0.031 0.051 0.051 E<br />
Hillsborough 1639 The Ryland Group Inc A415 G 0.023 0.054 0.054 E<br />
Hillsborough 1646 Harold M Collins A415 G 0.045 0.073 0.073 E<br />
Hillsborough 1650 Charles G. Grimes, Trustee and Betty J. Grimes, Trustee A535 G 0.056 0.091 0.091 E<br />
Hillsborough 1780 Hillsborough County BOCC A56S G 0.109 0.559 0.559 E<br />
Hillsborough 1782 Spencer Farms, Inc./Attn: Tonya Hills A56S G 0.201 0.364 0.364 E<br />
Hillsborough 1848 Steve & Sharon B Linton & Church Lake POA A415 G 0.003 0.076 0.006 E<br />
Hillsborough 1854 V V Vogel & Sons Farms Vance, George & John Vogel A56S G 0.027 0.194 0.194 E<br />
Hillsborough 1855 V V Vogel & Sons Farms Vance, George & John Vogel A56S G 0.035 0.127 0.127 E<br />
Hillsborough 1859 Ledford Tropical Fish, Inc. L660 G 0.035 0.06 0.06 E<br />
Hillsborough 1859 Ledford Tropical Fish, Inc. L660 S 0.001 0.06 0.06 E<br />
Hillsborough 1860 Warren R & Alice P Savidge L660 G 0.022 0.035 0.035 E<br />
Hillsborough 1871 James L. Butts A415 G 0.007 0.011 0.011 E<br />
Hillsborough 1873 Arthur Rawlins And Dorothy Rawlins L661 G 0.06 0.098 0.098 E<br />
Hillsborough 1885 Winfred M & Edna Sue Harrell A475 G 0.062 0.086 0.086 E<br />
Hillsborough 1903 RaLPh T & Helen M Russell A415 G 0.015 0.025 0.025 E<br />
Hillsborough 1970 Keith E And Antoinette Bush A415 G 0.007 0.012 0.012 E<br />
Hillsborough 1981 Amazon Tropical Fish Farm L660 G 0.014 0.022 0.022 E<br />
Hillsborough 1986 Vee & Vee Investment Company A415 G 0.056 0.077 0.077 E<br />
Hillsborough 1988 Willaford Groves LLC A415 G 0.026 0.043 0.043 E<br />
Hillsborough 1995 Dan Goodson A535 G 0.056 0.08 0.08 E<br />
Hillsborough 2027 J Pasco Sweat A415 G 0.033 0.085 0.085 E<br />
Hillsborough 2110 Jack P & Meribeth J Sizemore A415 G 0.024 0.039 0.039 E<br />
Hillsborough 2133 The Ah & Patricia Varnum Limited Partnership A415 G 0.044 0.061 0.061 E<br />
M/E 5<br />
Page | 220
<strong>2011</strong> ESTIMATED WATER USE REPORT<br />
Table A7. Metered and <strong>Estimated</strong> Agricultural WUPs, Withdrawals and Permitted <strong>Use</strong> (mgd), <strong>2011</strong><br />
County<br />
WUP<br />
Number<br />
Permittee<br />
<strong>Use</strong><br />
Code 1<br />
Source 2<br />
Annual<br />
Average<br />
Pumpage 3<br />
Total<br />
Permitted<br />
Annual<br />
Average<br />
Quantity<br />
Permitted<br />
Quantity<br />
Attributed<br />
to AG <strong>Use</strong><br />
Category 4<br />
Hillsborough 2155 Martin Bearss, Louise Bearss, Ma A415 G 0.027 0.044 0.044 E<br />
Hillsborough 2192 Bayside Aquatics Inc L660 G 0.058 0.086 0.086 E<br />
2205 Mathis Land Group, LLC/Attn.: Steven C & Joyne D A415<br />
0.008 0.013 0.013<br />
G<br />
Hillsborough<br />
Mathis<br />
E<br />
Hillsborough 2206 Double E Corporation & A.R. Ellis, Jr. A415 G 0.045 0.073 0.073 E<br />
Hillsborough 2291 Billy & Mattie Louise Williams A535 G 0.021 0.034 0.034 E<br />
Hillsborough 2292 Billy & Mattie Louise Williams A535 G 0.063 0.087 0.087 E<br />
Hillsborough 2293 Billy Williams A535 G 0.041 0.057 0.057 E<br />
Hillsborough 2298 Claude A. Miranda A415 G 0.006 0.009 0.009 E<br />
Hillsborough 2301 Cee Bee Groves Bill Bushenal A415 G 0.02 0.034 0.034 E<br />
Hillsborough 2304 Gladys Vinson A415 G 0.008 0.013 0.013 E<br />
Hillsborough 2308 Emma Hatcher C/O Shelley Hatcher A475 G 0.024 0.039 0.039 E<br />
Hillsborough 2311 Crum Properties III LLC A415 G 0.021 0.034 0.034 E<br />
2321 Griffin Investment Properties, Ltd., Attn: Mr. James A535<br />
0.105 0.149 0.149<br />
G<br />
Hillsborough<br />
Griffin<br />
E<br />
2322 Griffin Investment Properties, Ltd., Attn: Mr. James A495<br />
0.007 0.011 0.011<br />
G<br />
Hillsborough<br />
Griffin<br />
E<br />
Hillsborough 2335 Cone & Graham Inc A490 G 0.047 0.077 0.077 E<br />
Hillsborough 2377 Joan J Crow Inc A415 G 0.045 0.063 0.063 E<br />
2391 Bailey Family Foundation of Tampa Inc./Attn: Ron A415<br />
0.012 0.02 0.02<br />
G<br />
Hillsborough<br />
Bailey<br />
E<br />
Hillsborough 2395 George Klinchandy & Chittllapplly Antony A535 G 0.035 0.058 0.058 E<br />
Hillsborough 2396 Garry Rowell A490 G 0.018 0.03 0.03 E<br />
Hillsborough 2399 William G Gordon A480 G 0.004 0.007 0.007 E<br />
Hillsborough 2453 Roy C Sink Sr & Jo Wo Sink A495 G 0.013 0.021 0.021 E<br />
Hillsborough 2490 Score Properties LLC & Kelly Properties LLC A415 G 0.028 0.045 0.045 E<br />
Hillsborough 2512 Samuel A. Fuller A490 G 0.003 0.005 0.005 E<br />
Hillsborough 2526 Riverview Tropicals Inc L660 G 0.031 0.051 0.051 E<br />
2532 Timothy R. Porter, Lori Porter, Daniel Deluca and Karen A415<br />
0.004 0.007 0.007<br />
Hillsborough<br />
Deluca<br />
G<br />
E<br />
Hillsborough 2541 Marlene Mathews Trustee A415 G 0.018 0.029 0.029 E<br />
M/E 5<br />
<strong>Southwest</strong> <strong>Florida</strong> <strong>Water</strong> <strong>Management</strong> District<br />
Page | 221
<strong>2011</strong> ESTIMATED WATER USE REPORT<br />
Table A7. Metered and <strong>Estimated</strong> Agricultural WUPs, Withdrawals and Permitted <strong>Use</strong> (mgd), <strong>2011</strong><br />
County<br />
WUP<br />
Number<br />
<strong>Southwest</strong> <strong>Florida</strong> <strong>Water</strong> <strong>Management</strong> District<br />
Permittee<br />
<strong>Use</strong><br />
Code 1<br />
Source 2<br />
Annual<br />
Average<br />
Pumpage 3<br />
Total<br />
Permitted<br />
Annual<br />
Average<br />
Quantity<br />
Permitted<br />
Quantity<br />
Attributed<br />
to AG <strong>Use</strong><br />
Category 4<br />
Hillsborough 2542 R & E Property I LLC A480 G 0.005 0.008 0.008 E<br />
Hillsborough 2557 Ab, Sf & Sl Thayer‐Life Estate A415 G 0.027 0.043 0.043 E<br />
2558 Carol D Graham, Dennis W Boone, B Fae Knight And Et A415<br />
0.004 0.007 0.007<br />
G<br />
Hillsborough<br />
Al<br />
E<br />
Hillsborough 2563 Paul & Reba Bennett A535 G 0.019 0.032 0.032 E<br />
Hillsborough 2564 Citrus Meadows, LLC A415 G 0.015 0.048 0.048 E<br />
Hillsborough 2565 Joann H Crist L600 G 0 0 0 E<br />
Hillsborough 2566 M.K. Hakeem A525 G 0.056 0.078 0.078 E<br />
Hillsborough 2568 James Frederick Allen A415 G 0.011 0.018 0.018 E<br />
2574 Anderson Family Revocable Trust Agnes M Anderson L600<br />
0 0 0<br />
Hillsborough<br />
Trustee<br />
G<br />
E<br />
Hillsborough 2576 Charles D & Bobbie Ann Parrish A485 G 0.04 0.056 0.056 E<br />
Hillsborough 2682 Ronald Wetherington L660 G 0.005 0.008 0.008 E<br />
Hillsborough 2687 Grover C Melba L Marty C & Joyce M Sewell A535 G 0.04 0.056 0.056 E<br />
Hillsborough 2719 Larry W. Ennis A56S G 0.014 0.045 0.045 E<br />
Hillsborough 2719 Larry W. Ennis A56S S 0 0.045 0.045 E<br />
Hillsborough 2733 Nell C Burton A415 G 0.024 0.039 0.039 E<br />
Hillsborough 2739 Hinton Enterprises Of Sydney Inc A535 G 0.066 0.092 0.092 E<br />
Hillsborough 2749 Carolyn M Wilson Carolyn M Revocable Trust A415 G 0.072 0.099 0.099 E<br />
Hillsborough 2754 Nell T. Milam A415 G 0.007 0.012 0.012 E<br />
Hillsborough 2761 Pedro E. Machado A485 G 0.011 0.018 0.018 E<br />
Hillsborough 2768 Marshal L. Chancy A52S G 0.044 0.072 0.072 E<br />
Hillsborough 2775 Warren E Hand A480 G 0.015 0.051 0.051 E<br />
Hillsborough 2827 Johny & Billy Givens L660 G 0.045 0.063 0.063 E<br />
Hillsborough 2828 Apollo Tropicals, LLP L660 G 0.009 0.014 0.014 E<br />
Hillsborough 2829 Tidwell Fish Farm L660 G 0.01 0.016 0.016 E<br />
Hillsborough 2864 Sims Family Partnership, LTD. A415 G 0.038 0.089 0.089 E<br />
Hillsborough 2865 Belmont Glen Inc C/O Metro Development LLC L660 G 0.023 0.038 0.038 E<br />
Hillsborough 2867 Sims Family Partnership, LTD. A485 G 0.01 0.033 0.033 E<br />
Hillsborough 2868 Sun City Tree Farm A480 G 0.049 0.068 0.068 E<br />
Hillsborough 2942 Johny & Billy Givens L660 G 0.045 0.063 0.063 E<br />
M/E 5<br />
Page | 222
<strong>2011</strong> ESTIMATED WATER USE REPORT<br />
Table A7. Metered and <strong>Estimated</strong> Agricultural WUPs, Withdrawals and Permitted <strong>Use</strong> (mgd), <strong>2011</strong><br />
County<br />
WUP<br />
Number<br />
<strong>Southwest</strong> <strong>Florida</strong> <strong>Water</strong> <strong>Management</strong> District<br />
Permittee<br />
<strong>Use</strong><br />
Code 1<br />
Source 2<br />
Annual<br />
Average<br />
Pumpage 3<br />
Total<br />
Permitted<br />
Annual<br />
Average<br />
Quantity<br />
Permitted<br />
Quantity<br />
Attributed<br />
to AG <strong>Use</strong><br />
Category 4<br />
Hillsborough 2944 Velma Newsome Groves, Inc., Attn: Joe E. Newsome A535 G 0.022 0.036 0.036 E<br />
Hillsborough 2945 Raymond Stephens A415 G 0.003 0.004 0.004 E<br />
Hillsborough 2948 Leonard R. & Betty K. Beck A460 G 0.001 0.001 0.001 E<br />
Hillsborough 2951 San Way Farms Inc A535 G 0.022 0.036 0.036 E<br />
Hillsborough 2963 Colson Road Holdings, LLC/Attn. Gary Wishnatzki A535 G 0.032 0.081 0.081 E<br />
Hillsborough 2963 Colson Road Holdings, LLC/Attn. Gary Wishnatzki A535 S 0.016 0.081 0.081 E<br />
Hillsborough 2975 Carlton E and Jacqueline R Wilson A495 G 0.024 0.065 0.065 E<br />
Hillsborough 2990 Said I Hakky & Barbara Janet Hak L610 G 0 0.003 0 E<br />
Hillsborough 2998 Bay Mulch Inc. A535 G 0.027 0.045 0.045 E<br />
Hillsborough 3011 Mark H & Julia K Baker A535 G 0.045 0.074 0.074 E<br />
Hillsborough 3011 Mark H & Julia K Baker A535 S 0.001 0.074 0.074 E<br />
Hillsborough 3031 Hull Citrus Properties Inc A415 G 0.017 0.028 0.028 E<br />
Hillsborough 3059 C E Leisey III A485 G 0.075 0.135 0.135 E<br />
Hillsborough 3107 Joseph R & Donna Jo Goodson A535 G 0.035 0.085 0.085 E<br />
Hillsborough 3108 Paul N. And Shirley L. Bryant/Trustees A535 G 0.01 0.017 0.017 E<br />
Hillsborough 3122 RaLPh M & Richard A Selmont L660 G 0.015 0.025 0.025 E<br />
Hillsborough 3123 Charles G Jr & Deborah Grimes A535 G 0.144 0.223 0.223 E<br />
Hillsborough 3153 John & Tracey Pritchard A535 G 0.026 0.043 0.043 E<br />
Hillsborough 3153 John & Tracey Pritchard A535 S 0 0.043 0.043 E<br />
Hillsborough 3200 Hubbard Investments Inc A415 G 0.01 0.017 0.017 E<br />
3225 Henry C. McDonald ‐Personal Rep. The Estate Of Juanita A535<br />
0.05 0.07 0.07<br />
Hillsborough<br />
McDonald<br />
G<br />
E<br />
Hillsborough 3234 Koua Thao & Me Xiong Thao A57F G 0.005 0.008 0.008 E<br />
Hillsborough 3262 Paul F Tindle A415 G 0.006 0.019 0.019 E<br />
Hillsborough 3262 Paul F Tindle A415 S 0.005 0.019 0.019 E<br />
Hillsborough 3293 Patricia A Murrell A415 G 0.013 0.022 0.022 E<br />
Hillsborough 3311 Richard Joyner A495 G 0.016 0.026 0.026 E<br />
Hillsborough 3313 Porter And Sara Hare A535 G 0.057 0.094 0.094 E<br />
Hillsborough 3317 Andrew B & Marcella J Scott A415 G 0.025 0.041 0.041 E<br />
Hillsborough 3329 Bryan C Jr And M Alicia Thomas L660 G 0.027 0.044 0.044 E<br />
Hillsborough 3330 5‐D Tropical Inc A415 G 0.023 0.038 0.038 E<br />
M/E 5<br />
Page | 223
<strong>2011</strong> ESTIMATED WATER USE REPORT<br />
Table A7. Metered and <strong>Estimated</strong> Agricultural WUPs, Withdrawals and Permitted <strong>Use</strong> (mgd), <strong>2011</strong><br />
County<br />
WUP<br />
Number<br />
<strong>Southwest</strong> <strong>Florida</strong> <strong>Water</strong> <strong>Management</strong> District<br />
Permittee<br />
<strong>Use</strong><br />
Code 1<br />
Source 2<br />
Annual<br />
Average<br />
Pumpage 3<br />
Total<br />
Permitted<br />
Annual<br />
Average<br />
Quantity<br />
Permitted<br />
Quantity<br />
Attributed<br />
to AG <strong>Use</strong><br />
Category 4<br />
Hillsborough 3355 Paula G Fritz A535 G 0.048 0.099 0.098 E<br />
Hillsborough 3355 Paula G Fritz A535 S 0 0.099 0.098 E<br />
Hillsborough 3356 Ernest M Haefele Jr & Maggie M Savich L660 G 0.158 0.259 0.259 E<br />
Hillsborough 3369 Constantin Artzibushev, Et Al A415 G 0.044 0.16 0.16 E<br />
Hillsborough 3371 Nadine A. Mamontoff & Dimitri Artzibushev A490 G 0.005 0.009 0.009 E<br />
Hillsborough 3386 Tampa Electric Co A535 G 0.047 0.065 0.065 E<br />
3433 Amy Durden, Sidney Liles, Brenda Parker, & Teresa L661<br />
0.012 0.02 0.02<br />
G<br />
Hillsborough<br />
Wood<br />
E<br />
Hillsborough 3453 George and Patricia Sprouse A535 G 0.015 0.032 0.032 E<br />
Hillsborough 3453 George and Patricia Sprouse A535 S 0.004 0.032 0.032 E<br />
Hillsborough 3454 Nancy Skemp Trustee, Peter Skemp & John Shepard A495 G 0.042 0.058 0.058 E<br />
Hillsborough 3485 RaLPh Randall, Trustee A535 G 0.063 0.087 0.087 E<br />
3533 Jimmie S Way Life Estate & James Dowling Way & A445<br />
0.007 0.011 0.011<br />
Hillsborough<br />
Beverly Way Tyson<br />
S<br />
E<br />
Hillsborough 3560 Cypress Creek Land Corporation L600 G 0.001 0.002 0.002 E<br />
Hillsborough 3562 Floyd M & Catherine F Boone A415 G 0.006 0.009 0.009 E<br />
Hillsborough 3591 Ronald L. McClendon and Elizabeth A. McClendon A415 G 0.006 0.018 0.018 E<br />
3596 Eddie A. Jones Revocable Living Trust, Trenda Gude A535<br />
0.041 0.066 0.066<br />
Hillsborough<br />
Trustee<br />
G<br />
E<br />
Hillsborough 3600 Jackie C Wells & Esther Louise Tool A415 G 0.01 0.017 0.017 E<br />
Hillsborough 3603 D.M. Ercoli L640 G 0.012 0.02 0.02 E<br />
Hillsborough 3615 Sam Astin III A535 G 0.012 0.039 0.039 E<br />
Hillsborough 3617 Jorge G Arroyo A415 G 0.011 0.018 0.018 E<br />
Hillsborough 3652 George and Patricia Sprouse A44S G 0.059 0.081 0.081 E<br />
Hillsborough 3661 Co Tew A535 G 0.011 0.018 0.018 E<br />
Hillsborough 3686 Eleanor C Poppell Trustee A415 G 0.023 0.038 0.038 E<br />
Hillsborough 3699 Wayne Tanner L660 G 0.007 0.012 0.012 E<br />
Hillsborough 3700 John Russell & Evanett Griffin A535 G 0.004 0.006 0.006 E<br />
Hillsborough 3715 Spencer Farms, Inc./Attn: Tonya Hills A56S G 0.124 0.345 0.345 E<br />
Hillsborough 3725 Walter H Harkala (Glen Williamson #2) A535 G 0.061 0.089 0.089 E<br />
Hillsborough 3741 Jeffrey Sizemore A415 G 0.017 0.028 0.028 E<br />
M/E 5<br />
Page | 224
<strong>2011</strong> ESTIMATED WATER USE REPORT<br />
Table A7. Metered and <strong>Estimated</strong> Agricultural WUPs, Withdrawals and Permitted <strong>Use</strong> (mgd), <strong>2011</strong><br />
County<br />
WUP<br />
Number<br />
<strong>Southwest</strong> <strong>Florida</strong> <strong>Water</strong> <strong>Management</strong> District<br />
Permittee<br />
<strong>Use</strong><br />
Code 1<br />
Source 2<br />
Annual<br />
Average<br />
Pumpage 3<br />
Total<br />
Permitted<br />
Annual<br />
Average<br />
Quantity<br />
Permitted<br />
Quantity<br />
Attributed<br />
to AG <strong>Use</strong><br />
Category 4<br />
Hillsborough 3745 NNPIV Lake Hutto LLC C/O Newland Communities LLC A495 G 0.016 0.026 0.026 E<br />
Hillsborough 3797 Kenneth Wall A480 G 0.008 0.014 0.014 E<br />
Hillsborough 3809 G H Summerfield LLC A480 G 0.028 0.237 0.237 E<br />
Hillsborough 3809 G H Summerfield LLC A480 S 0.082 0.237 0.237 E<br />
Hillsborough 3888 Ben Forte A475 G 0.017 0.037 0.036 E<br />
Hillsborough 3888 Ben Forte A475 S 0.005 0.037 0.036 E<br />
3892 Caroline Pate and Claudia Pate Young Trustees Frank C. A535<br />
0.045 0.062 0.062<br />
Hillsborough<br />
Pate Fami<br />
G<br />
E<br />
Hillsborough 3958 Jack Felty A415 G 0.01 0.017 0.017 E<br />
Hillsborough 4030 Michael Joseph St. Martin A535 G 0.014 0.023 0.023 E<br />
Hillsborough 4037 Michael & Lynne Warren A480 G 0.008 0.027 0.027 E<br />
Hillsborough 4097 Thomas Fred Folsom A415 G 0.015 0.025 0.025 E<br />
Hillsborough 4144 Douglas A. and Sherill Holmberg A535 G 0.15 0.301 0.301 E<br />
Hillsborough 4144 Douglas A. and Sherill Holmberg A535 S 0.033 0.301 0.301 E<br />
Hillsborough 4159 Patty Brannon A470 G 0.029 0.052 0.052 E<br />
Hillsborough 4159 Patty Brannon A470 S 0.003 0.052 0.052 E<br />
Hillsborough 4298 Gary C Cooley Sr L660 G 0.058 0.085 0.085 E<br />
Hillsborough 4363 John H & SUSAn F Dukes A535 G 0.011 0.018 0.018 E<br />
Hillsborough 4379 Ernest E Boyette L640 G 0.02 0.033 0.033 E<br />
Hillsborough 4380 Thomas Brandon & Mary Rosa A44S G 0.053 0.074 0.074 E<br />
Hillsborough 4397 Gary C Cooley Sr L660 G 0.038 0.052 0.052 E<br />
Hillsborough 4419 Medley Groves Inc A415 G 0.016 0.026 0.026 E<br />
Hillsborough 4421 Jack P. & Meribeth J. Sizemore A535 G 0.329 0.591 0.586 E<br />
Hillsborough 4459 WIllie W & Lavone W Wingate A535 G 0.024 0.039 0.039 E<br />
Hillsborough 4483 Leland F. & Mattye L. Thomas A535 G 0.041 0.09 0.087 E<br />
Hillsborough 4483 Leland F. & Mattye L. Thomas A535 S 0.008 0.09 0.087 E<br />
Hillsborough 4485 Redman & Ford, Inc. A415 G 0.008 0.014 0.014 E<br />
Hillsborough 4512 Calla Hudas A415 G 0.003 0.006 0.006 E<br />
Hillsborough 4519 R Wade & Jeanne E Wetherington A415 G 0.01 0.017 0.017 E<br />
Hillsborough 4522 Ronald Wetherington A535 G 0.021 0.035 0.035 E<br />
Hillsborough 4548 Angel And Christy Lasso A490 G 0.005 0.008 0.008 E<br />
M/E 5<br />
Page | 225
<strong>2011</strong> ESTIMATED WATER USE REPORT<br />
Table A7. Metered and <strong>Estimated</strong> Agricultural WUPs, Withdrawals and Permitted <strong>Use</strong> (mgd), <strong>2011</strong><br />
County<br />
WUP<br />
Number<br />
<strong>Southwest</strong> <strong>Florida</strong> <strong>Water</strong> <strong>Management</strong> District<br />
Permittee<br />
<strong>Use</strong><br />
Code 1<br />
Source 2<br />
Annual<br />
Average<br />
Pumpage 3<br />
Total<br />
Permitted<br />
Annual<br />
Average<br />
Quantity<br />
Permitted<br />
Quantity<br />
Attributed<br />
to AG <strong>Use</strong><br />
Category 4<br />
Hillsborough 4617 Bobby Wilkerson L660 G 0.009 0.028 0.028 E<br />
Hillsborough 4627 Lucille E Reese A415 G 0.021 0.034 0.034 E<br />
Hillsborough 4640 Sam Astin, III A535 G 0.022 0.062 0.062 E<br />
Hillsborough 4714 The Montesco Group A480 G 0.097 0.266 0.266 E<br />
Hillsborough 4716 Gene Hawkins A535 G 0.019 0.031 0.031 E<br />
Hillsborough 4758 Glenn And Sarah Williamson A535 G 0.05 0.072 0.072 E<br />
Hillsborough 4778 Mark Wesley Shelton Et Al C/O James S Moody Jr A535 G 0.049 0.068 0.068 E<br />
Hillsborough 4830 I.M. III & Cynthia F. Sharpe A415 G 0.039 0.053 0.053 E<br />
Hillsborough 4848 Linda Serralles A415 G 0.017 0.027 0.027 E<br />
Hillsborough 4849 Perry E & Michelle L Varn A495 G 0.009 0.015 0.015 E<br />
Hillsborough 4861 George H And/Or Marie E Lipsey A415 G 0.011 0.018 0.018 E<br />
Hillsborough 4878 Larry W. Ennis A535 G 0.027 0.044 0.044 E<br />
Hillsborough 4924 Winfred And Sue Harrell Investments LLLP A475 G 0.062 0.091 0.091 E<br />
Hillsborough 4943 Erma Clausen Baker And Dale And Amy Baker A485 G 0.002 0.014 0.014 E<br />
Hillsborough 4947 Larry & Diane Vaughn A490 G 0.008 0.012 0.012 E<br />
Hillsborough 4949 Richard Purvis A415 G 0.015 0.024 0.024 E<br />
Hillsborough 4961 Harvey C & Joan Carr A535 G 0.02 0.063 0.063 E<br />
Hillsborough 4961 Harvey C & Joan Carr A535 S 0 0.063 0.063 E<br />
Hillsborough 4996 B & B Holland Groves LLC/Attn:Joseph K. Brown A415 G 0.075 0.111 0.111 E<br />
Hillsborough 5065 Elton E. & Carol H. Conrad A415 G 0.006 0.01 0.01 E<br />
Hillsborough 5140 Southshore Investments LLC L660 G 0.013 0.022 0.022 E<br />
Hillsborough 5145 Midway Ranchettes LLC A415 G 0.034 0.055 0.055 E<br />
Hillsborough 5156 Wylie L. & Carol A. Hinton, and Hinton Family LLC A535 G 0.051 0.183 0.183 E<br />
Hillsborough 5156 Wylie L. & Carol A. Hinton, and Hinton Family LLC A535 S 0.061 0.183 0.183 E<br />
Hillsborough 5188 Chapman Fruit Company A415 G 0.018 0.03 0.03 E<br />
Hillsborough 5237 Baum LLC A415 G 0.022 0.036 0.036 E<br />
Hillsborough 5239 James W. Smith A535 G 0.01 0.017 0.017 E<br />
Hillsborough 5243 Robert E & Wilmoth E Reynolds A415 G 0.012 0.038 0.038 E<br />
Hillsborough 5248 Stine Family Partnership Ltd A535 G 0.044 0.062 0.062 E<br />
Hillsborough 5250 Charles G & Betty Grimes & A535 G 0.024 0.078 0.078 E<br />
Hillsborough 5250 Charles G & Betty Grimes & A535 S 0 0.078 0.078 E<br />
M/E 5<br />
Page | 226
<strong>2011</strong> ESTIMATED WATER USE REPORT<br />
Table A7. Metered and <strong>Estimated</strong> Agricultural WUPs, Withdrawals and Permitted <strong>Use</strong> (mgd), <strong>2011</strong><br />
County<br />
WUP<br />
Number<br />
<strong>Southwest</strong> <strong>Florida</strong> <strong>Water</strong> <strong>Management</strong> District<br />
Permittee<br />
<strong>Use</strong><br />
Code 1<br />
Source 2<br />
Annual<br />
Average<br />
Pumpage 3<br />
Total<br />
Permitted<br />
Annual<br />
Average<br />
Quantity<br />
Permitted<br />
Quantity<br />
Attributed<br />
to AG <strong>Use</strong><br />
Category 4<br />
Hillsborough 5252 Barbara L Hall Life Estate Barbara L Hall Trustee A415 G 0.016 0.025 0.025 E<br />
Hillsborough 5397 Douglas A. Holmberg A58S G 0.107 0.195 0.195 E<br />
Hillsborough 5429 Tommy L & Dixie Gillman A535 G 0.024 0.039 0.039 E<br />
Hillsborough 5764 M L Davis Groves Inc. A415 G 0.043 0.06 0.06 E<br />
Hillsborough 5787 Cal‐Maine Foods Inc L600 G 0.027 0.078 0.075 E<br />
Hillsborough 5859 Macdonald Center Inc J Clifford A480 G 0.01 0.033 0.03 E<br />
Hillsborough 5861 IMC‐Agrico Company A415 G 0.052 0.086 0.086 E<br />
Hillsborough 5934 Vu Lu Van A58S G 0.021 0.057 0.057 E<br />
Hillsborough 5944 Pinai & Chuenkamol Nomchauy A485 G 0.009 0.015 0.015 E<br />
Hillsborough 5955 Harry A. Johnson A535 G 0.053 0.074 0.074 E<br />
Hillsborough 5972 George P & Glenda M Piasecki Jr L600 G 0 0 0 E<br />
Hillsborough 6060 Cecil Buzbee Farms, Inc. A50F G 0.03 0.082 0.082 E<br />
Hillsborough 6079 Joe Starks A415 G 0.029 0.047 0.047 E<br />
Hillsborough 6138 Jack P. & Meribeth J. Sizemore A535 G 0.071 0.099 0.099 E<br />
Hillsborough 6209 Homer Wall, Jr. & Sr. A535 G 0.021 0.034 0.034 E<br />
Hillsborough 6238 Tommy G Brock A56S G 0.045 0.088 0.086 E<br />
Hillsborough 6238 Tommy G Brock A56S S 0.007 0.088 0.086 E<br />
Hillsborough 6250 Claude Thomas A525 G 0.001 0.005 0.005 E<br />
Hillsborough 6252 Dumke, Chad C. and Angela D. A410 G 0.007 0.036 0.036 E<br />
Hillsborough 6266 S.A.C.K. Farm Inc A535 G 0.055 0.077 0.077 E<br />
Hillsborough 6271 D J & Uteva Mercer A485 G 0.013 0.022 0.022 E<br />
6283 Martha Betty Cowart, Mary K. Allen, & Jacqueline A. A415<br />
0.022 0.036 0.036<br />
Hillsborough<br />
Boyette<br />
G<br />
E<br />
Hillsborough 6296 Edward Mobley A485 G 0.005 0.008 0.008 E<br />
Hillsborough 6323 Terry Neal & Colleen Gail Fulton A535 G 0.009 0.015 0.015 E<br />
Hillsborough 6324 Robert H. & Peggy E. Parke A535 G 0.01 0.016 0.016 E<br />
Hillsborough 6341 Johnny R. Bryant A535 G 0.02 0.033 0.033 E<br />
Hillsborough 6348 Dwight L & Mary Nell Aman A415 G 0.025 0.041 0.041 E<br />
Hillsborough 6365 The Conrad Family Limited Partnership A415 G 0.008 0.013 0.013 E<br />
Hillsborough 6375 John R. Griffin A535 G 0.022 0.036 0.036 E<br />
Hillsborough 6406 Joseph R & Donna Jo Goodson A535 G 0.022 0.036 0.036 E<br />
M/E 5<br />
Page | 227
<strong>2011</strong> ESTIMATED WATER USE REPORT<br />
Table A7. Metered and <strong>Estimated</strong> Agricultural WUPs, Withdrawals and Permitted <strong>Use</strong> (mgd), <strong>2011</strong><br />
County<br />
WUP<br />
Number<br />
<strong>Southwest</strong> <strong>Florida</strong> <strong>Water</strong> <strong>Management</strong> District<br />
Permittee<br />
<strong>Use</strong><br />
Code 1<br />
Source 2<br />
Annual<br />
Average<br />
Pumpage 3<br />
Total<br />
Permitted<br />
Annual<br />
Average<br />
Quantity<br />
Permitted<br />
Quantity<br />
Attributed<br />
to AG <strong>Use</strong><br />
Category 4<br />
Hillsborough 6421 Jamie and Amanda Bell A535 G 0.02 0.033 0.033 E<br />
Hillsborough 6422 Shirley Roberts L635 G 0 0.008 0 E<br />
Hillsborough 6427 Donald V. Bennett A415 G 0 0.054 0.054 E<br />
Hillsborough 6427 Donald V. Bennett A415 S 0.006 0.054 0.054 E<br />
Hillsborough 6428 Sam III A535 G 0.043 0.089 0.089 E<br />
Hillsborough 6428 Sam III A535 S 0 0.089 0.089 E<br />
Hillsborough 6429 Mont‐Lest LLC A535 G 0.066 0.091 0.091 E<br />
Hillsborough 6438 Jaymar Farms Inc & Stockton Farms LLC A535 G 0 0.096 0.096 E<br />
Hillsborough 6438 Jaymar Farms Inc & Stockton Farms LLC A535 S 0 0.096 0.096 E<br />
Hillsborough 6455 Frank A & Nancy M Gregorio A415 G 0.012 0.02 0.02 E<br />
Hillsborough 6461 David J., James E. and Patricia J. Robinson A410 G 0.01 0.016 0.016 E<br />
Hillsborough 6470 Donald R & Katherine L Sodders A535 G 0.008 0.014 0.014 E<br />
Hillsborough 6479 Sam Astin Jr A535 G 0.02 0.04 0.04 E<br />
Hillsborough 6479 Sam Astin Jr A535 S 0.005 0.04 0.04 E<br />
Hillsborough 6489 David A Storck A480 G 0.018 0.029 0.029 E<br />
Hillsborough 6491 Eugene Roach A535 G 0.009 0.014 0.014 E<br />
Hillsborough 6492 Thomas E. & Betty L. Roach A51S G 0.058 0.08 0.08 E<br />
Hillsborough 6500 R L and Evelyn Cain A480 G 0.02 0.033 0.033 E<br />
Hillsborough 6513 James Frederick Allen A415 G 0.01 0.017 0.017 E<br />
Hillsborough 6514 James Fred Allen & Larry D. Conrad A415 G 0.008 0.013 0.013 E<br />
Hillsborough 6525 Ron E Stallings A535 G 0.031 0.056 0.056 E<br />
Hillsborough 6525 Ron E Stallings A535 S 0.004 0.056 0.056 E<br />
Hillsborough 6534 James L & Inez P Simmons A415 G 0.012 0.019 0.019 E<br />
Hillsborough 6541 Jeffrey S. Wacaser and Alica J. Wacaser A655 G 0.046 0.064 0.064 E<br />
Hillsborough 6553 Wesley N Sr & Sandra N Christie L600 G 0.005 0.008 0.008 E<br />
Hillsborough 6554 Farkas Groves, Inc. A415 G 0.019 0.031 0.031 E<br />
Hillsborough 6563 Scot And SUSAn Dumke A410 G 0 0.035 0.035 E<br />
Hillsborough 6563 Scot And SUSAn Dumke A410 S 0 0.035 0.035 E<br />
Hillsborough 6566 Herbert C & Bonnell H Overstreet L600 G 0.001 0.002 0.002 E<br />
Hillsborough 6630 GLH ‐ Lithia Pinecrest 19, LLC. A415 G 0.009 0.015 0.015 E<br />
Hillsborough 6634 C W & Peggy C Capps A415 G 0.045 0.063 0.063 E<br />
M/E 5<br />
Page | 228
<strong>2011</strong> ESTIMATED WATER USE REPORT<br />
Table A7. Metered and <strong>Estimated</strong> Agricultural WUPs, Withdrawals and Permitted <strong>Use</strong> (mgd), <strong>2011</strong><br />
County<br />
WUP<br />
Number<br />
<strong>Southwest</strong> <strong>Florida</strong> <strong>Water</strong> <strong>Management</strong> District<br />
Permittee<br />
<strong>Use</strong><br />
Code 1<br />
Source 2<br />
Annual<br />
Average<br />
Pumpage 3<br />
Total<br />
Permitted<br />
Annual<br />
Average<br />
Quantity<br />
Permitted<br />
Quantity<br />
Attributed<br />
to AG <strong>Use</strong><br />
Category 4<br />
Hillsborough 6657 Elizabeth G King A415 G 0.006 0.009 0.009 E<br />
Hillsborough 6672 Douglas N. Speer A415 G 0.004 0.013 0.013 E<br />
Hillsborough 6692 Claude C. & Allene Cameron A415 G 0.017 0.028 0.028 E<br />
Hillsborough 6694 Sarah Alice H Hall And Joy L Ford, Trustees A535 G 0.015 0.025 0.025 E<br />
Hillsborough 6698 Bruce Michael Lott A535 G 0.041 0.057 0.057 E<br />
Hillsborough 6708 Strawberry Red Ranch LLC, Attn: Ronnie E. Young A535 G 0.064 0.164 0.164 E<br />
Hillsborough 6708 Strawberry Red Ranch LLC, Attn: Ronnie E. Young A535 S 0 0.164 0.164 E<br />
Hillsborough 6731 SUSAn, Andrew And Alexis ShafII A415 G 0.016 0.026 0.026 E<br />
Hillsborough 6737 Claude Tanner A460 G 0 0.001 0.001 E<br />
Hillsborough 6743 Jimmy Garrison A410 G 0.02 0.035 0.035 E<br />
Hillsborough 6748 Mary M Eppard A535 G 0.011 0.018 0.018 E<br />
Hillsborough 6753 Salim K & Ruh Afza Afridi A480 G 0.016 0.029 0.029 E<br />
Hillsborough 6767 Grady & Marie B. Harrell, Trustees A535 G 0.018 0.059 0.059 E<br />
Hillsborough 6767 Grady & Marie B. Harrell, Trustees A535 S 0.018 0.059 0.059 E<br />
Hillsborough 6768 Mary L Keene Trustee A535 G 0.047 0.077 0.077 E<br />
Hillsborough 6779 Elmer S Rogers And Margaret G Rogers A535 G 0.018 0.03 0.03 E<br />
Hillsborough 6781 Steven Clyde And Joyne D Mathis A535 G 0.03 0.05 0.05 E<br />
Hillsborough 6807 Charles Grimes A535 G 0.03 0.049 0.049 E<br />
Hillsborough 6809 Sam Astin III and Buffy Astin A470 G 0.062 0.106 0.106 E<br />
Hillsborough 6809 Sam Astin III and Buffy Astin A470 S 0.009 0.106 0.106 E<br />
Hillsborough 6817 Vivian C Patisaul, Trustee The Patisaul Family Trust A415 G 0.015 0.025 0.025 E<br />
Hillsborough 6824 Michael J. and Marsha St. Martin A58S G 0.034 0.094 0.094 E<br />
Hillsborough 6824 Michael J. and Marsha St. Martin A58S S 0 0.094 0.094 E<br />
6825 Darryl F. Williams, and William K. Williams and Laural A535<br />
0.022 0.035 0.035<br />
Hillsborough<br />
Williams<br />
G<br />
E<br />
Hillsborough 6831 John F. St. Martin, III, And Rob A535 G 0.044 0.061 0.061 E<br />
Hillsborough 6849 Harold L & Martha S Fisher Trustees A535 G 0.022 0.036 0.036 E<br />
Hillsborough 6853 Liviu D & Gabriela Tanase A475 G 0.013 0.022 0.022 E<br />
Hillsborough 6855 Gary E. and Presley A. Glover A415 G 0.01 0.016 0.016 E<br />
Hillsborough 6860 C. Leroy Lariscy A535 G 0.036 0.059 0.059 E<br />
Hillsborough 6860 C. Leroy Lariscy A535 S 0 0.059 0.059 E<br />
M/E 5<br />
Page | 229
<strong>2011</strong> ESTIMATED WATER USE REPORT<br />
Table A7. Metered and <strong>Estimated</strong> Agricultural WUPs, Withdrawals and Permitted <strong>Use</strong> (mgd), <strong>2011</strong><br />
County<br />
WUP<br />
Number<br />
<strong>Southwest</strong> <strong>Florida</strong> <strong>Water</strong> <strong>Management</strong> District<br />
Permittee<br />
<strong>Use</strong><br />
Code 1<br />
Source 2<br />
Annual<br />
Average<br />
Pumpage 3<br />
Total<br />
Permitted<br />
Annual<br />
Average<br />
Quantity<br />
Permitted<br />
Quantity<br />
Attributed<br />
to AG <strong>Use</strong><br />
Category 4<br />
Hillsborough 6880 Lewis Robert Raulerson Jr & Glenda D Raulerson A535 G 0.019 0.031 0.031 E<br />
Hillsborough 6894 M Ledbetter A485 G 0.005 0.008 0.008 E<br />
Hillsborough 6939 William D & Kathryn A Mcknight A415 G 0.008 0.013 0.013 E<br />
Hillsborough 6944 Wayne H & Loraine W Brown A415 G 0.038 0.053 0.053 E<br />
Hillsborough 6964 David L Creeley A525 G 0.047 0.064 0.064 E<br />
6972 Carol H Fagot Real Estate Trust & Archie Hamlin<br />
A480<br />
0.037 0.061 0.061<br />
Hillsborough<br />
Nursery, LLC<br />
G<br />
E<br />
Hillsborough 7005 Jerry Terry A535 G 0.042 0.059 0.059 E<br />
Hillsborough 7005 Jerry Terry A535 S 0 0.059 0.059 E<br />
Hillsborough 7007 Michael Joseph St. Martin and Marsha St. Martin A535 G 0.013 0.022 0.022 E<br />
Hillsborough 7033 GLH Enterprises, LLLP A415 G 0.03 0.05 0.05 E<br />
Hillsborough 7034 Gregory Henderson A415 G 0.009 0.015 0.015 E<br />
Hillsborough 7037 Gerald R. Herms A415 G 0.005 0.008 0.008 E<br />
Hillsborough 7055 Willis S. Kirkland, Jr. & Barbara J.‐Life Estate A415 G 0.011 0.019 0.019 E<br />
Hillsborough 7057 M L Davis Inc A415 G 0.017 0.028 0.028 E<br />
Hillsborough 7060 Charlie Grimes Farms, LLC A535 G 0.009 0.015 0.015 E<br />
Hillsborough 7061 Martha Dixon A495 G 0.003 0.004 0.004 E<br />
Hillsborough 7083 Astin Farms, Inc. A415 G 0.008 0.014 0.014 E<br />
Hillsborough 7084 Porter Hare/The Hare Family LP A535 G 0.023 0.037 0.037 E<br />
Hillsborough 7098 Mosaic Fertilizer LLC A415 G 0.012 0.039 0.039 E<br />
Hillsborough 7098 Mosaic Fertilizer LLC A415 S 0 0.039 0.039 E<br />
Hillsborough 7117 Pacific Agricultural Research Corp. / Attn: Frank Sances A535 G 0.029 0.048 0.048 E<br />
Hillsborough 7118 Charles G & Betty J Grimes A535 G 0.053 0.074 0.074 E<br />
Hillsborough 7147 Cecile B James A415 G 0.009 0.014 0.014 E<br />
Hillsborough 7150 Cedar Haven Inc. / Attn: John Bugg A415 G 0.008 0.014 0.014 E<br />
7183 I‐4 Land Holding Limited Company and I‐4 Ventures, A490<br />
0.069 0.153 0.153<br />
G<br />
Hillsborough<br />
LLC<br />
E<br />
Hillsborough 7184 Manit Piluek A58S G 0.008 0.014 0.014 E<br />
Hillsborough 7218 Homes for Hillsborough, Inc. A415 G 0.02 0.033 0.033 E<br />
Hillsborough 7232 Frances White A535 G 0 0.307 0.307 E<br />
Hillsborough 7232 Frances White A535 S 0.042 0.307 0.307 E<br />
M/E 5<br />
Page | 230
<strong>2011</strong> ESTIMATED WATER USE REPORT<br />
Table A7. Metered and <strong>Estimated</strong> Agricultural WUPs, Withdrawals and Permitted <strong>Use</strong> (mgd), <strong>2011</strong><br />
County<br />
WUP<br />
Number<br />
<strong>Southwest</strong> <strong>Florida</strong> <strong>Water</strong> <strong>Management</strong> District<br />
Permittee<br />
<strong>Use</strong><br />
Code 1<br />
Source 2<br />
Annual<br />
Average<br />
Pumpage 3<br />
Total<br />
Permitted<br />
Annual<br />
Average<br />
Quantity<br />
Permitted<br />
Quantity<br />
Attributed<br />
to AG <strong>Use</strong><br />
Category 4<br />
Hillsborough 7258 Ed Parker Tropical Fish Farm Inc L660 G 0.002 0.008 0.008 E<br />
Hillsborough 7259 Tampa Electric Co L605 G 0.002 0.007 0.007 E<br />
Hillsborough 7261 DRSRJ Development LLC/Attn:Ashok K. Joshi A415 G 0.136 0.188 0.188 E<br />
Hillsborough 7308 Paul D. and Phyllis English A535 G 0.011 0.018 0.018 E<br />
Hillsborough 7322 William Stanford Fortner A535 G 0.008 0.026 0.026 E<br />
Hillsborough 7325 Krusen‐Douglas Partnership A470 G 0.065 0.09 0.09 E<br />
Hillsborough 7353 Leaford & Yvonne Shakes A415 G 0.026 0.043 0.043 E<br />
Hillsborough 7366 Victor Meyer L661 G 0.009 0.016 0.016 E<br />
Hillsborough 7374 Edna Sue Willaford Trustee A415 G 0.007 0.011 0.011 E<br />
Hillsborough 7401 Don R. Adams L660 G 0.017 0.028 0.028 E<br />
Hillsborough 7417 D G Diehl Farms Inc A415 G 0.013 0.022 0.022 E<br />
Hillsborough 7422 David & Joyce Stanaland A58S G 0.012 0.019 0.019 E<br />
Hillsborough 7458 Thomas L. And Barbara J. Fulford Trust A415 G 0.008 0.013 0.013 E<br />
Hillsborough 7472 WES Investments of Hillsborough LLC / Tony Leung A415 G 0.031 0.051 0.051 E<br />
Hillsborough 7486 C.W. Dukes A535 G 0.011 0.017 0.017 E<br />
Hillsborough 7491 Kalik Creek Ranch LLC A415 G 0.005 0.018 0.018 E<br />
Hillsborough 7510 Thomas L. Fulford A415 G 0.007 0.024 0.024 E<br />
Hillsborough 7511 Elmer & Lorene Lawson A415 G 0.017 0.028 0.028 E<br />
Hillsborough 7516 Marilyn D. Hinson Ayers A535 G 0.02 0.032 0.032 E<br />
Hillsborough 7579 Floyd K & Joyce L DeVane A415 G 0.017 0.027 0.027 E<br />
Hillsborough 7641 Department of Environmental Protection L600 G 0.002 0.003 0.003 E<br />
Hillsborough 7642 Velma Ruth Johnson A51S G 0 0.106 0.106 E<br />
Hillsborough 7642 Velma Ruth Johnson A51S S 0.029 0.106 0.106 E<br />
Hillsborough 7673 Carolyn D & John S McMullen A495 G 0.048 0.067 0.067 E<br />
Hillsborough 7710 Reeder'S Landscaping A475 G 0 0.071 0.071 E<br />
Hillsborough 7715 Sandra R. Cameron A415 G 0.015 0.024 0.024 E<br />
Hillsborough 7717 D J & Uteva Mercer A480 G 0.011 0.037 0.037 E<br />
Hillsborough 7719 Simmons Family Grove Inc., Attn: Wayne Simmons A415 G 0.019 0.032 0.032 E<br />
Hillsborough 7739 GLH Enterprises, LLLP A490 G 0.01 0.016 0.016 E<br />
Hillsborough 7741 William P Stokes A415 G 0.001 0.001 0.001 E<br />
Hillsborough 7765 William E. and Judith C. Meek A655 G 0.057 0.103 0.103 E<br />
M/E 5<br />
Page | 231
<strong>2011</strong> ESTIMATED WATER USE REPORT<br />
Table A7. Metered and <strong>Estimated</strong> Agricultural WUPs, Withdrawals and Permitted <strong>Use</strong> (mgd), <strong>2011</strong><br />
County<br />
WUP<br />
Number<br />
<strong>Southwest</strong> <strong>Florida</strong> <strong>Water</strong> <strong>Management</strong> District<br />
Permittee<br />
<strong>Use</strong><br />
Code 1<br />
Source 2<br />
Annual<br />
Average<br />
Pumpage 3<br />
Total<br />
Permitted<br />
Annual<br />
Average<br />
Quantity<br />
Permitted<br />
Quantity<br />
Attributed<br />
to AG <strong>Use</strong><br />
Category 4<br />
Hillsborough 7765 William E. and Judith C. Meek A655 S 0 0.103 0.103 E<br />
Hillsborough 7767 Earl P & Mattie Marie Driggers A57F G 0.004 0.007 0.007 E<br />
Hillsborough 7782 The Closshey South 39 Farm, LLC A535 G 0.058 0.081 0.081 E<br />
Hillsborough 7786 E.P. Burnett A415 G 0.01 0.016 0.016 E<br />
Hillsborough 7810 Corporation Of The Presiding Bishop A415 G 0.024 0.04 0.04 E<br />
7812 George Wm, Lisa Diane Phillips, Brenda Phillips & A535<br />
0.039 0.066 0.065<br />
Hillsborough<br />
Rhonda Deshong<br />
G<br />
E<br />
Hillsborough 7820 Roger Dapson A410 G 0.003 0.006 0.006 E<br />
Hillsborough 7842 Theron B. Bostick A535 G 0.011 0.018 0.018 E<br />
Hillsborough 7844 Meyers Nurseries Inc A480 G 0.045 0.074 0.074 E<br />
Hillsborough 7880 Samuel D & Anne M Williamson A535 G 0.033 0.1 0.1 E<br />
Hillsborough 7880 Samuel D & Anne M Williamson A535 S 0 0.1 0.1 E<br />
Hillsborough 7922 Charles L & Peggy A Swilley A415 G 0.013 0.022 0.022 E<br />
Hillsborough 7936 Kevin & Cheryl Ann Epps A480 G 0.023 0.038 0.038 E<br />
Hillsborough 7951 Ronald Lehman A415 G 0.021 0.035 0.035 E<br />
Hillsborough 7959 John M, Daniel W, &Judith E. Purvis A415 G 0.013 0.021 0.021 E<br />
Hillsborough 7975 Bf Usb Inc A415 G 0.004 0.038 0.011 E<br />
Hillsborough 7978 Joseph R Goodson A535 G 0.019 0.03 0.03 E<br />
Hillsborough 7984 Richard & Stacy Michelle Delcastillo A535 G 0.01 0.016 0.016 E<br />
Hillsborough 7992 Epps Nursery Inc A480 G 0.019 0.053 0.053 E<br />
Hillsborough 7992 Epps Nursery Inc A480 S 0 0.053 0.053 E<br />
Hillsborough 7993 Winfred M. Harrell A480 G 0.012 0.02 0.02 E<br />
Hillsborough 8008 Wilbur R & Julianne Reschly A415 G 0.006 0.011 0.011 E<br />
Hillsborough 8015 George and Patricia Sprouse A535 G 0.006 0.029 0.029 E<br />
Hillsborough 8015 George and Patricia Sprouse A535 S 0 0.029 0.029 E<br />
Hillsborough 8077 Cedar Haven Inc A415 G 0.018 0.03 0.03 E<br />
Hillsborough 8110 Hollis D McDonald Jr A535 G 0.023 0.038 0.038 E<br />
Hillsborough 8121 Robert L & Barbara B Carter Trustees A535 G 0.012 0.02 0.02 E<br />
Hillsborough 8138 Dan Mann A415 G 0.013 0.021 0.021 E<br />
Hillsborough 8161 Gregory S. Shiver and Jennifer L. Shiver A480 G 0.016 0.026 0.026 E<br />
Hillsborough 8172 Sam Astin, Jr. (Astin Farms, Inc.) A535 G 0.029 0.063 0.063 E<br />
M/E 5<br />
Page | 232
<strong>2011</strong> ESTIMATED WATER USE REPORT<br />
Table A7. Metered and <strong>Estimated</strong> Agricultural WUPs, Withdrawals and Permitted <strong>Use</strong> (mgd), <strong>2011</strong><br />
County<br />
WUP<br />
Number<br />
<strong>Southwest</strong> <strong>Florida</strong> <strong>Water</strong> <strong>Management</strong> District<br />
Permittee<br />
<strong>Use</strong><br />
Code 1<br />
Source 2<br />
Annual<br />
Average<br />
Pumpage 3<br />
Total<br />
Permitted<br />
Annual<br />
Average<br />
Quantity<br />
Permitted<br />
Quantity<br />
Attributed<br />
to AG <strong>Use</strong><br />
Category 4<br />
Hillsborough 8172 Sam Astin, Jr. (Astin Farms, Inc.) A535 S 0 0.063 0.063 E<br />
Hillsborough 8175 Fred Mcnairy A475 G 0.021 0.034 0.034 E<br />
Hillsborough 8190 E H & Loreta Harvill A480 G 0.027 0.044 0.044 E<br />
Hillsborough 8195 Lee Pallardy and C. Dennis Carlton A655 G 0.05 0.069 0.069 E<br />
Hillsborough 8217 Ellen S. Folsom A415 G 0.019 0.031 0.031 E<br />
Hillsborough 8227 Farkas Citrus Nursery Inc A415 G 0.01 0.017 0.017 E<br />
Hillsborough 8354 Francis J And Shirley A Roberts A50F G 0.001 0.003 0.003 E<br />
Hillsborough 8373 James B & Patricia A Haggard A480 G 0.033 0.054 0.054 E<br />
Hillsborough 8409 F.E. Hall Grove, Inc. A415 G 0.017 0.029 0.029 E<br />
Hillsborough 8427 Vila Elnora Clark & LJ Patterson A415 G 0.021 0.034 0.034 E<br />
Hillsborough 8428 John and Gina Donini A415 G 0.017 0.028 0.028 E<br />
Hillsborough 8451 John N Aoki Tst John N Aoki Rev Trust A475 G 0.004 0.014 0.014 E<br />
Hillsborough 8452 C C Bever Jr A415 G 0.003 0.004 0.004 E<br />
Hillsborough 8483 David E & Mary D Reynolds A485 G 0.001 0.042 0.041 E<br />
Hillsborough 8483 David E & Mary D Reynolds A485 S 0.012 0.042 0.041 E<br />
Hillsborough 8490 James Maring A535 G 0.021 0.035 0.035 E<br />
Hillsborough 8492 Ruis L Drawdy L660 G 0.069 0.095 0.095 E<br />
Hillsborough 8497 Raymond & Shirley J Spirnock A485 G 0.063 0.091 0.091 E<br />
8563 The T.G. and Laverne Robinson Family Partnership, A415<br />
0.023 0.087 0.047<br />
G<br />
Hillsborough<br />
LTD.<br />
E<br />
Hillsborough 8574 Pleasant/Wimauma Groves Ltd A415 G 0.037 0.052 0.052 E<br />
Hillsborough 8575 Benjamin T & Edith Sylvia Knox A415 G 0.014 0.046 0.046 E<br />
Hillsborough 8576 Hopewell Baptist Church Inc & A415 G 0.016 0.027 0.027 E<br />
Hillsborough 8578 Wilbur R & Melissa Reschly A415 G 0.008 0.014 0.014 E<br />
Hillsborough 8585 Leonard R Mallard L660 G 0.066 0.092 0.092 E<br />
Hillsborough 8591 Richard A & Francine J Grewe A415 G 0.008 0.013 0.013 E<br />
Hillsborough 8601 Donna S. Lloyd A480 G 0.006 0.01 0.01 E<br />
Hillsborough 8605 Fatemah Company A415 G 0.024 0.039 0.039 E<br />
Hillsborough 8611 Doris C. Harvey Marital Trust A415 G 0.01 0.017 0.017 E<br />
Hillsborough 8648 Human Development Ctr Inc A480 G 0.003 0.005 0.005 E<br />
Hillsborough 8657 Golden Pond Tropicals Inc L660 G 0.06 0.098 0.098 E<br />
M/E 5<br />
Page | 233
<strong>2011</strong> ESTIMATED WATER USE REPORT<br />
Table A7. Metered and <strong>Estimated</strong> Agricultural WUPs, Withdrawals and Permitted <strong>Use</strong> (mgd), <strong>2011</strong><br />
County<br />
WUP<br />
Number<br />
<strong>Southwest</strong> <strong>Florida</strong> <strong>Water</strong> <strong>Management</strong> District<br />
Permittee<br />
<strong>Use</strong><br />
Code 1<br />
Source 2<br />
Annual<br />
Average<br />
Pumpage 3<br />
Total<br />
Permitted<br />
Annual<br />
Average<br />
Quantity<br />
Permitted<br />
Quantity<br />
Attributed<br />
to AG <strong>Use</strong><br />
Category 4<br />
Hillsborough 8658 Consolidated Fish Farms Inc L660 G 0.026 0.043 0.043 E<br />
Hillsborough 8674 Maple Creek Properties Inc A415 G 0.046 0.063 0.063 E<br />
Hillsborough 8677 David H & Nancy S Gill A410 G 0.023 0.038 0.038 E<br />
Hillsborough 8679 Cee Bee'S Grove Inc A415 G 0 0.066 0.066 E<br />
Hillsborough 8679 Cee Bee'S Grove Inc A415 S 0 0.066 0.066 E<br />
Hillsborough 8686 Audrey Beauchamp Miller & Paula Ballinger A535 G 0.042 0.069 0.069 E<br />
Hillsborough 8699 Hillsborough Co School Board A485 G 0.003 0.006 0.006 E<br />
Hillsborough 8701 Hillsborough Co School Board A420 G 0.003 0.027 0.005 E<br />
Hillsborough 8705 Hillsborough Co School Board A485 G 0.004 0.048 0.006 E<br />
Hillsborough 8706 Hillsborough Co School Board A535 G 0.018 0.029 0.029 E<br />
Hillsborough 8708 School Board of Hillsborough County A58S G 0.001 0.075 0.002 E<br />
Hillsborough 8710 Hillsborough Co School Board A58S G 0.015 0.046 0.025 E<br />
Hillsborough 8711 Hillsborough Co School Board A485 G 0.004 0.006 0.006 E<br />
Hillsborough 8713 Hillsborough Co School Board A485 G 0.005 0.016 0.009 E<br />
Hillsborough 8715 Hillsborough Co School Board A58S G 0.003 0.02 0.005 E<br />
Hillsborough 8716 Hillsborough Co School Board A475 G 0.002 0.054 0.003 E<br />
Hillsborough 8717 Hillsborough Co School Board A58S G 0.005 0.034 0.018 E<br />
Hillsborough 8761 Hillsborough County BOCC, A415 G 0.036 0.051 0.051 E<br />
Hillsborough 8762 Calvin G Lyons Jr A415 G 0.016 0.026 0.026 E<br />
Hillsborough 8764 Mission At Lakeshore LLC A415 G 0.005 0.008 0.008 E<br />
Hillsborough 8824 William E. Bridges A550 G 0.005 0.008 0.008 E<br />
Hillsborough 8842 Winfred M. Harrell A480 G 0.022 0.071 0.071 E<br />
Hillsborough 8842 Winfred M. Harrell A480 S 0.021 0.071 0.071 E<br />
Hillsborough 8859 Paul Gatta Jr L660 G 0.002 0.004 0.004 E<br />
Hillsborough 8875 Paul L. Harris and Rebecca C. Harris A487 G 0.014 0.024 0.024 E<br />
Hillsborough 8883 Hillsborough Co School Board A480 G 0.001 0.058 0.001 E<br />
Hillsborough 8884 John F & Beverly J Stevens Co‐Trustees A480 G 0.021 0.035 0.035 E<br />
Hillsborough 8910 Turner Farms Inc Bradley And George Turner A415 G 0.037 0.051 0.051 E<br />
Hillsborough 8916 Winfred M. Harrell A480 G 0.031 0.051 0.051 E<br />
Hillsborough 8923 Jewell Wimberly A535 G 0.041 0.057 0.057 E<br />
Hillsborough 8946 Ferris‐Peggy‐Ferris Jr‐Albert & Stephanie Waller A415 G 0.049 0.067 0.067 E<br />
M/E 5<br />
Page | 234
<strong>2011</strong> ESTIMATED WATER USE REPORT<br />
Table A7. Metered and <strong>Estimated</strong> Agricultural WUPs, Withdrawals and Permitted <strong>Use</strong> (mgd), <strong>2011</strong><br />
County<br />
WUP<br />
Number<br />
<strong>Southwest</strong> <strong>Florida</strong> <strong>Water</strong> <strong>Management</strong> District<br />
Permittee<br />
<strong>Use</strong><br />
Code 1<br />
Source 2<br />
Annual<br />
Average<br />
Pumpage 3<br />
Total<br />
Permitted<br />
Annual<br />
Average<br />
Quantity<br />
Permitted<br />
Quantity<br />
Attributed<br />
to AG <strong>Use</strong><br />
Category 4<br />
Hillsborough 8955 Lone Oak Baptist Missionary Baptist Church Inc A535 G 0.015 0.027 0.025 E<br />
Hillsborough 8968 Lisa Lelan Mcconnell & Travis David Council A415 G 0.015 0.024 0.024 E<br />
Hillsborough 8971 William C Klein A415 G 0.009 0.014 0.014 E<br />
Hillsborough 8983 Ronald C. & Cynthia L. English A415 G 0.007 0.012 0.012 E<br />
Hillsborough 8999 <strong>Florida</strong> Star Farms Inc‐Hull Citrus Prop Inc‐S E Hull Rlt A535 G 0.04 0.066 0.066 E<br />
Hillsborough 9019 Raymond E & Patricia A Conrad A415 G 0.018 0.029 0.029 E<br />
Hillsborough 9020 Central Maint & Welding Inc A415 G 0.011 0.018 0.018 E<br />
Hillsborough 9056 Leonard H Marks Trustee A535 G 0.059 0.082 0.082 E<br />
Hillsborough 9062 Thomas F & Ellen S Folsom A415 G 0.024 0.039 0.039 E<br />
Hillsborough 9102 Thomas D. & Patricia M. Richey, Jr. A415 G 0.015 0.025 0.025 E<br />
Hillsborough 9106 Joseph B & Gloria J Cook L660 G 0.04 0.056 0.056 E<br />
Hillsborough 9133 Richard & Linda Lariscy A535 G 0.017 0.028 0.028 E<br />
Hillsborough 9179 Larry W Coleman A415 G 0.016 0.026 0.026 E<br />
Hillsborough 9238 Jose A & Teresa Chavez Hernandez A535 G 0.026 0.043 0.043 E<br />
9277 Alberta S Fletcher Life Estate & Marian Jeanette Fletcher A415<br />
0.008 0.012 0.012<br />
Hillsborough<br />
Hall<br />
G<br />
E<br />
Hillsborough 9278 Elias & Lorena Gutierrez A535 G 0.026 0.043 0.043 E<br />
Hillsborough 9286 Roger Dale Allen A415 G 0.004 0.006 0.006 E<br />
Hillsborough 9304 RaLPh And Virgie Williams A535 S 0.014 0.022 0.022 E<br />
Hillsborough 9315 Wilmer E & Joyce Woodard A535 G 0.015 0.024 0.024 E<br />
Hillsborough 9323 DT‐MST LLC & Rjjams LLC A415 G 0.005 0.018 0.018 E<br />
Hillsborough 9323 DT‐MST LLC & Rjjams LLC A415 S 0 0.018 0.018 E<br />
Hillsborough 9378 IMC Fertilizer Inc A415 G 0 0.024 0.024 E<br />
Hillsborough 9388 NNP‐Southbend II, LLC A56S G 0.244 0.443 0.443 E<br />
Hillsborough 9397 Richard A. & Peggy F. Hall A415 S 0.026 0.043 0.043 E<br />
Hillsborough 9399 Robert M. And Lisa Hinton A525 G 0.015 0.025 0.025 E<br />
Hillsborough 9456 Wanda M Stewart Trustee Uad 8‐08 A535 G 0.062 0.092 0.092 E<br />
Hillsborough 9459 First Freewill Baptist Holding Co. A460 G 0.012 0.02 0.02 E<br />
Hillsborough 9463 Thomas D & Patricia Richey A415 G 0.007 0.012 0.012 E<br />
Hillsborough 9481 C Dennis Carlton A415 G 0.02 0.034 0.034 E<br />
Hillsborough 9534 Robert James & Margaret Coe Wilder A415 G 0.008 0.012 0.012 E<br />
M/E 5<br />
Page | 235
<strong>2011</strong> ESTIMATED WATER USE REPORT<br />
Table A7. Metered and <strong>Estimated</strong> Agricultural WUPs, Withdrawals and Permitted <strong>Use</strong> (mgd), <strong>2011</strong><br />
County<br />
WUP<br />
Number<br />
<strong>Southwest</strong> <strong>Florida</strong> <strong>Water</strong> <strong>Management</strong> District<br />
Permittee<br />
<strong>Use</strong><br />
Code 1<br />
Source 2<br />
Annual<br />
Average<br />
Pumpage 3<br />
Total<br />
Permitted<br />
Annual<br />
Average<br />
Quantity<br />
Permitted<br />
Quantity<br />
Attributed<br />
to AG <strong>Use</strong><br />
Category 4<br />
Hillsborough 9542 John P & Katherine A McCarthy A415 G 0.013 0.022 0.022 E<br />
Hillsborough 9549 Virgil E & Shirley A Best L660 G 0.045 0.062 0.062 E<br />
Hillsborough 9554 Robert W Allen Jr/Bette J Allen A415 G 0.012 0.019 0.019 E<br />
9598 Big Bend Holdings LLP, And Duke Realty Limited L660<br />
0.002 0.003 0.003<br />
Hillsborough<br />
Partnership<br />
G<br />
E<br />
Hillsborough 9625 Cowart, Uleric Eugene and Martha A415 G 0.01 0.017 0.017 E<br />
Hillsborough 9651 Jose Abrams, Osvaldo Ruiz And L600 G 0 0 0 E<br />
Hillsborough 9655 Loop Farms LLC A415 G 0.021 0.034 0.034 E<br />
Hillsborough 9658 Keel Farms, Inc. A410 G 0.01 0.048 0.047 E<br />
Hillsborough 9676 Katherine B. Manning and Stephen Bronson L661 G 0.01 0.017 0.017 E<br />
Hillsborough 9701 Branch Land Company, LLC A415 G 0.018 0.03 0.03 E<br />
Hillsborough 9761 Frank Capitano L615 G 0.026 0.042 0.042 E<br />
Hillsborough 9771 Conrad Family LP A415 G 0.007 0.012 0.012 E<br />
Hillsborough 9788 Bret A. & Sarah A. Boston A410 G 0.018 0.029 0.029 E<br />
Hillsborough 9796 Sanchez Brothers Tropical Fish L660 G 0.044 0.072 0.072 E<br />
Hillsborough 9801 James W. Hatfield L660 G 0.011 0.019 0.019 E<br />
Hillsborough 9802 Scott E. and April M Shupert L660 G 0.01 0.016 0.016 E<br />
Hillsborough 9874 Elton E. Conrad and Carol H. Conrad A415 G 0.005 0.007 0.007 E<br />
Hillsborough 9875 Grace Community Church Of Brandon Inc A51S G 0.025 0.047 0.04 E<br />
Hillsborough 9888 Hilda Castillo A535 G 0.021 0.036 0.036 E<br />
Hillsborough 9888 Hilda Castillo A535 S 0 0.036 0.036 E<br />
Hillsborough 9889 Benny E Stanley A535 G 0 0.028 0.028 E<br />
Hillsborough 9889 Benny E Stanley A535 S 0 0.028 0.028 E<br />
Hillsborough 9902 Casper J. And Sue Ann Brock A415 G 0.003 0.004 0.004 E<br />
Hillsborough 9908 Sarah Williamson A410 G 0.072 0.099 0.099 E<br />
Hillsborough 9936 Wimauma Grove LLC A415 G 0.037 0.052 0.052 E<br />
Hillsborough 9948 Rand, Rex and Lucille E. Reese, Trustee A415 G 0.05 0.069 0.069 E<br />
Hillsborough 9992 Robert J. and Sylvia Rowell L600 G 0.006 0.021 0.009 E<br />
9995 Charlie Grimes Farms, LLC, Jacob Aaron and Melissa Sue A58S<br />
0.009 0.014 0.014<br />
Hillsborough<br />
Grimes<br />
S<br />
E<br />
Hillsborough 10003 Velma Newsome Groves, Inc. A535 G 0.011 0.018 0.018 E<br />
M/E 5<br />
Page | 236
<strong>2011</strong> ESTIMATED WATER USE REPORT<br />
Table A7. Metered and <strong>Estimated</strong> Agricultural WUPs, Withdrawals and Permitted <strong>Use</strong> (mgd), <strong>2011</strong><br />
County<br />
WUP<br />
Number<br />
Permittee<br />
<strong>Use</strong><br />
Code 1<br />
Source 2<br />
Annual<br />
Average<br />
Pumpage 3<br />
Total<br />
Permitted<br />
Annual<br />
Average<br />
Quantity<br />
Permitted<br />
Quantity<br />
Attributed<br />
to AG <strong>Use</strong><br />
Category 4<br />
Hillsborough 10010 L. Heath Ham A535 G 0.018 0.03 0.03 E<br />
Hillsborough 10010 L. Heath Ham A535 S 0 0.03 0.03 E<br />
Hillsborough 10018 Wimauma Snail Farm L661 G 0.013 0.023 0.023 E<br />
Hillsborough 10020 Darrell and Linda Gagnon L600 G 0.002 0.004 0.004 E<br />
Hillsborough 10037 Ed Parker Tropical Fish Farm Inc L660 G 0.037 0.062 0.062 E<br />
Hillsborough 10038 Dwayne Deshong A415 G 0.01 0.017 0.017 E<br />
Hillsborough 10053 Anna C Moore A58S G 0.004 0.007 0.007 E<br />
Hillsborough 10055 R.V. Morgan A58S G 0.057 0.085 0.085 E<br />
Hillsborough 10057 E O CuLPepper A415 G 0.005 0.017 0.017 E<br />
Hillsborough 10069 Gerald L. Swilley A415 G 0 0.007 0.007 E<br />
Hillsborough 10071 Terraqua Aquatics L660 G 0.028 0.061 0.055 E<br />
Hillsborough 10072 Terraqua Aquatics L660 G 0.007 0.015 0.012 E<br />
Hillsborough 10080 Perfection Partners Ltd A415 G 0 0.014 0.014 E<br />
Hillsborough 10100 B & P Tree Farm, LLC A475 G 0.027 0.045 0.045 E<br />
Hillsborough 10105 Sanwa Growers Inc A56F G 0.06 0.084 0.084 E<br />
Hillsborough 10106 Edith I Wansley Life Estate, Edith I Wansley Trustee A535 G 0.009 0.014 0.014 E<br />
Hillsborough 10111 Armando O Or Linda Roche A490 G 0.002 0.007 0.007 E<br />
Hillsborough 10115 Hudson Nursery A480 G 0.04 0.055 0.055 E<br />
10117 Fred S Johnston Jr., Jean J Ayala & Gloria Sparkman A415<br />
0.054 0.075 0.075<br />
G<br />
Hillsborough<br />
Trust<br />
E<br />
Hillsborough 10150 Feng Ci Zhen A646 G 0.021 0.035 0.035 E<br />
Hillsborough 10154 Juanita Saranko A415 G 0 0.012 0.012 E<br />
Hillsborough 10155 Glynn C. Capps A535 G 0.052 0.072 0.072 E<br />
Hillsborough 10165 Ronald M & Lena Lott A535 G 0 0.091 0.091 E<br />
Hillsborough 10165 Ronald M & Lena Lott A535 S 0 0.091 0.091 E<br />
Hillsborough 10170 EM & T Properties, Inc., A535 G 0.022 0.036 0.036 E<br />
10175 Chester P. Kon Living Trust and Waleria Kon Living L600<br />
0 0 0<br />
G<br />
Hillsborough<br />
Trust<br />
E<br />
Hillsborough 10201 Wes Investments Of Hillsborough LLC A415 G 0.009 0.015 0.015 E<br />
Hillsborough 10209 Robert A Newsome A415 G 0.012 0.019 0.019 E<br />
Hillsborough 10212 Wilbur R Reschly A415 G 0 0.018 0.018 E<br />
M/E 5<br />
<strong>Southwest</strong> <strong>Florida</strong> <strong>Water</strong> <strong>Management</strong> District<br />
Page | 237
<strong>2011</strong> ESTIMATED WATER USE REPORT<br />
Table A7. Metered and <strong>Estimated</strong> Agricultural WUPs, Withdrawals and Permitted <strong>Use</strong> (mgd), <strong>2011</strong><br />
County<br />
WUP<br />
Number<br />
<strong>Southwest</strong> <strong>Florida</strong> <strong>Water</strong> <strong>Management</strong> District<br />
Permittee<br />
<strong>Use</strong><br />
Code 1<br />
Source 2<br />
Annual<br />
Average<br />
Pumpage 3<br />
Total<br />
Permitted<br />
Annual<br />
Average<br />
Quantity<br />
Permitted<br />
Quantity<br />
Attributed<br />
to AG <strong>Use</strong><br />
Category 4<br />
Hillsborough 10227 Maryland E. White A58S G 0 0.015 0.015 E<br />
Hillsborough 10255 Tampa Bay Mitigation Lc A58S G 0.006 0.15 0.15 E<br />
Hillsborough 10268 Transcend Development Corp A525 G 0 0.099 0.041 E<br />
Hillsborough 10268 Transcend Development Corp A525 S 0.002 0.099 0.041 E<br />
Hillsborough 10269 Clyde W Munzel Revocable Trust L660 G 0.006 0.01 0.01 E<br />
Hillsborough 10276 Shirley Ranch A490 G 0 0.003 0.003 E<br />
Hillsborough 10291 N.O.B. Farms, Inc. A415 G 0.023 0.038 0.038 E<br />
Hillsborough 10303 Jon W & Suphaporn Berry A415 G 0.009 0.015 0.015 E<br />
Hillsborough 10354 Marion C. Smith, Trustee A415 G 0.01 0.016 0.016 E<br />
Hillsborough 10363 Virginia J & Douglas J Leetun A415 G 0.009 0.045 0.045 E<br />
Hillsborough 10363 Virginia J & Douglas J Leetun A415 S 0.018 0.045 0.045 E<br />
Hillsborough 10364 Currie Enterprises LLC/Attn: Wilmer Currie, III L600 G 0 0 0 E<br />
Hillsborough 10371 Linda Honeycutt Life Estate L600 G 0.001 0.002 0.002 E<br />
Hillsborough 10372 Jon R. Butts A575 G 0.022 0.062 0.062 E<br />
Hillsborough 10372 Jon R. Butts A575 S 0.022 0.062 0.062 E<br />
Hillsborough 10376 Robert & Lisa Weiss A490 G 0.026 0.042 0.042 E<br />
Hillsborough 10383 Edward T & Carol J Hubbell A480 G 0.002 0.004 0.003 E<br />
Hillsborough 10384 Tornello Landscape Corporation A475 G 0.025 0.04 0.04 E<br />
Hillsborough 10387 Robert Teegardin L661 G 0.01 0.017 0.017 E<br />
Hillsborough 10389 W.L. Evers, Inc. A415 G 0.027 0.044 0.044 E<br />
Hillsborough 10400 Cardanell Farms/Attn:David E Ward Jr A415 G 0.037 0.051 0.051 E<br />
Hillsborough 10401 Gerald Simmons Tropical Fish Farm L660 G 0.027 0.044 0.044 E<br />
Hillsborough 10402 Harold F. Dukes A535 G 0.017 0.057 0.057 E<br />
Hillsborough 10402 Harold F. Dukes A535 S 0 0.057 0.057 E<br />
Hillsborough 10408 Jesse Thomas Carr A415 S 0.015 0.025 0.025 E<br />
Hillsborough 10415 E.J. Proctor & B.H. Burnett L660 G 0.02 0.033 0.033 E<br />
Hillsborough 10417 Timothy B & Tina M Conley A56F G 0.026 0.042 0.042 E<br />
Hillsborough 10422 Ward, Bill A415 G 0.008 0.013 0.013 E<br />
Hillsborough 10431 Ronya Properties LLC A535 G 0.058 0.08 0.08 E<br />
Hillsborough 10431 Ronya Properties LLC A535 S 0 0.08 0.08 E<br />
Hillsborough 10432 Wes Investments Of Hillsborough LLC A56S G 0.023 0.037 0.037 E<br />
M/E 5<br />
Page | 238
<strong>2011</strong> ESTIMATED WATER USE REPORT<br />
Table A7. Metered and <strong>Estimated</strong> Agricultural WUPs, Withdrawals and Permitted <strong>Use</strong> (mgd), <strong>2011</strong><br />
County<br />
WUP<br />
Number<br />
<strong>Southwest</strong> <strong>Florida</strong> <strong>Water</strong> <strong>Management</strong> District<br />
Permittee<br />
<strong>Use</strong><br />
Code 1<br />
Source 2<br />
Annual<br />
Average<br />
Pumpage 3<br />
Total<br />
Permitted<br />
Annual<br />
Average<br />
Quantity<br />
Permitted<br />
Quantity<br />
Attributed<br />
to AG <strong>Use</strong><br />
Category 4<br />
Hillsborough 10437 Nancy G. Alcorn L660 G 0.008 0.013 0.013 E<br />
Hillsborough 10438 Hillsborough County BOCC, Attn:Kurt Gremley A485 G 0.004 0.015 0.015 E<br />
Hillsborough 10441 Alton M. Taylor A415 G 0 0.012 0.012 E<br />
Hillsborough 10464 Betty Jordan A465 G 0.006 0.01 0.01 E<br />
Hillsborough 10465 William Colby L660 G 0.014 0.055 0.055 E<br />
Hillsborough 10467 Dennis H Spivey A415 G 0.005 0.008 0.008 E<br />
Hillsborough 10480 Charles L. & Miria L. Hester A415 G 0.007 0.011 0.011 E<br />
Hillsborough 10484 Heriberto & Elba B Ruiz L630 G 0.007 0.014 0.014 E<br />
Hillsborough 10485 Thomas & Grace Jacob A58S G 0 0.063 0.062 E<br />
Hillsborough 10485 Thomas & Grace Jacob A58S S 0.022 0.063 0.062 E<br />
Hillsborough 10486 Robert D. Aman A415 G 0.011 0.018 0.018 E<br />
Hillsborough 10495 Charles L & Miria L Hester & Glenden E Lehnus A415 G 0.009 0.029 0.029 E<br />
Hillsborough 10542 Carroll F. Williamson A415 G 0.004 0.006 0.006 E<br />
Hillsborough 10570 Jerry Allen Joyner A56S G 0 0.099 0.099 E<br />
Hillsborough 10570 Jerry Allen Joyner A56S S 0.059 0.099 0.099 E<br />
Hillsborough 10603 Henry C Badcock Sr A415 G 0.013 0.022 0.022 E<br />
Hillsborough 10629 Willie Wingate A51S G 0.012 0.038 0.038 E<br />
Hillsborough 10674 James R. Welch Jr. and Freida Welch A651 G 0.013 0.022 0.022 E<br />
Hillsborough 10678 Kay Edwards & Gloria Sandhaus A415 G 0.002 0.004 0.004 E<br />
Hillsborough 10684 ESMS Enterprises, LTD A415 G 0.017 0.028 0.028 E<br />
Hillsborough 10695 Jamea J And Brenda A Cuthberston A415 G 0.006 0.01 0.01 E<br />
Hillsborough 10738 Perfection Partners Ltd A415 G 0.008 0.013 0.013 E<br />
Hillsborough 10741 Evans Properties Inc A415 G 0.005 0.008 0.008 E<br />
Hillsborough 10777 Steve Ronald Bonds A415 G 0 0.008 0.008 E<br />
Hillsborough 10779 Philip A. Bullerman A415 G 0 0.037 0.037 E<br />
Hillsborough 10780 C Reid Schmidt A415 G 0.003 0.004 0.004 E<br />
Hillsborough 10784 William C & Rebecca D Wilson A535 G 0.013 0.022 0.022 E<br />
Hillsborough 10789 Harold F. Dukes A535 G 0.024 0.04 0.04 E<br />
Hillsborough 10810 Thomas A. Knaus A415 S 0 0.011 0.011 E<br />
Hillsborough 10817 Farmland Reserve Inc.; Attn: Mr Will Redd A480 G 0.009 0.031 0.013 E<br />
Hillsborough 10839 J.H. & Ohnie Williams, Jr. A415 G 0.006 0.01 0.01 E<br />
M/E 5<br />
Page | 239
<strong>2011</strong> ESTIMATED WATER USE REPORT<br />
Table A7. Metered and <strong>Estimated</strong> Agricultural WUPs, Withdrawals and Permitted <strong>Use</strong> (mgd), <strong>2011</strong><br />
County<br />
WUP<br />
Number<br />
<strong>Southwest</strong> <strong>Florida</strong> <strong>Water</strong> <strong>Management</strong> District<br />
Permittee<br />
<strong>Use</strong><br />
Code 1<br />
Source 2<br />
Annual<br />
Average<br />
Pumpage 3<br />
Total<br />
Permitted<br />
Annual<br />
Average<br />
Quantity<br />
Permitted<br />
Quantity<br />
Attributed<br />
to AG <strong>Use</strong><br />
Category 4<br />
Hillsborough 10847 Glenna & Iris J Hogue A415 G 0.006 0.009 0.009 E<br />
Hillsborough 10867 Joan L Sultenfuss Ltd A415 G 0.029 0.047 0.047 E<br />
Hillsborough 10876 Mac A Greco Jr And Arlene Baker A525 G 0.025 0.04 0.04 E<br />
Hillsborough 10883 Danny R & Delta D Loyd & B & K Property Mgmt Trust A480 G 0 0.08 0.08 E<br />
Hillsborough 10883 Danny R & Delta D Loyd & B & K Property Mgmt Trust A480 S 0.039 0.08 0.08 E<br />
10898 Nancy N Skemp & Caroline N Shepard‐Sns Trust‐ A525<br />
0.03 0.057 0.05<br />
Hillsborough<br />
Newbern Groves<br />
G<br />
E<br />
Hillsborough 10899 Emiliano Colon L660 G 0.057 0.079 0.079 E<br />
Hillsborough 10906 Nector Abreut A480 G 0.009 0.014 0.014 E<br />
Hillsborough 10911 Kenneth R. Dance A415 G 0.016 0.027 0.027 E<br />
Hillsborough 10925 Frank Gonzalez A415 G 0 0.003 0.003 E<br />
Hillsborough 10939 Mrs H D McDonald Jr A535 G 0.018 0.036 0.036 E<br />
Hillsborough 10939 Mrs H D McDonald Jr A535 S 0.004 0.036 0.036 E<br />
Hillsborough 10949 Eddit H. & Elaine C. Outar L660 G 0.041 0.057 0.057 E<br />
Hillsborough 10953 Doyle R. & Joyce C. Hunter A415 G 0.004 0.007 0.007 E<br />
Hillsborough 10956 John E. Powell (Ruskin Colony Farms) A56F G 0.013 0.021 0.021 E<br />
Hillsborough 10957 Patricia A. Murrell A415 G 0.017 0.027 0.027 E<br />
Hillsborough 10958 Dana B Conner & Dennis Platt L660 G 0.028 0.046 0.046 E<br />
Hillsborough 10960 Rainbow Flowers Inc A485 G 0.042 0.058 0.058 E<br />
Hillsborough 10967 Country Properties Of SW Fla Inc A485 G 0.028 0.046 0.046 E<br />
Hillsborough 10973 Estate Of Eugene Jackson A415 G 0.008 0.013 0.013 E<br />
Hillsborough 10980 Jose Diaz, Jr. A485 G 0.016 0.026 0.026 E<br />
Hillsborough 11013 Plants Of Ruskin, Inc. A480 G 0.038 0.062 0.062 E<br />
Hillsborough 11040 Greg Lovett L660 G 0.008 0.032 0.032 E<br />
Hillsborough 11048 Berkshire Investments A535 G 0.018 0.029 0.029 E<br />
Hillsborough 11101 Milton & Joanne T Varn A415 G 0.015 0.025 0.025 E<br />
Hillsborough 11102 Stine Family Partnership Ltd/Attn: Donald K Stine A535 G 0.023 0.037 0.037 E<br />
Hillsborough 11121 Dennis R & Diane Tencza A415 G 0.008 0.013 0.013 E<br />
Hillsborough 11205 James H & Janice L Grisham Tst A490 G 0.009 0.015 0.015 E<br />
Hillsborough 11262 Basil N., Janie C. & Laureen Scaglione A415 G 0.013 0.022 0.022 E<br />
Hillsborough 11273 Clinton W & Bonnie S Chancey L660 G 0.011 0.017 0.017 E<br />
M/E 5<br />
Page | 240
<strong>2011</strong> ESTIMATED WATER USE REPORT<br />
Table A7. Metered and <strong>Estimated</strong> Agricultural WUPs, Withdrawals and Permitted <strong>Use</strong> (mgd), <strong>2011</strong><br />
County<br />
WUP<br />
Number<br />
<strong>Southwest</strong> <strong>Florida</strong> <strong>Water</strong> <strong>Management</strong> District<br />
Permittee<br />
<strong>Use</strong><br />
Code 1<br />
Source 2<br />
Annual<br />
Average<br />
Pumpage 3<br />
Total<br />
Permitted<br />
Annual<br />
Average<br />
Quantity<br />
Permitted<br />
Quantity<br />
Attributed<br />
to AG <strong>Use</strong><br />
Category 4<br />
Hillsborough 11284 George B & Mary H Anderson L660 G 0.02 0.033 0.033 E<br />
11298 Doyle E & Jimmie L Parker Tst Parker Family Lvg Tst L660<br />
0.024 0.039 0.039<br />
Hillsborough<br />
9/9/99<br />
G<br />
E<br />
Hillsborough 11302 Bd Of Tst Internal Improvement L660 G 0.026 0.042 0.042 E<br />
Hillsborough 11305 Batista & Evelyn Madonia A56S G 0.001 0.09 0.09 E<br />
Hillsborough 11307 Charles L. & Norma G. Woodard A480 G 0.011 0.018 0.018 E<br />
Hillsborough 11345 Darrell L. & Monica G. Knight A485 G 0.019 0.031 0.031 E<br />
Hillsborough 11371 Raymond F Lantzer A485 G 0 0.041 0.041 E<br />
Hillsborough 11390 Charles D & Yvonne O Barron A535 G 0.025 0.066 0.066 E<br />
Hillsborough 11390 Charles D & Yvonne O Barron A535 S 0 0.066 0.066 E<br />
Hillsborough 11418 Robert Wayne & Babara M Lewis A415 S 0.003 0.005 0.005 E<br />
Hillsborough 11474 Sam Howell Astin III and Buffy Suzanne Astin A535 G 0.056 0.078 0.078 E<br />
Hillsborough 11494 Winfred M & Edna Sue Harrell A480 G 0.014 0.022 0.022 E<br />
Hillsborough 11508 Patricia A & Raymond E Conrad Trustees A415 G 0.023 0.038 0.038 E<br />
Hillsborough 11525 Robert Whisnant L660 G 0.042 0.069 0.069 E<br />
Hillsborough 11527 Ame Properties LLC A495 G 0.012 0.02 0.02 E<br />
11542 The Conrad Family Ltd Ptnrshp & Howard C & Mary T A415<br />
0.021 0.034 0.034<br />
Hillsborough<br />
Hornsby<br />
G<br />
E<br />
Hillsborough 11543 Atem Real Estate P/S L625 G 0.001 0.002 0.002 E<br />
Hillsborough 11543 Atem Real Estate P/S L625 S 0 0.002 0.002 E<br />
Hillsborough 11550 Cee Bee'S Grove Inc A415 G 0.022 0.035 0.035 E<br />
Hillsborough 11553 James R & Cathy Ennis Townsend Jr A56S G 0.05 0.07 0.07 E<br />
Hillsborough 11576 Tampa Electric Co A525 G 0.047 0.065 0.065 E<br />
Hillsborough 11603 Nancy Skemp Trustee Peter Skemp & John Shepard A50F G 0.004 0.007 0.007 E<br />
Hillsborough 11642 Fidel & Hilda Castillo & Elias & Lorena M Gutierrez A535 G 0.015 0.025 0.025 E<br />
Hillsborough 11642 Fidel & Hilda Castillo & Elias & Lorena M Gutierrez A535 S 0 0.025 0.025 E<br />
Hillsborough 11644 Donald W Gay L600 G 0.002 0.003 0.003 E<br />
Hillsborough 11679 James W Silas & Gina Morris & Suzanne M Morris A535 G 0.005 0.008 0.008 E<br />
Hillsborough 11733 John D & Inell H White A535 G 0.017 0.07 0.07 E<br />
Hillsborough 11738 John F & Beverly J Stevens A480 G 0.012 0.04 0.04 E<br />
Hillsborough 11751 Jack P. & Meribeth J. Sizemore A415 G 0.012 0.02 0.02 E<br />
M/E 5<br />
Page | 241
<strong>2011</strong> ESTIMATED WATER USE REPORT<br />
Table A7. Metered and <strong>Estimated</strong> Agricultural WUPs, Withdrawals and Permitted <strong>Use</strong> (mgd), <strong>2011</strong><br />
County<br />
WUP<br />
Number<br />
<strong>Southwest</strong> <strong>Florida</strong> <strong>Water</strong> <strong>Management</strong> District<br />
Permittee<br />
<strong>Use</strong><br />
Code 1<br />
Source 2<br />
Annual<br />
Average<br />
Pumpage 3<br />
Total<br />
Permitted<br />
Annual<br />
Average<br />
Quantity<br />
Permitted<br />
Quantity<br />
Attributed<br />
to AG <strong>Use</strong><br />
Category 4<br />
Hillsborough 11772 Everett F Prevatt A535 G 0.063 0.087 0.087 E<br />
Hillsborough 11803 William L Carter‐Carter Country L660 G 0.014 0.022 0.022 E<br />
Hillsborough 11807 Maddox Groves Inc A415 G 0.014 0.023 0.023 E<br />
Hillsborough 11824 Vernon R & Janice J Morgan A535 G 0.011 0.019 0.019 E<br />
Hillsborough 11969 Charles G. Grimes, Trustee and Betty J. Grimes, Trustee A535 G 0.064 0.088 0.088 E<br />
Hillsborough 11971 KHP Ventures, Inc. / Attn: Kiran Patil A410 G 0.027 0.045 0.045 E<br />
Hillsborough 11977 Hillsborough County BOCC/Attn: Kurt G. Gremley A56S G 0.093 0.635 0.635 E<br />
Hillsborough 12030 Sizemore Farms, Inc./Attn: Jeff Sizemore A470 G 0.13 0.236 0.236 E<br />
Hillsborough 12063 Lowell L & Janice Kinard A415 G 0 0.024 0.024 E<br />
Hillsborough 12077 Cherri N. Clark A535 G 0.01 0.016 0.016 E<br />
Hillsborough 12084 Su Duc Do and Lan Mai Do A58H G 0.049 0.08 0.08 E<br />
Hillsborough 12188 E. W. Simmons, III and Carol C. Simmons A535 G 0.05 0.069 0.069 E<br />
Hillsborough 12188 E. W. Simmons, III and Carol C. Simmons A535 S 0 0.069 0.069 E<br />
Hillsborough 12193 B & P Tree Farm, LLC A485 G 0.007 0.011 0.011 E<br />
Hillsborough 12197 Maria Bessa and Joseph Labarbera A415 G 0.009 0.014 0.014 E<br />
Hillsborough 12212 Ben Bane Trste Ben Bane Revoc Trust A410 G 0.016 0.059 0.059 E<br />
Hillsborough 12245 Glenn and Anne Winograd A490 G 0.009 0.015 0.015 E<br />
Hillsborough 12277 Claude Gay, Sr. A535 G 0 0.041 0.041 E<br />
Hillsborough 12277 Claude Gay, Sr. A535 S 0 0.041 0.041 E<br />
Hillsborough 12299 C Joseph Keel III‐Raymond Keel‐ Ryan Keel A410 G 0.004 0.013 0.013 E<br />
Hillsborough 12313 Cee Bee'S Grove Inc A415 G 0.047 0.065 0.065 E<br />
Hillsborough 12333 Arthur Staggs A480 G 0.009 0.031 0.031 E<br />
Hillsborough 12338 Jorge Chavez A535 G 0.008 0.014 0.014 E<br />
Hillsborough 12354 Cye E & Nellie R Jones A415 G 0.008 0.013 0.013 E<br />
Hillsborough 12359 Gary M & Linda R Terrell A415 G 0.001 0.003 0.002 E<br />
Hillsborough 12363 Fancy Farms Inc A535 G 0.025 0.041 0.041 E<br />
Hillsborough 12368 O V Hargrett A650 G 0.006 0.009 0.009 E<br />
Hillsborough 12369 Kimball W Wetherington A535 S 0 0.047 0.047 E<br />
Hillsborough 12378 Roy L Harwood A415 G 0.006 0.011 0.011 E<br />
Hillsborough 12398 Man Van Nguyen & Mai Phan Nguyen A58S G 0.019 0.049 0.049 E<br />
Hillsborough 12399 Be Viet Le & Hoang Thi‐Phan Le A58S G 0 0.028 0.028 E<br />
M/E 5<br />
Page | 242
<strong>2011</strong> ESTIMATED WATER USE REPORT<br />
Table A7. Metered and <strong>Estimated</strong> Agricultural WUPs, Withdrawals and Permitted <strong>Use</strong> (mgd), <strong>2011</strong><br />
County<br />
WUP<br />
Number<br />
<strong>Southwest</strong> <strong>Florida</strong> <strong>Water</strong> <strong>Management</strong> District<br />
Permittee<br />
<strong>Use</strong><br />
Code 1<br />
Source 2<br />
Annual<br />
Average<br />
Pumpage 3<br />
Total<br />
Permitted<br />
Annual<br />
Average<br />
Quantity<br />
Permitted<br />
Quantity<br />
Attributed<br />
to AG <strong>Use</strong><br />
Category 4<br />
Hillsborough 12409 Benjamin T & Edith Sylvia Knox A415 G 0.007 0.011 0.011 E<br />
Hillsborough 12411 Deborah M & Archie E Carr A535 G 0.01 0.016 0.016 E<br />
Hillsborough 12417 Tran T C & Hai Q Nguyen A58S G 0.017 0.028 0.028 E<br />
Hillsborough 12437 Conrad Dumke A410 G 0.014 0.044 0.044 E<br />
Hillsborough 12440 Bung & Binh C Le A480 G 0.001 0.028 0.028 E<br />
Hillsborough 12445 Glenn W Hart & Tommy G Brock A56S G 0.042 0.088 0.088 E<br />
Hillsborough 12445 Glenn W Hart & Tommy G Brock A56S S 0.009 0.088 0.088 E<br />
Hillsborough 12480 Jeffrey Sizemore A535 G 0.069 0.125 0.125 E<br />
Hillsborough 12495 Wilbur R & Mary M Reschly A415 G 0.008 0.013 0.013 E<br />
Hillsborough 12505 David Watkins A415 G 0.014 0.022 0.022 E<br />
Hillsborough 12520 Mosaic Fertilizer LLC A56S G 0.135 0.491 0.491 E<br />
Hillsborough 12538 Floyd Woodrow Williams, Jr. A410 G 0.029 0.047 0.047 E<br />
Hillsborough 12554 Timothy A & Donna G Tillett A415 G 0.006 0.01 0.01 E<br />
Hillsborough 12561 Gail A Roszel A480 G 0.004 0.006 0.006 E<br />
Hillsborough 12738 Steven C & Joyne D Mathis A415 G 0.018 0.029 0.029 E<br />
Hillsborough 12787 Douglas Holmberg A535 G 0.067 0.122 0.122 E<br />
Hillsborough 12793 J & K Farms Inc A535 G 0 0.032 0.032 E<br />
Hillsborough 12793 J & K Farms Inc A535 S 0.01 0.032 0.032 E<br />
Hillsborough 12802 Lyna J Knight & SUSAn M Weicherding A410 G 0.017 0.028 0.028 E<br />
Hillsborough 12806 Billy Williams A535 G 0.024 0.04 0.04 E<br />
12811 Ellis L & Stella J Hall Trustees Ellis & Stella Hall Living A535<br />
0.015 0.024 0.024<br />
Hillsborough<br />
Trust<br />
G<br />
E<br />
Hillsborough 12819 Andrew E & Karen S Rogers A535 G 0.013 0.021 0.021 E<br />
12821 Greg & Karen Lawson‐Clif &Betty Hinson‐Hugh & Lillian A535<br />
0 0.053 0.053<br />
Hillsborough<br />
Prine<br />
G<br />
E<br />
Hillsborough 12822 Fidel & Hilda Castillo A535 G 0.014 0.023 0.023 E<br />
Hillsborough 12837 Delva W & Ruben Wallace Register A535 G 0.047 0.065 0.065 E<br />
Hillsborough 12839 Peter E Winston A490 G 0.002 0.003 0.003 E<br />
Hillsborough 12853 Melvin F Lee & Sam III & Buffy Astin A535 G 0.025 0.07 0.07 E<br />
Hillsborough 12868 Eisenhower Property Group LLC A525 G 0.109 0.367 0.367 E<br />
Hillsborough 12868 Eisenhower Property Group LLC A525 S 0 0.367 0.367 E<br />
M/E 5<br />
Page | 243
<strong>2011</strong> ESTIMATED WATER USE REPORT<br />
Table A7. Metered and <strong>Estimated</strong> Agricultural WUPs, Withdrawals and Permitted <strong>Use</strong> (mgd), <strong>2011</strong><br />
County<br />
WUP<br />
Number<br />
<strong>Southwest</strong> <strong>Florida</strong> <strong>Water</strong> <strong>Management</strong> District<br />
Permittee<br />
<strong>Use</strong><br />
Code 1<br />
Source 2<br />
Annual<br />
Average<br />
Pumpage 3<br />
Total<br />
Permitted<br />
Annual<br />
Average<br />
Quantity<br />
Permitted<br />
Quantity<br />
Attributed<br />
to AG <strong>Use</strong><br />
Category 4<br />
Hillsborough 12883 Julia Corley Life Estate A535 G 0.011 0.017 0.017 E<br />
Hillsborough 12935 Roger Gilford A535 G 0.012 0.02 0.02 E<br />
Hillsborough 12935 Roger Gilford A535 S 0 0.02 0.02 E<br />
Hillsborough 12989 BHD Limited Partnership A Indiana Partnership A485 G 0.059 0.096 0.096 E<br />
Hillsborough 12998 Robert L & Barbara A Carter Life Estate A535 G 0.048 0.067 0.067 E<br />
Hillsborough 12998 Robert L & Barbara A Carter Life Estate A535 S 0 0.067 0.067 E<br />
Hillsborough 13022 South Shore Pointe Llc & Artesian Farms Inc A56S G 0.072 0.1 0.1 E<br />
Hillsborough 13060 Gary Craig A480 G 0.018 0.053 0.053 E<br />
13072 Premanie Motiram ‐ Gunraj & Parsueram & Sharmila A56S<br />
0.06 0.098 0.098<br />
Hillsborough<br />
Chanderdat<br />
G<br />
E<br />
Hillsborough 13119 Setc Bruce Pieper A415 G 0 0.009 0.009 E<br />
Hillsborough 13176 Mary Lett Keene Trustee A535 G 0.015 0.025 0.025 E<br />
Hillsborough 13185 L Michael Nelis Dena L Nelis Freeda Nelis & Jamine Nelis L630 G 0.025 0.041 0.041 E<br />
Hillsborough 13260 Bailey Family Foundation Inc A495 G 0.013 0.021 0.021 E<br />
Hillsborough 13267 Andrew Frederick ‐ Yancy Blueberry A410 G 0.039 0.054 0.054 E<br />
Hillsborough 13285 Kenneth & Delana Parker & Joe Newsome A535 G 0.061 0.085 0.085 E<br />
13296 J. Aprile Properties, LLC, D. Aprile Properties, LLC and R. A44S<br />
0.001 0.089 0.089<br />
Hillsborough<br />
Aprile<br />
G<br />
E<br />
Hillsborough 13320 E F Prevatt Corp A535 G 0.066 0.091 0.091 E<br />
Hillsborough 13327 Doris T Howell Trust A415 G 0.014 0.024 0.024 E<br />
Hillsborough 20000 GLH‐SR 60 25, LLC., ATTN: Reed Fischbach A535 G 0.03 0.049 0.049 E<br />
Hillsborough 20009 Clyde Dixon And Kathryn W. Dixon A480 G 0.001 0.001 0.001 E<br />
Hillsborough 20010 Doris Randall A535 G 0.011 0.019 0.019 E<br />
Hillsborough 20019 Sam & Buffy Astin A535 G 0 0.092 0.092 E<br />
Hillsborough 20034 Pebbledale Farms, Inc. A410 G 0 0.032 0.032 E<br />
20038 Carrie Lou Dorman as Trustee of the Carrie Lou Dorman A655<br />
0.001 0.242 0.242<br />
Hillsborough<br />
Trust<br />
G<br />
E<br />
20038 Carrie Lou Dorman as Trustee of the Carrie Lou Dorman A655<br />
0.055 0.242 0.242<br />
Hillsborough<br />
Trust<br />
S<br />
E<br />
Hillsborough 20041 William Wingate A535 G 0.01 0.017 0.017 E<br />
Hillsborough 20074 E F Prevatt Corporation A470 G 0.021 0.035 0.035 E<br />
M/E 5<br />
Page | 244
<strong>2011</strong> ESTIMATED WATER USE REPORT<br />
Table A7. Metered and <strong>Estimated</strong> Agricultural WUPs, Withdrawals and Permitted <strong>Use</strong> (mgd), <strong>2011</strong><br />
County<br />
WUP<br />
Number<br />
Permittee<br />
<strong>Use</strong><br />
Code 1<br />
Source 2<br />
Annual<br />
Average<br />
Pumpage 3<br />
Total<br />
Permitted<br />
Annual<br />
Average<br />
Quantity<br />
Permitted<br />
Quantity<br />
Attributed<br />
to AG <strong>Use</strong><br />
Category 4<br />
Hillsborough 20101 Williams Holding Corporation A535 G 0.051 0.071 0.071 E<br />
Hillsborough 20102 Talal Properties Ltd./Attn: Tom Kazbour A535 G 0.008 0.014 0.014 E<br />
Hillsborough 20109 Sam Astin III A470 G 0.023 0.051 0.051 E<br />
Hillsborough 20109 Sam Astin III A470 S 0 0.051 0.051 E<br />
Hillsborough <strong>2011</strong>1 Rjjams, LLC A51S G 0 0.152 0.152 E<br />
Hillsborough <strong>2011</strong>1 Rjjams, LLC A51S S 0 0.152 0.152 E<br />
Hillsborough 20130 Sam Astin III and Buffy Astin A535 G 0 0.374 0.374 E<br />
Hillsborough 20130 Sam Astin III and Buffy Astin A535 S 0 0.374 0.374 E<br />
Hillsborough 20139 Rod Marvel A470 G 0.027 0.045 0.045 E<br />
Hillsborough 20150 Hurley Creek Townhomes, Inc. Attn:Michael Chadwell A535 G 0.022 0.061 0.061 E<br />
Hillsborough 20159 Earl C. Godwin and Dorothy R. Godwin, Trustees A535 S 0.028 0.046 0.046 E<br />
Hillsborough 20160 Hilda Castillo A535 G 0 0.031 0.031 E<br />
Hillsborough 20160 Hilda Castillo A535 S 0.019 0.031 0.031 E<br />
Hillsborough 20161 Terry O. and Daphne C. Ballard, et al A535 G 0 0.076 0.076 E<br />
Hillsborough 20181 Oak Hammock Ranch, LLC A410 G 0.001 0.055 0.055 E<br />
Hillsborough 20187 Cynthia Sharpe A415 G 0 0.029 0.029 E<br />
Hillsborough 20200 Daniel W. Davis and Melinda Davis A445 G 0 0.025 0.025 E<br />
Hillsborough 20207 Lyna Berry Farms, Inc. Attn: Lyna Knight A410 G 0 0.013 0.013 E<br />
Hillsborough 20212 Ira Lee West and Wendy M. West A410 G 0 0.01 0.01 E<br />
30.978 Metered, mgd<br />
Hillsborough County Totals<br />
19.555 <strong>Estimated</strong> , mgd<br />
50.533 Total, mgd<br />
Lake 1347 Tom Thayer Citrus Inc A425 G 0.394 0.565 0.565 M<br />
Lake 2142 Bay Lake Groves Inc A415 G 0 0.065 0.065 E<br />
Lake 2142 Bay Lake Groves Inc A415 S 0 0.065 0.065 E<br />
Lake 2145 Kuharske Properties Inc A470 G 0.023 0.038 0.038 E<br />
Lake 3457 Pine Island Land Company Inc A470 G 0.064 0.089 0.089 E<br />
Lake 3460 Charles A Rogers A415 G 0.014 0.022 0.022 E<br />
Lake 3484 John F. Horvath A415 G 0.007 0.011 0.011 E<br />
Lake 4730 Michael R. Langley A415 G 0.079 0.11 0.11 E<br />
M/E 5<br />
<strong>Southwest</strong> <strong>Florida</strong> <strong>Water</strong> <strong>Management</strong> District<br />
Page | 245
<strong>2011</strong> ESTIMATED WATER USE REPORT<br />
Table A7. Metered and <strong>Estimated</strong> Agricultural WUPs, Withdrawals and Permitted <strong>Use</strong> (mgd), <strong>2011</strong><br />
County<br />
WUP<br />
Number<br />
Permittee<br />
<strong>Use</strong><br />
Code 1<br />
Source 2<br />
Annual<br />
Average<br />
Pumpage 3<br />
Total<br />
Permitted<br />
Annual<br />
Average<br />
Quantity<br />
Permitted<br />
Quantity<br />
Attributed<br />
to AG <strong>Use</strong><br />
Category 4<br />
Lake 4792 Quality Petroleum Corp A495 G 0.159 0.271 0.271 E<br />
Lake 5027 Lake County Public Works A490 G 0.152 0.243 0.243 E<br />
Lake 5028 Bay Lake Groves Inc A415 G 0.023 0.064 0.064 E<br />
Lake 5028 Bay Lake Groves Inc A415 S 0 0.064 0.064 E<br />
Lake 8090 Greenswamp Ranch LLC A410 G 0.011 0.036 0.036 E<br />
Lake 8090 Greenswamp Ranch LLC A410 S 0 0.036 0.036 E<br />
Lake 8954 Charles O Kuharske A490 G 0 0.034 0.034 E<br />
Lake 8954 Charles O Kuharske A490 S 0.01 0.034 0.034 E<br />
9037 Barahona <strong>Florida</strong> Trust‐Jose R & Kathy L Barahona Co‐ A415<br />
0.029 0.048 0.048<br />
Lake<br />
Trustees<br />
G<br />
E<br />
Lake 9904 Dan & Patricia Ann Judy A415 G 0.028 0.046 0.046 E<br />
Lake 10754 Thomas W. Fish A415 G 0.008 0.014 0.014 E<br />
Lake 11358 Carter Island Citrus Grove Inc A415 G 0.063 0.088 0.088 E<br />
Lake 12588 Julia Faye Rogers L600 G 0.001 0.001 0.001 E<br />
Lake 12789 John Jahreis A470 G 0.054 0.074 0.074 E<br />
Lake 13308 Smoak Family Ltd Partnership A490 G 0.049 0.07 0.07 E<br />
Lake 20005 Jerry R and Nancy L Daniels Trust A410 G 0.007 0.011 0.011 E<br />
0.394 Metered, mgd<br />
Lake County Totals<br />
0.781 <strong>Estimated</strong> , mgd<br />
1.175 Total, mgd<br />
Ray Ferrero Jr Trustee‐Hiers, Stephen Rappenecker and<br />
G<br />
Levy 5095 Neal<br />
A52S<br />
0.901 2.057 2.057<br />
M<br />
Levy 5122 Whitehurst Cattle Co Inc A52S G 0.068 1.030 1.030 M<br />
Levy 5160 Arthur Sandlin A52S G 0.290 1.123 1.123 M<br />
Levy 10023 AEG Associates LLC A52S G 0.000 0.677 0.677 M<br />
Levy 11026 C. Neal Anderson A500 G 0.076 1.485 1.485 M<br />
Levy 13339 Marshall Tree Farm A485 G 0.346 2.436 2.436 M<br />
Levy 3580 Erich Koch L635 G 0.001 0.001 0.001 E<br />
Levy 3753 BGH Farms, LLP A550 G 0.044 0.061 0.061 E<br />
Levy 4945 Stanley McKoy A470 G 0.174 0.316 0.316 E<br />
M/E 5<br />
<strong>Southwest</strong> <strong>Florida</strong> <strong>Water</strong> <strong>Management</strong> District<br />
Page | 246
<strong>2011</strong> ESTIMATED WATER USE REPORT<br />
Table A7. Metered and <strong>Estimated</strong> Agricultural WUPs, Withdrawals and Permitted <strong>Use</strong> (mgd), <strong>2011</strong><br />
County<br />
WUP<br />
Number<br />
<strong>Southwest</strong> <strong>Florida</strong> <strong>Water</strong> <strong>Management</strong> District<br />
Permittee<br />
<strong>Use</strong><br />
Code 1<br />
Source 2<br />
Annual<br />
Average<br />
Pumpage 3<br />
Total<br />
Permitted<br />
Annual<br />
Average<br />
Quantity<br />
Permitted<br />
Quantity<br />
Attributed<br />
to AG <strong>Use</strong><br />
Category 4<br />
Levy 5109 Sonja Brooks A525 G 0.122 0.221 0.221 E<br />
Levy 5111 Mildred B Mikell & Diane M Price A470 G 0.042 0.058 0.058 E<br />
Levy 5115 Woodroe Fugate and Sons Inc A52S G 0.165 0.299 0.299 E<br />
Levy 5117 Woodroe Fugate and Sons Inc A52S G 0.083 0.15 0.15 E<br />
Levy 5159 Arthur Sandlin A52S G 0.002 0.358 0.358 E<br />
Levy 5159 Arthur Sandlin A52S S 0.196 0.358 0.358 E<br />
Levy 5169 AEG Associates III LLC A470 G 0.016 0.066 0.066 E<br />
Levy 5215 Otis Bell L610 G 0.001 0.002 0.002 E<br />
Levy 5607 John M. Dean A470 G 0.042 0.058 0.058 E<br />
Levy 6405 Ronald C. Gillman A470 G 0.059 0.082 0.082 E<br />
Levy 6586 Corrie Bell A500 G 0.35 0.654 0.642 E<br />
Levy 6623 J C Pendray & Sons Inc A490 G 0.056 0.078 0.078 E<br />
Levy 6659 Donald L Smith, Trustee A490 G 0.061 0.086 0.086 E<br />
Levy 6703 Cecil N & Jane F Benton A470 G 0.028 0.045 0.045 E<br />
Levy 6760 Freddy Bell A470 G 0.1 0.404 0.404 E<br />
Levy 7096 Steve Cole A470 G 0.041 0.057 0.057 E<br />
Levy 7167 Ferris Rogers A470 G 0.022 0.037 0.037 E<br />
Levy 7274 Grady E & Wilbur F Dean A470 G 0.091 0.165 0.165 E<br />
Levy 7445 Jerry M. Sr. And Sharon K. Mills A470 G 0.058 0.08 0.08 E<br />
Levy 8219 Arthur & Damon Sandlin A500 G 0.256 0.463 0.463 E<br />
Levy 8255 Jimmie E Markham A52S G 0.173 0.314 0.314 E<br />
Levy 8992 Freddy Arlene & Virginia Bell A490 G 0.044 0.061 0.061 E<br />
Levy 9505 Lee A Thomas & Ryan B Thomas A525 G 0.247 0.447 0.447 E<br />
Levy 9610 Solera, LLC L600 G 0 0.003 0 E<br />
Levy 10120 Thomas H Overstreet A495 G 0.068 0.094 0.094 E<br />
Levy 10285 Jennifer Cox A495 G 0.043 0.06 0.06 E<br />
Levy 10996 Edward F & Shirley A Williams A470 G 0.106 0.189 0.189 E<br />
Levy 11003 J C Pendray & Sons Inc A490 G 0.056 0.077 0.077 E<br />
Levy 11008 William M Hicks Trustee A500 G 0.11 0.2 0.2 E<br />
Levy 11009 Freddy & Adrienne Bell W W Gay And Kirk Hartley A52S G 0.246 0.67 0.67 E<br />
Levy 11084 Phyllis McCoy A470 G 0.042 0.058 0.058 E<br />
M/E 5<br />
Page | 247
<strong>2011</strong> ESTIMATED WATER USE REPORT<br />
Table A7. Metered and <strong>Estimated</strong> Agricultural WUPs, Withdrawals and Permitted <strong>Use</strong> (mgd), <strong>2011</strong><br />
County<br />
WUP<br />
Number<br />
Permittee<br />
<strong>Use</strong><br />
Code 1<br />
Source 2<br />
Annual<br />
Average<br />
Pumpage 3<br />
Total<br />
Permitted<br />
Annual<br />
Average<br />
Quantity<br />
Permitted<br />
Quantity<br />
Attributed<br />
to AG <strong>Use</strong><br />
Category 4<br />
Levy 11088 Ruby Noble A470 G 0.039 0.055 0.055 E<br />
Levy 11090 Phyllis V Albritton Evelyn V Farr A490 G 0.135 0.244 0.244 E<br />
Levy 11093 J.N. & Elvira Hale, Jr. A470 G 0.06 0.082 0.082 E<br />
11211 Phyllis J McCoy Trustee of The Phyllis J McCoy<br />
A470<br />
0.058 0.081 0.081<br />
Levy<br />
Revocable Trust<br />
G<br />
E<br />
Levy 11274 G Allen and Karen S Hayes A470 G 0.029 0.079 0.079 E<br />
Levy 11308 Levaughn Robinson A470 G 0.067 0.093 0.093 E<br />
Levy 11322 Geoffrey P & Pamela J Bernard A52S G 0.006 0.01 0.01 E<br />
Levy 11621 Reuben & Maria Hernandez A470 G 0.066 0.091 0.091 E<br />
Levy 11716 Neal O & Billie Jo Scherer A490 G 0.04 0.055 0.055 E<br />
Levy 11783 GM‐1 Partnership A490 G 0.011 0.017 0.017 E<br />
Levy 11928 James B & Allison W Baxter A52S G 0.064 0.089 0.089 E<br />
Levy 12040 Roy R Lane Sr. and Todd Lane A495 G 0.057 0.078 0.078 E<br />
Levy 12090 Robert A Baker L600 G 0 0 0 E<br />
Levy 12262 Harrell Phillips A470 G 0.026 0.042 0.042 E<br />
Levy 12263 Harrell Phillips A470 G 0 0.032 0.032 E<br />
Levy 12380 Arthur M And Damon W Sandlin A470 G 0.062 0.086 0.086 E<br />
Levy 12420 David Benton A470 G 0.041 0.057 0.057 E<br />
Levy 12439 Vaona P Hartley A470 G 0.043 0.06 0.06 E<br />
Levy 12528 Pat Markham Trust A525 G 0.177 0.321 0.321 E<br />
Levy 12553 Corrie Bell A470 G 0 0.186 0.186 E<br />
Levy 12570 Margaret Knight A470 G 0 0.166 0.166 E<br />
Levy 12570 Margaret Knight A470 S 0 0.166 0.166 E<br />
Levy 12571 Dale Wright A470 G 0 0.166 0.166 E<br />
Levy 12571 Dale Wright A470 S 0 0.166 0.166 E<br />
Levy 12573 Ryan & Bonnie Jean Thomas A470 G 0 0.022 0.022 E<br />
Levy 12578 Lee A & Beverly J Thomas Co‐Trustees A470 G 0.141 0.196 0.196 E<br />
Levy 12579 Lee A & Beverly J Thomas Co‐Trustees A52S G 0.236 0.428 0.428 E<br />
Levy 12583 G Frank & Nancy W Etheridge A525 G 0.003 0.122 0.122 E<br />
Levy 12642 Adrienne M Bell L600 G 0.012 0.038 0.038 E<br />
M/E 5<br />
<strong>Southwest</strong> <strong>Florida</strong> <strong>Water</strong> <strong>Management</strong> District<br />
Page | 248
<strong>2011</strong> ESTIMATED WATER USE REPORT<br />
Table A7. Metered and <strong>Estimated</strong> Agricultural WUPs, Withdrawals and Permitted <strong>Use</strong> (mgd), <strong>2011</strong><br />
County<br />
WUP<br />
Number<br />
Permittee<br />
<strong>Use</strong><br />
Code 1<br />
Source 2<br />
Annual<br />
Average<br />
Pumpage 3<br />
Total<br />
Permitted<br />
Annual<br />
Average<br />
Quantity<br />
Permitted<br />
Quantity<br />
Attributed<br />
to AG <strong>Use</strong><br />
Category 4<br />
12741 CF Jr & A Bell & B&G Partnership LLP & BGH Farm & Je A470<br />
0.115 0.171 0.171<br />
Levy<br />
& K Barley<br />
G<br />
E<br />
Levy 12758 Gabino L & Maria G Ortiz A410 G 0.013 0.044 0.044 E<br />
Levy 12805 Kenneth & Martha Tafoya A495 G 0 0.1 0.1 E<br />
Levy 12880 Ben F & Rose M Fant A455 G 0.05 0.069 0.069 E<br />
Levy 12930 Randall & Rebecca Jones A525 G 0.037 0.055 0.052 E<br />
Levy 13001 Donna C Phillips A490 G 0.049 0.068 0.068 E<br />
Levy 13261 Vince E Dean A470 G 0.042 0.059 0.059 E<br />
Levy 20049 Terry Sharon And Devon Robinson A410 G 0 0.105 0.105 E<br />
Levy 20050 Wayne And Linda Kotrba A410 G 0.025 0.04 0.04 E<br />
Levy 20217 Charles B Jackson A470 G 0 0.039 0.039 E<br />
1.681 Metered, mgd<br />
Levy County Totals<br />
4.849 <strong>Estimated</strong> , mgd<br />
6.530 Total, mgd<br />
Manatee 503 J T Reeder Part LLLP & Snell Family LP of SW <strong>Florida</strong> A56S G 0.795 0.875 0.867 M<br />
Manatee 2933 Bruce E Leland S Gary L & Brent D Shackelford A515 G 0.745 1.339 1.339 M<br />
Manatee 3794 Verna Asset <strong>Management</strong> LLC A525 G 0.026 0.350 0.350 M<br />
Manatee 3796 Ira Carlton Revocable Living Tr A490 G 0.000 0.110 0.110 M<br />
Manatee 3808 ATS Ag Ventures LLC A415 G 0.000 0.152 0.152 M<br />
Manatee 3832 Taylor's Farm and Ranch Inc A58S G 0.320 0.470 0.470 M<br />
Manatee 3837 John Falkner Classie Growers LLC A56S G 1.268 4.232 4.202 M<br />
Manatee 3838 CSPR Ltd A58S G 0.012 0.252 0.252 M<br />
Manatee 3847 L3 Partnership Dba L3 Farms A56F G 2.266 8.224 8.224 M<br />
Manatee 3848 Dimare Homestead Inc A56S G 0.907 4.802 4.802 M<br />
Manatee 3924 Chamax LLC A490 G 0.000 0.280 0.280 M<br />
Manatee 3956 G & D Farms Inc and 2 P Cattle Co. A535 G 0.488 0.710 0.710 M<br />
Manatee 3975 Rye Bridge Road, LLC A43F G 0.719 2.054 2.054 M<br />
Manatee 4049 Sorrells Groves Inc. A415 G 1.592 0.965 0.965 M<br />
Manatee 4190 Myakka River Properties Inc A56F G 0.000 0.123 0.123 M<br />
Manatee 4228 Peace Valley Groves Inc A415 G 0.237 0.302 0.302 M<br />
M/E 5<br />
<strong>Southwest</strong> <strong>Florida</strong> <strong>Water</strong> <strong>Management</strong> District<br />
Page | 249
<strong>2011</strong> ESTIMATED WATER USE REPORT<br />
Table A7. Metered and <strong>Estimated</strong> Agricultural WUPs, Withdrawals and Permitted <strong>Use</strong> (mgd), <strong>2011</strong><br />
County<br />
WUP<br />
Number<br />
<strong>Southwest</strong> <strong>Florida</strong> <strong>Water</strong> <strong>Management</strong> District<br />
Permittee<br />
<strong>Use</strong><br />
Code 1<br />
Source 2<br />
Annual<br />
Average<br />
Pumpage 3<br />
Total<br />
Permitted<br />
Annual<br />
Average<br />
Quantity<br />
Permitted<br />
Quantity<br />
Attributed<br />
to AG <strong>Use</strong><br />
Category 4<br />
Manatee 4307 The Treeleaders Inc A525 G 0.138 0.401 0.401 M<br />
Manatee 4309 CC Manatee Development LLC l A525 G 0.000 0.740 0.740 M<br />
Manatee 4378 Pat Carlton A56F G 0.051 0.357 0.357 M<br />
Manatee 4412 Pacific Land Ltd A56S G 0.177 3.417 3.417 M<br />
Manatee 4447 Batista & Evelyn Madonia A56F G 0.755 1.354 1.354 M<br />
Manatee 4453 Paul J & Janice E Hunsader A615 G 0.084 0.388 0.388 M<br />
Manatee 4467 John Falkner A51S G 2.653 11.278 11.273 M<br />
Manatee 4655 Avignon Holdings LLC A415 G 0.000 0.085 0.085 M<br />
Manatee 4662 R Chapman A415 G 0.058 0.123 0.123 M<br />
Manatee 4729 Aris Horticulture Inc A485 G 0.004 0.095 0.095 M<br />
Manatee 4761 Johnson Grove and Farm A415 G 0.046 0.320 0.320 M<br />
Manatee 4761 Johnson Grove and Farm A415 S 0.000 0.320 0.320 M<br />
Manatee 4780 Reynold Glanz A56F G 0.000 0.785 0.785 M<br />
Manatee 4789 Hunsader Farms Inc & Donald J Hunsader & Mdm LLC A56S G 0.335 1.747 1.747 M<br />
Manatee 5058 McCarlton Partners Ltd A525 G 0.000 0.466 0.466 M<br />
Manatee 5309 OB <strong>Florida</strong> CRE Holdings LLC A415 G 0.090 0.236 0.236 M<br />
Manatee 5310 Port Manatee Land LLC A57F G 0.139 0.196 0.196 M<br />
Manatee 5384 Myrna A Jordan Trust A56F G 0.236 0.398 0.398 M<br />
Manatee 5423 <strong>Florida</strong> Power & Light Company A56S G 0.890 1.717 1.694 M<br />
Manatee 5459 Manatee Fruit Co A480 G 0.000 0.225 0.225 M<br />
Manatee 5460 Hayden Lane I Ltd A485 G 0.000 0.120 0.120 M<br />
Manatee 5461 Manatee Fruit Co A485 G 0.197 2.600 2.600 M<br />
Manatee 5462 Manatee Fruit Co A415 G 0.000 0.146 0.146 M<br />
Manatee 5512 G & D Farms Inc A57F G 1.197 2.002 2.002 M<br />
Manatee 5514 McClure Properties, Ltd A56S G 2.625 5.985 5.985 M<br />
Manatee 5599 LF LLC A415 G 0.166 0.272 0.272 M<br />
Manatee 5620 Bill E. & Hiram C Saffold A51S G 0.511 0.678 0.678 M<br />
Manatee 5689 Farren R & Christina M Dakin L625 G 0.004 0.412 0.412 M<br />
Manatee 5693 Andy D Taylor Ranch LLC A490 G 0.097 0.133 0.133 M<br />
Manatee 6059 M Plus Ranch Inc/West <strong>Florida</strong> Agro Ltd A56S G 0.839 1.004 1.004 M<br />
Manatee 6077 McClure Properties, Ltd A465 G 1.642 3.078 3.078 M<br />
M/E 5<br />
Page | 250
<strong>2011</strong> ESTIMATED WATER USE REPORT<br />
Table A7. Metered and <strong>Estimated</strong> Agricultural WUPs, Withdrawals and Permitted <strong>Use</strong> (mgd), <strong>2011</strong><br />
County<br />
WUP<br />
Number<br />
<strong>Southwest</strong> <strong>Florida</strong> <strong>Water</strong> <strong>Management</strong> District<br />
Permittee<br />
<strong>Use</strong><br />
Code 1<br />
Source 2<br />
Annual<br />
Average<br />
Pumpage 3<br />
Total<br />
Permitted<br />
Annual<br />
Average<br />
Quantity<br />
Permitted<br />
Quantity<br />
Attributed<br />
to AG <strong>Use</strong><br />
Category 4<br />
Manatee 6667 Heart Groves Inc A415 G 0.720 0.814 0.814 M<br />
Manatee 6668 CFI USA, Inc A415 G 0.055 0.213 0.213 M<br />
Manatee 6668 CFI USA, Inc A415 S 0.092 0.213 0.213 M<br />
Manatee 6915 James D & Robert C Brewer A495 G 0.265 1.228 1.228 M<br />
Manatee 6981 Jones Potato Farm A515 G 0.353 0.367 0.367 M<br />
Manatee 7031 Adamatmar LLC A56S G 0.000 0.318 0.317 M<br />
Manatee 7085 Turner Groves Citrus Limited Partnership A415 G 1.321 1.327 1.327 M<br />
Manatee 7350 Felton C Walker Jr A56S G 0.949 1.383 1.383 M<br />
Manatee 7502 J M Cincotta Ranch A56F G 0.041 0.495 0.495 M<br />
Manatee 7631 McClure Properties, Ltd A56F G 0.245 0.849 0.849 M<br />
Manatee 7635 McClure Properties, Ltd A56S G 0.000 0.238 0.238 M<br />
Manatee 7649 Betty Moody A525 G 0.132 0.352 0.352 M<br />
Manatee 7723 Moccasin Wallow LLC A415 G 0.057 0.098 0.098 M<br />
Manatee 7724 FLM, Inc. A415 G 0.276 0.835 0.835 M<br />
Manatee 7846 Schroeder‐Manatee Ranch Inc A525 G 1.867 16.793 4.736 M<br />
Manatee 7846 Schroeder‐Manatee Ranch Inc A525 S 0.289 16.793 4.736 M<br />
Manatee 7891 Harrell Groves Inc A415 G 0.371 0.402 0.402 M<br />
Manatee 7998 Highlands Groves Inc A415 G 0.171 0.465 0.465 M<br />
Manatee 8102 Jordan and Jordan Inc. A415 G 0.133 0.126 0.126 M<br />
Manatee 8420 James R Grainger II A415 G 0.959 1.266 1.266 M<br />
Manatee 8421 4 Star Tomato Inc A465 G 0.911 1.253 1.253 M<br />
Jefferson Grove & DEA Manatee Grove & NFA Manatee<br />
G<br />
Manatee 8638 Grove, LLC<br />
A415<br />
0.903 0.706 0.706<br />
M<br />
Manatee 8694 J Bar C Inc A415 G 0.560 0.615 0.615 M<br />
Manatee 8829 Whisenant Farms Co Inc A56S G 0.976 1.278 1.278 M<br />
Manatee 8904 Walker Pasture LLC A525 G 0.002 0.516 0.516 M<br />
Manatee 8912 J Gary and Cathryn Russ A415 G 0.152 0.168 0.168 M<br />
Manatee 8987 C & D Fruit & Vegetable Co Inc A535 G 0.078 0.128 0.128 M<br />
Manatee 8987 C & D Fruit & Vegetable Co Inc A535 S 0.012 0.128 0.128 M<br />
Manatee 9014 Good Grove Investments, LLC A415 G 1.265 1.815 1.815 M<br />
Manatee 9025 John Falkner Classie Growers LLC A51S G 0.641 1.461 1.461 M<br />
M/E 5<br />
Page | 251
<strong>2011</strong> ESTIMATED WATER USE REPORT<br />
Table A7. Metered and <strong>Estimated</strong> Agricultural WUPs, Withdrawals and Permitted <strong>Use</strong> (mgd), <strong>2011</strong><br />
County<br />
WUP<br />
Number<br />
<strong>Southwest</strong> <strong>Florida</strong> <strong>Water</strong> <strong>Management</strong> District<br />
Permittee<br />
<strong>Use</strong><br />
Code 1<br />
Source 2<br />
Annual<br />
Average<br />
Pumpage 3<br />
Total<br />
Permitted<br />
Annual<br />
Average<br />
Quantity<br />
Permitted<br />
Quantity<br />
Attributed<br />
to AG <strong>Use</strong><br />
Category 4<br />
Manatee 9089 FFD Land Co Inc A56S G 1.507 2.791 2.779 M<br />
Manatee 9113 FLM, Inc. A415 G 0.091 0.183 0.183 M<br />
Manatee 9227 Farr Groves LLC A415 G 0.007 0.081 0.081 M<br />
Manatee 9348 Elizabeth Johnson A56S G 0.031 0.754 0.754 M<br />
Manatee 9391 West <strong>Florida</strong> Agro Limited A655 G 1.288 2.779 2.779 M<br />
Manatee 9400 Recie Putnal A415 G 0.011 0.156 0.152 M<br />
Manatee 9400 Recie Putnal A415 S 0.000 0.156 0.152 M<br />
Manatee 9526 Robert K Hunsader Family Trust A56S G 0.278 0.486 0.486 M<br />
Manatee 9526 Robert K Hunsader Family Trust A56S S 0.000 0.486 0.486 M<br />
Manatee 9603 Reeder'S Landscaping, Inc A480 G 0.019 0.318 0.318 M<br />
Manatee 9603 Reeder'S Landscaping, Inc A480 S 0.000 0.318 0.318 M<br />
Manatee 9817 Benny Albritton Sr A56F G 0.112 0.369 0.369 M<br />
Whisenant Farms, Inc. & Whisenant Family Limited<br />
G<br />
Manatee 9968 Partnership<br />
A485<br />
0.005 0.158 0.158<br />
M<br />
Whisenant Farms, Inc. & Whisenant Family Limited<br />
S<br />
Manatee 9968 Partnership<br />
A485<br />
0.031 0.158 0.158<br />
M<br />
Manatee 10187 Cameron Dakin L625 G 0.218 0.306 0.306 M<br />
Manatee 10320 Gemstone Grove LLC A415 G 0.112 0.227 0.227 M<br />
Manatee 10483 Bill & Hiram Saffold A56S G 0.229 0.440 0.440 M<br />
Manatee 10487 4 Star Tomato Inc A515 G 0.683 1.347 1.347 M<br />
Manatee 10541 Jones Potato Farm A465 G 0.327 0.688 0.688 M<br />
Manatee 10758 Jordan and Jordan Inc. A415 G 0.099 0.113 0.113 M<br />
Manatee 10800 Batista & Evelyn Madonia A56F G 1.369 2.388 2.388 M<br />
Manatee 10978 Little Manatee LLC A525 G 0.148 0.251 0.251 M<br />
Manatee 11019 Old <strong>Florida</strong> Investments Inc A56S G 0.325 2.277 2.277 M<br />
Manatee 11065 Robert E & Benjamin E King A56S G 0.128 0.257 0.257 M<br />
Manatee 11105 Farm‐Op Inc A56S G 1.115 3.016 2.992 M<br />
Manatee 11123 Clay Gully Ranch, LLC A56S G 0.525 2.263 2.263 M<br />
Manatee 11125 Edward Grady Maggard, Jr. and Lorene Maggard A56S G 0.387 2.084 2.084 M<br />
Manatee 11258 Lindas Nursery A480 G 0.001 0.215 0.215 M<br />
Manatee 11388 John Falkner A44S G 0.519 0.980 0.980 M<br />
M/E 5<br />
Page | 252
<strong>2011</strong> ESTIMATED WATER USE REPORT<br />
Table A7. Metered and <strong>Estimated</strong> Agricultural WUPs, Withdrawals and Permitted <strong>Use</strong> (mgd), <strong>2011</strong><br />
County<br />
WUP<br />
Number<br />
<strong>Southwest</strong> <strong>Florida</strong> <strong>Water</strong> <strong>Management</strong> District<br />
Permittee<br />
<strong>Use</strong><br />
Code 1<br />
Source 2<br />
Annual<br />
Average<br />
Pumpage 3<br />
Total<br />
Permitted<br />
Annual<br />
Average<br />
Quantity<br />
Permitted<br />
Quantity<br />
Attributed<br />
to AG <strong>Use</strong><br />
Category 4<br />
Manatee 11427 <strong>Water</strong>cress Farms A592 G 0.533 1.276 1.276 M<br />
Manatee 11440 John Falkner Classie Growers LLC A56S G 0.367 0.574 0.574 M<br />
Manatee 11440 John Falkner Classie Growers LLC A56S S 0.000 0.574 0.574 M<br />
Manatee 11481 Cameron Dakin Dairy A490 G 0.259 0.318 0.318 M<br />
Manatee 11536 John Falkner Classie Growers LLC A50F G 2.045 2.426 2.421 M<br />
Manatee 11918 Gordon Properties, LLC A56F G 0.073 0.315 0.315 M<br />
Manatee 11921 OB <strong>Florida</strong> CRE Holdings LLC A56S G 0.234 0.616 0.616 M<br />
Manatee 11922 Jones Potato Farm, Inc A515 G 0.369 1.483 1.483 M<br />
Manatee 11961 Pacific Land, Ltd A56S G 0.504 3.852 3.852 M<br />
SCF Farms Inc, Handcart Citrus and Cattle, Inc.and Harry<br />
G<br />
Manatee 11963 Cortese<br />
A56F<br />
0.512 2.502 2.502<br />
M<br />
Manatee 12005 Elias Cura LLC A525 G 0.246 0.488 0.488 M<br />
Manatee 12018 McClure Properties, Ltd A56F G 1.354 2.102 2.102 M<br />
Manatee 12133 W.S. Badcock Corporation A56S G 0.024 1.121 1.121 M<br />
Manatee 12154 H D Budd Farms, Inc. A56F G 0.294 0.750 0.750 M<br />
Manatee 12189 The Baker, Walter, Saraw Family Trust A495 G 0.000 0.204 0.204 M<br />
Manatee 12216 ESDA Inc A495 G 0.140 0.323 0.323 M<br />
Manatee 12246 Mary Ann Turner A480 G 0.040 0.264 0.264 M<br />
Manatee 12264 John Falkner Trustee A44S G 0.660 1.398 1.398 M<br />
Manatee 12386 Batista & Evelyn Madonia A56F G 0.676 1.000 1.000 M<br />
Manatee 12428 Sandy Branch Ranch, LLC A56S G 0.270 0.674 0.674 M<br />
Manatee 12903 Manatee County Board of County Commissioners A56S G 0.000 0.385 0.385 M<br />
Manatee 12971 Wade & Felicia Tappan A525 G 0.025 0.322 0.322 M<br />
Manatee 12991 HBT of Eagle Pointe LLC c/o Young & Madigan SC A56S G 0.315 0.178 0.178 M<br />
Manatee 13007 Lakeshore Knolls LLC A415 G 0.261 0.258 0.258 M<br />
Manatee 13008 Lakeshore Knolls LLC A415 G 0.210 0.200 0.200 M<br />
Manatee 13011 John Falkner Classie Growers LLC A56S G 1.848 2.524 2.524 M<br />
Manatee 13281 Ryan Mixon LLC Attn: Mr. Michael S. Lawson A495 G 0.000 0.131 0.131 M<br />
Manatee 13354 Hecht Manatee Properties, Ltd. A56S G 1.692 3.048 3.048 M<br />
Manatee 13354 Hecht Manatee Properties, Ltd. A56S S 0.049 3.048 3.048 M<br />
Manatee 20091 SamWes, LLC A56S G 0.420 1.342 1.342 M<br />
M/E 5<br />
Page | 253
<strong>2011</strong> ESTIMATED WATER USE REPORT<br />
Table A7. Metered and <strong>Estimated</strong> Agricultural WUPs, Withdrawals and Permitted <strong>Use</strong> (mgd), <strong>2011</strong><br />
County<br />
WUP<br />
Number<br />
<strong>Southwest</strong> <strong>Florida</strong> <strong>Water</strong> <strong>Management</strong> District<br />
Permittee<br />
<strong>Use</strong><br />
Code 1<br />
Source 2<br />
Annual<br />
Average<br />
Pumpage 3<br />
Total<br />
Permitted<br />
Annual<br />
Average<br />
Quantity<br />
Permitted<br />
Quantity<br />
Attributed<br />
to AG <strong>Use</strong><br />
Category 4<br />
2821 Robert J Flint Trustee Of Gwen Flint Trust & Flint<br />
A535<br />
0 0.784 0.784<br />
Manatee<br />
Properties<br />
G<br />
E<br />
Manatee 3754 Gaylord Inc A415 G 0.021 0.035 0.035 E<br />
Manatee 3762 Michael McKenzie A415 G 0.058 0.081 0.081 E<br />
Manatee 3788 WCB Properties LLC A415 G 0.018 0.029 0.029 E<br />
Manatee 3798 Dana Parrish A415 G 0.01 0.016 0.016 E<br />
Manatee 3799 Dana Parrish A415 G 0.009 0.015 0.015 E<br />
Manatee 3800 Larry W Parrish A415 G 0.015 0.025 0.025 E<br />
Manatee 3802 Mixon Fruit Farms Inc A415 G 0.015 0.024 0.024 E<br />
Manatee 3823 Larry W & Robbie Ann Fenimore A415 G 0.002 0.003 0.003 E<br />
Manatee 3824 White Oak Development A490 G 0.012 0.019 0.019 E<br />
3850 <strong>Florida</strong> West Coast Resource Cons V & Development A58S<br />
0.026 0.042 0.042<br />
Manatee<br />
Council Inc<br />
G<br />
E<br />
Manatee 3853 Triple 7 Ranch LLC A490 G 0.139 0.252 0.252 E<br />
Manatee 3874 Marguerite Cook A415 G 0.024 0.039 0.039 E<br />
Manatee 3893 Leo D. Bonagua A415 S 0.037 0.051 0.051 E<br />
Manatee 3900 Coddington Cattle Enterprises & Diocese Of Venice A495 G 0.046 0.063 0.063 E<br />
Manatee 3907 Emilie J Bradley A490 G 0.008 0.014 0.014 E<br />
Manatee 3925 Dickinsons Wholesale Nursery Inc A480 S 0.016 0.027 0.027 E<br />
Manatee 3939 FLM, Inc. A415 G 0.027 0.075 0.075 E<br />
Manatee 3954 Mosaic Phosphates Co A470 G 0.204 0.371 0.371 E<br />
Manatee 3955 GREEN BULL LLC A615 G 0.108 0.193 0.193 E<br />
Manatee 4003 Daniel P & Corrine McClure/Trust A56S G 0.043 0.059 0.059 E<br />
Manatee 4036 Alan Reasoner A415 G 0.02 0.033 0.033 E<br />
Manatee 4146 FLM, Inc. A415 G 0.026 0.042 0.042 E<br />
4152 Ei Dupont De Nemours & Ci Inc Agricultural Products A520<br />
0.054 0.075 0.075<br />
Manatee<br />
Dept<br />
G<br />
E<br />
Manatee 4183 North Manatee LLC A415 G 0.193 0.35 0.35 E<br />
Manatee 4293 FLM, Inc. A415 G 0.051 0.07 0.07 E<br />
Manatee 4297 Charles Abbott & Josephine Abbott A415 G 0.013 0.021 0.021 E<br />
Manatee 4319 Theolla B Cannon A415 G 0.015 0.049 0.049 E<br />
M/E 5<br />
Page | 254
<strong>2011</strong> ESTIMATED WATER USE REPORT<br />
Table A7. Metered and <strong>Estimated</strong> Agricultural WUPs, Withdrawals and Permitted <strong>Use</strong> (mgd), <strong>2011</strong><br />
County<br />
WUP<br />
Number<br />
<strong>Southwest</strong> <strong>Florida</strong> <strong>Water</strong> <strong>Management</strong> District<br />
Permittee<br />
<strong>Use</strong><br />
Code 1<br />
Source 2<br />
Annual<br />
Average<br />
Pumpage 3<br />
Total<br />
Permitted<br />
Annual<br />
Average<br />
Quantity<br />
Permitted<br />
Quantity<br />
Attributed<br />
to AG <strong>Use</strong><br />
Category 4<br />
Manatee 4320 H H Cannon A415 G 0.026 0.043 0.043 E<br />
Manatee 4321 Theolla B Cannon A415 G 0.008 0.013 0.013 E<br />
Manatee 4350 Leland Carlton A415 G 0.041 0.057 0.057 E<br />
Manatee 4369 PGCI IV LLC A495 G 0.049 0.091 0.091 E<br />
Manatee 4506 Esther Reagan Et Al Trust L610 G 0.001 0.001 0.001 E<br />
Manatee 4580 Anthony Carlton A490 G 0.075 0.136 0.136 E<br />
Manatee 4616 Louise W McDonald A475 G 0.019 0.03 0.03 E<br />
Manatee 4648 Maureen Kenney A485 G 0.03 0.049 0.049 E<br />
Manatee 4650 Avignon Holdings LLC A415 G 0.008 0.012 0.012 E<br />
Manatee 4651 William C Grimes A415 G 0.021 0.034 0.034 E<br />
Manatee 4652 Grimes Groves Inc A490 G 0.014 0.023 0.023 E<br />
Manatee 4653 Grimes Groves Inc & Richard U Rex Et Al A415 G 0.02 0.032 0.032 E<br />
Manatee 4654 Grimes Groves Inc A415 G 0.009 0.015 0.015 E<br />
Manatee 4741 Dawson Grove Sam Dawson A415 G 0.028 0.046 0.046 E<br />
Manatee 4756 AF Saraw Family Trust A415 G 0.057 0.078 0.078 E<br />
Manatee 4978 J Gary and Cathryn Russ A415 G 0.046 0.064 0.064 E<br />
Manatee 5042 Stank LLC A485 G 0.06 0.084 0.084 E<br />
Manatee 5067 Leroy Amerson A485 G 0.04 0.065 0.065 E<br />
Manatee 5280 Quality Petroleum Corp A415 G 0.018 0.03 0.03 E<br />
Manatee 5288 David Spicer & Robert Davidson A415 G 0.026 0.043 0.043 E<br />
Manatee 5307 RaLPh Taylors Nursery A480 G 0.033 0.054 0.054 E<br />
Manatee 5325 Friedrich Mayr A475 G 0.009 0.015 0.015 E<br />
Manatee 5444 School District of Manatee County A56S G 0.136 0.271 0.244 E<br />
Manatee 5453 James Henderson A415 G 0.037 0.061 0.061 E<br />
Manatee 5463 Manatee Fruit Co A415 G 0.035 0.057 0.057 E<br />
Manatee 5578 CITRUS BULL LLC A415 G 0.025 0.047 0.042 E<br />
Manatee 5579 Grimes Groves Inc A415 G 0.018 0.029 0.029 E<br />
Manatee 5591 Manatee County Board Of County Commissioners A480 G 0.008 0.013 0.013 E<br />
Manatee 5617 Medallion Homes A700 G 0.024 0.332 0.116 E<br />
Manatee 5649 Mark Holdren & Roger E Triplett A475 G 0.006 0.009 0.009 E<br />
Manatee 5651 Liewalds Nursery Inc A485 G 0.019 0.061 0.061 E<br />
M/E 5<br />
Page | 255
<strong>2011</strong> ESTIMATED WATER USE REPORT<br />
Table A7. Metered and <strong>Estimated</strong> Agricultural WUPs, Withdrawals and Permitted <strong>Use</strong> (mgd), <strong>2011</strong><br />
County<br />
WUP<br />
Number<br />
<strong>Southwest</strong> <strong>Florida</strong> <strong>Water</strong> <strong>Management</strong> District<br />
Permittee<br />
<strong>Use</strong><br />
Code 1<br />
Source 2<br />
Annual<br />
Average<br />
Pumpage 3<br />
Total<br />
Permitted<br />
Annual<br />
Average<br />
Quantity<br />
Permitted<br />
Quantity<br />
Attributed<br />
to AG <strong>Use</strong><br />
Category 4<br />
Manatee 5659 CLYDE Yancy, JR L600 G 0.001 0.002 0.002 E<br />
Manatee 5682 Armstrong Nursery A475 G 0.007 0.011 0.011 E<br />
Manatee 5684 Brouwers Flowers Inc A487 G 0.041 0.089 0.089 E<br />
Manatee 5684 Brouwers Flowers Inc A487 S 0.014 0.089 0.089 E<br />
Manatee 5697 North Property Partnership Ltd A485 G 0.047 0.065 0.065 E<br />
Manatee 5700 Robinson Farms Inc A485 G 0.029 0.047 0.047 E<br />
Manatee 5701 Robert J Feeney A415 G 0.003 0.005 0.005 E<br />
Manatee 5706 David E. and Barbara Marlow A485 G 0.005 0.008 0.008 E<br />
Manatee 5713 Charlie Jones Nursery A475 G 0.004 0.013 0.013 E<br />
Manatee 5715 Palma Sola LLC, Needham B. Jones & Georgia L. Jones A485 G 0.011 0.019 0.019 E<br />
Manatee 5726 Heide H Boothe A490 G 0.027 0.044 0.044 E<br />
Manatee 5729 James Gary Russ A415 G 0.012 0.019 0.019 E<br />
Manatee 5748 Larry And Barbara Jones L610 G 0.001 0.001 0.001 E<br />
Manatee 6572 Murats Plant Ranch A480 G 0.008 0.013 0.013 E<br />
Manatee 6589 Chapman Groves/Gillette Grove A415 G 0.016 0.027 0.027 E<br />
Manatee 6784 Stephen A & Nancy L Pope A415 G 0.017 0.029 0.029 E<br />
Manatee 6857 Charles E & Donna J French A495 G 0.017 0.028 0.028 E<br />
Manatee 6923 Harley Riedel & Don Stichter A415 G 0.037 0.051 0.051 E<br />
Manatee 6945 Devane Citrus Inc A415 G 0.026 0.042 0.042 E<br />
Manatee 7618 Reliance Mendoza A485 G 0.029 0.048 0.048 E<br />
Manatee 7671 Ronald I. Dickinson A480 G 0.039 0.067 0.067 E<br />
Manatee 7911 School District of Manatee County A485 G 0.004 0.021 0.007 E<br />
Manatee 7928 Oliver Norris A415 G 0.02 0.032 0.032 E<br />
Manatee 7997 Wilmer M Saffold A415 G 0.054 0.074 0.074 E<br />
8032 Kent W Geartz Trustee Of Kent W Geartz Revocable A415<br />
0.027 0.045 0.045<br />
Manatee<br />
Living Trust<br />
G<br />
E<br />
Manatee 8187 Saray Inc A485 S 0 0.496 0.496 E<br />
Manatee 8465 Powells Nursery A480 G 0.008 0.027 0.027 E<br />
Manatee 8470 Manatee County Port Authority L630 G 0.043 0.069 0.069 E<br />
Manatee 8929 Melvin H And Marlene H Taylor A480 G 0.019 0.031 0.031 E<br />
Manatee 8982 Dana Parrish A415 G 0.007 0.011 0.011 E<br />
M/E 5<br />
Page | 256
<strong>2011</strong> ESTIMATED WATER USE REPORT<br />
Table A7. Metered and <strong>Estimated</strong> Agricultural WUPs, Withdrawals and Permitted <strong>Use</strong> (mgd), <strong>2011</strong><br />
County<br />
WUP<br />
Number<br />
<strong>Southwest</strong> <strong>Florida</strong> <strong>Water</strong> <strong>Management</strong> District<br />
Permittee<br />
<strong>Use</strong><br />
Code 1<br />
Source 2<br />
Annual<br />
Average<br />
Pumpage 3<br />
Total<br />
Permitted<br />
Annual<br />
Average<br />
Quantity<br />
Permitted<br />
Quantity<br />
Attributed<br />
to AG <strong>Use</strong><br />
Category 4<br />
Manatee 9021 Conrad Family LP A415 G 0.038 0.052 0.052 E<br />
Manatee 9221 Monica M Lester & David J Berry A415 G 0.004 0.009 0.009 E<br />
Manatee 9285 Edward T Hubbell A415 G 0.047 0.065 0.065 E<br />
Manatee 9307 Eugene Yon A415 G 0.007 0.011 0.011 E<br />
Manatee 9358 Walter P. Long, Thomas W. Long, Louisa L. Jaffe A490 G 0.009 0.014 0.014 E<br />
9375 Byron R. Hodgin, As Trustee Of The Byron R. Hodgin A615<br />
0.033 0.053 0.053<br />
Manatee<br />
Revocable Tr<br />
G<br />
E<br />
Manatee 9432 Surriya A Sabir A415 G 0.013 0.022 0.022 E<br />
Manatee 9439 Doyle C Chancey A415 G 0.015 0.049 0.049 E<br />
Manatee 9439 Doyle C Chancey A415 S 0 0.049 0.049 E<br />
Manatee 9544 Robert A Davidson A415 G 0.064 0.089 0.089 E<br />
Manatee 9561 David Cannon A415 G 0.002 0.007 0.007 E<br />
Manatee 9694 Patricia Groover West Dodson A415 G 0.015 0.025 0.025 E<br />
Manatee 9725 B. Douglas Fraley II A415 G 0 0.01 0.01 E<br />
Manatee 9728 T D M Groves Partnership A415 G 0.055 0.101 0.101 E<br />
Manatee 9780 George Taylor A415 G 0.016 0.026 0.026 E<br />
Manatee 9827 Brc Investments LLC A415 G 0.019 0.031 0.031 E<br />
Manatee 9849 Rocking Seven Ranch LLC A485 G 0.247 0.448 0.448 E<br />
Manatee 9860 R Tom Chapman Jr A415 G 0.013 0.022 0.022 E<br />
Manatee 9921 D4 LLC A450 G 0 0.192 0.192 E<br />
Manatee 9991 James P & Phyllis R Gilreath A415 G 0.014 0.023 0.023 E<br />
Manatee 10068 Larry Betts A415 G 0.022 0.037 0.037 E<br />
Manatee 10145 James M Cannon A415 G 0.007 0.011 0.011 E<br />
Manatee 10159 H H Cannon A415 G 0.001 0.001 0.001 E<br />
Manatee 10164 Riggs National Property Co LLC L600 G 0 0.084 0 E<br />
Manatee 10164 Riggs National Property Co LLC L600 S 0 0.084 0 E<br />
Manatee 10181 Jon A And Cheryl L Andhugh E And Margaret B Mcguire A415 G 0.011 0.018 0.018 E<br />
Manatee 10186 Franklin Douglas and Debra Ann Harkrider A415 G 0.008 0.013 0.013 E<br />
Manatee 10226 Patron Holdings LLC A415 G 0.011 0.018 0.018 E<br />
Manatee 10257 Town & Country Developers Of <strong>Florida</strong> Inc A415 G 0.03 0.048 0.048 E<br />
Manatee 10262 Peter Vole III A415 G 0.028 0.046 0.046 E<br />
M/E 5<br />
Page | 257
<strong>2011</strong> ESTIMATED WATER USE REPORT<br />
Table A7. Metered and <strong>Estimated</strong> Agricultural WUPs, Withdrawals and Permitted <strong>Use</strong> (mgd), <strong>2011</strong><br />
County<br />
WUP<br />
Number<br />
Permittee<br />
<strong>Use</strong><br />
Code 1<br />
Source 2<br />
Annual<br />
Average<br />
Pumpage 3<br />
Total<br />
Permitted<br />
Annual<br />
Average<br />
Quantity<br />
Permitted<br />
Quantity<br />
Attributed<br />
to AG <strong>Use</strong><br />
Category 4<br />
Manatee 10270 Parson Brown Oranges, Inc. C/O Helen T King A415 G 0.035 0.058 0.058 E<br />
Manatee 10325 James G. and Nancy A. Newby A415 G 0.011 0.017 0.017 E<br />
Manatee 10328 Stephany, Inc. A58S G 0.132 0.239 0.239 E<br />
Manatee 10329 Keystone Grove Company A415 G 0.046 0.063 0.063 E<br />
Manatee 10365 Thomas J & Frances E Beimborn A415 G 0.023 0.037 0.037 E<br />
Manatee 10378 Diamond Bar Limited Partnership C/O Trey Desenberg A485 G 0.025 0.041 0.041 E<br />
Manatee 10423 James C Nanney A485 G 0.015 0.025 0.025 E<br />
Manatee 10424 B W Seawright A415 G 0.004 0.007 0.007 E<br />
Manatee 10430 George W Hooper L660 G 0.069 0.097 0.097 E<br />
Manatee 10435 Vickers Annual Plants Inc A480 G 0.012 0.02 0.02 E<br />
Manatee 10436 Robert A Grebe & Gene L T Keene A480 G 0.021 0.037 0.035 E<br />
Manatee 10439 Roger Musgrave L615 G 0.021 0.034 0.034 E<br />
Manatee 10446 FLM, Inc. A415 G 0.021 0.034 0.034 E<br />
Manatee 10448 FDIC As Receiver For Freedom Bank A415 G 0.04 0.055 0.055 E<br />
Manatee 10449 Gertrude Suggs A415 G 0.012 0.02 0.02 E<br />
Manatee 10451 B & B Suncoast Land Development, Inc A415 G 0.004 0.007 0.007 E<br />
Manatee 10454 Thomas J & Frances E Beimborn A415 G 0.024 0.039 0.039 E<br />
Manatee 10455 James W Keen A415 G 0.05 0.07 0.07 E<br />
Manatee 10457 McClure Properties, Ltd A485 G 0.003 0.005 0.005 E<br />
Manatee 10459 Julie M. Cole A475 G 0.005 0.009 0.009 E<br />
Manatee 10472 Appalachian Material Service Inc L660 G 0 0.045 0.045 E<br />
Manatee 10690 Port Manatee Industrial Park LLC A58S G 0.038 0.061 0.057 E<br />
Manatee 10742 C. Dennis Carlton, Sr M Carlton III A56S G 0 0.465 0.465 E<br />
Manatee 10749 Daniel B & Rebecca B Pope A525 G 0.024 0.066 0.066 E<br />
Manatee 10753 Gerald C Vorbeck A480 G 0.011 0.018 0.018 E<br />
10835 Nathan Benderson Ron Benderson Tst 1993 1 W Ruben A415<br />
0.042 0.059 0.059<br />
Manatee<br />
H Benatovich<br />
G<br />
E<br />
Manatee 10954 Perry J & Melvin H Taylor A415 G 0.037 0.051 0.051 E<br />
Manatee 11062 Quality Metal Fabricators Inc A410 G 0.017 0.028 0.028 E<br />
Manatee 11106 Craig J & Priscilla L Trace A485 G 0.031 0.081 0.081 E<br />
M/E 5<br />
<strong>Southwest</strong> <strong>Florida</strong> <strong>Water</strong> <strong>Management</strong> District<br />
Page | 258
<strong>2011</strong> ESTIMATED WATER USE REPORT<br />
Table A7. Metered and <strong>Estimated</strong> Agricultural WUPs, Withdrawals and Permitted <strong>Use</strong> (mgd), <strong>2011</strong><br />
County<br />
WUP<br />
Number<br />
<strong>Southwest</strong> <strong>Florida</strong> <strong>Water</strong> <strong>Management</strong> District<br />
Permittee<br />
<strong>Use</strong><br />
Code 1<br />
Source 2<br />
Annual<br />
Average<br />
Pumpage 3<br />
Total<br />
Permitted<br />
Annual<br />
Average<br />
Quantity<br />
Permitted<br />
Quantity<br />
Attributed<br />
to AG <strong>Use</strong><br />
Category 4<br />
11167 Coffee Pond LLC & Curtis Road Land Co LLC & Myakka A56S<br />
0.375 1.281 1.281<br />
Manatee<br />
Holdings<br />
G<br />
E<br />
Manatee 11183 Theolla B Cannon A415 G 0 0.015 0.015 E<br />
Manatee 11293 Ida Thomas & Walter Schmid Jr A470 G 0.196 0.465 0.465 E<br />
Manatee 11329 Jack R Groover A495 G 0.062 0.086 0.086 E<br />
Manatee 11339 Louis F & Sonia J Vodila L600 G 0 0.001 0.001 E<br />
Manatee 11350 Countyline Ranch LLC A56S G 0.275 0.498 0.498 E<br />
Manatee 11366 Robinson Farms Inc A445 G 0.019 0.054 0.054 E<br />
Manatee 11376 Doyle C Chancey A415 G 0.044 0.061 0.061 E<br />
Manatee 11378 Laura & Ronald Townsend A56S G 0.023 0.038 0.038 E<br />
Manatee 11521 Canal Road Greenhouses Inc A56F G 0.042 0.073 0.073 E<br />
Manatee 11619 Diocese of Venice A415 G 0.019 0.032 0.032 E<br />
Manatee 11629 Flint Gullett A415 G 0.008 0.025 0.025 E<br />
Manatee 11647 James A & Belva A Gullett A470 G 0.014 0.023 0.023 E<br />
Manatee 11651 Benjamin D & Alice J Gullett A470 G 0.012 0.02 0.02 E<br />
Manatee 11664 Eugene Yon A415 G 0.006 0.031 0.031 E<br />
Manatee 11735 John & Theresa Allen A415 G 0 0.047 0.047 E<br />
Manatee 11760 Juerg Ragaz L600 G 0 0.018 0 E<br />
Manatee 11813 MJ Road LLC, Cyrus Manning and Michael Manning A470 G 0.03 0.088 0.088 E<br />
Manatee 11831 Alan Reasoner A485 G 0 0.027 0.027 E<br />
Manatee 11888 Douglas S Rohrer A415 G 0.018 0.03 0.03 E<br />
Manatee 11941 Whisenant Farms Co Inc A470 G 0.011 0.017 0.017 E<br />
Manatee 11949 Paul R Gullett A415 G 0.001 0.002 0.002 E<br />
Manatee 11955 Declan E & Mollie B Huber L600 G 0.001 0.001 0.001 E<br />
Manatee 11973 Robert Graham A415 G 0.044 0.061 0.061 E<br />
Manatee 11975 Len‐Tran, Inc A485 G 0.061 0.084 0.084 E<br />
Manatee 12003 The Mitchell Family A415 G 0 0.026 0.026 E<br />
Manatee 12028 Burnetts Nursery A475 G 0.005 0.015 0.015 E<br />
Manatee 12071 David and Sheila Cash, Iris Stripling and Kethleen Creeh A480 G 0.007 0.012 0.012 E<br />
Manatee 12092 Joseph Wortham A490 G 0.07 0.096 0.096 E<br />
Manatee 12252 John J Wroblewski A415 G 0 0.048 0.048 E<br />
M/E 5<br />
Page | 259
<strong>2011</strong> ESTIMATED WATER USE REPORT<br />
Table A7. Metered and <strong>Estimated</strong> Agricultural WUPs, Withdrawals and Permitted <strong>Use</strong> (mgd), <strong>2011</strong><br />
County<br />
WUP<br />
Number<br />
Permittee<br />
<strong>Use</strong><br />
Code 1<br />
Source 2<br />
Annual<br />
Average<br />
Pumpage 3<br />
Total<br />
Permitted<br />
Annual<br />
Average<br />
Quantity<br />
Permitted<br />
Quantity<br />
Attributed<br />
to AG <strong>Use</strong><br />
Category 4<br />
Manatee 12412 Walter Schmid Jr L600 G 0.001 0.001 0.001 E<br />
Manatee 12454 Hhus Land Co Ltd Partnership L600 G 0.001 0.001 0.001 E<br />
12457 Cameron Farren Jerry & Rodney Dakinc/O Of Cameron A450<br />
0 0.09 0.09<br />
Manatee<br />
Dakin<br />
G<br />
E<br />
12457 Cameron Farren Jerry & Rodney Dakinc/O Of Cameron A450<br />
0 0.09 0.09<br />
Manatee<br />
Dakin<br />
S<br />
E<br />
Manatee 12470 Franklin D & Patricia Christophe A56S G 0.029 0.083 0.083 E<br />
Manatee 12470 Franklin D & Patricia Christophe A56S S 0.021 0.083 0.083 E<br />
Manatee 12474 Mary Forristall A485 G 0 0.119 0.119 E<br />
Manatee 12511 Mcz/Centrum <strong>Florida</strong> Ix, LLC A525 G 0.13 0.236 0.236 E<br />
Manatee 12544 Country Meadows LLC A416 G 0 0.005 0.005 E<br />
Manatee 12615 Chirdo Investments A415 G 0.014 0.023 0.023 E<br />
Manatee 12924 Needham B Jones A480 G 0.016 0.027 0.027 E<br />
Manatee 12944 Mcz/Centrum <strong>Florida</strong> Ix, LLC A56S G 0.351 0.59 0.59 E<br />
Manatee 12946 Clay Gully Tree Farm LLP A480 G 0 0.332 0.332 E<br />
Manatee 12946 Clay Gully Tree Farm LLP A480 S 0 0.332 0.332 E<br />
Manatee 13024 Enza Zaden Research USA, Inc. A56F G 0.06 0.083 0.083 E<br />
Manatee 13040 T RaLPh Taylor Jr‐Taylor Family Ltd Partnership Ll A480 G 0.013 0.08 0.08 E<br />
Manatee 13040 T RaLPh Taylor Jr‐Taylor Family Ltd Partnership Ll A480 S 0 0.08 0.08 E<br />
Manatee 13227 Faye Mann A480 G 0.003 0.005 0.005 E<br />
Manatee 13346 J Gary & Cathryne Russ & Russ A415 G 0.037 0.061 0.061 E<br />
Manatee 13352 Heller 301 Partners Investors, L Lc A56S G 0.127 0.461 0.461 E<br />
Manatee 20106 G & D FARMS INC and 2 P Cattle Co. A535 G 0.057 0.207 0.207 E<br />
Manatee 20203 Samuel Thornton A415 G 0 0.008 0.008 E<br />
Manatee 20245 Timothy A. Knowles as Trustee of The Land Trust 32 A56S G 0.085 0.154 0.154 E<br />
59.090 Metered, mgd<br />
Manatee County Totals<br />
6.519 <strong>Estimated</strong> , mgd<br />
65.609 Total, mgd<br />
Marion 2697 Charlotte Weber A455 G 0.269 1.028 0.847 M<br />
Marion 5424 J Crayton Pruitt A550 G 0.000 1.226 1.226 M<br />
M/E 5<br />
<strong>Southwest</strong> <strong>Florida</strong> <strong>Water</strong> <strong>Management</strong> District<br />
Page | 260
<strong>2011</strong> ESTIMATED WATER USE REPORT<br />
Table A7. Metered and <strong>Estimated</strong> Agricultural WUPs, Withdrawals and Permitted <strong>Use</strong> (mgd), <strong>2011</strong><br />
County<br />
WUP<br />
Number<br />
<strong>Southwest</strong> <strong>Florida</strong> <strong>Water</strong> <strong>Management</strong> District<br />
Permittee<br />
<strong>Use</strong><br />
Code 1<br />
Source 2<br />
Annual<br />
Average<br />
Pumpage 3<br />
Total<br />
Permitted<br />
Annual<br />
Average<br />
Quantity<br />
Permitted<br />
Quantity<br />
Attributed<br />
to AG <strong>Use</strong><br />
Category 4<br />
Marion 11475 Arbor Springs Dev LLC A52S G 0.019 0.655 0.635 M<br />
Marion 11602 McGinley Family LP A52S G 0.286 1.795 1.795 M<br />
Marion 20174 On Top of the World Communities Inc A52F G 0.006 0.664 0.663 M<br />
Marion 206 Robert E. Scott‐Etal (Bar S.F. Ranch) A405 G 0.013 0.021 0.021 E<br />
Marion 206 Robert E. Scott‐Etal (Bar S.F. Ranch) A405 S 0 0.021 0.021 E<br />
Marion 2824 Eddie Woods & Dennis & Patricia L625 G 0.006 0.019 0.019 E<br />
Marion 3957 Bridlewood Farm L705 G 0.015 0.024 0.024 E<br />
Marion 4096 Meadowbrook Farms, Inc. A500 G 0.06 0.083 0.083 E<br />
Marion 4386 Hale R. Stancil A56S G 0.002 0.003 0.003 E<br />
Marion 4390 T Richard Barber Jr Tst T Richard Barber Tst 7/19/96 A500 G 0.215 0.381 0.381 E<br />
Marion 5550 Dale Wright A470 G 0.067 0.093 0.093 E<br />
Marion 5619 Audrey P Murray A485 G 0.002 0.003 0.003 E<br />
Marion 6282 Robert Killian A52S G 0.076 0.138 0.138 E<br />
Marion 6397 Bradford Farms, Inc. and Bradford Farms 159 P2 LLC A500 G 0.061 0.084 0.084 E<br />
Marion 6423 Salgaca Corporation A480 G 0.121 0.335 0.335 E<br />
Marion 6989 Carl Allen A490 G 0.068 0.126 0.123 E<br />
Marion 7145 Romeo Ridge Ranch Terry Roberts A58S G 0.089 0.164 0.164 E<br />
Marion 7414 Michael L Russ, Danny G Stevens, Robert E Stevens A470 G 0.061 0.09 0.09 E<br />
Marion 7415 Ned H Folks A470 G 0.123 0.171 0.171 E<br />
Marion 7487 Robert R. Hilger A480 G 0.006 0.019 0.019 E<br />
Marion 7709 Joseph B. Greeley L635 G 0 0.004 0.001 E<br />
Marion 7847 Ellis M. & A.A. Gillum (Alice Ann Farm) A460 G 0.004 0.007 0.007 E<br />
Marion 8034 Rainbow River Ranch A470 G 0.069 0.096 0.096 E<br />
Marion 8053 CPS Land Holdings LLC A410 G 0.001 0.033 0.033 E<br />
Marion 8075 Domenic And Marianna Martelli A650 G 0.025 0.046 0.042 E<br />
Marion 8076 Tac Holdings, Inc. A490 G 0.125 0.227 0.227 E<br />
Marion 8271 Bain S. Miller A495 G 0.001 0.045 0.045 E<br />
Marion 8271 Bain S. Miller A495 S 0.026 0.045 0.045 E<br />
Marion 8828 Dewey W Brewton II A470 G 0.04 0.055 0.055 E<br />
Marion 9136 Taylor Bristow A500 G 0.049 0.068 0.068 E<br />
Marion 9204 George W & Sheila A Sikes A415 G 0.003 0.005 0.005 E<br />
M/E 5<br />
Page | 261
<strong>2011</strong> ESTIMATED WATER USE REPORT<br />
Table A7. Metered and <strong>Estimated</strong> Agricultural WUPs, Withdrawals and Permitted <strong>Use</strong> (mgd), <strong>2011</strong><br />
County<br />
WUP<br />
Number<br />
Permittee<br />
<strong>Use</strong><br />
Code 1<br />
Source 2<br />
Annual<br />
Average<br />
Pumpage 3<br />
Total<br />
Permitted<br />
Annual<br />
Average<br />
Quantity<br />
Permitted<br />
Quantity<br />
Attributed<br />
to AG <strong>Use</strong><br />
Category 4<br />
Marion 9558 Drake Ranch A485 G 0.05 0.18 0.18 E<br />
Marion 10148 Cecil N Benton A470 G 0.004 0.007 0.007 E<br />
Marion 11002 Carol B Markham & Reba M Caldwell A52S G 0.065 0.089 0.089 E<br />
Marion 11005 Marnelle Sampson A52S G 0.103 0.187 0.187 E<br />
Marion 11098 Donna S Colli A470 G 0.065 0.09 0.09 E<br />
Marion 11579 Cool Springs Ranch LLC A470 G 0.067 0.099 0.099 E<br />
Marion 12041 Ruth Taber A490 G 0 0.036 0.036 E<br />
Marion 12159 Kenneth Carroll Sr. A500 G 0.179 0.324 0.324 E<br />
Marion 12303 James E & Terry Jean Hiers A470 G 0.06 0.083 0.083 E<br />
Marion 12306 William J. And Colin D. Morrow A470 G 0.038 0.053 0.053 E<br />
Marion 12307 Jack & Cynthia Bivens A495 G 0.197 0.357 0.357 E<br />
Marion 12549 Triple Bell Farms LLC A650 G 0.025 0.045 0.045 E<br />
Marion 12560 Robert J Nealy Jr A485 G 0.068 0.094 0.094 E<br />
Marion 12774 Charles M. Webb, Jr. A470 G 0.043 0.06 0.06 E<br />
Marion 12910 Mary Ross A470 G 0.051 0.071 0.071 E<br />
Marion 12921 Ocala 623 Land Development Llc And Marion Co Utilities A485 G 0 0.482 0.009 E<br />
Marion 13030 Ronald D & Sarah F Cannon A470 G 0.185 0.336 0.336 E<br />
Marion 13058 Alden & Patricia A Poole A470 G 0.009 0.015 0.015 E<br />
Marion 13157 W C & Barbara P Weeks A52S G 0.055 0.077 0.077 E<br />
Marion 13197 Shade Tree Turf LLC A485 G 0.112 0.203 0.203 E<br />
Marion 13364 John Rudnianyn Et Al A455 G 0.276 0.498 0.498 E<br />
Marion 20080 Herbert Mills Trustee A470 G 0.045 0.063 0.063 E<br />
Marion 20147 Farrior Investments Ltd A495 G 0.063 0.099 0.099 E<br />
Marion 20152 HT Ranch, LLC A495 G 0 0.218 0.218 E<br />
Marion 20210 R.L. Roberts Properties LLC A495 G 0.306 0.426 0.424 E<br />
0.580 Metered, mgd<br />
Marion County Totals<br />
3.394 <strong>Estimated</strong> , mgd<br />
3.974 Total, mgd<br />
Pasco 617 Oakley Groves Inc A415 G 0.113 0.122 0.122 M<br />
Pasco 1977 Herbert Boltin Jr A415 G 0.066 0.153 0.153 M<br />
M/E 5<br />
<strong>Southwest</strong> <strong>Florida</strong> <strong>Water</strong> <strong>Management</strong> District<br />
Page | 262
<strong>2011</strong> ESTIMATED WATER USE REPORT<br />
Table A7. Metered and <strong>Estimated</strong> Agricultural WUPs, Withdrawals and Permitted <strong>Use</strong> (mgd), <strong>2011</strong><br />
County<br />
WUP<br />
Number<br />
<strong>Southwest</strong> <strong>Florida</strong> <strong>Water</strong> <strong>Management</strong> District<br />
Permittee<br />
<strong>Use</strong><br />
Code 1<br />
Source 2<br />
Annual<br />
Average<br />
Pumpage 3<br />
Total<br />
Permitted<br />
Annual<br />
Average<br />
Quantity<br />
Permitted<br />
Quantity<br />
Attributed<br />
to AG <strong>Use</strong><br />
Category 4<br />
Pasco 2413 Pasco Ranch Inc A490 G 0.000 0.115 0.115 M<br />
Pasco 2479 Wiregrass Ranch Inc A495 G 0.231 2.801 2.801 M<br />
Pasco 2603 Marie Cook‐Matis A490 G 0.000 0.109 0.109 M<br />
Pasco 2698 Sid Larkin & Son Inc Enterprise Recycling & Disposal A525 G 0.015 1.940 1.940 M<br />
Pasco 3379 Perfection Partners Ltd A415 G 0.051 0.112 0.112 M<br />
Pasco 3380 Evans Properties Inc A50F G 0.035 0.165 0.165 M<br />
Pasco 3381 Evans Properties Inc A415 G 0.070 0.161 0.161 M<br />
Pasco 3388 Evans Properties Inc A415 G 0.120 0.252 0.252 M<br />
Pasco 3390 Evans Properties Inc A50F G 0.092 0.202 0.202 M<br />
Pasco 3391 Evans Properties Inc A415 G 0.507 1.044 1.044 M<br />
Pasco 3392 Evans Properties Inc A415 G 0.104 0.226 0.226 M<br />
Pasco 3468 Bexley Land Trust‐Sc Bexley Jr‐ Lsb Corp‐Nnp Bexley Ltd A525 G 0.014 2.981 2.830 M<br />
Pasco 3468 Bexley Land Trust‐Sc Bexley Jr‐ Lsb Corp‐Nnp Bexley Ltd A525 S 0.000 2.981 2.830 M<br />
Pasco 4052 Evans Properties Inc A415 G 0.098 0.102 0.102 M<br />
Pasco 4540 Will Pick LLC A425 G 0.000 0.025 0.025 M<br />
Pasco 5897 Barthle Brothers Ranch Inc A405 G 0.167 0.515 0.515 M<br />
Pasco 5973 Neukom Properties Inc A415 G 0.134 0.302 0.302 M<br />
Pasco 7021 Brightman Logan Revocable Trust A480 G 0.090 0.155 0.155 M<br />
Pasco 7326 Krusen Properties LLC A525 G 0.000 0.447 0.447 M<br />
Pasco 7497 Ann Oakley Maggard And Dale Edward Maggard A415 G 0.089 0.139 0.139 M<br />
Pasco 7499 Lake Placid Groves LLC A415 G 0.144 0.187 0.187 M<br />
Pasco 8737 W.R.B. Enterprises Inc A480 G 0.030 0.844 0.844 M<br />
Pasco 8932 Jordan and Jordan Inc. A415 G 0.086 0.140 0.140 M<br />
Pasco 9081 Evans Properties Inc A635 G 0.054 0.094 0.094 M<br />
Pasco 9150 LD Mitchell Inc A415 G 0.067 0.245 0.245 M<br />
Pasco 10447 Goldenranch Property, LLC A525 G 0.056 0.450 0.450 M<br />
Pasco 10809 Bill M Surratt Jr A455 G 0.044 0.181 0.181 M<br />
Pasco 11773 Little Everglades Ranch Inc A525 G 0.074 0.452 0.259 M<br />
Pasco 11773 Little Everglades Ranch Inc A525 S 0.000 0.452 0.259 M<br />
Pasco 11926 Price Realty LLC A415 G 0.001 0.053 0.053 M<br />
Pasco 11927 Will Pick LLC A415 G 0.002 0.111 0.111 M<br />
M/E 5<br />
Page | 263
<strong>2011</strong> ESTIMATED WATER USE REPORT<br />
Table A7. Metered and <strong>Estimated</strong> Agricultural WUPs, Withdrawals and Permitted <strong>Use</strong> (mgd), <strong>2011</strong><br />
County<br />
WUP<br />
Number<br />
<strong>Southwest</strong> <strong>Florida</strong> <strong>Water</strong> <strong>Management</strong> District<br />
Permittee<br />
<strong>Use</strong><br />
Code 1<br />
Source 2<br />
Annual<br />
Average<br />
Pumpage 3<br />
Total<br />
Permitted<br />
Annual<br />
Average<br />
Quantity<br />
Permitted<br />
Quantity<br />
Attributed<br />
to AG <strong>Use</strong><br />
Category 4<br />
Pasco 12346 La Hacienda Del Cielo LLC A415 G 0.051 0.327 0.321 M<br />
Pasco 12919 John & Julie M Faulkner A480 G 0.186 0.151 0.151 M<br />
Pasco 12934 Angeline Corp James P Bexley A525 G 0.000 0.343 0.265 M<br />
Pasco 12934 Angeline Corp James P Bexley A525 S 0.000 0.343 0.265 M<br />
Pasco 13170 Angelos Aggregate Materials Ltd A525 G 0.231 0.532 0.532 M<br />
Pasco 13171 Stony Pointe LP A425 G 0.208 0.127 0.127 M<br />
Pasco 9 Guy H Grieshop A480 G 0.01 0.016 0.016 E<br />
Pasco 19 Pat Nathe Groves, Inc. A415 G 0.042 0.058 0.058 E<br />
Pasco 20 Pat Nathe Groves, Inc. A415 G 0.061 0.084 0.084 E<br />
Pasco 21 Pat Nathe Groves, Inc. A415 G 0.038 0.052 0.052 E<br />
Pasco 155 Russell and Leann Finlay A415 G 0.015 0.025 0.025 E<br />
Pasco 156 Randy J. and Barbara L. Barthle A415 G 0.008 0.013 0.013 E<br />
Pasco 210 Maconi‐Pashley LLC L610 G 0 0 0 E<br />
Pasco 258 Wayne Woodward A415 G 0.007 0.012 0.012 E<br />
Pasco 272 Stanley Ryals A415 G 0.069 0.095 0.095 E<br />
Pasco 329 <strong>Florida</strong> Capital Bank Na A415 G 0.017 0.027 0.027 E<br />
Pasco 361 Josephine A Shafchuk A415 G 0.01 0.017 0.017 E<br />
Pasco 363 Oakley Groves, Inc. (Kelly Ann Grove) A415 G 0.02 0.033 0.033 E<br />
Pasco 618 Henry L Wickett A415 G 0.043 0.06 0.06 E<br />
Pasco 667 John Fletcher & Theresa Edwards A415 G 0.008 0.013 0.013 E<br />
Pasco 677 Janice H Urban A415 G 0.018 0.029 0.029 E<br />
Pasco 727 Kinsman Inc A415 G 0.088 0.157 0.157 E<br />
Pasco 733 Rollins Fruit Co Inc A415 G 0.011 0.018 0.018 E<br />
Pasco 734 James R. Jones A415 G 0.019 0.032 0.032 E<br />
Pasco 741 Harold F & Emilee Warren A415 G 0.061 0.085 0.085 E<br />
Pasco 763 Us 98 LLC L610 G 0.001 0.002 0.002 E<br />
Pasco 777 Herman Schrader A415 G 0.044 0.061 0.061 E<br />
Pasco 778 Schrader Family Limited Partnership A495 G 0.049 0.07 0.07 E<br />
Pasco 780 Yankee Citrus A415 G 0.028 0.047 0.047 E<br />
Pasco 862 James R. Jones A415 G 0.014 0.027 0.023 E<br />
Pasco 875 Terms III LLC A415 G 0.031 0.075 0.075 E<br />
M/E 5<br />
Page | 264
<strong>2011</strong> ESTIMATED WATER USE REPORT<br />
Table A7. Metered and <strong>Estimated</strong> Agricultural WUPs, Withdrawals and Permitted <strong>Use</strong> (mgd), <strong>2011</strong><br />
County<br />
WUP<br />
Number<br />
<strong>Southwest</strong> <strong>Florida</strong> <strong>Water</strong> <strong>Management</strong> District<br />
Permittee<br />
<strong>Use</strong><br />
Code 1<br />
Source 2<br />
Annual<br />
Average<br />
Pumpage 3<br />
Total<br />
Permitted<br />
Annual<br />
Average<br />
Quantity<br />
Permitted<br />
Quantity<br />
Attributed<br />
to AG <strong>Use</strong><br />
Category 4<br />
Pasco 931 Rb Kiefer Groves Inc A415 G 0.024 0.039 0.039 E<br />
Pasco 932 Wilton Simpson & James Stalnaker A415 G 0.015 0.024 0.024 E<br />
Pasco 965 Wayne Thomas Inc A470 G 0.052 0.072 0.072 E<br />
Pasco 1029 James N Powell Trustee A495 G 0.04 0.055 0.055 E<br />
Pasco 1190 <strong>Florida</strong> Colonial Groves Inc A415 G 0.066 0.092 0.092 E<br />
Pasco 1192 John M. Madison and Diana Thomas‐Madison A500 G 0.07 0.097 0.097 E<br />
Pasco 1377 Richard & Kimberly Kinney A490 G 0.05 0.081 0.081 E<br />
Pasco 1561 Hines Properties, Inc. A415 G 0.044 0.061 0.061 E<br />
Pasco 1580 Starkey Land Company LLC A490 G 0.031 0.051 0.051 E<br />
Pasco 1627 George A. Neukom, Jr. A415 G 0.017 0.027 0.027 E<br />
Pasco 1636 Frassrand Estates Inc & Gude Family Cattle Inc A415 G 0.1 0.177 0.177 E<br />
Pasco 1893 Allen R Tucker A415 G 0.019 0.032 0.032 E<br />
Pasco 2014 Curtis & Maxine Law & Sharon Law A415 G 0.059 0.083 0.083 E<br />
Pasco 2269 Douglas W & Leah R King A58S G 0.001 0.002 0.002 E<br />
Pasco 2283 Earl D. Tyer A495 G 0.018 0.029 0.029 E<br />
Pasco 2534 Marshall B. Armstrong A415 S 0.004 0.006 0.006 E<br />
Pasco 2537 Vasilios & Andreas Benetatos A415 G 0.01 0.016 0.016 E<br />
Pasco 2644 Epco Ranch, Inc. A415 G 0 0.08 0.08 E<br />
Pasco 2696 William Preston Hill L650 G 0.001 0.002 0.002 E<br />
Pasco 2701 William B Taylor A416 G 0.016 0.027 0.027 E<br />
Pasco 2744 La Hacienda Del Cielo A415 G 0.043 0.06 0.06 E<br />
Pasco 2745 Harold C. Thomas A495 G 0.016 0.027 0.027 E<br />
Pasco 2745 Harold C. Thomas A495 S 0.001 0.027 0.027 E<br />
Pasco 2853 Karen L and Robert F Bardin Jr A410 G 0.002 0.004 0.004 E<br />
Pasco 2857 Six Feet Under LLC A415 G 0.029 0.047 0.047 E<br />
Pasco 2859 Oak Bridge Limited A415 G 0.029 0.048 0.048 E<br />
Pasco 2863 Paul Beaty A535 G 0.013 0.021 0.021 E<br />
Pasco 2883 Joseph B., Margaret K., Paul J., & Mary A. Neuhofer A415 G 0.015 0.025 0.025 E<br />
Pasco 2921 E R & Vonice Tupper A495 G 0.023 0.038 0.038 E<br />
Pasco 2924 SB Associates, LP A495 G 0.033 0.297 0.297 E<br />
Pasco 2924 SB Associates, LP A495 S 0.152 0.297 0.297 E<br />
M/E 5<br />
Page | 265
<strong>2011</strong> ESTIMATED WATER USE REPORT<br />
Table A7. Metered and <strong>Estimated</strong> Agricultural WUPs, Withdrawals and Permitted <strong>Use</strong> (mgd), <strong>2011</strong><br />
County<br />
WUP<br />
Number<br />
<strong>Southwest</strong> <strong>Florida</strong> <strong>Water</strong> <strong>Management</strong> District<br />
Permittee<br />
<strong>Use</strong><br />
Code 1<br />
Source 2<br />
Annual<br />
Average<br />
Pumpage 3<br />
Total<br />
Permitted<br />
Annual<br />
Average<br />
Quantity<br />
Permitted<br />
Quantity<br />
Attributed<br />
to AG <strong>Use</strong><br />
Category 4<br />
Pasco 2985 Dueward & Beatrice Atkins A490 G 0.044 0.061 0.061 E<br />
Pasco 3113 James Groves and Ranch Inc A415 G 0.016 0.048 0.048 E<br />
3183 Vida Depue‐Depue Ranch Llc‐Mary J Geiger‐Michael D & L605<br />
0.004 0.006 0.006<br />
Pasco<br />
Mary F Nutt<br />
G<br />
E<br />
Pasco 3246 Douglas Fort Dade Groves Inc A415 G 0.021 0.035 0.035 E<br />
3255 K., B., K.T., & M.M. Williams & A. Rescigno,I. Smith & S. A415<br />
0.019 0.031 0.031<br />
Pasco<br />
Larson<br />
G<br />
E<br />
Pasco 3377 Withlacoochee River Electric Coop A415 G 0.04 0.056 0.056 E<br />
Pasco 3378 Evans Properties Inc A415 G 0.046 0.064 0.064 E<br />
Pasco 3382 Evans Properties Inc A415 G 0.029 0.047 0.047 E<br />
Pasco 3479 Jordan & Jordan Inc A495 G 0.011 0.018 0.018 E<br />
Pasco 3487 Jeffrey P. & Margret C. Hust A51S G 0.063 0.087 0.087 E<br />
Pasco 3564 Robert J Clark Sr Revocable Trust A415 G 0.029 0.048 0.048 E<br />
Pasco 3644 Harry Ryder Denlinger Janet L Denlinger A415 G 0.039 0.054 0.054 E<br />
Pasco 4212 Rollins Fruit Company Inc A415 G 0.044 0.062 0.062 E<br />
Pasco 4437 Joseph Neal Hancock A415 G 0.011 0.018 0.018 E<br />
Pasco 4470 Himanshu Patel & Dipti Patel A415 G 0.021 0.034 0.034 E<br />
Pasco 4541 Price Realty LLC A415 G 0.023 0.037 0.037 E<br />
Pasco 4543 Price Realty LLC A490 G 0.018 0.029 0.029 E<br />
Pasco 4546 Maconi‐Pashley LLC A415 G 0.046 0.064 0.064 E<br />
Pasco 4688 Midili Enterprises Inc A515 G 0.024 0.039 0.039 E<br />
Pasco 4735 Triple J Ranch Inc A470 G 0.171 0.28 0.28 E<br />
Pasco 4736 Lykes Bros Inc A415 G 0.147 0.267 0.267 E<br />
Pasco 4788 Running M Ranch & Groves Inc A415 G 0.013 0.042 0.042 E<br />
Pasco 4909 James & Barbara Lasseter A415 G 0.02 0.033 0.033 E<br />
Pasco 4910 Vincent W Straigis A490 G 0.006 0.011 0.011 E<br />
Pasco 4923 Ruth A Hill A415 G 0.014 0.023 0.023 E<br />
Pasco 4953 Geiger Ranch A490 G 0.065 0.09 0.09 E<br />
Pasco 4954 James & Neville Groves, Inc. A415 G 0.017 0.029 0.029 E<br />
Pasco 4984 Oakley Groves Inc A415 G 0.028 0.046 0.046 E<br />
Pasco 5093 Finest Farms Inc A470 G 0.067 0.093 0.093 E<br />
M/E 5<br />
Page | 266
<strong>2011</strong> ESTIMATED WATER USE REPORT<br />
Table A7. Metered and <strong>Estimated</strong> Agricultural WUPs, Withdrawals and Permitted <strong>Use</strong> (mgd), <strong>2011</strong><br />
County<br />
WUP<br />
Number<br />
<strong>Southwest</strong> <strong>Florida</strong> <strong>Water</strong> <strong>Management</strong> District<br />
Permittee<br />
<strong>Use</strong><br />
Code 1<br />
Source 2<br />
Annual<br />
Average<br />
Pumpage 3<br />
Total<br />
Permitted<br />
Annual<br />
Average<br />
Quantity<br />
Permitted<br />
Quantity<br />
Attributed<br />
to AG <strong>Use</strong><br />
Category 4<br />
Pasco 5158 Brent Coppedge Price A415 G 0.002 0.004 0.004 E<br />
Pasco 5175 Richard & M'Lisse Ramsey A470 G 0.055 0.077 0.077 E<br />
5804 Michael Glantz Trustee Of The Pasco 41 Land Trust Uad A415<br />
0.042 0.058 0.058<br />
Pasco<br />
8‐16‐04<br />
G<br />
E<br />
Pasco 5914 Darcy Mirabal A415 G 0.03 0.05 0.05 E<br />
Pasco 5950 Evans Properties Inc A415 G 0.028 0.047 0.047 E<br />
Pasco 5958 Oakley Groves Inc A415 G 0.047 0.066 0.066 E<br />
Pasco 6049 Dominic Iafrate Angelo'S Aggregate Materials Ltd A495 G 0.042 0.059 0.059 E<br />
Pasco 6099 Hilltop Estates Inc A415 G 0.028 0.047 0.047 E<br />
Pasco 6210 Earl and Walter M. Singletary A495 G 0.011 0.017 0.017 E<br />
6301 Gloria M.S. Chiang, Trustee For B. Chiang Irrev. Childrens A415<br />
0.043 0.06 0.06<br />
Pasco<br />
Trust<br />
G<br />
E<br />
Pasco 6395 Anthony R & Francine T Hancock A485 G 0.029 0.081 0.081 E<br />
Pasco 6407 Ronald C Or Betty Jo Weber A415 G 0.006 0.01 0.01 E<br />
Pasco 6555 Cornelius Mccabe A480 G 0.009 0.014 0.014 E<br />
Pasco 6621 John E. & Velma Radloff A56S G 0.024 0.04 0.04 E<br />
Pasco 6639 Blanton Road Land Trust A415 G 0.073 0.133 0.133 E<br />
Pasco 6785 Celia M Williams, Trustee A415 G 0.026 0.066 0.066 E<br />
Pasco 6785 Celia M Williams, Trustee A415 S 0.014 0.066 0.066 E<br />
Pasco 6808 Cedora P. Andrews Trust A415 G 0.041 0.057 0.057 E<br />
Pasco 6814 Keathel W Chauncey A535 G 0.03 0.049 0.049 E<br />
Pasco 6844 Sarah E Hammond A415 G 0.014 0.023 0.023 E<br />
Pasco 6899 Earl Singletary (Singletary Farm ) A635 G 0.06 0.083 0.083 E<br />
7017 Bruce & Judy Weicht ‐ Herman A Heinlein & Frank J A58S<br />
0.031 0.05 0.05<br />
Pasco<br />
Ciardullo<br />
G<br />
E<br />
Pasco 7125 Steven Glavich A470 G 0.03 0.084 0.084 E<br />
Pasco 7161 Tom Ed & Patricia A Oakley A415 G 0.025 0.041 0.041 E<br />
Pasco 7206 Ruth W. Philmon Trust A415 G 0.025 0.041 0.041 E<br />
Pasco 7324 Luis Hernandez L610 G 0.001 0.001 0.001 E<br />
Pasco 7370 Kevin L And Tammy L Ryman A415 G 0.01 0.017 0.017 E<br />
Pasco 7371 Helen, Michael, Robert, Ruth Stu Bbs A415 G 0.009 0.015 0.015 E<br />
M/E 5<br />
Page | 267
<strong>2011</strong> ESTIMATED WATER USE REPORT<br />
Table A7. Metered and <strong>Estimated</strong> Agricultural WUPs, Withdrawals and Permitted <strong>Use</strong> (mgd), <strong>2011</strong><br />
County<br />
WUP<br />
Number<br />
<strong>Southwest</strong> <strong>Florida</strong> <strong>Water</strong> <strong>Management</strong> District<br />
Permittee<br />
<strong>Use</strong><br />
Code 1<br />
Source 2<br />
Annual<br />
Average<br />
Pumpage 3<br />
Total<br />
Permitted<br />
Annual<br />
Average<br />
Quantity<br />
Permitted<br />
Quantity<br />
Attributed<br />
to AG <strong>Use</strong><br />
Category 4<br />
Pasco 7498 Oakley Investments A415 G 0.054 0.074 0.074 E<br />
Pasco 7525 Paul E. Korchak A415 G 0.002 0.004 0.004 E<br />
Pasco 7563 Richard and Nancy Debosek L635 G 0 0 0 E<br />
Pasco 7564 The William Floyd Philmon Revocable Living Trust A415 G 0.043 0.06 0.06 E<br />
Pasco 7565 Grandview Botanicals, Inc. & Paul D. Finora A480 G 0.017 0.028 0.028 E<br />
7603 Nancy B. Counihan Revocable Trust & Merry Meeting, A415<br />
0.02 0.033 0.033<br />
G<br />
Pasco<br />
Inc.<br />
E<br />
Pasco 7686 Angelos Aggregate Materials A485 G 0.084 0.152 0.152 E<br />
Pasco 7722 Midili Enterprises Inc A535 G 0.019 0.031 0.031 E<br />
Pasco 7729 Evans Properties Inc A415 G 0.043 0.06 0.06 E<br />
Pasco 7730 Evans Properties Inc A415 G 0.028 0.046 0.046 E<br />
Pasco 7763 Himanshu Patel & Dipti Patel A415 G 0.012 0.02 0.02 E<br />
Pasco 7769 Joseph W & Beverly J Gilmore Sr A480 G 0.01 0.016 0.016 E<br />
Pasco 7848 Nancy Counihan A410 G 0.001 0.002 0.002 E<br />
Pasco 7932 Tom L. Rankin A415 G 0.046 0.064 0.064 E<br />
Pasco 7977 Mitchell Ranch Partnership, Ltd. L600 G 0.002 0.004 0.004 E<br />
Pasco 7979 Danny R. & Candy D. Linville L650 G 0.004 0.012 0.012 E<br />
Pasco 8046 Nancy Lynn Williams Lockman A425 G 0.007 0.012 0.012 E<br />
Pasco 8125 Dona Leonhard And Heidi Pennella A415 G 0.011 0.017 0.017 E<br />
Pasco 8221 Floyd Philmon A415 G 0.021 0.034 0.034 E<br />
Pasco 8524 Pickens C & William F E Price L600 G 0 0 0 E<br />
Pasco 8539 John D & Mary C Jones A415 G 0.001 0.002 0.002 E<br />
Pasco 8598 Bruce Mcclendon A495 G 0.001 0.002 0.002 E<br />
Pasco 8650 Billie Jean Wilson & Jan E Retz A415 G 0.014 0.023 0.023 E<br />
Pasco 8663 Floyd Philmon A415 G 0.041 0.056 0.056 E<br />
Pasco 8680 Ruth A Hill A415 G 0.029 0.048 0.048 E<br />
Pasco 8727 Southeast Real Estate Partners A415 G 0.008 0.013 0.013 E<br />
Pasco 8754 Nadeem Iqbal & Iqbal Groves Inc A415 G 0.028 0.047 0.047 E<br />
Pasco 8840 Henry L Wickett Sr L600 G 0.001 0.001 0.001 E<br />
Pasco 8856 Evans Properties Inc A415 G 0.009 0.036 0.036 E<br />
Pasco 8906 Cal‐Maine Foods Inc L600 G 0.051 0.095 0.084 E<br />
M/E 5<br />
Page | 268
<strong>2011</strong> ESTIMATED WATER USE REPORT<br />
Table A7. Metered and <strong>Estimated</strong> Agricultural WUPs, Withdrawals and Permitted <strong>Use</strong> (mgd), <strong>2011</strong><br />
County<br />
WUP<br />
Number<br />
<strong>Southwest</strong> <strong>Florida</strong> <strong>Water</strong> <strong>Management</strong> District<br />
Permittee<br />
<strong>Use</strong><br />
Code 1<br />
Source 2<br />
Annual<br />
Average<br />
Pumpage 3<br />
Total<br />
Permitted<br />
Annual<br />
Average<br />
Quantity<br />
Permitted<br />
Quantity<br />
Attributed<br />
to AG <strong>Use</strong><br />
Category 4<br />
Pasco 8924 Evans Properties Inc A415 G 0.024 0.04 0.04 E<br />
Pasco 8933 Jordan & Jordan Inc A415 G 0.024 0.039 0.039 E<br />
Pasco 8941 Walter M Rowland Jr & Dina L A535 G 0.036 0.132 0.132 E<br />
Pasco 8951 <strong>Florida</strong> Department of Corrections A57F G 0.004 0.007 0.007 E<br />
Pasco 8984 Floyd & Associates Inc A425 G 0.034 0.056 0.056 E<br />
Pasco 9054 John E. Radloff A56F G 0.06 0.082 0.082 E<br />
Pasco 9071 Harold Krig Edward Greif A56S G 0.138 0.25 0.25 E<br />
Pasco 9151 Henry Douglas A415 G 0.058 0.08 0.08 E<br />
Pasco 9214 Oakley Groves Inc A415 G 0.014 0.023 0.023 E<br />
Pasco 9216 Oakley Groves Inc A415 G 0.028 0.046 0.046 E<br />
Pasco 9403 El ‐ JJ Peeples Living Trust A415 G 0.04 0.055 0.055 E<br />
Pasco 9461 Evans Properties Inc A415 G 0.058 0.082 0.082 E<br />
Pasco 9466 Mildred & Richard E Kennedy A415 G 0.014 0.023 0.023 E<br />
Pasco 9609 Lake Iola Land LLC A415 G 0.006 0.01 0.01 E<br />
Pasco 9618 Ronald E. Oakley A415 G 0.031 0.05 0.05 E<br />
Pasco 9695 Douglas Family Partnership A415 G 0.042 0.059 0.059 E<br />
Pasco 9747 Gene E. Pike & Sandra K. Pike L600 G 0 0.002 0.001 E<br />
Pasco 9749 Northsee Corporation And Southsee Corporation A415 G 0.123 0.17 0.17 E<br />
Pasco 9772 Stacy Edwards And W R And A I Jordan A415 G 0.026 0.043 0.043 E<br />
Pasco 9913 Tedwell H. and Carol J. Surratt A415 G 0.007 0.011 0.011 E<br />
Pasco 9916 URADCO, Inc. A415 G 0.045 0.062 0.062 E<br />
Pasco 9939 The Robert G & Evelyn M Gorman R Evocable Trust A415 G 0.006 0.01 0.01 E<br />
Pasco 9950 Bruce L. And Kathy J Weber A415 S 0.02 0.033 0.033 E<br />
Pasco 9952 Bruce L. And Kathy J Weber A415 G 0.01 0.017 0.017 E<br />
Pasco 10041 Julie & Charles David Hearn A480 G 0.003 0.005 0.005 E<br />
Pasco 10047 David T & Linda J Beecham A415 G 0 0.014 0.014 E<br />
Pasco 10205 James Groves & Ranch Inc A415 G 0 0.054 0.054 E<br />
Pasco 10206 James Groves & Ranch Inc A415 G 0 0.053 0.053 E<br />
Pasco 10207 David T & Linda J Beecham A415 G 0.008 0.013 0.013 E<br />
Pasco 10208 David T & Linda J Beecham A415 G 0.012 0.019 0.019 E<br />
Pasco 10244 Terry Schrader A415 G 0 0.026 0.026 E<br />
M/E 5<br />
Page | 269
<strong>2011</strong> ESTIMATED WATER USE REPORT<br />
Table A7. Metered and <strong>Estimated</strong> Agricultural WUPs, Withdrawals and Permitted <strong>Use</strong> (mgd), <strong>2011</strong><br />
County<br />
WUP<br />
Number<br />
Permittee<br />
<strong>Use</strong><br />
Code 1<br />
Source 2<br />
Annual<br />
Average<br />
Pumpage 3<br />
Total<br />
Permitted<br />
Annual<br />
Average<br />
Quantity<br />
Permitted<br />
Quantity<br />
Attributed<br />
to AG <strong>Use</strong><br />
Category 4<br />
Pasco 10311 Louis Haywood Mercer A470 G 0.006 0.01 0.01 E<br />
Pasco 10315 Herbert T. James, Jr. A415 G 0.013 0.021 0.021 E<br />
Pasco 10327 URADCO, Inc. A415 G 0.029 0.081 0.081 E<br />
Pasco 10635 Gerald R. and Diane J. Rice A415 G 0.022 0.037 0.037 E<br />
Pasco 10796 Norman R & Joan M Oyen A415 G 0.024 0.039 0.039 E<br />
Pasco 10859 A P & P Citrus Nursery A415 G 0.022 0.035 0.035 E<br />
Pasco 10900 C & C Of Wesley Chapel Inc L660 G 0.068 0.099 0.099 E<br />
Pasco 10941 William R. Watson A535 G 0.051 0.07 0.07 E<br />
Pasco 10983 Herman Schrader A415 G 0.004 0.007 0.007 E<br />
Pasco 11053 Logan C., Corinne E. & Ernest Logan Peeples, Jr. A415 G 0.027 0.044 0.044 E<br />
Pasco 11058 Ernest L. & Jimmie J. Peeples‐ Living Trust A415 G 0.039 0.053 0.053 E<br />
Pasco 11067 Linda B Price A415 G 0.051 0.071 0.071 E<br />
Pasco 11068 Triple J Groves, Inc. A415 G 0 0.048 0.048 E<br />
Pasco 11069 James Groves & Ranch Inc A415 G 0.005 0.008 0.008 E<br />
Pasco 11092 George C James A415 G 0.021 0.035 0.035 E<br />
Pasco 11107 Charles E. & Helen C. Keith A415 G 0.028 0.046 0.046 E<br />
11318 James E Stubbs Unified Credit Shelter‐Michael‐Robert & A490<br />
0.043 0.06 0.06<br />
G<br />
Pasco<br />
Ruth A<br />
E<br />
Pasco 11526 George S Surratt A415 G 0.017 0.027 0.027 E<br />
11592 Tall Timber Cattle & Grove Inc & Robert J & Patricia A415<br />
0.055 0.077 0.077<br />
G<br />
Pasco<br />
Nathe<br />
E<br />
Pasco 11606 Richard Wirth A475 G 0.003 0.005 0.005 E<br />
Pasco 11634 Milo Thomas A455 G 0.188 0.346 0.346 E<br />
Pasco 11769 Charles & Debbie Cates A415 G 0.005 0.008 0.008 E<br />
Pasco 11815 Tall Timber Cattle & Grove Inc A415 G 0.031 0.05 0.05 E<br />
11832 David R & Deborah Abla Trustees Under Abla Declar'Tn A415<br />
0.007 0.012 0.012<br />
G<br />
Pasco<br />
Tst‐<br />
E<br />
Pasco 12014 J Mercer Jr & Jeanette Hogan A415 G 0.021 0.035 0.035 E<br />
Pasco 12038 Gerard H & Roxanne Nathe A415 G 0.019 0.031 0.031 E<br />
Pasco 12051 Margarita P McCoy Trustee Of Mar Garita P McCoy Tst A475 G 0.026 0.044 0.044 E<br />
Pasco 12072 Zenen & Griselda M Valdes A495 G 0.052 0.071 0.071 E<br />
M/E 5<br />
<strong>Southwest</strong> <strong>Florida</strong> <strong>Water</strong> <strong>Management</strong> District<br />
Page | 270
<strong>2011</strong> ESTIMATED WATER USE REPORT<br />
Table A7. Metered and <strong>Estimated</strong> Agricultural WUPs, Withdrawals and Permitted <strong>Use</strong> (mgd), <strong>2011</strong><br />
County<br />
WUP<br />
Number<br />
<strong>Southwest</strong> <strong>Florida</strong> <strong>Water</strong> <strong>Management</strong> District<br />
Permittee<br />
<strong>Use</strong><br />
Code 1<br />
Source 2<br />
Annual<br />
Average<br />
Pumpage 3<br />
Total<br />
Permitted<br />
Annual<br />
Average<br />
Quantity<br />
Permitted<br />
Quantity<br />
Attributed<br />
to AG <strong>Use</strong><br />
Category 4<br />
Pasco 12085 Garry Richard and Sandra Agnes Huffman A415 G 0 0.028 0.028 E<br />
Pasco 12136 Tall Timber Cattle & Grove Inc A415 G 0.01 0.016 0.016 E<br />
Pasco 12311 James R McClelland A495 G 0.014 0.023 0.023 E<br />
12342 Charles A & Angela S Derksen And Robert C Waldo & A410<br />
0.022 0.036 0.036<br />
Pasco<br />
Nina Lewis<br />
G<br />
E<br />
Pasco 12343 J Crayton Pruitt Trustee & Secret Promise, Ltd L625 G 0.013 0.043 0.042 E<br />
12373 James E, Helen P, Michael D, Robert W And Ruth Ann A416<br />
0.011 0.018 0.018<br />
G<br />
Pasco<br />
Stubbs<br />
E<br />
Pasco 12394 Ginger A Bozeman Storch A415 G 0.007 0.012 0.012 E<br />
Pasco 12486 Robert And Katharine Williams A415 G 0.009 0.014 0.014 E<br />
Pasco 12524 Vince C & Kathy J Conner A410 G 0.003 0.005 0.005 E<br />
Pasco 12628 Gary & Doreen Rosenbloom A410 G 0.003 0.005 0.005 E<br />
Pasco 12644 Krusen Properties LLC A525 G 0 0.152 0.152 E<br />
Pasco 12740 James B Owen A410 G 0 0.01 0.01 E<br />
Pasco 12751 Frank Balish & Victoria Rey A410 G 0.01 0.016 0.016 E<br />
Pasco 12776 William R & Brian J & Chad W Peterson A410 G 0 0.035 0.035 E<br />
Pasco 12861 William R & Sharen C Hunziker A410 G 0.002 0.006 0.006 E<br />
Pasco 12968 Michael David Bright & A495 G 0.006 0.01 0.01 E<br />
Pasco 12982 Schwend Inc A490 G 0 0.018 0.018 E<br />
Pasco 13080 Phillip M & Judy B OHearn A495 G 0.071 0.098 0.098 E<br />
Pasco 13104 Ronald A Barrentine A415 G 0.011 0.017 0.017 E<br />
Pasco 13112 Tall Timber Cattle & Grove Inc A415 G 0.009 0.015 0.015 E<br />
Pasco 13114 The Gardens Wholesale Nursery A480 G 0.108 0.174 0.174 E<br />
Pasco 13178 Paul Russell A415 G 0.007 0.011 0.011 E<br />
Pasco 13305 James T Tipton A415 G 0.005 0.008 0.008 E<br />
Pasco 13316 Al‐Bar Ranch Partnership A535 G 0.083 0.149 0.149 E<br />
Pasco 13351 BAS and Sons LLC A410 G 0.026 0.043 0.043 E<br />
Pasco 20020 Gregory Keith A415 G 0.017 0.028 0.028 E<br />
Pasco 20048 Michael Geschke A410 G 0.003 0.011 0.011 E<br />
Pasco 20104 Marks Grove, Inc A415 G 0 0.028 0.028 E<br />
Pasco 20137 Jacquelyn Krupski A410 G 0.006 0.01 0.01 E<br />
M/E 5<br />
Page | 271
<strong>2011</strong> ESTIMATED WATER USE REPORT<br />
Table A7. Metered and <strong>Estimated</strong> Agricultural WUPs, Withdrawals and Permitted <strong>Use</strong> (mgd), <strong>2011</strong><br />
County<br />
WUP<br />
Number<br />
<strong>Southwest</strong> <strong>Florida</strong> <strong>Water</strong> <strong>Management</strong> District<br />
Permittee<br />
<strong>Use</strong><br />
Code 1<br />
Source 2<br />
Annual<br />
Average<br />
Pumpage 3<br />
Total<br />
Permitted<br />
Annual<br />
Average<br />
Quantity<br />
Permitted<br />
Quantity<br />
Attributed<br />
to AG <strong>Use</strong><br />
Category 4<br />
Pasco 20149 Tamara Oakley A415 G 0.007 0.011 0.011 E<br />
Pasco 20156 Michael Neuhofer A415 G 0.005 0.009 0.009 E<br />
Pasco 20197 Jacquelyn Krupski A410 G 0.013 0.022 0.022 E<br />
Pasco 20199 CPM2, INC A410 G 0.016 0.052 0.052 E<br />
Pasco 20220 Daniel McBath A495 G 0 0.069 0.069 E<br />
Pasco 20224 Tall Timber Cattle & Grove Inc A415 G 0.028 0.047 0.047 E<br />
3.230 Metered, mgd<br />
Pasco County Totals<br />
6.466 <strong>Estimated</strong> , mgd<br />
9.696 Total, mgd<br />
Pinellas 7362 Pinellas Co Parks & Conservation Department A485 G 0.000 0.177 0.068 M<br />
Pinellas 7362 Pinellas Co Parks & Conservation Department A485 S 0.000 0.177 0.068 M<br />
Pinellas 12062 Pinellas County A405 G 0.000 0.131 0.131 M<br />
Pinellas 5867 Pinellas County School Board A460 G 0.002 0.005 0.005 E<br />
Pinellas 6109 Earl J Small Growers Inc A475 G 0.029 0.047 0.047 E<br />
Pinellas 7677 Webbs Nursery Inc A480 G 0.005 0.093 0.091 E<br />
Pinellas 7677 Webbs Nursery Inc A480 S 0.03 0.093 0.091 E<br />
Pinellas 10525 Deanza Mobel Americana A460 G 0.038 0.062 0.062 E<br />
0.000 Metered, mgd<br />
Pinellas County Totals<br />
0.104 <strong>Estimated</strong> , mgd<br />
0.104 Total, mgd<br />
Polk 29 Mosaic Fertilizer LLC A415 G 0.324 11.486 1.112 M<br />
Polk 97 Gapway Grove Corp & Strang Groves, LLC A415 G 0.844 0.889 0.889 M<br />
Polk 143 Mountain Lake Corp A415 G 0.449 3.380 0.742 M<br />
Polk 170 Pamplin & Smith, LLC A415 G 0.111 0.112 0.112 M<br />
Polk 222 Lake Hancock Partners LLLP A415 G 0.103 0.079 0.079 M<br />
Polk 285 Lake Garfield Grove LLC A415 G 0.193 0.132 0.132 M<br />
Polk 327 Waverly Growers Cooperative A415 G 0.192 0.111 0.111 M<br />
Polk 382 L Dicks, Inc. A415 G 0.147 0.129 0.129 M<br />
Polk 384 John G Wood & Associates Inc A415 G 0.381 0.320 0.320 M<br />
Polk 423 John W Perdue Jr A415 G 0.082 0.079 0.079 M<br />
M/E 5<br />
Page | 272
<strong>2011</strong> ESTIMATED WATER USE REPORT<br />
Table A7. Metered and <strong>Estimated</strong> Agricultural WUPs, Withdrawals and Permitted <strong>Use</strong> (mgd), <strong>2011</strong><br />
County<br />
WUP<br />
Number<br />
<strong>Southwest</strong> <strong>Florida</strong> <strong>Water</strong> <strong>Management</strong> District<br />
Permittee<br />
<strong>Use</strong><br />
Code 1<br />
Source 2<br />
Annual<br />
Average<br />
Pumpage 3<br />
Total<br />
Permitted<br />
Annual<br />
Average<br />
Quantity<br />
Permitted<br />
Quantity<br />
Attributed<br />
to AG <strong>Use</strong><br />
Category 4<br />
Polk 425 Jefferson Grove Ltd A415 G 0.258 0.159 0.159 M<br />
Polk 426 Carson Futch A415 G 0.038 0.121 0.121 M<br />
Polk 427 Clear Springs Land Company, LLC A495 G 0.000 0.235 0.235 M<br />
Polk 429 Jefferson Grove Ltd A415 G 0.000 0.106 0.106 M<br />
Polk 504 Ray Bob Groves Inc A415 G 0.197 0.151 0.151 M<br />
Polk 551 Bryan Groves, Inc. A415 G 0.088 0.113 0.113 M<br />
Polk 674 Homer V Thompson A415 G 0.068 0.081 0.081 M<br />
Polk 683 Rohlfing Groves Co A415 G 0.097 0.134 0.134 M<br />
Polk 683 Rohlfing Groves Co A415 S 0.001 0.134 0.134 M<br />
Polk 696 Gardinier <strong>Florida</strong> Citrus, Inc. A415 G 0.135 0.211 0.211 M<br />
Polk 697 Interlachen Groves Inc A415 G 0.060 0.105 0.105 M<br />
Polk 765 Rogers Brothers Partnership A415 G 0.022 0.066 0.066 M<br />
Polk 772 Putnam Groves Inc A415 G 0.098 0.140 0.140 M<br />
Polk 819 Robert Washington A415 G 0.104 0.086 0.086 M<br />
Polk 910 Berry Groves Inc A415 G 0.261 0.174 0.174 M<br />
Polk 928 Manuel & Shelly Lopez & John A Jr & Allison Stephens A415 G 0.073 0.077 0.077 M<br />
Polk 949 Albritton & Sons Ltd A415 G 0.118 0.073 0.073 M<br />
Polk 961 Adams Groves Inc A415 G 0.149 0.143 0.143 M<br />
Polk 1109 Brent Monk & Betsy Monk A415 G 0.078 0.140 0.140 M<br />
Polk 1109 Brent Monk & Betsy Monk A415 S 0.000 0.140 0.140 M<br />
Polk 1153 Orange & Sons Inc A415 G 0.041 0.112 0.112 M<br />
Polk 1161 Lake Buffum Grove Ltd A415 G 0.182 0.120 0.120 M<br />
Polk 1202 Gapway Grove Corp & Max W Strang & Et‐Al A415 G 0.094 0.098 0.098 M<br />
Polk 1207 Gapway Groves A415 G 0.100 0.151 0.151 M<br />
Polk 1253 Cutrale Citrus Juices USA Inc A415 G 0.078 0.184 0.184 M<br />
Polk 1300 Oscar W Rogers & Jane Rogers A415 G 0.137 0.181 0.181 M<br />
Polk 1404 Ben Hill Griffin, Inc. A415 G 0.123 0.123 0.123 M<br />
Polk 1420 FETCO Inc A415 G 0.054 0.086 0.086 M<br />
Polk 1426 Bowen Brothers Inc A415 G 0.089 0.087 0.087 M<br />
Polk 1430 Story Citrus Inc A415 G 0.105 0.188 0.188 M<br />
Polk 1433 Flying V ,Inc A415 G 0.030 0.097 0.097 M<br />
M/E 5<br />
Page | 273
<strong>2011</strong> ESTIMATED WATER USE REPORT<br />
Table A7. Metered and <strong>Estimated</strong> Agricultural WUPs, Withdrawals and Permitted <strong>Use</strong> (mgd), <strong>2011</strong><br />
County<br />
WUP<br />
Number<br />
<strong>Southwest</strong> <strong>Florida</strong> <strong>Water</strong> <strong>Management</strong> District<br />
Permittee<br />
<strong>Use</strong><br />
Code 1<br />
Source 2<br />
Annual<br />
Average<br />
Pumpage 3<br />
Total<br />
Permitted<br />
Annual<br />
Average<br />
Quantity<br />
Permitted<br />
Quantity<br />
Attributed<br />
to AG <strong>Use</strong><br />
Category 4<br />
Polk 1455 M A Hutcheson Trust A415 G 0.062 0.111 0.111 M<br />
Polk 1456 Stephens Stephens A415 G 0.092 0.135 0.135 M<br />
Polk 1458 Hurlburt Construction Inc A470 G 0.026 0.169 0.169 M<br />
Polk 1467 Sunshine Fort Meade Properties Inc A480 G 0.113 0.117 0.117 M<br />
Polk 1501 J Henry Groves Inc A415 G 0.048 0.077 0.077 M<br />
Polk 1667 BJ Quality Homes LLC A415 G 0.000 0.078 0.078 M<br />
Polk 1693 Clear Springs Land Company LLC A525 G 0.000 1.049 1.049 M<br />
Polk 1693 Clear Springs Land Company LLC A525 S 0.000 1.049 1.049 M<br />
Polk 1845 Ben Hill Griffin, Inc. A495 G 0.200 0.330 0.330 M<br />
Polk 1851 Southern Tropical Fish Hatchery L660 G 0.362 0.446 0.446 M<br />
Polk 1883 Johnson Properties Inc A415 G 0.175 0.176 0.176 M<br />
Polk 1884 Michael E. And Lanita S. Wynn A415 G 0.080 0.154 0.154 M<br />
Polk 1943 Valencia Dundee LLC A415 G 0.029 0.114 0.114 M<br />
Polk 1955 Jones Gillispie & Clyatt Grove A415 G 0.117 0.103 0.103 M<br />
Polk 2003 Fresh <strong>Florida</strong> Oranges Inc A415 G 0.023 0.158 0.158 M<br />
Polk 2047 Sun Grown Citrus LP A415 G 0.087 0.112 0.112 M<br />
Polk 2057 Gabriel Groves, Inc. A415 G 0.062 0.093 0.093 M<br />
Polk 2063 Scott Stevenson A415 G 0.004 0.167 0.167 M<br />
Polk 2130 Fort Family Partnership Limited A415 G 0.120 0.102 0.102 M<br />
Polk 2132 Flying V ,Inc A415 G 0.112 0.073 0.073 M<br />
Polk 2146 Thelma C Raley Inc A415 G 0.468 0.308 0.308 M<br />
Polk 2147 Thelma C Raley Inc A415 G 0.260 0.298 0.298 M<br />
Polk 2438 Ben Hill Griffin, Inc. A415 G 0.098 0.115 0.115 M<br />
Polk 2439 Gertrude Feil Marital Trust dba Lake Mcleod Associates A415 G 0.169 0.266 0.266 M<br />
Polk 2448 Ben Hill Griffin, Inc. A415 G 0.312 0.484 0.484 M<br />
Polk 2470 Alico Inc A415 G 0.076 0.098 0.098 M<br />
Polk 2501 Seibels Enterprises Inc A415 G 0.148 0.227 0.227 M<br />
Polk 2503 Estes Groves Inc A415 G 0.178 0.189 0.189 M<br />
Polk 2587 Flying V Inc A415 G 0.164 0.150 0.150 M<br />
Polk 2722 Hunt Bros Service Inc A415 G 0.144 0.117 0.117 M<br />
Polk 2834 Bartow Citrus Products LLC A485 G 0.246 0.468 0.313 M<br />
M/E 5<br />
Page | 274
<strong>2011</strong> ESTIMATED WATER USE REPORT<br />
Table A7. Metered and <strong>Estimated</strong> Agricultural WUPs, Withdrawals and Permitted <strong>Use</strong> (mgd), <strong>2011</strong><br />
County<br />
WUP<br />
Number<br />
<strong>Southwest</strong> <strong>Florida</strong> <strong>Water</strong> <strong>Management</strong> District<br />
Permittee<br />
<strong>Use</strong><br />
Code 1<br />
Source 2<br />
Annual<br />
Average<br />
Pumpage 3<br />
Total<br />
Permitted<br />
Annual<br />
Average<br />
Quantity<br />
Permitted<br />
Quantity<br />
Attributed<br />
to AG <strong>Use</strong><br />
Category 4<br />
Polk 2873 Cemex Const Materials <strong>Florida</strong> A415 G 0.089 0.500 0.417 M<br />
Polk 2873 Cemex Const Materials <strong>Florida</strong> A415 S 0.000 0.500 0.417 M<br />
Polk 3039 Mark Wheeler Groves Inc A415 G 0.076 0.071 0.071 M<br />
Polk 3040 Waverly Partners LLC A415 G 0.000 0.266 0.266 M<br />
Polk 3074 Suncoast Builders Of Bartow LLC A415 G 0.167 0.134 0.134 M<br />
Polk 3147 Clear Springs Land Company, LLC A535 G 0.053 0.478 0.147 M<br />
Polk 3219 Gardinier <strong>Florida</strong> Citrus, Inc. A415 G 0.424 0.296 0.296 M<br />
Polk 3238 Dundee Investments LLC A415 G 0.000 0.092 0.092 M<br />
Polk 3439 William M & Dixie L Lennon A415 G 0.037 0.099 0.099 M<br />
Polk 3439 William M & Dixie L Lennon A415 S 0.000 0.099 0.099 M<br />
Polk 3446 Holmes Gardens Associates Ltd A415 G 0.102 0.068 0.068 M<br />
Polk 3493 Bartow 98 Development Corp A415 G 0.125 0.116 0.116 M<br />
Polk 3675 Ow Hancock LLLP A415 G 0.187 0.136 0.136 M<br />
Polk 3731 Five Star Family Growers LLC A480 G 0.315 0.444 0.444 M<br />
Polk 3731 Five Star Family Growers LLC A480 S 0.000 0.444 0.444 M<br />
Polk 3734 Ben Hill Griffin, Inc. A415 G 0.156 0.168 0.168 M<br />
Polk 3735 LO Brothers Enterprises A415 G 0.342 0.325 0.325 M<br />
Polk 3747 James L Schmidt II Trustee of The FBJO Land Trust A415 G 0.000 0.131 0.131 M<br />
Polk 3806 Laura V Riche Trust A415 G 0.099 0.102 0.102 M<br />
Polk 3841 Sun Grown Citrus LP A415 G 0.010 0.310 0.310 M<br />
Polk 3842 Sun Grown Citrus LP A415 G 1.266 1.082 1.082 M<br />
Polk 3867 Ben Hill Griffin, Inc. A415 G 0.101 0.121 0.121 M<br />
Polk 3946 Ellingson Groves Inc A415 G 0.044 0.077 0.077 M<br />
Polk 3962 KMV Holding LLC A415 G 0.075 0.074 0.074 M<br />
Polk 3963 CBM Groves Inc. A415 G 0.027 0.100 0.100 M<br />
Polk 3966 LMC Backbone Grove LLC A415 G 0.063 0.079 0.079 M<br />
Polk 3972 Victor B Story Sr A415 G 0.061 0.096 0.096 M<br />
Polk 3984 John A Attaway Sr A415 G 0.119 0.072 0.072 M<br />
Polk 4002 J L Beck Tst of E W Beck Shelter A415 G 0.540 0.320 0.320 M<br />
Polk 4026 J LLC A415 G 0.039 0.097 0.097 M<br />
Polk 4045 Crocker‐Watson LLC A415 G 0.178 0.126 0.126 M<br />
M/E 5<br />
Page | 275
<strong>2011</strong> ESTIMATED WATER USE REPORT<br />
Table A7. Metered and <strong>Estimated</strong> Agricultural WUPs, Withdrawals and Permitted <strong>Use</strong> (mgd), <strong>2011</strong><br />
County<br />
WUP<br />
Number<br />
<strong>Southwest</strong> <strong>Florida</strong> <strong>Water</strong> <strong>Management</strong> District<br />
Permittee<br />
<strong>Use</strong><br />
Code 1<br />
Source 2<br />
Annual<br />
Average<br />
Pumpage 3<br />
Total<br />
Permitted<br />
Annual<br />
Average<br />
Quantity<br />
Permitted<br />
Quantity<br />
Attributed<br />
to AG <strong>Use</strong><br />
Category 4<br />
Polk 4073 W F Ward Residual Trust A415 S 0.000 0.086 0.086 M<br />
Polk 4074 Wards Nursery Inc A485 G 0.029 0.290 0.290 M<br />
Polk 4093 Ben Hill Griffin, Inc. A415 G 0.081 0.113 0.113 M<br />
Polk 4099 Rolling Meadow Ranch Inc A415 G 0.202 0.254 0.254 M<br />
Polk 4099 Rolling Meadow Ranch Inc A415 S 0.000 0.254 0.254 M<br />
Polk 4123 Wheeler Farms Inc A415 G 0.110 0.196 0.196 M<br />
Polk 4285 The Ridge Irrigation Cooperative A415 G 0.287 0.184 0.184 M<br />
Polk 4286 H2OM Grove Partners A415 G 0.132 0.096 0.096 M<br />
Polk 4301 Sun Grown Citrus LP A415 G 0.412 0.609 0.609 M<br />
Polk 4328 G Stead Groves Inc A415 G 0.104 0.128 0.128 M<br />
Polk 4331 Wheeler Farms Inc A415 G 0.592 0.415 0.415 M<br />
Polk 4341 Ben Hill Griffin, Inc. A415 G 0.064 0.077 0.077 M<br />
Polk 4345 Mixon Family Farm Inc A410 G 0.959 0.568 0.568 M<br />
Polk 4376 Alcoma Caretaking LLC A415 G 0.688 1.008 1.008 M<br />
Polk 4376 Alcoma Caretaking LLC A415 S 0.000 1.008 1.008 M<br />
Polk 4377 H R Baxter & Sons Enterprises A415 G 0.117 0.105 0.105 M<br />
Polk 4395 Dunson & Roels Inc A415 G 0.062 0.087 0.087 M<br />
Polk 4432 Hunt Bros Inc A415 G 0.235 0.217 0.217 M<br />
Polk 4497 Gapway Groves A415 G 0.176 0.169 0.169 M<br />
Polk 4516 Central Ridge Inc A415 G 0.188 0.142 0.142 M<br />
Polk 4532 Thomas Thayer Jr A415 G 0.079 0.092 0.092 M<br />
Polk 4558 Ben Hill Griffin, Inc. A415 G 0.347 0.357 0.357 M<br />
Polk 4558 Ben Hill Griffin, Inc. A415 S 0.011 0.357 0.357 M<br />
Polk 4559 Ben Hill Griffin, Inc. A415 G 0.774 1.226 1.226 M<br />
Polk 4560 Ben Hill Griffin, Inc. A415 G 0.249 0.395 0.395 M<br />
Polk 4563 Griffin Groves Inc A415 G 0.080 0.130 0.130 M<br />
Polk 4628 Dopler Groves Inc A415 G 0.056 0.105 0.105 M<br />
Polk 4629 Ronnies Citrus Inc A415 G 0.119 0.100 0.100 M<br />
Polk 4634 Hunt Bros Inc & CFM Inc & ENC Inc A415 G 0.155 0.115 0.115 M<br />
Polk 4810 Highland Sand LLC A415 G 0.573 0.420 0.420 M<br />
Polk 4811 LMC Backbone Grove LLC A415 G 0.507 0.719 0.719 M<br />
M/E 5<br />
Page | 276
<strong>2011</strong> ESTIMATED WATER USE REPORT<br />
Table A7. Metered and <strong>Estimated</strong> Agricultural WUPs, Withdrawals and Permitted <strong>Use</strong> (mgd), <strong>2011</strong><br />
County<br />
WUP<br />
Number<br />
<strong>Southwest</strong> <strong>Florida</strong> <strong>Water</strong> <strong>Management</strong> District<br />
Permittee<br />
<strong>Use</strong><br />
Code 1<br />
Source 2<br />
Annual<br />
Average<br />
Pumpage 3<br />
Total<br />
Permitted<br />
Annual<br />
Average<br />
Quantity<br />
Permitted<br />
Quantity<br />
Attributed<br />
to AG <strong>Use</strong><br />
Category 4<br />
Polk 4831 Durrance and Sons LLC A415 G 0.113 0.146 0.146 M<br />
Polk 5008 Alico Inc A415 G 0.121 0.231 0.231 M<br />
Polk 5010 Alico Inc A415 G 0.115 0.093 0.093 M<br />
Polk 5011 Alico Inc A415 G 0.114 0.320 0.320 M<br />
Polk 5013 Alico Inc A415 G 0.410 0.565 0.565 M<br />
Polk 5013 Alico Inc A415 S 0.090 0.565 0.565 M<br />
Polk 5014 Alico Inc A415 G 0.214 0.302 0.302 M<br />
Polk 5014 Alico Inc A415 S 0.035 0.302 0.302 M<br />
Polk 5015 Alico Inc A415 G 0.543 0.524 0.524 M<br />
Polk 5016 Alico Inc A415 G 0.069 0.285 0.285 M<br />
Polk 5016 Alico Inc A415 S 0.206 0.285 0.285 M<br />
Polk 5019 Alico Inc A415 G 0.308 0.335 0.335 M<br />
Polk 5062 Gardinier <strong>Florida</strong> Citrus, Inc. A415 G 0.228 0.307 0.307 M<br />
Polk 5063 Rolling Meadow Ranch Inc A415 G 0.166 0.172 0.172 M<br />
Polk 5086 Vonann Groves Inc A415 G 0.280 0.400 0.400 M<br />
Polk 5120 Sultenfuss Ltd Family LP A415 G 0.018 0.186 0.186 M<br />
Polk 5125 Baneway Groves Inc A415 G 0.052 0.081 0.081 M<br />
Polk 5130 Betty Jane Fulton & Betty Jane Fulton Trust A415 G 0.096 0.216 0.216 M<br />
Polk 5296 Ben Hill Griffin, Inc. A415 G 0.091 0.102 0.102 M<br />
Polk 5396 Crews Groves Inc & Mallory Enterprises Inc A415 G 0.302 0.242 0.242 M<br />
Polk 5414 Kahn Service A415 G 0.101 0.131 0.131 M<br />
Polk 5472 Hunt Bros Inc A415 G 0.222 0.116 0.116 M<br />
Polk 5476 Hunt Bros Service Inc A415 G 0.350 0.290 0.290 M<br />
Polk 5477 Hunt Bros Inc A415 G 0.125 0.181 0.181 M<br />
Polk 5481 Hunt Bros Inc A415 G 0.231 0.193 0.193 M<br />
Polk 5482 Hunt Bros Inc A415 G 0.358 0.278 0.278 M<br />
Polk 5486 Hunt Bros Inc A415 G 0.103 0.087 0.087 M<br />
Polk 5564 Robert C Crews II A415 G 0.059 0.074 0.074 M<br />
Polk 5571 Latt Maxcy Corp. A415 G 0.117 0.221 0.221 M<br />
Polk 5572 Latt Maxcy Corp. A415 G 0.110 0.143 0.143 M<br />
Polk 5584 Sun Grown Citrus LP A415 G 0.066 0.085 0.085 M<br />
M/E 5<br />
Page | 277
<strong>2011</strong> ESTIMATED WATER USE REPORT<br />
Table A7. Metered and <strong>Estimated</strong> Agricultural WUPs, Withdrawals and Permitted <strong>Use</strong> (mgd), <strong>2011</strong><br />
County<br />
WUP<br />
Number<br />
<strong>Southwest</strong> <strong>Florida</strong> <strong>Water</strong> <strong>Management</strong> District<br />
Permittee<br />
<strong>Use</strong><br />
Code 1<br />
Source 2<br />
Annual<br />
Average<br />
Pumpage 3<br />
Total<br />
Permitted<br />
Annual<br />
Average<br />
Quantity<br />
Permitted<br />
Quantity<br />
Attributed<br />
to AG <strong>Use</strong><br />
Category 4<br />
Polk 5629 Davis Enterprises Inc A415 G 0.217 0.142 0.142 M<br />
Polk 5635 Story Groves Inc A415 G 0.186 0.295 0.295 M<br />
Polk 5636 Griffin Family Ltd Partnership A415 G 0.125 0.191 0.191 M<br />
Polk 5654 Story Groves Inc A415 G 0.056 0.105 0.105 M<br />
Polk 5679 South Property Holdings, LLC A415 G 0.143 0.097 0.097 M<br />
Polk 5711 C. C. Calhoun, Inc. A415 G 0.081 0.107 0.107 M<br />
Polk 5739 R Tom Chapman Jr A415 G 0.076 0.091 0.091 M<br />
Polk 5823 Putnam Groves Inc A415 G 0.131 0.318 0.318 M<br />
Polk 5850 Hunt Bros Inc A415 G 0.388 0.302 0.302 M<br />
Polk 6026 7l Camp Mack LLC A415 G 0.931 1.448 1.448 M<br />
Polk 6068 Rolling Meadow Ranch Inc A415 G 0.878 1.433 1.433 M<br />
Polk 6128 Ben Hill Griffin, Inc. A415 G 0.008 0.313 0.006 M<br />
Polk 6268 Detour Studios Inc. attn: GBowen, LLC A415 G 0.045 0.145 0.145 M<br />
Polk 6278 M & V LLC A480 G 0.067 0.273 0.273 M<br />
Polk 6280 Hazel Brannen A415 G 0.032 0.092 0.092 M<br />
Polk 6344 Joe L Saunders A415 G 0.089 0.181 0.181 M<br />
Polk 6468 Robert G Stokes & Stokes Groves Inc A495 G 0.279 0.340 0.340 M<br />
Polk 6481 C Perry A415 G 0.081 0.120 0.120 M<br />
Polk 6558 Southern Citrus Nurseries Inc A415 G 0.021 0.261 0.261 M<br />
Polk 6624 City of Lake Alfred A415 G 0.020 1.381 0.028 M<br />
Polk 6670 Mosaic Fertilizer LLC A415 G 0.397 0.425 0.425 M<br />
Polk 6732 Holly Hill Fruit Products Co Inc A415 G 0.032 0.194 0.194 M<br />
Polk 6755 Chris & Minnie Ingram A415 G 0.000 0.159 0.159 M<br />
Polk 6878 Wheeler Farms Inc A415 G 0.084 0.077 0.077 M<br />
Polk 6890 Triple S Holdings Limited A415 G 0.077 0.136 0.136 M<br />
Polk 6995 Martin And Karen McKenna A415 G 0.090 0.137 0.137 M<br />
Polk 7024 Tastespire, Inc A415 G 0.136 0.110 0.110 M<br />
Polk 7136 Ken & Kay Family Ltd Partnership A415 G 0.116 0.151 0.151 M<br />
Deborah Sizemore‐ Trustee, WS Langford, JA Langford,<br />
G<br />
Polk 7176 LM Langford<br />
A415<br />
0.100 0.103 0.103<br />
M<br />
Polk 7197 Santrust Investment Properties A415 G 0.000 0.102 0.102 M<br />
M/E 5<br />
Page | 278
<strong>2011</strong> ESTIMATED WATER USE REPORT<br />
Table A7. Metered and <strong>Estimated</strong> Agricultural WUPs, Withdrawals and Permitted <strong>Use</strong> (mgd), <strong>2011</strong><br />
County<br />
WUP<br />
Number<br />
<strong>Southwest</strong> <strong>Florida</strong> <strong>Water</strong> <strong>Management</strong> District<br />
Permittee<br />
<strong>Use</strong><br />
Code 1<br />
Source 2<br />
Annual<br />
Average<br />
Pumpage 3<br />
Total<br />
Permitted<br />
Annual<br />
Average<br />
Quantity<br />
Permitted<br />
Quantity<br />
Attributed<br />
to AG <strong>Use</strong><br />
Category 4<br />
Polk 7199 South Orange Properties LLP A415 G 0.104 0.118 0.118 M<br />
Polk 7270 B & D LLC A415 G 0.106 0.277 0.277 M<br />
Polk 7375 Carson Futch A415 G 0.079 0.117 0.117 M<br />
Polk 7409 Princess Grove LLC A415 G 0.194 0.143 0.143 M<br />
Polk 7517 Brown Groves Inc A415 G 0.099 0.097 0.097 M<br />
Polk 7548 Jonathan Maxcy Inc A415 G 0.091 0.108 0.108 M<br />
Polk 7566 SR 544 LLC A415 G 0.042 0.163 0.163 M<br />
Polk 7570 Ambrose Grove LLC A415 G 0.090 0.102 0.102 M<br />
Polk 7573 Devane Citrus Inc A415 G 0.054 0.163 0.163 M<br />
Polk 7601 Davis E Fishback Jr Residuary Trust A415 G 0.010 0.072 0.072 M<br />
Polk 7668 Ben Hill Griffin, Inc. A415 G 0.253 0.300 0.300 M<br />
Polk 7670 LMC Backbone Grove, LLC A415 G 0.096 0.109 0.109 M<br />
Polk 7698 Ben Hill Griffin, Inc. A415 G 0.122 0.117 0.117 M<br />
Polk 7789 Elliott Investments LLC A490 G 0.053 0.182 0.182 M<br />
Polk 7791 W E Green & Sons Inc A495 G 0.025 0.125 0.125 M<br />
Polk 7796 Pat Wilson Inc A490 G 0.154 0.166 0.166 M<br />
Polk 7839 Griffin Family Ltd Partnership A415 G 0.096 0.097 0.097 M<br />
Polk 8096 Myers Groves, Inc. A415 G 0.162 0.232 0.232 M<br />
Polk 8098 Myers Groves, Inc. A415 G 0.223 0.307 0.307 M<br />
Polk 8099 Batista & Evelyn Madonia A56S G 0.083 0.499 0.499 M<br />
Polk 8143 VLI Family Limited Partnership A415 G 0.106 0.097 0.097 M<br />
Polk 8206 Hollis G Brannen A415 G 0.117 0.097 0.097 M<br />
Polk 8228 Jacob Groves Inc A415 G 0.110 0.226 0.226 M<br />
Polk 8263 Latt Maxcy Corp. A415 G 0.098 0.125 0.125 M<br />
Polk 8356 William M Kersey Living Trust A475 G 0.017 0.172 0.172 M<br />
Polk 8357 Thomas E. Davis A415 G 0.078 0.101 0.101 M<br />
Polk 8360 Lake Annie Groves LLC A415 G 0.122 0.166 0.166 M<br />
Polk 8367 Thomas E. Davis A415 G 0.120 0.097 0.097 M<br />
Polk 8645 Frances Drawdy L660 G 0.122 0.180 0.180 M<br />
Polk 8934 Ben Hill Griffin, Inc. A415 G 0.179 0.181 0.181 M<br />
Polk 8978 Victor B Story Sr A415 G 0.087 0.085 0.085 M<br />
M/E 5<br />
Page | 279
<strong>2011</strong> ESTIMATED WATER USE REPORT<br />
Table A7. Metered and <strong>Estimated</strong> Agricultural WUPs, Withdrawals and Permitted <strong>Use</strong> (mgd), <strong>2011</strong><br />
County<br />
WUP<br />
Number<br />
<strong>Southwest</strong> <strong>Florida</strong> <strong>Water</strong> <strong>Management</strong> District<br />
Permittee<br />
<strong>Use</strong><br />
Code 1<br />
Source 2<br />
Annual<br />
Average<br />
Pumpage 3<br />
Total<br />
Permitted<br />
Annual<br />
Average<br />
Quantity<br />
Permitted<br />
Quantity<br />
Attributed<br />
to AG <strong>Use</strong><br />
Category 4<br />
Polk 9192 Bowen Bros Inc A415 G 0.383 0.162 0.162 M<br />
Polk 9419 Alico Inc A415 G 0.169 0.531 0.531 M<br />
Polk 9419 Alico Inc A415 S 0.439 0.531 0.531 M<br />
Polk 9704 Walter William Investment Company A415 G 0.120 0.216 0.216 M<br />
Polk 9704 Walter William Investment Company A415 S 0.166 0.216 0.216 M<br />
Polk 9806 Lake Hancock Partners LLLP A415 G 0.113 0.117 0.117 M<br />
Polk 9864 J Everett Allen & Sons Inc A415 G 0.000 0.091 0.091 M<br />
Polk 10096 Twenty Twenty Groves Inc A415 G 0.404 0.626 0.626 M<br />
Polk 10598 Quality LC A525 G 0.302 0.392 0.392 M<br />
Polk 11031 Growers Investment Group LLC A415 G 0.236 0.125 0.125 M<br />
Polk 11152 Holly Hill Fruit Products Co Inc A415 G 0.010 0.039 0.039 M<br />
Polk 11161 Ridge Investments LLC A415 G 0.092 0.096 0.096 M<br />
Polk 11163 Emil Jahna A415 G 0.122 0.101 0.101 M<br />
Polk 11176 Rocker Farms Inc A415 G 0.062 0.077 0.077 M<br />
Rolling Meadow Groves Limited And Rolling Meadow<br />
G<br />
Polk 11219 Ranch Inc<br />
A415<br />
0.314 0.565 0.565<br />
M<br />
Polk 11229 Griffin Family Ltd Partnership A415 G 0.110 0.113 0.113 M<br />
Polk 11297 Lake Isabell Partners A415 G 0.193 0.153 0.153 M<br />
Polk 11361 R G Sullivan Inc A415 G 0.077 0.075 0.075 M<br />
Polk 11377 Daniel A Norris Sr & Carolyn A Norris A415 G 0.101 0.097 0.097 M<br />
Polk 11437 Putnam Groves Inc A415 G 0.059 0.108 0.108 M<br />
Polk 11630 Victor Story Estate‐Story Citrus Inc & Story Groves Inc A415 G 0.110 0.144 0.144 M<br />
Polk 11693 City of Lakeland Parks & Recreation Department A485 G 0.008 0.176 0.017 M<br />
Polk 11704 Ruthven I‐4 LLC A525 G 0.000 0.205 0.205 M<br />
Polk 11843 Family Acres Inc A415 G 0.117 0.162 0.162 M<br />
Polk 11843 Family Acres Inc A415 S 0.012 0.162 0.162 M<br />
Polk 11867 Alico Inc A415 G 0.094 0.084 0.084 M<br />
Polk 12060 Bowlegs Creek LLC A415 G 0.128 0.185 0.185 M<br />
Polk 12061 Hunt Bros Inc A415 G 0.121 0.082 0.082 M<br />
Polk 12232 Citrosuco North America A415 G 0.266 1.251 0.247 M<br />
Polk 12392 PH Citrus LLC A415 G 1.187 0.958 0.958 M<br />
M/E 5<br />
Page | 280
<strong>2011</strong> ESTIMATED WATER USE REPORT<br />
Table A7. Metered and <strong>Estimated</strong> Agricultural WUPs, Withdrawals and Permitted <strong>Use</strong> (mgd), <strong>2011</strong><br />
County<br />
WUP<br />
Number<br />
<strong>Southwest</strong> <strong>Florida</strong> <strong>Water</strong> <strong>Management</strong> District<br />
Permittee<br />
<strong>Use</strong><br />
Code 1<br />
Source 2<br />
Annual<br />
Average<br />
Pumpage 3<br />
Total<br />
Permitted<br />
Annual<br />
Average<br />
Quantity<br />
Permitted<br />
Quantity<br />
Attributed<br />
to AG <strong>Use</strong><br />
Category 4<br />
Polk 12488 Jack P James Jr A525 G 0.118 0.151 0.151 M<br />
Polk 12504 DGB Properties Inc A415 G 0.002 0.116 0.116 M<br />
Polk 12510 80 Ft Rd, LLC A415 G 0.286 0.336 0.336 M<br />
Polk 12637 Wheeler Farms Inc A415 G 0.167 0.139 0.139 M<br />
Polk 12763 Cemex Const Materials <strong>Florida</strong> A415 G 0.449 0.767 0.767 M<br />
Polk 12782 Standard Sand & Silica Company Timothy Carnes A415 G 0.363 0.493 0.493 M<br />
Polk 12782 Standard Sand & Silica Company Timothy Carnes A415 S 0.098 0.493 0.493 M<br />
Polk 12792 Quality Turf Nursery A525 G 0.058 0.198 0.198 M<br />
Polk 12867 Clear Springs Enterprises LLC A410 G 0.608 0.908 0.908 M<br />
Polk 12890 Wise Seed Co Inc A415 G 0.228 0.168 0.168 M<br />
Polk 13018 Alico Inc A470 G 0.000 0.243 0.243 M<br />
Polk 13062 Sun Grown Citrus LP A415 G 0.175 0.261 0.261 M<br />
Polk 13084 South Property Holdings LLC A415 G 0.132 0.112 0.112 M<br />
Polk 13201 Bowen Brothers Inc A415 G 0.132 0.079 0.079 M<br />
Polk 42 Lake Dell Properties LLC A415 G 0.008 0.013 0.013 E<br />
Polk 54 Tree‐O Groves Inc A415 G 0.015 0.05 0.05 E<br />
Polk 60 Leland Young A415 G 0.02 0.033 0.033 E<br />
Polk 61 Dicks Partnership A415 G 0.024 0.039 0.039 E<br />
Polk 62 Dorothy E Harley A415 G 0.045 0.062 0.062 E<br />
Polk 72 Orangedale Farms Inc A415 G 0.028 0.046 0.046 E<br />
Polk 80 Bailey Groves Inc A415 G 0.007 0.012 0.012 E<br />
Polk 118 Patrick Groves Inc A415 G 0.042 0.058 0.058 E<br />
Polk 133 Edwards Fruit Company A415 G 0.017 0.028 0.028 E<br />
Polk 136 W H Stuart Ranch L610 G 0.001 0.001 0.001 E<br />
Polk 141 <strong>Florida</strong> Dept Of Ag & Consumer Services A415 G 0.009 0.014 0.014 E<br />
Polk 142 <strong>Florida</strong> Dept Of Ag & Consumer Services A415 G 0.002 0.003 0.003 E<br />
Polk 146 Tina Black Rushing A415 G 0.007 0.012 0.012 E<br />
Polk 172 Co‐Operative Fruit Co Inc A415 G 0.041 0.06 0.06 E<br />
Polk 173 Oak Knoll Ranch Inc A495 G 0.028 0.045 0.045 E<br />
Polk 175 Clay Road Groves, LLC A415 G 0.018 0.03 0.03 E<br />
Polk 186 Louise W Moore Family Trust A415 G 0.023 0.038 0.038 E<br />
M/E 5<br />
Page | 281
<strong>2011</strong> ESTIMATED WATER USE REPORT<br />
Table A7. Metered and <strong>Estimated</strong> Agricultural WUPs, Withdrawals and Permitted <strong>Use</strong> (mgd), <strong>2011</strong><br />
County<br />
WUP<br />
Number<br />
<strong>Southwest</strong> <strong>Florida</strong> <strong>Water</strong> <strong>Management</strong> District<br />
Permittee<br />
<strong>Use</strong><br />
Code 1<br />
Source 2<br />
Annual<br />
Average<br />
Pumpage 3<br />
Total<br />
Permitted<br />
Annual<br />
Average<br />
Quantity<br />
Permitted<br />
Quantity<br />
Attributed<br />
to AG <strong>Use</strong><br />
Category 4<br />
Polk 187 Story Groves Inc A415 G 0.028 0.046 0.046 E<br />
Polk 211 William III & Elizabeth L Putnam A415 G 0.011 0.017 0.017 E<br />
Polk 224 Michael Behnke A480 G 0.035 0.052 0.052 E<br />
Polk 230 Putnam Groves Inc A415 G 0.05 0.07 0.07 E<br />
Polk 233 Scim Inc A490 G 0.036 0.059 0.059 E<br />
Polk 234 Bereah Groves, LLC A415 G 0.029 0.048 0.048 E<br />
Polk 248 The Hart Lands Development, LLC A415 G 0.028 0.045 0.045 E<br />
Polk 256 Roger & Denise Haag A415 G 0.011 0.018 0.018 E<br />
Polk 275 Carl M Huntsberger A415 G 0.005 0.008 0.008 E<br />
Polk 282 Leonas Dicks A415 G 0.019 0.031 0.031 E<br />
Polk 304 Ernest Breton Jr & Phillip Cooper A425 S 0.029 0.048 0.048 E<br />
Polk 306 Donal Joe & Elaine K Brown A415 G 0.007 0.011 0.011 E<br />
Polk 307 Eric C Hinshaw A415 G 0.007 0.012 0.012 E<br />
Polk 311 C & H Citrus LLC a <strong>Florida</strong> Ltd Liability Co A415 G 0.045 0.062 0.062 E<br />
Polk 314 Lm Properties Of Polk Co Inc A415 G 0.015 0.024 0.024 E<br />
Polk 315 Waverly Growers Cooperative A415 G 0.013 0.022 0.022 E<br />
Polk 319 Atlee Davis A415 G 0.022 0.037 0.037 E<br />
Polk 335 Greenwood Family Ltd Ptnship A490 G 0.024 0.04 0.04 E<br />
Polk 345 Richard A Schutt A415 G 0.019 0.032 0.032 E<br />
Polk 367 Esms Enterprises Ltd A415 G 0.051 0.071 0.071 E<br />
Polk 386 Cynthia T McCaleb, Gloria T Goss, Shelby B McCaleb III A491 G 0.046 0.064 0.064 E<br />
Polk 387 Kard Properties A415 G 0.024 0.039 0.039 E<br />
392 Winston Grove Corp Perch Lake & Grove Corp & Airport A415<br />
0.028 0.046 0.046<br />
G<br />
Polk<br />
Grove<br />
E<br />
Polk 394 PH Citrus LLC A415 G 0.025 0.041 0.041 E<br />
Polk 395 D. Edward Dickinson And Elise Bonwit Dickinson A415 G 0.012 0.041 0.041 E<br />
Polk 397 J.K. Wilson A410 G 0.006 0.009 0.009 E<br />
Polk 400 Don Ruster & Barbara Jean Ruster A415 G 0.014 0.023 0.023 E<br />
Polk 402 Anthony T & Frances A Rosa A415 G 0.005 0.008 0.008 E<br />
Polk 407 J Henry Groves Inc A415 G 0.019 0.031 0.031 E<br />
Polk 414 Bessie Hancock A415 G 0.006 0.01 0.01 E<br />
M/E 5<br />
Page | 282
<strong>2011</strong> ESTIMATED WATER USE REPORT<br />
Table A7. Metered and <strong>Estimated</strong> Agricultural WUPs, Withdrawals and Permitted <strong>Use</strong> (mgd), <strong>2011</strong><br />
County<br />
WUP<br />
Number<br />
<strong>Southwest</strong> <strong>Florida</strong> <strong>Water</strong> <strong>Management</strong> District<br />
Permittee<br />
<strong>Use</strong><br />
Code 1<br />
Source 2<br />
Annual<br />
Average<br />
Pumpage 3<br />
Total<br />
Permitted<br />
Annual<br />
Average<br />
Quantity<br />
Permitted<br />
Quantity<br />
Attributed<br />
to AG <strong>Use</strong><br />
Category 4<br />
Polk 416 Jane Ellis Rogers A415 G 0.014 0.023 0.023 E<br />
Polk 420 Nelson & Connie Groves Inc & Ann Workman A415 G 0.025 0.04 0.04 E<br />
Polk 421 Walton N Crews Jr A415 G 0.019 0.031 0.031 E<br />
Polk 424 Story Citrus Inc A415 G 0.018 0.029 0.029 E<br />
Polk 428 N L Black A415 G 0.018 0.029 0.029 E<br />
Polk 430 Story Groves Inc A415 G 0.061 0.11 0.11 E<br />
Polk 431 Stenger Grove Service Inc A415 G 0.02 0.033 0.033 E<br />
Polk 437 Alico‐Agri Ltd A415 G 0.042 0.058 0.058 E<br />
Polk 445 Challis Marshall Inc & Ricky Ray Marshall A415 G 0.009 0.029 0.029 E<br />
Polk 463 Gresham Farms Development A415 G 0.037 0.051 0.051 E<br />
Polk 464 The Montesco Group, LLC A415 G 0.065 0.119 0.119 E<br />
Polk 474 Haines City Citrus Growers Assoc A415 G 0.028 0.046 0.046 E<br />
511 Ronald & Denise Clark & Lawrence W Anita & Lawrence A415<br />
0.009 0.016 0.016<br />
Polk<br />
T Maxwell<br />
G<br />
E<br />
Polk 512 Stephen K Hollister A415 G 0.056 0.077 0.077 E<br />
Polk 516 Kermit C & Joy C Sims A415 G 0.005 0.008 0.008 E<br />
Polk 532 Thomas L & Gwindolyn West A415 G 0.006 0.01 0.01 E<br />
Polk 546 Walter E & Sharon D Bigbie A415 G 0.012 0.02 0.02 E<br />
Polk 548 Gerald E Baker A410 G 0.003 0.005 0.005 E<br />
Polk 552 Walker Groves Inc A415 G 0.012 0.02 0.02 E<br />
Polk 574 Juan Ulloa A460 G 0 0.001 0.001 E<br />
Polk 581 Fred <strong>Water</strong>s A415 G 0.01 0.016 0.016 E<br />
Polk 587 Dave Lynn A415 G 0.001 0.024 0.002 E<br />
Polk 601 Dicks Partnership A415 G 0.03 0.049 0.049 E<br />
Polk 607 Alvin F Barfield A415 G 0.006 0.01 0.01 E<br />
Polk 613 O M Richardson A415 G 0.005 0.009 0.009 E<br />
621 Dennis & Richard Dicks, David Dicks Family Trust & A415<br />
0.038 0.053 0.053<br />
Polk<br />
Dicks Patrn<br />
G<br />
E<br />
Polk 622 Henry Groves Inc A415 G 0.03 0.048 0.048 E<br />
Polk 625 Richard Wright A415 G 0.015 0.024 0.024 E<br />
Polk 626 Co‐Operative Fruit Co Inc A415 G 0.015 0.025 0.025 E<br />
M/E 5<br />
Page | 283
<strong>2011</strong> ESTIMATED WATER USE REPORT<br />
Table A7. Metered and <strong>Estimated</strong> Agricultural WUPs, Withdrawals and Permitted <strong>Use</strong> (mgd), <strong>2011</strong><br />
County<br />
WUP<br />
Number<br />
<strong>Southwest</strong> <strong>Florida</strong> <strong>Water</strong> <strong>Management</strong> District<br />
Permittee<br />
<strong>Use</strong><br />
Code 1<br />
Source 2<br />
Annual<br />
Average<br />
Pumpage 3<br />
Total<br />
Permitted<br />
Annual<br />
Average<br />
Quantity<br />
Permitted<br />
Quantity<br />
Attributed<br />
to AG <strong>Use</strong><br />
Category 4<br />
Polk 632 Jack Watkins A415 G 0.01 0.022 0.022 E<br />
Polk 671 Thomas A Thayer Sr A415 G 0.019 0.031 0.031 E<br />
Polk 672 Arnold J Spanjers A415 G 0.004 0.006 0.006 E<br />
Polk 684 Robert M Baird A415 G 0.008 0.013 0.013 E<br />
Polk 685 Hart Cove LLC A415 G 0.024 0.04 0.04 E<br />
Polk 691 John Wright A415 G 0.002 0.004 0.004 E<br />
Polk 693 Putnam Groves Inc A415 G 0.017 0.028 0.028 E<br />
Polk 700 Robert H & Donna Muller A415 G 0.008 0.013 0.013 E<br />
Polk 701 Virginia Draudt & the Estate of Robert Draudt A415 G 0.004 0.007 0.007 E<br />
Polk 713 Ridge Pallets Inc A415 G 0.003 0.034 0.007 E<br />
Polk 726 John C Sr & John C Barnett Jr A415 G 0.018 0.029 0.029 E<br />
Polk 737 Stenger Grove Service Inc A415 G 0.024 0.039 0.039 E<br />
Polk 738 Stenger Bros Grove A415 G 0.012 0.038 0.038 E<br />
Polk 740 Earl V & Eloise H Ethridge A415 G 0.008 0.014 0.014 E<br />
Polk 744 Dicks Partnership A415 G 0.01 0.017 0.017 E<br />
Polk 745 C E Gidder Inc A415 G 0.022 0.035 0.035 E<br />
Polk 757 Dicks Partnership A415 G 0.019 0.032 0.032 E<br />
Polk 758 Malcolm Brent Burris A415 G 0.051 0.073 0.073 E<br />
Polk 761 Mary C Werner A415 G 0.019 0.031 0.031 E<br />
Polk 767 Bishop Of The Diocese Of Orlando A415 G 0.011 0.018 0.018 E<br />
Polk 792 Marjorie H Roe A415 G 0.011 0.022 0.018 E<br />
Polk 794 Duke Groves A415 G 0.018 0.03 0.03 E<br />
Polk 800 George W Gentry A535 G 0.023 0.037 0.037 E<br />
Polk 803 Mahamad and Zaheer Gulmahamad A415 G 0.012 0.02 0.02 E<br />
Polk 806 Preserve At Auburndale LLC A415 G 0.017 0.029 0.029 E<br />
Polk 814 EOL INC A415 G 0.004 0.006 0.006 E<br />
Polk 818 L Dicks, Inc. A415 G 0.006 0.01 0.01 E<br />
Polk 820 Annette P Thompson A415 G 0.026 0.043 0.043 E<br />
Polk 822 Danny P & Cara A Sadler A415 G 0.007 0.012 0.012 E<br />
Polk 823 TBM General Partnership A415 G 0.038 0.053 0.053 E<br />
Polk 824 Patrick M & Pamela K Richart A415 G 0.022 0.036 0.036 E<br />
M/E 5<br />
Page | 284
<strong>2011</strong> ESTIMATED WATER USE REPORT<br />
Table A7. Metered and <strong>Estimated</strong> Agricultural WUPs, Withdrawals and Permitted <strong>Use</strong> (mgd), <strong>2011</strong><br />
County<br />
WUP<br />
Number<br />
<strong>Southwest</strong> <strong>Florida</strong> <strong>Water</strong> <strong>Management</strong> District<br />
Permittee<br />
<strong>Use</strong><br />
Code 1<br />
Source 2<br />
Annual<br />
Average<br />
Pumpage 3<br />
Total<br />
Permitted<br />
Annual<br />
Average<br />
Quantity<br />
Permitted<br />
Quantity<br />
Attributed<br />
to AG <strong>Use</strong><br />
Category 4<br />
Polk 825 C C Calhoun Inc A415 G 0.027 0.044 0.044 E<br />
Polk 829 Atlas Business Assoc Ltd A415 G 0.012 0.044 0.044 E<br />
Polk 849 Carol J & Hoyt R Barnett, Trustees A460 G 0.016 0.027 0.027 E<br />
Polk 856 Sharrett Land LLC A415 G 0.009 0.015 0.015 E<br />
Polk 860 Winter Haven Nurseries A480 G 0.017 0.038 0.038 E<br />
Polk 860 Winter Haven Nurseries A480 S 0 0.038 0.038 E<br />
Polk 867 John C Barnett Sr & John C Barnett Jr A415 G 0.012 0.02 0.02 E<br />
Polk 869 James Ruhl Best A490 G 0.024 0.039 0.039 E<br />
Polk 874 Edna June Black A415 G 0.007 0.012 0.012 E<br />
Polk 926 William E Hillard A415 G 0.026 0.043 0.043 E<br />
Polk 934 Highlands Citrus Inc A415 G 0.009 0.015 0.015 E<br />
Polk 935 Norman L & Phyllis V Black A415 G 0.023 0.037 0.037 E<br />
Polk 937 Bruce R Jacob A415 G 0.012 0.02 0.02 E<br />
Polk 938 PH Citrus LLC A415 G 0.022 0.036 0.036 E<br />
Polk 941 Marshall Hampton Trust A490 G 0.071 0.098 0.098 E<br />
Polk 943 Lynn & Leigh Hampton A490 G 0.031 0.083 0.083 E<br />
Polk 943 Lynn & Leigh Hampton A490 S 0.024 0.083 0.083 E<br />
Polk 945 Stenger Grove Service Inc A415 G 0.012 0.019 0.019 E<br />
Polk 951 John C Barnett Sr & John C Barnett Jr A415 G 0.028 0.045 0.045 E<br />
Polk 952 Danny E Sr & Rebecca A Howze A415 G 0.007 0.011 0.011 E<br />
Polk 954 Robert C & Robin E Abbott A415 G 0.038 0.062 0.062 E<br />
Polk 963 Gapway Groves A415 G 0.088 0.16 0.16 E<br />
Polk 974 E W Farrer A415 G 0.009 0.015 0.015 E<br />
Polk 977 Lucille E Reese Trust, LLC A415 G 0.011 0.019 0.019 E<br />
Polk 1003 Bcw Groves Inc A415 G 0.01 0.017 0.017 E<br />
Polk 1004 Polk Nursery Company Inc A480 G 0.056 0.083 0.083 E<br />
Polk 1005 Polk Nursery Company Inc A480 G 0.044 0.072 0.072 E<br />
Polk 1010 Bomber Road Of Polk County LLC A415 G 0.037 0.051 0.051 E<br />
Polk 1037 Bentley‐Edward Groves A415 G 0.017 0.027 0.027 E<br />
Polk 1038 Tillis & Sons Inc A415 G 0.018 0.029 0.029 E<br />
Polk 1054 CDA Citrus LLC A415 G 0.012 0.02 0.02 E<br />
M/E 5<br />
Page | 285
<strong>2011</strong> ESTIMATED WATER USE REPORT<br />
Table A7. Metered and <strong>Estimated</strong> Agricultural WUPs, Withdrawals and Permitted <strong>Use</strong> (mgd), <strong>2011</strong><br />
County<br />
WUP<br />
Number<br />
Permittee<br />
Polk 1055 Cooperative Ventures LLC A415 G 0.016 0.026 0.026 E<br />
Polk 1086 Berry Groves Inc A415 G 0.042 0.058 0.058 E<br />
Polk 1087 Meridian Land Holdings LLC A415 G 0.067 0.121 0.121 E<br />
Polk 1095 Leonas Dicks A415 G 0.005 0.009 0.009 E<br />
Polk 1099 Stephens 4 INC A415 G 0.014 0.044 0.044 E<br />
Polk 1106 Charles R & SUSAn E Lanier A415 G 0.043 0.059 0.059 E<br />
Polk 1111 Thomas E Wales A415 G 0.022 0.036 0.036 E<br />
Polk 1128 Bowlegs Creek Groves LLC A415 G 0.049 0.068 0.068 E<br />
Polk 1141 Floyd Sr & Joyce Devane As Trustees A415 G 0.047 0.064 0.064 E<br />
Polk 1150 Weita Roderick A415 G 0.007 0.011 0.011 E<br />
Polk 1159 Phyllis V Albritton Evelyn V Farr A415 G 0.018 0.029 0.029 E<br />
Polk 1160 Lake Enderly Grove ,LLC A415 G 0.006 0.01 0.01 E<br />
Polk 1163 Rod R Sweet A415 G 0.043 0.059 0.059 E<br />
Polk 1173 Donnie G Alford As Trustee Of The Donnie G Alford Tr A415 S 0.01 0.017 0.017 E<br />
Polk 1178 Barbara Rohde A415 G 0.013 0.022 0.022 E<br />
Polk 1179 Lago Properties LLC A415 G 0.004 0.007 0.007 E<br />
Polk 1182 Donald Burton Stokes A415 G 0.006 0.01 0.01 E<br />
Polk 1196 City of Auburndale A415 G 0.02 0.033 0.033 E<br />
Polk 1197 Ark Industries Inc A415 G 0.03 0.05 0.05 E<br />
Polk 1205 Gapway Groves A415 G 0.047 0.065 0.065 E<br />
Polk 1206 Donald W & Ronald K Wright A415 G 0.006 0.009 0.009 E<br />
Polk 1208 R G Reynolds & Eleanor Henderson A415 G 0.03 0.049 0.049 E<br />
Polk 1212 Louise W Moore Family Trust A415 G 0.008 0.013 0.013 E<br />
Polk 1213 Eighty Foot Groves A415 G 0.038 0.052 0.052 E<br />
Polk 1216 James E Giles A410 G 0.008 0.014 0.014 E<br />
Polk 1218 Devane Groves Inc A415 G 0.04 0.065 0.065 E<br />
Polk 1219 Floyd Sr & Joyce Devane As Trust A415 G 0.012 0.019 0.019 E<br />
Polk 1220 Devane Citrus Inc A415 G 0.017 0.029 0.029 E<br />
Polk 1226 S Jarvis & Shelia P Hart A415 G 0.012 0.019 0.019 E<br />
Polk 1229 Lake Hancock Partners LLLP A415 G 0.024 0.039 0.039 E<br />
Polk 1231 J Ragon Barnett Jr & J Ragon Barnett III A415 G 0.011 0.017 0.017 E<br />
Page | 286<br />
<strong>Southwest</strong> <strong>Florida</strong> <strong>Water</strong> <strong>Management</strong> District<br />
<strong>Use</strong><br />
Code 1<br />
Source 2<br />
Annual<br />
Average<br />
Pumpage 3<br />
Total<br />
Permitted<br />
Annual<br />
Average<br />
Quantity<br />
Permitted<br />
Quantity<br />
Attributed<br />
to AG <strong>Use</strong><br />
Category 4<br />
M/E 5
<strong>2011</strong> ESTIMATED WATER USE REPORT<br />
Table A7. Metered and <strong>Estimated</strong> Agricultural WUPs, Withdrawals and Permitted <strong>Use</strong> (mgd), <strong>2011</strong><br />
County<br />
WUP<br />
Number<br />
Permittee<br />
Polk 1236 Richards Restaurants, Inc. A415 G 0.005 0.029 0.029 E<br />
Polk 1241 Thomas A Thayer Sr A415 G 0.017 0.028 0.028 E<br />
Polk 1252 Lynchburg Groves A415 G 0.134 0.243 0.243 E<br />
Polk 1261 Fairy Development Llc Duane Mcquillen A415 G 0.022 0.035 0.035 E<br />
Polk 1265 Kadu LLC A415 G 0.038 0.053 0.053 E<br />
Polk 1279 C L Bundy & Son Inc A415 G 0.018 0.03 0.03 E<br />
Polk 1286 Oscar W Rogers Trustee Of Oscar W Rogers Liv Trst A415 G 0.015 0.025 0.025 E<br />
Polk 1288 James Gold A415 G 0.003 0.007 0.005 E<br />
Polk 1301 Oscar W As Trustee C D Rogers W T & J S Rogers A415 G 0.007 0.011 0.011 E<br />
Polk 1313 Gapway Groves A415 G 0.006 0.009 0.009 E<br />
Polk 1315 Connie Vee Kelly Living Trust A415 G 0.036 0.06 0.06 E<br />
Polk 1328 J H Dickinson Groves Inc A415 G 0.027 0.044 0.044 E<br />
Polk 1329 J K Stuart Properties LLC A415 G 0 0.034 0.034 E<br />
Polk 1330 J K Stuart Properties LLC L600 G 0.004 0.006 0.006 E<br />
Polk 1331 Robert G Stokes A415 G 0.011 0.019 0.019 E<br />
Polk 1343 Edwin D Mercer A415 G 0.008 0.014 0.014 E<br />
Polk 1344 Brent Monk Trustee Of The Brent Monk Rev Living Trst A415 G 0.009 0.014 0.014 E<br />
1348 Oscar W Rogers Trustee Of The O W Rogers Living Tr & A415<br />
0.008 0.014 0.014<br />
Polk<br />
C D Rogers<br />
G<br />
E<br />
Polk 1352 Leslie W Dunson Jr A415 G 0.016 0.027 0.027 E<br />
Polk 1355 Mark Shabla A415 G 0.008 0.022 0.022 E<br />
Polk 1355 Mark Shabla A415 S 0.006 0.022 0.022 E<br />
Polk 1356 Apac‐Georgia Inc A415 G 0.074 0.5 0.343 E<br />
Polk 1356 Apac‐Georgia Inc A415 S 0 0.5 0.343 E<br />
Polk 1360 Christopher & Mary Stricklen A415 G 0.023 0.038 0.038 E<br />
Polk 1396 Alan R Hart A415 G 0.022 0.036 0.036 E<br />
Polk 1422 Walter L Brewer & Lynn D Horne Jr A415 G 0.027 0.044 0.044 E<br />
Polk 1423 Robert L & Cathy J Lewis A415 G 0.038 0.053 0.053 E<br />
Polk 1427 Stephens 4 Inc A415 G 0.021 0.04 0.04 E<br />
Polk 1428 Ladon J Jones III A415 G 0.014 0.022 0.022 E<br />
Polk 1435 Delia V Drohan&Est Of B S Varn A415 G 0.024 0.04 0.04 E<br />
Page | 287<br />
<strong>Southwest</strong> <strong>Florida</strong> <strong>Water</strong> <strong>Management</strong> District<br />
<strong>Use</strong><br />
Code 1<br />
Source 2<br />
Annual<br />
Average<br />
Pumpage 3<br />
Total<br />
Permitted<br />
Annual<br />
Average<br />
Quantity<br />
Permitted<br />
Quantity<br />
Attributed<br />
to AG <strong>Use</strong><br />
Category 4<br />
M/E 5
<strong>2011</strong> ESTIMATED WATER USE REPORT<br />
Table A7. Metered and <strong>Estimated</strong> Agricultural WUPs, Withdrawals and Permitted <strong>Use</strong> (mgd), <strong>2011</strong><br />
County<br />
WUP<br />
Number<br />
<strong>Southwest</strong> <strong>Florida</strong> <strong>Water</strong> <strong>Management</strong> District<br />
Permittee<br />
<strong>Use</strong><br />
Code 1<br />
Source 2<br />
Annual<br />
Average<br />
Pumpage 3<br />
Total<br />
Permitted<br />
Annual<br />
Average<br />
Quantity<br />
Permitted<br />
Quantity<br />
Attributed<br />
to AG <strong>Use</strong><br />
Category 4<br />
Polk 1459 Donnie G Alford As Trustee Of The Donnie G Alford Tr A415 G 0.024 0.04 0.04 E<br />
Polk 1470 Francis & Sunya Jacobs L610 G 0.001 0.001 0.001 E<br />
Polk 1496 Tree‐O Groves Inc A415 G 0.248 0.345 0.345 E<br />
Polk 1505 Alturas Real Properties LLC A415 G 0.012 0.019 0.019 E<br />
Polk 1506 John S Langford A415 G 0.009 0.015 0.015 E<br />
Polk 1508 Varner Marketing Company A415 G 0.016 0.027 0.027 E<br />
Polk 1509 Kevin E Varner Varner Marketing Co A415 G 0.021 0.035 0.035 E<br />
Polk 1514 Harriett S Wheaton As Tr Of The H S Wheaton Rev Tr A415 G 0.016 0.026 0.026 E<br />
Polk 1515 John C Sr & John C Barnett Jr A415 G 0.016 0.027 0.027 E<br />
Polk 1523 Angel Islands A415 G 0.031 0.051 0.051 E<br />
Polk 1525 Gapway Groves A415 G 0.029 0.048 0.048 E<br />
Polk 1528 Tunno Groves, LLC A415 G 0.008 0.012 0.012 E<br />
Polk 1537 Joel T Butler A58S G 0.004 0.013 0.013 E<br />
Polk 1542 Stenger Grove Service Inc A415 G 0.024 0.039 0.039 E<br />
Polk 1552 Walter E & Sharon D Bigbie A415 G 0.01 0.016 0.016 E<br />
Polk 1566 Peace River Packing Company, Inc. A415 G 0.012 0.019 0.019 E<br />
Polk 1567 Peace River Packing Company, Inc. A415 G 0.012 0.019 0.019 E<br />
Polk 1582 Victor B Story Sr A415 G 0.006 0.01 0.01 E<br />
Polk 1586 Brian J & Cathleen Connolly A415 G 0.006 0.01 0.01 E<br />
Polk 1591 Donald H Wilson Jr, Trustee A415 G 0.012 0.019 0.019 E<br />
Polk 1592 Walter Manley A415 S 0.018 0.029 0.029 E<br />
Polk 1601 Jason B Devane A415 G 0.006 0.009 0.009 E<br />
1602 William G Weyand Trustee Of The William G Weyand A415<br />
0.001 0.002 0.002<br />
Polk<br />
Revocable Trust<br />
G<br />
E<br />
Polk 1603 South Property Holdings LLC A415 G 0.014 0.024 0.024 E<br />
Polk 1615 Adams & Adams Inc A415 G 0.023 0.038 0.038 E<br />
1618 Thomas J & Karen M Bryant And Thomas W & Nancy G A415<br />
0.024 0.039 0.039<br />
G<br />
Polk<br />
Oswalt<br />
E<br />
Polk 1632 Ruby Lake Development LLC A415 G 0.022 0.036 0.036 E<br />
Polk 1656 Hubert L Johnson Jr A415 G 0.012 0.019 0.019 E<br />
Polk 1657 McMullen Childrens Trust A415 G 0.013 0.021 0.021 E<br />
M/E 5<br />
Page | 288
<strong>2011</strong> ESTIMATED WATER USE REPORT<br />
Table A7. Metered and <strong>Estimated</strong> Agricultural WUPs, Withdrawals and Permitted <strong>Use</strong> (mgd), <strong>2011</strong><br />
County<br />
WUP<br />
Number<br />
<strong>Southwest</strong> <strong>Florida</strong> <strong>Water</strong> <strong>Management</strong> District<br />
Permittee<br />
<strong>Use</strong><br />
Code 1<br />
Source 2<br />
Annual<br />
Average<br />
Pumpage 3<br />
Total<br />
Permitted<br />
Annual<br />
Average<br />
Quantity<br />
Permitted<br />
Quantity<br />
Attributed<br />
to AG <strong>Use</strong><br />
Category 4<br />
Polk 1658 Lawrence Dimmitt A415 S 0.026 0.042 0.042 E<br />
Polk 1659 Leland Young A415 G 0.02 0.032 0.032 E<br />
Polk 1660 The North Forty Grove Corp., Inc . A415 G 0.024 0.039 0.039 E<br />
Polk 1661 Lake Enderly Grove ,LLC A415 G 0.047 0.065 0.065 E<br />
1662 Perch Lake Corporation Perdue Homestead Corp Patton A415<br />
0.029 0.048 0.048<br />
G<br />
Polk<br />
Trust<br />
E<br />
Polk 1663 Maude Patton Trust & Airport Grove Corp Of Polk Co A415 G 0.017 0.028 0.028 E<br />
Polk 1664 Robert R Crittenden‐Trustee Land Trust #1 A415 G 0.026 0.042 0.042 E<br />
Polk 1665 Robert & Carolyn Benoit A415 G 0.045 0.063 0.063 E<br />
Polk 1666 BCW Groves Inc A415 G 0.052 0.071 0.071 E<br />
Polk 1668 Subhas Ramroop A415 G 0.026 0.043 0.043 E<br />
Polk 1669 Ray Bob Groves Inc A415 G 0.027 0.044 0.044 E<br />
Polk 1676 The Montesco Group, LLC A415 G 0.029 0.048 0.048 E<br />
Polk 1677 Wilton E Murphy Family Ltd Partnership LLP A415 G 0.011 0.019 0.019 E<br />
Polk 1678 Mitco <strong>Water</strong> Laboratories Inc A415 G 0.012 0.019 0.019 E<br />
Polk 1681 Bern Kinard L610 G 0 0 0 E<br />
Polk 1695 Gene & Kathy Kniffen A465 G 0.012 0.019 0.019 E<br />
Polk 1697 Linda J May A415 S 0.019 0.031 0.031 E<br />
Polk 1699 Inman Groves Inc A415 G 0.009 0.015 0.015 E<br />
Polk 1731 Devane Citrus Inc A415 G 0.019 0.031 0.031 E<br />
Polk 1732 Peggy P Davis A415 S 0.006 0.01 0.01 E<br />
Polk 1733 City of Lake Wales A415 G 0.03 0.048 0.048 E<br />
Polk 1752 Baxter Groves A415 G 0.019 0.031 0.031 E<br />
Polk 1761 Nat Wolf Corporation A415 G 0.011 0.019 0.019 E<br />
Polk 1793 Claude E Mann Inc A415 G 0.009 0.014 0.014 E<br />
Polk 1795 Claude E Mann Inc A415 G 0.006 0.01 0.01 E<br />
Polk 1798 William Serdynski A415 G 0.007 0.012 0.012 E<br />
Polk 1801 Robert C Turner A415 G 0.014 0.022 0.022 E<br />
Polk 1802 Luke Angel Groves Inc A415 G 0.118 0.215 0.215 E<br />
Polk 1805 <strong>Florida</strong> State Board Of Education A415 G 0.019 0.031 0.031 E<br />
Polk 1806 University Of <strong>Florida</strong> Citrus Research & Education A415 G 0.018 0.029 0.029 E<br />
M/E 5<br />
Page | 289
<strong>2011</strong> ESTIMATED WATER USE REPORT<br />
Table A7. Metered and <strong>Estimated</strong> Agricultural WUPs, Withdrawals and Permitted <strong>Use</strong> (mgd), <strong>2011</strong><br />
County<br />
WUP<br />
Number<br />
<strong>Southwest</strong> <strong>Florida</strong> <strong>Water</strong> <strong>Management</strong> District<br />
Permittee<br />
<strong>Use</strong><br />
Code 1<br />
Source 2<br />
Annual<br />
Average<br />
Pumpage 3<br />
Total<br />
Permitted<br />
Annual<br />
Average<br />
Quantity<br />
Permitted<br />
Quantity<br />
Attributed<br />
to AG <strong>Use</strong><br />
Category 4<br />
Center<br />
Polk 1807 <strong>Florida</strong> State Board Of Education A415 G 0.028 0.071 0.071 E<br />
Polk 1815 F Alroy <strong>Water</strong>s A415 G 0.017 0.027 0.027 E<br />
Polk 1820 Robert G Lahmon A415 G 0.008 0.012 0.012 E<br />
Polk 1823 7s Bar Inc A415 G 0.121 0.22 0.22 E<br />
Polk 1828 Eagle Ridge Corp C/O Triangle Grove Services A415 G 0.017 0.027 0.027 E<br />
Polk 1829 Eagle‐Ridge Inc A415 G 0.006 0.009 0.009 E<br />
Polk 1830 James Hughes‐Eagle Ridge, Inc A415 G 0.025 0.041 0.041 E<br />
Polk 1841 James Brantley Gabriel A415 G 0.012 0.02 0.02 E<br />
Polk 1842 Leland Young A415 G 0.008 0.014 0.014 E<br />
Polk 1844 Carldon E Voigt A415 G 0.017 0.028 0.028 E<br />
Polk 1865 Calvin R Ford & Deborah J Ford A415 G 0.003 0.004 0.004 E<br />
Polk 1866 Whaley W & Trena L Lorenz A415 G 0.011 0.017 0.017 E<br />
Polk 1867 Guy & Mary Rubush A415 G 0.01 0.017 0.017 E<br />
Polk 1880 David L Curry A415 G 0.007 0.011 0.011 E<br />
Polk 1888 B.L. Lanier & Associates A415 G 0.024 0.039 0.039 E<br />
Polk 1889 Sultenfuss Ltd Family Ltd Prtnsp A415 G 0.024 0.039 0.039 E<br />
Polk 1892 Grassy Lake Estates LLC A415 G 0.028 0.045 0.045 E<br />
Polk 1899 Raymond F Barnes A415 G 0.013 0.022 0.022 E<br />
Polk 1905 Stenger Grove Service Inc A415 G 0.012 0.019 0.019 E<br />
Polk 1910 L Dicks, Inc. A415 G 0.006 0.01 0.01 E<br />
Polk 1914 William E & SUSAn M Ruth A415 G 0.024 0.039 0.039 E<br />
Polk 1915 Hubert L & Marian P Walker A415 S 0.011 0.017 0.017 E<br />
Polk 1935 BTS A415 G 0.025 0.042 0.042 E<br />
Polk 1940 Charles Grimes A490 G 0.049 0.068 0.068 E<br />
Polk 1949 O‐M Holdings LLC A415 G 0.019 0.031 0.031 E<br />
Polk 1952 Daniel J Adams A415 G 0.011 0.017 0.017 E<br />
Polk 1953 John P Adams Properties, Inc. A415 G 0.015 0.024 0.024 E<br />
Polk 1978 Alico‐Agri Ltd A415 G 0.006 0.01 0.01 E<br />
Polk 1979 Cecile Laroche A415 G 0.002 0.003 0.003 E<br />
Polk 1993 Frankenburger Farms, LLC A415 G 0.038 0.053 0.053 E<br />
M/E 5<br />
Page | 290
<strong>2011</strong> ESTIMATED WATER USE REPORT<br />
Table A7. Metered and <strong>Estimated</strong> Agricultural WUPs, Withdrawals and Permitted <strong>Use</strong> (mgd), <strong>2011</strong><br />
County<br />
WUP<br />
Number<br />
<strong>Southwest</strong> <strong>Florida</strong> <strong>Water</strong> <strong>Management</strong> District<br />
Permittee<br />
<strong>Use</strong><br />
Code 1<br />
Source 2<br />
Annual<br />
Average<br />
Pumpage 3<br />
Total<br />
Permitted<br />
Annual<br />
Average<br />
Quantity<br />
Permitted<br />
Quantity<br />
Attributed<br />
to AG <strong>Use</strong><br />
Category 4<br />
Polk 1997 John Laurent A485 G 0.014 0.023 0.023 E<br />
Polk 1999 Polk County School Board A415 G 0.006 0.013 0.009 E<br />
Polk 2001 Peace River Citrus Investments, LLC A415 G 0.012 0.071 0.071 E<br />
Polk 2002 CN Sons Holdings LLC A415 G 0.061 0.084 0.084 E<br />
Polk 2006 D C Cattle Inc A490 G 0.224 0.405 0.405 E<br />
Polk 2010 Leland Young A415 G 0.004 0.015 0.015 E<br />
Polk 2026 69‐98 Corp A415 G 0.016 0.026 0.026 E<br />
Polk 2039 B.L. Lanier & Associates A490 G 0.028 0.045 0.045 E<br />
Polk 2046 Olson Jordan Groves A415 G 0.024 0.039 0.039 E<br />
Polk 2050 Tid Services Inc & Tulsie Dass A415 G 0.039 0.063 0.063 E<br />
Polk 2051 James Brantley Gabriel A415 G 0.037 0.051 0.051 E<br />
Polk 2052 Donald L & Judith G Marchman A415 G 0.04 0.055 0.055 E<br />
Polk 2053 Brent & Betsy Monk A415 G 0.022 0.036 0.036 E<br />
Polk 2054 James Brantley Gabriel A415 G 0.024 0.039 0.039 E<br />
Polk 2055 Earl E Dodd A415 G 0.012 0.019 0.019 E<br />
Polk 2056 Gabriel Family Partners Ltd A415 G 0.031 0.05 0.05 E<br />
Polk 2058 David C & Jackie C Domine Revocable Trust Agreement A415 G 0.005 0.009 0.009 E<br />
Polk 2059 Gabriel Groves, Inc. A415 G 0.006 0.011 0.011 E<br />
Polk 2060 Philip F & Sandra Kay Crews A415 G 0.003 0.005 0.005 E<br />
Polk 2061 Gabriel Groves, Inc. A415 G 0.014 0.023 0.023 E<br />
Polk 2064 Bentley Development Group LLC A415 G 0.02 0.033 0.033 E<br />
Polk 2066 Slater‐Kanaley, Jacquelyn A415 G 0.002 0.004 0.004 E<br />
Polk 2067 Louis Whitaker A460 G 0.001 0.002 0.002 E<br />
Polk 2070 Earl E Dodd A415 G 0.024 0.039 0.039 E<br />
Polk 2081 Wanda P Young A415 G 0.005 0.008 0.008 E<br />
Polk 2082 Mahamad and Zaheer Gulmahamad A415 G 0.007 0.011 0.011 E<br />
Polk 2083 Sunrise Utilities LLC A415 G 0.003 0.034 0.004 E<br />
Polk 2084 Brooks B Register III And John L & Ruby B Register A415 G 0.01 0.017 0.017 E<br />
Polk 2085 Mary E & Kenneth E Johnting A415 G 0.012 0.019 0.019 E<br />
Polk 2087 Brooks B Register III And John L & Ruby B Register A415 G 0.011 0.018 0.018 E<br />
Polk 2088 Michael G & Wendi E Baker A410 G 0.012 0.02 0.02 E<br />
M/E 5<br />
Page | 291
<strong>2011</strong> ESTIMATED WATER USE REPORT<br />
Table A7. Metered and <strong>Estimated</strong> Agricultural WUPs, Withdrawals and Permitted <strong>Use</strong> (mgd), <strong>2011</strong><br />
County<br />
WUP<br />
Number<br />
<strong>Southwest</strong> <strong>Florida</strong> <strong>Water</strong> <strong>Management</strong> District<br />
Permittee<br />
<strong>Use</strong><br />
Code 1<br />
Source 2<br />
Annual<br />
Average<br />
Pumpage 3<br />
Total<br />
Permitted<br />
Annual<br />
Average<br />
Quantity<br />
Permitted<br />
Quantity<br />
Attributed<br />
to AG <strong>Use</strong><br />
Category 4<br />
Polk 2090 Polk County School Board A480 G 0.008 0.025 0.013 E<br />
Polk 2094 Board Of Public Inst A415 G 0 0.05 0.001 E<br />
Polk 2095 Polk County School Board A460 G 0.004 0.007 0.007 E<br />
Polk 2096 Polk County School Board A450 G 0.02 0.04 0.033 E<br />
Polk 2100 Polk Co School Board A415 G 0.003 0.035 0.004 E<br />
Polk 2111 Railroad Distribution Services A410 G 0.002 0.018 0.015 E<br />
Polk 2112 Robert And Carolyn Benoit A415 G 0.011 0.018 0.018 E<br />
Polk 2113 Wylie L & Wylie R Hinton A415 G 0.113 0.156 0.156 E<br />
Polk 2120 Allen Grove Partnership A415 G 0.004 0.05 0.05 E<br />
Polk 2121 Thomas E & Maija K Baynes A415 G 0.004 0.006 0.006 E<br />
Polk 2126 Jahna Groves Inc A415 G 0.04 0.055 0.055 E<br />
Polk 2127 Fort Family Partnership Limited A415 G 0.025 0.041 0.041 E<br />
Polk 2129 Bvg Groves Inc A415 G 0.03 0.048 0.048 E<br />
Polk 2134 Double Oj Inc A415 G 0.024 0.039 0.039 E<br />
2148 William L Raley Jr As Tr Of The Thelma C Raley<br />
A415<br />
0.014 0.023 0.023<br />
Polk<br />
Revocable Trust<br />
G<br />
E<br />
Polk 2153 Morrison Partnership A415 G 0.022 0.036 0.036 E<br />
Polk 2154 Morrison Partnership A415 G 0.009 0.015 0.015 E<br />
Polk 2160 Pierre Ducharme A410 G 0.004 0.007 0.007 E<br />
Polk 2163 James W Blackburn Jr A415 G 0.004 0.007 0.007 E<br />
Polk 2186 Richard G & Shirley C Ellis A415 G 0.022 0.037 0.037 E<br />
Polk 2200 J T Mangus A415 G 0.024 0.039 0.039 E<br />
Polk 2202 Linda Carver A415 G 0.013 0.021 0.021 E<br />
Polk 2204 Carlson Groves Inc A415 G 0.006 0.01 0.01 E<br />
Polk 2220 Barnum City Grove LLP A415 G 0.054 0.074 0.074 E<br />
Polk 2248 H G Brannen & Gloria C Cotton A415 G 0.02 0.032 0.032 E<br />
Polk 2249 New Continental Inc A415 G 0.015 0.025 0.025 E<br />
Polk 2250 John E Olson & Mary O Jordan A415 G 0.018 0.029 0.029 E<br />
Polk 2334 Anita D Lyle & SUSAn L Brooks A415 G 0.009 0.014 0.014 E<br />
Polk 2364 Viola Thomas L600 G 0.015 0.024 0.024 E<br />
Polk 2365 John P Adams Properties, Inc. A415 G 0.038 0.052 0.052 E<br />
M/E 5<br />
Page | 292
<strong>2011</strong> ESTIMATED WATER USE REPORT<br />
Table A7. Metered and <strong>Estimated</strong> Agricultural WUPs, Withdrawals and Permitted <strong>Use</strong> (mgd), <strong>2011</strong><br />
County<br />
WUP<br />
Number<br />
<strong>Southwest</strong> <strong>Florida</strong> <strong>Water</strong> <strong>Management</strong> District<br />
Permittee<br />
<strong>Use</strong><br />
Code 1<br />
Source 2<br />
Annual<br />
Average<br />
Pumpage 3<br />
Total<br />
Permitted<br />
Annual<br />
Average<br />
Quantity<br />
Permitted<br />
Quantity<br />
Attributed<br />
to AG <strong>Use</strong><br />
Category 4<br />
Polk 2367 Family Acres Inc A415 G 0.024 0.039 0.039 E<br />
Polk 2368 Stephens 4 INC A415 G 0.01 0.017 0.017 E<br />
Polk 2379 Eleanor Henderson A415 G 0.02 0.032 0.032 E<br />
Polk 2408 Janet Heidtman A415 G 0.049 0.068 0.068 E<br />
Polk 2422 Janet Heidtman A415 G 0.012 0.019 0.019 E<br />
Polk 2426 Hinson Mcteer A415 G 0.045 0.062 0.062 E<br />
Polk 2446 Pentecostal Church Of God A415 S 0.017 0.03 0.027 E<br />
Polk 2450 Snyder Discount Tire Inc A415 G 0.008 0.013 0.013 E<br />
Polk 2451 Sunshine Foliage World, Inc A485 G 0.023 0.038 0.038 E<br />
Polk 2454 John C Sr & John C Barnett Jr A415 G 0.012 0.019 0.019 E<br />
Polk 2461 BJ & JP James' Land LLC A415 G 0.03 0.049 0.049 E<br />
Polk 2464 Minesh Patel DBA Amelia Farms, LLC A415 G 0.043 0.063 0.063 E<br />
Polk 2465 Pauline C Huie, TR A415 G 0.012 0.019 0.019 E<br />
Polk 2466 Lmt Groves Inc A415 G 0.05 0.069 0.069 E<br />
Polk 2488 Fletcher Groves Inc A415 G 0.012 0.019 0.019 E<br />
Polk 2491 T. Kelton Hill Revocable Trust A415 G 0.018 0.03 0.03 E<br />
Polk 2504 L M Hollister Groves Inc A415 G 0.023 0.037 0.037 E<br />
Polk 2508 Clark R Fletcher Etal A415 G 0.011 0.017 0.017 E<br />
Polk 2509 Richard B Wright Jr A415 G 0.008 0.014 0.014 E<br />
Polk 2510 Nathan O Mcguire & Richard B A415 G 0.006 0.01 0.01 E<br />
Polk 2511 Hamilton Groves LLC A415 G 0.02 0.032 0.032 E<br />
Polk 2513 Richard G & Dennis & Ronald D Dicks A415 G 0.006 0.01 0.01 E<br />
Polk 2514 Sharpe Investment Limited Partnership A415 G 0.049 0.067 0.067 E<br />
Polk 2519 Marvin M Starling A58S G 0.005 0.009 0.009 E<br />
Polk 2520 Robert G Stokes A415 G 0.011 0.018 0.018 E<br />
Polk 2543 Robert G Stokes & Jeffrey K Stokes A415 G 0.021 0.034 0.034 E<br />
Polk 2596 Wayne R Snell A415 G 0.002 0.003 0.003 E<br />
Polk 2597 Janice Costanza A415 G 0.007 0.011 0.011 E<br />
Polk 2598 King Groves Inc A415 G 0.066 0.119 0.119 E<br />
Polk 2600 Floyd K & Joyce L DeVane A415 G 0.009 0.015 0.015 E<br />
Polk 2609 John W & Mary B Kregl A415 G 0.01 0.016 0.016 E<br />
M/E 5<br />
Page | 293
<strong>2011</strong> ESTIMATED WATER USE REPORT<br />
Table A7. Metered and <strong>Estimated</strong> Agricultural WUPs, Withdrawals and Permitted <strong>Use</strong> (mgd), <strong>2011</strong><br />
County<br />
WUP<br />
Number<br />
<strong>Southwest</strong> <strong>Florida</strong> <strong>Water</strong> <strong>Management</strong> District<br />
Permittee<br />
<strong>Use</strong><br />
Code 1<br />
Source 2<br />
Annual<br />
Average<br />
Pumpage 3<br />
Total<br />
Permitted<br />
Annual<br />
Average<br />
Quantity<br />
Permitted<br />
Quantity<br />
Attributed<br />
to AG <strong>Use</strong><br />
Category 4<br />
Polk 2615 Peace Acres Groves Inc A415 G 0.216 0.334 0.334 E<br />
Polk 2624 Sangster Groves Inc A415 G 0.024 0.039 0.039 E<br />
Polk 2627 Latt Maxcy Corp. A415 G 0.014 0.022 0.022 E<br />
Polk 2650 Alitiger Enterprises Inc A415 G 0.048 0.066 0.066 E<br />
Polk 2666 Richard F Sweeney Jr & Maria S Sweeney A415 G 0.002 0.004 0.004 E<br />
Polk 2721 Rogerd Guilmette‐Hunt Bros Inc A415 G 0.012 0.019 0.019 E<br />
Polk 2723 Hunt Bros Inc & Cfm Inc A415 G 0.021 0.034 0.034 E<br />
Polk 2725 Thomas Thayer, Sr. A415 G 0.012 0.02 0.02 E<br />
Polk 2743 Leonas Dicks A415 G 0.006 0.01 0.01 E<br />
Polk 2752 Pressley Davis Inc & Mary Ann Pressley A415 G 0.02 0.032 0.032 E<br />
Polk 2753 E J Pearson Jr A415 G 0.009 0.015 0.015 E<br />
Polk 2763 Willis Properties Inc A415 G 0.012 0.019 0.019 E<br />
Polk 2794 Jimmy W. Matthews A495 G 0.24 0.464 0.464 E<br />
Polk 2794 Jimmy W. Matthews A495 S 0.018 0.464 0.464 E<br />
Polk 2795 Family Acres Inc A415 G 0.043 0.059 0.059 E<br />
Polk 2814 Johnson Properties Inc C/O Estes Citrus, Inc. A415 G 0.009 0.015 0.015 E<br />
Polk 2833 Valentin & Eduardo Eddie Badillo A415 G 0.03 0.048 0.048 E<br />
2960 Trena Lorenz as trustee of the Trena Louise Lorenz A415<br />
0.03 0.048 0.048<br />
G<br />
Polk<br />
Trust<br />
E<br />
Polk 2965 Bradco Inc A415 G 0.028 0.046 0.046 E<br />
Polk 2994 Howard C Lucas A415 G 0.026 0.043 0.043 E<br />
Polk 3001 Circus Inn, Inc. And L.W. Mcknight, Sr. A415 G 0.067 0.093 0.093 E<br />
Polk 3004 Richard G & Dennis & Ronald D Dicks A415 G 0.017 0.027 0.027 E<br />
Polk 3005 PH Citrus LLC A415 G 0.018 0.029 0.029 E<br />
Polk 3006 Eleanor G Watts A415 G 0.024 0.039 0.039 E<br />
Polk 3007 James M and Sony L Stewart A415 G 0.018 0.029 0.029 E<br />
Polk 3027 Thelma J Medley A415 G 0.004 0.007 0.007 E<br />
Polk 3045 Blessings Inc C/O Rev Jack M Clark A58S G 0.004 0.011 0.007 E<br />
Polk 3072 Tillis & Sons Inc A415 G 0.045 0.062 0.062 E<br />
Polk 3073 Matthew M & Leelam M Varkey A415 G 0.014 0.023 0.023 E<br />
Polk 3092 Katherine Routh A415 G 0.02 0.056 0.056 E<br />
M/E 5<br />
Page | 294
<strong>2011</strong> ESTIMATED WATER USE REPORT<br />
Table A7. Metered and <strong>Estimated</strong> Agricultural WUPs, Withdrawals and Permitted <strong>Use</strong> (mgd), <strong>2011</strong><br />
County<br />
WUP<br />
Number<br />
Permittee<br />
<strong>Use</strong><br />
Code 1<br />
Source 2<br />
Annual<br />
Average<br />
Pumpage 3<br />
Total<br />
Permitted<br />
Annual<br />
Average<br />
Quantity<br />
Permitted<br />
Quantity<br />
Attributed<br />
to AG <strong>Use</strong><br />
Category 4<br />
Polk 3093 John P Adams Properties, Inc. A415 G 0.008 0.014 0.014 E<br />
Polk 3094 Floyd K Devane Jr & Sandra A A415 G 0.02 0.033 0.033 E<br />
Polk 3095 Flying V Inc A415 G 0.011 0.02 0.02 E<br />
Polk 3115 Billy Allen A415 G 0.012 0.02 0.02 E<br />
Polk 3146 Snoop Development Ltd L635 G 0 0.004 0 E<br />
Polk 3163 Daco Investments A415 G 0.03 0.048 0.048 E<br />
Polk 3184 Stephens 4 Inc A415 G 0.009 0.015 0.015 E<br />
Polk 3186 J R Paul Bob Paul Inc & Tc Shirley For Loyd Shirley A415 G 0.03 0.048 0.048 E<br />
Polk 3187 John Stephens, Inc. A415 G 0.027 0.044 0.044 E<br />
Polk 3189 Lake Hamilton Hills Of Polk County LLC A415 G 0.014 0.024 0.024 E<br />
Polk 3203 Ben Hill Griffin, Inc. A415 G 0 0.063 0.063 E<br />
Polk 3204 Joey Avery A490 G 0.013 0.021 0.021 E<br />
Polk 3208 David Watson & James H Whigham A57F G 0.013 0.022 0.022 E<br />
Polk 3212 SUSAn S. & Thomas A. Thayer, Jr. A415 G 0.006 0.01 0.01 E<br />
Polk 3223 Al Bellotto, Inc. A415 G 0.055 0.077 0.077 E<br />
Polk 3226 Pbp Groves Inc A415 G 0.072 0.099 0.099 E<br />
3254 Morton Pechter & Elissa & Cara Kathleen & Allen & W A415<br />
0.023 0.037 0.037<br />
G<br />
Polk<br />
Miller<br />
E<br />
Polk 3285 HC Land Company LLC, c/o Office Depot Inc. A415 G 0.038 0.053 0.053 E<br />
Polk 3289 Mollie A Cooper A415 G 0.006 0.01 0.01 E<br />
Polk 3303 Glenn M Attaway A415 G 0.004 0.006 0.006 E<br />
Polk 3309 Ernest M Smith Revocable Trust A415 G 0.03 0.048 0.048 E<br />
Polk 3366 Randy Martin A415 G 0.003 0.006 0.006 E<br />
3367 Clifton J Phares‐Trustee Of Cj Phares Family Trst<br />
A415<br />
0.022 0.037 0.037<br />
G<br />
Polk<br />
9/11/01<br />
E<br />
Polk 3396 X L Ranch A490 G 0.059 0.081 0.081 E<br />
Polk 3400 L Dicks, Inc. A415 G 0.035 0.058 0.058 E<br />
Polk 3402 Mary H Mcteer A410 G 0.018 0.029 0.029 E<br />
Polk 3463 Charles Ivan Stewart A415 G 0.025 0.041 0.041 E<br />
Polk 3464 W T Simpson Jr Etal & St Matthews Catholic Church A415 G 0.012 0.019 0.019 E<br />
Polk 3469 Bob Paul Inc A415 G 0.01 0.016 0.016 E<br />
M/E 5<br />
<strong>Southwest</strong> <strong>Florida</strong> <strong>Water</strong> <strong>Management</strong> District<br />
Page | 295
<strong>2011</strong> ESTIMATED WATER USE REPORT<br />
Table A7. Metered and <strong>Estimated</strong> Agricultural WUPs, Withdrawals and Permitted <strong>Use</strong> (mgd), <strong>2011</strong><br />
County<br />
WUP<br />
Number<br />
<strong>Southwest</strong> <strong>Florida</strong> <strong>Water</strong> <strong>Management</strong> District<br />
Permittee<br />
<strong>Use</strong><br />
Code 1<br />
Source 2<br />
Annual<br />
Average<br />
Pumpage 3<br />
Total<br />
Permitted<br />
Annual<br />
Average<br />
Quantity<br />
Permitted<br />
Quantity<br />
Attributed<br />
to AG <strong>Use</strong><br />
Category 4<br />
Polk 3470 B.L. Lanier & Associates A415 G 0.012 0.019 0.019 E<br />
Polk 3494 Emmett F & Margie Griffin A415 G 0.006 0.01 0.01 E<br />
Polk 3497 Seay Groves Inc A415 G 0.037 0.051 0.051 E<br />
Polk 3499 Sand Lake Groves LLC A415 G 0.043 0.059 0.059 E<br />
Polk 3504 V‐W Tropical Fish Hatcheries Inc L660 G 0.21 0.382 0.382 E<br />
Polk 3516 Jeff Stabler A485 G 0.043 0.06 0.06 E<br />
Polk 3517 Clark Cattle Enterprises LLC & Van Ridge Cattle II LLC A495 G 0.011 0.018 0.018 E<br />
Polk 3527 Robert W Harwell A480 G 0.06 0.087 0.087 E<br />
Polk 3529 A & J <strong>Water</strong>s Prop Inc A415 G 0.053 0.073 0.073 E<br />
Polk 3554 John S And Mary K Langford A415 G 0.039 0.055 0.055 E<br />
Polk 3555 Gary N Newell & William O Henry A415 G 0.008 0.014 0.014 E<br />
Polk 3570 Lawrence Dimmitt A415 G 0.011 0.018 0.018 E<br />
Polk 3579 Edwin D Mercer A415 G 0.009 0.014 0.014 E<br />
Polk 3618 Manuel And Shelly Lopez & John And Allison Stephens A415 G 0.013 0.022 0.022 E<br />
Polk 3629 Philip F & Sandra Kay Crews A415 G 0.016 0.026 0.026 E<br />
Polk 3649 V M V Groves Inc A415 G 0.029 0.047 0.047 E<br />
Polk 3654 Howard Lucas, Tr Of Irrevocable Tr A415 G 0.024 0.039 0.039 E<br />
Polk 3655 David W Lanier A415 G 0.006 0.01 0.01 E<br />
Polk 3689 John C Barnett Sr & John C Barnett Jr A415 G 0.006 0.01 0.01 E<br />
Polk 3721 Calvin M Barnett A415 G 0.008 0.013 0.013 E<br />
Polk 3723 Patrick M Richart Revocable Trust A415 G 0.005 0.008 0.008 E<br />
Polk 3746 Morgan Family Limited Partnership A415 G 0.017 0.029 0.029 E<br />
Polk 3750 Patricia Angel Tunno,Mary Jane A415 G 0.029 0.047 0.047 E<br />
Polk 3751 John C Barnett A415 G 0.007 0.012 0.012 E<br />
Polk 3763 John J Langford A415 G 0.025 0.04 0.04 E<br />
Polk 3765 Jim Norris Venrick A415 G 0.005 0.008 0.008 E<br />
Polk 3769 Ivan Stewart Trust & Gladys Stew A415 G 0.015 0.025 0.025 E<br />
Polk 3770 Ivan Stewart Trust & Gladys Stew A415 G 0.009 0.015 0.015 E<br />
Polk 3776 R & R Enterprises A415 G 0.029 0.048 0.048 E<br />
Polk 3777 Charles Stewart A415 G 0.009 0.015 0.015 E<br />
Polk 3782 Carlson Groves Inc A415 G 0.012 0.019 0.019 E<br />
M/E 5<br />
Page | 296
<strong>2011</strong> ESTIMATED WATER USE REPORT<br />
Table A7. Metered and <strong>Estimated</strong> Agricultural WUPs, Withdrawals and Permitted <strong>Use</strong> (mgd), <strong>2011</strong><br />
County<br />
WUP<br />
Number<br />
<strong>Southwest</strong> <strong>Florida</strong> <strong>Water</strong> <strong>Management</strong> District<br />
Permittee<br />
<strong>Use</strong><br />
Code 1<br />
Source 2<br />
Annual<br />
Average<br />
Pumpage 3<br />
Total<br />
Permitted<br />
Annual<br />
Average<br />
Quantity<br />
Permitted<br />
Quantity<br />
Attributed<br />
to AG <strong>Use</strong><br />
Category 4<br />
Polk 3804 Boston Mining Company A415 G 0.023 0.037 0.037 E<br />
Polk 3805 Boston Mining Company A415 G 0.052 0.071 0.071 E<br />
Polk 3813 Mary E Rubush A415 G 0.007 0.011 0.011 E<br />
Polk 3814 Guy W Rubush Revocable Living Trust A415 G 0.006 0.01 0.01 E<br />
Polk 3817 Patrick M Richart Revocable Trust A415 G 0.005 0.009 0.009 E<br />
Polk 3818 Guy W. Rubush Trust, #2 A415 G 0.012 0.019 0.019 E<br />
Polk 3821 Fox Branch Tropicals, Inc. L660 G 0.134 0.222 0.222 E<br />
Polk 3849 Bok Tower Gardens Foundation Inc A415 G 0.038 0.053 0.053 E<br />
Polk 3865 Brown Groves Inc A415 G 0.012 0.019 0.019 E<br />
Polk 3868 Brown Groves Inc A415 G 0.018 0.029 0.029 E<br />
Polk 3869 Brown Groves Inc A415 G 0.024 0.039 0.039 E<br />
3876 A Hoffman & G Scales & J Wilder Franklin & Dorothy A415<br />
0.008 0.013 0.013<br />
Polk<br />
Gardner Trust<br />
G<br />
E<br />
Polk 3899 <strong>Florida</strong> Dept Of Ag & Consumers Services A415 G 0.038 0.055 0.055 E<br />
Polk 3919 Richard Dantzler A415 G 0.006 0.01 0.01 E<br />
Polk 3920 Richard Dantzler A415 G 0.007 0.012 0.012 E<br />
Polk 3945 Ellingson Groves Inc A415 G 0.01 0.017 0.017 E<br />
Polk 3947 Polk County School Board A415 G 0.006 0.01 0.01 E<br />
Polk 3948 Ellingson Groves Inc A415 G 0.052 0.072 0.072 E<br />
Polk 3949 Ellingson Groves Inc A415 G 0.034 0.055 0.055 E<br />
Polk 3965 Story Groves Inc A415 G 0.006 0.01 0.01 E<br />
Polk 3967 Watters Holdings LLC A415 G 0.01 0.016 0.016 E<br />
Polk 3968 Story Groves Inc A415 G 0.021 0.035 0.035 E<br />
Polk 3969 Story Groves Inc A415 G 0.006 0.01 0.01 E<br />
Polk 3970 Story Groves Inc & Victor B Story Sr A415 G 0.011 0.019 0.019 E<br />
Polk 3971 Victor B Story Sr A415 G 0.015 0.025 0.025 E<br />
Polk 3973 Victor B Story Sr A415 G 0.014 0.023 0.023 E<br />
Polk 3980 Surmath, Inc. A415 G 0.011 0.018 0.018 E<br />
Polk 3981 Lake Marion Development Group LLC A415 G 0.027 0.044 0.044 E<br />
Polk 3982 Nola Land Co Inc A415 G 0.02 0.032 0.032 E<br />
Polk 3985 Hilltop Of Haines City Inc A415 G 0.012 0.019 0.019 E<br />
M/E 5<br />
Page | 297
<strong>2011</strong> ESTIMATED WATER USE REPORT<br />
Table A7. Metered and <strong>Estimated</strong> Agricultural WUPs, Withdrawals and Permitted <strong>Use</strong> (mgd), <strong>2011</strong><br />
County<br />
WUP<br />
Number<br />
<strong>Southwest</strong> <strong>Florida</strong> <strong>Water</strong> <strong>Management</strong> District<br />
Permittee<br />
<strong>Use</strong><br />
Code 1<br />
Source 2<br />
Annual<br />
Average<br />
Pumpage 3<br />
Total<br />
Permitted<br />
Annual<br />
Average<br />
Quantity<br />
Permitted<br />
Quantity<br />
Attributed<br />
to AG <strong>Use</strong><br />
Category 4<br />
Polk 3988 Luckenback Grove A415 G 0.011 0.019 0.019 E<br />
Polk 3989 Betty J Bellotto A415 G 0.029 0.047 0.047 E<br />
Polk 3990 James Redman & Robert S Trinkle A415 G 0.01 0.016 0.016 E<br />
Polk 4000 Highstreet Enterprises LTP L600 G 0.002 0.003 0.003 E<br />
Polk 4009 Joseph S & Rachelle M Murphy A415 G 0.011 0.018 0.018 E<br />
Polk 4010 Leonas Dicks A415 G 0.012 0.019 0.019 E<br />
Polk 4013 Jimmie D & Linda L Davis Jr A415 G 0.007 0.011 0.011 E<br />
Polk 4015 James G Hughes A415 G 0.006 0.01 0.01 E<br />
Polk 4016 Ivan Stewart A415 G 0.006 0.01 0.01 E<br />
Polk 4017 Bruce A & SUSAn E Davis A415 G 0.011 0.019 0.019 E<br />
Polk 4019 Sample Groves Inc A415 G 0.018 0.029 0.029 E<br />
Polk 4022 Irby Groves Inc A415 G 0.012 0.019 0.019 E<br />
Polk 4023 Guy W Rubush Revocable Living Trust A415 G 0.006 0.01 0.01 E<br />
4024 Georgene Mullins Henderson‐Cust For Fredrick & Mary A415<br />
0.024 0.039 0.039<br />
Polk<br />
Henderson<br />
G<br />
E<br />
Polk 4025 Homer V Thompson A415 G 0.024 0.039 0.039 E<br />
Polk 4044 S & J Partnership A415 G 0.012 0.019 0.019 E<br />
Polk 4047 Pleasant Hill Estates Llc Mitchell Kalogridis A415 G 0.019 0.031 0.031 E<br />
Polk 4051 Nelle H Stalnaker A415 G 0.006 0.01 0.01 E<br />
Polk 4053 Dicks Family Limited Partnership A415 G 0.011 0.018 0.018 E<br />
Polk 4058 John R Edwards A415 G 0.007 0.012 0.012 E<br />
Polk 4080 Janice M. Mitchell A415 G 0.005 0.008 0.008 E<br />
Polk 4094 Ronald S. Perry A415 G 0.019 0.032 0.032 E<br />
Polk 4095 Ronald S. Perry A415 G 0.009 0.015 0.015 E<br />
Polk 4101 Charles A & Jerry C Counter A415 G 0.007 0.012 0.012 E<br />
Polk 4103 John A & Olga S Attaway A415 G 0.012 0.019 0.019 E<br />
Polk 4104 Mary E Rubush A415 G 0.012 0.019 0.019 E<br />
Polk 4105 Lake Marie LLC A415 G 0.043 0.071 0.071 E<br />
Polk 4106 Mabel Jean Mathias & Betty Louise Murphy A415 G 0.012 0.019 0.019 E<br />
Polk 4108 PH Citrus LLC A415 G 0.24 0.424 0.424 E<br />
Polk 4109 Ridge Citrus Corporation A415 G 0.012 0.02 0.02 E<br />
M/E 5<br />
Page | 298
<strong>2011</strong> ESTIMATED WATER USE REPORT<br />
Table A7. Metered and <strong>Estimated</strong> Agricultural WUPs, Withdrawals and Permitted <strong>Use</strong> (mgd), <strong>2011</strong><br />
County<br />
WUP<br />
Number<br />
<strong>Southwest</strong> <strong>Florida</strong> <strong>Water</strong> <strong>Management</strong> District<br />
Permittee<br />
<strong>Use</strong><br />
Code 1<br />
Source 2<br />
Annual<br />
Average<br />
Pumpage 3<br />
Total<br />
Permitted<br />
Annual<br />
Average<br />
Quantity<br />
Permitted<br />
Quantity<br />
Attributed<br />
to AG <strong>Use</strong><br />
Category 4<br />
Polk 4110 Tea Groves A415 G 0.01 0.017 0.017 E<br />
Polk 4120 Barbara H Smith Trustee Of The Revocable Living Trust‐ A415 G 0.009 0.016 0.016 E<br />
Polk 4122 Aich & Aich Inc A415 G 0.011 0.018 0.018 E<br />
Polk 4124 Tuan A & Trangdai T Nguyen A415 G 0.024 0.039 0.039 E<br />
Polk 4125 John Henderson A415 G 0.012 0.019 0.019 E<br />
Polk 4127 Charles Cook & Vicki Cook A415 G 0.006 0.01 0.01 E<br />
Polk 4128 J B M Enterprises Inc A415 G 0.028 0.046 0.046 E<br />
Polk 4132 Berry Groves Inc A415 G 0.025 0.042 0.042 E<br />
Polk 4136 Billy J Allen A415 G 0.028 0.046 0.046 E<br />
Polk 4155 Charles E & Pamela H Watson A415 G 0.024 0.039 0.039 E<br />
Polk 4164 Latt Maxcy Corp. A415 G 0.006 0.01 0.01 E<br />
Polk 4166 Sr 544 LLC A415 G 0.096 0.147 0.147 E<br />
Polk 4169 Donald Frasier A495 G 0.03 0.05 0.05 E<br />
Polk 4170 Peter Musser Trust A415 G 0.019 0.031 0.031 E<br />
Polk 4172 Mary A Dam A415 S 0.013 0.022 0.022 E<br />
Polk 4177 Ridge Citrus Corporation A415 G 0.005 0.01 0.01 E<br />
Polk 4201 Blye B. Pegg Trust and W. Gary Bittle A415 G 0.065 0.097 0.097 E<br />
Polk 4203 Alan Walters Home Improvement & Repair Inc A415 G 0.024 0.039 0.039 E<br />
Polk 4206 William Eugene & Rebecca Lamb & Era M Comparato A415 G 0.016 0.026 0.026 E<br />
Polk 4213 Godwin Groves Inc A415 G 0.052 0.071 0.071 E<br />
Polk 4214 Godwin Groves Inc & Jimmie G Smith A415 G 0.012 0.02 0.02 E<br />
Polk 4225 Gbs Groves Inc A415 G 0.029 0.047 0.047 E<br />
Polk 4226 Larry D & Linda F Weeks L600 G 0 0 0 E<br />
Polk 4234 Growers Investment Group LLC A415 G 0.015 0.03 0.03 E<br />
Polk 4236 Lake Marion Development Group LLC A415 G 0.006 0.01 0.01 E<br />
Polk 4237 Marshall Citrus Inc A415 G 0.008 0.028 0.028 E<br />
Polk 4238 Marshall Citrus Inc A415 G 0.02 0.033 0.033 E<br />
Polk 4239 Polyak Development Inc & Town Of Dundee A415 G 0.025 0.041 0.041 E<br />
Polk 4242 <strong>Florida</strong> Sterling Invest Ltd A415 G 0.03 0.048 0.048 E<br />
Polk 4246 Blucher & Bertha Inc A415 G 0.018 0.029 0.029 E<br />
Polk 4250 B L Lanier & Assoc A415 G 0.015 0.025 0.025 E<br />
M/E 5<br />
Page | 299
<strong>2011</strong> ESTIMATED WATER USE REPORT<br />
Table A7. Metered and <strong>Estimated</strong> Agricultural WUPs, Withdrawals and Permitted <strong>Use</strong> (mgd), <strong>2011</strong><br />
County<br />
WUP<br />
Number<br />
<strong>Southwest</strong> <strong>Florida</strong> <strong>Water</strong> <strong>Management</strong> District<br />
Permittee<br />
<strong>Use</strong><br />
Code 1<br />
Source 2<br />
Annual<br />
Average<br />
Pumpage 3<br />
Total<br />
Permitted<br />
Annual<br />
Average<br />
Quantity<br />
Permitted<br />
Quantity<br />
Attributed<br />
to AG <strong>Use</strong><br />
Category 4<br />
Polk 4258 Goodman Grove Partnership A415 G 0.028 0.046 0.046 E<br />
Polk 4262 Brent & Betsy Monk A415 G 0.018 0.029 0.029 E<br />
Polk 4263 PH Citrus LLC A415 G 0.185 0.276 0.276 E<br />
Polk 4265 Jbt Properties LLC A415 G 0.014 0.022 0.022 E<br />
Polk 4267 John A Edwards & Dorthy Doran A415 S 0.03 0.049 0.049 E<br />
Polk 4276 Mrs Walter Meier A415 G 0.006 0.009 0.009 E<br />
Polk 4278 Joseph Parker A415 G 0.005 0.008 0.008 E<br />
Polk 4280 Polk County School Board A415 G 0.029 0.047 0.047 E<br />
4281 Challis G & Mary K Marshall Trst Of The Revoc Trst A415<br />
0.027 0.044 0.044<br />
G<br />
Polk<br />
Agreement<br />
E<br />
Polk 4282 Martin Yager & Laffey Inc A415 G 0.022 0.036 0.036 E<br />
Polk 4283 Clyde Rinaldi Estate A415 G 0.017 0.028 0.028 E<br />
Polk 4287 Patrick M Richart Revocable Trst Dated Sept 5 2000 A415 G 0.012 0.019 0.019 E<br />
Polk 4302 Tea Groves A415 G 0.012 0.02 0.02 E<br />
Polk 4305 Mohomed & Famona Azeez A415 G 0.009 0.015 0.015 E<br />
Polk 4315 Joseph Corrado Jr A415 G 0.006 0.009 0.009 E<br />
Polk 4322 Young & Young Partnership A415 G 0.005 0.008 0.008 E<br />
Polk 4329 Bgf Properties Llc Attn: Aristela Ferrari A415 G 0.011 0.018 0.018 E<br />
Polk 4339 Billy J Allen A415 G 0.036 0.05 0.05 E<br />
Polk 4346 Bradley Dean Reiter A415 G 0.014 0.023 0.023 E<br />
Polk 4353 Frank C & Charles H Rohlfing Rohlfing Groves Co LLP A415 G 0.011 0.018 0.018 E<br />
Polk 4355 Amcope Inc A415 G 0.006 0.01 0.01 E<br />
Polk 4356 Boozers Service & Equipment Inc A415 G 0.043 0.059 0.059 E<br />
Polk 4357 Carl P Boozer Etal A415 G 0.011 0.019 0.019 E<br />
Polk 4358 Carl P Boozer Etal A415 G 0.056 0.078 0.078 E<br />
Polk 4361 D Keith Emmett & Stuart L Arost A415 G 0.026 0.042 0.042 E<br />
Polk 4373 Thomas L & Cheryl V Lewis A415 G 0.012 0.019 0.019 E<br />
Polk 4383 George C Morris Jr A415 G 0.004 0.006 0.006 E<br />
Polk 4384 Frankie R Revette A415 G 0.002 0.006 0.003 E<br />
Polk 4389 Carl Sons, Robert W Sons And Patricia Lutz A415 G 0.019 0.031 0.031 E<br />
Polk 4392 Anglo Investments Inc A415 G 0.154 0.276 0.276 E<br />
M/E 5<br />
Page | 300
<strong>2011</strong> ESTIMATED WATER USE REPORT<br />
Table A7. Metered and <strong>Estimated</strong> Agricultural WUPs, Withdrawals and Permitted <strong>Use</strong> (mgd), <strong>2011</strong><br />
County<br />
WUP<br />
Number<br />
<strong>Southwest</strong> <strong>Florida</strong> <strong>Water</strong> <strong>Management</strong> District<br />
Permittee<br />
<strong>Use</strong><br />
Code 1<br />
Source 2<br />
Annual<br />
Average<br />
Pumpage 3<br />
Total<br />
Permitted<br />
Annual<br />
Average<br />
Quantity<br />
Permitted<br />
Quantity<br />
Attributed<br />
to AG <strong>Use</strong><br />
Category 4<br />
Polk 4394 Elizabeth G King A415 G 0.021 0.034 0.034 E<br />
Polk 4398 John P & Sandra K Beilman A415 G 0.026 0.043 0.043 E<br />
Polk 4418 D Edward & Elsie Bonwit Dickinson A415 G 0.013 0.042 0.042 E<br />
Polk 4422 Rosemary Futch A485 G 0.031 0.05 0.05 E<br />
Polk 4424 Putnam Groves Inc A415 G 0.039 0.054 0.054 E<br />
Polk 4425 Putnam Groves Inc A415 G 0.018 0.029 0.029 E<br />
Polk 4433 Hunt Bros Inc A415 G 0.015 0.024 0.024 E<br />
Polk 4434 Strickland & Smith, Inc. A415 G 0.019 0.031 0.031 E<br />
Polk 4445 B L Lanier & Assoc A415 G 0.028 0.045 0.045 E<br />
Polk 4450 Development Group of Central <strong>Florida</strong> Inc A415 G 0.04 0.055 0.055 E<br />
Polk 4451 Mihael & Farrellin Dekalands A415 G 0.062 0.086 0.086 E<br />
Polk 4455 Kermit Weeks As Trustee A415 G 0.069 0.1 0.1 E<br />
Polk 4457 Ida M Fullerton A415 G 0.02 0.032 0.032 E<br />
4458 Richard‐Jo‐Pamela‐Dennis‐SUSAn‐ Stephen‐Michelle‐ A415<br />
0.011 0.078 0.078<br />
Polk<br />
Randall Dicks<br />
G<br />
E<br />
Polk 4480 Floyd K & Joyce L DeVane A415 G 0.017 0.028 0.028 E<br />
Polk 4517 Central Ridge Inc A415 G 0.012 0.019 0.019 E<br />
Polk 4524 Black & Myers Properties LLC A415 G 0.029 0.047 0.047 E<br />
Polk 4537 W S Martin Revocable Living Trust A415 G 0.012 0.02 0.02 E<br />
Polk 4551 Moody Five JV LLC A415 G 0.006 0.01 0.01 E<br />
Polk 4556 Ronald & Carolyn Young A415 G 0.009 0.014 0.014 E<br />
Polk 4562 Jonathan Maxcy Inc A415 G 0.007 0.012 0.012 E<br />
Polk 4564 Ben Hill Griffin, Inc. A415 G 0.009 0.015 0.015 E<br />
Polk 4566 Ben Hill Griffin III A415 G 0.005 0.008 0.008 E<br />
Polk 4567 Ben Hill Griffin, Inc. A415 G 0.037 0.051 0.051 E<br />
Polk 4568 Alico Inc A415 G 0.014 0.023 0.023 E<br />
Polk 4569 Ben Hill Griffin, Inc. A415 G 0.003 0.005 0.005 E<br />
Polk 4570 Ben Hill Griffin, Inc. A415 G 0.014 0.023 0.023 E<br />
Polk 4571 RaLPh Wardlaw Inc A415 S 0.02 0.032 0.032 E<br />
Polk 4572 Ben Hill Griffin IV A415 G 0.037 0.051 0.051 E<br />
Polk 4574 Ben Hill Griffin Inc A415 G 0.011 0.017 0.017 E<br />
M/E 5<br />
Page | 301
<strong>2011</strong> ESTIMATED WATER USE REPORT<br />
Table A7. Metered and <strong>Estimated</strong> Agricultural WUPs, Withdrawals and Permitted <strong>Use</strong> (mgd), <strong>2011</strong><br />
County<br />
WUP<br />
Number<br />
<strong>Southwest</strong> <strong>Florida</strong> <strong>Water</strong> <strong>Management</strong> District<br />
Permittee<br />
<strong>Use</strong><br />
Code 1<br />
Source 2<br />
Annual<br />
Average<br />
Pumpage 3<br />
Total<br />
Permitted<br />
Annual<br />
Average<br />
Quantity<br />
Permitted<br />
Quantity<br />
Attributed<br />
to AG <strong>Use</strong><br />
Category 4<br />
Polk 4578 Carolyn King Roberts & Judith King Barnett A415 G 0.011 0.019 0.019 E<br />
Polk 4579 Carolyn King Roberts Et Al A415 G 0.007 0.012 0.012 E<br />
Polk 4581 Walter & Pam Farr And Ben Hill Griffin IV A415 G 0.012 0.019 0.019 E<br />
Polk 4587 Miss Hazel Citrus Inc A415 G 0.005 0.009 0.009 E<br />
4588 Shirley R. Morris, David A. Morris, Jr. & Allan Casey, A415<br />
0.012 0.019 0.019<br />
Polk<br />
Trustees<br />
G<br />
E<br />
Polk 4590 Cynthia B Hopkins A415 G 0.011 0.018 0.018 E<br />
Polk 4593 Hilltop Groves, LLC / Attn: Joe L. Saunders A415 G 0.012 0.02 0.02 E<br />
Polk 4610 Vigel M Varkey And Matthew Varkey A415 G 0.018 0.03 0.03 E<br />
Polk 4618 Craig Long & Daryl Deka & Robert Monti A415 G 0.01 0.016 0.016 E<br />
Polk 4623 Victor B Story Jr. Revocable Trust A415 G 0.012 0.019 0.019 E<br />
Polk 4635 Frank M & G Ellis Hunt A415 G 0.05 0.069 0.069 E<br />
Polk 4636 Mil Roc Inc A415 G 0.017 0.029 0.029 E<br />
Polk 4638 Kevin Monk A415 G 0.017 0.028 0.028 E<br />
Polk 4643 Mil Roc Inc A415 G 0.03 0.048 0.048 E<br />
Polk 4661 Hunt Bros Inc A415 G 0.044 0.071 0.071 E<br />
Polk 4665 Lake Sawyer Properties A415 G 0.037 0.051 0.051 E<br />
Polk 4674 LD Crews A415 G 0.028 0.068 0.068 E<br />
Polk 4711 John Barnett Jr. A415 G 0.006 0.01 0.01 E<br />
Polk 4720 Dayle T Weinkauf A415 G 0.007 0.012 0.012 E<br />
Polk 4740 Range 27 Cooperative A415 G 0.049 0.067 0.067 E<br />
Polk 4760 Nola Land Co Inc A415 G 0.014 0.024 0.024 E<br />
Polk 4764 Denis T Barnes & Hom Groves Partnership A415 G 0.03 0.048 0.048 E<br />
Polk 4766 Julia E Livingston Trustee Of Ju Lia E Livingston Trust A415 G 0.044 0.073 0.073 E<br />
4773 J E Smith & D H Rev Living Trust and Frank Hannon A415<br />
0.03 0.048 0.048<br />
G<br />
Polk<br />
Trust<br />
E<br />
Polk 4786 Mil Roc Inc A415 G 0.024 0.039 0.039 E<br />
Polk 4799 Elizabeth Ann Workman A415 G 0.014 0.023 0.023 E<br />
Polk 4807 Upco Inc A415 G 0.017 0.028 0.028 E<br />
Polk 4808 U&H Caretaking Inc A415 G 0.028 0.045 0.045 E<br />
Polk 4819 William A Jaques A415 G 0.03 0.048 0.048 E<br />
M/E 5<br />
Page | 302
<strong>2011</strong> ESTIMATED WATER USE REPORT<br />
Table A7. Metered and <strong>Estimated</strong> Agricultural WUPs, Withdrawals and Permitted <strong>Use</strong> (mgd), <strong>2011</strong><br />
County<br />
WUP<br />
Number<br />
<strong>Southwest</strong> <strong>Florida</strong> <strong>Water</strong> <strong>Management</strong> District<br />
Permittee<br />
<strong>Use</strong><br />
Code 1<br />
Source 2<br />
Annual<br />
Average<br />
Pumpage 3<br />
Total<br />
Permitted<br />
Annual<br />
Average<br />
Quantity<br />
Permitted<br />
Quantity<br />
Attributed<br />
to AG <strong>Use</strong><br />
Category 4<br />
Polk 4820 Ben Hill Griffin, Inc. A415 G 0.028 0.046 0.046 E<br />
Polk 4823 T. Kelton Hill Revocable Trust A415 G 0.04 0.055 0.055 E<br />
Polk 4827 Story Groves Inc A415 G 0.043 0.059 0.059 E<br />
Polk 4835 AJ & Reba Dubberly A415 G 0.007 0.011 0.011 E<br />
Polk 4864 John C Barnett Sr & John C Barnett Jr A415 G 0.012 0.019 0.019 E<br />
Polk 4868 John Joyner A490 G 0.002 0.003 0.003 E<br />
Polk 4880 Roger N. Wright Family Partnership A415 G 0.019 0.031 0.031 E<br />
Polk 4884 Signature Property Ent LLC A415 G 0.022 0.036 0.036 E<br />
Polk 4885 Stanley & Elisse Kulbaba A415 G 0.004 0.007 0.007 E<br />
Polk 4902 James And Marilyn Best A415 G 0.014 0.022 0.022 E<br />
Polk 4904 Story Groves Inc A415 G 0.019 0.032 0.032 E<br />
Polk 4911 Pressley‐Davis Inc A415 G 0.01 0.017 0.017 E<br />
Polk 4932 John Connally Barnett Sr & Jr A415 G 0.018 0.029 0.029 E<br />
Polk 4956 Devane Citrus Inc A415 G 0.021 0.035 0.035 E<br />
Polk 4963 Norma U Gabriel & Family A415 G 0.027 0.044 0.044 E<br />
Polk 4973 Robert Baker Sr & Connie J Baker A415 G 0.02 0.032 0.032 E<br />
Polk 4976 Tindel Camp Grove LLC A415 G 0.011 0.018 0.018 E<br />
Polk 4981 Grassy Lake Corporation A415 G 0.007 0.011 0.011 E<br />
Polk 4982 Floyd Sr & Joyce Devane As Trust A415 G 0.012 0.019 0.019 E<br />
Polk 4988 Dolly E Woodley A415 G 0.003 0.005 0.005 E<br />
Polk 4992 Michael Nikitin A415 G 0.02 0.032 0.032 E<br />
Polk 5038 State Farm Mutual Automobile Insurance Company A415 G 0.004 0.06 0.009 E<br />
Polk 5061 Town Of Dundee A415 G 0.006 0.01 0.01 E<br />
Polk 5098 B & D LLC A415 G 0.037 0.061 0.061 E<br />
Polk 5101 James Daris Dodd A415 G 0.012 0.02 0.02 E<br />
Polk 5119 SUSAn D & S Wayne Cannon Jr A415 G 0.022 0.036 0.036 E<br />
Polk 5123 Deborah F Sizemore Trustee Wc Fulton Grantor Trust A415 G 0.012 0.02 0.02 E<br />
Polk 5124 Caldwell Citrus Groves LLC A415 G 0.012 0.019 0.019 E<br />
Polk 5128 Betty Jane Fulton & Betty Jane Fulton Trust A415 G 0.022 0.036 0.036 E<br />
Polk 5129 Betty Jane Fulton Grantor Trust A415 G 0.015 0.025 0.025 E<br />
Polk 5132 Betty Jane Fulton & Betty Jane Fulton Trust A415 G 0.038 0.052 0.052 E<br />
M/E 5<br />
Page | 303
<strong>2011</strong> ESTIMATED WATER USE REPORT<br />
Table A7. Metered and <strong>Estimated</strong> Agricultural WUPs, Withdrawals and Permitted <strong>Use</strong> (mgd), <strong>2011</strong><br />
County<br />
WUP<br />
Number<br />
<strong>Southwest</strong> <strong>Florida</strong> <strong>Water</strong> <strong>Management</strong> District<br />
Permittee<br />
<strong>Use</strong><br />
Code 1<br />
Source 2<br />
Annual<br />
Average<br />
Pumpage 3<br />
Total<br />
Permitted<br />
Annual<br />
Average<br />
Quantity<br />
Permitted<br />
Quantity<br />
Attributed<br />
to AG <strong>Use</strong><br />
Category 4<br />
Polk 5154 Daniel & Janan Mckerahan A415 G 0.005 0.008 0.008 E<br />
Polk 5165 Joe Lombardi Inc A415 G 0.006 0.01 0.01 E<br />
Polk 5198 Richard G Ellis A415 G 0.016 0.026 0.026 E<br />
Polk 5208 William S & Regina J M Dundore A445 G 0.001 0.006 0.002 E<br />
Polk 5211 S Mark & Irene L Crissman A460 G 0.001 0.002 0.002 E<br />
Polk 5221 Pressley‐Davis Inc A415 G 0.007 0.012 0.012 E<br />
Polk 5224 Home Grown Fruit, Inc A415 G 0.028 0.046 0.046 E<br />
Polk 5225 Myron L & Lindsey Durrance Davis A415 G 0.026 0.043 0.043 E<br />
Polk 5247 Maronda Homes Inc Of <strong>Florida</strong> A415 G 0.006 0.01 0.01 E<br />
Polk 5261 C A C Investments Inc A415 G 0.025 0.041 0.041 E<br />
Polk 5272 Richard & Janice L Brooks A415 G 0.006 0.01 0.01 E<br />
Polk 5295 Gulf Land & Timber Co A415 G 0.026 0.042 0.042 E<br />
Polk 5306 Preserve At Auburndale LLC A415 G 0.014 0.023 0.023 E<br />
Polk 5313 Gladco A415 G 0.028 0.046 0.046 E<br />
Polk 5315 Davis Bros Inc A415 G 0.012 0.02 0.02 E<br />
Polk 5333 North Reedy Grove Inc & Moser A415 S 0.014 0.034 0.034 E<br />
Polk 5394 Lake Sawyer Properties A415 G 0.039 0.054 0.054 E<br />
Polk 5402 R G Sullivan Inc A415 G 0.013 0.021 0.021 E<br />
Polk 5413 Kahn Service A415 G 0.006 0.01 0.01 E<br />
Polk 5415 Story Citrus Inc A415 G 0.021 0.035 0.035 E<br />
Polk 5416 Herbert Mahle Sally Stuart And SUSAn & Stephen Mahle A415 G 0.021 0.034 0.034 E<br />
Polk 5418 Lee Groves Inc A415 G 0.036 0.05 0.05 E<br />
Polk 5419 Mack Farms Inc A415 G 0.037 0.051 0.051 E<br />
Polk 5427 J E Phillips Inc A415 G 0.014 0.023 0.023 E<br />
Polk 5432 Emmett & Arost Groves, P. Linder, Ed Tonore A415 G 0.047 0.064 0.064 E<br />
Polk 5434 Alcoma Properties Ltd A415 G 0.022 0.036 0.036 E<br />
Polk 5442 Johnny E & Eula B Dubose A415 G 0.007 0.012 0.012 E<br />
Polk 5443 Halina Lake Wales Investment LLC A415 G 0.006 0.01 0.01 E<br />
Polk 5450 Hunt Bros Inc A415 G 0.045 0.062 0.062 E<br />
Polk 5467 Unadilla Corporation A415 G 0.023 0.037 0.037 E<br />
Polk 5468 Story Citrus Inc A415 G 0.022 0.036 0.036 E<br />
M/E 5<br />
Page | 304
<strong>2011</strong> ESTIMATED WATER USE REPORT<br />
Table A7. Metered and <strong>Estimated</strong> Agricultural WUPs, Withdrawals and Permitted <strong>Use</strong> (mgd), <strong>2011</strong><br />
County<br />
WUP<br />
Number<br />
<strong>Southwest</strong> <strong>Florida</strong> <strong>Water</strong> <strong>Management</strong> District<br />
Permittee<br />
<strong>Use</strong><br />
Code 1<br />
Source 2<br />
Annual<br />
Average<br />
Pumpage 3<br />
Total<br />
Permitted<br />
Annual<br />
Average<br />
Quantity<br />
Permitted<br />
Quantity<br />
Attributed<br />
to AG <strong>Use</strong><br />
Category 4<br />
Polk 5470 Wheeler Farms Inc A415 G 0.044 0.061 0.061 E<br />
Polk 5478 Hunt Bros Inc A415 G 0.016 0.026 0.026 E<br />
Polk 5480 Frank M & G Ellis Hunt And Hunt Bros Service Inc A415 G 0.025 0.041 0.041 E<br />
Polk 5483 Hunt Bros Service Inc A415 G 0.012 0.02 0.02 E<br />
Polk 5484 Hunt Bros Inc A415 G 0.045 0.062 0.062 E<br />
Polk 5485 Hunt Bros Inc A415 G 0.012 0.02 0.02 E<br />
Polk 5494 Hunt Bros Inc A415 G 0.014 0.023 0.023 E<br />
Polk 5500 Ben Hill Griffin IV & Pia Kaarina Griffin A415 G 0.051 0.073 0.073 E<br />
Polk 5502 Julia E Livingston Trustee Of Ju Lia E Livingston Trust A415 G 0.012 0.02 0.02 E<br />
Polk 5503 Minnie E Dempsey A415 G 0.023 0.038 0.038 E<br />
Polk 5545 Carroll Rhoden Inc A415 G 0.014 0.024 0.024 E<br />
Polk 5552 Ruby E Benton A415 G 0.019 0.031 0.031 E<br />
Polk 5555 James B Delaney A415 G 0.014 0.023 0.023 E<br />
Polk 5556 Michael D. Falk and Debra M. Falk A490 G 0.024 0.04 0.04 E<br />
Polk 5560 Thullbery Caretaking Inc A415 G 0.014 0.023 0.023 E<br />
Polk 5561 Richard and Sandee Tuck A415 G 0.015 0.024 0.024 E<br />
Polk 5570 Pat Wilson Inc A415 G 0.025 0.041 0.041 E<br />
Polk 5573 Ben Hill Griffin, Inc. A415 G 0.009 0.014 0.014 E<br />
Polk 5582 Robert C Crews II A415 G 0.019 0.031 0.031 E<br />
Polk 5585 Sun Grown Citrus LP A415 G 0.054 0.075 0.075 E<br />
Polk 5594 Howard L Mcleod A415 S 0.006 0.009 0.009 E<br />
Polk 5595 Highlands Citrus Inc A415 G 0.005 0.009 0.009 E<br />
Polk 5597 Farrington Groves Partnership A415 G 0.011 0.018 0.018 E<br />
Polk 5598 Daniel A Norris Sr & Carolyn A Norris A415 G 0.024 0.039 0.039 E<br />
Polk 5600 Billy Allen A415 G 0.025 0.041 0.041 E<br />
Polk 5602 Dolly E Woodley A415 S 0.008 0.013 0.013 E<br />
Polk 5608 Arnco Land Co LLC A415 G 0.02 0.032 0.032 E<br />
Polk 5610 Ben Hill Griffin, Inc. A415 G 0.038 0.053 0.053 E<br />
Polk 5614 Julia E Livingston Trustee Of Ju Lia E Livingston Trust A415 G 0.012 0.019 0.019 E<br />
Polk 5615 J H Dickinson Groves Inc A415 G 0.006 0.01 0.01 E<br />
Polk 5623 Blue Lake Groves Inc A415 G 0.013 0.021 0.021 E<br />
M/E 5<br />
Page | 305
<strong>2011</strong> ESTIMATED WATER USE REPORT<br />
Table A7. Metered and <strong>Estimated</strong> Agricultural WUPs, Withdrawals and Permitted <strong>Use</strong> (mgd), <strong>2011</strong><br />
County<br />
WUP<br />
Number<br />
<strong>Southwest</strong> <strong>Florida</strong> <strong>Water</strong> <strong>Management</strong> District<br />
Permittee<br />
<strong>Use</strong><br />
Code 1<br />
Source 2<br />
Annual<br />
Average<br />
Pumpage 3<br />
Total<br />
Permitted<br />
Annual<br />
Average<br />
Quantity<br />
Permitted<br />
Quantity<br />
Attributed<br />
to AG <strong>Use</strong><br />
Category 4<br />
Polk 5633 Pat Wilson Inc A415 G 0.009 0.014 0.014 E<br />
Polk 5652 Orie N Lee & Louise H Lee A415 G 0.013 0.021 0.021 E<br />
5653 Johnny D Dubose‐James A & Hilda D Robinson‐C Don & A415<br />
0.025 0.041 0.041<br />
Polk<br />
Nancy William<br />
G<br />
E<br />
Polk 5666 Vivek Welfare & Educational Foundation Inc A415 G 0.054 0.075 0.075 E<br />
Polk 5669 PH Citrus LLC A415 G 0.012 0.02 0.02 E<br />
Polk 5670 Harmac Development A415 G 0.007 0.012 0.012 E<br />
Polk 5675 Whaley Ward Lorenz Family Trust A415 G 0.006 0.01 0.01 E<br />
Polk 5677 Merle J Jr & Lee Ann Bullard A415 G 0.011 0.017 0.017 E<br />
Polk 5678 Merle Jackson & Lee Ann Bullard Jr A415 G 0.03 0.048 0.048 E<br />
Polk 5680 Julia Livingston Revocable Living Trust A415 S 0.026 0.042 0.042 E<br />
Polk 5681 Moody Four JV LLC A415 G 0.012 0.019 0.019 E<br />
Polk 5686 Joe W Harvey & David A Norka A415 G 0.022 0.037 0.037 E<br />
Polk 5708 Phyllis Langford English A415 G 0.005 0.009 0.009 E<br />
Polk 5709 Sultenfuss Ltd., Family Limited Partnership A415 G 0.012 0.02 0.02 E<br />
Polk 5734 Charles Stewart A415 G 0.012 0.019 0.019 E<br />
Polk 5735 Polk County School Board A415 G 0.018 0.029 0.029 E<br />
Polk 5737 Dayle T & William T Weinkauf Trustee A415 G 0.013 0.021 0.021 E<br />
Polk 5740 L Dicks, Inc. A415 G 0.012 0.019 0.019 E<br />
Polk 5741 Baxter G Troutman A415 G 0.02 0.033 0.033 E<br />
Polk 5742 Estate of Jack E Rubush A415 G 0.026 0.043 0.043 E<br />
Polk 5751 Story Citrus Inc A415 G 0.026 0.042 0.042 E<br />
Polk 5756 Phillip Rucks A415 G 0.006 0.009 0.009 E<br />
Polk 5758 Thomas E. Davis A415 G 0.018 0.029 0.029 E<br />
Polk 5765 C & R Groves A415 G 0.001 0.051 0.051 E<br />
Polk 5765 C & R Groves A415 S 0.036 0.051 0.051 E<br />
Polk 5769 J Langford A415 G 0.048 0.067 0.067 E<br />
Polk 5770 CC Calhoun, Inc. / Attn: Larry Calhoun A415 G 0.03 0.048 0.048 E<br />
Polk 5773 R Tom Chapman Jr A415 G 0.03 0.048 0.048 E<br />
Polk 5775 Daniel A Norris, Carolyn Norris and Ruby Benton A415 G 0.012 0.02 0.02 E<br />
Polk 5776 Wise Brothers Of Frostproof LLC A415 G 0.009 0.014 0.014 E<br />
M/E 5<br />
Page | 306
<strong>2011</strong> ESTIMATED WATER USE REPORT<br />
Table A7. Metered and <strong>Estimated</strong> Agricultural WUPs, Withdrawals and Permitted <strong>Use</strong> (mgd), <strong>2011</strong><br />
County<br />
WUP<br />
Number<br />
<strong>Southwest</strong> <strong>Florida</strong> <strong>Water</strong> <strong>Management</strong> District<br />
Permittee<br />
<strong>Use</strong><br />
Code 1<br />
Source 2<br />
Annual<br />
Average<br />
Pumpage 3<br />
Total<br />
Permitted<br />
Annual<br />
Average<br />
Quantity<br />
Permitted<br />
Quantity<br />
Attributed<br />
to AG <strong>Use</strong><br />
Category 4<br />
Polk 5777 Wise Brothers Of Frostproof LLC A415 G 0.006 0.01 0.01 E<br />
Polk 5778 Story Groves Inc A415 G 0.012 0.02 0.02 E<br />
Polk 5779 Roland And Lynda Durrance A415 G 0.022 0.037 0.037 E<br />
Polk 5782 John C Sr & John C Barnett Jr A415 G 0.006 0.01 0.01 E<br />
Polk 5785 Oscar W & C Dane & John Steven & William T Rogers A415 G 0.018 0.029 0.029 E<br />
Polk 5801 Joshua Meeks A415 G 0.022 0.035 0.035 E<br />
Polk 5812 Cypress Foods Inc L650 G 0.011 0.036 0.036 E<br />
Polk 5813 Petteway Grove Service Inc. A415 G 0.041 0.057 0.057 E<br />
Polk 5820 Charles E Weeder A415 G 0.004 0.007 0.007 E<br />
Polk 5826 Patrick M Richart Revocable Trst Dated Sept 5 2000 A415 G 0.022 0.037 0.037 E<br />
Polk 5830 Willex Technologies Inc A415 G 0.006 0.01 0.01 E<br />
Polk 5836 Richard M McKenzie Jr A415 G 0.042 0.058 0.058 E<br />
Polk 5838 Lannie James Cooper A415 G 0.005 0.009 0.009 E<br />
Polk 5841 Rolling Meadow Ranch Inc A415 G 0.026 0.043 0.043 E<br />
Polk 5842 Patrick L & Kathy E Borders L600 G 0.001 0.002 0.002 E<br />
Polk 5845 Walsh & Meissner Inc A415 G 0.049 0.068 0.068 E<br />
Polk 5847 Mary Wyrosdick A415 G 0.042 0.06 0.06 E<br />
Polk 5849 Bassett Groves Inc A415 G 0.024 0.04 0.04 E<br />
Polk 5874 Hector Berrio A415 G 0.004 0.006 0.006 E<br />
Polk 5887 Flying V Inc A415 G 0.013 0.021 0.021 E<br />
5900 Oscar W Rogers Trustee Of The O W Rogers Living Tr & A415<br />
0.01 0.017 0.017<br />
Polk<br />
C D Rogers<br />
G<br />
E<br />
Polk 5901 Ben Hill Griffin, Inc. A415 G 0.006 0.01 0.01 E<br />
Polk 5904 Charles Stewart Dba S & S Groves A415 G 0.006 0.01 0.01 E<br />
Polk 5911 Charles Donald Harden A51S G 0.013 0.022 0.022 E<br />
Polk 5919 Jeffrey B Moore A415 G 0.012 0.02 0.02 E<br />
Polk 5923 Nelson & Connie Groves Inc A415 G 0.014 0.023 0.023 E<br />
Polk 5925 Kenneth L Sr & Ramphan Griffin A415 G 0.004 0.007 0.007 E<br />
Polk 5968 Family Farms LLC, Stuart Arost & John Arost A415 G 0.025 0.041 0.041 E<br />
Polk 5994 Ivan Stewart A415 G 0.017 0.028 0.028 E<br />
Polk 5995 Flood Groves Corp A415 G 0.012 0.02 0.02 E<br />
M/E 5<br />
Page | 307
<strong>2011</strong> ESTIMATED WATER USE REPORT<br />
Table A7. Metered and <strong>Estimated</strong> Agricultural WUPs, Withdrawals and Permitted <strong>Use</strong> (mgd), <strong>2011</strong><br />
County<br />
WUP<br />
Number<br />
<strong>Southwest</strong> <strong>Florida</strong> <strong>Water</strong> <strong>Management</strong> District<br />
Permittee<br />
<strong>Use</strong><br />
Code 1<br />
Source 2<br />
Annual<br />
Average<br />
Pumpage 3<br />
Total<br />
Permitted<br />
Annual<br />
Average<br />
Quantity<br />
Permitted<br />
Quantity<br />
Attributed<br />
to AG <strong>Use</strong><br />
Category 4<br />
Polk 6002 Thomas E Davis A415 G 0.006 0.01 0.01 E<br />
Polk 6022 Atlee Davis A415 G 0.019 0.031 0.031 E<br />
Polk 6037 South Property Holdings LLC A415 G 0.024 0.039 0.039 E<br />
Polk 6038 Tuan A & Trangdai T Nguyen A415 G 0.049 0.068 0.068 E<br />
6050 Smith South Reedy Groves Inc & R P‐N A‐& J A Smith‐ A415<br />
0.038 0.054 0.054<br />
Polk<br />
Trustees Etc<br />
G<br />
E<br />
Polk 6051 Flood Groves Corporation & J B M Enterprises Inc A415 G 0.012 0.02 0.02 E<br />
Polk 6054 E R Jahna Industries Inc & Pamela Estes A415 G 0 0.092 0.042 E<br />
Polk 6054 E R Jahna Industries Inc & Pamela Estes A415 S 0 0.092 0.042 E<br />
Polk 6055 Carol J Mcteer A415 G 0.011 0.017 0.017 E<br />
Polk 6056 Ken & Kay Family Ltd Partnership A415 G 0.009 0.015 0.015 E<br />
Polk 6058 PH Citrus LLC A415 G 0.019 0.031 0.031 E<br />
Polk 6069 J L & Virginia Hollon A490 G 0.007 0.012 0.012 E<br />
Polk 6074 Ridge Citrus Corp A415 G 0.006 0.01 0.01 E<br />
Polk 6081 Marjo Block Citrus Groves LLC A415 G 0.015 0.024 0.024 E<br />
Polk 6106 Robert D Conerly A58H G 0.015 0.027 0.025 E<br />
Polk 6131 Ardelle M Carter A460 G 0.005 0.008 0.008 E<br />
Polk 6140 B L And Sara T Lanier A415 G 0.027 0.044 0.044 E<br />
Polk 6142 PH Citrus LLC A415 G 0.01 0.016 0.016 E<br />
Polk 6145 Land Equity Resources Inc A415 G 0.006 0.01 0.01 E<br />
Polk 6161 Harold B & Louis Howard Mcteer A415 G 0.011 0.018 0.018 E<br />
Polk 6182 Boy Scouts Of America Gulf Ridge Council A415 G 0.02 0.042 0.033 E<br />
Polk 6191 Boston Mining And Mark Wheeler Wheeler Groves Inc A415 G 0.04 0.055 0.055 E<br />
Polk 6192 Hazel Brannen A415 G 0.012 0.02 0.02 E<br />
Polk 6199 Highlands Citrus Inc A415 G 0.007 0.012 0.012 E<br />
Polk 6201 RaLPh & Mary Beth Bevins A415 G 0.006 0.01 0.01 E<br />
Polk 6221 David D & Tracie Bridges A415 G 0.009 0.015 0.015 E<br />
Polk 6237 Story Groves Inc A415 G 0.03 0.048 0.048 E<br />
Polk 6240 Julia E Livingston Trustee Of Ju Lia E Livingston Trust A415 G 0.008 0.013 0.013 E<br />
Polk 6242 Jose Gracia A425 G 0.011 0.018 0.018 E<br />
Polk 6254 Ridgecrest Groves Inc A415 G 0.024 0.039 0.039 E<br />
M/E 5<br />
Page | 308
<strong>2011</strong> ESTIMATED WATER USE REPORT<br />
Table A7. Metered and <strong>Estimated</strong> Agricultural WUPs, Withdrawals and Permitted <strong>Use</strong> (mgd), <strong>2011</strong><br />
County<br />
WUP<br />
Number<br />
<strong>Southwest</strong> <strong>Florida</strong> <strong>Water</strong> <strong>Management</strong> District<br />
Permittee<br />
<strong>Use</strong><br />
Code 1<br />
Source 2<br />
Annual<br />
Average<br />
Pumpage 3<br />
Total<br />
Permitted<br />
Annual<br />
Average<br />
Quantity<br />
Permitted<br />
Quantity<br />
Attributed<br />
to AG <strong>Use</strong><br />
Category 4<br />
Polk 6256 H Allan Prevatt A490 G 0.018 0.029 0.029 E<br />
Polk 6267 Leslie W Dunson III & Dunson Jr A415 G 0.03 0.049 0.049 E<br />
Polk 6277 Putnam Groves Inc A415 G 0.022 0.036 0.036 E<br />
Polk 6285 E Tracy & Gary W Robinson A415 G 0.022 0.036 0.036 E<br />
Polk 6285 E Tracy & Gary W Robinson A415 S 0 0.036 0.036 E<br />
Polk 6288 Richard E & Cynthia L Barrow A490 G 0.003 0.004 0.004 E<br />
Polk 6299 Pat Wilson Inc A415 G 0.01 0.016 0.016 E<br />
6309 Julia F Hanusch As Trustee Of The J Hanusch Rev Trst A415<br />
0.008 0.014 0.014<br />
Polk<br />
6/15/83<br />
G<br />
E<br />
Polk 6315 Robert H W Hart & Russell C Hart A415 G 0.023 0.037 0.037 E<br />
Polk 6331 Celia J Mckee A415 G 0.005 0.009 0.009 E<br />
Polk 6338 Joe L Davis Groves Inc A415 G 0.022 0.037 0.037 E<br />
Polk 6339 Flying V Inc A415 G 0.042 0.069 0.069 E<br />
Polk 6340 W Allen & Marjorie F Hancock A490 G 0.012 0.02 0.02 E<br />
Polk 6350 Phillip H Stephens A415 G 0.013 0.021 0.021 E<br />
Polk 6359 Wise Seed Co Inc A415 G 0.005 0.009 0.009 E<br />
Polk 6377 Claude E Mann Inc A415 G 0.008 0.014 0.014 E<br />
Polk 6389 Kingswood Sprott Inc A415 G 0.04 0.055 0.055 E<br />
Polk 6400 Bgf Properties Llc Attn: Aristela Ferrari A415 G 0.026 0.043 0.043 E<br />
Polk 6401 John C & Margarette C Dubois A415 G 0.002 0.003 0.003 E<br />
Polk 6424 Rena Mae Dice A415 G 0.013 0.021 0.021 E<br />
Polk 6440 R. Tom Chapman & Shirley A. Rubush Trust A415 G 0.017 0.028 0.028 E<br />
Polk 6467 L W Dunson & Son Inc A415 G 0.012 0.02 0.02 E<br />
Polk 6474 Norman E & Martha L Wallace A415 G 0.012 0.02 0.02 E<br />
Polk 6486 Bader Of Lakeland Inc A415 G 0.009 0.014 0.014 E<br />
Polk 6493 Robert S & Brenda H Congdon A490 G 0.008 0.013 0.013 E<br />
Polk 6499 Wise Seed Co Inc A415 G 0.044 0.071 0.071 E<br />
Polk 6511 Flood Groves Corp A415 G 0.015 0.048 0.048 E<br />
Polk 6512 Raymond Shea A490 S 0.002 0.004 0.004 E<br />
Polk 6515 C & L Yates Inc A415 G 0.014 0.023 0.023 E<br />
Polk 6520 Michael L & Judy F Bedenbaugh A58S G 0.016 0.026 0.026 E<br />
M/E 5<br />
Page | 309
<strong>2011</strong> ESTIMATED WATER USE REPORT<br />
Table A7. Metered and <strong>Estimated</strong> Agricultural WUPs, Withdrawals and Permitted <strong>Use</strong> (mgd), <strong>2011</strong><br />
County<br />
WUP<br />
Number<br />
<strong>Southwest</strong> <strong>Florida</strong> <strong>Water</strong> <strong>Management</strong> District<br />
Permittee<br />
<strong>Use</strong><br />
Code 1<br />
Source 2<br />
Annual<br />
Average<br />
Pumpage 3<br />
Total<br />
Permitted<br />
Annual<br />
Average<br />
Quantity<br />
Permitted<br />
Quantity<br />
Attributed<br />
to AG <strong>Use</strong><br />
Category 4<br />
Polk 6528 Greenwood Family Ltd Partnership A415 G 0.024 0.039 0.039 E<br />
Polk 6532 Burnett Groves Inc A415 G 0.021 0.034 0.034 E<br />
Polk 6536 John C Sr & John C Barnett Jr A415 G 0.006 0.01 0.01 E<br />
Polk 6559 Alcoma Properties Ltd. A415 G 0.024 0.039 0.039 E<br />
Polk 6560 Luke C & Melissa A Oie A415 G 0.014 0.022 0.022 E<br />
Polk 6582 James R Jr & Suzanne B Fletcher A415 G 0.014 0.022 0.022 E<br />
Polk 6583 Ben Hill Griffin, Inc. A415 G 0.005 0.008 0.008 E<br />
Polk 6587 N C Hunt Rev Trust & Scott & A415 G 0.004 0.007 0.007 E<br />
Polk 6588 R Chapman A415 G 0.047 0.065 0.065 E<br />
Polk 6591 Donnie G Alford A415 G 0.028 0.045 0.045 E<br />
Polk 6594 James P & Dorothy L Drane Jr A415 G 0.006 0.01 0.01 E<br />
Polk 6609 George M Bell A415 G 0.024 0.039 0.039 E<br />
Polk 6613 Carolyn W Albritton A415 G 0.006 0.01 0.01 E<br />
Polk 6618 J Ragon Barnett A415 G 0.012 0.02 0.02 E<br />
Polk 6620 Marvin H Brown Jr A415 G 0.018 0.03 0.03 E<br />
Polk 6642 Kenneth L Wetherington Sr & Jr A415 G 0.036 0.059 0.059 E<br />
Polk 6653 Putnam Groves Inc A415 G 0.024 0.04 0.04 E<br />
Polk 6656 John Stephens, Inc. A415 G 0.014 0.022 0.022 E<br />
Polk 6663 Vince Wilfork A415 G 0.024 0.04 0.04 E<br />
Polk 6663 Vince Wilfork A415 S 0 0.04 0.04 E<br />
Polk 6680 John C Sr & John C Barnett Jr A415 G 0.038 0.062 0.062 E<br />
Polk 6681 Frostproof Acres LLC A415 G 0.043 0.172 0.172 E<br />
Polk 6690 Ivan Stewart A415 G 0.006 0.01 0.01 E<br />
Polk 6695 Enzor & Stephens A415 G 0.012 0.02 0.02 E<br />
Polk 6700 Joshua Meeks A415 G 0.004 0.006 0.006 E<br />
Polk 6705 Magnatronix Corporation A415 G 0.018 0.03 0.03 E<br />
Polk 6706 Devane Citrus Inc A415 G 0.006 0.01 0.01 E<br />
Polk 6730 Gabriel Groves, Inc. A415 G 0.007 0.011 0.011 E<br />
Polk 6738 Highlands Citrus Inc A415 G 0.021 0.034 0.034 E<br />
Polk 6740 Smith & Slater Grove Inc A415 G 0.021 0.035 0.035 E<br />
Polk 6747 Mosaic Fertilizer LLC A475 G 0.029 0.047 0.047 E<br />
M/E 5<br />
Page | 310
<strong>2011</strong> ESTIMATED WATER USE REPORT<br />
Table A7. Metered and <strong>Estimated</strong> Agricultural WUPs, Withdrawals and Permitted <strong>Use</strong> (mgd), <strong>2011</strong><br />
County<br />
WUP<br />
Number<br />
<strong>Southwest</strong> <strong>Florida</strong> <strong>Water</strong> <strong>Management</strong> District<br />
Permittee<br />
<strong>Use</strong><br />
Code 1<br />
Source 2<br />
Annual<br />
Average<br />
Pumpage 3<br />
Total<br />
Permitted<br />
Annual<br />
Average<br />
Quantity<br />
Permitted<br />
Quantity<br />
Attributed<br />
to AG <strong>Use</strong><br />
Category 4<br />
Polk 6750 Paint Creek, Llc. A415 G 0.069 0.125 0.125 E<br />
Polk 6752 Jeffries/Canady Properties LLP A415 G 0.009 0.015 0.015 E<br />
Polk 6758 Robert S. Kerr Revocable Trust A415 G 0.017 0.027 0.027 E<br />
Polk 6766 Joseph Greenfield, Byron and Harold Short A415 G 0.016 0.025 0.025 E<br />
Polk 6771 Lisa Young Rath & Daryl Scott Young A415 G 0.007 0.012 0.012 E<br />
Polk 6776 David & Wanda Jackson A415 G 0.003 0.005 0.005 E<br />
Polk 6791 John A Jr & Allison Stephens A415 G 0.006 0.01 0.01 E<br />
Polk 6813 <strong>Florida</strong> Fish & Wildlife Conservation Commission A415 G 0.04 0.055 0.055 E<br />
Polk 6820 ELJAY PROPERTIES LLP A475 G 0.058 0.095 0.095 E<br />
Polk 6834 Sultenfuss Ltd., Family Limited Partnership A415 G 0.007 0.011 0.011 E<br />
Polk 6848 Bennie Eugene Lewis L600 G 0 0 0 E<br />
Polk 6856 Goff Properties LLC A415 G 0.009 0.015 0.015 E<br />
Polk 6859 Curtis Wheeler A535 G 0.009 0.015 0.015 E<br />
Polk 6864 John Borders A535 G 0.052 0.131 0.131 E<br />
Polk 6864 John Borders A535 S 0.043 0.131 0.131 E<br />
Polk 6897 William G & Janet C Ward A415 G 0.006 0.01 0.01 E<br />
Polk 6913 Strickland & Smith, Inc. A415 G 0.007 0.011 0.011 E<br />
Polk 6917 Marguerite Pitsikoulis A415 G 0.003 0.005 0.005 E<br />
Polk 6919 John Saith A415 G 0.047 0.066 0.066 E<br />
Polk 6932 Dundee Citrus Growers Assoc A415 G 0.011 0.018 0.018 E<br />
Polk 6934 Carson Futch A415 G 0.052 0.072 0.072 E<br />
Polk 6936 Quina Family LLC A415 G 0.012 0.02 0.02 E<br />
Polk 6937 Cherry Bee Inc. A415 G 0.024 0.039 0.039 E<br />
Polk 6940 Alturas Twin Lakes Grove LLC A415 G 0.12 0.167 0.167 E<br />
Polk 6970 Godwin Groves Inc A415 G 0.023 0.038 0.038 E<br />
Polk 6984 Erling Oie Living Trust A415 G 0.004 0.006 0.006 E<br />
Polk 6987 Co‐Operative Fruit Company A415 G 0.046 0.063 0.063 E<br />
Polk 6988 Luke C Oie Rev Trust & Melissa A Oie Rev Trust A415 G 0.018 0.03 0.03 E<br />
Polk 6994 C Land Inc A415 G 0.01 0.016 0.016 E<br />
Polk 7000 Ernestine B Durrance A415 G 0.018 0.034 0.034 E<br />
Polk 7000 Ernestine B Durrance A415 S 0.003 0.034 0.034 E<br />
M/E 5<br />
Page | 311
<strong>2011</strong> ESTIMATED WATER USE REPORT<br />
Table A7. Metered and <strong>Estimated</strong> Agricultural WUPs, Withdrawals and Permitted <strong>Use</strong> (mgd), <strong>2011</strong><br />
County<br />
WUP<br />
Number<br />
Permittee<br />
Polk 7028 SUSAn S. & Thomas A. Thayer, Jr. A415 G 0.039 0.055 0.055 E<br />
Polk 7039 Donnie G Alford As Trustee Of The Donnie G Alford Tr A415 G 0.024 0.04 0.04 E<br />
Polk 7052 South Property Holdings LLC A415 G 0.046 0.064 0.064 E<br />
Polk 7053 Lake Hancock Partners LLLP A415 G 0.128 0.2 0.2 E<br />
Polk 7054 Beverly A & Bryan Mixon A410 G 0.003 0.005 0.005 E<br />
Polk 7063 Nimby Development Group Inc A415 G 0.012 0.02 0.02 E<br />
Polk 7074 Robert And Carol Bemman A410 G 0.002 0.004 0.004 E<br />
Polk 7079 Imperial Polk Properties Inc A415 G 0.017 0.028 0.028 E<br />
Polk 7080 Danny L. Thomas A415 G 0.024 0.039 0.039 E<br />
7092 Keith'S Nursery Inc, Keith & Dellis Wayne Bass & A480<br />
0.029 0.064 0.064<br />
Polk<br />
Pamela Childs<br />
G<br />
E<br />
7092 Keith'S Nursery Inc, Keith & Dellis Wayne Bass & A480<br />
0.01 0.064 0.064<br />
Polk<br />
Pamela Childs<br />
S<br />
E<br />
Polk 7106 Faye I Milbrodt Trustee Of Faye I Milbrodt Rev Trust A415 G 0.006 0.009 0.009 E<br />
Polk 7138 Gary D & Elizabeth J Robinson A415 G 0.025 0.041 0.041 E<br />
Polk 7144 Thomas E. Davis A415 G 0.019 0.031 0.031 E<br />
Polk 7146 Julie Elliott L600 G 0 0.001 0.001 E<br />
Polk 7152 Sultenfuss Ltd., Family Limited Partnership A415 G 0.01 0.016 0.016 E<br />
Polk 7154 Rogerosa Farms LLLP A415 G 0.023 0.037 0.037 E<br />
Polk 7156 Samuel E. & David A. Duke A415 G 0.007 0.011 0.011 E<br />
Polk 7170 Eugene Stuart Paul Limited Partnership A415 G 0.009 0.015 0.015 E<br />
Polk 7171 Joseph Esposito A410 G 0.01 0.017 0.017 E<br />
Polk 7177 Quina Family LLC A415 G 0.006 0.009 0.009 E<br />
Polk 7191 Flood Groves Corp A415 G 0.015 0.025 0.025 E<br />
Polk 7192 Davis Bros Inc A415 G 0.006 0.01 0.01 E<br />
Polk 7203 Mt Olive Holdings Inc A415 G 0.063 0.087 0.087 E<br />
Polk 7211 A Louise Voigt A415 G 0.011 0.018 0.018 E<br />
Polk 7215 Josef Kleine A415 G 0.011 0.019 0.019 E<br />
Polk 7219 Willis Properties Inc A415 G 0.008 0.013 0.013 E<br />
Polk 7221 Clear Springs Enterprises LLC A415 G 0.02 0.032 0.032 E<br />
Polk 7227 Putnam Groves, Inc. A415 G 0.014 0.023 0.023 E<br />
Page | 312<br />
<strong>Southwest</strong> <strong>Florida</strong> <strong>Water</strong> <strong>Management</strong> District<br />
<strong>Use</strong><br />
Code 1<br />
Source 2<br />
Annual<br />
Average<br />
Pumpage 3<br />
Total<br />
Permitted<br />
Annual<br />
Average<br />
Quantity<br />
Permitted<br />
Quantity<br />
Attributed<br />
to AG <strong>Use</strong><br />
Category 4<br />
M/E 5
<strong>2011</strong> ESTIMATED WATER USE REPORT<br />
Table A7. Metered and <strong>Estimated</strong> Agricultural WUPs, Withdrawals and Permitted <strong>Use</strong> (mgd), <strong>2011</strong><br />
County<br />
WUP<br />
Number<br />
<strong>Southwest</strong> <strong>Florida</strong> <strong>Water</strong> <strong>Management</strong> District<br />
Permittee<br />
<strong>Use</strong><br />
Code 1<br />
Source 2<br />
Annual<br />
Average<br />
Pumpage 3<br />
Total<br />
Permitted<br />
Annual<br />
Average<br />
Quantity<br />
Permitted<br />
Quantity<br />
Attributed<br />
to AG <strong>Use</strong><br />
Category 4<br />
Polk 7228 James F & Gaynell D Stoutz A415 G 0.002 0.003 0.003 E<br />
Polk 7230 Story Groves Inc A415 G 0.009 0.015 0.015 E<br />
Polk 7242 Dicks Partnership A415 G 0.006 0.01 0.01 E<br />
Polk 7245 David W & Marla Spann Lanier A415 G 0.006 0.019 0.019 E<br />
Polk 7246 Systemized Properties Inc A415 G 0.021 0.035 0.035 E<br />
Polk 7247 Jimmy Alvarez & Mary Alvarez L660 G 0.032 0.053 0.053 E<br />
Polk 7250 Brent & Betsy Monk A415 G 0.052 0.071 0.071 E<br />
Polk 7257 <strong>Florida</strong> Dept Of Ag & Consumer Services A415 G 0.002 0.008 0.008 E<br />
Polk 7263 L M Hollister Groves Inc A415 G 0.019 0.031 0.031 E<br />
Polk 7264 Lake Buffam Groves Inc A415 G 0.044 0.06 0.06 E<br />
Polk 7275 Calvary Baptist Church Of Winter Haven A460 G 0.004 0.006 0.006 E<br />
Polk 7303 Charles Fry & Ruby Fry A58S G 0.005 0.008 0.008 E<br />
Polk 7305 Lannie James Cooper A415 G 0.005 0.008 0.008 E<br />
Polk 7316 Stenger Grove Service Inc A415 G 0.02 0.032 0.032 E<br />
Polk 7317 Flying V ,Inc A415 G 0.008 0.013 0.013 E<br />
Polk 7319 Griffin Groves Inc A415 G 0.017 0.027 0.027 E<br />
Polk 7321 Sun Ariana LLC A460 G 0.007 0.011 0.011 E<br />
Polk 7336 Katherine Jean Clancy & Heather D Clancy, Trustees A535 G 0.026 0.042 0.042 E<br />
Polk 7377 Florence M. Hamilton Revocable Trust A415 G 0.002 0.003 0.003 E<br />
Polk 7378 Strang Groves LLC A415 G 0.016 0.026 0.026 E<br />
Polk 7379 Kennwood On The Lake POA Inc A415 G 0.022 0.042 0.039 E<br />
Polk 7381 Bok Tower Gardens Foundation Inc A415 G 0.006 0.01 0.01 E<br />
Polk 7389 L Dicks Inc & Richard Gary Dicks Etal A415 G 0.042 0.062 0.062 E<br />
Polk 7391 Patrick M. Richart Revocable Trust A415 G 0.006 0.01 0.01 E<br />
Polk 7392 Timothy A Irby A415 G 0.012 0.02 0.02 E<br />
Polk 7393 Polk County School Board A415 G 0.009 0.021 0.015 E<br />
Polk 7400 Westside Ridge Ltd A460 G 0.003 0.006 0.006 E<br />
Polk 7403 Sharon Ann Brannen A415 G 0.01 0.017 0.017 E<br />
Polk 7416 Sharon Ann Brannen A415 G 0.006 0.01 0.01 E<br />
Polk 7427 I W Colburn A415 G 0.007 0.012 0.012 E<br />
Polk 7431 Whaley W & Trena L Lorenz A415 G 0.012 0.02 0.02 E<br />
M/E 5<br />
Page | 313
<strong>2011</strong> ESTIMATED WATER USE REPORT<br />
Table A7. Metered and <strong>Estimated</strong> Agricultural WUPs, Withdrawals and Permitted <strong>Use</strong> (mgd), <strong>2011</strong><br />
County<br />
WUP<br />
Number<br />
<strong>Southwest</strong> <strong>Florida</strong> <strong>Water</strong> <strong>Management</strong> District<br />
Permittee<br />
<strong>Use</strong><br />
Code 1<br />
Source 2<br />
Annual<br />
Average<br />
Pumpage 3<br />
Total<br />
Permitted<br />
Annual<br />
Average<br />
Quantity<br />
Permitted<br />
Quantity<br />
Attributed<br />
to AG <strong>Use</strong><br />
Category 4<br />
Polk 7439 Irby Groves Inc A415 G 0.008 0.013 0.013 E<br />
Polk 7453 Harold E & Amy F Thompson A415 G 0 0.015 0.015 E<br />
Polk 7473 Alick S Gerard III A415 G 0.006 0.01 0.01 E<br />
Polk 7501 Donley Family Limited Partnership A490 G 0.009 0.015 0.015 E<br />
Polk 7509 Putnam Groves Inc A415 G 0.007 0.012 0.012 E<br />
Polk 7524 Tree‐O Groves Inc A415 G 0.02 0.032 0.032 E<br />
Polk 7527 Haven Citrus Enterprises, Inc A415 G 0.014 0.024 0.024 E<br />
Polk 7529 William III & Eliazbeth L Putnam A415 G 0.012 0.019 0.019 E<br />
Polk 7541 Kenneth & Donnie Reynolds A415 G 0.003 0.004 0.004 E<br />
Polk 7542 Highland Park Service Co A415 G 0.021 0.035 0.035 E<br />
Polk 7547 Jonathan Maxcy Inc A415 G 0.024 0.04 0.04 E<br />
Polk 7549 Jonathan Maxcy Inc A415 G 0.025 0.041 0.041 E<br />
Polk 7560 Eleanor H Lawrence Trust A415 G 0.005 0.008 0.008 E<br />
Polk 7569 Thomas C & Louise Harrington A415 G 0.006 0.01 0.01 E<br />
Polk 7571 Quentin J. and Lori J. Roe A415 G 0.015 0.025 0.025 E<br />
Polk 7574 Village Church Of God Inc A415 G 0.017 0.028 0.028 E<br />
Polk 7575 Donley Family Limited Partnership A415 G 0.037 0.051 0.051 E<br />
Polk 7584 PH Citrus LLC A415 G 0.06 0.098 0.098 E<br />
Polk 7598 Henderson Pace LLC A415 G 0.046 0.064 0.064 E<br />
Polk 7599 Dicks Brothers Citrus A415 G 0.039 0.054 0.054 E<br />
Polk 7610 G W Mann Jr A415 G 0.009 0.034 0.022 E<br />
Polk 7625 Jack P & Meribeth J Sizemore A415 G 0.005 0.008 0.008 E<br />
Polk 7626 Tillis & Sons Inc A415 G 0.012 0.02 0.02 E<br />
Polk 7644 Cooperative Fruit Company A415 G 0.032 0.053 0.053 E<br />
Polk 7645 Iam P And Catherine Bhisitkul A460 G 0.001 0.001 0.001 E<br />
Polk 7656 Canaan Land Investors, LLC. A415 G 0.012 0.02 0.02 E<br />
Polk 7657 Story Groves Inc A415 G 0.012 0.019 0.019 E<br />
Polk 7676 Jack Berry Jr A415 G 0.006 0.01 0.01 E<br />
Polk 7678 Darwin, Dewayne & Geneva T Cliett A415 G 0.006 0.01 0.01 E<br />
Polk 7680 D Scott Young & Lisa Y Rath A415 G 0.007 0.011 0.011 E<br />
Polk 7690 Tim Irby A415 G 0.05 0.069 0.069 E<br />
M/E 5<br />
Page | 314
<strong>2011</strong> ESTIMATED WATER USE REPORT<br />
Table A7. Metered and <strong>Estimated</strong> Agricultural WUPs, Withdrawals and Permitted <strong>Use</strong> (mgd), <strong>2011</strong><br />
County<br />
WUP<br />
Number<br />
<strong>Southwest</strong> <strong>Florida</strong> <strong>Water</strong> <strong>Management</strong> District<br />
Permittee<br />
<strong>Use</strong><br />
Code 1<br />
Source 2<br />
Annual<br />
Average<br />
Pumpage 3<br />
Total<br />
Permitted<br />
Annual<br />
Average<br />
Quantity<br />
Permitted<br />
Quantity<br />
Attributed<br />
to AG <strong>Use</strong><br />
Category 4<br />
Polk 7700 Seay Groves Inc A415 G 0.052 0.072 0.072 E<br />
Polk 7716 Mary E. Rubush Tr A415 G 0.006 0.01 0.01 E<br />
Polk 7794 Charles S & Vicki W Cook A415 G 0.02 0.034 0.034 E<br />
Polk 7794 Charles S & Vicki W Cook A415 S 0.001 0.034 0.034 E<br />
Polk 7797 John C Sr & John C Barnett Jr A415 G 0.029 0.048 0.048 E<br />
Polk 7801 John C Barnett Sr A415 G 0.022 0.036 0.036 E<br />
Polk 7824 City of Lakeland Parks & Recreation Department A485 G 0.004 0.027 0.007 E<br />
Polk 7838 Griffin Family Ltd Partnership A415 G 0.025 0.041 0.041 E<br />
Polk 7864 Thomas V & SUSAn J Davidson A415 G 0.041 0.057 0.057 E<br />
Polk 7866 Highland Park Service Co A415 G 0.03 0.049 0.049 E<br />
7886 Brent I Monk Trust Of The Brent Monk Rev Trust & A415<br />
0.021 0.035 0.035<br />
Polk<br />
Betsy Monk<br />
G<br />
E<br />
Polk 7916 Estates Of Lake Wales LLC A415 G 0.006 0.01 0.01 E<br />
Polk 7929 Tony Wise And Rudy Wise A415 G 0.012 0.02 0.02 E<br />
Polk 7934 Terranova Holdings Inc A415 G 0.012 0.019 0.019 E<br />
Polk 7937 William S Vorous Jr A415 G 0 0.009 0.009 E<br />
Polk 7948 John C & Iris Jean Barnett A415 G 0.009 0.014 0.014 E<br />
Polk 7966 Lago Properties LLC A415 G 0.038 0.053 0.053 E<br />
Polk 7969 Richard Karppe & Charles R Shearon A410 G 0.015 0.048 0.048 E<br />
Polk 7969 Richard Karppe & Charles R Shearon A410 S 0 0.048 0.048 E<br />
Polk 7972 Mcneil Investments C/O William G Roe & Sons Inc A415 G 0.004 0.008 0.007 E<br />
Polk 7973 Devane Citrus Inc A415 G 0.01 0.017 0.017 E<br />
Polk 7986 Crews Groves Inc A415 G 0.011 0.018 0.018 E<br />
Polk 7996 Richard H & Frances J Davis A415 G 0.01 0.016 0.016 E<br />
Polk 8004 Combee Properties Ltd A415 G 0.006 0.009 0.009 E<br />
Polk 8021 Wise Seed Co Inc A415 G 0.005 0.009 0.009 E<br />
Polk 8028 Watson Charles E. and Pamela L. A415 G 0.046 0.064 0.064 E<br />
Polk 8035 Robert J Cook A415 G 0.006 0.01 0.01 E<br />
Polk 8037 John P Adams A415 G 0.019 0.032 0.032 E<br />
Polk 8038 John P Adams A415 G 0.012 0.019 0.019 E<br />
Polk 8040 Don & Barbara J Ruster A415 G 0.006 0.01 0.01 E<br />
M/E 5<br />
Page | 315
<strong>2011</strong> ESTIMATED WATER USE REPORT<br />
Table A7. Metered and <strong>Estimated</strong> Agricultural WUPs, Withdrawals and Permitted <strong>Use</strong> (mgd), <strong>2011</strong><br />
County<br />
WUP<br />
Number<br />
<strong>Southwest</strong> <strong>Florida</strong> <strong>Water</strong> <strong>Management</strong> District<br />
Permittee<br />
<strong>Use</strong><br />
Code 1<br />
Source 2<br />
Annual<br />
Average<br />
Pumpage 3<br />
Total<br />
Permitted<br />
Annual<br />
Average<br />
Quantity<br />
Permitted<br />
Quantity<br />
Attributed<br />
to AG <strong>Use</strong><br />
Category 4<br />
Polk 8045 Duke Groves A415 G 0.006 0.01 0.01 E<br />
Polk 8052 Sultenfuss Frostproof LLC A415 G 0.027 0.074 0.074 E<br />
Polk 8080 Jonathan Maxcy Inc A415 G 0.022 0.036 0.036 E<br />
Polk 8092 Myers Groves Inc A415 G 0.012 0.019 0.019 E<br />
Polk 8094 Myers & Woolfolk Groves Inc A415 G 0.052 0.072 0.072 E<br />
Polk 8097 Estates Of Lake Wales LLC A415 G 0.018 0.029 0.029 E<br />
Polk 8111 Atlas Business Assoc Ltd A415 G 0.006 0.01 0.01 E<br />
Polk 8113 Bernard Terence Schimmel & Beverly Ann Barbour A415 S 0.007 0.011 0.011 E<br />
Polk 8114 Gary Lombardi A415 G 0.012 0.019 0.019 E<br />
Polk 8119 Paolo & Bernadine C Lanzano A415 G 0.024 0.039 0.039 E<br />
Polk 8140 Double Oj Inc A415 G 0.038 0.053 0.053 E<br />
Polk 8152 Hunt Bros Inc A415 G 0.006 0.01 0.01 E<br />
Polk 8168 H & D Groves Inc. A415 G 0.006 0.011 0.011 E<br />
Polk 8200 Farrington Groves Partnership A415 G 0.009 0.015 0.015 E<br />
Polk 8208 Steven and Tina Lanier A415 G 0.038 0.053 0.053 E<br />
Polk 8229 Jacob Groves Inc & Jacob Groves A415 G 0.024 0.039 0.039 E<br />
Polk 8230 Jacob Groves Inc A415 G 0.012 0.019 0.019 E<br />
Polk 8231 Jacob Groves Inc A415 G 0.013 0.022 0.022 E<br />
Polk 8235 Maxijet Inc A415 G 0.009 0.014 0.014 E<br />
Polk 8261 Latt Maxcy Corp. A415 S 0.043 0.059 0.059 E<br />
Polk 8266 Ken & Kay Family Ltd Partnership A415 G 0.016 0.026 0.026 E<br />
Polk 8270 Kahn Service A415 G 0.017 0.029 0.029 E<br />
Polk 8272 Joel Butler A480 G 0.037 0.052 0.052 E<br />
Polk 8283 Robinson Callen Trustee A415 G 0.001 0.005 0.002 E<br />
Polk 8284 John C. Updike Jr., Family Limited Partnership, LLLP A415 G 0.017 0.029 0.029 E<br />
Polk 8290 Hunt Bros Inc A415 G 0.006 0.01 0.01 E<br />
Polk 8295 Richard D & Barbara S Fackender A415 G 0.043 0.059 0.059 E<br />
Polk 8300 Annie B Walker A415 G 0.009 0.014 0.014 E<br />
Polk 8304 Ken & Kay Family Ltd Partnership A415 S 0.006 0.009 0.009 E<br />
Polk 8305 Thomas E Davis A415 G 0.046 0.063 0.063 E<br />
Polk 8306 Ken & Kay Family Ltd Partnership A415 G 0.012 0.02 0.02 E<br />
M/E 5<br />
Page | 316
<strong>2011</strong> ESTIMATED WATER USE REPORT<br />
Table A7. Metered and <strong>Estimated</strong> Agricultural WUPs, Withdrawals and Permitted <strong>Use</strong> (mgd), <strong>2011</strong><br />
County<br />
WUP<br />
Number<br />
<strong>Southwest</strong> <strong>Florida</strong> <strong>Water</strong> <strong>Management</strong> District<br />
Permittee<br />
<strong>Use</strong><br />
Code 1<br />
Source 2<br />
Annual<br />
Average<br />
Pumpage 3<br />
Total<br />
Permitted<br />
Annual<br />
Average<br />
Quantity<br />
Permitted<br />
Quantity<br />
Attributed<br />
to AG <strong>Use</strong><br />
Category 4<br />
Polk 8307 Ken & Kay Family Ltd Partnership A415 G 0.012 0.02 0.02 E<br />
Polk 8309 Estate Of Victor B Story Sr A415 G 0.024 0.039 0.039 E<br />
Polk 8314 Regal Development Of Polk Co Inc A475 G 0.022 0.036 0.036 E<br />
Polk 8320 Emmett & Arost Groves, P. Linder, Ed Tonore A415 G 0.043 0.059 0.059 E<br />
Polk 8328 A M & Ruth P Smith Trust A415 G 0.006 0.01 0.01 E<br />
Polk 8330 R A Riley & Silver Mountain A415 S 0.024 0.039 0.039 E<br />
Polk 8332 Thomas E. Davis A415 G 0.016 0.026 0.026 E<br />
Polk 8338 D H Crews Properties Inc A415 G 0.028 0.046 0.046 E<br />
Polk 8350 Verna Atwell A415 G 0.032 0.052 0.052 E<br />
Polk 8369 Thomas E Davis A415 G 0.009 0.015 0.015 E<br />
Polk 8374 Thomas E. Davis A415 G 0.011 0.018 0.018 E<br />
Polk 8375 Gabriel Family Partners Ltd A415 G 0.008 0.013 0.013 E<br />
Polk 8378 Wise Seed Co Inc A415 G 0.005 0.009 0.009 E<br />
Polk 8383 Mary Ann Pressley A415 G 0 0.057 0.057 E<br />
Polk 8383 Mary Ann Pressley A415 S 0.03 0.057 0.057 E<br />
Polk 8393 Thomas E. Davis A415 G 0.01 0.016 0.016 E<br />
Polk 8396 Thomas E. Davis A415 G 0.014 0.023 0.023 E<br />
Polk 8404 Anne W Martin A415 G 0.067 0.093 0.093 E<br />
Polk 8408 Thomas E Davis A415 G 0.012 0.02 0.02 E<br />
Polk 8414 Benton & Norris Partnership A415 G 0.038 0.053 0.053 E<br />
Polk 8422 Davis Bros Inc A415 G 0.02 0.032 0.032 E<br />
Polk 8431 Flood Groves Corp A485 G 0.011 0.017 0.017 E<br />
Polk 8435 D G V Enterprises LLC A415 G 0.004 0.007 0.007 E<br />
Polk 8438 Ken & Kay Family Ltd Partnership A415 G 0.027 0.044 0.044 E<br />
Polk 8454 K J Holdings Inc A490 G 0.05 0.081 0.081 E<br />
Polk 8456 David Bove A480 G 0.004 0.014 0.014 E<br />
Polk 8488 Stenger Grove Service Inc A415 G 0.007 0.012 0.012 E<br />
Polk 8496 James T Birge A415 G 0.008 0.013 0.013 E<br />
Polk 8513 Gary Newell A415 G 0.011 0.018 0.018 E<br />
Polk 8535 John H ONeal A415 G 0.006 0.01 0.01 E<br />
Polk 8546 Albertson International Inc & A415 G 0.018 0.029 0.029 E<br />
M/E 5<br />
Page | 317
<strong>2011</strong> ESTIMATED WATER USE REPORT<br />
Table A7. Metered and <strong>Estimated</strong> Agricultural WUPs, Withdrawals and Permitted <strong>Use</strong> (mgd), <strong>2011</strong><br />
County<br />
WUP<br />
Number<br />
<strong>Southwest</strong> <strong>Florida</strong> <strong>Water</strong> <strong>Management</strong> District<br />
Permittee<br />
<strong>Use</strong><br />
Code 1<br />
Source 2<br />
Annual<br />
Average<br />
Pumpage 3<br />
Total<br />
Permitted<br />
Annual<br />
Average<br />
Quantity<br />
Permitted<br />
Quantity<br />
Attributed<br />
to AG <strong>Use</strong><br />
Category 4<br />
Polk 8549 D Edward & Elise B Dickinson A415 G 0.012 0.02 0.02 E<br />
Polk 8555 Frederick J & Sylvia W Bohde A415 G 0.016 0.026 0.026 E<br />
Polk 8558 Ralph L Fletcher A415 G 0.011 0.018 0.018 E<br />
Polk 8564 CDR Farms, LLC. A415 G 0.018 0.029 0.029 E<br />
Polk 8571 Devane Groves Inc A415 G 0.024 0.039 0.039 E<br />
Polk 8581 Gladys C Flora A415 G 0.017 0.028 0.028 E<br />
Polk 8582 Thomas Thayer Jr A415 G 0.05 0.07 0.07 E<br />
Polk 8583 Richard L Sr & Margaret N Crumbly A415 G 0.009 0.015 0.015 E<br />
Polk 8586 John C Barnett A415 G 0.005 0.009 0.009 E<br />
Polk 8587 Robert A & Shirley V Randall A415 G 0.005 0.007 0.007 E<br />
Polk 8594 Violet Sheffield Trust A415 G 0.007 0.012 0.012 E<br />
Polk 8604 PH Citrus LLC A415 G 0.013 0.021 0.021 E<br />
Polk 8607 Donnie G Alford As Trustee Of The Donnie G Alford Tr A415 G 0.013 0.021 0.021 E<br />
Polk 8615 Martha L Snell A58S G 0.002 0.004 0.004 E<br />
Polk 8620 B.L. Lanier & Associates A415 G 0.026 0.042 0.042 E<br />
Polk 8622 James Brantley Gabriel A415 G 0 0.01 0.01 E<br />
Polk 8631 James Brantley Gabriel A415 G 0.006 0.01 0.01 E<br />
Polk 8635 Alturas Properties LLC A415 G 0.059 0.082 0.082 E<br />
Polk 8647 Margie F Dobbs A415 G 0.015 0.024 0.024 E<br />
Polk 8653 D & L Farms Inc A415 G 0.006 0.01 0.01 E<br />
Polk 8654 John Updike Jr A415 G 0.006 0.01 0.01 E<br />
Polk 8655 Joshua Meeks A415 G 0.009 0.015 0.015 E<br />
Polk 8656 Bruce Kelley A415 G 0.006 0.01 0.01 E<br />
Polk 8731 John P & Ann D Adams A415 G 0.029 0.047 0.047 E<br />
Polk 8735 G Michael & Sharon W Mccawley A525 G 0.031 0.05 0.05 E<br />
Polk 8738 Dewey Kelly Payne A415 G 0.012 0.02 0.02 E<br />
Polk 8768 Carlton W Lowe A415 S 0.009 0.015 0.015 E<br />
Polk 8771 Dopler Groves Inc A415 G 0.009 0.015 0.015 E<br />
Polk 8775 Phyllis V Albritton Louis A Voigt & Evelyn V Farr A415 G 0.011 0.018 0.018 E<br />
Polk 8780 LMT Groves Inc A415 G 0.011 0.017 0.017 E<br />
Polk 8781 Edmar Grove LLC A415 G 0.021 0.034 0.034 E<br />
M/E 5<br />
Page | 318
<strong>2011</strong> ESTIMATED WATER USE REPORT<br />
Table A7. Metered and <strong>Estimated</strong> Agricultural WUPs, Withdrawals and Permitted <strong>Use</strong> (mgd), <strong>2011</strong><br />
County<br />
WUP<br />
Number<br />
<strong>Southwest</strong> <strong>Florida</strong> <strong>Water</strong> <strong>Management</strong> District<br />
Permittee<br />
<strong>Use</strong><br />
Code 1<br />
Source 2<br />
Annual<br />
Average<br />
Pumpage 3<br />
Total<br />
Permitted<br />
Annual<br />
Average<br />
Quantity<br />
Permitted<br />
Quantity<br />
Attributed<br />
to AG <strong>Use</strong><br />
Category 4<br />
Polk 8791 Charles J And Nancy Young III A460 G 0.004 0.006 0.006 E<br />
Polk 8792 Eleanor F Griffin A415 G 0.02 0.033 0.033 E<br />
Polk 8800 Lake Aurora Christian Assembly Inc A415 G 0.027 0.044 0.044 E<br />
Polk 8812 Cecil Baker A415 G 0.006 0.01 0.01 E<br />
Polk 8826 David Morris A415 G 0.009 0.014 0.014 E<br />
8850 Whaley Lorenz as trustee of the Whaley Ward Lorenz A415<br />
0.024 0.039 0.039<br />
Polk<br />
Family Trust<br />
G<br />
E<br />
Polk 8872 Ben Hill Griffin III A415 G 0.042 0.059 0.059 E<br />
Polk 8877 Stenger Varner LLC A415 G 0.009 0.015 0.015 E<br />
Polk 8882 Barbara H Smith A415 G 0.005 0.009 0.009 E<br />
Polk 8886 Stephen C & Debra M Bales A415 G 0.003 0.005 0.005 E<br />
Polk 8888 James L & Diane Davis A485 G 0.023 0.038 0.038 E<br />
Polk 8893 Leland Young A415 G 0.04 0.055 0.055 E<br />
Polk 8908 Stenger Grove Service Inc A415 G 0.012 0.02 0.02 E<br />
Polk 8918 Oscar W & Cd Rogers A415 G 0.019 0.031 0.031 E<br />
Polk 8921 80 Ft Rd, LLC A415 G 0.015 0.048 0.048 E<br />
Polk 8936 Lynn D Horne A475 G 0.018 0.038 0.038 E<br />
Polk 8944 Ben Hill Griffin IV A415 G 0.013 0.021 0.021 E<br />
Polk 8948 McKenzie & Cook Investments LLC A415 G 0.024 0.039 0.039 E<br />
Polk 8989 Bassett Groves Inc A415 G 0.036 0.051 0.051 E<br />
Polk 8993 J K Gene Wilson A410 G 0.006 0.011 0.011 E<br />
Polk 9001 New Living Stones Inc A415 G 0.049 0.085 0.085 E<br />
Polk 9002 E R Jahna Industries Inc A415 G 0.007 0.011 0.011 E<br />
Polk 9004 T E L A <strong>Florida</strong> General Partnership A415 G 0.019 0.031 0.031 E<br />
Polk 9010 Chalet Suzanne Properties A415 G 0.002 0.061 0.008 E<br />
Polk 9010 Chalet Suzanne Properties A415 S 0 0.061 0.008 E<br />
Polk 9012 Devane Citrus Inc A415 G 0.027 0.045 0.045 E<br />
Polk 9036 Howard & Marilyn A Gibson A415 G 0.013 0.021 0.021 E<br />
Polk 9040 Roger M Phillips A415 G 0.005 0.008 0.008 E<br />
Polk 9051 Marjo Inc A415 G 0.011 0.018 0.018 E<br />
Polk 9057 Crews Groves Inc A415 G 0.036 0.053 0.053 E<br />
M/E 5<br />
Page | 319
<strong>2011</strong> ESTIMATED WATER USE REPORT<br />
Table A7. Metered and <strong>Estimated</strong> Agricultural WUPs, Withdrawals and Permitted <strong>Use</strong> (mgd), <strong>2011</strong><br />
County<br />
WUP<br />
Number<br />
<strong>Southwest</strong> <strong>Florida</strong> <strong>Water</strong> <strong>Management</strong> District<br />
Permittee<br />
<strong>Use</strong><br />
Code 1<br />
Source 2<br />
Annual<br />
Average<br />
Pumpage 3<br />
Total<br />
Permitted<br />
Annual<br />
Average<br />
Quantity<br />
Permitted<br />
Quantity<br />
Attributed<br />
to AG <strong>Use</strong><br />
Category 4<br />
Polk 9069 Smith South Reedy Groves Inc A415 G 0.011 0.019 0.019 E<br />
Polk 9086 Robert G Stokes A415 G 0.019 0.032 0.032 E<br />
Polk 9093 Gary Newell A415 G 0.012 0.02 0.02 E<br />
Polk 9107 A.D. and Edna L. Combee A525 G 0.041 0.057 0.057 E<br />
Polk 9111 Alico Inc A415 G 0.02 0.032 0.032 E<br />
Polk 9112 H & M Citrus Inc A415 G 0.005 0.009 0.009 E<br />
Polk 9119 John C Barnett A415 G 0.029 0.048 0.048 E<br />
Polk 9126 Thomas H Wood A490 G 0.013 0.021 0.021 E<br />
Polk 9130 J A Stephens A415 G 0.035 0.057 0.057 E<br />
Polk 9139 Longs Tree Farm Inc Attn: Randy Scott A485 G 0.04 0.056 0.056 E<br />
Polk 9141 Triple A Properties Inc A415 G 0.008 0.013 0.013 E<br />
Polk 9159 Floyd K & Joyce L DeVane A415 G 0.013 0.022 0.022 E<br />
9162 Diana J & Willie C Moss Co Trustees Diana J Moss Rev A415<br />
0.004 0.007 0.007<br />
Polk<br />
Trust<br />
G<br />
E<br />
Polk 9177 Kadu‐II LLC A415 G 0.021 0.035 0.035 E<br />
Polk 9190 PH Citrus LLC A415 G 0.012 0.02 0.02 E<br />
Polk 9207 Norman O Warren A485 S 0.017 0.028 0.028 E<br />
Polk 9210 David E & Patricia L Wallace A415 G 0.004 0.007 0.007 E<br />
9217 Sylvia Peggy C Mann Trustee Of Sylvia Peggy C Mann A415<br />
0.024 0.039 0.039<br />
Polk<br />
Rev Lvg Trst<br />
G<br />
E<br />
Polk 9230 Annette P Thompson A415 G 0.012 0.02 0.02 E<br />
Polk 9253 Portokalis Groves LLC A415 G 0.007 0.011 0.011 E<br />
Polk 9255 Crooked Lake Investments LLC A415 G 0.024 0.039 0.039 E<br />
Polk 9257 Oscar W & C Dane & John Steven & William T Rogers A415 G 0.037 0.051 0.051 E<br />
Polk 9291 Timothy A Irby A415 G 0.007 0.011 0.011 E<br />
Polk 9299 David Morris A415 G 0.014 0.023 0.023 E<br />
Polk 9309 Morrison Partnership A415 G 0.006 0.01 0.01 E<br />
Polk 9325 J A Stephens A490 G 0 0.013 0.013 E<br />
Polk 9351 Kistorange LLC A415 G 0.021 0.035 0.035 E<br />
Polk 9359 Dundee Properties Inc A415 G 0.011 0.018 0.018 E<br />
Polk 9407 Robert & Carl Sons A415 G 0.048 0.066 0.066 E<br />
M/E 5<br />
Page | 320
<strong>2011</strong> ESTIMATED WATER USE REPORT<br />
Table A7. Metered and <strong>Estimated</strong> Agricultural WUPs, Withdrawals and Permitted <strong>Use</strong> (mgd), <strong>2011</strong><br />
County<br />
WUP<br />
Number<br />
<strong>Southwest</strong> <strong>Florida</strong> <strong>Water</strong> <strong>Management</strong> District<br />
Permittee<br />
<strong>Use</strong><br />
Code 1<br />
Source 2<br />
Annual<br />
Average<br />
Pumpage 3<br />
Total<br />
Permitted<br />
Annual<br />
Average<br />
Quantity<br />
Permitted<br />
Quantity<br />
Attributed<br />
to AG <strong>Use</strong><br />
Category 4<br />
Polk 9408 Eleanor F Griffin A415 G 0.006 0.01 0.01 E<br />
9430 James M & Violet V Vickers Trustees Of Rev Living A415<br />
0.017 0.028 0.028<br />
G<br />
Polk<br />
Trusts<br />
E<br />
Polk 9435 Clifton J Phares III & Bradley A415 G 0.008 0.012 0.012 E<br />
Polk 9436 Francis H Jahna A415 G 0.018 0.029 0.029 E<br />
Polk 9447 Mcteer Farms Inc A415 G 0.019 0.031 0.031 E<br />
Polk 9451 Victor B. Story Jr. A415 G 0.006 0.01 0.01 E<br />
Polk 9453 Julia E Livingston Trustee Of Julia E Livingston Trust A415 G 0.006 0.01 0.01 E<br />
Polk 9454 Julia Livingston Trustee Of The Julia E Livingston Trust A415 G 0.019 0.031 0.031 E<br />
Polk 9470 John H. Soles & Soles Grove LLC A415 G 0 0.006 0.006 E<br />
Polk 9472 Eljay Properties, LLP. L661 G 0.141 0.273 0.273 E<br />
Polk 9473 Garry E & Sonia T David L661 G 0.058 0.082 0.082 E<br />
Polk 9474 Hunt Bros Inc A415 G 0.012 0.02 0.02 E<br />
Polk 9475 Minesh Patel DBA Amelia Farms, LLC A410 G 0.042 0.089 0.089 E<br />
Polk 9475 Minesh Patel DBA Amelia Farms, LLC A410 S 0.018 0.089 0.089 E<br />
Polk 9498 David J Mcintree A415 G 0.009 0.015 0.015 E<br />
Polk 9499 James Hogan A415 G 0.014 0.022 0.022 E<br />
Polk 9500 Byrd Groves Inc A415 G 0.006 0.01 0.01 E<br />
Polk 9502 Schulz Lake Mattie Partnership A415 G 0.016 0.026 0.026 E<br />
Polk 9512 Emmett & Arost Groves A415 G 0.005 0.008 0.008 E<br />
Polk 9513 Sam Van Hook A415 G 0.007 0.012 0.012 E<br />
Polk 9514 Thomas E. Davis A415 G 0.023 0.037 0.037 E<br />
Polk 9519 Lucy Anne G Collier A415 G 0.005 0.008 0.008 E<br />
Polk 9535 Gary A & Nancy G Lombardi A415 G 0.005 0.008 0.008 E<br />
Polk 9539 James K & Sandra D Carter A415 G 0.037 0.06 0.06 E<br />
Polk 9540 D & S D'Souza & A & A D'Mello A415 G 0.008 0.012 0.012 E<br />
Polk 9541 Oscar W & C Dane Rogers A415 G 0.044 0.071 0.071 E<br />
Polk 9543 Gresham Farms Development, LLC A415 G 0.012 0.019 0.019 E<br />
Polk 9553 Charles E Clements A415 G 0.006 0.01 0.01 E<br />
Polk 9562 Traders Bay Company, Inc. A415 G 0.041 0.066 0.066 E<br />
Polk 9564 J & B Citrus A415 G 0.02 0.032 0.032 E<br />
M/E 5<br />
Page | 321
<strong>2011</strong> ESTIMATED WATER USE REPORT<br />
Table A7. Metered and <strong>Estimated</strong> Agricultural WUPs, Withdrawals and Permitted <strong>Use</strong> (mgd), <strong>2011</strong><br />
County<br />
WUP<br />
Number<br />
<strong>Southwest</strong> <strong>Florida</strong> <strong>Water</strong> <strong>Management</strong> District<br />
Permittee<br />
<strong>Use</strong><br />
Code 1<br />
Source 2<br />
Annual<br />
Average<br />
Pumpage 3<br />
Total<br />
Permitted<br />
Annual<br />
Average<br />
Quantity<br />
Permitted<br />
Quantity<br />
Attributed<br />
to AG <strong>Use</strong><br />
Category 4<br />
Polk 9576 Donald Frasier A415 G 0 0.005 0.005 E<br />
Polk 9577 Hazel Brannen A415 G 0.006 0.01 0.01 E<br />
Polk 9578 Floyd K & Sandra A Devane A415 G 0.006 0.01 0.01 E<br />
Polk 9593 J & G Groves Llc & Royce Jackson A415 G 0.01 0.017 0.017 E<br />
Polk 9597 Kings Partnership A415 G 0.006 0.019 0.019 E<br />
Polk 9604 Emil Jahna A415 G 0.007 0.012 0.012 E<br />
Polk 9606 PH Citrus LLC A415 G 0.005 0.009 0.009 E<br />
Polk 9615 School Board Of Polk County A415 G 0.019 0.032 0.032 E<br />
Polk 9623 South Property Holdings LLC A415 G 0 0.044 0.044 E<br />
Polk 9630 Glen J & Guelda V Wise Trust A415 G 0.03 0.05 0.05 E<br />
Polk 9631 Bryan Groves, Inc. A415 G 0.009 0.015 0.015 E<br />
Polk 9637 John C Barnett Sr & John C Barnett Jr A415 G 0.006 0.01 0.01 E<br />
Polk 9646 Rolling Meadow Ranch Inc A415 G 0.024 0.04 0.04 E<br />
Polk 9662 James K & Sandra D Carter A415 G 0.007 0.011 0.011 E<br />
Polk 9665 Latt Maxcy Corp. A415 G 0.022 0.035 0.035 E<br />
Polk 9669 Citrus Enterprises Inc A415 G 0.015 0.025 0.025 E<br />
Polk 9680 E R Jahna Industries Inc A415 G 0.198 0.327 0.327 E<br />
Polk 9706 Kenney Family Groves LP A415 G 0.006 0.01 0.01 E<br />
Polk 9712 Heller Brothers Packing Company A415 G 0.112 0.155 0.155 E<br />
Polk 9714 Malcolm & Richard Mckinley A415 G 0.025 0.041 0.041 E<br />
Polk 9719 John Stephens, Inc. A415 G 0.015 0.025 0.025 E<br />
Polk 9720 Frances Janet Davis A415 G 0.006 0.01 0.01 E<br />
Polk 9733 Marshall Citrus Inc A415 G 0.006 0.01 0.01 E<br />
Polk 9736 Challis Marshall Inc A415 G 0.012 0.02 0.02 E<br />
Polk 9742 C & T Groves & Lands Inc A415 G 0.042 0.058 0.058 E<br />
Polk 9752 Stephen Hollister A415 G 0.007 0.012 0.012 E<br />
Polk 9758 Young's Citrus Properties LLC A415 G 0.024 0.039 0.039 E<br />
Polk 9769 Richard L Sr & Margaret N Crumbly A415 G 0.01 0.016 0.016 E<br />
Polk 9770 Lake Marion Development Group LLC A415 G 0.015 0.024 0.024 E<br />
Polk 9784 Victor B Story Jr. Revocable Trust A415 G 0.012 0.02 0.02 E<br />
Polk 9787 Interlachen Groves Inc A415 G 0.014 0.024 0.024 E<br />
M/E 5<br />
Page | 322
<strong>2011</strong> ESTIMATED WATER USE REPORT<br />
Table A7. Metered and <strong>Estimated</strong> Agricultural WUPs, Withdrawals and Permitted <strong>Use</strong> (mgd), <strong>2011</strong><br />
County<br />
WUP<br />
Number<br />
<strong>Southwest</strong> <strong>Florida</strong> <strong>Water</strong> <strong>Management</strong> District<br />
Permittee<br />
<strong>Use</strong><br />
Code 1<br />
Source 2<br />
Annual<br />
Average<br />
Pumpage 3<br />
Total<br />
Permitted<br />
Annual<br />
Average<br />
Quantity<br />
Permitted<br />
Quantity<br />
Attributed<br />
to AG <strong>Use</strong><br />
Category 4<br />
Polk 9792 Joseph Dubois A415 G 0.002 0.01 0.01 E<br />
Polk 9793 Alico, Inc. A415 G 0.011 0.019 0.019 E<br />
Polk 9800 Samuel & David Duke A415 G 0.014 0.032 0.032 E<br />
Polk 9800 Samuel & David Duke A415 S 0 0.032 0.032 E<br />
Polk 9803 Alcoma Properties Ltd. A415 G 0.007 0.011 0.011 E<br />
Polk 9812 Gary L & Charlsie L Gatlin A415 S 0.008 0.013 0.013 E<br />
Polk 9821 Lisa M Irby A415 G 0 0.006 0.006 E<br />
Polk 9824 Doudney Investment Company A415 G 0 0.022 0.022 E<br />
Polk 9831 Clarke Gerard A415 G 0.007 0.012 0.012 E<br />
Polk 9841 Nell PheLPs A415 G 0 0.002 0.002 E<br />
Polk 9844 Atlee Davis A415 G 0 0.027 0.027 E<br />
Polk 9852 JML Land LLC A415 G 0.019 0.031 0.031 E<br />
Polk 9857 Neat And Sweet Farms, LLC A445 G 0.011 0.019 0.019 E<br />
Polk 9865 Stephen C. Bales A415 G 0.037 0.051 0.051 E<br />
Polk 9873 Fotios & Georgia Vrionis A415 G 0 0.035 0.035 E<br />
Polk 9887 Ida Averett, Sam Averett and Suzzane Butner A415 G 0.064 0.096 0.096 E<br />
Polk 9893 Judy Bice Winchester A415 G 0.012 0.02 0.02 E<br />
Polk 9928 Richard St. Petery and Roberta A. St. Petery A415 G 0.011 0.018 0.018 E<br />
Polk 9937 Griffin Family Ltd Partnership A415 G 0.012 0.02 0.02 E<br />
Polk 9943 Beacon Landscaping, Inc. A415 G 0.012 0.02 0.02 E<br />
Polk 9944 Luanne S. Collins Revocable Living Trust A415 G 0.009 0.015 0.015 E<br />
Polk 9973 James And Marilyn Best A415 G 0.024 0.039 0.039 E<br />
Polk 9975 Ken Flanagan A415 G 0.009 0.016 0.016 E<br />
Polk 9976 W.A. Gamper & Mary E. Rubush A415 G 0.012 0.02 0.02 E<br />
Polk 9989 Douglas S. and Carol I. Richards A415 S 0.008 0.014 0.014 E<br />
Polk 10001 Arnold H Mack Trust A415 G 0.006 0.01 0.01 E<br />
Polk 10002 Linda Hughes A415 G 0.003 0.005 0.005 E<br />
Polk 10031 Donald S. & Beverly McCorquodale A415 G 0.012 0.02 0.02 E<br />
Polk 10082 Carolyn Diane Lunsford & Helen Louise Lunsford A415 G 0.007 0.011 0.011 E<br />
Polk 10088 Pamela K. Richart Revocable Trust A415 G 0.012 0.02 0.02 E<br />
Polk 10089 Steve & Becky Coscia A445 G 0 0.058 0.058 E<br />
M/E 5<br />
Page | 323
<strong>2011</strong> ESTIMATED WATER USE REPORT<br />
Table A7. Metered and <strong>Estimated</strong> Agricultural WUPs, Withdrawals and Permitted <strong>Use</strong> (mgd), <strong>2011</strong><br />
County<br />
WUP<br />
Number<br />
<strong>Southwest</strong> <strong>Florida</strong> <strong>Water</strong> <strong>Management</strong> District<br />
Permittee<br />
<strong>Use</strong><br />
Code 1<br />
Source 2<br />
Annual<br />
Average<br />
Pumpage 3<br />
Total<br />
Permitted<br />
Annual<br />
Average<br />
Quantity<br />
Permitted<br />
Quantity<br />
Attributed<br />
to AG <strong>Use</strong><br />
Category 4<br />
Polk 10092 Eleanor R. Henderson A415 G 0.021 0.035 0.035 E<br />
Polk 10093 Mina Groves Inc A415 G 0.029 0.047 0.047 E<br />
Polk 10101 Nola Land Co Inc A415 G 0.018 0.029 0.029 E<br />
Polk 10102 Janet Heidtman A415 G 0.012 0.02 0.02 E<br />
Polk 10108 Hurlburt Construction Inc A415 G 0.009 0.014 0.014 E<br />
Polk 10109 Walter Steven & Pam Farr A415 S 0.011 0.017 0.017 E<br />
Polk 10112 City of Winter Haven Attn: Terry Carver A415 G 0.038 0.053 0.053 E<br />
Polk 10113 Three B's Groves LLC A415 G 0.028 0.045 0.045 E<br />
Polk 10121 Lisa Young Rath & Daryl Scott Young A415 G 0.024 0.039 0.039 E<br />
Polk 10122 Leland Young A415 G 0.007 0.014 0.014 E<br />
Polk 10122 Leland Young A415 S 0.001 0.014 0.014 E<br />
Polk 10123 C. C. Calhoun, Inc. A415 G 0.002 0.003 0.003 E<br />
Polk 10124 Hunt Bros Inc A415 G 0.019 0.031 0.031 E<br />
Polk 10126 Hunt Bros Inc A415 G 0 0.008 0.008 E<br />
Polk 10128 L Russell & SUSAn B Flood A415 G 0 0.01 0.01 E<br />
Polk 10129 Hunt Bros Inc A415 G 0 0.012 0.012 E<br />
Polk 10132 James J Kelley A415 G 0.014 0.023 0.023 E<br />
Polk 10133 Unadilla Corporation A415 G 0.009 0.015 0.015 E<br />
Polk 10134 Hunt Bros Inc A415 G 0.009 0.015 0.015 E<br />
Polk 10135 Lloyd W Wise Jr A415 G 0.005 0.008 0.008 E<br />
Polk 10136 Hunt Bros Inc A415 G 0.012 0.02 0.02 E<br />
Polk 10146 John C Barnett A415 G 0 0.026 0.026 E<br />
Polk 10147 Leslie W III & Virginia T Dunson A415 G 0.023 0.037 0.037 E<br />
Polk 10156 Amir Ahmad & Associates Partnership A415 G 0.008 0.013 0.013 E<br />
Polk 10168 Sunrise Tropicals Inc L660 G 0.035 0.104 0.104 E<br />
Polk 10168 Sunrise Tropicals Inc L660 S 0.005 0.104 0.104 E<br />
Polk 10171 Dicks Partnership A415 G 0.019 0.031 0.031 E<br />
Polk 10173 Primrose M Hollinsed A415 G 0.006 0.009 0.009 E<br />
Polk 10210 Trustee of Elizabeth McLaughlin Crum Trust A410 G 0.021 0.035 0.035 E<br />
Polk 10219 Bernard R & Elizabeth B Martin A415 G 0.006 0.009 0.009 E<br />
Polk 10222 Emmett & Arost Groves A415 G 0.005 0.008 0.008 E<br />
M/E 5<br />
Page | 324
<strong>2011</strong> ESTIMATED WATER USE REPORT<br />
Table A7. Metered and <strong>Estimated</strong> Agricultural WUPs, Withdrawals and Permitted <strong>Use</strong> (mgd), <strong>2011</strong><br />
County<br />
WUP<br />
Number<br />
<strong>Southwest</strong> <strong>Florida</strong> <strong>Water</strong> <strong>Management</strong> District<br />
Permittee<br />
<strong>Use</strong><br />
Code 1<br />
Source 2<br />
Annual<br />
Average<br />
Pumpage 3<br />
Total<br />
Permitted<br />
Annual<br />
Average<br />
Quantity<br />
Permitted<br />
Quantity<br />
Attributed<br />
to AG <strong>Use</strong><br />
Category 4<br />
Polk 10231 Byrd Groves Inc A415 G 0.025 0.058 0.058 E<br />
Polk 10234 Rolfe G Thompson&Diane Van Dusen 45 A415 G 0.052 0.071 0.071 E<br />
Polk 10241 L & E Inc A415 G 0.019 0.031 0.031 E<br />
Polk 10261 Helen V Wilkinson A415 G 0.011 0.018 0.018 E<br />
Polk 10271 Patricia H Wilkerson A415 G 0.01 0.016 0.016 E<br />
Polk 10273 Clarence P Hickman A415 G 0 0.001 0.001 E<br />
Polk 10294 Otto Polk Inc A415 G 0.003 0.045 0.045 E<br />
Polk 10295 Richland LLC A410 G 0.004 0.007 0.007 E<br />
Polk 10297 John C Sr & John C Barnett Jr A415 G 0 0.01 0.01 E<br />
Polk 10308 Charles E Bailey A535 G 0.05 0.07 0.07 E<br />
Polk 10308 Charles E Bailey A535 S 0 0.07 0.07 E<br />
Polk 10310 Reed Brothers, Inc. Dba Reed Brothers Citrus A415 G 0.017 0.029 0.029 E<br />
Polk 10312 <strong>Florida</strong> Best Farms, Inc. A410 G 0.018 0.06 0.06 E<br />
Polk 10319 Stephens 4 Inc A415 G 0 0.007 0.007 E<br />
Polk 10322 Putnam Groves, Inc. A415 G 0 0.012 0.012 E<br />
Polk 10336 80 Ft Rd, LLC A415 G 0.016 0.026 0.026 E<br />
Polk 10343 Shirley R Morris Marital Trust and Byrd Groves, Inc. A415 G 0.022 0.036 0.036 E<br />
Polk 10346 Peace River Packing Company, Inc. A415 G 0.019 0.031 0.031 E<br />
Polk 10355 Lewis Lake Garfield, LLC A415 G 0.013 0.021 0.021 E<br />
Polk 10367 John Stephens, Inc. A415 G 0.015 0.025 0.025 E<br />
Polk 10382 Marilynn M Everett Trustee A415 G 0.006 0.01 0.01 E<br />
Polk 10405 B Bar J Ranch Inc A415 G 0.041 0.057 0.057 E<br />
Polk 10418 Polk County School Board A480 G 0.004 0.069 0.009 E<br />
Polk 10425 Kistorange LLC A415 G 0.015 0.025 0.025 E<br />
Polk 10468 Sharon Roberts A410 G 0.003 0.005 0.005 E<br />
Polk 10478 Cynthia Deleen Dawes L600 G 0.001 0.004 0.004 E<br />
Polk 10482 Cemex Const Materials <strong>Florida</strong> A415 G 0.002 0.026 0.023 E<br />
Polk 10482 Cemex Const Materials <strong>Florida</strong> A415 S 0.012 0.026 0.023 E<br />
Polk 10489 Ellis Groves, LLC A415 G 0.016 0.026 0.026 E<br />
Polk 10512 Faisal Fakih A415 G 0.013 0.022 0.022 E<br />
Polk 10514 Wells <strong>Florida</strong> Land Corp A415 G 0.046 0.063 0.063 E<br />
M/E 5<br />
Page | 325
<strong>2011</strong> ESTIMATED WATER USE REPORT<br />
Table A7. Metered and <strong>Estimated</strong> Agricultural WUPs, Withdrawals and Permitted <strong>Use</strong> (mgd), <strong>2011</strong><br />
County<br />
WUP<br />
Number<br />
<strong>Southwest</strong> <strong>Florida</strong> <strong>Water</strong> <strong>Management</strong> District<br />
Permittee<br />
<strong>Use</strong><br />
Code 1<br />
Source 2<br />
Annual<br />
Average<br />
Pumpage 3<br />
Total<br />
Permitted<br />
Annual<br />
Average<br />
Quantity<br />
Permitted<br />
Quantity<br />
Attributed<br />
to AG <strong>Use</strong><br />
Category 4<br />
Polk 10523 Gapway Grove Corp & Strang Groves, LLC A415 G 0.024 0.039 0.039 E<br />
Polk 10526 Robert Kerr A415 G 0.007 0.011 0.011 E<br />
Polk 10528 Holly Hill Fruit Products Co Inc A415 G 0.041 0.056 0.056 E<br />
Polk 10529 Robert Kerr A415 G 0.011 0.017 0.017 E<br />
Polk 10531 Farrington Groves Partnership A415 G 0.006 0.01 0.01 E<br />
Polk 10545 Hunt Bros Service Inc A415 G 0 0.06 0.06 E<br />
Polk 10556 Edwin D Mercer Revocable Trust A415 G 0.009 0.014 0.014 E<br />
Polk 10571 Sarah Leigh Boutwell Revocable Living Trust A525 G 0.141 0.195 0.195 E<br />
Polk 10572 Ronald W & Sarah Boutwell‐Aka Leigh Boutwell A525 G 0.126 0.247 0.247 E<br />
Polk 10575 Sunshine Growers Inc A480 G 0.019 0.031 0.031 E<br />
Polk 10576 Jando Inc A490 G 0.005 0.008 0.008 E<br />
Polk 10583 D Keith Emmett & Stuart L Arost A415 G 0.014 0.023 0.023 E<br />
Polk 10588 Latt Maxcy Corp. A415 G 0.012 0.02 0.02 E<br />
Polk 10591 Ben Hill Griffin, Inc. A415 G 0.012 0.02 0.02 E<br />
Polk 10593 Flood Groves Corp A415 G 0.041 0.057 0.057 E<br />
Polk 10594 Flood Groves Corp A415 G 0.017 0.029 0.029 E<br />
Polk 10595 Flood Groves Corp A415 G 0.025 0.041 0.041 E<br />
Polk 10596 Flood Groves Corp A415 G 0.006 0.01 0.01 E<br />
Polk 10597 Donley Family Ltd Partnership A415 G 0.028 0.046 0.046 E<br />
Polk 10600 Albritton & Sons Ltd A415 G 0.021 0.034 0.034 E<br />
Polk 10602 Albritton & Sons Ltd A415 G 0.05 0.07 0.07 E<br />
Polk 10613 Glen J & Guelda V Wise Trust A415 S 0.056 0.077 0.077 E<br />
Polk 10620 Walter A Payne A415 G 0.007 0.012 0.012 E<br />
Polk 10634 Wekiva Groves Inc C/O Philip F Keidaish Jr A415 G 0.005 0.009 0.009 E<br />
Polk 10643 John A Attaway Sr Trust & Turner Investments Ltd A415 G 0.005 0.009 0.009 E<br />
Polk 10658 Square X Investments LLC A415 G 0.007 0.011 0.011 E<br />
Polk 10668 Trevor A And Phyllis P Williamson A415 G 0.006 0.01 0.01 E<br />
Polk 10703 Norbert M Dorsey As Bishop Of The Diocese Of Orlando A415 G 0.011 0.018 0.018 E<br />
Polk 10706 Edward L Flood A415 G 0.017 0.028 0.028 E<br />
Polk 10707 Ottawa Trust A415 S 0.006 0.01 0.01 E<br />
Polk 10708 Ottawa Trust A415 S 0.006 0.009 0.009 E<br />
M/E 5<br />
Page | 326
<strong>2011</strong> ESTIMATED WATER USE REPORT<br />
Table A7. Metered and <strong>Estimated</strong> Agricultural WUPs, Withdrawals and Permitted <strong>Use</strong> (mgd), <strong>2011</strong><br />
County<br />
WUP<br />
Number<br />
<strong>Southwest</strong> <strong>Florida</strong> <strong>Water</strong> <strong>Management</strong> District<br />
Permittee<br />
<strong>Use</strong><br />
Code 1<br />
Source 2<br />
Annual<br />
Average<br />
Pumpage 3<br />
Total<br />
Permitted<br />
Annual<br />
Average<br />
Quantity<br />
Permitted<br />
Quantity<br />
Attributed<br />
to AG <strong>Use</strong><br />
Category 4<br />
Polk 10713 Sun Orchard Of <strong>Florida</strong> A415 G 0.006 0.01 0.01 E<br />
Polk 10714 Victor B Story Jr‐Kyle R Story & Matthew S Story A415 G 0.021 0.034 0.034 E<br />
Polk 10718 John Jr. & Deedra Allen Revocable Living Trust A480 G 0.034 0.055 0.055 E<br />
Polk 10727 Keith G Salmi & Beverly Kington A415 G 0.006 0.01 0.01 E<br />
Polk 10728 Earl P & Mattie Marie Driggers A535 G 0.038 0.053 0.053 E<br />
Polk 10729 Highlands Enhancement Inc A415 G 0.026 0.043 0.043 E<br />
Polk 10739 Dan F Smith A415 G 0.001 0.01 0.01 E<br />
Polk 10740 Joseph Palermo A415 G 0.001 0.011 0.011 E<br />
Polk 10743 Wise Seed Co Inc A415 G 0.024 0.039 0.039 E<br />
Polk 10746 Van Fleet Estates Hoa A460 G 0 0.001 0.001 E<br />
Polk 10751 Fletcher Groves Inc A415 G 0.006 0.01 0.01 E<br />
Polk 10756 Irven Enterprises, Inc. A415 G 0.014 0.023 0.023 E<br />
Polk 10761 Stephens 4 Inc A415 G 0.012 0.019 0.019 E<br />
Polk 10785 Gary L & Danielle A Crooks A415 G 0.019 0.032 0.032 E<br />
Polk 10801 Charles A Congdon A415 G 0.013 0.021 0.021 E<br />
Polk 10803 Jhm Grove Partnership A415 G 0.008 0.013 0.013 E<br />
Polk 10804 Byrd Groves Inc A415 G 0.004 0.009 0.009 E<br />
Polk 10815 Consolidated Holding Company Of Lakeland Inc A415 G 0.006 0.011 0.011 E<br />
Polk 10816 Hickory Branch Corp C/O Mark Dunn A415 G 0.011 0.018 0.018 E<br />
Polk 10841 Danny L & Betty A Thomas A415 G 0.026 0.068 0.068 E<br />
Polk 10841 Danny L & Betty A Thomas A415 S 0 0.068 0.068 E<br />
Polk 10849 Putnam Groves Inc A415 G 0.02 0.032 0.032 E<br />
Polk 10853 Varner Marketing Company A415 G 0.011 0.035 0.035 E<br />
Polk 10857 Maristela Ferrari A415 G 0.032 0.053 0.053 E<br />
Polk 10858 Curtis T & Peggie S Campbell A415 G 0.007 0.012 0.012 E<br />
Polk 10862 M & M Groves Inc & Morrison Yager Inc A415 G 0.016 0.027 0.027 E<br />
Polk 10864 H O M Partners A415 G 0.005 0.009 0.009 E<br />
Polk 10878 Bok Tower Gardens Foundation Inc A415 G 0.006 0.009 0.009 E<br />
Polk 10915 Stenger Grove Service Inc A415 G 0.011 0.019 0.019 E<br />
Polk 10929 William G Roe II A415 G 0.005 0.008 0.008 E<br />
Polk 10938 Fred B Klote A460 G 0.003 0.006 0.006 E<br />
M/E 5<br />
Page | 327
<strong>2011</strong> ESTIMATED WATER USE REPORT<br />
Table A7. Metered and <strong>Estimated</strong> Agricultural WUPs, Withdrawals and Permitted <strong>Use</strong> (mgd), <strong>2011</strong><br />
County<br />
WUP<br />
Number<br />
<strong>Southwest</strong> <strong>Florida</strong> <strong>Water</strong> <strong>Management</strong> District<br />
Permittee<br />
<strong>Use</strong><br />
Code 1<br />
Source 2<br />
Annual<br />
Average<br />
Pumpage 3<br />
Total<br />
Permitted<br />
Annual<br />
Average<br />
Quantity<br />
Permitted<br />
Quantity<br />
Attributed<br />
to AG <strong>Use</strong><br />
Category 4<br />
Polk 10955 Hawkins Hegarty Properties LLC A415 G 0.009 0.015 0.015 E<br />
Polk 10974 Edmar Grove LLC A415 G 0.021 0.034 0.034 E<br />
Polk 10976 James W. Thompson A480 G 0.05 0.069 0.069 E<br />
Polk 10990 Charles Stewart Dba S & S Groves A415 G 0.011 0.017 0.017 E<br />
Polk 10991 Edenfield Groves Inc A415 G 0.022 0.035 0.035 E<br />
Polk 11011 Dana C Campbell Jr & Amy M Kerstein A415 G 0.006 0.01 0.01 E<br />
Polk 11015 Peace River Packing Company, Inc. A415 G 0.042 0.058 0.058 E<br />
Polk 11020 Timothy A Irby A415 G 0.006 0.01 0.01 E<br />
Polk 11022 Myrtle H Erickson A415 G 0.026 0.043 0.043 E<br />
Polk 11023 P Frank & Pelar D Metcalf & Robert S Kerr Sr A415 G 0.027 0.045 0.045 E<br />
Polk 11029 Jimmie Stacy & Jimmie L Woodard A415 G 0.022 0.036 0.036 E<br />
Polk 11037 Daniel S & Karen H Mcclellan A415 G 0 0.007 0.007 E<br />
Polk 11057 Daniel A. Norris, Carolyn A. Norris, & Ruby E. Benton A415 G 0.019 0.062 0.062 E<br />
Polk 11064 Devane Groves Inc A415 G 0.009 0.016 0.016 E<br />
Polk 11078 Mary Lynn Pippin A415 G 0.014 0.023 0.023 E<br />
Polk 11091 Katherine Routh A415 G 0.01 0.017 0.017 E<br />
Polk 11095 Davis Bros Inc A415 G 0.007 0.011 0.011 E<br />
Polk 11096 Claude C Saunders A415 S 0.015 0.025 0.025 E<br />
Polk 11099 R F Development Company Inc A415 G 0.009 0.015 0.015 E<br />
Polk 11100 Patrick M Richart Revocable Trst Dated Sept 5 2000 A415 G 0.016 0.027 0.027 E<br />
Polk 11137 Mathew and Tammy Patalik A415 S 0.004 0.006 0.006 E<br />
Polk 11138 Holly Hill Fruit Products Co Inc A415 G 0.022 0.035 0.035 E<br />
Polk 11141 L Dicks, Inc. A415 G 0.004 0.015 0.015 E<br />
Polk 11141 L Dicks, Inc. A415 S 0.004 0.015 0.015 E<br />
Polk 11146 Hunt Bros Inc A415 G 0.013 0.022 0.022 E<br />
Polk 11149 Holly Hill Fruit Products Co Inc A415 G 0 0.061 0.061 E<br />
Polk 11170 Rocker Farms Inc A415 G 0.024 0.039 0.039 E<br />
Polk 11171 Rocker Farms Inc A415 G 0.012 0.019 0.019 E<br />
Polk 11172 Rocker Farms Inc A415 G 0.04 0.055 0.055 E<br />
Polk 11173 Rocker Farms Inc A415 G 0.043 0.06 0.06 E<br />
Polk 11175 Ivey Groves Ltd A415 G 0.017 0.028 0.028 E<br />
M/E 5<br />
Page | 328
<strong>2011</strong> ESTIMATED WATER USE REPORT<br />
Table A7. Metered and <strong>Estimated</strong> Agricultural WUPs, Withdrawals and Permitted <strong>Use</strong> (mgd), <strong>2011</strong><br />
County<br />
WUP<br />
Number<br />
<strong>Southwest</strong> <strong>Florida</strong> <strong>Water</strong> <strong>Management</strong> District<br />
Permittee<br />
<strong>Use</strong><br />
Code 1<br />
Source 2<br />
Annual<br />
Average<br />
Pumpage 3<br />
Total<br />
Permitted<br />
Annual<br />
Average<br />
Quantity<br />
Permitted<br />
Quantity<br />
Attributed<br />
to AG <strong>Use</strong><br />
Category 4<br />
Polk 11178 David A & Leigh Ann Morris A415 G 0.039 0.054 0.054 E<br />
Polk 11186 Frank N & Julia F Hanusch A415 G 0.007 0.011 0.011 E<br />
Polk 11204 Oscar W & C Dane & John Steven & William T Rogers A415 G 0.004 0.007 0.007 E<br />
Polk 11209 Story Citrus Inc A415 S 0.013 0.022 0.022 E<br />
Polk 11215 Hickory Hill Citrus Nursery Inc A420 G 0.011 0.036 0.036 E<br />
Polk 11223 Tea Groves A415 G 0.018 0.03 0.03 E<br />
Polk 11230 Ivey Groves Ltd A415 G 0.02 0.034 0.034 E<br />
Polk 11232 Sultenfuss Ltd Family LP A415 G 0 0.01 0.01 E<br />
Polk 11235 Joyce M Mcclendon Tr/Of Joyce Mcclendon Family Trust A415 G 0.008 0.014 0.014 E<br />
Polk 11238 W T And Frances S Bice A415 G 0.009 0.016 0.016 E<br />
Polk 11239 Alico‐Agri Ltd A415 G 0.011 0.018 0.018 E<br />
Polk 11241 University Of <strong>Florida</strong> Foundation Inc A415 G 0.009 0.015 0.015 E<br />
Polk 11242 Thomas A & Linda L Fatout A415 S 0.005 0.009 0.009 E<br />
Polk 11257 Donald E & Patricia A Scarborough & Sollie W Rabun III L600 G 0 0.001 0.001 E<br />
Polk 11260 Hunt Bros Inc A415 G 0 0.018 0.018 E<br />
Polk 11270 Cottonwood South Inc A415 G 0 0.016 0.016 E<br />
Polk 11272 William H Hawkins‐Patricia H & Thomas H Jobe A415 G 0.024 0.039 0.039 E<br />
Polk 11292 Polk County School Board A415 G 0.009 0.016 0.016 E<br />
Polk 11296 Polk County School Board A415 G 0.065 0.09 0.09 E<br />
Polk 11310 Jando Inc A415 G 0.008 0.012 0.012 E<br />
Polk 11311 Gilbert Bowen C/O Matthew E Green A415 G 0.026 0.043 0.043 E<br />
Polk 11313 J Everett Allen & Sons Inc A415 G 0.014 0.023 0.023 E<br />
Polk 11315 J Everett Allen & Sons Inc A415 G 0.026 0.043 0.043 E<br />
Polk 11316 Julia E Livingston Trustee Of Ju Lia E Livingston Trust A415 G 0.054 0.075 0.075 E<br />
Polk 11324 Daniel Norris A415 G 0.009 0.015 0.015 E<br />
Polk 11332 Daniel F Woodley A415 G 0.009 0.015 0.015 E<br />
Polk 11333 C C Calhoun Inc Lawrence Calhoun A415 G 0.024 0.04 0.04 E<br />
Polk 11342 Wendall K & Debra P Slover A415 G 0.003 0.005 0.005 E<br />
Polk 11353 H R Baxter & Sons Enterprises A415 G 0.017 0.047 0.047 E<br />
Polk 11372 Keith G Salmi & Beverly Kington A415 G 0.01 0.017 0.017 E<br />
Polk 11382 Ronald C & Rebekah J Johnson A415 G 0.003 0.005 0.005 E<br />
M/E 5<br />
Page | 329
<strong>2011</strong> ESTIMATED WATER USE REPORT<br />
Table A7. Metered and <strong>Estimated</strong> Agricultural WUPs, Withdrawals and Permitted <strong>Use</strong> (mgd), <strong>2011</strong><br />
County<br />
WUP<br />
Number<br />
<strong>Southwest</strong> <strong>Florida</strong> <strong>Water</strong> <strong>Management</strong> District<br />
Permittee<br />
<strong>Use</strong><br />
Code 1<br />
Source 2<br />
Annual<br />
Average<br />
Pumpage 3<br />
Total<br />
Permitted<br />
Annual<br />
Average<br />
Quantity<br />
Permitted<br />
Quantity<br />
Attributed<br />
to AG <strong>Use</strong><br />
Category 4<br />
Polk 11384 Flood Groves Corp A415 G 0.013 0.021 0.021 E<br />
Polk 11386 Putnam Groves Inc A415 G 0.006 0.01 0.01 E<br />
Polk 11411 Robert W & Catherine L Teston A415 G 0.016 0.026 0.026 E<br />
Polk 11434 Ben Hill Griffin, Inc. A415 S 0.016 0.027 0.027 E<br />
Polk 11451 Michael L Stenger A415 G 0.014 0.022 0.022 E<br />
11470 Dept Of Environmental Protection And Board Of<br />
A485<br />
0.003 0.006 0.004<br />
Polk<br />
Trustees Trust Fun<br />
G<br />
E<br />
Polk 11485 James F Stephenson Trustee A480 G 0.068 0.094 0.094 E<br />
Polk 11498 Stephens 4 Inc A415 G 0.003 0.005 0.005 E<br />
Polk 11505 Richard Orrock A415 G 0.006 0.01 0.01 E<br />
Polk 11507 James Bester A415 G 0.008 0.013 0.013 E<br />
Polk 11519 Latt Maxcy Corp. A415 G 0.053 0.073 0.073 E<br />
Polk 11524 Wallace U Barber A535 G 0.02 0.033 0.033 E<br />
Polk 11533 Neat & Sweet Farms Inc A415 G 0.014 0.024 0.024 E<br />
Polk 11538 Emmett & Arost Groves A415 G 0.006 0.01 0.01 E<br />
Polk 11539 Lake Marion Development Group LLC A415 G 0.049 0.071 0.071 E<br />
Polk 11544 Kenneth V Ford & Marcia L Ford A480 G 0.037 0.06 0.06 E<br />
11546 Brent I Monk Trust Of The Brent Monk Rev Trust & A415<br />
0.011 0.019 0.019<br />
Polk<br />
Betsy Monk<br />
G<br />
E<br />
11547 Richart Revocable Trust 9‐5‐00 Patrick M Richart A415<br />
0.006 0.01 0.01<br />
Polk<br />
Revocable Trus<br />
G<br />
E<br />
Polk 11548 Nola Land Company Inc A415 G 0.012 0.02 0.02 E<br />
Polk 11582 Lake Marion Development Group LLC A415 G 0.018 0.029 0.029 E<br />
Polk 11610 John H ONeal A415 G 0.006 0.01 0.01 E<br />
Polk 11617 Josephine T Planck Trustee A415 G 0.006 0.01 0.01 E<br />
Polk 11618 Jefferson Dale Albritton A415 G 0.018 0.029 0.029 E<br />
Polk 11643 James R Best Jr & Marilyn S Best A415 G 0.026 0.043 0.043 E<br />
Polk 11649 Anna Bea & Louis James Lazorko A415 G 0.006 0.01 0.01 E<br />
Polk 11659 Leonas Dicks A415 G 0.005 0.009 0.009 E<br />
Polk 11662 L & D Properties Lakeland LLC A480 S 0.004 0.014 0.014 E<br />
Polk 11668 Harold M Bowers Jr A58S G 0.008 0.013 0.013 E<br />
M/E 5<br />
Page | 330
<strong>2011</strong> ESTIMATED WATER USE REPORT<br />
Table A7. Metered and <strong>Estimated</strong> Agricultural WUPs, Withdrawals and Permitted <strong>Use</strong> (mgd), <strong>2011</strong><br />
County<br />
WUP<br />
Number<br />
<strong>Southwest</strong> <strong>Florida</strong> <strong>Water</strong> <strong>Management</strong> District<br />
Permittee<br />
<strong>Use</strong><br />
Code 1<br />
Source 2<br />
Annual<br />
Average<br />
Pumpage 3<br />
Total<br />
Permitted<br />
Annual<br />
Average<br />
Quantity<br />
Permitted<br />
Quantity<br />
Attributed<br />
to AG <strong>Use</strong><br />
Category 4<br />
Polk 11684 John Stephens, Inc. A415 G 0.006 0.018 0.018 E<br />
Polk 11685 Fort Groves Inc A415 G 0.039 0.054 0.054 E<br />
Polk 11695 Petersen Properties Inc A415 G 0.014 0.025 0.024 E<br />
Polk 11710 Albert V CoLPaert Inc A415 G 0.018 0.03 0.03 E<br />
Polk 11745 Edward S Weeks A415 G 0.013 0.022 0.022 E<br />
Polk 11763 Justin S & Marian S Martin A415 G 0.006 0.01 0.01 E<br />
Polk 11781 Donnie G Alford A415 G 0.005 0.009 0.009 E<br />
Polk 11798 Floyd K Devane Jr & Sandra A A415 G 0.019 0.031 0.031 E<br />
Polk 11814 John Stephens, Inc. A415 G 0.041 0.057 0.057 E<br />
Polk 11818 Griffin Family Ltd Partnership A415 G 0.046 0.063 0.063 E<br />
Polk 11819 Harold & Wanda Faye Coates Jr A415 G 0.005 0.008 0.008 E<br />
Polk 11826 Tea Groves A415 G 0.005 0.009 0.009 E<br />
Polk 11834 Alturas Real Properties LLC A485 G 0.03 0.049 0.049 E<br />
Polk 11851 Tbm General Partnership A415 G 0.079 0.143 0.143 E<br />
Polk 11866 Stephen T & Randall Coleman A415 G 0.012 0.02 0.02 E<br />
Polk 11876 John C Barnett Sr & John C Barnett Jr A415 G 0.025 0.041 0.041 E<br />
Polk 11884 Daniel A Norris A415 G 0.005 0.009 0.009 E<br />
Polk 11891 Ken & Kay Family Ltd Partnership A415 G 0.006 0.01 0.01 E<br />
Polk 11894 T. Kelton Hill Revocable Trust A415 G 0.038 0.052 0.052 E<br />
Polk 11901 Joan H. Hill Revocable Trust A415 G 0.026 0.042 0.042 E<br />
Polk 11903 Hunt Bros Inc A415 G 0.005 0.008 0.008 E<br />
Polk 11907 McKenna Family Partnership A415 G 0.009 0.014 0.014 E<br />
Polk 11909 Citrus Enterprises Inc A415 G 0.056 0.078 0.078 E<br />
Polk 11910 Ridgewood Lake Gardens Inc A525 G 0.138 0.301 0.301 E<br />
Polk 11910 Ridgewood Lake Gardens Inc A525 S 0 0.301 0.301 E<br />
Polk 11923 Ace Storage Facilities LLC A495 G 0 0.005 0.001 E<br />
Polk 11930 Donald W & Teresa M Reed L610 G 0.001 0.001 0.001 E<br />
Polk 11935 Tree‐O Groves Inc A415 G 0.029 0.047 0.047 E<br />
Polk 11937 William Dennis Lanfair A415 G 0.005 0.008 0.008 E<br />
Polk 11954 John F & Louise M Watkins A460 G 0.005 0.008 0.008 E<br />
Polk 11976 Holly Hill Fruit Products Co Inc A415 G 0.017 0.029 0.029 E<br />
M/E 5<br />
Page | 331
<strong>2011</strong> ESTIMATED WATER USE REPORT<br />
Table A7. Metered and <strong>Estimated</strong> Agricultural WUPs, Withdrawals and Permitted <strong>Use</strong> (mgd), <strong>2011</strong><br />
County<br />
WUP<br />
Number<br />
<strong>Southwest</strong> <strong>Florida</strong> <strong>Water</strong> <strong>Management</strong> District<br />
Permittee<br />
<strong>Use</strong><br />
Code 1<br />
Source 2<br />
Annual<br />
Average<br />
Pumpage 3<br />
Total<br />
Permitted<br />
Annual<br />
Average<br />
Quantity<br />
Permitted<br />
Quantity<br />
Attributed<br />
to AG <strong>Use</strong><br />
Category 4<br />
Polk 11981 Highland Meadows, LLC A415 G 0.091 0.126 0.126 E<br />
Polk 11983 Haines City Estates Llc Mohammed Battla A415 G 0.009 0.015 0.015 E<br />
Polk 11991 Family Acres Inc A415 G 0 0.043 0.043 E<br />
Polk 12017 Willis Properties Inc A415 G 0.005 0.009 0.009 E<br />
Polk 12023 Daniel Norris A415 G 0.012 0.019 0.019 E<br />
Polk 12026 B L Lanier & Assoc A415 G 0.037 0.052 0.052 E<br />
Polk 12056 Moody Four JV LLC A415 G 0.007 0.012 0.012 E<br />
Polk 12064 Hunt Bros Inc A415 G 0.017 0.028 0.028 E<br />
Polk 12083 RB Hancock A415 G 0.059 0.088 0.088 E<br />
Polk 12088 John Jerue, Jerue Lake Van L.C. A485 G 0.061 0.084 0.084 E<br />
Polk 12096 Lex C. Brown, Lex C. Brown Trust A525 G 0.047 0.077 0.077 E<br />
Polk 12102 Cedargreen Land Co LLC A415 G 0.024 0.04 0.04 E<br />
Polk 12103 John C. Barnett, Sr. and John Connally Barnett, Jr. A415 G 0.009 0.015 0.015 E<br />
Polk 12104 Sun Grown Citrus LP A415 G 0.022 0.037 0.037 E<br />
Polk 12105 JML Land LLC A415 G 0.007 0.012 0.012 E<br />
Polk 12117 Violet Sheffield Trust A415 G 0.008 0.013 0.013 E<br />
Polk 12122 Wanda N. Langford Revocable Trust A415 G 0.011 0.018 0.018 E<br />
Polk 12123 The Frasier Family Limited Partnership A495 G 0.016 0.026 0.026 E<br />
Polk 12132 Polk County School Board A415 G 0.001 0.004 0.001 E<br />
Polk 12137 William C. Wynn, et al A415 G 0.008 0.013 0.013 E<br />
Polk 12148 Eagles Nest Grove, LLC A415 G 0.008 0.013 0.013 E<br />
Polk 12151 Charles E Lanfier A415 G 0.01 0.016 0.016 E<br />
Polk 12170 Lawrence Smith A525 G 0 0.08 0.08 E<br />
Polk 12194 John C Barnett Sr & John C Barnett Jr A415 G 0.012 0.02 0.02 E<br />
Polk 12206 Lawrence Smith A410 G 0.024 0.079 0.079 E<br />
Polk 12207 John Stephens, Inc. A415 G 0.006 0.01 0.01 E<br />
Polk 12225 MG10, LLC A415 G 0.006 0.01 0.01 E<br />
Polk 12228 Ben Hill Griffin, Inc. A415 G 0.012 0.019 0.019 E<br />
Polk 12237 James R Mckinnish A415 G 0.001 0.002 0.002 E<br />
Polk 12258 WM G Roe & Sons, Inc. A410 G 0.009 0.029 0.029 E<br />
Polk 12258 WM G Roe & Sons, Inc. A410 S 0.009 0.029 0.029 E<br />
M/E 5<br />
Page | 332
<strong>2011</strong> ESTIMATED WATER USE REPORT<br />
Table A7. Metered and <strong>Estimated</strong> Agricultural WUPs, Withdrawals and Permitted <strong>Use</strong> (mgd), <strong>2011</strong><br />
County<br />
WUP<br />
Number<br />
<strong>Southwest</strong> <strong>Florida</strong> <strong>Water</strong> <strong>Management</strong> District<br />
Permittee<br />
<strong>Use</strong><br />
Code 1<br />
Source 2<br />
Annual<br />
Average<br />
Pumpage 3<br />
Total<br />
Permitted<br />
Annual<br />
Average<br />
Quantity<br />
Permitted<br />
Quantity<br />
Attributed<br />
to AG <strong>Use</strong><br />
Category 4<br />
Polk 12259 E R Jahna Industries Inc A415 G 0.048 0.174 0.087 E<br />
Polk 12286 Glenn E. and Peggy M. Beck A415 G 0.012 0.019 0.019 E<br />
Polk 12298 Patrick M Richart Revocable Trust A415 G 0 0.007 0.007 E<br />
Polk 12305 Jerry W Harris A415 G 0.011 0.017 0.017 E<br />
Polk 12312 Floyd K Devane Rev Trust and Joyce L Devane Rev Trust A415 G 0.04 0.056 0.056 E<br />
Polk 12319 Curtis H & George E Clark A490 G 0.024 0.039 0.039 E<br />
Polk 12320 Fred R & Sheryl L Harvey A410 G 0.012 0.02 0.02 E<br />
Polk 12326 Ben Hill Griffin, Inc. A415 S 0.006 0.01 0.01 E<br />
Polk 12330 Vincent T & Barbara Eaker Carter A415 G 0.007 0.011 0.011 E<br />
Polk 12344 Thomas E Davis Jr & Linda W Davis A415 G 0.015 0.025 0.025 E<br />
Polk 12345 Thomas E Davis Jr & Linda W Davis A415 G 0.011 0.017 0.017 E<br />
Polk 12356 Danny E Sr & Rebecca A Howze A415 G 0.012 0.019 0.019 E<br />
Polk 12365 Broad Forest LP & Bradco Farms A410 G 0.019 0.032 0.032 E<br />
Polk 12366 Ben Hill Griffin, Inc. A425 G 0.044 0.072 0.072 E<br />
Polk 12402 B.L. Lanier & Associates A415 G 0.047 0.065 0.065 E<br />
Polk 12403 B.L. Lanier & Associates A415 G 0.013 0.021 0.021 E<br />
Polk 12404 B.L. Lanier & Associates A415 G 0.045 0.063 0.063 E<br />
Polk 12405 B L Lanier & Assoc A415 G 0.03 0.048 0.048 E<br />
Polk 12406 S & J Partnership A <strong>Florida</strong> Gp A415 G 0.018 0.029 0.029 E<br />
Polk 12408 Floyd K Devane Jr & Sandra A A415 G 0.015 0.024 0.024 E<br />
Polk 12429 Martin J & Karen N McKenna A415 G 0.009 0.015 0.015 E<br />
Polk 12430 Whaley W & Trena L Lorenz A415 G 0.006 0.01 0.01 E<br />
Polk 12444 Double A Grove A415 G 0.025 0.042 0.042 E<br />
Polk 12446 C. C. Calhoun, Inc. A415 G 0.012 0.019 0.019 E<br />
Polk 12449 Geiger Bowling Green Grove Inc A415 G 0.031 0.05 0.05 E<br />
Polk 12458 Triben Groves A415 G 0.007 0.012 0.012 E<br />
Polk 12459 BL & D Lanier As Trustees A415 G 0.05 0.069 0.069 E<br />
Polk 12460 BL & D Lanier As Trustees A415 G 0.019 0.031 0.031 E<br />
Polk 12461 Bl & D Lanier As Trustees A415 G 0.012 0.019 0.019 E<br />
Polk 12466 Holly Hill Fruit Products Co Inc A415 G 0 0.02 0.02 E<br />
Polk 12468 Holly Hill Fruit Products Co Inc A415 G 0.01 0.016 0.016 E<br />
M/E 5<br />
Page | 333
<strong>2011</strong> ESTIMATED WATER USE REPORT<br />
Table A7. Metered and <strong>Estimated</strong> Agricultural WUPs, Withdrawals and Permitted <strong>Use</strong> (mgd), <strong>2011</strong><br />
County<br />
WUP<br />
Number<br />
<strong>Southwest</strong> <strong>Florida</strong> <strong>Water</strong> <strong>Management</strong> District<br />
Permittee<br />
<strong>Use</strong><br />
Code 1<br />
Source 2<br />
Annual<br />
Average<br />
Pumpage 3<br />
Total<br />
Permitted<br />
Annual<br />
Average<br />
Quantity<br />
Permitted<br />
Quantity<br />
Attributed<br />
to AG <strong>Use</strong><br />
Category 4<br />
Polk 12471 Flying V ,Inc A415 G 0.006 0.01 0.01 E<br />
Polk 12476 Claude E Mann Inc A415 G 0.012 0.02 0.02 E<br />
Polk 12477 Kovacs Brothers Inc A415 G 0.002 0.003 0.003 E<br />
Polk 12481 Stenger Grove Service Inc A415 G 0.029 0.048 0.048 E<br />
Polk 12482 Jeanne A Jahna A415 G 0.002 0.004 0.004 E<br />
Polk 12484 Limestone Groves A415 G 0.012 0.019 0.019 E<br />
Polk 12493 Ben Hill Griffin, Inc. A415 G 0.024 0.039 0.039 E<br />
Polk 12500 Rolling Meadow Ranch Inc A415 G 0.017 0.027 0.027 E<br />
Polk 12502 Andrew Michael Machata & Emil R Jahna III A415 G 0 0.044 0.044 E<br />
Polk 12521 Berry Groves Inc A415 G 0.007 0.012 0.012 E<br />
Polk 12530 William D & Loyce Borders & John W & Terry Borders A445 G 0.013 0.021 0.021 E<br />
12531 Sharon L & David Garrett Jr And Mary Lee & Carl & Carl A415<br />
0.006 0.009 0.009<br />
Polk<br />
S Boozer<br />
G<br />
E<br />
Polk 12552 Rebeccas Farms Inc David & Rebecca Kissack A415 G 0.012 0.019 0.019 E<br />
Polk 12559 Seedrock ‐ VGP, Inc A415 G 0.042 0.058 0.058 E<br />
Polk 12566 Ash Chemical LLC A415 G 0.012 0.02 0.02 E<br />
Polk 12567 Frank H & Sandra K Kneip A480 G 0.041 0.057 0.057 E<br />
Polk 12574 Family Acres Inc A415 G 0.026 0.043 0.043 E<br />
Polk 12585 Toll Orlando Limited Partnership C/O Landstar Homes A415 G 0 0.036 0.036 E<br />
Polk 12587 City of Auburndale A402 G 0 0.001 0.001 E<br />
Polk 12599 William Braswell A410 G 0.011 0.036 0.036 E<br />
Polk 12599 William Braswell A410 S 0 0.036 0.036 E<br />
Polk 12602 Howard J Ekblad A410 G 0.012 0.038 0.038 E<br />
Polk 12602 Howard J Ekblad A410 S 0.012 0.038 0.038 E<br />
12608 Thomas S Jr & Carol S Ricketts & R Dean & Janet<br />
A415<br />
0.014 0.023 0.023<br />
G<br />
Polk<br />
Langford<br />
E<br />
Polk 12611 Cheryl Voight Lewis A485 G 0 0.022 0.022 E<br />
Polk 12619 Nathan & Betty Tew A410 G 0 0.01 0.01 E<br />
Polk 12619 Nathan & Betty Tew A410 S 0.003 0.01 0.01 E<br />
12624 Edgar L Davis Sr Trustee Of The Edgar L Davis Sr Fam A415<br />
0.008 0.013 0.013<br />
Polk<br />
Trust<br />
G<br />
E<br />
M/E 5<br />
Page | 334
<strong>2011</strong> ESTIMATED WATER USE REPORT<br />
Table A7. Metered and <strong>Estimated</strong> Agricultural WUPs, Withdrawals and Permitted <strong>Use</strong> (mgd), <strong>2011</strong><br />
County<br />
WUP<br />
Number<br />
<strong>Southwest</strong> <strong>Florida</strong> <strong>Water</strong> <strong>Management</strong> District<br />
Permittee<br />
<strong>Use</strong><br />
Code 1<br />
Source 2<br />
Annual<br />
Average<br />
Pumpage 3<br />
Total<br />
Permitted<br />
Annual<br />
Average<br />
Quantity<br />
Permitted<br />
Quantity<br />
Attributed<br />
to AG <strong>Use</strong><br />
Category 4<br />
Polk 12641 Uries Inc A415 G 0.006 0.01 0.01 E<br />
Polk 12654 Amcope Inc A415 G 0.09 0.147 0.147 E<br />
Polk 12656 Citrus Enterprises Inc A415 G 0.018 0.029 0.029 E<br />
Polk 12658 Paul Sultenfuss A415 G 0.027 0.045 0.045 E<br />
Polk 12659 Lewco Properties Inc A415 G 0.014 0.022 0.022 E<br />
Polk 12660 Citrus Enterprises, Inc. A415 G 0.041 0.133 0.133 E<br />
Polk 12661 James M & Deborah D Shinn A415 G 0.012 0.02 0.02 E<br />
Polk 12662 Thomas Thayer Jr A415 G 0.02 0.032 0.032 E<br />
Polk 12663 Gapway Groves A415 G 0.134 0.25 0.25 E<br />
Polk 12664 Ridgecrest Groves Inc A415 G 0.03 0.049 0.049 E<br />
Polk 12665 Rutherford H. Cook Jr. and Sharon Ann Gardner A415 G 0.021 0.034 0.034 E<br />
Polk 12666 Webb Citrus Packing And Candy Factory Inc A415 G 0.019 0.031 0.031 E<br />
Polk 12667 CDA Citrus LLC A415 G 0.048 0.067 0.067 E<br />
Polk 12668 John P Blackwelder A415 G 0.01 0.016 0.016 E<br />
Polk 12669 D Edward & Elise B Dickinson A415 G 0.024 0.04 0.04 E<br />
Polk 12670 Pauline C Huie, TR A415 G 0.009 0.014 0.014 E<br />
Polk 12671 MCCG Inc A415 G 0.012 0.019 0.019 E<br />
Polk 12674 Rudy Beddingfield A415 G 0.088 0.159 0.159 E<br />
Polk 12676 Ava Nell Bobo A415 G 0.077 0.14 0.14 E<br />
Polk 12677 Steven Adams A415 G 0.019 0.031 0.031 E<br />
Polk 12678 John M Le & Thanh T Nguyen A415 G 0.03 0.049 0.049 E<br />
Polk 12679 Asset Investors Operating Prtnsp LP A415 G 0.004 0.007 0.007 E<br />
Polk 12680 Patrick M & Pamela Richart Co‐Tr A415 G 0.009 0.015 0.015 E<br />
Polk 12681 Grady L Rewis A415 G 0.005 0.009 0.009 E<br />
Polk 12682 Berry Groves Inc A415 G 0.113 0.157 0.157 E<br />
Polk 12683 Ed Hamilton A415 G 0.01 0.016 0.016 E<br />
Polk 12684 Ridgecrest Groves Inc A415 G 0.006 0.01 0.01 E<br />
Polk 12685 CSLB LLC A415 G 0.055 0.076 0.076 E<br />
Polk 12686 Citrus Enterprises Inc A415 G 0.017 0.027 0.027 E<br />
Polk 12687 Sons Brothers A415 G 0.028 0.046 0.046 E<br />
Polk 12690 Randall Perry A415 G 0.012 0.02 0.02 E<br />
M/E 5<br />
Page | 335
<strong>2011</strong> ESTIMATED WATER USE REPORT<br />
Table A7. Metered and <strong>Estimated</strong> Agricultural WUPs, Withdrawals and Permitted <strong>Use</strong> (mgd), <strong>2011</strong><br />
County<br />
WUP<br />
Number<br />
<strong>Southwest</strong> <strong>Florida</strong> <strong>Water</strong> <strong>Management</strong> District<br />
Permittee<br />
<strong>Use</strong><br />
Code 1<br />
Source 2<br />
Annual<br />
Average<br />
Pumpage 3<br />
Total<br />
Permitted<br />
Annual<br />
Average<br />
Quantity<br />
Permitted<br />
Quantity<br />
Attributed<br />
to AG <strong>Use</strong><br />
Category 4<br />
Polk 12691 Robert & Carl Sons A415 G 0.008 0.013 0.013 E<br />
Polk 12692 Ridgecrest Groves Inc A415 G 0.051 0.071 0.071 E<br />
Polk 12693 Robert W Sons & Carl Sons A415 G 0.04 0.066 0.066 E<br />
Polk 12694 Robert & Carl Sons A415 G 0.041 0.056 0.056 E<br />
Polk 12695 Jack Berry Inc A415 G 0.107 0.148 0.148 E<br />
Polk 12696 Treatt USA Inc A415 G 0.003 0.005 0.005 E<br />
Polk 12697 Boozers Service & Equipment Inc A415 G 0.009 0.014 0.014 E<br />
Polk 12698 Robert & Carl Sons A415 G 0.017 0.028 0.028 E<br />
Polk 12701 Ivan Stewart A415 G 0.008 0.013 0.013 E<br />
Polk 12702 Holly Hill Fruit Products Co Inc & James M Shearer A415 G 0.028 0.045 0.045 E<br />
Polk 12703 Holly Hill Fruit Products Co Inc A415 G 0.17 0.308 0.308 E<br />
Polk 12705 Holly Hill Fruit Products Co Inc A415 G 0.112 0.203 0.203 E<br />
Polk 12706 Goodman Grove Partnership A415 G 0.039 0.054 0.054 E<br />
Polk 12707 William C Quill A415 G 0.023 0.038 0.038 E<br />
Polk 12708 Patrick M & Pamela Richart Co‐Tr A415 G 0.022 0.036 0.036 E<br />
Polk 12709 Ridgecrest Groves Inc A415 G 0.009 0.014 0.014 E<br />
Polk 12710 Angel Olson Inc A415 G 0.028 0.046 0.046 E<br />
Polk 12713 TIITF/Fish & Wildlife A647 G 0.012 0.02 0.02 E<br />
Polk 12714 Citrus Research & Education Ctr A415 G 0.008 0.013 0.013 E<br />
Polk 12717 Robert & Carl Sons A415 G 0.013 0.021 0.021 E<br />
Polk 12718 Hazel Brannen A415 G 0.009 0.014 0.014 E<br />
Polk 12719 D Dickinson A415 G 0.009 0.014 0.014 E<br />
Polk 12722 Ridgecrest Groves Inc A415 G 0.03 0.049 0.049 E<br />
Polk 12724 Patrick M & Pamela Richart Co‐Tr A415 G 0.007 0.011 0.011 E<br />
Polk 12725 Benson And Coline Cain A415 G 0.024 0.039 0.039 E<br />
Polk 12726 Martin Losey II A490 G 0.017 0.028 0.028 E<br />
Polk 12728 Ridgecrest Groves Inc A415 G 0.071 0.116 0.116 E<br />
Polk 12733 Holly Hill Fruit Products Co Inc & James M Shearer A415 G 0.05 0.069 0.069 E<br />
Polk 12734 Polk Co Bocc Util. Division A415 G 0.262 0.475 0.475 E<br />
Polk 12762 Congdon Family Inc A58H G 0.007 0.011 0.011 E<br />
Polk 12764 Holly Hill Fruit Products Co Inc A415 G 0.169 0.306 0.306 E<br />
M/E 5<br />
Page | 336
<strong>2011</strong> ESTIMATED WATER USE REPORT<br />
Table A7. Metered and <strong>Estimated</strong> Agricultural WUPs, Withdrawals and Permitted <strong>Use</strong> (mgd), <strong>2011</strong><br />
County<br />
WUP<br />
Number<br />
<strong>Southwest</strong> <strong>Florida</strong> <strong>Water</strong> <strong>Management</strong> District<br />
Permittee<br />
<strong>Use</strong><br />
Code 1<br />
Source 2<br />
Annual<br />
Average<br />
Pumpage 3<br />
Total<br />
Permitted<br />
Annual<br />
Average<br />
Quantity<br />
Permitted<br />
Quantity<br />
Attributed<br />
to AG <strong>Use</strong><br />
Category 4<br />
Polk 12777 Hugh J. Tidwell A415 G 0.006 0.01 0.01 E<br />
Polk 12788 Seedrock ‐ Vgp,Inc A415 G 0.022 0.036 0.036 E<br />
Polk 12795 Polk Co School Board A415 G 0.006 0.024 0.009 E<br />
Polk 12798 David Morris A415 G 0.009 0.014 0.014 E<br />
Polk 12810 Dopler Groves Inc A415 G 0.015 0.024 0.024 E<br />
Polk 12812 South Property Holdings LLC A415 G 0.019 0.031 0.031 E<br />
Polk 12813 High Street Enterprises Ltd A415 G 0.018 0.029 0.029 E<br />
Polk 12825 Danny L & Betty A Thomas A415 G 0.02 0.033 0.033 E<br />
Polk 12834 Marian B Lambert‐Marian B A415 G 0 0.03 0.03 E<br />
Polk 12844 Byrd Groves Inc A415 G 0.016 0.026 0.026 E<br />
Polk 12852 James M And Deborah D Shinn A415 G 0.013 0.021 0.021 E<br />
Polk 12854 Waverly Growers Cooperative A415 G 0.044 0.158 0.158 E<br />
Polk 12855 Boozers Service & Equipment Inc A415 G 0.016 0.027 0.027 E<br />
Polk 12856 B.L. Lanier & Associates A415 G 0.024 0.039 0.039 E<br />
Polk 12857 Holly Hills Fruit A415 G 0 0.042 0.042 E<br />
Polk 12871 C. C. Calhoun, Inc. A415 G 0.017 0.028 0.028 E<br />
Polk 12874 Square X Investments LLC A415 G 0.012 0.02 0.02 E<br />
Polk 12884 Estates Of Lake Wales LLC A415 G 0.012 0.02 0.02 E<br />
Polk 12897 Spirit Lake Grove LLC A415 G 0.015 0.025 0.025 E<br />
Polk 12909 Nola Land Co Inc A490 G 0.019 0.031 0.031 E<br />
Polk 12912 Carlson Grove Inc & Roy & Joanne A Carlson A415 G 0.007 0.011 0.011 E<br />
Polk 12916 Manuel & Shelly Lopez & John A Jr & Allison Stephens A415 G 0 0.01 0.01 E<br />
Polk 12936 Dung Thi Le A415 G 0.012 0.02 0.02 E<br />
Polk 12941 McKenzie & Cook Investments LLC A415 G 0.005 0.008 0.008 E<br />
Polk 12945 Deanna A & Daniel A Norris Jr A415 G 0.003 0.006 0.006 E<br />
Polk 12948 Moody Jv Llc & Aaron Newman A415 G 0.019 0.031 0.031 E<br />
Polk 12949 Bierrami Walters Dunkley A415 G 0.007 0.011 0.011 E<br />
Polk 12960 Norman Larry Black Jr & Nikki L Black & Flying V Inc A415 G 0.025 0.041 0.041 E<br />
Polk 12972 Patrick M & Pamela K Richart As A415 G 0.006 0.01 0.01 E<br />
Polk 12975 Jeremy Best & Best Developments & Investments Inc A490 G 0.015 0.024 0.024 E<br />
Polk 12976 Challis Marshall Inc A415 G 0.006 0.01 0.01 E<br />
M/E 5<br />
Page | 337
<strong>2011</strong> ESTIMATED WATER USE REPORT<br />
Table A7. Metered and <strong>Estimated</strong> Agricultural WUPs, Withdrawals and Permitted <strong>Use</strong> (mgd), <strong>2011</strong><br />
County<br />
WUP<br />
Number<br />
<strong>Southwest</strong> <strong>Florida</strong> <strong>Water</strong> <strong>Management</strong> District<br />
Permittee<br />
<strong>Use</strong><br />
Code 1<br />
Source 2<br />
Annual<br />
Average<br />
Pumpage 3<br />
Total<br />
Permitted<br />
Annual<br />
Average<br />
Quantity<br />
Permitted<br />
Quantity<br />
Attributed<br />
to AG <strong>Use</strong><br />
Category 4<br />
Polk 12986 ELEANOR Henderson A415 G 0.025 0.041 0.041 E<br />
Polk 12990 Pamela Dicks A410 G 0.02 0.035 0.035 E<br />
Polk 12999 Diane B & John J Stepanic A410 G 0.006 0.01 0.01 E<br />
Polk 13006 Jahna Groves Inc A415 G 0.025 0.04 0.04 E<br />
Polk 13010 Progress Energy & T.Thayer Jr. A415 G 0.015 0.025 0.025 E<br />
Polk 13014 Highlands Citrus Inc A415 G 0.025 0.041 0.041 E<br />
Polk 13015 Devane Citrus Inc A415 G 0.037 0.061 0.061 E<br />
Polk 13021 J Henry Groves Inc A415 G 0.038 0.052 0.052 E<br />
Polk 13028 Kenneth Thompson A415 G 0.025 0.041 0.041 E<br />
Polk 13038 Dennis Murphy Family Limited Part. A415 G 0.045 0.062 0.062 E<br />
Polk 13045 Diane Hammond A415 G 0.006 0.01 0.01 E<br />
Polk 13047 Thomas L Fortner A415 G 0.006 0.01 0.01 E<br />
Polk 13057 PH Citrus LLC A410 G 0 0.036 0.036 E<br />
Polk 13071 S J Barranco A415 G 0.011 0.018 0.018 E<br />
Polk 13075 Bowen Brothers Inc A415 G 0.019 0.031 0.031 E<br />
Polk 13076 Swfwmd & Fdep State Lands A490 G 0.065 0.091 0.09 E<br />
Polk 13078 Jerome & Martha H Fojtik A415 G 0.009 0.014 0.014 E<br />
Polk 13079 Td Properties LLC A415 G 0.012 0.02 0.02 E<br />
Polk 13085 Cenco Inc A415 G 0.028 0.045 0.045 E<br />
Polk 13097 Katherine Stuart Fitzgerald A485 G 0.027 0.043 0.043 E<br />
Polk 13101 Edward M & Viola Coughenour A415 G 0.008 0.013 0.013 E<br />
13108 Gudelia Sanchez De Jaramillo Joseph & Mario Jaramillo A415<br />
0.008 0.014 0.014<br />
Polk<br />
Trustee<br />
G<br />
E<br />
Polk 13109 Davis Bros Inc A415 G 0.008 0.013 0.013 E<br />
Polk 13116 PH Citrus LLC A415 G 0.017 0.027 0.027 E<br />
Polk 13118 Thomas E Davis A415 G 0.011 0.018 0.018 E<br />
Polk 13121 Kermit Weeks As Trustee A415 G 0.008 0.013 0.013 E<br />
Polk 13127 D Edward & Elise B Dickinson A415 G 0.015 0.024 0.024 E<br />
Polk 13129 Ryan M Russell & Laura B Russell A415 G 0.011 0.018 0.018 E<br />
Polk 13137 Robert & Carolyn Benoit A415 G 0.009 0.015 0.015 E<br />
Polk 13141 William & Jacqueline Futch A410 G 0.023 0.037 0.037 E<br />
M/E 5<br />
Page | 338
<strong>2011</strong> ESTIMATED WATER USE REPORT<br />
Table A7. Metered and <strong>Estimated</strong> Agricultural WUPs, Withdrawals and Permitted <strong>Use</strong> (mgd), <strong>2011</strong><br />
County<br />
WUP<br />
Number<br />
<strong>Southwest</strong> <strong>Florida</strong> <strong>Water</strong> <strong>Management</strong> District<br />
Permittee<br />
<strong>Use</strong><br />
Code 1<br />
Source 2<br />
Annual<br />
Average<br />
Pumpage 3<br />
Total<br />
Permitted<br />
Annual<br />
Average<br />
Quantity<br />
Permitted<br />
Quantity<br />
Attributed<br />
to AG <strong>Use</strong><br />
Category 4<br />
Polk 13142 Davis Bros Inc A415 G 0.007 0.012 0.012 E<br />
Polk 13143 Stephens 4 Inc A415 G 0.013 0.021 0.021 E<br />
Polk 13144 Est Of David A Morris Sr & David A Morris Jr A415 G 0.01 0.016 0.016 E<br />
Polk 13153 E Wise LLC A480 G 0.056 0.078 0.078 E<br />
Polk 13155 Julia Livingston Rev Living Trst A415 G 0.009 0.015 0.015 E<br />
Polk 13159 Cc Calhoun Inc A415 G 0.033 0.062 0.046 E<br />
Polk 13162 Kermit Weeks Worlds Greatest Aircraft Collect A485 G 0.061 0.084 0.084 E<br />
Polk 13163 Brown Wood Enterprises Inc A415 G 0.003 0.005 0.005 E<br />
Polk 13166 Hinson Mcteer A410 G 0.052 0.073 0.073 E<br />
Polk 13172 Five Star Group LLC A415 G 0.031 0.05 0.05 E<br />
Polk 13174 W M Keen A415 G 0.008 0.013 0.013 E<br />
Polk 13179 Nathan E & Betty Tew A410 G 0.011 0.024 0.024 E<br />
Polk 13182 Caldwell Citrus Groves LLC A415 G 0.014 0.024 0.024 E<br />
Polk 13186 Perry Norman Ford Trustee Of Rev Trust Of P N Ford A415 G 0.008 0.014 0.014 E<br />
Polk 13187 L & E Inc A415 G 0.027 0.044 0.044 E<br />
Polk 13191 Gary Whidden Trustee Of The Gary L Whidden Rev Trst A415 G 0.008 0.013 0.013 E<br />
Polk 13192 Brent Monk Trustee Of The Brent Monk Rev Living Trst A415 G 0.011 0.019 0.019 E<br />
Polk 13196 Devane Citrus Inc A415 G 0.012 0.019 0.019 E<br />
Polk 13198 Imperial Polk Properties Inc L600 G 0 0.001 0.001 E<br />
13199 Imperial Polk Properties Inc & The Worlds Greatest A415<br />
0.037 0.051 0.051<br />
G<br />
Polk<br />
Aircraft<br />
E<br />
Polk 13200 Glen J Wise As Trustee Of The A415 G 0.007 0.012 0.012 E<br />
Polk 13204 Donald & Esther Piers Trustees Of Ottawa Trust A415 G 0.005 0.009 0.009 E<br />
Polk 13208 Lake Trask Groves LLP Thomas A Thayer Jr A415 G 0.012 0.019 0.019 E<br />
Polk 13209 Lake Easy Land Acquisitions Inc A415 G 0.024 0.039 0.039 E<br />
Polk 13215 Jose Gracia A56S G 0.054 0.075 0.075 E<br />
Polk 13220 Matt Elliott Tr Of Revocable Tr A415 G 0.014 0.023 0.023 E<br />
Polk 13221 John C Barnett Sr & John C Barnett Jr A415 G 0.048 0.066 0.066 E<br />
Polk 13222 Agnes A Character As Trustee Of A490 G 0.011 0.018 0.018 E<br />
Polk 13226 Byrd Groves Inc A415 G 0.012 0.019 0.019 E<br />
Polk 13232 4 H Farms Inc A410 G 0 0.055 0.055 E<br />
M/E 5<br />
Page | 339
<strong>2011</strong> ESTIMATED WATER USE REPORT<br />
Table A7. Metered and <strong>Estimated</strong> Agricultural WUPs, Withdrawals and Permitted <strong>Use</strong> (mgd), <strong>2011</strong><br />
County<br />
WUP<br />
Number<br />
<strong>Southwest</strong> <strong>Florida</strong> <strong>Water</strong> <strong>Management</strong> District<br />
Permittee<br />
<strong>Use</strong><br />
Code 1<br />
Source 2<br />
Annual<br />
Average<br />
Pumpage 3<br />
Total<br />
Permitted<br />
Annual<br />
Average<br />
Quantity<br />
Permitted<br />
Quantity<br />
Attributed<br />
to AG <strong>Use</strong><br />
Category 4<br />
Polk 13233 Richard A Lewis A415 G 0.052 0.072 0.072 E<br />
Polk 13236 C Land Inc A415 G 0.051 0.071 0.071 E<br />
Polk 13237 Thomas Thayer Jr A415 G 0.012 0.02 0.02 E<br />
Polk 13242 Story Citrus Inc A415 G 0.012 0.02 0.02 E<br />
Polk 13243 Joshua Meeks A415 G 0.015 0.024 0.024 E<br />
Polk 13250 Steven Catob A415 G 0.006 0.009 0.009 E<br />
13257 Ruth S Whidden Trustee Of The Ruth S Whidden<br />
A415<br />
0.011 0.018 0.018<br />
Polk<br />
Revocable Trust<br />
G<br />
E<br />
Polk 13264 Doug Michaels A480 S 0.026 0.043 0.043 E<br />
Polk 13265 Emmett & Arost Groves A415 G 0.006 0.01 0.01 E<br />
Polk 13269 Thomas C Shirley Trustee Of The A415 G 0 0.063 0.063 E<br />
Polk 13270 John Connally Barnett Sr & John Connally Barnett Jr A415 G 0.004 0.007 0.007 E<br />
Polk 13283 Barbara H Smith Trustee Of The Revocable Living Trust A415 G 0.053 0.073 0.073 E<br />
Polk 13293 Nancy Davis King Md Living Trust A415 G 0.006 0.01 0.01 E<br />
Polk 13295 David C & Kimberly Mong & Nilton Varnadoro A490 G 0.017 0.029 0.029 E<br />
Polk 13299 Timothy S Frost A415 G 0.01 0.016 0.016 E<br />
Polk 13303 Gary N Sharpe A415 G 0.04 0.055 0.055 E<br />
Polk 13311 William T & Gayle M Weinkauf A415 G 0.006 0.01 0.01 E<br />
Polk 13315 Allen B Shaw Jr A415 G 0.003 0.005 0.005 E<br />
Polk 13324 Wilbur R & Mary M Reschly A415 G 0.004 0.007 0.007 E<br />
Polk 13325 Julia Livingston As Trustee Of Julia Livingston Trust A415 G 0.009 0.015 0.015 E<br />
Polk 13326 Central <strong>Florida</strong> Investments A470 G 0 0.058 0.058 E<br />
Polk 13342 Evans Ranch LLC A410 G 0.012 0.039 0.039 E<br />
Polk 13358 Lanier Groves A415 G 0.015 0.024 0.024 E<br />
Polk 13363 Lewis Groves Inc A415 G 0.016 0.026 0.026 E<br />
Polk 13366 Weber Revocable Trust A410 G 0.011 0.035 0.035 E<br />
Polk 13366 Weber Revocable Trust A410 S 0 0.035 0.035 E<br />
Polk 13372 Emmett & Arost Groves A415 G 0.01 0.016 0.016 E<br />
Polk 20012 Brenda K Gordon & Ronald Nelson A410 G 0 0.029 0.029 E<br />
Polk 20018 Kristi & Dennis Vegter A410 G 0 0.02 0.02 E<br />
Polk 20023 Gary & Carole McKenzie A410 G 0 0.013 0.013 E<br />
M/E 5<br />
Page | 340
<strong>2011</strong> ESTIMATED WATER USE REPORT<br />
Table A7. Metered and <strong>Estimated</strong> Agricultural WUPs, Withdrawals and Permitted <strong>Use</strong> (mgd), <strong>2011</strong><br />
County<br />
WUP<br />
Number<br />
<strong>Southwest</strong> <strong>Florida</strong> <strong>Water</strong> <strong>Management</strong> District<br />
Permittee<br />
<strong>Use</strong><br />
Code 1<br />
Source 2<br />
Annual<br />
Average<br />
Pumpage 3<br />
Total<br />
Permitted<br />
Annual<br />
Average<br />
Quantity<br />
Permitted<br />
Quantity<br />
Attributed<br />
to AG <strong>Use</strong><br />
Category 4<br />
Polk 20026 Billy A & Kathleen L Ellis A415 G 0.003 0.004 0.004 E<br />
Polk 20027 Edward Parker A410 G 0.017 0.028 0.028 E<br />
Polk 20028 Lex C Brown A525 G 0.092 0.15 0.15 E<br />
Polk 20031 Karima, Mian & Abdool Saladeen A415 G 0.024 0.039 0.039 E<br />
Polk 20036 Junes Grove LLC A415 G 0 0.031 0.031 E<br />
Polk 20037 LJR Family Limited Partnership A470 G 0.072 0.1 0.1 E<br />
Polk 20047 Caldwell Citrus Groves LLC A415 G 0 0.01 0.01 E<br />
Polk 20052 Nuha Ogla A415 G 0.024 0.04 0.04 E<br />
Polk 20055 Robert M & Vicki L Pearson A410 G 0.003 0.004 0.004 E<br />
Polk 20056 Mancini Development Auburndale, LLC A490 G 0.021 0.035 0.035 E<br />
Polk 20057 Eagle Lake Reserve LLC A415 G 0.046 0.064 0.064 E<br />
Polk 20065 Jeremy & Kimberly Scott A410 G 0.005 0.016 0.016 E<br />
Polk 20065 Jeremy & Kimberly Scott A410 S 0 0.016 0.016 E<br />
Polk 20068 Diane Starling A410 G 0 0.049 0.049 E<br />
Polk 20069 Richard & Tina Ford A410 G 0.011 0.018 0.018 E<br />
Polk 20073 Frank Narki A415 G 0.01 0.017 0.017 E<br />
Polk 20083 William And Catherine Melvin & Christine Sonnenberg A410 S 0.009 0.015 0.015 E<br />
Polk 20085 Ronald Young A535 G 0.029 0.105 0.105 E<br />
Polk 20085 Ronald Young A535 S 0.029 0.105 0.105 E<br />
Polk 20086 Matthew Smith A415 G 0.012 0.02 0.02 E<br />
Polk 20087 Highlands Citrus Inc A415 G 0.012 0.02 0.02 E<br />
Polk 20089 Hermanns Real Estate Ventures LLC A415 G 0 0.015 0.015 E<br />
Polk 20090 IOWA LLC A415 G 0.024 0.039 0.039 E<br />
Polk <strong>2011</strong>2 Wingo Investment Corporation A410 G 0 0.059 0.059 E<br />
Polk <strong>2011</strong>5 Atallah Jadallah & Bakr MUSA A410 G 0.012 0.019 0.019 E<br />
Polk <strong>2011</strong>8 Perry Hendrick A415 G 0.007 0.011 0.011 E<br />
Polk 20131 L & E Inc. A415 G 0.012 0.02 0.02 E<br />
Polk 20144 Jimmy And Connie Gould A410 G 0.009 0.015 0.015 E<br />
Polk 20145 Patricia Alford A415 G 0.039 0.055 0.055 E<br />
Polk 20157 Nancy M. Hunt & Hunt Bros. Inc. A415 G 0.012 0.02 0.02 E<br />
Polk 20164 Manuel and Shelley Lopez and Oreste Lopez Jr. A415 G 0.005 0.008 0.008 E<br />
M/E 5<br />
Page | 341
<strong>2011</strong> ESTIMATED WATER USE REPORT<br />
Table A7. Metered and <strong>Estimated</strong> Agricultural WUPs, Withdrawals and Permitted <strong>Use</strong> (mgd), <strong>2011</strong><br />
County<br />
WUP<br />
Number<br />
<strong>Southwest</strong> <strong>Florida</strong> <strong>Water</strong> <strong>Management</strong> District<br />
Permittee<br />
<strong>Use</strong><br />
Code 1<br />
Source 2<br />
Annual<br />
Average<br />
Pumpage 3<br />
Total<br />
Permitted<br />
Annual<br />
Average<br />
Quantity<br />
Permitted<br />
Quantity<br />
Attributed<br />
to AG <strong>Use</strong><br />
Category 4<br />
Polk 20172 Charles Glass A415 S 0 0.037 0.037 E<br />
Polk 20180 John Stephens, Inc & John and Allison Stephens A415 G 0.019 0.031 0.031 E<br />
Polk 20184 Willex Technologies Inc A415 G 0.015 0.024 0.024 E<br />
Polk 20185 Jarvis & Sheila Hartt A415 G 0.012 0.019 0.019 E<br />
Polk 20196 Joe F. & Marie Katherine Parrish A415 G 0.012 0.02 0.02 E<br />
Polk 20202 Margie Adams A485 G 0.024 0.04 0.04 E<br />
Polk 20205 David H. Grooms and Carl R. Grooms A535 G 0.037 0.053 0.053 E<br />
Polk 20205 David H. Grooms and Carl R. Grooms A535 S 0 0.053 0.053 E<br />
Polk 20208 William Ward A415 G 0 0.023 0.023 E<br />
Polk 20225 Black & Myers Properties, LLC A415 G 0 0.028 0.028 E<br />
Polk 20227 Antenna LLC A410 G 0 0.039 0.039 E<br />
Polk 20234 Lake Trask Groves, LLP A415 G 0.025 0.041 0.041 E<br />
Polk 20241 Brian & Carroll Swinney A415 G 0.01 0.034 0.034 E<br />
20247 Trena Lorenz as trustee of the Trena Louise Lorenz A415<br />
0.012 0.02 0.02<br />
G<br />
Polk<br />
Trust<br />
E<br />
Polk 20249 Ward Family Trust A415 G 0.008 0.013 0.013 E<br />
43.684 Metered, mgd<br />
Polk County Totals<br />
36.675 <strong>Estimated</strong> , mgd<br />
80.359 Total, mgd<br />
Sarasota 3755 Mabry Carlton Ranch Inc A56S G 0.097 4.261 4.261 M<br />
Sarasota 3764 Longino Ranch Inc A525 G 0.079 1.219 1.219 M<br />
Sarasota 3854 Chuck Downs Jr A490 G 0.000 0.218 0.218 M<br />
Sarasota 3872 Fourth Quarter Properties XXXII A525 G 0.000 2.459 2.459 M<br />
Sarasota 3872 Fourth Quarter Properties XXXII A525 S 0.000 2.459 2.459 M<br />
Sarasota 3873 Schwartz Farms Inc A470 G 0.333 2.190 2.190 M<br />
Sarasota 3890 Bispham Family Limited Partnership A525 G 0.153 0.464 0.464 M<br />
Sarasota 4087 L T Partners LLLP A525 G 0.826 1.128 1.128 M<br />
Sarasota 4387 Javier Vargas A525 G 0.991 3.884 3.884 M<br />
Sarasota 5544 Indiantown Dairy Farm Inc A490 G 0.000 0.277 0.277 M<br />
Sarasota 6736 Hmta Real Estate LLC A525 G 0.000 0.301 0.301 M<br />
Sarasota 7289 John A. Peachey TTEE and Glenn A. Peachey A450 G 0.233 0.333 0.333 M<br />
M/E 5<br />
Page | 342
<strong>2011</strong> ESTIMATED WATER USE REPORT<br />
Table A7. Metered and <strong>Estimated</strong> Agricultural WUPs, Withdrawals and Permitted <strong>Use</strong> (mgd), <strong>2011</strong><br />
County<br />
WUP<br />
Number<br />
<strong>Southwest</strong> <strong>Florida</strong> <strong>Water</strong> <strong>Management</strong> District<br />
Permittee<br />
<strong>Use</strong><br />
Code 1<br />
Source 2<br />
Annual<br />
Average<br />
Pumpage 3<br />
Total<br />
Permitted<br />
Annual<br />
Average<br />
Quantity<br />
Permitted<br />
Quantity<br />
Attributed<br />
to AG <strong>Use</strong><br />
Category 4<br />
Sarasota 8226 Lindvest Fruitvile Ltd A58H G 0.000 0.370 0.370 M<br />
Sarasota 8336 SMR/Myakka LLC A470 G 0.038 0.883 0.883 M<br />
Sarasota 9361 Albritton Groves Ltd A415 G 0.122 0.177 0.177 M<br />
Sarasota 12275 Mote Foundation L630 G 0.149 0.153 0.153 M<br />
Sarasota 12516 Matt Harrison A525 G 0.035 0.553 0.553 M<br />
Sarasota 12606 FC LLC & Myakka Ranch Holdings A56S G 0.088 0.200 0.200 M<br />
Sarasota 12772 Divosta LP A525 S 0.146 1.092 0.442 M<br />
Sarasota 12849 Sarasota County Board of County Commissioners A415 G 0.209 0.615 0.615 M<br />
Sarasota 3845 Jerry Flint & Cecil Daughtrey Jr A470 G 0.262 1.536 1.536 E<br />
Sarasota 3852 Barry And Joanna Sternberg A490 G 0.002 0.004 0.004 E<br />
Sarasota 3855 The Sheldon L. Campbell Credit Shelter Trust A415 G 0.015 0.024 0.024 E<br />
Sarasota 3875 Marguerite Cook A415 G 0.008 0.012 0.012 E<br />
Sarasota 3917 Redy, Inc A495 G 0.017 0.027 0.027 E<br />
Sarasota 4083 Irwin D Campbell A415 G 0.021 0.035 0.035 E<br />
Sarasota 5283 Palmer Lake Investments, LLC A56F G 0 0.063 0.063 E<br />
Sarasota 5283 Palmer Lake Investments, LLC A56F S 0.037 0.063 0.063 E<br />
Sarasota 5376 Louie F & Edna L Grubbs L610 G 0.0003 0.0003 0.0003 E<br />
Sarasota 5404 James A Hawkins L600 G 0.028 0.046 0.046 E<br />
Sarasota 5695 Lindvest Fruitvile Ltd A495 G 0.045 0.073 0.073 E<br />
Sarasota 6008 GP Land Investment LLC A415 G 0.012 0.019 0.019 E<br />
Sarasota 7639 Eli Herschberger A485 G 0.121 0.217 0.217 E<br />
Sarasota 8010 William T & Pamela C Wilson A485 G 0.013 0.021 0.021 E<br />
Sarasota 8289 Richard N Devita A490 G 0.04 0.056 0.056 E<br />
Sarasota 8541 Nokomis Groves Inc A415 G 0.025 0.041 0.041 E<br />
Sarasota 8542 Nokomis Groves Inc A415 G 0.023 0.038 0.038 E<br />
Sarasota 8543 Nokomis Groves Inc A415 G 0.039 0.055 0.055 E<br />
Sarasota 9267 Edward F & Maria Windemuller A415 G 0.016 0.026 0.026 E<br />
Sarasota 9617 William L & Pamela A Pischer A57F G 0.007 0.011 0.011 E<br />
Sarasota 10396 Joe I. Douglas & Myrtle D. Gass, Trustees A415 G 0.006 0.02 0.02 E<br />
Sarasota 10396 Joe I. Douglas & Myrtle D. Gass, Trustees A415 S 0.006 0.02 0.02 E<br />
Sarasota 10426 Robert A Davidson A415 G 0.001 0.03 0.03 E<br />
M/E 5<br />
Page | 343
<strong>2011</strong> ESTIMATED WATER USE REPORT<br />
Table A7. Metered and <strong>Estimated</strong> Agricultural WUPs, Withdrawals and Permitted <strong>Use</strong> (mgd), <strong>2011</strong><br />
County<br />
WUP<br />
Number<br />
<strong>Southwest</strong> <strong>Florida</strong> <strong>Water</strong> <strong>Management</strong> District<br />
Permittee<br />
<strong>Use</strong><br />
Code 1<br />
Source 2<br />
Annual<br />
Average<br />
Pumpage 3<br />
Total<br />
Permitted<br />
Annual<br />
Average<br />
Quantity<br />
Permitted<br />
Quantity<br />
Attributed<br />
to AG <strong>Use</strong><br />
Category 4<br />
Sarasota 10426 Robert A Davidson A415 S 0.018 0.03 0.03 E<br />
Sarasota 10444 James G. Russ, Trustee A415 S 0.014 0.023 0.023 E<br />
Sarasota 10458 Palmer Place LLC A415 G 0.185 0.335 0.335 E<br />
Sarasota 10520 Indian Creek Development LLC & Bdr Investments LLC L600 G 0.001 0.002 0.002 E<br />
Sarasota 10979 Angelo E Alviani A415 G 0.009 0.015 0.015 E<br />
Sarasota 11351 Sea Oats Nursery & Landscaping A480 S 0.01 0.016 0.016 E<br />
Sarasota 11511 Thomas F & James M Kelly A490 G 0.019 0.031 0.031 E<br />
Sarasota 12492 School Board of Sarasota County A490 G 0.005 0.016 0.009 E<br />
12645 Riggs NPC #2 LLC & Riggs NPCLC3 LLC‐FC LLC‐ACP LLCJ A525<br />
0 0.395 0.395<br />
G<br />
Sarasota<br />
Schier<br />
E<br />
Sarasota 13029 Great River Groves Inc & Browers Groves Inc A415 G 0.023 0.038 0.038 E<br />
Sarasota 13088 Richard Walden A480 G 0.001 0.073 0.073 E<br />
Sarasota 13088 Richard Walden A480 S 0.043 0.073 0.073 E<br />
3.499 Metered, mgd<br />
Sarasota County Totals<br />
1.072 <strong>Estimated</strong> , mgd<br />
4.571 Total, mgd<br />
Sumter 2180 Lee Capital LP & Sr 44 LC A480 G 0.002 1.026 1.026 M<br />
Sumter 3534 <strong>Florida</strong> Fish & Wildlife Conserv Commission L630 G 1.610 1.901 1.901 M<br />
Sumter 6838 <strong>Florida</strong> Department of Corrections A57F G 0.009 0.458 0.014 M<br />
Sumter 8211 Flowerwood Nursery A480 G 0.180 0.575 0.575 M<br />
Sumter 8211 Flowerwood Nursery A480 S 0.308 0.575 0.575 M<br />
Sumter 10519 Carriage Country, Appaloosa Acres, Derby Dreams A480 G 0.448 0.746 0.746 M<br />
Sumter 11259 Sumter County BOCC L600 G 0.000 0.125 0.011 M<br />
Sumter 410 M. Austin Davis Revocable Trust A495 G 0.266 0.48 0.48 E<br />
Sumter 1811 Speedling Inc A487 G 0.059 0.099 0.097 E<br />
Sumter 1853 Jerry G. Maddox L610 G 0.001 0.001 0.001 E<br />
Sumter 1895 J.A. Watson A490 G 0.017 0.028 0.028 E<br />
1896 Debra A. Smith Revocable Trust and Debra A. Smith, A490<br />
0.021 0.034 0.034<br />
G<br />
Sumter<br />
Trustee<br />
E<br />
Sumter 1926 Donald and Wilma Jones A470 G 0.052 0.072 0.072 E<br />
Sumter 2106 R Wendell Warnock Family Trust A470 G 0.018 0.03 0.03 E<br />
M/E 5<br />
Page | 344
<strong>2011</strong> ESTIMATED WATER USE REPORT<br />
Table A7. Metered and <strong>Estimated</strong> Agricultural WUPs, Withdrawals and Permitted <strong>Use</strong> (mgd), <strong>2011</strong><br />
County<br />
WUP<br />
Number<br />
<strong>Southwest</strong> <strong>Florida</strong> <strong>Water</strong> <strong>Management</strong> District<br />
Permittee<br />
<strong>Use</strong><br />
Code 1<br />
Source 2<br />
Annual<br />
Average<br />
Pumpage 3<br />
Total<br />
Permitted<br />
Annual<br />
Average<br />
Quantity<br />
Permitted<br />
Quantity<br />
Attributed<br />
to AG <strong>Use</strong><br />
Category 4<br />
Sumter 2182 Lee Capital LP & Sr 44 Lc A495 G 0.06 0.202 0.202 E<br />
Sumter 2409 James Young A445 G 0.007 0.012 0.012 E<br />
Sumter 2460 Hugh L. Nichols A400 G 0.069 0.3 0.3 E<br />
Sumter 2460 Hugh L. Nichols A400 S 0 0.3 0.3 E<br />
Sumter 2548 Bakers Properties Inc A470 G 0 0.036 0.036 E<br />
Sumter 2548 Bakers Properties Inc A470 S 0.021 0.036 0.036 E<br />
Sumter 2608 Barbara M Mccarty & Lisa D L600 G 0.001 0.001 0.001 E<br />
Sumter 2685 Helen & Autrey Tompkins A430 G 0.004 0.012 0.012 E<br />
Sumter 2777 T. P Caruthers Jr. And Betty G Caruthers A495 G 0.025 0.041 0.041 E<br />
Sumter 2778 Reggie P. Caruthers A495 G 0.004 0.007 0.007 E<br />
Sumter 2798 Bigham Farms, Inc. A470 G 0.011 0.059 0.059 E<br />
Sumter 2798 Bigham Farms, Inc. A470 S 0 0.059 0.059 E<br />
Sumter 2808 Denco Inc A470 G 0.031 0.05 0.05 E<br />
Sumter 2825 Darroll Martin A56F G 0.052 0.072 0.072 E<br />
Sumter 2970 GMJ Properties, LLC A495 G 0.04 0.056 0.056 E<br />
Sumter 3066 Bigham Hide Co A470 G 0.033 0.182 0.182 E<br />
Sumter 3066 Bigham Hide Co A470 S 0 0.182 0.182 E<br />
Sumter 3087 Sumter Cement Co LLC L600 G 0 0.006 0.005 E<br />
Sumter 3089 Darryl Richie, Martha Richie, Christina Moye A495 G 0.058 0.095 0.095 E<br />
Sumter 3152 Graham Contracting, Inc. A495 G 0.186 0.49 0.322 E<br />
Sumter 3229 Gattis, Inc. A470 G 0.029 0.048 0.048 E<br />
Sumter 3231 Word Family LLC c/o Thomas Word, Jr. A470 G 0.009 0.042 0.042 E<br />
Sumter 3232 W. Caruthers A495 G 0.016 0.087 0.087 E<br />
Sumter 3282 Hugh L. Marshall A490 G 0.011 0.017 0.017 E<br />
Sumter 3315 William and Wendy Ricci L600 G 0.001 0.001 0.001 E<br />
Sumter 3316 Sumter County LLC, c/o G. Kent Fuller A495 G 0.021 0.035 0.035 E<br />
Sumter 3351 Selway Farms, Inc. A415 G 0.023 0.065 0.065 E<br />
Sumter 3374 Larry R Brown A525 G 0.206 0.495 0.495 E<br />
Sumter 3507 Francis E & Theresa H Dewitt L600 G 0 0 0 E<br />
Sumter 3526 Acorn Investments LLC A470 G 0.017 0.027 0.027 E<br />
Sumter 3566 George J Nash A490 G 0.053 0.074 0.074 E<br />
M/E 5<br />
Page | 345
<strong>2011</strong> ESTIMATED WATER USE REPORT<br />
Table A7. Metered and <strong>Estimated</strong> Agricultural WUPs, Withdrawals and Permitted <strong>Use</strong> (mgd), <strong>2011</strong><br />
County<br />
WUP<br />
Number<br />
<strong>Southwest</strong> <strong>Florida</strong> <strong>Water</strong> <strong>Management</strong> District<br />
Permittee<br />
<strong>Use</strong><br />
Code 1<br />
Source 2<br />
Annual<br />
Average<br />
Pumpage 3<br />
Total<br />
Permitted<br />
Annual<br />
Average<br />
Quantity<br />
Permitted<br />
Quantity<br />
Attributed<br />
to AG <strong>Use</strong><br />
Category 4<br />
Sumter 3569 George O. Parrot Jr., Trustee A495 G 0.086 0.156 0.156 E<br />
Sumter 4090 Barbara Suzanne Hairston, Trustee A495 G 0.055 0.076 0.076 E<br />
Sumter 4216 Bakers Tree Farm A485 G 0.018 0.03 0.03 E<br />
Sumter 4295 Sumter County Board Of Public Instruction A465 G 0.02 0.041 0.032 E<br />
Sumter 4400 The Villages of Lake‐Sumter, Inc. A706 G 0.004 0.424 0.424 E<br />
Sumter 4400 The Villages of Lake‐Sumter, Inc. A706 S 0.231 0.424 0.424 E<br />
Sumter 4429 C John Coniglio A470 G 0.034 0.093 0.093 E<br />
Sumter 4644 Jack Drawdy A58S G 0.054 0.089 0.089 E<br />
Sumter 4940 Thelma O Strong A490 G 0.147 0.267 0.267 E<br />
Sumter 5275 Jack Drawdy & Malcolm B. Burris A51S G 0.001 0.056 0.056 E<br />
Sumter 5959 Sumter County School Board A500 G 0.004 0.006 0.006 E<br />
Sumter 5963 Robert V Millikan Jr A470 G 0.023 0.037 0.037 E<br />
Sumter 6941 Robert Beville Trustee L600 G 0 0.001 0.001 E<br />
Sumter 7180 Center Hill LLC A495 G 0.106 0.188 0.188 E<br />
7380 Arthur Hunter Mcneer‐Florence M Hamilton & Richard R A415<br />
0.129 0.216 0.216<br />
Sumter<br />
Mcneer<br />
G<br />
E<br />
Sumter 7646 M L & Marie T Marsh L600 G 0 0.001 0.001 E<br />
Sumter 7746 Cal‐Maine Foods, Inc. L650 G 0.037 0.061 0.061 E<br />
Sumter 7806 Leone Thomas A470 G 0.014 0.078 0.078 E<br />
Sumter 7814 Frank W. & Perry C. Smith A470 G 0.033 0.092 0.092 E<br />
Sumter 7861 L B Mcleod III & Lucy & John C & James & C Scott Mcleod A52S G 0.163 0.295 0.295 E<br />
Sumter 7885 Charles & Myra Paxton A465 G 0.02 0.032 0.032 E<br />
Sumter 7888 Tom A. Bissonnette & Raymond R. Shoneck, III L610 G 0 0 0 E<br />
Sumter 7925 Rice Cattle Company A470 G 0.005 0.017 0.017 E<br />
Sumter 7933 C. Herman Beville Estate A470 G 0.013 0.18 0.18 E<br />
Sumter 8023 J. Alexander A495 G 0.061 0.084 0.084 E<br />
Sumter 8222 J C & Bertie Crenshaw A465 G 0.014 0.024 0.024 E<br />
Sumter 8366 Barney L. Gentry, III A51S G 0.031 0.05 0.05 E<br />
Sumter 8368 Walter Jr & Dolores E Fuller A480 G 0.055 0.097 0.097 E<br />
Sumter 8397 M J Williams & E L Adams L600 G 0.001 0.001 0.001 E<br />
Sumter 8580 Ben C And Ernestine Gant A51S G 0.018 0.029 0.029 E<br />
M/E 5<br />
Page | 346
<strong>2011</strong> ESTIMATED WATER USE REPORT<br />
Table A7. Metered and <strong>Estimated</strong> Agricultural WUPs, Withdrawals and Permitted <strong>Use</strong> (mgd), <strong>2011</strong><br />
County<br />
WUP<br />
Number<br />
<strong>Southwest</strong> <strong>Florida</strong> <strong>Water</strong> <strong>Management</strong> District<br />
Permittee<br />
<strong>Use</strong><br />
Code 1<br />
Source 2<br />
Annual<br />
Average<br />
Pumpage 3<br />
Total<br />
Permitted<br />
Annual<br />
Average<br />
Quantity<br />
Permitted<br />
Quantity<br />
Attributed<br />
to AG <strong>Use</strong><br />
Category 4<br />
Sumter 8832 Terry N & Betsy S Gideons A480 G 0.029 0.094 0.094 E<br />
Sumter 8835 Rice Cattle Company A495 G 0.006 0.049 0.049 E<br />
Sumter 9121 Keith And Karen Sumner A485 G 0.024 0.039 0.039 E<br />
Sumter 9410 <strong>Florida</strong> Fish Farms Inc L633 G 0.102 0.35 0.35 E<br />
Sumter 9899 Harvey R. & Grace Croft A430 G 0.02 0.032 0.032 E<br />
Sumter 9960 Center Hill LLC, Shady Brook LLC, & K. Ray Pinkstaff A525 G 0.283 0.492 0.492 E<br />
Sumter 10289 Paul S. and Geraldine V. McCormic L600 G 0 0.001 0.001 E<br />
Sumter 10385 William & Hildreth Stalnaker, William Stalnaker Trust A455 G 0.065 0.09 0.09 E<br />
Sumter 10510 Robert & Christine Dudley A485 G 0.01 0.033 0.033 E<br />
Sumter 10626 William Mizell A470 G 0.015 0.024 0.024 E<br />
Sumter 10769 Bexley Brothers, Inc A470 G 0.154 0.279 0.279 E<br />
Sumter 10894 Patrick Jean & Anita Kiehl A415 G 0.022 0.036 0.036 E<br />
Sumter 10918 Peter A & Iris M Alfonso A535 G 0.005 0.094 0.094 E<br />
Sumter 10920 Patricia Mauldin A51S G 0.039 0.084 0.084 E<br />
Sumter 11051 Jimmy & Joyce Myles A470 G 0.025 0.041 0.041 E<br />
Sumter 11054 George M Derewenko A470 G 0.04 0.056 0.056 E<br />
Sumter 11060 Dianne K. Waldron A51S G 0.023 0.038 0.038 E<br />
11094 Glenn E & Brenda K Maddox‐Trsts Of Glenn & Brenda A480<br />
0.138 0.249 0.249<br />
Sumter<br />
Maddox‐Et Al<br />
G<br />
E<br />
Sumter 11415 Lee Capital LP & Sumter LLC A480 G 0.057 0.319 0.319 E<br />
Sumter 11551 Vernon & Maritsa Cook A480 G 0.023 0.094 0.094 E<br />
Sumter 11611 Steven M & Eugenia Bowling A485 G 0.017 0.029 0.029 E<br />
Sumter 11622 Klinger Brothers Enterprises A480 G 0.082 0.301 0.301 E<br />
Sumter 11622 Klinger Brothers Enterprises A480 S 0.068 0.301 0.301 E<br />
Sumter 11632 Terry N & Betsy S Gideons A480 G 0.056 0.098 0.098 E<br />
Sumter 11645 John H & Edward A Froberg A455 G 0.068 0.094 0.094 E<br />
Sumter 11655 Antonio Estarellas A470 G 0.026 0.043 0.043 E<br />
Sumter 11658 Hibernia Enterprises Inc A480 G 0.052 0.281 0.281 E<br />
Sumter 11676 Joel A & Evan D Merritt & Connie L Cayson A52S G 0.017 0.028 0.028 E<br />
Sumter 11730 Kenneth A & Peggy A Jones L600 G 0 0 0 E<br />
Sumter 11849 Stuart W & Lori G Maddox A480 G 0.137 0.358 0.358 E<br />
M/E 5<br />
Page | 347
<strong>2011</strong> ESTIMATED WATER USE REPORT<br />
Table A7. Metered and <strong>Estimated</strong> Agricultural WUPs, Withdrawals and Permitted <strong>Use</strong> (mgd), <strong>2011</strong><br />
County<br />
WUP<br />
Number<br />
<strong>Southwest</strong> <strong>Florida</strong> <strong>Water</strong> <strong>Management</strong> District<br />
Permittee<br />
<strong>Use</strong><br />
Code 1<br />
Source 2<br />
Annual<br />
Average<br />
Pumpage 3<br />
Total<br />
Permitted<br />
Annual<br />
Average<br />
Quantity<br />
Permitted<br />
Quantity<br />
Attributed<br />
to AG <strong>Use</strong><br />
Category 4<br />
Sumter 11859 James Young Trustee A56S G 0.022 0.037 0.037 E<br />
Sumter 11879 Hal Lyons A480 G 0.047 0.172 0.172 E<br />
Sumter 11942 Monica Motley A470 G 0 0.059 0.059 E<br />
Sumter 12039 Tree Capital Inc A480 G 0 0.172 0.172 E<br />
Sumter 12047 Eric J & Sandy S Green A410 G 0.002 0.006 0.006 E<br />
Sumter 12138 Brenda Branch Lancaster A480 G 0.066 0.097 0.097 E<br />
Sumter 12162 Alva A. and Glenda Lipps A58S G 0.008 0.012 0.012 E<br />
Sumter 12327 Pavel Goussev & Natalia Gousseva A480 G 0 0.042 0.042 E<br />
Sumter 12332 Daroll Craig & Angela Martin A56S G 0.054 0.075 0.075 E<br />
Sumter 12336 Richard Alton Branch II A58S G 0.048 0.066 0.066 E<br />
Sumter 12518 Robert Douglas Snook A485 G 0.009 0.015 0.015 E<br />
Sumter 12522 Raymond Penrose & June Baker Beaumont A470 G 0.107 0.148 0.148 E<br />
Sumter 12610 Dale E & Linda F Jones A470 G 0.014 0.023 0.023 E<br />
12651 Emil & Ivette Owen As Trustees Of The Malachite<br />
A410<br />
0.013 0.042 0.042<br />
Sumter<br />
Revocable Trust<br />
G<br />
E<br />
Sumter 12773 D Randall Davis Revocable Trust A52S G 0.104 0.189 0.189 E<br />
Sumter 12827 James B. & Gloria Williams A58S G 0.003 0.004 0.004 E<br />
Sumter 12831 Donald C & Virginia V Marshall A410 G 0.007 0.024 0.024 E<br />
Sumter 12858 Mildred B Odell Trust A470 G 0.048 0.078 0.078 E<br />
Sumter 13019 Susie Ann Steele&Joseph D Graham A470 G 0.004 0.007 0.007 E<br />
Sumter 13139 Monique De Groen & Newsome A470 G 0.045 0.064 0.064 E<br />
Sumter 13190 Martin C Brown A490 G 0 0.091 0.091 E<br />
Sumter 13214 Frank M Mills A410 G 0.017 0.057 0.057 E<br />
Sumter 20035 Johannes Vanderwey A410 G 0 0.043 0.043 E<br />
Sumter 20039 Gordon Tillman A470 G 0.061 0.084 0.084 E<br />
Sumter 20042 Odis W And Carole W Bennett A57S G 0.006 0.01 0.01 E<br />
Sumter 20059 Ronald K & SUSAn M Hunt A495 G 0.014 0.046 0.046 E<br />
Sumter 20060 Nathaniel H & Anna R Jameson A420 G 0.014 0.023 0.023 E<br />
Sumter 20100 Gyorgy & Hilda Pecsenka A410 G 0 0.008 0.007 E<br />
Sumter 20105 TrueBlue Growers LLC A410 G 0.026 0.064 0.064 E<br />
Sumter 20155 Skyline LLC A470 G 0.057 0.079 0.079 E<br />
M/E 5<br />
Page | 348
<strong>Southwest</strong> <strong>Florida</strong> <strong>Water</strong> <strong>Management</strong> District<br />
<strong>2011</strong> ESTIMATED WATER USE REPORT<br />
Table A7. Metered and <strong>Estimated</strong> Agricultural WUPs, Withdrawals and Permitted <strong>Use</strong> (mgd), <strong>2011</strong><br />
County<br />
WUP<br />
Number<br />
Permittee<br />
<strong>Use</strong><br />
Code 1<br />
Source 2<br />
Annual<br />
Average<br />
Pumpage 3<br />
Total<br />
Permitted<br />
Annual<br />
Average<br />
Quantity<br />
Permitted<br />
Quantity<br />
Attributed<br />
to AG <strong>Use</strong><br />
Category 4<br />
Sumter 20221 Leonard Northup A445 G 0 0.021 0.021 E<br />
Sumter 20222 Leonard Northup A445 G 0 0.033 0.033 E<br />
Sumter 20250 Dorothy and Norman LaPerle A470 G 0 0.107 0.107 E<br />
2.557 Metered, mgd<br />
Sumter County Totals<br />
5.198 <strong>Estimated</strong> , mgd<br />
7.755 Total, mgd<br />
271.601 Metered, mgd<br />
118.842 <strong>Estimated</strong> , mgd<br />
District Totals<br />
390.443 Total, mgd<br />
Source: District WUP database (WMIS), Calendar year <strong>2011</strong><br />
Notes:<br />
1<br />
<strong>Use</strong> Code: <strong>Use</strong> Code: Alpha‐numeric number given to the use that has the highest quantity attributed to the permit. The first letter indicates the “Predominant<br />
<strong>Use</strong>” on the permit (A=Agricultural, I = Industrial/Commercial, M = Mining/Dewatering, R = Recreation/Aesthetic and P = Public Supply<br />
2 Source = Groundwater (G), Surface <strong>Water</strong> (S)<br />
3<br />
The metered or estimated annual average amount pumped (aka used, withdrawn) in 2010.<br />
4<br />
This value gives an indication if the issued WUP is entirely for agricultural use (the quantities in the 7th and 8th columns are equal), or if water is also permitted<br />
under another predominant use (quantity in 7th column > quantity in 8th column).<br />
5 Metered or <strong>Estimated</strong><br />
<strong>Use</strong> Code Descriptions (This list contains all District agricultural water use codes and may contain more codes than are listed in the table. Codes in italics are discontinued,<br />
but may still be in the database until a permit is modified.)<br />
<strong>Water</strong><br />
<strong>Use</strong><br />
Code<br />
<strong>Water</strong> <strong>Use</strong> Description<br />
<strong>Water</strong><br />
<strong>Use</strong> Code <strong>Water</strong> <strong>Use</strong> Description Livestock Codes<br />
A402 Spray Mix for Crops A520 Research L600 Animals<br />
A403 Biofuel Crops A525 Sod L601 Goats<br />
A405 Augmentation for Environmental A52F Peanuts, Fall L602 Llama/Alpaca<br />
A406 Product Washing & Packaging (crops) A52S Peanuts, Spring L603 Ostrich<br />
A407 Pine Or Other Evergreen Trees A515 Potatoes A655 Squash, Zucchini ‐ (Non Cover Crop)<br />
A410 Blueberries A51S Peppers, Spring A700 Other Crops/Plants<br />
M/E 5<br />
Page | 349
<strong>2011</strong> ESTIMATED WATER USE REPORT<br />
A415 Citrus A530 Soybeans A706 Dewatering to offsite For Ag Purposes<br />
A416 Citrus, Flatwood A535 Strawberries A705 Dewatering to Onsite For Ag Purposes<br />
A420 Container Citrus Nursery A540 Subtropical Fruits (Avocado, Bananas, Kiwi) L604 Rabbits<br />
A421 Bedding Plants A545 Sugarcane L606 Sheep<br />
A425 Field Citrus Nursery A550 Corn, Sweet L615 Dairy Farming<br />
A426 Woody Ornamentals A555 Tobacco L630 Aquaculture ‐ Fish Farm (Edible)<br />
A430 Cover Crop A56F Tomatoes, Fall L631 Catfish ‐ Food<br />
A43F Cucumbers, Fall A56S Tomatoes, Spring L650 Poultry/Turkeys<br />
A43S Cucumbers, Spring A575 Vegetables, Oriental L655 Swine<br />
A445 Fruit trees other than citrus A57F Vegetables Small, Fall L660 Aquaculture ‐ Tropical Fish Farms<br />
A44S Cucumbers, Spring A57H Vegetables, Summer L730 Product Cooling<br />
A450 Corn, Feed A57S Vegetables, Spring L725 Packaging<br />
A451 Corn, Silage A58H Summer Small Vegetables L740 Fire Protection/Testing<br />
A455 Grains, All A58S Vegetables Small, Spring L745 Rescue Shelter Animals<br />
A460 Lawn & Landscape Irrigation A590 Vineyards L715 Equipment And Facility Cleaning<br />
A465 Beans, Dry A591 Freeze and/or Heat Stress L632 Commercial Food<br />
A466 Beans, Green A592 <strong>Water</strong>cress L633 Feeder Fish<br />
A470 Melons A610 Broccoli L661 Commercial Tropical Fish<br />
A475 Nurseries A615 Cabbage Bok Choy L705 Cleaning / Maintenance<br />
A480 Nursery, Container A620 Carrots L707 Tank fill for fertigation/chemigation<br />
A485 Nursery, Field A625 Cauliflower L720 In‐field washing and packing<br />
A486 Caladiums A630 Celery L735 Product Washing<br />
A487 Greenhouse Plants/Nursery A635 Eggplant L700 Animal Cleaning<br />
A488 Cut Flowers A640 Okra (Non‐Cover Crop) L710 Drinking <strong>Water</strong><br />
A490 Pasture A645 Personal Sanitary <strong>Use</strong> L620 Dairy Product Cooling<br />
A491 Alfalfa A646 Onions L625 Equipment and Facility Cleaning<br />
A495 Hay, Commercial A647 Fire Suppression L605 Cattle, Feedlot<br />
A500 Peanuts A650 Other (NonCrop Miscellaneous <strong>Water</strong> Needs) L610 Cattle, Pastured<br />
A505 Peppers A651 Peas, Snow Peas L635 Horses<br />
A50F Peppers, Fall A652 Pine or Other Evergreen Trees L640 Livestock Cooling<br />
<strong>Southwest</strong> <strong>Florida</strong> <strong>Water</strong> <strong>Management</strong> District<br />
Page | 350
<strong>2011</strong> ESTIMATED WATER USE REPORT<br />
TABLE A8. <strong>2011</strong> METERED + ESTIMATED AGRICULTURE MONTHLY AVERAGE PUMPAGE (MGD/MONTH) BY COUNTY)<br />
County Jan Feb Mar Apr May Jun Jul Aug Sep Oct Nov Dec<br />
*Charlotte 8.076 17.910 15.028 18.140 20.194 11.451 2.784 2.391 2.982 6.079 10.877 15.723<br />
Citrus 1.307 1.392 1.946 2.229 2.734 2.216 0.130 0.111 0.623 0.727 1.589 2.167<br />
Desoto 85.349 54.462 73.679 87.143 101.165 95.087 13.305 15.342 52.269 34.036 74.482 123.702<br />
Hardee 37.616 40.440 43.251 53.411 61.095 55.790 14.438 9.761 30.232 16.044 37.642 54.981<br />
Hernando 1.708 1.644 2.345 2.760 3.402 2.835 0.151 0.122 0.799 0.904 2.015 2.646<br />
*Highlands 29.588 40.991 48.777 53.841 64.527 54.654 22.092 24.983 32.499 19.961 52.993 41.891<br />
Hillsborough 54.521 47.314 60.797 67.598 75.362 56.906 9.293 14.209 31.880 62.473 62.067 64.028<br />
*Lake 0.838 1.045 1.046 2.381 2.391 1.738 0.299 0.090 0.537 0.674 0.891 2.180<br />
*Levy 4.402 5.236 7.617 8.588 12.259 13.461 3.358 2.694 3.366 3.907 5.426 8.064<br />
Manatee 60.597 89.482 100.525 88.157 83.371 57.595 12.596 20.955 42.362 62.319 76.187 93.154<br />
*Marion 3.141 3.640 5.287 5.382 7.016 6.621 1.005 0.782 2.262 2.054 4.387 6.141<br />
Pasco 9.245 7.480 13.377 13.729 17.775 14.772 4.300 2.301 5.243 4.846 9.772 13.613<br />
Pinellas 0.102 0.088 0.132 0.160 0.197 0.168 0.007 0.003 0.049 0.052 0.126 0.157<br />
*Polk 65.288 72.680 100.302 119.023 143.401 127.143 27.190 20.762 47.840 47.005 87.373 106.143<br />
Sarasota 3.483 6.382 5.830 5.569 7.672 5.293 1.198 0.362 1.421 1.786 3.356 12.512<br />
Sumter 5.831 6.981 10.027 10.697 12.835 12.708 3.038 3.616 4.839 4.706 7.744 10.037<br />
District 371.092 397.167 489.966 538.808 615.396 518.438 115.184 118.484 259.203 267.573 436.927 557.139<br />
Groundwater 359.117 378.758 473.229 517.895 592.333 500.565 111.857 112.345 244.290 255.499 410.800 537.871<br />
Surface <strong>Water</strong> 11.975 18.409 16.736 20.913 23.062 17.872 3.327 6.139 14.913 12.075 26.126 19.268<br />
<strong>Southwest</strong> <strong>Florida</strong> <strong>Water</strong> <strong>Management</strong> District Page | 351
<strong>2011</strong> ESTIMATED WATER USE REPORT<br />
Table A9. Metered and <strong>Estimated</strong> Mining/Dewatering WUPs, Withdrawals and Permitted <strong>Use</strong> (mgd), <strong>2011</strong><br />
COUNTY<br />
WUP<br />
Number<br />
Permittee<br />
<strong>Use</strong><br />
Code1<br />
Source 2<br />
Annual<br />
Average<br />
<strong>Use</strong> 3<br />
Total Permitted<br />
Annual Average<br />
Quantity<br />
Permitted<br />
Quantity<br />
Attributed<br />
to M/D <strong>Use</strong><br />
Category 4<br />
M/E 5<br />
CHARLOTTE 9687 WILLIAMS FARMS PARTNERSHIP M976 G 0.000 1.571 0.032 M<br />
CHARLOTTE 9687 WILLIAMS FARMS PARTNERSHIP M976 S 0.021 1.571 0.032 M<br />
CHARLOTTE 8322 WATERMELON PIT LLC M976 S 0.000 0.009 0.009 E<br />
CHARLOTTE 9322 HIGHLANDS COUNTY BOCC M970 S 0.000 0.004 0.004 E<br />
CHARLOTTE 9778 HANDY PHIL INC M976 S 0.000 0.006 0.006 E<br />
CHARLOTTE 10193 DON DESROSIERS M960 S 0.000 0.400 0.400 E<br />
CHARLOTTE 10218 M. LEWIS HALL PROTECTIVE TRUST M965 S 0.000 0.012 0.012 E<br />
CHARLOTTE 11222 NESLUND FAMILY LIMITED PARTNERSHIP II M976 G 0.000 0.036 0.036 E<br />
CHARLOTTE 11222 NESLUND FAMILY LIMITED PARTNERSHIP II M976 S 0.000 0.036 0.036 E<br />
CHARLOTTE 11968 ROTONDA SANDS CONSERVATION ASSOC INC M976 S 0.000 0.014 0.014 E<br />
CHARLOTTE 11996 STOCK DEVELOPMENT LLC M976 S 0.000 0.010 0.010 E<br />
CHARLOTTE 12337 ROTONDA GOLF PARTNERS LLC M965 S 0.004 0.129 0.006 E<br />
CHARLOTTE 12388 WESTPOINTS INVESTMENT PARTNERS VIII LLC M976 S 0.000 0.046 0.046 E<br />
CHARLOTTE 12828<br />
GREG MORO C/O INDEPENDENCE RECYCLING OF FL<br />
INC<br />
M976 S 0.000 0.029 0.029 E<br />
CHARLOTTE 12915 INFINITY LAKES INVESTORS M976 S 0.000 0.068 0.068 E<br />
CHARLOTTE 13020 TRB GROVES LLC WESLEY W BRUMBACK M965 S 0.000 0.058 0.058 E<br />
CHARLOTTE 13115 TRIPLE I LIMITED PARTNERSHIP LLLP M970 S 0.000 0.050 0.050 E<br />
CHARLOTTE 13120 JOHN MENEELY M970 S 0.000 0.022 0.022 E<br />
CHARLOTTE 13138 JULIAN L WRIGHT M970 S 0.000 0.053 0.053 E<br />
CHARLOTTE 13353<br />
FLORIDA FISH & WILDLIFE CONSERVATION<br />
COMMISSION<br />
M995 S 0.000 0.499 0.499 E<br />
CHARLOTTE 20066 AMERICAN CITRUS PRODUCTS M976 S 0.000 0.028 0.028 E<br />
CHARLOTTE COUNTY TOTALS<br />
0.021 Metered, mgd<br />
0.004 <strong>Estimated</strong> , mgd<br />
0.025 Total, mgd<br />
CITRUS 7687 CRYSTAL RIVER QUARRIES INC M915 G 0.000 0.062 0.060 E<br />
<strong>Southwest</strong> <strong>Florida</strong> <strong>Water</strong> <strong>Management</strong> District Page | 352
<strong>2011</strong> ESTIMATED WATER USE REPORT<br />
Table A9. Metered and <strong>Estimated</strong> Mining/Dewatering WUPs, Withdrawals and Permitted <strong>Use</strong> (mgd), <strong>2011</strong><br />
COUNTY<br />
WUP<br />
Number<br />
Permittee<br />
<strong>Use</strong><br />
Code1<br />
Source 2<br />
Annual<br />
Average<br />
<strong>Use</strong> 3<br />
Total Permitted<br />
Annual Average<br />
Quantity<br />
Permitted<br />
Quantity<br />
Attributed<br />
to M/D <strong>Use</strong><br />
Category 4<br />
M/E 5<br />
CITRUS 7819 CITRUS MINING AND TIMBER INC. M976 G 0.000 0.038 0.038 E<br />
CITRUS 7819 CITRUS MINING AND TIMBER INC. M976 S 0.000 0.038 0.038 E<br />
CITRUS 12058 CRYSTAL RIVER QUARRIES INC M911 S 0.006 0.067 0.067 E<br />
CITRUS COUNTY TOTALS<br />
0.000 Metered, mgd<br />
0.006 <strong>Estimated</strong> , mgd<br />
0.006 Total, mgd<br />
DESOTO 1796 NEW FLORIDA VENTURES INC M976 S 0.000 0.010 0.010 E<br />
DESOTO 2076 SANDHILL GROUP LLC M976 S 0.000 0.045 0.045 E<br />
DESOTO 2914 JAMES D WOODSON JR M976 S 0.000 0.018 0.018 E<br />
DESOTO 5902 CHASE INVESTMENTS 2 LLC M965 S 0.000 0.011 0.011 E<br />
DESOTO 10211 D L BRANTLEY JR M970 S 0.000 0.010 0.010 E<br />
DESOTO 10673 BORAN DEANGELIS GARGUILO PARTNERSHIP M965 S 0.000 0.226 0.226 E<br />
DESOTO 10905 GEORGE COLEMAN & ADRIAN R CHAPMAN M976 S 0.000 0.007 0.007 E<br />
DESOTO 12981 LAWRENCE I DAVIS JR M970 S 0.000 0.010 0.010 E<br />
DESOTO 12985 DONRAY PROP LLC M976 S 0.000 0.045 0.045 E<br />
DESOTO 13002 WHEELER FARMS INC M965 S 0.000 0.018 0.018 E<br />
DESOTO 13037 DESOTO LAND INVESTMENT, LLC M976 S 0.000 0.058 0.058 E<br />
DESOTO 13073 HAY AVENUE PROPERTIES LLC M976 S 0.000 0.024 0.024 E<br />
DESOTO 13274 WCA OF FLORIDA LLC M965 G 0.000 0.019 0.019 E<br />
DESOTO 13274 WCA OF FLORIDA LLC M965 S 0.000 0.019 0.019 E<br />
DESOTO COUNTY TOTALS<br />
NA Metered, mgd<br />
0.000 <strong>Estimated</strong> , mgd<br />
0.000 Total, mgd<br />
HARDEE 3669 CF INDUSTRIES INC M940 G 0.333 6.392 6.390 M<br />
HARDEE 218 KESHAV PATEL P070 G 0.003 0.005 0.005 E<br />
HARDEE 2402 ORANGE BLOSSOM RV PARK INC P131 G 0.016 0.025 0.025 E<br />
HARDEE 3424 GEORGE H & NORMA M MCNARY P100 G 0.004 0.006 0.006 E<br />
<strong>Southwest</strong> <strong>Florida</strong> <strong>Water</strong> <strong>Management</strong> District Page | 353
<strong>2011</strong> ESTIMATED WATER USE REPORT<br />
Table A9. Metered and <strong>Estimated</strong> Mining/Dewatering WUPs, Withdrawals and Permitted <strong>Use</strong> (mgd), <strong>2011</strong><br />
COUNTY<br />
WUP<br />
Number<br />
Permittee<br />
<strong>Use</strong><br />
Code1<br />
Source 2<br />
Annual<br />
Average<br />
<strong>Use</strong> 3<br />
Total Permitted<br />
Annual Average<br />
Quantity<br />
Permitted<br />
Quantity<br />
Attributed<br />
to M/D <strong>Use</strong><br />
Category 4<br />
M/E 5<br />
HARDEE 7022 MHC PEACE RIVER, LLC ATTN: KAREN DOIRON P100 G 0.018 0.026 0.026 E<br />
HARDEE 8969 GERMAN FLORIDA CITRUS LLC P130 G 0.041 0.376 0.083 E<br />
HARDEE 11087 FLORIDA S K P CO‐OP INC P131 G 0.004 0.006 0.006 E<br />
HARDEE 11180 TORREY OAKS HOA CHARLES NICHOLSON P130 G 0.012 0.017 0.017 E<br />
HARDEE 11352 WAYNE C & DORIS F RICKERT P130 G 0.021 0.059 0.059 E<br />
HARDEE COUNTY TOTALS<br />
0.333 Metered, mgd<br />
0.119 <strong>Estimated</strong> , mgd<br />
0.452 Total, mgd<br />
HERNANDO 215 CEMEX CONSTRUCTION MATERIALS M915 G 4.637 6.785 6.785 M<br />
HERNANDO 215 CEMEX CONSTRUCTION MATERIALS M915 S 0.000 6.785 6.785 M<br />
HERNANDO 199 BROOKSVILLE QUARRY LLC M976 G 0.000 0.021 0.021 E<br />
HERNANDO 199 BROOKSVILLE QUARRY LLC M976 S 0.000 0.021 0.021 E<br />
HERNANDO 2288 VULCAN MATERIALS CO & M976 G 0.000 0.070 0.070 E<br />
HERNANDO 7822 E R JAHNA INDUSTRIES INC M976 G 0.000 0.026 0.026 E<br />
HERNANDO 7822 E R JAHNA INDUSTRIES INC M976 S 0.000 0.026 0.026 E<br />
HERNANDO COUNTY TOTALS<br />
4.637 Metered, mgd<br />
0.000 <strong>Estimated</strong> , mgd<br />
4.637 Total, mgd<br />
HIGHLANDS 10547 TU‐CO PEAT INC M976 G 0.000 0.026 0.026 E<br />
HIGHLANDS 10547 TU‐CO PEAT INC M976 S 0.000 0.026 0.026 E<br />
HIGHLANDS 12631 HI‐LAND FARMS INC & DUNE HILL PROPERTIES INC M976 G 0.000 0.012 0.012 E<br />
HIGHLANDS 12631 HI‐LAND FARMS INC & DUNE HILL PROPERTIES INC M976 S 0.000 0.012 0.012 E<br />
HIGHLANDS 12778 HARRELL'S HORTICULTURAL PRODUCTS, LLC M930 G 0.000 0.009 0.009 E<br />
HIGHLANDS 12778 HARRELL'S HORTICULTURAL PRODUCTS, LLC M930 S 0.000 0.009 0.009 E<br />
HIGHLANDS COUNTY TOTALS<br />
NA Metered, mgd<br />
0.000 <strong>Estimated</strong> , mgd<br />
0.000 Total, mgd<br />
<strong>Southwest</strong> <strong>Florida</strong> <strong>Water</strong> <strong>Management</strong> District Page | 354
<strong>2011</strong> ESTIMATED WATER USE REPORT<br />
Table A9. Metered and <strong>Estimated</strong> Mining/Dewatering WUPs, Withdrawals and Permitted <strong>Use</strong> (mgd), <strong>2011</strong><br />
COUNTY<br />
WUP<br />
Number<br />
Permittee<br />
<strong>Use</strong><br />
Code1<br />
Source 2<br />
Annual<br />
Average<br />
<strong>Use</strong> 3<br />
Total Permitted<br />
Annual Average<br />
Quantity<br />
Permitted<br />
Quantity<br />
Attributed<br />
to M/D <strong>Use</strong><br />
Category 4<br />
M/E 5<br />
HILLSBOROUGH 10140 WASTE SERVICES OF FLORIDA INC M976 G 0.001 0.159 0.017 M<br />
HILLSBOROUGH 10140 WASTE SERVICES OF FLORIDA INC M976 S 0.000 0.159 0.017 M<br />
HILLSBOROUGH 12514 DAN S & JOANI J TILLETT M965 G 0.063 0.473 0.080 M<br />
HILLSBOROUGH 12514 DAN S & JOANI J TILLETT M965 S 0.000 0.473 0.080 M<br />
HILLSBOROUGH 12836 TAMPA GROVES LLC M965 G 0.000 0.247 0.093 M<br />
HILLSBOROUGH 12836 TAMPA GROVES LLC M965 S 0.000 0.247 0.093 M<br />
HILLSBOROUGH 11400 MOSAIC FERTILIZER LLC M940 G 0.791 0.000 0.000 M<br />
HILLSBOROUGH 11400 MOSAIC FERTILIZER LLC M940 S 0.015 7.940 7.940 M<br />
HILLSBOROUGH 478 LEE PALLARDY, III, TRUSTEE M976 S 0.000 0.057 0.057 E<br />
HILLSBOROUGH 10268 TRANSCEND DEVELOPMENT CORP M905 G 0.000 0.099 0.058 E<br />
HILLSBOROUGH 10268 TRANSCEND DEVELOPMENT CORP M905 S 0.003 0.099 0.058 E<br />
HILLSBOROUGH 12091<br />
KRUSEN‐DOUGLAS, LLC, ATTN. ANDREW<br />
INGERSOLL<br />
M965 S 0.000 0.140 0.140 E<br />
HILLSBOROUGH 12284 C E LEISEY JR M995 S 0.000 0.057 0.057 E<br />
HILLSBOROUGH 12829 STOCKTON FARMS LLC M976 S 0.000 0.384 0.384 E<br />
HILLSBOROUGH 12955 CL REALTY LLC M976 S 0.000 0.083 0.083 E<br />
HILLSBOROUGH 13146 NORTH DALE DEV LTD M965 S 0.000 0.071 0.071 E<br />
HILLSBOROUGH COUNTY TOTALS<br />
THERE ARE NO MINING/DWEATERING WATER USE PERMITS IN LAKE COUNTY<br />
0.870 Metered, mgd<br />
0.003 <strong>Estimated</strong> , mgd<br />
0.873 Total, mgd<br />
LEVY 13273 TARMAC AMERICA LLC M915 G 0.000 0.123 0.123 E<br />
LEVY 13273 TARMAC AMERICA LLC M915 S 0.000 0.123 0.123 E<br />
LEVY COUNTY TOTALS<br />
NA Metered, mgd<br />
0.000 <strong>Estimated</strong> , mgd<br />
0.000 Total, mgd<br />
<strong>Southwest</strong> <strong>Florida</strong> <strong>Water</strong> <strong>Management</strong> District Page | 355
<strong>2011</strong> ESTIMATED WATER USE REPORT<br />
Table A9. Metered and <strong>Estimated</strong> Mining/Dewatering WUPs, Withdrawals and Permitted <strong>Use</strong> (mgd), <strong>2011</strong><br />
COUNTY<br />
WUP<br />
Number<br />
Permittee<br />
<strong>Use</strong><br />
Code1<br />
Source 2<br />
Annual<br />
Average<br />
<strong>Use</strong> 3<br />
Total Permitted<br />
Annual Average<br />
Quantity<br />
Permitted<br />
Quantity<br />
Attributed<br />
to M/D <strong>Use</strong><br />
Category 4<br />
M/E 5<br />
MANATEE 3740 MOSAIC FERTILIZER LLC M940 G 3.539 6.410 6.410 M<br />
MANATEE 7638 SF AGGREGATES SUPPLY, LLC M976 G 0.000 0.088 0.088 E<br />
MANATEE 7638 SF AGGREGATES SUPPLY, LLC M976 S 0.009 0.088 0.088 E<br />
MANATEE 12992<br />
CC MANATEE DEVELOPMENT LLC C/O LLC DEV<br />
GROUP OF CENTRAL FL<br />
M976 S 0.000 0.218 0.218 E<br />
MANATEE 13106 VERNA ASSET MANAGEMENT LLC M976 S 0.000 0.039 0.039 E<br />
MANATEE 13173 WHITNEY BANK M976 G 0.000 0.097 0.096 E<br />
MANATEE 13173 WHITNEY BANK M976 S 0.000 0.097 0.096 E<br />
PASCO 3468<br />
PASCO 3468<br />
MANATEE COUNTY TOTALS<br />
BEXLEY LAND TRUST‐SC BEXLEY JR‐ LSB CORP‐NNP<br />
BEXLEY LTD<br />
BEXLEY LAND TRUST‐SC BEXLEY JR‐ LSB CORP‐NNP<br />
BEXLEY LTD<br />
3.539 Metered, mgd<br />
0.009 <strong>Estimated</strong> , mgd<br />
3.548 Total, mgd<br />
M976 G 0.001 2.981 0.151 M<br />
M976 S 0.000 2.981 0.151 M<br />
PASCO 11773 LITTLE EVERGLADES RANCH INC M976 G 0.007 0.452 0.025 M<br />
PASCO 11773 LITTLE EVERGLADES RANCH INC M976 S 0.000 0.452 0.025 M<br />
PASCO 12934 ANGELINE CORP JAMES P BEXLEY M976 G 0.000 0.343 0.078 M<br />
PASCO 12934 ANGELINE CORP JAMES P BEXLEY M976 S 0.000 0.343 0.078 M<br />
PASCO 4826 CENTRAL STATE AGGREGATES LLC M976 G 0.000 0.114 0.114 E<br />
PASCO 4826 CENTRAL STATE AGGREGATES LLC M976 S 0.000 0.114 0.114 E<br />
PASCO 6821 SUNCOAST GOLF INC M935 G 0.003 0.093 0.007 E<br />
PASCO 8232 SUN WEST MINE & SUN WEST ACQUISITIONS INC M976 S 0.000 0.004 0.004 E<br />
PASCO 11656 KRUSEN‐DOUGLAS LLC M930 S 0.000 0.014 0.014 E<br />
PASCO 12940 EQUUS RESERVE LLC M925 G 0.000 0.015 0.015 E<br />
PASCO 12940 EQUUS RESERVE LLC M925 S 0.000 0.015 0.015 E<br />
PASCO 13090 JOHN DALFINO OUTLAW RIDGE INC M976 S 0.000 0.012 0.012 E<br />
<strong>Southwest</strong> <strong>Florida</strong> <strong>Water</strong> <strong>Management</strong> District Page | 356
<strong>2011</strong> ESTIMATED WATER USE REPORT<br />
Table A9. Metered and <strong>Estimated</strong> Mining/Dewatering WUPs, Withdrawals and Permitted <strong>Use</strong> (mgd), <strong>2011</strong><br />
COUNTY<br />
WUP<br />
Number<br />
Permittee<br />
<strong>Use</strong><br />
Code1<br />
Source 2<br />
Annual<br />
Average<br />
<strong>Use</strong> 3<br />
Total Permitted<br />
Annual Average<br />
Quantity<br />
Permitted<br />
Quantity<br />
Attributed<br />
to M/D <strong>Use</strong><br />
Category 4<br />
M/E 5<br />
PASCO 13218 NG DEVELOPMENT CORPORATION INC & M965 S 0.000 0.006 0.006 E<br />
PASCO COUNTY TOTALS<br />
0.008 Metered, mgd<br />
0.003 <strong>Estimated</strong> , mgd<br />
0.011 Total, mgd<br />
POLK 29 MOSAIC FERTILIZER LLC M940 G 3.020 11.486 10.374 M<br />
POLK 2297 MOSAIC FERTILIZER LLC M940 G 0.254 17.864 17.864 M<br />
POLK 2873 CEMEX CONST MATERIALS FLORIDA M976 G 0.018 0.500 0.083 M<br />
POLK 2873 CEMEX CONST MATERIALS FLORIDA M976 S 0.000 0.500 0.083 M<br />
POLK 4857<br />
STANDARD SAND & SILICA COMPANY TIMOTHY<br />
CARNES<br />
M960 G 1.196 1.181 1.181 M<br />
POLK 11400 MOSAIC FERTILIZER LLC M940 G 6.602 27.477 27.477 M<br />
POLK 11400 MOSAIC FERTILIZER LLC M940 S 0.126 27.477 27.477 M<br />
POLK 12755 CEMEX CONST MATERIALS FLORIDA M960 G 0.026 0.198 0.198 M<br />
POLK 12755 CEMEX CONST MATERIALS FLORIDA M960 S 0.000 0.198 0.198 M<br />
POLK 1356 APAC‐GEORGIA INC M965 G 0.034 0.500 0.157 E<br />
POLK 1356 APAC‐GEORGIA INC M965 S 0.000 0.500 0.157 E<br />
POLK 1862 DANON MOXLEY M990 G 0.000 0.098 0.092 E<br />
POLK 1862 DANON MOXLEY M990 S 0.000 0.098 0.092 E<br />
POLK 4463 FLORIDA ROCK INDUSTRIES INC M960 G 0.000 0.045 0.045 E<br />
POLK 4463 FLORIDA ROCK INDUSTRIES INC M960 S 0.000 0.045 0.045 E<br />
POLK 5173 VULCAN MATERIALS CO M960 G 0.000 0.029 0.029 E<br />
POLK 5173 VULCAN MATERIALS CO M960 S 0.000 0.029 0.029 E<br />
POLK 6054 E R JAHNA INDUSTRIES INC & PAMELA ESTES M976 G 0.000 0.092 0.050 E<br />
POLK 6054 E R JAHNA INDUSTRIES INC & PAMELA ESTES M976 S 0.000 0.092 0.050 E<br />
POLK 7301 DONALD W FRASIER/ FRASIER CONSTRACTING M976 G 0.000 0.032 0.032 E<br />
POLK 7301 DONALD W FRASIER/ FRASIER CONSTRACTING M976 S 0.000 0.032 0.032 E<br />
POLK 10731 500 ENTERPRISES INC & LITTLE WHEELS INC M965 S 0.000 0.411 0.411 E<br />
<strong>Southwest</strong> <strong>Florida</strong> <strong>Water</strong> <strong>Management</strong> District Page | 357
<strong>2011</strong> ESTIMATED WATER USE REPORT<br />
Table A9. Metered and <strong>Estimated</strong> Mining/Dewatering WUPs, Withdrawals and Permitted <strong>Use</strong> (mgd), <strong>2011</strong><br />
COUNTY<br />
WUP<br />
Number<br />
Permittee<br />
<strong>Use</strong><br />
Code1<br />
Source 2<br />
Annual<br />
Average<br />
<strong>Use</strong> 3<br />
Total Permitted<br />
Annual Average<br />
Quantity<br />
Permitted<br />
Quantity<br />
Attributed<br />
to M/D <strong>Use</strong><br />
Category 4<br />
M/E 5<br />
POLK 11063 SARGEANT FARMS INC M976 S 0.000 0.001 0.001 E<br />
POLK 12076 CEMEX CONST MATERIALS FLORIDA M976 G 0.011 0.097 0.046 E<br />
POLK 12076 CEMEX CONST MATERIALS FLORIDA M976 S 0.009 0.097 0.046 E<br />
POLK 12259 E R JAHNA INDUSTRIES INC M960 G 0.048 0.174 0.087 E<br />
POLK 12292 CEMEX CONST MATERIALS LP & DON M960 G 0.000 0.493 0.489 E<br />
POLK 12292 CEMEX CONST MATERIALS LP & DON M960 S 0.000 0.493 0.489 E<br />
POLK 13359 MOSAIC FERTILIZER LLC M925 G 0.000 0.003 0.003 E<br />
POLK COUNTY TOTALS<br />
11.242 Metered, mgd<br />
0.102 <strong>Estimated</strong> , mgd<br />
11.344 Total, mgd<br />
SARASOTA 8817 SMR AGGREGATES INC M976 G 0.000 0.136 0.136 E<br />
SARASOTA 8817 SMR AGGREGATES INC M976 S 0.000 0.136 0.136 E<br />
SARASOTA 9766 VENICE MINERALS & MINING LLC M976 S 0.000 0.038 0.038 E<br />
SARASOTA 11518 APAC‐SOUTHEAST INC M965 G 0.000 0.214 0.214 E<br />
SARASOTA 11518 APAC‐SOUTHEAST INC M965 S 0.000 0.214 0.214 E<br />
SARASOTA 13169 SUGAR BOWL RESOURCES LLC & HI HAT RANCH M965 S 0.000 0.014 0.014 E<br />
SARASOTA COUNTY TOTALS<br />
NA Metered, mgd<br />
0.000 <strong>Estimated</strong> , mgd<br />
0.000 Total, mgd<br />
SUMTER 12885 AMERICAN CEMENT CO LLC M976 G 0.008 0.443 0.099 M<br />
SUMTER 213 CEMEX CONSTRUCTION MATERIALS FLORIDA LLC M920 G 0.000 0.252 0.252 E<br />
SUMTER 213 CEMEX CONSTRUCTION MATERIALS FLORIDA LLC M920 S 0.000 0.252 0.252 E<br />
SUMTER 1334<br />
SUMTER 1334<br />
DIXIE LIME AND STONE CO INC, ALMA REAGA<br />
TRUST AND SHADY BROOK LL<br />
DIXIE LIME AND STONE CO INC, ALMA REAGA<br />
TRUST AND SHADY BROOK LL<br />
M976 G 0.000 0.266 0.266 E<br />
M976 S 0.000 0.266 0.266 E<br />
SUMTER 8891 FRANKLIN & FAYE DIXON M976 G 0.000 0.107 0.107 E<br />
<strong>Southwest</strong> <strong>Florida</strong> <strong>Water</strong> <strong>Management</strong> District Page | 358
<strong>2011</strong> ESTIMATED WATER USE REPORT<br />
Table A9. Metered and <strong>Estimated</strong> Mining/Dewatering WUPs, Withdrawals and Permitted <strong>Use</strong> (mgd), <strong>2011</strong><br />
COUNTY<br />
WUP<br />
Number<br />
Permittee<br />
<strong>Use</strong><br />
Code1<br />
Source 2<br />
Annual<br />
Average<br />
<strong>Use</strong> 3<br />
Total Permitted<br />
Annual Average<br />
Quantity<br />
Permitted<br />
Quantity<br />
Attributed<br />
to M/D <strong>Use</strong><br />
Category 4<br />
M/E 5<br />
SUMTER 8891 FRANKLIN & FAYE DIXON M976 S 0.011 0.107 0.107 E<br />
SUMTER 12255 MAZAK MINE M976 G 0.000 0.197 0.197 E<br />
SUMTER 12255 MAZAK MINE M976 S 0.011 0.197 0.197 E<br />
SUMTER 12640 WILLIAM A NICHOLS M976 S 0.000 0.005 0.005 E<br />
SUMTER 20158 GIRL SCOUTS OF WEST CENTRAL FLORIDA M930 S 0.000 0.003 0.003 E<br />
SUMTER COUNTY TOTALS<br />
DISTRICT TOTALS<br />
0.008 Metered, mgd<br />
0.022 <strong>Estimated</strong> , mgd<br />
0.030 Total, mgd<br />
20.658 Metered, mgd<br />
0.268 <strong>Estimated</strong> , mgd<br />
20.926 Total, mgd<br />
Source: District WUP database (WMIS), Calendar Year <strong>2011</strong><br />
1 <strong>Use</strong> Code: Alpha‐numeric number given to the use that has the highest quantity attributed to the permit. The first letter indicates the “Predominant <strong>Use</strong>” on the<br />
permit (A=Agricultural, I = Industrial/Commercial, M = Mining/Dewatering, R = Recreation/Aesthetic and P = Public Supply. The list for each <strong>Use</strong> Code used in<br />
Notes: the table is below.<br />
2 Source = Groundwater (G) or Surface <strong>Water</strong> (S)<br />
3 Annual Average Pumpage = sum of monthly total gallons / 365 days per year<br />
4<br />
Many water use permits have more than one <strong>Use</strong> Type. This column shows the total annual average quantity permitted to that WUP that is under the same<br />
Predominant <strong>Use</strong> as is indicated by the first letter in the <strong>Use</strong> Code.<br />
5<br />
Metered or <strong>Estimated</strong> Pumpage<br />
<strong>Use</strong> Code Descriptions. (Not all the codes shown below may appear in this table.)<br />
M905 Augmentation for Environmental M940 Phosphate Ore Processing M990 <strong>Water</strong> Discharged Off‐Site<br />
M910 Lawn & Landscape Irrigation M960 Sand & Gravel Processing M995 Environmental Dewatering<br />
M915 Limestone Processing M965 Sand & Gravel Dewatering<br />
M925 Mining Other <strong>Use</strong>s M970 Shell Pit Dewatering<br />
M930 Peat Mine Dewatering M976 <strong>Water</strong> Entrained With Product<br />
M935 Personal Sanitary <strong>Use</strong> M985 Recirculated Mining Quantities<br />
<strong>Southwest</strong> <strong>Florida</strong> <strong>Water</strong> <strong>Management</strong> District Page | 359
<strong>2011</strong> ESTIMATED WATER USE REPORT<br />
TABLE A10. <strong>2011</strong> METERED + ESTIMATED MINING/DEWATERING MONTHLY AVERAGE PUMPAGE (MGD/MONTH)<br />
County Jan Feb Mar Apr May Jun Jul Aug Sep Oct Nov Dec<br />
*Charlotte 0.015 0.050 0.042 0.057 0.030 0.009 0.004 0.008 0.012 0.031 0.021 0.030<br />
Citrus 0.026 0.026 0.008 0.007 0.001 0.000 0.000 0.000 0.000 0.000 0.002 0.004<br />
Desoto 0.000 0.000 0.000 0.000 0.000 0.000 0.000 0.000 0.000 0.000 0.000 0.000<br />
Hardee 0.151 0.263 0.135 0.820 0.019 0.173 0.150 1.200 0.644 0.147 0.158 0.140<br />
Hernando 4.253 3.960 4.423 3.406 6.414 7.918 5.011 3.840 2.057 4.151 4.300 5.915<br />
*Highlands 0.000 0.000 0.000 0.000 0.000 0.000 0.000 0.000 0.000 0.000 0.000 0.000<br />
Hillsborough 0.099 0.077 0.044 0.045 0.035 0.040 0.003 0.026 0.110 0.144 0.050 0.121<br />
*Lake 0.000 0.000 0.000 0.000 0.000 0.000 0.000 0.000 0.000 0.000 0.000 0.000<br />
*Levy 0.000 0.000 0.000 0.000 0.000 0.000 0.000 0.000 0.000 0.000 0.000 0.000<br />
Manatee 0.038 3.996 3.402 3.370 3.433 4.051 3.608 3.954 4.481 5.092 3.100 4.047<br />
*Marion 0.000 0.000 0.000 0.000 0.000 0.000 0.000 0.000 0.000 0.000 0.000 0.000<br />
Pasco 0.005 0.007 0.018 0.014 0.020 0.016 0.005 0.008 0.007 0.009 0.012 0.014<br />
Pinellas 0.000 0.000 0.000 0.000 0.000 0.000 0.000 0.000 0.000 0.000 0.000 0.000<br />
*Polk 11.638 14.969 9.901 13.665 11.632 10.061 12.334 18.089 10.900 8.133 7.006 17.460<br />
Sarasota 0.000 0.000 0.000 0.000 0.000 0.000 0.000 0.000 0.000 0.000 0.000 0.000<br />
Sumter 0.095 0.100 0.033 0.033 0.019 0.007 0.004 0.010 0.009 0.007 0.011 0.025<br />
District 16.320 23.448 18.005 21.416 21.604 22.276 21.119 27.136 18.220 17.713 14.660 27.755<br />
Groundwater 16.128 23.222 17.908 21.304 21.560 20.982 21.108 26.696 18.199 17.673 14.621 27.690<br />
Surface <strong>Water</strong> 0.192 0.226 0.097 0.112 0.044 1.294 0.011 0.440 0.021 0.039 0.038 0.065<br />
* Data is only from the portion of the county within the District<br />
Source: <strong>Estimated</strong> <strong>Water</strong> <strong>Use</strong> Tables derived from the WMIS WUP database, <strong>2011</strong>.<br />
<strong>Southwest</strong> <strong>Florida</strong> <strong>Water</strong> <strong>Management</strong> District Page | 360
<strong>2011</strong> ESTIMATED WATER USE REPORT<br />
Table A11. Metered And <strong>Estimated</strong> Industrial/Commercial WUPs, Withdrawals and Permitted <strong>Use</strong> (mgd), <strong>2011</strong><br />
County<br />
Wup<br />
Number<br />
Permittee<br />
<strong>Use</strong><br />
Code 1<br />
Source 2<br />
Annual<br />
Average<br />
<strong>Use</strong> 3<br />
Total<br />
Permitted<br />
Annual<br />
Average<br />
Quantity<br />
Permitted<br />
Quantity<br />
Attributed<br />
To M/D <strong>Use</strong><br />
Category 4<br />
CHARLOTTE 7871 CEMEX CONSTRUCTION MATERIALS LLC I745 G 0.005 0.013 0.013 E<br />
CHARLOTTE 9180 SCHWAB READY MIX INC I745 G 0.018 0.047 0.047 E<br />
CHARLOTTE 12050 CEMEX CONSTRUCTION MATERIALS LLC I745 G 0.004 0.010 0.010 E<br />
CHARLOTTE COUNTY TOTALS<br />
0.000 Metered, mgd<br />
0.027 <strong>Estimated</strong>, mgd<br />
0.027 Total, mgd<br />
CITRUS 3672 FLORIDA POWER CORP DBA PROGRESS I860 G 2.800 4.309 4.309 M<br />
CITRUS 4695 FLORIDA POWER CORP DBA PROGRESS I725 G 0.462 1.000 1.000 M<br />
CITRUS 11281 METAL INDUSTRIES INC HOWARD LOY I705 G 0.086 0.200 0.200 M<br />
CITRUS 7352 KELLY GARDINER I840 G 0.001 0.003 0.003 E<br />
CITRUS 7662 CHAMPS SOFTWARE INC I403 G 0.008 0.031 0.022 E<br />
CITRUS 7662 CHAMPS SOFTWARE INC I403 S 0.000 0.031 0.022 E<br />
CITRUS 8874 GTE FEDERAL CREDIT UNION/STEPHEN A FOSTER I840 G 0.000 0.002 0.000 E<br />
CITRUS 9115 TRU GAS OF FLORIDA, INC. I790 G 0.000 0.001 0.001 E<br />
CITRUS 9329 INERGY PROPANE, LLC I790 G 0.000 0.001 0.001 E<br />
CITRUS 10166 SIMON PROPERTY GROUP LP I810 S 0.003 0.009 0.009 E<br />
CITRUS 10247 CITRUS CO ENGINEERING I840 G 0.000 0.001 0.001 E<br />
CITRUS 10842 CITRUS CO BOCC & DEPT OF PUBLIC I805 G 0.001 0.006 0.004 E<br />
CITRUS 11801 UNITED STATE OF AMERICA, US FISH & WILDLIFE SERVICES I735 S 0.000 0.224 0.224 E<br />
CITRUS 12049 CITRUS CO BOCC I790 G 0.001 0.003 0.003 E<br />
CITRUS COUNTY TOTALS<br />
3.348 Metered, mgd<br />
0.014 <strong>Estimated</strong>, mgd<br />
3.362 Total, mgd<br />
DESOTO 6841 DESOTO COUNTY I841 G 0.377 0.822 0.822 M<br />
DESOTO 70 PEACE RIVER CITRUS PRODUCTS INC I437 G 0.090 0.267 0.267 E<br />
DESOTO 7749 DESOTO COUNTY BOARD OF COUNTY COMMISSIONERS I790 G 0.001 0.002 0.002 E<br />
DESOTO 12131 DESOTO COUNTY GENERATING COMPANY, LLC I860 G 0.027 0.076 0.076 E<br />
DESOTO 12416 PEACE RIVER/MANASOTA REGIONAL WA I845 G 0.106 0.432 0.432 E<br />
DESOTO 20044 FLORIDA POWER & LIGHT COMPANY I414 G 0.001 0.001 0.001 E<br />
M/E 5<br />
<strong>Southwest</strong> <strong>Florida</strong> <strong>Water</strong> <strong>Management</strong> District Page | 361
<strong>2011</strong> ESTIMATED WATER USE REPORT<br />
Table A11. Metered And <strong>Estimated</strong> Industrial/Commercial WUPs, Withdrawals and Permitted <strong>Use</strong> (mgd), <strong>2011</strong><br />
County<br />
Wup<br />
Number<br />
Permittee<br />
DESOTO COUNTY TOTALS<br />
<strong>Use</strong><br />
Code 1<br />
Source 2<br />
Annual<br />
Average<br />
<strong>Use</strong> 3<br />
Total<br />
Permitted<br />
Annual<br />
Average<br />
Quantity<br />
0.377 Metered, mgd<br />
0.225 <strong>Estimated</strong>, mgd<br />
0.602 Total, mgd<br />
Permitted<br />
Quantity<br />
Attributed<br />
To M/D <strong>Use</strong><br />
Category 4<br />
HARDEE 9731 HARDEE POWER PARTNERS I725 G 1.538 3.800 3.800 M<br />
HARDEE 12048 VANDOLAH POWER COMPANY LLC I425 G 0.016 0.212 0.212 M<br />
HARDEE 12331 CLASSIC CALADIUMS INC & SMOAK GROVES INC I805 G 0.040 0.860 0.086 M<br />
HARDEE 13158 TBBT WATER LLC I735 G 0.000 0.449 0.449 M<br />
HARDEE 11400 MOSAIC I835 G 0.000 1.359 1.359 M<br />
HARDEE 2494 THE MANCINI PACKING COMPANY I437 G 0.039 0.098 0.098 E<br />
HARDEE 7073 BOULDIN HOLDINGS 2 INC I790 G 0.000 0.006 0.000 E<br />
HARDEE 10924 ALL FLORIDA JUICE CORPORATION & JOE M DURANCE JR I765 G 0.007 0.018 0.018 E<br />
HARDEE COUNTY TOTALS<br />
1.594 Metered, mgd<br />
0.046 <strong>Estimated</strong>, mgd<br />
1.640 Total, mgd<br />
HERNANDO 2286 CEMEX INC I740 G 0.004 0.171 0.171 M<br />
HERNANDO 7015 FLORIDA CRUSHED STONE CO I447 G 2.586 20.080 20.080 M<br />
HERNANDO 8453 HERNANDO EGG PRODUCERS INC I790 G 0.001 0.041 0.001 E<br />
HERNANDO 10249 HERNANDO CO UTILITIES DEPT I770 G 0.000 0.002 0.002 E<br />
HERNANDO 12791 CHRISTIAN CONTRACTORS ASSOC INC I735 G 0.006 0.015 0.015 E<br />
HERNANDO 12879<br />
FLORIDA CRUSHED STONE CO‐RINKER MATERIALS OF<br />
FLORIDA INC<br />
I745 G 0.012 0.030 0.030 E<br />
2.590 Metered, mgd<br />
HERNANDO COUNTY TOTALS<br />
0.019 <strong>Estimated</strong>, mgd<br />
2.609 Total, mgd<br />
HIGHLANDS 4086 CARGILL JUICE NORTH AMERICA INC I765 G 0.005 0.439 0.388 M<br />
HIGHLANDS 7068 DOUGLASS FERTILIZER & CHEMICAL I800 G 0.024 0.060 0.060 E<br />
HIGHLANDS 8460 JAMES DALKE AND LINDA DALKE I770 G 0.007 0.019 0.019 E<br />
HIGHLANDS 10866 ARCHBOLD EXPEDITIONS I840 G 0.001 0.007 0.007 E<br />
HIGHLANDS 12114 CHRIST LUTHERAN CHURCH OF AVON PARK INC I840 G 0.000 0.011 0.001 E<br />
HIGHLANDS 12272 TRIANGLE CHEMICAL COMPANY I810 G 0.001 0.002 0.002 E<br />
M/E 5<br />
<strong>Southwest</strong> <strong>Florida</strong> <strong>Water</strong> <strong>Management</strong> District Page | 362
<strong>2011</strong> ESTIMATED WATER USE REPORT<br />
Table A11. Metered And <strong>Estimated</strong> Industrial/Commercial WUPs, Withdrawals and Permitted <strong>Use</strong> (mgd), <strong>2011</strong><br />
County<br />
Wup<br />
Number<br />
Permittee<br />
<strong>Use</strong><br />
Code 1<br />
Source 2<br />
Annual<br />
Average<br />
<strong>Use</strong> 3<br />
Total<br />
Permitted<br />
Annual<br />
Average<br />
Quantity<br />
Permitted<br />
Quantity<br />
Attributed<br />
To M/D <strong>Use</strong><br />
Category 4<br />
HIGHLANDS 20218 DISTRIBUTION BLVD., LLC I840 G 0.000 0.007 0.007 E<br />
HIGHLANDS 20233 LAKE PLACID GROVES LLC I408 G 0.000 0.166 0.166 E<br />
HIGHLANDS COUNTY TOTALS<br />
0.005 Metered, mgd<br />
0.033 <strong>Estimated</strong>, mgd<br />
0.038 Total, mgd<br />
HILLSBOROUGH 148 YUENGLING BREWING CO OF TAMPA INC I830 G 0.406 0.666 0.666 M<br />
HILLSBOROUGH 229 R C C I (RED CHAMBER CO INC) I830 G 0.139 0.214 0.214 M<br />
HILLSBOROUGH 405 SEABOARD COLD STORAGE INC I830 G 0.000 0.200 0.200 M<br />
HILLSBOROUGH 1415 CF INDUSTRIES INC PLANT CITY PHOSPHATE COMPLEX I835 G 2.526 4.240 4.240 M<br />
HILLSBOROUGH 1415 CF INDUSTRIES INC PLANT CITY PHOSPHATE COMPLEX I835 S 0.000 4.240 4.240 M<br />
HILLSBOROUGH 1532 MOSAIC FERTILIZER LLC I755 G 0.005 5.985 5.970 M<br />
HILLSBOROUGH 1532 MOSAIC FERTILIZER LLC I755 S 2.843 5.985 5.970 M<br />
HILLSBOROUGH 1838 CARDANELL FARMS I810 G 0.000 1.449 0.004 M<br />
HILLSBOROUGH 1861 CORONET INDUSTRIES, INC. I835 G 0.037 0.740 0.740 M<br />
HILLSBOROUGH 1960 UNIVERSITY OF SOUTH FLORIDA.; ATTN: MR. DERYL WAGNER I840 G 0.769 2.364 1.377 M<br />
HILLSBOROUGH 1960 UNIVERSITY OF SOUTH FLORIDA.; ATTN: MR. DERYL WAGNER I840 S 0.000 2.364 1.377 M<br />
HILLSBOROUGH 2045 MIDWAY INVESTMENT COMPANY, INC I840 G 0.001 0.306 0.001 M<br />
HILLSBOROUGH 2045 MIDWAY INVESTMENT COMPANY, INC I840 S 0.000 0.306 0.001 M<br />
HILLSBOROUGH 3055 SPEEDLING INC I800 G 0.004 0.302 0.011 M<br />
HILLSBOROUGH 3118 KERRY I & F CONTRACTING CO I800 G 2.031 3.050 3.050 M<br />
HILLSBOROUGH 3742 PARADISE FRUIT COMPANY, INC. FT. PROPERTY I830 G 0.112 0.452 0.452 M<br />
HILLSBOROUGH 6233 TAMPA ELECTRIC CO I863 G 0.000 0.234 0.234 M<br />
HILLSBOROUGH 11181 BATISTA & EVELYN MADONIA I850 G 0.000 1.591 0.002 M<br />
HILLSBOROUGH 11181 BATISTA & EVELYN MADONIA I850 S 0.000 1.591 0.002 M<br />
HILLSBOROUGH 11986 ST JOSEPHS HOSPITAL INC I700 G 0.176 0.192 0.192 M<br />
HILLSBOROUGH 13131 ST. JOSEPHS HOSPITAL NORTH I840 G 0.001 0.006 0.006 M<br />
HILLSBOROUGH 20215 TRADEMARK NITROGEN, CORP. I805 G 0.000 0.206 0.206 M<br />
HILLSBOROUGH 11400 MOSAIC FERTILIZER LLC I835 G 0.184 1.862 1.862 M<br />
HILLSBOROUGH 11400 MOSAIC FERTILIZER LLC I835 S 0.004 1.862 1.862 M<br />
HILLSBOROUGH 138 BRANNAN LIVING TRUST I790 G 0.001 0.072 0.001 E<br />
HILLSBOROUGH 253 AGRO DISTRIBUTION LLC I790 G 0.003 0.009 0.009 E<br />
M/E 5<br />
<strong>Southwest</strong> <strong>Florida</strong> <strong>Water</strong> <strong>Management</strong> District Page | 363
<strong>2011</strong> ESTIMATED WATER USE REPORT<br />
Table A11. Metered And <strong>Estimated</strong> Industrial/Commercial WUPs, Withdrawals and Permitted <strong>Use</strong> (mgd), <strong>2011</strong><br />
County<br />
Wup<br />
Number<br />
Permittee<br />
<strong>Use</strong><br />
Code 1<br />
Source 2<br />
Annual<br />
Average<br />
<strong>Use</strong> 3<br />
Total<br />
Permitted<br />
Annual<br />
Average<br />
Quantity<br />
Permitted<br />
Quantity<br />
Attributed<br />
To M/D <strong>Use</strong><br />
Category 4<br />
HILLSBOROUGH 253 AGRO DISTRIBUTION LLC I790 S 0.000 0.009 0.009 E<br />
HILLSBOROUGH 633 PACIFIC TOMATO GROWERS LTD, LPP I830 G 0.001 0.005 0.005 E<br />
HILLSBOROUGH 2606 RUSKIN VEGETABLE CORP I850 G 0.001 0.007 0.006 E<br />
HILLSBOROUGH 2630 YELVINGTON DISTRIBUTORS INC I805 G 0.006 0.015 0.015 E<br />
HILLSBOROUGH 2730 MCNATT PROPERTIES LLC I775 G 0.001 0.002 0.002 E<br />
HILLSBOROUGH 4416 FRED GODLEY I840 G 0.009 0.075 0.061 E<br />
HILLSBOROUGH 4416 FRED GODLEY I840 S 0.000 0.075 0.061 E<br />
HILLSBOROUGH 4876 CHARLES W POE IRREV. TRST & RINKER MATERIALS OF FLA I745 G 0.007 0.017 0.017 E<br />
HILLSBOROUGH 5749 CEMEX CONSTRUCTION MATERIALS LLC I745 G 0.011 0.050 0.050 E<br />
HILLSBOROUGH 5749 CEMEX CONSTRUCTION MATERIALS LLC I745 S 0.009 0.050 0.050 E<br />
HILLSBOROUGH 5787 CAL‐MAINE FOODS INC I840 G 0.001 0.078 0.003 E<br />
HILLSBOROUGH 6677 CEMEX CONSTRUCTION MATERIALS FLORIDA, LLC I745 G 0.001 0.013 0.013 E<br />
HILLSBOROUGH 6677 CEMEX CONSTRUCTION MATERIALS FLORIDA, LLC I745 S 0.000 0.013 0.013 E<br />
HILLSBOROUGH 6696 TRANS‐CONTINENTAL MARINE & DRYDOCK CORP I770 G 0.002 0.006 0.006 E<br />
HILLSBOROUGH 7751 UNIVERSITY COMMUNITY HOSPITAL INC I810 G 0.004 0.010 0.010 E<br />
HILLSBOROUGH 7975 BF USB INC I810 G 0.011 0.038 0.027 E<br />
HILLSBOROUGH 8066 FIRST UNITED METHODIST CHURCH OF LUTZ INC I810 G 0.002 0.008 0.008 E<br />
HILLSBOROUGH 8406 CHARLES W POE IRREVOCABLE TRUST I740 G 0.004 0.010 0.010 E<br />
HILLSBOROUGH 8493 CEMEX CONSTRUCTION MATERIALS LLC I740 G 0.008 0.020 0.020 E<br />
HILLSBOROUGH 8809 10420 MCKINLEY PARTNERS, LP I800 G 0.115 0.469 0.469 E<br />
HILLSBOROUGH 9259 HILLSBOROUGH CO WATER DEPT I785 G 0.013 0.059 0.059 E<br />
HILLSBOROUGH 10339 THE CLOROX COMPANY I755 G 0.042 0.094 0.094 E<br />
HILLSBOROUGH 10380 WASTE SERVICES OF FLORIDA INC I805 G 0.007 0.017 0.017 E<br />
HILLSBOROUGH 10485 THOMAS & GRACE JACOB I830 G 0.000 0.063 0.001 E<br />
HILLSBOROUGH 10485 THOMAS & GRACE JACOB I830 S 0.000 0.063 0.001 E<br />
HILLSBOROUGH 10812 SAFETY KLEEN CORPORATION I840 G 0.001 0.003 0.003 E<br />
HILLSBOROUGH 10863 GENERAL CABLE COMPANY I810 G 0.001 0.001 0.001 E<br />
HILLSBOROUGH 10898<br />
NANCY N SKEMP & CAROLINE N SHEPARD‐SNS TRUST‐<br />
NEWBERN GROVES<br />
I765 G 0.004 0.057 0.006 E<br />
HILLSBOROUGH 10939 MRS H D MCDONALD JR I850 G 0.000 0.036 0.000 E<br />
HILLSBOROUGH 10939 MRS H D MCDONALD JR I850 S 0.000 0.036 0.000 E<br />
HILLSBOROUGH 11477 HILLSBOROUGH CO AVIATION AUTH I840 G 0.001 0.009 0.006 E<br />
M/E 5<br />
<strong>Southwest</strong> <strong>Florida</strong> <strong>Water</strong> <strong>Management</strong> District Page | 364
<strong>2011</strong> ESTIMATED WATER USE REPORT<br />
Table A11. Metered And <strong>Estimated</strong> Industrial/Commercial WUPs, Withdrawals and Permitted <strong>Use</strong> (mgd), <strong>2011</strong><br />
County<br />
Wup<br />
Number<br />
Permittee<br />
<strong>Use</strong><br />
Code 1<br />
Source 2<br />
Annual<br />
Average<br />
<strong>Use</strong> 3<br />
Total<br />
Permitted<br />
Annual<br />
Average<br />
Quantity<br />
Permitted<br />
Quantity<br />
Attributed<br />
To M/D <strong>Use</strong><br />
Category 4<br />
HILLSBOROUGH 11477 HILLSBOROUGH CO AVIATION AUTH I840 S 0.001 0.009 0.006 E<br />
HILLSBOROUGH 11510 CEMEX CONSTRUCTION MATERIALS LLC I750 G 0.006 0.016 0.016 E<br />
HILLSBOROUGH 11555<br />
INTERNATIONAL PAPER COMPANY ‐ WILLAMETTE<br />
INDUSTRIES INC<br />
I810 G 0.004 0.011 0.011 E<br />
HILLSBOROUGH 11712 HILLSBOROUGH CO DEPT OF SOLID WASTE I805 G 0.002 0.012 0.012 E<br />
HILLSBOROUGH 11802 LAU/LADD PARTNERSHIP DONALD K LAU I840 G 0.000 0.001 0.001 E<br />
HILLSBOROUGH 12101 TAMPA PORT AUTHORITY I500 G 0.003 0.008 0.008 E<br />
HILLSBOROUGH 12140 ST. JOSEPH'S HOSPITAL, INC. I400 G 0.000 0.124 0.124 E<br />
HILLSBOROUGH 12472 FIRST NATIONWIDE TITLE JOHN SULLIVAN I840 G 0.001 0.004 0.004 E<br />
HILLSBOROUGH 13042 HILLSBOROUGH COUNTY SOLD WASTE MGMT DEPT I810 S 0.004 0.011 0.011 E<br />
HILLSBOROUGH 13180 TRINITY MATERIALS LLC I805 G 0.000 0.091 0.091 E<br />
HILLSBOROUGH 13228 MOSAIC FERTILIZER LLC I720 G 0.000 4.500 4.500 E<br />
HILLSBOROUGH 13277 CITI CORP BANK NA INC & I840 G 0.004 0.011 0.011 E<br />
HILLSBOROUGH COUNTY TOTALS<br />
9.237 Metered, mgd<br />
0.291 <strong>Estimated</strong>, mgd<br />
9.528 Total, mgd<br />
LEVY 11308 LEVAUGHN ROBINSON I805 G 0.000 0.093 0.001 E<br />
LEVY 12074 FREEBEE LANDHOLDINGS, LTD. I805 G 0.004 0.009 0.009 E<br />
LEVY 13050 SCHOOL BOARD OF LEVY CO I790 G 0.000 0.001 0.001 E<br />
LEVY 13262 PROGRESS ENERGY FLORIDA INC I409 G 0.000 1.580 1.580 E<br />
LEVY 20072 FLORIDA GAS TRANSMISSION COMPANY I858 S 0.000 0.037 0.037 E<br />
LEVY COUNTY TOTALS<br />
0.000 Metered, mgd<br />
0.004 <strong>Estimated</strong>, mgd<br />
0.004 Total, mgd<br />
MANATEE 3837 JOHN FALKNER CLASSIE GROWERS LLC I850 G 0.003 4.232 0.010 M<br />
MANATEE 5302 FLORIDA POWER & LIGHT COMPANY I861 S 4.780 8.519 8.519 M<br />
MANATEE 5423 FLORIDA POWER & LIGHT COMPANY I865 G 0.012 1.717 0.023 M<br />
MANATEE 12413 WASTE MANAGEMENT INC OF FLORIDA I805 G 0.006 0.149 0.149 M<br />
MANATEE 12413 WASTE MANAGEMENT INC OF FLORIDA I805 S 0.000 0.149 0.149 M<br />
MANATEE 4202 MODERN CONSTRUCTION USA INC I412 G 0.002 0.005 0.005 E<br />
MANATEE 4444 HARLLEE PACKING INC I437 G 0.000 0.005 0.005 E<br />
M/E 5<br />
<strong>Southwest</strong> <strong>Florida</strong> <strong>Water</strong> <strong>Management</strong> District Page | 365
<strong>2011</strong> ESTIMATED WATER USE REPORT<br />
Table A11. Metered And <strong>Estimated</strong> Industrial/Commercial WUPs, Withdrawals and Permitted <strong>Use</strong> (mgd), <strong>2011</strong><br />
County<br />
Wup<br />
Number<br />
Permittee<br />
<strong>Use</strong><br />
Code 1<br />
Source 2<br />
Annual<br />
Average<br />
<strong>Use</strong> 3<br />
Total<br />
Permitted<br />
Annual<br />
Average<br />
Quantity<br />
Permitted<br />
Quantity<br />
Attributed<br />
To M/D <strong>Use</strong><br />
Category 4<br />
MANATEE 4907 CC PROPERTY ACQUISITION, LLC I800 G 0.009 0.022 0.022 E<br />
MANATEE 5578 CITRUS BULL LLC I760 G 0.003 0.047 0.005 E<br />
MANATEE 5590 CITY OF BRADENTON FIRE STATION NO. 3 I790 G 0.000 0.014 0.014 E<br />
MANATEE 7544 FALKNER I, LLC ATTN: JOHN FALKNER I402 G 0.010 0.024 0.024 E<br />
MANATEE 9181 FLORIDA ROCK INDUSTRIES INC C/O TRACY L HAYDEN I745 G 0.015 0.039 0.039 E<br />
MANATEE 11731 CEMEX CONSTRUCTION MATERIALS FLORIDA,LLC I740 G 0.008 0.020 0.020 E<br />
MANATEE 12414 JOHN C GREER I770 G 0.000 0.001 0.001 E<br />
MANATEE 12605 RINKER MATERIALS INC & CBM I745 G 0.014 0.035 0.035 E<br />
MANATEE 12980 SCHWAB READY MIX INC I745 G 0.027 0.067 0.067 E<br />
MANATEE 13034 SCHWAB READY MIX INC I745 G 0.000 0.090 0.090 E<br />
MANATEE 20198 LOCKHEED MARTIN CORPORATION I705 G 0.019 0.411 0.411 E<br />
MANATEE COUNTY TOTALS<br />
4.801 Metered, mgd<br />
0.107 <strong>Estimated</strong>, mgd<br />
4.908 Total, mgd<br />
MARION 6585 OCALA JOCKEY CLUB INC I700 G 0.046 0.191 0.105 M<br />
MARION 9026 MUNROE REGIONAL HEALTH SYSTEM INC. I790 G 0.000 0.001 0.001 E<br />
MARION 12785 KUNAL II LLC I840 G 0.008 0.041 0.041 E<br />
MARION 13083<br />
MFM LIMESTONE LLC; THE PALMER CO MPANIES, INC. AND<br />
PADDOCK PARK<br />
I510 G 0.010 0.119 0.119 E<br />
MARION 13083<br />
MFM LIMESTONE LLC; THE PALMER CO MPANIES, INC. AND<br />
PADDOCK PARK<br />
MARION COUNTY TOTALS<br />
I510 S 0.000 0.119 0.119 E<br />
0.046 Metered, mgd<br />
0.018 <strong>Estimated</strong>, mgd<br />
0.064 Total, mgd<br />
PASCO 451 TANLER WATER COMPANY I805 G 0.133 3.514 3.514 M<br />
PASCO 9087 PASCO CO UTILITIES I780 G 0.090 0.720 0.720 M<br />
PASCO 9132 CRYSTAL SPRINGS PRESERVE INC I735 G 0.000 0.757 0.757 M<br />
PASCO 9132 CRYSTAL SPRINGS PRESERVE INC I735 S 0.563 0.757 0.757 M<br />
PASCO 10413 PASCO COGEN LTD & JDR PROPERTIES OF PASCO INC I861 G 0.215 0.762 0.762 M<br />
PASCO 10772 FLORIDA POWER CORPORATION I865 G 0.180 0.288 0.288 M<br />
PASCO 12052 SHADY HILLS POWER COMPANY, LLC I425 G 0.011 0.154 0.154 M<br />
M/E 5<br />
<strong>Southwest</strong> <strong>Florida</strong> <strong>Water</strong> <strong>Management</strong> District Page | 366
<strong>2011</strong> ESTIMATED WATER USE REPORT<br />
Table A11. Metered And <strong>Estimated</strong> Industrial/Commercial WUPs, Withdrawals and Permitted <strong>Use</strong> (mgd), <strong>2011</strong><br />
County<br />
Wup<br />
Number<br />
Permittee<br />
<strong>Use</strong><br />
Code 1<br />
Source 2<br />
Annual<br />
Average<br />
<strong>Use</strong> 3<br />
Total<br />
Permitted<br />
Annual<br />
Average<br />
Quantity<br />
Permitted<br />
Quantity<br />
Attributed<br />
To M/D <strong>Use</strong><br />
Category 4<br />
PASCO 817 HELENA CHEMICAL CO I810 G 0.014 0.036 0.036 E<br />
PASCO 4722 DISTRICT SCHOOL BOARD OF PASCO COUNTY I840 G 0.003 0.027 0.016 E<br />
PASCO 4986 PASCO COUNTY SCHOOL BOARD I700 G 0.019 0.047 0.047 E<br />
PASCO 6533 SKYBIRD PROP INC PROFIT SHARING I810 G 0.007 0.019 0.019 E<br />
PASCO 6930 JOLANDER WELL DRILLING INC I855 G 0.000 0.001 0.001 E<br />
PASCO 7976 CEMEX CONSTRUCTION MATERIALS FLORIDA,LLC I745 G 0.001 0.003 0.003 E<br />
PASCO 8433 R E PURCELL CONSTRUCTION CO INC I770 G 0.000 0.001 0.001 E<br />
PASCO 8906 CAL‐MAINE FOODS INC I830 G 0.006 0.095 0.011 E<br />
PASCO 10017 PASCO COUNTY BOARD OF COUNTY COMMISSIONERS I770 G 0.004 0.011 0.011 E<br />
PASCO 10764 HQ‐T LLC I790 G 0.000 0.001 0.001 E<br />
PASCO 13049 DMTC LLC I790 G 0.001 0.001 0.001 E<br />
PASCO COUNTY TOTALS<br />
1.192 Metered, mgd<br />
0.055 <strong>Estimated</strong>, mgd<br />
1.247 Total, mgd<br />
PINELLAS 217 COCA‐COLA CO I800 G 0.015 0.165 0.165 M<br />
PINELLAS 10646 OLYMPIA INVESTMENT GROUP LLC SHS RESORT LLC I735 G 0.005 0.100 0.100 M<br />
PINELLAS 13276 ALL CHILDRENS HOSPITAL INC I700 G 0.001 0.112 0.112 M<br />
PINELLAS 2528 STAUFFER MANAGEMENT CO I770 G 0.000 0.028 0.028 E<br />
PINELLAS 3159 LAWRENCE DIMMITT,III I810 G 0.001 0.001 0.001 E<br />
PINELLAS 3783 SPACE CENTER, INC. I840 G 0.000 0.000 0.000 E<br />
PINELLAS 3784 SPACE CENTER, INC. & FRANK C. KUNNEN, JR. I745 G 0.002 0.012 0.012 E<br />
PINELLAS 3784 SPACE CENTER, INC. & FRANK C. KUNNEN, JR. I745 S 0.001 0.012 0.012 E<br />
PINELLAS 5855 JOHN HANCOCK LIFE INSURANCE CO I810 S 0.008 0.020 0.020 E<br />
PINELLAS 8101 THE SEMBLER CORP I810 G 0.004 0.010 0.010 E<br />
PINELLAS 8192 COQUINA KEY ARMS APARTMENTS I810 G 0.001 0.003 0.003 E<br />
PINELLAS COUNTY TOTALS<br />
0.021 Metered, mgd<br />
0.017 <strong>Estimated</strong>, mgd<br />
0.038 Total, mgd<br />
M/E 5<br />
<strong>Southwest</strong> <strong>Florida</strong> <strong>Water</strong> <strong>Management</strong> District Page | 367
<strong>2011</strong> ESTIMATED WATER USE REPORT<br />
Table A11. Metered And <strong>Estimated</strong> Industrial/Commercial WUPs, Withdrawals and Permitted <strong>Use</strong> (mgd), <strong>2011</strong><br />
County<br />
Wup<br />
Number<br />
Permittee<br />
<strong>Use</strong><br />
Code 1<br />
Source 2<br />
Annual<br />
Average<br />
<strong>Use</strong> 3<br />
Total<br />
Permitted<br />
Annual<br />
Average<br />
Quantity<br />
Permitted<br />
Quantity<br />
Attributed<br />
To M/D <strong>Use</strong><br />
Category 4<br />
POLK 47 CITY OF LAKELAND I863 G 0.863 2.592 2.592 M<br />
POLK 47 CITY OF LAKELAND I863 S 0.000 2.592 2.592 M<br />
POLK 260 CARIBBEAN DISTILLERS I735 G 0.000 0.112 0.112 M<br />
POLK 295 CITY OF LAKELAND WATER UTILITIES WATER ADM I780 S 0.092 0.415 0.415 M<br />
POLK 408 CITRUS WORLD INC I765 G 1.485 2.183 2.183 M<br />
POLK 438 US AGRI‐CHEMICALS CORPORATION I835 G 7.781 9.150 9.150 M<br />
POLK 440 US AGRI‐CHEMICALS CORPORATION I835 G 0.000 0.124 0.124 M<br />
POLK 493 CUTRALE CITRUS JUICES USA INC I765 G 1.213 2.500 2.500 M<br />
POLK 610 CF INDUSTRIES INC I835 G 0.118 1.665 1.665 M<br />
POLK 610 CF INDUSTRIES INC I835 S 0.000 1.665 1.665 M<br />
POLK 1539 MOSAIC FERTILIZER LLC I805 G 1.247 7.504 7.504 M<br />
POLK 2224 MOSAIC FERTILIZER LLC I755 G 0.112 5.197 5.197 M<br />
POLK 2834 BARTOW CITRUS PRODUCTS LLC I765 G 0.122 0.468 0.155 M<br />
POLK 3147 CLEAR SPRINGS LAND COMPANY, LLC I511 G 0.120 0.478 0.331 M<br />
POLK 3150 KC INDUSTRIES LLC & KC INDUSTRIES PROPERTIES LLC I423 G 0.077 0.192 0.141 M<br />
POLK 3195 MOSAIC FERTILIZER I835 G 0.023 1.991 1.991 M<br />
POLK 3641 AOC LLC I780 G 0.351 0.800 0.800 M<br />
POLK 4312 HOLLY HILL FRUIT PRODUCTS CO INC I805 G 0.019 0.371 0.371 M<br />
POLK 5798 PUBLIX SUPER MARKETS INC., ATTN ANN BATTS I412 G 0.992 1.441 1.441 M<br />
POLK 5798 PUBLIX SUPER MARKETS INC., ATTN ANN BATTS I412 S 0.013 1.441 1.441 M<br />
POLK 10347 CARIBBEAN DISTILLERS I800 G 0.270 0.410 0.410 M<br />
POLK 10555 CARIBBEAN DISTILLERS I780 G 0.328 0.455 0.455 M<br />
POLK 10604 AUBURNDALE POWER PARTNERS LTD PARTNERSHIP I861 G 0.654 1.326 1.326 M<br />
POLK 10631 WHEELABRATOR RIDGE ENERGY, INC. I861 G 0.427 0.875 0.875 M<br />
POLK 10700 POLK POWER PARTNERS LP I861 G 0.321 0.761 0.761 M<br />
POLK 10770 JUICE BOWL PRODUCTS INC I800 G 0.440 0.900 0.900 M<br />
POLK 10840 FLORIDA POWER CORP & US AGRI CHEMICALS CORP I780 G 1.007 1.700 1.700 M<br />
POLK 10944 PROGRESS ENERGY FLORIDA I861 G 4.594 17.500 17.500 M<br />
POLK 10948 ORANGE COGENERATION LIMITED PARTNERSHIP I860 G 0.263 0.660 0.660 M<br />
POLK 11400 MOSAIC FERTILIZER LLC I835 G 1.534 33.922 33.922 M<br />
POLK 11400 MOSAIC FERTILIZER LLC I835 S 0.029 33.922 33.922 M<br />
POLK 11747 TAMPA ELECTRIC CO I863 G 1.338 6.400 6.400 M<br />
M/E 5<br />
<strong>Southwest</strong> <strong>Florida</strong> <strong>Water</strong> <strong>Management</strong> District Page | 368
<strong>2011</strong> ESTIMATED WATER USE REPORT<br />
Table A11. Metered And <strong>Estimated</strong> Industrial/Commercial WUPs, Withdrawals and Permitted <strong>Use</strong> (mgd), <strong>2011</strong><br />
County<br />
Wup<br />
Number<br />
Permittee<br />
<strong>Use</strong><br />
Code 1<br />
Source 2<br />
Annual<br />
Average<br />
<strong>Use</strong> 3<br />
Total<br />
Permitted<br />
Annual<br />
Average<br />
Quantity<br />
Permitted<br />
Quantity<br />
Attributed<br />
To M/D <strong>Use</strong><br />
Category 4<br />
POLK 12054 CALPINE CONSTRUCT FINANCE CO LP OSPREY ENERGY CNTR I780 G 1.683 2.742 2.742 M<br />
POLK 12232 CITROSUCO NORTH AMERICA I765 G 1.079 1.251 1.004 M<br />
POLK 12794 MATRICE OF FLORIDA LLC I800 G 0.168 0.324 0.324 M<br />
POLK 12867 CLEAR SPRINGS ENTERPRISES LLC I840 G 0.000 0.908 0.000 M<br />
POLK 13240 MIZKAN AMERICAS INC I800 G 0.025 0.095 0.095 M<br />
POLK 225 WBRK PROPERTY LLLP I845 G 0.031 0.068 0.068 E<br />
POLK 261 HACKL ENTERPRISES LLC I840 G 0.001 0.002 0.002 E<br />
POLK 713 RIDGE PALLETS INC I800 G 0.011 0.034 0.027 E<br />
POLK 1068 OSCAR W & C DANE & JOHN STEVEN & WILLIAM T ROGERS I810 G 0.001 0.002 0.002 E<br />
POLK 1079 WILLIAMS ACQUISITION HOLDING COMPANY INC I840 G 0.000 0.000 0.000 E<br />
POLK 1275 DUNDEE CITRUS GROWERS ASSOC I760 G 0.010 0.024 0.024 E<br />
POLK 1405 BARTOW HOLDING CO INC & LANDSMAN FAMILY TRUST 84 I412 G 0.003 0.007 0.007 E<br />
POLK 1554 RIDGE LUMBER & TREATING INC I775 G 0.003 0.008 0.008 E<br />
POLK 1808 RITCHIE BROTHERS PROPERTIES INC I810 G 0.032 0.070 0.070 E<br />
POLK 2023 PHOENIX INDUSTRIES LLC I402 G 0.010 0.028 0.028 E<br />
POLK 2345 ALL‐TEMP STORAGE LLC I790 G 0.001 0.002 0.002 E<br />
POLK 2462 P&K USA INC I840 G 0.013 0.032 0.032 E<br />
POLK 2538 APAC‐SOUTHEAST INC I805 G 0.004 0.011 0.011 E<br />
POLK 4894 LX REAL ESTATE CO LLC I725 G 0.002 0.006 0.006 E<br />
POLK 4894 LX REAL ESTATE CO LLC I725 S 0.000 0.006 0.006 E<br />
POLK 5038 STATE FARM MUTUAL AUTOMOBILE INSURANCE COMPANY I810 G 0.023 0.060 0.051 E<br />
POLK 5927 ALL PLASTICS RECYCLING I790 G 0.001 0.004 0.004 E<br />
POLK 6004 BRIDGE CRANES OF AMERICA LLC I770 G 0.002 0.005 0.005 E<br />
POLK 6625 CIRCLE F DUDE RANCH CAMP LLC & F LORIDA ROCK IND INC I715 G 0.032 0.081 0.071 E<br />
POLK 6861 WINTER HAVEN HOSPITAL INC I810 G 0.002 0.004 0.004 E<br />
POLK 7023 NATURAL SUN CITRUS INC I760 G 0.004 0.021 0.021 E<br />
POLK 7212 BEN HILL GRIFFIN, INC. I765 G 0.017 0.042 0.042 E<br />
POLK 7226 FLORIDA SPECTRUM ENVIRONMENTAL SERVICES I755 G 0.006 0.016 0.016 E<br />
POLK 7229 NATHAN DYKGRAAF I840 G 0.000 0.017 0.017 E<br />
POLK 7314 KEY AUTOMOTIVE OF FLORIDA INC I810 G 0.003 0.007 0.007 E<br />
POLK 7356 BARTOW ETHANOL OF FLORIDA, LLC I755 G 0.000 0.001 0.001 E<br />
POLK 7469 HANSON PIPE & PRODUCTS SOUTHEAST, INC. I750 G 0.043 0.096 0.096 E<br />
M/E 5<br />
<strong>Southwest</strong> <strong>Florida</strong> <strong>Water</strong> <strong>Management</strong> District Page | 369
<strong>2011</strong> ESTIMATED WATER USE REPORT<br />
Table A11. Metered And <strong>Estimated</strong> Industrial/Commercial WUPs, Withdrawals and Permitted <strong>Use</strong> (mgd), <strong>2011</strong><br />
County<br />
Wup<br />
Number<br />
Permittee<br />
<strong>Use</strong><br />
Code 1<br />
Source 2<br />
Annual<br />
Average<br />
<strong>Use</strong> 3<br />
Total<br />
Permitted<br />
Annual<br />
Average<br />
Quantity<br />
Permitted<br />
Quantity<br />
Attributed<br />
To M/D <strong>Use</strong><br />
Category 4<br />
POLK 7614 POLK COUNTY DEPT OF ENVIRONMENTAL SERVICES I790 G 0.000 0.001 0.001 E<br />
POLK 7843 HARMSCO FILTRATION PRODUCTS I800 G 0.001 0.004 0.004 E<br />
POLK 8547 COLERIDGE CORP & BOARD WALK AND BASEBALL INC I840 G 0.063 0.257 0.257 E<br />
POLK 8691 ASHLAND INC I805 G 0.004 0.014 0.011 E<br />
POLK 8890 R & L INVESTMENTS I790 G 0.000 0.001 0.001 E<br />
POLK 8945 DOLORES A BARTON I810 G 0.003 0.015 0.015 E<br />
POLK 9010 CHALET SUZANNE PROPERTIES I805 G 0.005 0.061 0.018 E<br />
POLK 9010 CHALET SUZANNE PROPERTIES I805 S 0.001 0.061 0.018 E<br />
POLK 9131 ROOMS TO GO FURNITURE CORP I810 G 0.002 0.007 0.007 E<br />
POLK 9131 ROOMS TO GO FURNITURE CORP I810 S 0.000 0.007 0.007 E<br />
POLK 9326 HIGHWAY 27 CORP I840 G 0.001 0.005 0.005 E<br />
POLK 9412 HANSON HARDSCAPE PRODUCTS, LLC I740 G 0.007 0.017 0.017 E<br />
POLK 10012 JIM BROWN & RANDALL GRANT I840 G 0.002 0.005 0.005 E<br />
POLK 10045 POLK COUNTY BOARD OF COUNTY COMMISSIONERS I790 G 0.000 0.001 0.001 E<br />
POLK 10104 RING POWER CORPORATION I790 G 0.000 0.001 0.001 E<br />
POLK 10151 CHARLES RUTLAND I790 G 0.000 0.001 0.001 E<br />
POLK 10157 OAKLEY GROVES INC I770 G 0.007 0.037 0.037 E<br />
POLK 10163 ALTA METCALF C/O ALLEN CASEY I840 G 0.001 0.004 0.003 E<br />
POLK 10163 ALTA METCALF C/O ALLEN CASEY I840 S 0.000 0.004 0.003 E<br />
POLK 10196 BIG‐E TRAILERS INC I790 G 0.000 0.001 0.001 E<br />
POLK 10278 BONE VALLEY SERVICE COMPANY INC I805 G 0.001 0.004 0.004 E<br />
POLK 10341 MICHAEL E. HAMPTON I810 G 0.002 0.005 0.005 E<br />
POLK 10373 CSH LAKELAND/LAKE WALES PARTNERSHIP I840 G 0.001 0.002 0.002 E<br />
POLK 10482 CEMEX CONST MATERIALS FLORIDA I770 G 0.000 0.026 0.004 E<br />
POLK 10482 CEMEX CONST MATERIALS FLORIDA I770 S 0.002 0.026 0.004 E<br />
POLK 10494 LAKELAND AUTO AUCTION, INC. I840 G 0.002 0.005 0.005 E<br />
POLK 10585 RALPH L ROBERTS SR TR UNDER TR # 1 I840 G 0.003 0.007 0.007 E<br />
POLK 10829 GIVAUDAN FLAVORS CORP I428 G 0.030 0.077 0.077 E<br />
POLK 10908 MIMS RANCH LLC AND CHEMICAL LIME CO I815 G 0.007 0.018 0.018 E<br />
POLK 10985 LAMB BROTHERS CONSTRUCT. CO, DIV. OF KOVACS BROS INC I810 G 0.002 0.008 0.008 E<br />
POLK 10985 LAMB BROTHERS CONSTRUCT. CO, DIV. OF KOVACS BROS INC I810 S 0.000 0.008 0.008 E<br />
POLK 10997 GREEN POND BAPTIST CHURCH I790 S 0.000 0.000 0.000 E<br />
M/E 5<br />
<strong>Southwest</strong> <strong>Florida</strong> <strong>Water</strong> <strong>Management</strong> District Page | 370
<strong>2011</strong> ESTIMATED WATER USE REPORT<br />
Table A11. Metered And <strong>Estimated</strong> Industrial/Commercial WUPs, Withdrawals and Permitted <strong>Use</strong> (mgd), <strong>2011</strong><br />
County<br />
Wup<br />
Number<br />
Permittee<br />
<strong>Use</strong><br />
Code 1<br />
Source 2<br />
Annual<br />
Average<br />
<strong>Use</strong> 3<br />
Total<br />
Permitted<br />
Annual<br />
Average<br />
Quantity<br />
Permitted<br />
Quantity<br />
Attributed<br />
To M/D <strong>Use</strong><br />
Category 4<br />
POLK 11061 NEWMARK INTERNATIONAL INC I750 G 0.002 0.005 0.005 E<br />
POLK 11177 CITY OF WINTER HAVEN ATTENTION: WILLOWBROOK I805 G 0.005 0.014 0.014 E<br />
POLK 11226 JAMES P VAUGHAN SR I805 G 0.001 0.002 0.002 E<br />
POLK 11354 AERCON FLORIDA LLC I750 G 0.010 0.049 0.049 E<br />
POLK 11374 RECAP HILLTOP LLC I760 G 0.045 0.099 0.099 E<br />
POLK 11397 MONIER LIFETILE INC I750 G 0.012 0.030 0.030 E<br />
POLK 11406 HUNT BROS SERVICE INC & HUNT BROS COOPERATIVE INC I760 G 0.023 0.058 0.058 E<br />
POLK 11436 ORGANIC MATTERS INC I770 G 0.001 0.005 0.005 E<br />
POLK 11512 SAR INDUSTRIES LLC I755 G 0.003 0.008 0.008 E<br />
POLK 11695 PETERSEN PROPERTIES INC I840 G 0.001 0.025 0.002 E<br />
POLK 11877 SAMS EAST INC I810 G 0.004 0.010 0.010 E<br />
POLK 11923 ACE STORAGE FACILITIES LLC I770 G 0.000 0.005 0.000 E<br />
POLK 11946 W A READ, JR I800 G 0.040 0.088 0.088 E<br />
POLK 12076 CEMEX CONST MATERIALS FLORIDA I745 G 0.012 0.097 0.050 E<br />
POLK 12076 CEMEX CONST MATERIALS FLORIDA I745 S 0.010 0.097 0.050 E<br />
POLK 12183 BEN HILL GRIFFIN, INC. I810 G 0.005 0.013 0.013 E<br />
POLK 12223 TERRENCE W. CRUM REV. TRST & PEGGY B. CRUM REV. TRST I790 G 0.000 0.001 0.001 E<br />
POLK 12477 KOVACS BROTHERS INC I790 G 0.000 0.003 0.000 E<br />
POLK 12489 FLORIDA CENTRAL PARK POA I790 G 0.001 0.004 0.001 E<br />
POLK 12532 CHAMPAGNE INVESTMENTS LLC I840 G 0.000 0.001 0.001 E<br />
POLK 12597 WATKINS MOTOR LINES I810 G 0.007 0.017 0.017 E<br />
POLK 12603 RINKER MATERIALS INC & CBM I750 G 0.000 0.034 0.034 E<br />
POLK 12657 GREENLEAF PRODUCTS INC A FLORIDA CORP I805 G 0.019 0.049 0.049 E<br />
POLK 12902 MARK A WOODS I810 G 0.003 0.006 0.006 E<br />
POLK 12929 FLORIDA ROCK INDUSTRIES INC I745 G 0.011 0.029 0.029 E<br />
POLK 12939 J T SCHERLING INC I790 G 0.000 0.001 0.001 E<br />
POLK 13061 OPUS SOUTH CORPORATION I840 G 0.031 0.069 0.069 E<br />
POLK 13068 LAKE WALES LLC I810 G 0.006 0.015 0.015 E<br />
POLK 13148 GILIEO & SON FABRICATION I790 G 0.000 0.001 0.001 E<br />
POLK 13175 INTERNATIONAL PAPER CO I800 G 0.000 0.011 0.011 E<br />
POLK 13246 HARRELLS INC I790 G 0.001 0.002 0.002 E<br />
POLK 13302 FLORIDA SEALING PRODUCTS I840 G 0.000 0.001 0.001 E<br />
M/E 5<br />
<strong>Southwest</strong> <strong>Florida</strong> <strong>Water</strong> <strong>Management</strong> District Page | 371
<strong>2011</strong> ESTIMATED WATER USE REPORT<br />
Table A11. Metered And <strong>Estimated</strong> Industrial/Commercial WUPs, Withdrawals and Permitted <strong>Use</strong> (mgd), <strong>2011</strong><br />
County<br />
Wup<br />
Number<br />
Permittee<br />
<strong>Use</strong><br />
Code 1<br />
Source 2<br />
Annual<br />
Average<br />
<strong>Use</strong> 3<br />
Total<br />
Permitted<br />
Annual<br />
Average<br />
Quantity<br />
Permitted<br />
Quantity<br />
Attributed<br />
To M/D <strong>Use</strong><br />
Category 4<br />
POLK 13321 BYNUM TRANSPORTATION INC I770 G 0.008 0.021 0.021 E<br />
POLK 13333 MOSAIC FERTILIZER LLC I840 G 0.000 0.001 0.001 E<br />
POLK 13362 ASSUIT INVESTMENTS I805 G 0.000 0.003 0.003 E<br />
POLK 20024 WAVERLY GROWERS COOPERATIVE I436 G 0.007 0.021 0.021 E<br />
POLK 20108 TWENTY TWENTY GROVES INC I790 G 0.002 0.004 0.004 E<br />
POLK COUNTY TOTALS<br />
5.857 Metered, mgd<br />
0.672 <strong>Estimated</strong>, mgd<br />
6.529 Total, mgd<br />
SARASOTA 11043 RMC SOUTH FLORIDA INC I745 G 0.042 0.093 0.093 E<br />
SARASOTA 11516 PETERSON MANUFACTURING COMPANY I800 G 0.002 0.006 0.006 E<br />
SARASOTA 11520 GULF HARBOR MARINA LLC I770 G 0.000 0.001 0.001 E<br />
SARASOTA 11557 ALLEN ENTERPRISES OF SARASOTA I770 G 0.000 0.001 0.001 E<br />
SARASOTA 11667 FREDERICK E FARLEY I810 G 0.002 0.004 0.004 E<br />
SARASOTA 12746 BKOP1 LLC I700 G 0.012 0.032 0.032 E<br />
SARASOTA 12842 SARASOTA MEMORIAL HOSPITAL I840 G 0.000 0.001 0.001 E<br />
SARASOTA COUNTY TOTALS<br />
NA Metered, mgd<br />
0.058 <strong>Estimated</strong>, mgd<br />
0.058 Total, mgd<br />
SUMTER 6838 FLORIDA DEPARTMENT OF CORRECTIONS I840 G 0.290 0.458 0.444 M<br />
SUMTER 11259 SUMTER COUNTY BOCC I805 G 0.000 0.125 0.113 M<br />
SUMTER 12786 DUBLIN INVESTMENTS LLC & XPRESS MATERIALS LLC I745 G 0.044 0.187 0.187 M<br />
SUMTER 12885 AMERICAN CEMENT CO LLC I740 G 0.027 0.443 0.345 M<br />
SUMTER 13111 WILLIAM FARKUS REV LIVING TRUST I735 G 0.123 0.496 0.496 M<br />
SUMTER 815 PRIME DEVELOPMENT CORP INC I790 G 0.000 0.001 0.001 E<br />
SUMTER 2223 BUSHNELL ELDERLY HOUSING LIMITED I810 G 0.002 0.005 0.005 E<br />
SUMTER 3236 PROGRESS ENERGY FLORIDA INC I805 G 0.002 0.013 0.013 E<br />
SUMTER 9949 GREAT SOUTHERN WOOD OF FL INC I500 G 0.012 0.032 0.032 E<br />
SUMTER 11575 CENTRAL BEEF IND LLC I820 G 0.039 0.090 0.090 E<br />
SUMTER 11864 CEMEX CONSTRUCTION MATERIALS FLORIDA LLC I750 G 0.010 0.024 0.024 E<br />
SUMTER 12125 SHIRMIK ENTERPRISES LTD INC I790 G 0.000 0.001 0.001 E<br />
SUMTER 12385 BAILEY BROTHERS INC I790 G 0.000 0.000 0.000 E<br />
M/E 5<br />
<strong>Southwest</strong> <strong>Florida</strong> <strong>Water</strong> <strong>Management</strong> District Page | 372
<strong>2011</strong> ESTIMATED WATER USE REPORT<br />
Table A11. Metered And <strong>Estimated</strong> Industrial/Commercial WUPs, Withdrawals and Permitted <strong>Use</strong> (mgd), <strong>2011</strong><br />
County<br />
Wup<br />
Number<br />
Permittee<br />
<strong>Use</strong><br />
Code 1<br />
Source 2<br />
Annual<br />
Average<br />
<strong>Use</strong> 3<br />
Total<br />
Permitted<br />
Annual<br />
Average<br />
Quantity<br />
Permitted<br />
Quantity<br />
Attributed<br />
To M/D <strong>Use</strong><br />
Category 4<br />
SUMTER 12622 BLACK GOLD COMPOST CO I790 G 0.000 0.002 0.002 E<br />
SUMTER 12647 BRIAN E & CHRISTINE M MUNZ I810 G 0.001 0.004 0.004 E<br />
SUMTER 12756 CEMEX CONST MATERIALS FLA LLC I745 G 0.012 0.030 0.030 E<br />
SUMTER 12962 TRINITY MATERIALS LLC I745 G 0.000 0.030 0.030 E<br />
SUMTER 12965 EAGLE ROOFING PRODUCTS FL LLC I800 G 0.000 0.053 0.053 E<br />
SUMTER 20100 GYORGY & HILDA PECSENKA I504 G 0.000 0.008 0.000 E<br />
SUMTER COUNTY TOTALS<br />
DISTRICT TOTALS<br />
Source: District WUP database (WMIS ), Calendar year <strong>2011</strong><br />
NOTES: 1<br />
0.484 Metered, mgd<br />
0.078 <strong>Estimated</strong>, mgd<br />
0.562 Total, mgd<br />
29.552 Metered, mgd<br />
1.664 <strong>Estimated</strong>, mgd<br />
31.216 Total, mgd<br />
<strong>Use</strong> Code: alpha‐numeric number given to the use that has the highest quantity attributed to the permit. The first letter indicates the “predominant use”<br />
on the permit (A=Agricultural, I = Industrial/Commercial, M = Mining/Dewatering, R = Recreation/Aesthetic And P = Public Supply. The list for each use<br />
code used in the table is below.<br />
2 Source = Groundwater (G) Or Surface <strong>Water</strong> (S)<br />
3 Annual Average Pumpage = Sum of monthly total gallons / 365 days per year<br />
4<br />
Many <strong>Water</strong> <strong>Use</strong> Permits Have More Than One <strong>Use</strong> Type. This Column Shows The Total Annual Average Quantity Permitted To That Wup That Is Under<br />
The Same Predominant <strong>Use</strong> As Is Indicated By The First Letter In The <strong>Use</strong> Code.<br />
5 Metered or estimated pumpage<br />
DESCRIPTIONS FOR THE USE CODES THAT ARE GIVEN IN THIS TABLE.<br />
I412 CLEANING AND MAINTENANCE I800 GENERAL PRODUCT MANUFACTURING<br />
I423 EMISSION CONTROL I805 INDUSTRIAL OTHER USES<br />
I425 EMISSION CONTROL I810 MEAT PACKING<br />
I447 POWER PLANT COOLING WATER MAKEUP I825 NON‐POWER‐PLANT NON‐CONSUMPTIVE COOLING<br />
I511 PRODUCT MIXING AND DILUTION I830 PERISHABLE FOOD PROCESSING<br />
I700 AIR CONDITIONING I835 PHOSPHATE CHEMICAL PROCESSING<br />
I705 AQUIFER REMEDIATION I840 PERSONAL SANITARY USE<br />
I725 NON‐POWER‐PLANT BOILER MAKEUP‐WATER I841 POTABLE USE FOR INSTITUTIONS<br />
M/E 5<br />
<strong>Southwest</strong> <strong>Florida</strong> <strong>Water</strong> <strong>Management</strong> District Page | 373
<strong>2011</strong> ESTIMATED WATER USE REPORT<br />
I735 BOTTLED WATER I845 REFRIGERATION<br />
I740 CEMENT MANUFACTURING I850 TRUCK CROP PACKING<br />
I740 CEMENT OR CONCRETE BATCH PLANTS I860 POWER PLANT EMISSION CONTROL<br />
I755 CHEMICAL MANUFACTURING I861 POWER PLANT CLOSED CYCLE STEAM COOLING<br />
I765 CITRUS PROCESSING I863 POWER PLANT BOILER FEED AND MAKEUP WATER<br />
I780 CONSUMPTIVE COOLING (CHEMICAL, CEMENT PLANTS) I865 POWER PLANT INDUSTRIAL‐OTHER<br />
<strong>Southwest</strong> <strong>Florida</strong> <strong>Water</strong> <strong>Management</strong> District Page | 374
<strong>2011</strong> ESTIMATED WATER USE REPORT<br />
TABLE A12. <strong>2011</strong> METERED + ESTIMATED INDUSTRIAL/COMMERCIAL MONTHLY AVERAGE PUMPAGE (MGD/MONTH)<br />
County Jan Feb Mar Apr May Jun Jul Aug Sep Oct Nov Dec<br />
*Charlotte 0.029 0.025 0.015 0.027 0.031 0.042 0.023 0.027 0.027 0.027 0.020 0.031<br />
Citrus 4.021 3.088 4.372 2.801 2.735 3.631 3.474 3.657 3.677 3.545 2.863 2.506<br />
Desoto 0.553 0.561 0.562 0.537 0.753 0.706 0.595 0.668 0.590 0.562 0.599 0.528<br />
Hardee 1.255 1.348 0.957 0.114 1.532 1.740 1.653 1.844 3.088 1.941 2.158 2.058<br />
Hernando 5.942 0.021 2.435 2.666 0.026 3.186 2.614 3.847 3.044 0.022 3.383 4.109<br />
*Highlands 0.036 0.032 0.019 0.035 0.049 0.104 0.029 0.033 0.033 0.034 0.026 0.039<br />
Hillsborough 9.324 9.667 9.353 9.387 9.281 10.211 9.544 10.305 8.757 8.505 9.232 8.560<br />
*Lake 0.000 0.000 0.000 0.000 0.000 0.000 0.000 0.000 0.000 0.000 0.000 0.000<br />
*Levy 0.005 0.004 0.003 0.005 0.005 0.007 0.003 0.004 0.004 0.004 0.003 0.005<br />
Manatee 3.361 3.424 1.795 10.509 0.154 0.607 0.477 21.238 8.091 8.355 0.717 0.166<br />
*Marion 0.050 0.037 0.035 0.034 0.090 0.120 0.092 0.113 0.093 0.038 0.036 0.036<br />
Pasco 1.192 1.227 1.219 1.549 1.756 1.478 1.126 1.293 1.207 0.960 0.895 1.086<br />
Pinellas 0.056 0.037 0.009 0.030 0.024 0.028 0.019 0.017 0.017 0.017 0.013 0.182<br />
*Polk 30.210 39.010 22.904 28.739 28.241 33.943 29.284 29.797 30.237 23.870 26.405 33.178<br />
Sarasota 0.060 0.062 0.051 0.056 0.085 0.069 0.026 0.070 0.069 0.059 0.052 0.049<br />
Sumter 0.677 0.594 0.694 0.597 0.726 0.618 0.549 0.591 0.611 0.471 0.406 0.223<br />
District 56.771 59.138 44.423 57.084 45.489 56.489 49.508 73.503 59.545 48.411 46.809 52.757<br />
Groundwater 49.574 52.140 39.161 42.844 41.952 52.256 45.435 48.719 48.248 37.268 42.975 48.980<br />
Surface <strong>Water</strong> 7.195 6.998 5.262 14.241 3.537 4.233 4.073 24.785 11.297 11.144 3.833 3.777<br />
* Data is only from the portion of the county within the District<br />
Source: <strong>Estimated</strong> <strong>Water</strong> <strong>Use</strong> Tables derived from the WMIS WUP database, <strong>2011</strong>.<br />
<strong>Southwest</strong> <strong>Florida</strong> <strong>Water</strong> <strong>Management</strong> District Page | 375
<strong>2011</strong> ESTIMATED WATER USE REPORT<br />
APPENDIX B.<br />
<strong>2011</strong> METERED + ESTIMATED ANNUAL AVERAGE<br />
GROUNDWATER & SURFACE WATER<br />
PUMPAGE<br />
<strong>Southwest</strong> <strong>Florida</strong> <strong>Water</strong> <strong>Management</strong> District Page | 376
<strong>2011</strong> ESTIMATED WATER USE REPORT<br />
TABLE B1.<br />
County<br />
<strong>2011</strong> METERED + ESTIMATED ANNUAL AVERAGE PUMPAGE (MGD) IN THE DISTRICT BY SOURCE, USE<br />
CATEGORY, AND COUNTY.<br />
Industrial/ Mining/ Public Recreation/<br />
Agriculture<br />
Total Pumpage<br />
Commercial Dewatering Supply Aesthetic<br />
GROUNDWATER<br />
*Charlotte 7.792 0.027 0.000 2.373 0.661 10.853<br />
Citrus 1.431 3.361 0.000 15.308 4.803 24.903<br />
Desoto 66.181 0.601 0.000 0.955 0.265 68.002<br />
Hardee 37.442 1.641 0.333 1.217 0.269 40.902<br />
Hernando 1.778 2.608 4.637 20.779 4.718 34.520<br />
*Highlands 35.860 0.039 0.000 7.473 2.392 45.764<br />
Hillsborough 48.079 6.668 0.855 63.809 8.219 127.630<br />
*Lake 1.166 0.000 0.000 0.000 0.000 1.166<br />
*Levy 6.336 0.004 0.000 0.721 0.247 7.308<br />
Manatee 65.048 0.127 3.539 14.906 9.464 93.084<br />
*Marion 3.950 0.064 0.000 11.412 3.651 19.077<br />
Pasco 9.513 0.686 0.011 58.654 3.594 72.458<br />
Pinellas 0.074 0.029 0.000 22.340 1.424 23.867<br />
*Polk 78.472 29.318 11.208 66.211 7.846 193.055<br />
Sarasota 4.298 0.059 0.000 19.183 5.794 29.334<br />
Sumter 7.128 0.563 0.008 21.275 2.656 31.630<br />
District GW Subtotals 374.548 45.795 20.591 326.616 56.003 823.553<br />
% of District GW Subtotals 46% 6% 3% 39% 7% 100%<br />
SURFACE WATER<br />
*Charlotte 3.177 0.000 0.026 4.701 1.068 8.972<br />
Citrus 0.000 0.004 0.006 0.002 0.451 0.463<br />
Desoto 1.321 0.000 0.000 30.780 0.090 32.191<br />
Hardee 0.449 0.000 0.000 0.000 0.032 0.481<br />
Hernando 0.000 0.000 0.000 0.000 0.345 0.345<br />
*Highlands 4.707 0.000 0.000 0.005 0.037 4.749<br />
Hillsborough 2.458 2.863 0.018 126.174 0.431 131.944<br />
*Lake 0.010 0.000 0.000 0.000 0.000 0.010<br />
*Levy 0.196 0.000 0.000 0.000 0.000 0.196<br />
Manatee 0.561 4.780 0.009 29.715 0.937 36.002<br />
*Marion 0.026 0.000 0.000 0.000 0.173 0.199<br />
Pasco 0.191 0.563 0.000 0.000 0.640 1.394<br />
Pinellas 0.030 0.009 0.000 0.000 0.565 0.604<br />
*Polk 1.874 0.130 0.135 0.000 0.491 2.630<br />
Sarasota 0.274 0.000 0.000 1.600 1.046 2.920<br />
Sumter 0.627 0.000 0.022 0.000 0.000 0.649<br />
District SW Subtotals 15.901 8.349 0.216 192.977 6.306 223.749<br />
% of District SW Subtotals 7% 4% 0% 86% 3% 100%<br />
District Totals 390.449 54.144 20.807 519.593 62.309 1,047.302<br />
% District Totals/<strong>Use</strong><br />
Category<br />
37% 5% 2% 49% 6% 100%<br />
* Data is only from the portion of the county within the District<br />
Source: <strong>Estimated</strong> <strong>Water</strong> <strong>Use</strong> Tables derived from the WMIS WUP database, <strong>2011</strong>.<br />
<strong>Southwest</strong> <strong>Florida</strong> <strong>Water</strong> <strong>Management</strong> District Page | 377
<strong>2011</strong> ESTIMATED WATER USE REPORT<br />
TABLE B2.<br />
<strong>2011</strong> METERED + ESTIMATED AVERAGE ANNUAL PUMPAGE (MGD) IN THE SOUTHERN WATER<br />
USE CAUTION AREA (SWUCA) BY SOURCE, USE CATEGORY, AND COUNTY<br />
County<br />
Agriculture<br />
Industrial/<br />
Commercial<br />
Mining/<br />
Dewatering<br />
Public<br />
Supply<br />
Recreation/<br />
Aesthetic<br />
Total Pumpage<br />
GROUNDWATER<br />
*Charlotte 7.792 0.027 0.000 2.373 0.661 10.855<br />
Desoto 66.181 0.601 0.000 0.955 0.265 67.891<br />
Hardee 37.442 1.641 0.333 1.217 0.269 40.901<br />
*Highlands 35.860 0.039 0.000 7.473 2.392 45.599<br />
*Hillsborough 27.375 0.039 0.064 27.081 2.517 57.076<br />
Manatee 65.048 0.127 3.539 14.906 9.464 88.361<br />
*Polk 68.625 28.975 10.677 58.422 6.077 172.777<br />
Sarasota 4.298 0.059 0.000 19.183 5.794 28.721<br />
SWUCA GW Subtotals 312.621 31.508 14.613 131.610 27.439 512.181<br />
% of SWUCA GW Subtotals 61% 6% 3% 26% 5% 100%<br />
SURFACE WATER<br />
%)*Charlotte 3.177 0 0.026 4.701 1.068 8.852<br />
Desoto 1.321 0 0 30.78 0.09 32.191<br />
Hardee 0.449 0 0 0 0.032 0.481<br />
*Highlands 4.707 0 0 0.005 0.037 4.749<br />
*Hillsborough 1.392 2.863 0.018 7.241 0.33 7.62<br />
Manatee 0.561 4.78 0.009 29.715 0.937 36.002<br />
*Polk 1.636 0.13 0.135 0 0.395 2.331<br />
Sarasota 0.274 0 0 1.6 1.046 2.92<br />
SWUCA SW Subtotals 13.517 7.773 0.188 74.042 3.935 95.146<br />
% of SWUCA SW Subtotals 14% 8% 0% 78% 4% 100%<br />
% of SWUCA<br />
Totals<br />
4%<br />
SWUCA Totals 326.138 39.281 14.801 205.652 31.374 607.327<br />
% of SWUCA<br />
Totals<br />
54% 6% 2% 34% 5% 100%<br />
District Totals 390.449 54.144 20.807 519.593 62.309 1,047.302<br />
SWUCA % District<br />
84% 73% 71% 40% 50% 58%<br />
Totals/<strong>Use</strong> Category<br />
Source: <strong>Estimated</strong> <strong>Water</strong> <strong>Use</strong> Tables derived from the WMIS WUP database, <strong>2011</strong>.<br />
District Total = 1,043.841 mgd<br />
* Data is only from the portion of the county within the SWUCA.<br />
<strong>Southwest</strong> <strong>Florida</strong> <strong>Water</strong> <strong>Management</strong> District Page | 378
<strong>2011</strong> ESTIMATED WATER USE REPORT<br />
TABLE B3.<br />
<strong>2011</strong> METERED + ESTIMATED AVERAGE ANNUAL PUMPAGE (MGD) IN THE MOST IMPACTED<br />
AREA (MIA) OF THE SOUTHERN WATER USE CAUTION AEA BY SOURCE, USE CATEGORY, AND<br />
COUNTY<br />
County<br />
Agriculture<br />
Industrial /<br />
Commercial<br />
Mining/<br />
Dewatering<br />
Public<br />
Supply<br />
Recreation/<br />
Aesthetic<br />
Total Pumpage<br />
GROUNDWATER (68%)<br />
Hillsborough 17.728 0.031 0.064 0.314 2.249 20.385<br />
Manatee 33.402 0.092 0.000 0.415 9.162 43.070<br />
Sarasota 0.990 0.017 0.000 10.836 1.304 13.147<br />
MIA GW Subtotal 52.120 0.140 0.064 11.565 12.715 76.602<br />
% of MIA GW Subtotal 68% 0% 0.1% 15% 17% 100%<br />
SURFACE WATER (32%)<br />
Hillsborough 0.238 0.000 0.003 0.073 0.316 0.630<br />
Manatee 0.416 4.780 0.000 29.715 0.931 35.841<br />
Sarasota 0.080 0.000 0.000 0.000 0.038 0.118<br />
MIA SW Subtotals 0.734 4.780 0.003 29.788 1.285 36.589<br />
% of MIA SW Subtotals 2% 13% 0.01% 81% 4% 100%<br />
MIA Totals 52.854 4.920 0.067 41.353 14.000 113.191<br />
% of MIA Totals 47% 4% 0.1% 37% 12% 100%<br />
SWUCA Totals<br />
326.13<br />
8<br />
39.281 14.801 205.482 31.374 607.327<br />
MIA % of SWUCA Totals 16% 13% 0.5% 20% 45% 19%<br />
District Totals<br />
MIA % of District<br />
Totals/<strong>Use</strong> Category<br />
390.44<br />
9<br />
54.144 20.807 519.593 62.309 1,047.302<br />
14% 9% 0.3% 8% 22% 11%<br />
Source: <strong>Estimated</strong> <strong>Water</strong> <strong>Use</strong> Tables derived from the WMIS WUP database, <strong>2011</strong>.<br />
Data is only from the portion of the county that is within the MIA.<br />
<strong>Southwest</strong> <strong>Florida</strong> <strong>Water</strong> <strong>Management</strong> District Page | 379
<strong>2011</strong> ESTIMATED WATER USE REPORT<br />
TABLE B4.<br />
<strong>2011</strong> METERED + ESTIMATED AVERAGE ANNUAL PUMPAGE (MGD) IN THE NORTHERN TAMPA<br />
BAY WATER USE CAUTION AREA (NTB WUCA), BY SOURCE, USE CATEGORY, AND COUNTY<br />
County<br />
Agriculture<br />
Industrial/<br />
Commercial<br />
Mining/<br />
Dewatering<br />
Public<br />
Supply<br />
Recreation/<br />
Aesthetic<br />
Total<br />
Pumpage<br />
GROUNDWATER<br />
*Hillsborough 20.695 6.446 0.000 11.107 5.702 43.949<br />
Pasco 8.938 0.686 0.011 94.555 3.557 107.747<br />
Pinellas 0.074 0.029 0.000 10.473 1.424 11.999<br />
NTB WUCA GW Subtotals 29.744 7.161 0.011 116.135 10.683 163.732<br />
% of NTB WUCA Subtotals 18% 4% 0.01% 71% 7% 100%<br />
SURFACE WATER<br />
*Hillsborough 1.066 0.015 0.000 90.819 0.101 92.001<br />
Pasco 0.191 0.563 0.000 0.000 0.640 1.395<br />
Pinellas 0.030 0.009 0.000 0.000 0.565 0.604<br />
NTB WUCA SW Subtotals 1.287 0.587 0.000 90.819 1.306 94.000<br />
% of NTB WUCA SW Subtotals 1% 1% 0% 97% 1% 100%<br />
NTB WUCA Total 31.031 7.748 0.011 206.954 11.989 257.732<br />
% of NTB WUCA Totals 12% 3% 0.004% 80% 5% 100%<br />
District Totals 390.449 54.144 20.807 519.593 62.309 1,047.302<br />
NTB WUCA % District<br />
Totals/<strong>Use</strong> Category<br />
Source: <strong>Estimated</strong> <strong>Water</strong> <strong>Use</strong> Tables derived from the WMIS WUP database, <strong>2011</strong>.<br />
* Data is only from the portion of the county that is within the NTB WUCA.<br />
8% 14% 0.1% 40% 19% 25%<br />
** Data is only from the portion of the county that is within the District and also within the NTB WUCA.<br />
District Total = 1,043.841<br />
<strong>Southwest</strong> <strong>Florida</strong> <strong>Water</strong> <strong>Management</strong> District Page | 380
<strong>2011</strong> ESTIMATED WATER USE REPORT<br />
TABLE B5. <strong>2011</strong> METERED + ESTIMATED ANNUAL AVERAGE PUMPAGE (MGD) IN THE DOVER/PLANT CITY<br />
WATER USE CAUTION AREA (DPC WUCA )BY SOURCE, USE CATEGORY, AND COUNTY,<br />
County<br />
Agriculture<br />
Industrial/<br />
Commercial<br />
Mining/<br />
Dewatering<br />
Public<br />
Supply<br />
Recreation/<br />
Aesthetic<br />
Total<br />
Pumpage<br />
GROUNDWATER<br />
Hillsborough 21.147 2.359 0.000 32.031 0.411 55.948<br />
Polk 0.658 1.763 7.393 6.265 0.000 16.079<br />
DPC WUCA GW Subtotals 21.805 4.122 7.393 38.296 0.411 72.027<br />
% of DPC WUCA GW Subtotals 30% 6% 10% 53% 1% 100%<br />
SURFACE WATER<br />
Hillsborough 1.325 0.000 0.000 0.001 0.000 1.326<br />
Polk 0.000 0.033 0.141 0.000 0.000 0.174<br />
DPC WUCA SW Subtotals 1.325 0.033 0.141 0.001 0.000 1.500<br />
% of DPC WUCA SW Subtotals 88% 2% 9% 0.1% 0% 100%<br />
DPC WUCA Totals 23.130 4.155 7.534 38.297 0.411 73.527<br />
% of DPC WUCA Totals 31% 6% 10% 52% 1% 100%<br />
District Totals 390.449 54.144 20.807 519.593 62.309 1,047.302<br />
DPC WUCA % District<br />
Totals/<strong>Use</strong> Category<br />
6% 8% 36% 7% 1% 7%<br />
Source: <strong>Estimated</strong> <strong>Water</strong> <strong>Use</strong> Tables derived from the WMIS WUP database, <strong>2011</strong>.<br />
Data is only for the portion of Hillsborough and Polk counties that are in the Dover/Plant City WUCA.<br />
Note: The Dover/Plant City WUCA was established in <strong>2011</strong> based on impacts to existing legal users and offsite<br />
land use caused by pumping from groundwater to protect some crops from frost and freeze damage. Metering of<br />
crop freeze protection pumping became required on all withdrawal points having maximum day quantities<br />
permitted on their WUP for freeze protection. However, the meters and automated reporting devices were in the<br />
process of being installed in <strong>2011</strong>, so actual pumpage for freeze protection of crops is not available for <strong>2011</strong>.<br />
<strong>Southwest</strong> <strong>Florida</strong> <strong>Water</strong> <strong>Management</strong> District Page | 381
<strong>2011</strong> ESTIMATED WATER USE REPORT<br />
APPENDIX C<br />
<strong>2011</strong> PERMITTED<br />
GROUNDWATER & SURFACE WATER<br />
ANNUAL AVERAGE QUANTITIES<br />
<strong>Southwest</strong> <strong>Florida</strong> <strong>Water</strong> <strong>Management</strong> District Page | 382
<strong>2011</strong> ESTIMATED WATER USE REPORT<br />
TABLE C1.<br />
<strong>2011</strong> TOTAL PERMITTED AVERAGE ANNUAL QUANTITIES (MGD) IN THE DISTRICT BY SOURCE,<br />
USE CATEGORY, AND COUNTY<br />
County<br />
Agriculture<br />
Industrial/<br />
Commercial<br />
Mining/<br />
Dewatering<br />
Public<br />
Supply<br />
Recreation/<br />
Aesthetic<br />
Total<br />
Permitted<br />
GROUNDWATER<br />
*Charlotte 21.707 0.069 0.012 5.634 2.027 29.449<br />
Citrus 2.881 5.542 0.061 19.922 5.076 33.482<br />
DeSoto 102.836 1.600 0.001 1.444 1.028 106.908<br />
Hardee 76.532 4.662 6.390 3.171 0.556 91.311<br />
Hernando 3.765 20.298 3.966 29.784 6.415 64.228<br />
*Highlands 53.871 0.650 0.004 12.591 2.848 69.963<br />
Hillsborough 97.906 17.192 0.177 49.874 18.963 184.112<br />
*Lake 1.801 0.000 0.000 0.000 0.000 1.801<br />
*Levy 17.805 1.591 0.001 1.221 0.362 20.979<br />
Manatee 158.485 0.910 6.420 23.159 19.358 208.332<br />
*Marion 11.171 0.226 0.000 15.350 4.757 31.505<br />
Pasco 26.324 6.152 0.234 113.727 8.346 154.783<br />
Pinellas 0.321 0.429 0.000 20.246 4.304 25.301<br />
*Polk 114.185 81.911 71.605 117.894 11.927 397.521<br />
Sarasota 22.682 0.138 0.003 41.931 11.968 76.721<br />
Sumter 14.776 1.870 0.129 19.816 2.999 39.591<br />
District GW Subtotal 727.048 143.240 89.003 475.764 100.934 1535.987<br />
% of District GW Subtotal 47% 9% 6% 31% 7% 100%<br />
SURFACE WATER<br />
*Charlotte 4.886 0.000 1.369 8.088 2.989 17.331<br />
Citrus 0.083 0.233 0.106 0.002 0.630 1.054<br />
DeSoto 3.622 0.000 0.500 32.701 0.368 37.191<br />
Hardee 1.624 0.000 0.000 0.000 0.146 1.771<br />
Hernando 0.001 0.000 2.936 0.028 1.506 4.471<br />
*Highlands 5.856 0.000 0.043 0.007 0.093 5.999<br />
Hillsborough 7.827 6.081 0.862 204.597 1.638 221.006<br />
*Lake 0.099 0.000 0.000 0.000 0.000 0.099<br />
*Levy 0.548 0.037 0.122 0.000 0.000 0.707<br />
Manatee 2.550 8.528 0.431 36.717 4.154 52.380<br />
*Marion 0.043 0.040 0.000 0.000 0.565 0.648<br />
Pasco 0.579 0.189 0.191 0.181 0.989 2.130<br />
Pinellas 0.083 0.022 0.000 0.000 2.863 2.968<br />
*Polk 3.319 1.479 1.307 0.032 1.238 7.375<br />
Sarasota 0.734 0.000 0.399 3.675 2.558 7.366<br />
Sumter 1.011 0.000 0.799 9.872 0.833 12.515<br />
District SW Subtotal 32.865 16.609 9.065 295.900 20.570 375.011<br />
% of District SW Subtotal 9% 4% 2% 79% 5% 100%<br />
District Total 759.913 159.849 98.068 771.664 121.504 1910.998<br />
% District Totals/<strong>Use</strong><br />
Category<br />
40%<br />
* Data is only for the portion of the county within the District.<br />
Source: <strong>Estimated</strong> <strong>Water</strong> <strong>Use</strong> Tables derived from the WMIS WUP database, <strong>2011</strong>.<br />
8% 5% 40% 6% 100%<br />
<strong>Southwest</strong> <strong>Florida</strong> <strong>Water</strong> <strong>Management</strong> District Page | 383
<strong>2011</strong> ESTIMATED WATER USE REPORT<br />
TABLE C2.<br />
County<br />
<strong>2011</strong> TOTAL PERMITTED AVERAGE ANNUAL QUANTITIES (MGD) IN THE SOUTHERN WATER USE<br />
CAUTION AREA (SWUCA) BY SOURCE, USE CATEGORY, AND COUNTY<br />
Agriculture<br />
Industrial/<br />
Commercial<br />
Mining/<br />
Dewatering<br />
Public<br />
Supply<br />
Recreation/<br />
Aesthetic<br />
Total<br />
Permitted<br />
GROUNDWATER<br />
*Charlotte 21.707 0.069 0.012 5.634 2.027 29.449<br />
DeSoto 102.836 1.600 0.001 1.444 1.028 106.908<br />
Hardee 76.532 4.662 6.390 3.171 0.556 91.311<br />
*Highlands 53.871 0.650 0.004 12.591 2.848 69.963<br />
*Hillsborough 60.283 4.858 0.177 31.253 6.234 102.805<br />
Manatee 158.485 0.910 6.420 23.159 19.358 208.332<br />
*Polk 97.452 80.266 69.598 102.575 9.139 359.030<br />
Sarasota 22.682 0.138 0.003 41.931 11.968 76.721<br />
SWUCA GW Subtotals 593.848 93.153 82.605 221.758 53.158 1044.519<br />
% SWUCA GW Subtotals 57% 9% 8% 21% 5% 100%<br />
SURFACE WATER<br />
*Charlotte 4.886 0.000 1.369 8.088 2.989 17.331<br />
DeSoto 3.622 0.000 0.500 32.701 0.368 37.191<br />
Hardee 1.624 0.000 0.000 0.000 0.146 1.771<br />
*Highlands 5.856 0.000 0.043 0.007 0.093 5.999<br />
*Hillsborough 3.996 5.963 0.651 17.590 1.186 29.384<br />
Manatee 2.550 8.528 0.431 36.717 4.154 52.380<br />
*Polk 2.642 1.478 1.087 0.032 0.956 6.195<br />
Sarasota 0.734 0.000 0.399 3.675 2.558 7.366<br />
SWUCA SW Subtotals 25.91 15.969 4.48 98.81 12.45 157.617<br />
% SWUCA SW Subtotals 16% 10% 3% 63% 8% 100%<br />
SWUCA Totals 619.758 109.122 87.085 320.568 65.608 1202.136<br />
% of SWUCA Totals 52% 9% 7% 27% 5% 100%<br />
District Totals 759.913 159.849 98.068 771.664 121.504 1910.998<br />
SWUCA % District<br />
Totals/<strong>Use</strong> Category<br />
82% 68% 89% 42% 54% 63%<br />
* Data is only for the portion of the county within the SWUCA<br />
Source: <strong>Estimated</strong> <strong>Water</strong> <strong>Use</strong> Tables derived from the WMIS WUP database, <strong>2011</strong>.<br />
<strong>Southwest</strong> <strong>Florida</strong> <strong>Water</strong> <strong>Management</strong> District Page | 384
<strong>2011</strong> ESTIMATED WATER USE REPORT<br />
TABLE C3<br />
County<br />
<strong>2011</strong> TOTAL PERMITTED AVERAGE ANNUAL QUANTITIES (MGD) IN THE MOST IMPACTED AREA<br />
OF THE SWUCA BY SOURCE, USE CATEGORY, AND COUNTY<br />
Agriculture<br />
Industrial/<br />
Commercial<br />
Mining/<br />
Dewaterin<br />
g<br />
GROUNDWATER<br />
Public<br />
Supply<br />
Recreation/<br />
Aesthetic<br />
Total<br />
Permitted<br />
Hillsborough 40.356 0.327 0.177 0.540 5.412 46.812<br />
Manatee 79.282 0.679 0.000 5.157 18.320 103.438<br />
Sarasota 4.510 0.044 0.003 26.002 2.555 33.114<br />
MIA GW Subtotals 124.148 1.050 0.180 31.699 26.287 183.364<br />
% of MIA GW Subtotals 68% 1% 0% 17% 14% 100%<br />
SURFACE WATER<br />
Hillsborough 1.066 0.000 0.651 0.079 1.079 2.875<br />
Manatee 1.711 8.519 0.218 36.716 4.144 51.307<br />
Sarasota 0.122 0.000 0.133 0.000 0.058 0.314<br />
MIA SW Subtotals 2.899 8.519 1.002 36.795 5.281 54.496<br />
% of MIA SW Subtotals 5% 16% 2% 68% 10% 100%<br />
MIA Totals 127.047 9.569 1.182 68.494 31.568 237.86<br />
% of MIA Totals 53% 4% 0% 29% 13% 100%<br />
SWUCA Totals 619.758 109.122 87.085 320.568 65.608 1202.136<br />
MIA % of SWUCA Totals 20% 9% 1% 21% 48% 20%<br />
District Total 759.913 159.849 98.068 771.664 121.504 1910.998<br />
MIA % District<br />
Totals/<strong>Use</strong> Category<br />
17% 6% 1% 9% 26% 12%<br />
Data is only for the portion of the county that is within the MIA.<br />
Source: <strong>Estimated</strong> <strong>Water</strong> <strong>Use</strong> Tables derived from the WMIS WUP database, <strong>2011</strong>.<br />
<strong>Southwest</strong> <strong>Florida</strong> <strong>Water</strong> <strong>Management</strong> District Page | 385
<strong>2011</strong> ESTIMATED WATER USE REPORT<br />
Table C4. <strong>2011</strong> TOTAL PERMITTED AVERAGE ANNUAL QUANTITIES (MGD) IN THE NORTHERN TAMPA BAY<br />
WATER USE CAUTION AREA (NTB WUCA) BY SOURCE, USE CATEGORY, AND COUNTY<br />
County<br />
Agriculture<br />
Industrial/<br />
Commercial<br />
Mining/<br />
Dewatering<br />
Public<br />
Supply<br />
Recreation/<br />
Aesthetic<br />
Total<br />
Permitted<br />
GROUNDWATER<br />
*Hillsborough 37.608 12.334 0.000 18.621 12.730 81.293<br />
Pasco 26.324 6.152 0.234 113.727 8.346 154.783<br />
Pinellas 0.321 0.429 0.000 20.246 4.304 25.301<br />
NTB WUCA GW Subtotals 64.253 18.915 0.234 152.594 25.380 261.377<br />
% NTB WUCA GW Subtotals 25% 7% 0% 58% 10% 100%<br />
SURFACE WATER<br />
*Hillsborough 3.832 0.119 0.211 187.007 0.452 191.622<br />
Pasco 0.579 0.189 0.191 0.181 0.989 2.130<br />
Pinellas 0.083 0.022 0.000 0.000 2.863 2.968<br />
NTB WUCA SW Subtotals 4.494 0.330 0.402 187.188 4.304 196.720<br />
% NTB WUCA SW Subtotals 2% 0.2% 0.2% 95% 2% 100%<br />
NTB WUCA Totals 68.747 19.245 0.636 339.782 29.684 458.097<br />
% NTB WUCA Totals 15% 4% 0.1% 74% 7% 100%<br />
District Totals 759.913 159.849 98.068 771.664 121.504 1910.998<br />
NTB WUCA % District<br />
Totals/<strong>Use</strong> Category<br />
9% 12% 1% 44% 24% 24%<br />
* Data is only for the portion of the county that is within the NTB WUCA.<br />
Source: <strong>Estimated</strong> <strong>Water</strong> <strong>Use</strong> Tables derived from the WMIS WUP database, <strong>2011</strong>.<br />
<strong>Southwest</strong> <strong>Florida</strong> <strong>Water</strong> <strong>Management</strong> District Page | 386
<strong>2011</strong> ESTIMATED WATER USE REPORT<br />
TABLE C5. <strong>2011</strong> TOTAL PERMITTED ANNUAL AVERAGE QUANTITIES (MGD) IN THE DOVER/PLANT CITY<br />
WATER USE CAUTION AREA (DPC WUCA) BY SOURCE, USE CATEGORY, AND COUNTY<br />
County<br />
Agriculture<br />
Industrial/<br />
Commercial<br />
Mining/<br />
Dewatering<br />
Public<br />
Supply<br />
Recreation/<br />
Aesthetic<br />
Total<br />
Permitted<br />
GROUNDWATER<br />
Hillsborough 39.673 4.783 0.000 41.012 0.919 86.386<br />
Polk 1.283 9.701 41.289 12.162 0.007 64.443<br />
DPC WUCA GW Totals 40.956 14.484 41.289 53.174 0.926 150.829<br />
% DPC WUCA GW<br />
Subtotals<br />
27% 10% 27% 35% 1% 100%<br />
SURFACE WATER<br />
Hillsborough 4.882 0.001 0.000 0.005 0.256 5.144<br />
Polk 0.000 0.111 0.891 0.000 0.000 1.002<br />
DPC WUCA SW Totals 4.882 0.112 0.891 0.005 0.256 6.146<br />
% DPC WUCA SW<br />
Subtotals<br />
79% 2% 14% 0% 4% 100%<br />
DPC WUCA Totals 45.838 14.596 42.180 53.179 1.182 156.975<br />
% DPC WUCA Totals 29% 9% 27% 34% 1% 100%<br />
District Totals 759.913 159.849 98.068 771.664 121.504 1910.998<br />
DPC WUCA % District<br />
Totals/<strong>Use</strong> Category<br />
Data is only for the portion of the county that is within the MIA.<br />
Source: <strong>Estimated</strong> <strong>Water</strong> <strong>Use</strong> Tables derived from the WMIS WUP database, <strong>2011</strong>.<br />
6% 9% 43% 7% 1% 8%<br />
<strong>Southwest</strong> <strong>Florida</strong> <strong>Water</strong> <strong>Management</strong> District Page | 387
<strong>2011</strong> ESTIMATED WATER USE REPORT<br />
TABLE C6.<br />
County/<strong>Use</strong><br />
<strong>2011</strong> TOTAL PERMITTED FREEZE PROTECTION QUANTITIES (MGD) PER<br />
AGRICULTURAL USE IN THE DOVER/PLANT CITY WATER USE CAUTION AREA (DPC<br />
WUCA)<br />
Citrus<br />
Nursery<br />
GROUNDWATER<br />
Nursery,<br />
Container<br />
Nursery,<br />
Field<br />
Other<br />
Fruit<br />
Trees<br />
Straw <br />
berry<br />
County<br />
Total<br />
Hillsborough 2.797 13.440 107.836 6.780 37.504 4.324 0.150 702.450 875.280<br />
Polk 0.000 0.360 3.787 0.000 0.000 0.000 0.000 6.924 11.071<br />
Subtotal Maximum<br />
Groundwater<br />
Quantities<br />
% of Subtotal<br />
Groundwater<br />
2.797 13.800 111.623 6.780 37.504 4.324 0.150 709.374 886.351<br />
0.3% 2% 13% 1% 4% 0.5% 0.02% 80% 100%<br />
SURFACE WATER<br />
Hillsborough 0.000 1.636 11.597 0.000 8.775 0.399 0.000 216.259 238.667<br />
Polk 0.000 0.000 0.000 0.000 0.000 0.000 0.000 1.169 1.169<br />
Subtotal Maximum<br />
Surface <strong>Water</strong><br />
Quantities<br />
% of Subtotal Surface<br />
<strong>Water</strong><br />
Total Maximum<br />
Quantities<br />
<strong>Use</strong> Type % of Total<br />
Maximum Quantities<br />
0.000 1.636 11.597 0.000 8.775 0.399 0.000 217.428 239.836<br />
0 1% 5% 0% 4% 0% 0% 91% 100%<br />
2.797 15.436 123.220 6.780 46.279 4.723 0.150 926.802 1,126.187<br />
0.2% 1% 11% 1% 4% 0.4% 0.01% 82% 100%<br />
Aquaculture<br />
Blueberries<br />
TABLE C7. <strong>2011</strong> TOTAL NUMBER OF AGRICULTURAL WATER USE PERMITS WITH FREEZE PROTECTION<br />
QUANTITIES IN THE DPC WUCA PER AGRICULTURAL USE<br />
Other<br />
Aquaculturberries<br />
Container Field<br />
berry Total<br />
Blue<br />
Nursery, Nursery, Straw County<br />
County/<strong>Use</strong><br />
Citrus Nursery<br />
Fruit<br />
Trees<br />
Hillsborough 4 10 136 3 35 6 1 288 483<br />
Polk 0 1 5 0 0 0 0 4 10<br />
Total 4 11 141 3 35 6 1 292 493<br />
Source for both tables <strong>Estimated</strong> <strong>Water</strong> <strong>Use</strong> Tables derived from the WMIS WUP database, <strong>2011</strong>.<br />
Data is only for the portion of the county within the Dover/Plant City WUCA<br />
<strong>Southwest</strong> <strong>Florida</strong> <strong>Water</strong> <strong>Management</strong> District Page | 388
<strong>2011</strong> ESTIMATED WATER USE REPORT<br />
APPENDIX D.<br />
2002—<strong>2011</strong><br />
HISTORIC PUMPAGE<br />
AND<br />
HISTORIC PUBLIC SUPPLY PER CAPITA RATES<br />
FOR<br />
LARGE WATER USE PERMITS<br />
PERMITTED ANNUAL AVERAGE QUANTITIES > 1.0 MGD<br />
<strong>Southwest</strong> <strong>Florida</strong> <strong>Water</strong> <strong>Management</strong> District Page | 389
<strong>2011</strong> ESTIMATED WATER USE REPORT<br />
TABLE D1. TENYEAR HISTORIC ANNUAL AVERAGE PUMPAGE (MGD) FOR PUBLIC SUPPLY WUPS WITH ANNUAL AVERAGE QUANTITIES > 1.0 MGD<br />
County<br />
WUP<br />
No.<br />
Permittee Name<br />
Permitted<br />
Quantity 1<br />
2002 2003 2004 2005 2006 2007 2008 2009 2010 <strong>2011</strong><br />
Charlotte 718 Gasparilla Island <strong>Water</strong> Assoc 1.538 1.029 1.167 1.292 1.160 1.364 1.433 1.345 1.336 1.227 1.287<br />
Charlotte 871 City of Punta Gorda 8.088 4.196 4.140 4.441 4.402 4.956 4.988 4.752 4.437 4.814 4.701<br />
Charlotte 3522 Charlotte Co Utilities Dept 3.172 0.385 0.405 0.528 0.579 0.681 0.632 0.566 0.538 0.530 0.552<br />
Charlotte County Totals 12.798 5.611 5.712 6.261 6.141 7.001 7.054 6.663 6.311 6.571 6.540<br />
Citrus 207 City of Crystal River 1.090 0.778 0.814 0.806 0.749 0.781 0.741 0.800 0.745 0.735 0.779<br />
Citrus 419 City of Inverness 1.535 1.278 1.276 1.374 1.273 1.394 1.260 1.173 1.129 1.102 1.131<br />
Citrus 2842 Citrus Co <strong>Water</strong> Resources Dev 3.653 1.732 1.865 2.290 2.309 2.808 2.966 2.561 2.397 2.605 2.698<br />
Citrus 4153 Rolling Oaks Utilities Inc 2.500 2.121 2.012 2.263 2.017 2.422 2.002 1.816 1.733 1.689 1.740<br />
Citrus 7121 Citrus County & Withlacoochee 6.272 3.775 3.734 3.052 4.634 5.549 4.753 4.422 4.036 4.125 4.548<br />
Citrus 9791 Citrus Co <strong>Water</strong> Resources Dev 2.064 1.692 1.721 2.213 2.252 3.080 2.767 2.241 2.226 2.208 2.440<br />
Citrus County Totals 17.114 11.376 11.422 11.998 13.234 16.034 14.489 13.014 12.268 12.464 13.336<br />
Desoto 4725 City of Arcadia 1.117 1.091 1.123 1.227 1.113 1.015 0.922 0.868 0.856 0.827 0.830<br />
Desoto 10420 Peace River‐Manasota WSA 32.855 16.182 19.143 18.500 20.354 18.102 16.120 12.386 31.753 22.600 32.214<br />
DeSoto County Totals 33.972 17.272 20.266 19.727 21.467 19.117 17.043 13.254 32.609 23.427 33.044<br />
Hardee 4461 City of Wauchula 1.237 0.827 0.830 0.898 0.861 0.919 0.845 0.851 0.808 0.716 0.443<br />
Hernando 2983 Hernando Co Utilities Dept 22.713 5.826 5.734 6.925 7.573 9.902 10.923 18.599 17.968 17.347 18.222<br />
Hernando 5789 Hernando Co Utilities Dept 3.818 0.600 0.571 0.684 0.766 0.878 0.804 0.720 0.815 0.869 0.991<br />
Hernando 7627 City of Brooksville 2.448 1.586 1.512 1.388 1.461 1.549 1.407 1.388 1.313 1.237 1.236<br />
Hernando County Totals 28.979 8.012 7.817 8.997 9.801 12.330 13.134 20.707 20.096 19.453 20.449<br />
Highlands 4492 City of Sebring 5.712 3.555 3.160 3.304 3.263 3.558 3.538 3.226 2.514 3.256 3.303<br />
Highlands 5270 Town of Lake Placid 1.192 0.490 0.501 0.534 0.552 0.560 0.526 0.482 0.478 0.419 0.444<br />
Highlands 6029 City of Avon Park 2.225 2.322 1.942 1.718 1.734 1.934 1.843 1.806 1.665 1.687 1.738<br />
Highlands 13099 Sun N Lake of Sebring 1.104 . 2 . . . . 0.056 0.650 0.615 0.606 0.577<br />
Highlands County Totals 10.233 6.367 5.603 5.556 5.550 6.052 5.963 6.164 5.272 5.968 6.062<br />
Hillsborough 450 City of Temple Terrace 5.150 3.795 3.744 4.030 4.035 4.535 3.949 3.717 3.481 3.477 3.707<br />
<strong>Southwest</strong> <strong>Florida</strong> <strong>Water</strong> <strong>Management</strong> District Page | 390
<strong>2011</strong> ESTIMATED WATER USE REPORT<br />
TABLE D1. TENYEAR HISTORIC ANNUAL AVERAGE PUMPAGE (MGD) FOR PUBLIC SUPPLY WUPS WITH ANNUAL AVERAGE QUANTITIES > 1.0 MGD<br />
County<br />
WUP<br />
No.<br />
Permittee Name<br />
Permitted<br />
Quantity 1<br />
2002 2003 2004 2005 2006 2007 2008 2009 2010 <strong>2011</strong><br />
Hillsborough 1776 City of Plant City 9.852 5.573 5.479 5.771 5.713 6.203 6.114 5.707 4.966 4.825 4.955<br />
Hillsborough 2062 City of Tampa <strong>Water</strong> Dept 82.000 65.909 73.689 78.971 79.404 76.772 71.754 69.261 60.054 68.184 70.115<br />
Hillsborough 4352 Tampa Bay <strong>Water</strong> 24.100 21.091 22.326 22.893 21.205 23.506 23.393 20.362 21.578 21.176 22.209<br />
Hillsborough 6675 Tampa Bay <strong>Water</strong> 20.000 10.479 0.000 2.264 2.064 15.647 15.279 11.491 10.245 5.225 5.017<br />
Hillsborough 11732 Tampa Bay <strong>Water</strong> 6.000 3.881 3.708 4.896 4.657 5.388 2.011 0.449 6.254 3.367 4.185<br />
Hillsborough 11771 Tampa Bay <strong>Water</strong> 90.000 131.484 79.581 86.879 99.471 113.315 116.538 86.918 86.710 85.158 78.425<br />
Hillsborough 11794 Tampa Bay <strong>Water</strong> 17.510 0.000 2.993 8.476 23.170 13.091 11.773 5.711 23.680 5.793 2.978<br />
Hillsborough 11796 Tampa Bay <strong>Water</strong> 85.000 17.457 75.269 72.925 120.155 42.993 49.370 41.840 79.677 50.506 31.373<br />
Hillsborough County Totals 339.612 259.669 266.790 287.105 359.874 301.449 300.182 245.454 296.645 247.711 222.964<br />
Levy 5640 City of Williston 1.000 0.498 0.457 0.538 0.527 0.540 0.539 0.518 0.478 0.469 0.483<br />
Manatee 5387 Manatee Co Utility Operations 34.900 29.066 26.454 28.718 28.562 34.427 33.820 30.415 21.817 17.491 24.897<br />
Manatee 6392 City of Bradenton 6.950 5.584 5.439 5.588 6.229 5.984 5.754 5.376 5.319 5.301 5.219<br />
Manatee 7345<br />
Mosaic Fertilizer LLC &<br />
Manatee Co<br />
1.960 0.957 1.717 1.364 1.750 1.721 1.430 1.169 1.668 1.481 1.720<br />
Manatee 7470 Manatee Co BOCC 15.986 13.189 13.499 13.306 13.030 10.642 11.811 14.217 10.451 8.736 8.026<br />
Manatee County Totals 59.796 48.795 47.109 48.976 49.571 52.774 52.815 51.176 39.255 33.009 39.862<br />
Marion 377 Marion Co Utilities Dept 3.200 0.015 0.018 0.052 0.142 0.338 0.739 1.866 1.726 2.215 1.917<br />
Marion 1156 On Top Of The World Comm. 2.555 1.789 1.714 1.909 1.882 3.083 3.325 3.362 3.152 3.180 3.030<br />
Marion 4257 Rainbow Springs Utilities LC 1.057 0.903 0.889 0.874 0.638 0.875 0.813 0.746 0.746 0.969 0.748<br />
Marion 6151 Marion Co Utilities Dept 3.263 0.396 0.178 1.387 2.363 3.173 2.806 2.386 2.390 2.491 2.650<br />
Marion 8481 Marion Utilities Inc 1.180 0.334 0.354 0.455 0.522 0.880 0.742 0.668 0.656 0.612 0.625<br />
Marion County Totals 11.255 3.438 3.153 4.678 5.548 8.349 8.424 9.028 8.670 9.467 8.970<br />
Pasco 590 Mad Hatter Utilities Inc 1.000 0.886 0.704 0.762 0.953 1.094 0.883 0.705 1.171 0.884 0.909<br />
Pasco 1631 City of Dade City 2.275 1.480 1.469 1.534 1.770 1.480 1.431 1.465 1.383 1.331 1.311<br />
Pasco 3182 Fl Gov Utility Auth 2.040 2.906 2.869 3.275 3.249 3.856 3.597 3.649 3.296 2.984 2.589<br />
Pasco 3692 City of Port Richey 1.165 0.492 0.435 0.392 0.378 0.669 0.641 0.677 0.746 0.768 0.781<br />
Pasco 6040 City of Zephyrhills 2.900 2.316 2.294 2.456 2.870 2.960 2.809 2.579 2.490 2.350 2.462<br />
<strong>Southwest</strong> <strong>Florida</strong> <strong>Water</strong> <strong>Management</strong> District Page | 391
<strong>2011</strong> ESTIMATED WATER USE REPORT<br />
TABLE D1. TENYEAR HISTORIC ANNUAL AVERAGE PUMPAGE (MGD) FOR PUBLIC SUPPLY WUPS WITH ANNUAL AVERAGE QUANTITIES > 1.0 MGD<br />
County<br />
WUP<br />
No.<br />
Permittee Name<br />
Permitted<br />
Quantity 1<br />
2002 2003 2004 2005 2006 2007 2008 2009 2010 <strong>2011</strong><br />
Pasco 11863 Master Pasco County 6.286 0.116 0.146 0.218 0.289 0.388 0.411 0.384 0.329 3.023 4.297<br />
Pasco County Totals 15.666 8.196 7.917 8.637 9.509 10.447 9.772 9.460 9.415 11.340 12.349<br />
Pinellas 742 City of Tarpon Springs 1.380 0.099 0.022 0.265 0.478 0.583 0.486 0.471 0.672 0.891 0.511<br />
Pinellas 2980 City of Dunedin 6.617 5.207 5.278 5.097 5.067 5.003 4.788 4.733 4.471 4.361 4.309<br />
Pinellas 2981 City of Clearwater Pub Works 8.000 2.536 3.653 3.411 3.579 3.859 3.307 2.972 4.111 4.389 4.750<br />
Pinellas 7692 Town of Belleair 1.160 1.015 0.964 1.012 1.038 1.089 1.071 0.988 0.828 0.777 0.768<br />
Pinellas 11218 City of Oldsmar 2.700 . . . . 0.000 0.000 0.000 0.000 0.000 0.000<br />
Pinellas County Totals 19.857 8.856 9.917 9.785 10.163 10.533 9.652 9.164 10.082 10.418 10.338<br />
Polk 341 City of Bartow 7.900 3.425 3.132 3.266 3.020 3.486 3.316 3.246 2.977 2.240 2.976<br />
Polk 645 City of Fort Meade 1.014 0.594 0.754 0.814 0.773 0.849 0.722 0.697 0.720 0.563 0.544<br />
Polk 4607 City of Winter Haven 14.060 6.133 6.015 6.733 9.948 11.200 10.615 9.948 9.534 9.170 8.601<br />
Polk 4658 City of Lake Wales 3.821 2.657 2.651 2.763 2.639 3.366 3.300 2.986 2.802 2.568 2.551<br />
Polk 4912 City of Lakeland 35.030 22.009 21.185 23.165 24.669 26.389 23.933 23.083 21.390 20.269 21.901<br />
Polk 5251 Grenelefe Resort LLC 1.278 0.947 1.164 0.756 0.865 1.086 0.831 0.925 1.158 1.397 0.994<br />
Polk 5750 City of Davenport 1.002 0.519 0.514 0.564 0.467 0.634 0.750 0.720 0.590 0.241 0.450<br />
Polk 5893 Town of Dundee 1.831 0.493 0.435 0.458 0.476 0.623 0.564 0.540 0.545 0.542 0.296<br />
Polk 6505 Polk Co BOCC Utilities Div 5.085 3.089 3.188 3.155 3.018 3.659 3.391 2.978 2.900 3.024 2.832<br />
Polk 6506 Polk Co BOCC Utilities Div 7.000 3.197 3.296 3.463 3.520 3.944 3.464 3.396 3.427 3.616 3.379<br />
Polk 6507 Polk Co BOCC Utilities Div 2.271 1.560 1.232 1.305 1.256 1.450 1.202 1.038 1.183 1.018 0.981<br />
Polk 6508 Polk Co BOCC Utilities Div 1.367 0.636 0.541 0.591 0.653 0.664 0.668 0.568 0.620 0.530 0.508<br />
Polk 6509 Polk Co BOCC Utilities Div 10.919 4.717 4.560 4.563 5.866 6.199 5.846 5.975 5.010 4.539 4.486<br />
Polk 6624 City of Lake Alfred 1.381 0.621 0.724 0.716 0.770 1.012 0.861 0.903 0.862 0.943 0.972<br />
Polk 7119 City of Auburndale 7.036 2.926 3.150 4.031 3.750 4.714 4.551 4.555 4.328 4.756 4.468<br />
Polk 8054 Polk Co BOCC Utilities Div 1.065 0.498 0.492 0.469 0.448 0.509 0.443 0.475 0.502 0.460 0.527<br />
Polk 8468 City of Polk City 1.187 0.281 0.262 0.274 0.264 0.331 0.280 0.319 0.399 0.304 0.338<br />
Polk 8522 City of Haines City 5.921 2.841 2.853 3.343 3.699 4.305 4.375 3.991 3.721 3.618 3.728<br />
Polk County Totals 109.168 57.145 56.148 60.431 66.103 74.420 69.114 66.342 62.670 59.798 60.532<br />
Sarasota 2923 City of North Port Utilities 7.100 1.303 1.316 1.422 2.556 2.389 1.294 1.653 1.459 1.150 1.541<br />
<strong>Southwest</strong> <strong>Florida</strong> <strong>Water</strong> <strong>Management</strong> District Page | 392
<strong>2011</strong> ESTIMATED WATER USE REPORT<br />
TABLE D1. TENYEAR HISTORIC ANNUAL AVERAGE PUMPAGE (MGD) FOR PUBLIC SUPPLY WUPS WITH ANNUAL AVERAGE QUANTITIES > 1.0 MGD<br />
County<br />
WUP<br />
No.<br />
Permittee Name<br />
Permitted<br />
Quantity 1<br />
2002 2003 2004 2005 2006 2007 2008 2009 2010 <strong>2011</strong><br />
Sarasota 4318 City of Sarasota Public Works 6.000 5.036 4.832 5.067 4.880 5.086 3.871 2.901 3.392 3.013 3.035<br />
Sarasota 4866 Englewood <strong>Water</strong> District 5.360 3.067 3.084 3.636 3.151 3.022 3.280 2.888 2.766 2.796 3.566<br />
Sarasota 5393 City of Venice 6.864 4.301 4.336 4.578 4.469 4.449 4.383 4.137 4.002 3.867 4.066<br />
Sarasota 8836 Sarasota Co BOCC 13.737 6.340 6.632 6.756 7.075 7.725 8.947 11.402 8.827 2.366 3.091<br />
Sarasota 10224 City of Sarasota 6.000 4.733 4.110 3.500 4.006 4.048 5.199 5.835 4.654 5.225 4.613<br />
Sarasota County Totals 45.061 24.781 24.310 24.959 26.138 26.719 26.975 28.816 25.098 18.417 19.912<br />
Sumter 6519 City of Bushnell 1.367 0.383 0.362 0.398 0.438 0.483 0.428 0.444 0.403 0.399 0.366<br />
Sumter 8135 City of Wildwood City Mgmt 4.980 2.520 1.890 1.868 1.897 2.149 2.022 2.075 1.981 1.989 2.048<br />
Sumter 13005 Village Center Comm. Dev. 3 23.066 . . . . . 8.851 11.242 11.834 13.050 14.565<br />
Sumter County Totals 29.413 2.903 2.252 2.266 2.335 2.632 11.301 13.761 14.218 15.438 16.979<br />
District Public Supply Totals 735.160 463.746 469.704 500.814 586.822 549.315 547.301 494.371 543.893 474.666 472.263<br />
Source: <strong>Estimated</strong> <strong>Water</strong> <strong>Use</strong> Tables derived from the WMIS WUP database, <strong>2011</strong>.<br />
Permits that were included in the 2010 list have been removed from this list if they were modified to be less than 1.0 MGD on an Annual Average basis.<br />
Permits that were in "Inactive" status on December 31, <strong>2011</strong> will not be listed.<br />
1 “Permitted" represents the total daily average quantity (mgd) permitted by the District as of <strong>2011</strong><br />
2 When no pumpage has been reported by a permittee during the year, " . " is shown.<br />
3 Pumpage for 2007, 2008, 2009 was corrected for WUP 13005.<br />
<strong>Southwest</strong> <strong>Florida</strong> <strong>Water</strong> <strong>Management</strong> District Page | 393
<strong>2011</strong> ESTIMATED WATER USE REPORT<br />
TABLE D2. TENYEAR HISTORIC ANNUAL AVERAGE PUMPAGE (MGD) FOR AGRICULTURAL WUPS WITH ANNUAL AVERAGE QUANTITIES > 1.0 MGD<br />
County<br />
WUP<br />
No.<br />
Permittee Name<br />
Permitted<br />
Quantity 1<br />
2002 2003 2004 2005 2006 2007 2008 2009 2010 <strong>2011</strong><br />
Charlotte 1759 Diner Citrus and Cattle Co. 2.461 0.000 . 2 0.000 0.000 0.000 0.004 0.030 0.340 0.503 0.350<br />
Charlotte 2689 East Charlotte Drainage District 2.920 1.300 1.019 1.105 0.339 2.496 3.404 1.620 2.449 1.668 1.279<br />
Charlotte 5936<br />
Schwartz Charlotte Grove<br />
Properties, LLC<br />
1.001 0.024 0.087 0.041 0.000 0.124 0.000 . . 0.012 0.320<br />
Charlotte 8224<br />
Spanish Trail Land & Cattle<br />
Company LLC<br />
2.534 0.768 0.560 0.003 0.005 0.041 0.300 0.200 0.282 0.485 0.181<br />
Charlotte 9052 Ben Hill Griffin, Inc. 1.396 1.714 1.140 1.023 0.458 0.577 0.962 0.813 0.610 1.032 0.740<br />
Charlotte 9398<br />
TRB Groves LLC Wesley W<br />
Brumback<br />
1.258 0.885 0.812 0.953 0.637 0.843 0.894 0.746 1.410 2.022 1.344<br />
Charlotte 9648 Thomas Beddard 1.491 0.698 0.602 0.440 0.673 0.637 0.867 0.893 0.747 0.414 0.806<br />
Charlotte 9687 Williams Farms Partnership 1.571 0.175 0.342 0.500 0.566 0.879 1.005 0.892 1.229 0.893 1.045<br />
Charlotte County Totals 14.632 5.564 4.563 4.065 2.678 5.597 7.437 5.195 7.067 7.029 6.064<br />
DeSoto 1635 Bethel Farms, LLLP 2.578 1.652 1.291 1.503 1.772 2.424 2.373 1.768 1.965 1.681 1.792<br />
DeSoto 2193<br />
The Phillip W Turner Family<br />
Partnership LTD<br />
3.967 0.577 1.256 0.822 0.663 1.746 1.593 0.759 0.796 0.439 0.488<br />
DeSoto 2386 Joshua <strong>Water</strong> Control District 14.353 11.610 9.771 8.850 6.948 11.844 12.002 7.481 10.953 10.990 11.337<br />
DeSoto 2452<br />
<strong>Florida</strong> Power & Light Co & OCF<br />
27 Corp<br />
4.301 . . . 0.033 0.816 0.379 0.073 0.022 0.893 0.944<br />
DeSoto 3275 Adrian R Chapman 1.102 1.336 0.899 1.226 0.658 1.251 0.957 0.466 1.282 1.079 1.458<br />
DeSoto 4606<br />
Spanish Trail Land & Cattle<br />
Company LLC<br />
3.398 1.049 0.195 0.088 0.042 0.403 0.316 0.090 0.398 0.058 0.130<br />
DeSoto 4641 Roper Growers Cooperative 1.167 0.685 0.657 0.785 0.331 0.792 1.006 0.641 0.585 0.388 0.382<br />
DeSoto 5060 Charlee LLC 2.203 0.338 0.400 0.379 0.137 0.669 0.624 0.388 1.006 0.385 2.018<br />
DeSoto 6669 FLM, Inc. 1.516 1.362 1.490 1.056 1.283 1.603 1.609 1.206 1.968 1.547 1.727<br />
DeSoto 6765 LD Hancock Marital Trust 1.313 0.840 0.636 0.722 0.674 1.217 1.600 0.899 1.208 1.743 1.083<br />
DeSoto 6872 Bob Paul Inc 1.585 0.452 0.216 0.144 0.108 0.130 0.441 0.165 0.245 0.283 0.182<br />
DeSoto 7462 Bright Hour Ranch 1.246 0.586 0.460 0.447 0.486 1.136 1.276 0.580 0.810 0.568 0.399<br />
DeSoto 7957 Turner Groves Citrus LP 3.166 3.427 2.129 2.573 2.261 3.649 3.023 2.767 3.457 3.755 2.648<br />
DeSoto 8566 Eugene H Turner Family LP 3.576 0.802 1.221 1.136 0.998 2.399 1.992 1.078 2.333 1.898 1.717<br />
DeSoto 8985 Gaylon Lawrence 2.603 1.459 1.190 1.232 1.160 3.015 2.698 2.369 2.922 3.073 3.063<br />
DeSoto 9226 Bluehead Farms, LLC 1.267 0.256 0.303 0.566 0.215 0.128 0.118 0.408 1.427 1.079 0.813<br />
DeSoto 9741 Mosaic Fertilizer LLC & 1.482 0.709 0.866 0.633 0.487 0.826 0.826 0.545 0.871 0.971 0.785<br />
<strong>Southwest</strong> <strong>Florida</strong> <strong>Water</strong> <strong>Management</strong> District Page | 394
<strong>2011</strong> ESTIMATED WATER USE REPORT<br />
TABLE D2. TENYEAR HISTORIC ANNUAL AVERAGE PUMPAGE (MGD) FOR AGRICULTURAL WUPS WITH ANNUAL AVERAGE QUANTITIES > 1.0 MGD<br />
County<br />
WUP<br />
No.<br />
Permittee Name<br />
Permitted<br />
Quantity 1<br />
2002 2003 2004 2005 2006 2007 2008 2009 2010 <strong>2011</strong><br />
CMI/Family Dynamics Inc<br />
DeSoto 11124 Dimare Ruskin #2 LLC 2.259 0.046 0.036 0.023 0.000 1.470 2.179 1.491 1.560 1.314 1.769<br />
DeSoto 12814 Tiger Bay Ranch LLC 1.749 . . . 0.010 0.055 0.149 0.094 0.104 0.000 0.000<br />
DeSoto County Totals 54.828 27.185 23.018 22.185 18.265 35.576 35.162 23.266 33.911 32.144 32.734<br />
Hardee 785 Mosaic Fertilizer LLC 1.255 1.156 0.902 0.677 0.407 1.363 1.131 0.494 0.738 0.705 0.769<br />
Hardee 1809 Putnam Groves Inc 2.034 0.125 0.694 1.776 0.542 1.226 1.367 0.888 0.910 0.000 0.000<br />
Hardee 1912 V & W Farms Inc of Delray Bch 1.236 0.276 0.254 0.352 0.245 0.428 0.528 0.364 0.325 0.150 0.132<br />
Hardee 2467 Ben Hill Griffin, Inc. 1.271 0.385 0.258 0.312 0.127 0.320 0.345 0.354 0.587 0.285 0.427<br />
Hardee 2715<br />
Mosaic Fertilizer LLC and South<br />
Fort Meade Partnership LP<br />
5.097 1.575 1.093 1.361 0.704 1.775 1.762 1.670 2.168 2.226 1.876<br />
Hardee 3258<br />
South Fort Meade Partnership &<br />
Parker Farms Inc<br />
1.171 0.650 0.594 0.743 0.175 0.125 0.497 0.319 0.281 0.128 0.000<br />
Hardee 4091 Bentley‐Brahman Ranch Inc 2.518 1.125 1.303 0.905 0.491 1.604 1.270 0.707 1.369 1.614 1.380<br />
Hardee 7025 Ridge Resources Inc 1.301 0.000 0.000 0.000 0.000 0.000 0.000 0.116 0.063 0.055 0.000<br />
Hardee 10671 Mosaic Fertilizer LLC 1.208 1.348 0.554 0.838 0.459 1.012 0.835 0.852 0.747 0.800 0.507<br />
Hardee County Totals 17.091 6.639 5.652 6.964 3.151 7.853 7.735 5.765 7.189 5.963 5.090<br />
Highlands 4219 S.Y. Hartt & Son, Inc. 1.297 1.481 1.255 1.122 0.826 1.508 1.305 1.069 1.989 2.233 1.373<br />
Highlands 4679 Ben Hill Griffin, Inc. 1.593 1.103 0.941 0.969 0.690 1.049 0.949 1.008 0.999 1.455 1.364<br />
Highlands 4680 Ben Hill Griffin, Inc. 1.596 0.959 0.839 0.863 0.603 0.973 0.796 0.854 0.860 1.314 0.998<br />
Highlands 5516<br />
Wabasso Road Dairy Inc & L C<br />
Dairy Inc<br />
1.585 0.116 0.234 0.192 0.262 0.288 0.306 0.301 0.311 0.280 0.359<br />
Highlands 5638 Running W Citrus LP 1.756 1.590 1.964 1.843 1.254 2.577 1.681 1.294 1.387 1.430 1.062<br />
Highlands 5676 7l Lake Placid LLC 2.483 1.610 1.573 1.693 1.235 2.418 2.256 1.756 2.538 2.380 2.245<br />
Highlands 6031 Lake Placid Groves LLC 1.900 2.654 2.018 1.696 1.932 2.136 0.473 0.743 0.927 0.810 1.722<br />
Highlands 6197 Turner Groves Citrus LP 5.191 5.619 3.782 3.375 3.903 3.771 4.515 3.837 4.178 5.422 3.796<br />
Highlands 9302 Lake Placid Groves LLC 2.006 1.367 0.876 1.560 1.152 1.428 0.398 0.640 0.875 1.056 1.662<br />
Hillsborough 360<br />
Highlands County Totals 19.407 16.500 13.482 13.315 11.855 16.149 12.679 11.501 14.064 16.380 14.581<br />
Astin Strawberry Property<br />
<strong>Management</strong>, LLC, Trustee<br />
2.271 0.768 0.905 0.821 0.926 1.403 0.942 0.375 0.158 0.411 0.025<br />
<strong>Southwest</strong> <strong>Florida</strong> <strong>Water</strong> <strong>Management</strong> District Page | 395
<strong>2011</strong> ESTIMATED WATER USE REPORT<br />
TABLE D2. TENYEAR HISTORIC ANNUAL AVERAGE PUMPAGE (MGD) FOR AGRICULTURAL WUPS WITH ANNUAL AVERAGE QUANTITIES > 1.0 MGD<br />
County<br />
WUP<br />
No.<br />
Permittee Name<br />
Permitted<br />
Quantity 1<br />
2002 2003 2004 2005 2006 2007 2008 2009 2010 <strong>2011</strong><br />
Hillsborough 655 Farmland Reserve Inc. 1.744 0.599 0.347 0.175 0.046 0.143 0.431 0.816 0.440 0.830 0.639<br />
Hillsborough 659 Farmland Reserve Inc. 1.033 0.235 0.202 0.312 0.403 0.714 0.829 0.752 0.656 0.581 0.600<br />
Hillsborough 985 Diehl Family LP 2.328 1.502 1.545 1.103 0.788 1.226 1.395 1.545 1.443 1.297 2.224<br />
Hillsborough 1124<br />
Artesian Farms Inc/Dickman<br />
Inv. LLC/South Shore Corp Park<br />
1.445 1.691 1.777 1.845 1.393 0.954 0.622 0.441 0.457 0.430 0.332<br />
Hillsborough 1836 Rood Family LP 1.873 1.315 1.562 1.729 0.892 1.019 1.613 1.070 0.802 0.606 0.909<br />
Hillsborough 1838 Cardanell Farms 1.449 0.661 1.028 1.240 1.253 1.406 1.139 0.582 0.050 0.000 0.152<br />
Hillsborough 3417 Ag‐Mart Produce Inc 1.177 1.074 0.997 0.951 0.674 1.052 0.826 0.825 0.853 0.938 0.849<br />
Hillsborough 6371 Summerfield Farms Inc. 1.332 1.233 0.749 0.519 0.323 0.090 0.066 0.062 0.149 0.687 0.479<br />
Hillsborough 7591 Corp of the Presiding Bishop 1.037 0.167 0.105 0.613 0.473 0.644 0.560 0.410 0.402 0.378 0.467<br />
Hillsborough 8450 Farmland Reserve Inc. 1.061 0.211 0.000 0.298 0.310 0.596 0.463 0.555 0.727 0.753 0.759<br />
Hillsborough 9387 NNP Southbend II LLC 1.033 0.161 0.096 0.090 0.070 0.082 0.004 0.003 0.001 0.001 0.002<br />
Hillsborough 9489 Holmberg Farms Inc. 1.780 0.540 0.483 0.661 0.489 0.689 0.676 0.781 0.880 0.754 0.735<br />
Hillsborough 11181 Batista & Evelyn Madonia 1.591 0.269 0.204 1.067 0.486 0.946 0.552 0.830 0.748 0.534 0.388<br />
Hillsborough 12572 Mosaic Phosphates Co 1.344 . . 0.827 0.822 1.399 1.167 0.693 0.541 0.549 0.808<br />
Hillsborough County Totals 22.498 10.425 9.998 12.251 9.348 12.364 11.283 9.741 8.306 8.749 9.368<br />
Levy 5095<br />
Ray Ferrero Jr. Trustee ‐ Heirs<br />
Trust, et al<br />
2.057 0.611 0.428 0.690 0.455 1.069 1.042 0.056 0.595 0.045 0.901<br />
Levy 5122 Whitehurst Cattle Co Inc 1.030 0.011 0.000 0.000 0.000 0.000 0.000 0.000 0.057 0.025 0.068<br />
Levy 5160 Arthur Sandlin 1.123 0.248 0.191 0.140 0.089 0.220 0.178 0.111 0.131 0.137 0.290<br />
Levy 11026 C. Neal Anderson 1.485 0.124 0.060 0.059 0.053 0.348 0.263 0.095 0.478 6.715 0.076<br />
Levy 13339 Marshall Tree Farm 2.436 . . . . . . . 0.085 0.144 0.346<br />
Levy County Totals 8.131 0.994 0.678 0.890 0.597 1.636 1.483 0.262 1.347 7.066 1.682<br />
Manatee 2933<br />
Bruce E Leland S Gary L & Brent<br />
D Shackelford<br />
1.339 0.829 0.710 0.818 0.655 1.141 1.058 0.818 1.104 0.872 0.745<br />
Manatee 3837<br />
John Falkner Classie Growers<br />
LLC<br />
4.232 0.321 0.878 0.911 1.335 2.233 2.095 0.463 1.533 1.613 1.277<br />
Manatee 3847 L3 Partnership dba L3 Farms 8.224 5.837 4.977 2.876 2.531 4.570 4.524 3.770 3.973 4.258 2.266<br />
Manatee 3848 Dimare Homestead Inc 4.802 2.800 2.975 3.471 3.492 2.198 1.677 1.116 1.168 1.004 0.907<br />
Manatee 3975 Rye Bridge Road, LLC 2.054 1.687 1.172 2.039 1.872 1.894 1.410 0.877 0.993 1.650 0.719<br />
<strong>Southwest</strong> <strong>Florida</strong> <strong>Water</strong> <strong>Management</strong> District Page | 396
<strong>2011</strong> ESTIMATED WATER USE REPORT<br />
TABLE D2. TENYEAR HISTORIC ANNUAL AVERAGE PUMPAGE (MGD) FOR AGRICULTURAL WUPS WITH ANNUAL AVERAGE QUANTITIES > 1.0 MGD<br />
County<br />
WUP<br />
No.<br />
Permittee Name<br />
Permitted<br />
Quantity 1<br />
2002 2003 2004 2005 2006 2007 2008 2009 2010 <strong>2011</strong><br />
Manatee 4412 Pacific Land Ltd 3.417 1.235 0.072 0.448 0.181 0.433 0.247 0.183 0.230 0.003 0.177<br />
Manatee 4447 Batista & Evelyn Madonia 1.354 0.297 0.669 0.514 0.904 0.681 0.652 0.680 0.488 0.217 0.755<br />
Manatee 4467 John Falkner 11.278 8.995 7.694 8.487 6.970 7.707 6.362 3.594 4.327 3.244 2.654<br />
Manatee 4789<br />
Hunsader Farms Inc & Donald J<br />
Hunsader & Mdm LLC<br />
1.747 0.315 0.363 0.439 0.495 0.620 0.596 0.484 0.705 0.374 0.335<br />
Manatee 5423 <strong>Florida</strong> Power & Light Company 1.717 0.901 1.135 1.102 0.954 1.537 1.223 0.962 0.969 0.970 0.902<br />
Manatee 5461 Manatee Fruit Co 2.600 0.159 0.416 0.117 0.156 0.624 0.248 0.177 0.331 0.246 0.197<br />
Manatee 5512 G & D Farms Inc 2.002 0.257 0.126 0.125 0.130 0.413 0.894 1.027 0.851 2.230 1.197<br />
Manatee 5514 McClure Properties, Ltd 5.985 0.893 0.407 0.457 1.371 3.049 2.242 2.099 1.703 2.227 2.625<br />
Manatee 6059<br />
M Plus Ranch Inc/West <strong>Florida</strong><br />
Agro Ltd<br />
1.004 . 0.319 1.102 0.273 0.675 0.761 0.497 0.539 0.519 0.839<br />
Manatee 6077 McClure Properties, Ltd 3.078 0.640 0.063 0.559 0.668 1.366 1.428 1.265 2.075 1.295 1.642<br />
Manatee 6915 James D & Robert C Brewer 1.228 0.290 0.292 0.241 0.195 0.194 0.404 0.195 0.658 0.318 0.265<br />
Manatee 7085 Turner Groves Citrus LP 1.327 1.341 1.307 1.365 1.254 1.494 1.540 1.394 1.578 1.810 1.321<br />
Manatee 7350 Felton C Walker Jr 1.383 1.092 1.107 1.130 1.215 1.253 1.022 1.084 1.419 1.038 0.949<br />
Manatee 8420 James R Grainger II 1.266 0.812 0.527 0.646 0.530 1.189 0.918 0.962 0.981 0.783 0.959<br />
Manatee 8421 4 Star Tomato Inc 1.253 0.887 0.597 0.881 0.944 0.879 0.930 0.613 0.873 0.675 0.911<br />
Manatee 8829 Whisenant Farms Co Inc 1.278 0.620 0.599 0.642 0.529 0.839 0.713 0.766 0.737 1.034 0.976<br />
Manatee 9014 Good Grove Investments, LLC 1.815 2.049 1.393 1.073 0.646 1.777 1.626 1.297 1.817 2.315 1.265<br />
Manatee 9025<br />
John Falkner Classie Growers<br />
LLC<br />
1.461 0.769 0.757 1.041 1.073 1.205 1.120 0.758 0.273 0.509 0.641<br />
Manatee 9089 FFD Land Co Inc 2.791 0.987 1.907 1.632 1.175 1.250 1.813 0.731 1.310 1.509 1.514<br />
Manatee 9391 West <strong>Florida</strong> Agro Limited 2.779 1.242 1.070 1.445 1.678 2.030 2.067 1.767 2.270 3.290 1.288<br />
Manatee 10487 4 Star Tomato Inc 1.347 1.319 1.000 1.103 1.070 1.012 1.039 0.782 1.290 1.174 0.683<br />
Manatee 10800 Batista & Evelyn Madonia 2.388 0.599 0.239 1.156 1.095 1.705 1.446 1.462 1.538 1.354 1.369<br />
Manatee 11019 Old <strong>Florida</strong> Investments Inc 2.277 0.555 0.579 1.184 0.951 1.302 0.942 1.216 1.921 2.601 0.325<br />
Manatee 11105 Farm‐Op Inc 3.016 1.523 1.664 1.598 1.216 1.653 0.988 0.842 0.974 0.817 1.124<br />
Manatee 11123 Clay Gully Ranch, LLC 2.263 0.312 0.438 0.479 0.583 0.718 0.606 0.609 0.753 0.459 0.525<br />
Manatee 11125<br />
Edward Grady Maggard, Jr. and<br />
Lorene Maggard<br />
2.084 0.672 1.063 0.943 0.978 1.477 1.449 1.102 0.792 0.947 0.387<br />
Manatee 11167<br />
Coffee Pond LLC & Curtis Road<br />
Land Co LLC & Myakka<br />
Holdings<br />
1.281 0.000 0.007 0.196 0.000 0.000 0.000 0.000 0.000 0.000 .<br />
<strong>Southwest</strong> <strong>Florida</strong> <strong>Water</strong> <strong>Management</strong> District Page | 397
<strong>2011</strong> ESTIMATED WATER USE REPORT<br />
TABLE D2. TENYEAR HISTORIC ANNUAL AVERAGE PUMPAGE (MGD) FOR AGRICULTURAL WUPS WITH ANNUAL AVERAGE QUANTITIES > 1.0 MGD<br />
County<br />
WUP<br />
No.<br />
Permittee Name<br />
Permitted<br />
Quantity 1<br />
2002 2003 2004 2005 2006 2007 2008 2009 2010 <strong>2011</strong><br />
Manatee 11427 <strong>Water</strong>cress Farms 1.276 0.356 0.272 0.517 0.425 0.425 0.532 0.490 0.409 0.186 0.533<br />
Manatee 11536<br />
John Falkner Classie Growers<br />
LLC<br />
2.426 . 0.000 0.000 0.000 0.000 0.987 0.614 0.458 1.599 2.049<br />
Manatee 11922 Jones Potato Farm, Inc 1.483 0.262 0.060 0.646 0.818 0.763 0.536 0.539 0.588 0.506 0.369<br />
Manatee 11961 Pacific Land, Ltd 3.852 1.346 3.016 1.852 2.764 3.089 2.746 2.047 1.715 1.601 0.504<br />
Manatee 11963<br />
SCF Farms Inc, Handcart Citrus<br />
and Cattle, Inc., Harry Cortese<br />
2.502 0.650 0.332 0.392 0.376 0.679 0.093 0.225 0.105 0.742 0.512<br />
Manatee 12018 McClure Properties, Ltd 2.102 0.343 0.321 0.632 1.045 1.485 1.184 1.116 1.192 1.513 1.354<br />
Manatee 12133 W.S. Badcock Corporation 1.121 0.527 0.455 0.414 0.320 0.583 0.338 0.141 0.423 0.036 0.024<br />
Manatee 12264 John Falkner Trustee 1.398 0.000 0.000 0.000 0.462 1.155 1.117 1.118 0.834 1.383 0.660<br />
Manatee 12386 Batista & Evelyn Madonia 1.000 . . 0.448 0.749 0.801 0.800 0.886 0.214 0.175 0.676<br />
Manatee 13011<br />
John Falkner Classie Growers<br />
LLC<br />
2.524 . . . . . 0.497 0.557 0.668 1.393 1.848<br />
Manatee 13354 Hecht Manatee Properties, Ltd. 3.048 . . . . . . . 0.770 1.578 1.741<br />
Manatee 20091 Sam Wes, LLC 1.342 . . . . . . . . . 0.420<br />
Manatee County Totals 110.142 43.720 40.979 45.121 44.076 58.100 52.870 41.324 47.548 52.071 42.430<br />
Marion 2697 Charlotte Weber 1.028 . . . . . . . . . 0.327<br />
Marion 5424 J Crayton Pruitt 1.226 . 0.059 0.164 0.000 0.130 0.096 0.071 0.066 0.221 0.000<br />
Marion 11602 McGinley Family LP 1.795 . . . . . 0.000 0.071 0.249 0.157 0.286<br />
Marion County Totals 4.049 0.000 0.059 0.164 0.000 0.130 0.096 0.142 0.316 0.378 0.613<br />
Pasco 2479 Wiregrass Ranch Inc 2.801 0.176 0.049 0.114 0.089 0.155 0.154 0.163 0.252 0.190 0.231<br />
Pasco 2698<br />
Sid Larkin & Son Inc Enterprise<br />
Recycling & Disposal<br />
1.940 0.219 0.141 0.552 0.236 0.360 0.440 0.150 0.010 0.075 0.015<br />
Pasco 3391 Evans Properties Inc 1.044 0.395 0.365 0.248 0.215 0.531 0.577 0.301 0.588 0.822 0.507<br />
Pasco 3468<br />
Bexley Land Trust‐SC Bexley Jr‐<br />
LSB Corp‐NNP Bexley Ltd<br />
2.981 0.000 0.000 0.000 0.000 0.000 0.104 0.085 0.062 0.001 0.015<br />
Pasco County Totals 8.766 0.790 0.555 0.914 0.540 1.046 1.275 0.699 0.912 1.088 0.768<br />
Polk 1693 Clear Springs Land Co LLC 1.049 0.000 . . 0.000 0.037 0.127 0.151 0.014 0.005 0.000<br />
Polk 3842 Sun Grown Citrus LP 1.082 1.412 1.158 1.011 0.855 1.476 1.461 1.359 1.215 1.426 1.266<br />
Polk 4376 Alcoma Caretaking LLC 1.008 2.310 1.227 0.745 0.315 1.011 0.831 0.737 0.969 1.086 0.688<br />
<strong>Southwest</strong> <strong>Florida</strong> <strong>Water</strong> <strong>Management</strong> District Page | 398
<strong>2011</strong> ESTIMATED WATER USE REPORT<br />
TABLE D2. TENYEAR HISTORIC ANNUAL AVERAGE PUMPAGE (MGD) FOR AGRICULTURAL WUPS WITH ANNUAL AVERAGE QUANTITIES > 1.0 MGD<br />
County<br />
WUP<br />
No.<br />
Permittee Name<br />
Permitted<br />
Quantity 1<br />
2002 2003 2004 2005 2006 2007 2008 2009 2010 <strong>2011</strong><br />
Polk 4559 Ben Hill Griffin, Inc. 1.226 0.966 0.870 0.739 0.634 0.917 0.637 0.607 0.670 0.959 0.774<br />
Polk 6026 7l Camp Mack LLC 1.448 0.987 1.240 1.132 0.481 1.221 1.278 1.121 1.187 1.116 0.931<br />
Polk 6068 Rolling Meadow Ranch Inc 1.433 2.413 1.402 1.917 0.828 2.282 1.888 1.588 1.154 1.193 0.878<br />
Polk County Totals 7.245 8.088 5.895 5.544 3.113 6.944 6.221 5.563 5.209 5.785 4.538<br />
Sarasota 3755 Mabry Carlton Ranch Inc 4.261 0.486 0.226 0.209 0.159 0.332 0.102 0.062 0.119 0.163 0.097<br />
Sarasota 3764 Longino Ranch Inc 1.219 0.082 0.078 0.050 0.034 0.147 0.366 0.194 0.241 0.110 0.079<br />
Sarasota 3845 Jerry Flint,Cecil Daughtrey Jr 1.536 0.000 0.000 0.000 0.000 0.000 0.000 0.000 . . .<br />
Sarasota 3872 Fourth Quarter Properties XXXII 2.459 0.283 0.124 0.065 0.007 0.000 0.336 0.178 0.722 0.001 0.000<br />
Sarasota 3873 Schwartz Farms Inc 2.190 1.568 0.888 0.413 1.100 1.499 1.067 0.792 0.468 0.677 0.333<br />
Sarasota 4087 L T Partners LLLP 1.128 0.072 0.000 0.000 0.000 0.000 0.117 0.243 0.131 0.116 0.826<br />
Sarasota 4387 Javier Vargas 3.884 0.002 0.019 0.001 1.175 0.639 0.898 0.820 0.767 0.655 0.991<br />
Sarasota County Totals 16.676 2.494 1.335 0.738 2.475 2.618 2.886 2.288 2.449 1.721 2.327<br />
Sumter 2180 Lee Capital LP & SR 44 LC 1.026 . . . . . . . 0.001 0.001 0.002<br />
Sumter 3534<br />
<strong>Florida</strong> Fish & Wildlife<br />
Conservation Commission<br />
1.901 0.683 0.641 0.432 0.256 0.678 0.956 0.792 0.654 2.123 1.610<br />
Sumter County Totals 2.927 0.683 0.641 0.432 0.256 0.678 0.956 0.792 0.654 2.123 1.612<br />
District Agricultural Totals 286.392 123.083 106.856 112.582 96.355 148.691 140.083 106.538 128.972 140.498 121.806<br />
Source: <strong>Estimated</strong> <strong>Water</strong> <strong>Use</strong> Tables derived from the WMIS WUP database, <strong>2011</strong>.<br />
Permits that were included in the 2010 list have been removed from this list if they were modified to be less than 1.0 MGD on an annual average basis.<br />
Permits that were in "Inactive" status on December 31, <strong>2011</strong> will not be listed.<br />
1 “Permitted" represents the total daily average quantity (mgd) permitted by the District as of <strong>2011</strong><br />
2 When no pumpage has been reported by a permittee during the year, " . " is shown.<br />
<strong>Southwest</strong> <strong>Florida</strong> <strong>Water</strong> <strong>Management</strong> District Page | 399
<strong>2011</strong> ESTIMATED WATER USE REPORT<br />
TABLE D3. TENYEAR HISTORIC ANNUAL AVERAGE WATER PUMPAGE (MGD) FOR MINING/DEWATERING WUPS WITH ANNUAL AVERAGE<br />
QUANTITIES > 1.0 MGD<br />
County WUP No. Permittee Name<br />
Permitted<br />
Quantity1<br />
2002 2003 2004 2005 2006 2007 2008 2009 2010 <strong>2011</strong><br />
Hardee<br />
Hernando<br />
Manatee<br />
3669<br />
215<br />
3740<br />
CF Industries Inc 6.392 0.796 1.640 0.052 0.282 1.525 3.660 4.707 2.252 0.176 0.333<br />
Cemex Construction Materials 6.785 5.568 3.646 8.248 5.194 6.913 4.396 2.914 3.002 3.616 4.637<br />
Mosaic Fertilizer LLC 6.410 0.318 0.151 0.660 4.076 0.566 3.197 4.540 4.881 3.434 3.539<br />
Polk 29 Mosaic Fertilizer LLC 11.486 4.597 4.314 2.720 0.711 0.996 4.828 4.769 3.720 4.548 3.343<br />
Polk 2297 Mosaic Fertilizer LLC 17.864 4.747 0.695 2.669 1.713 2.843 4.552 7.667 4.808 0.244 0.254<br />
4857 Standard Sand & Silica<br />
Polk<br />
1.181 2.144 1.567 16.460 9.970 0.097 0.929 0.718 0.619 0.994 1.196<br />
Company<br />
Polk 11400 Mosaic Fertilizer LLC 51.475 25.641 34.207 30.416 30.914 22.367 24.067 16.806 13.525 13.052 9.285<br />
Polk County Totals 82.006 37.129 40.784 52.264 43.309 26.303 34.376 29.960 22.672 18.839 14.078<br />
District Mining/Dewatering Totals 101.593 43.812 46.220 61.224 52.860 35.307 45.629 42.121 32.806 26.065 22.587<br />
Source: <strong>Estimated</strong> <strong>Water</strong> <strong>Use</strong> Tables derived from the WMIS WUP database, <strong>2011</strong>.<br />
Permits that were included in the 2010 list have been removed from this list if they were modified to be less than 1.0 MGD on an annual average basis.<br />
Permits that were in "Inactive" status on December 31, <strong>2011</strong> will not be listed.<br />
1 “Permitted" represents the total daily average quantity (mgd) permitted by the District as of <strong>2011</strong><br />
<strong>Southwest</strong> <strong>Florida</strong> <strong>Water</strong> <strong>Management</strong> District Page | 400
<strong>2011</strong> ESTIMATED WATER USE REPORT<br />
TABLE D4. TENYEAR HISTORIC ANNUAL AVERAGE PUMPAGE (MGD) FOR INDUSTRIAL/COMMERCIAL WUPS WITH ANNUAL AVERAGE QUANTITIES > 1.0<br />
MGD<br />
County WUP No. Permittee Name<br />
Permitted<br />
Quantity 1<br />
2002 2003 2004 2005 2006 2007 2008 2009 2010 <strong>2011</strong><br />
Citrus 3672<br />
Citrus 4695<br />
<strong>Florida</strong> Power Corp dba Progress<br />
Energy<br />
<strong>Florida</strong> Power Corp dba Progress<br />
Energy<br />
Citrus County Totals<br />
4.309 0.821 0.976 0.833 0.893 0.959 0.928 1.010 1.061 2.327 2.800<br />
1.000 0.671 0.726 0.672 0.715 0.708 0.762 0.852 0.873 0.628 0.462<br />
Hardee 9731 Hardee Power Partners 3.800 1.183 1.028 1.006 0.804 1.081 1.685 1.570 1.551 1.265 1.538<br />
Hernando 7015 <strong>Florida</strong> Crushed Stone Co 20.080 8.077 6.351 3.945 3.565 4.510 4.411 4.231 3.522 4.466 2.586<br />
Hillsborough 1415<br />
CF Industries Inc Plant City<br />
Phosphate Complex<br />
4.240 2.096 1.965 2.064 2.052 2.109 2.491 2.668 2.417 2.811 2.526<br />
Hillsborough 1532 Mosaic Fertilizer LLC 5.985 4.446 4.625 3.842 3.451 3.512 3.724 3.385 2.878 2.642 2.855<br />
Hillsborough 1960 University of South <strong>Florida</strong> 2.364 1.634 1.432 1.465 1.961 1.865 1.868 1.374 1.580 1.498 1.321<br />
Hillsborough 3118 Kerry I & F Contracting Co 3.050 1.743 1.350 0.977 1.370 1.482 1.900 1.855 1.346 1.817 2.031<br />
Hillsborough County Totals 15.639 9.918 9.372 8.347 8.834 8.968 9.984 9.282 8.221 8.768 8.733<br />
Manatee 5302 <strong>Florida</strong> Power & Light Company 8.519 15.066 0.086 6.223 1.125 5.436 5.092 7.185 8.058 0.000 4.780<br />
Pasco 451 Tanler <strong>Water</strong> Company 3.514 2.998 3.778 2.438 1.032 0.627 0.353 0.220 0.133 0.172 0.133<br />
Polk 47 City of Lakeland 2.592 1.418 1.334 1.210 1.388 1.387 1.373 1.253 0.947 0.912 0.863<br />
Polk 408 Citrus World Inc 2.183 1.763 1.906 1.571 1.556 1.682 1.592 1.592 1.427 1.321 1.485<br />
Polk 438 US Agri‐Chemicals Corporation 9.150 4.048 6.493 6.385 5.500 5.547 7.571 8.823 9.018 8.697 7.781<br />
Polk 493 Cutrale Citrus Juices USA Inc 2.500 1.495 1.595 1.259 1.224 1.521 1.038 1.258 1.159 1.124 1.213<br />
Polk 610 CF Industries Inc 1.665 1.855 1.773 2.050 1.164 0.935 0.617 0.533 0.384 0.454 0.118<br />
Polk 1539 Mosaic Fertilizer LLC 7.504 4.610 4.090 3.718 2.639 1.166 0.897 1.123 0.643 0.894 1.247<br />
Polk 2224 Mosaic Fertilizer LLC 5.197 4.223 4.197 4.599 4.663 5.794 4.052 3.983 4.609 4.156 3.796<br />
<strong>Southwest</strong> <strong>Florida</strong> <strong>Water</strong> <strong>Management</strong> District Page | 401
<strong>2011</strong> ESTIMATED WATER USE REPORT<br />
TABLE D4. TENYEAR HISTORIC ANNUAL AVERAGE PUMPAGE (MGD) FOR INDUSTRIAL/COMMERCIAL WUPS WITH ANNUAL AVERAGE QUANTITIES > 1.0<br />
MGD<br />
County WUP No. Permittee Name<br />
Permitted<br />
Quantity 1<br />
2002 2003 2004 2005 2006 2007 2008 2009 2010 <strong>2011</strong><br />
Polk 3195 Mosaic Fertilizer 1.991 0.140 0.495 0.689 0.956 0.569 0.551 0.569 0.146 0.196 0.023<br />
Polk 5798 Publix Super Markets Inc. 1.441 0.650 1.005 1.037 1.134 1.053 0.985 1.041 1.006 1.034 1.005<br />
Polk 10604 Auburndale Power Partners LP 1.326 1.011 1.019 0.853 0.615 0.655 0.686 0.669 0.663 0.628 0.654<br />
Polk 10840<br />
<strong>Florida</strong> Power Corp & US Agri<br />
Chemicals Corp<br />
1.700 0.933 0.961 0.765 0.618 0.972 0.725 0.488 0.831 0.845 1.007<br />
Polk 10944 Progress Energy <strong>Florida</strong> 17.500 . 2 . . . . . . 1.742 3.373 4.594<br />
Polk 11747 Tampa Electric Co 6.400 2.230 1.136 1.211 1.326 2.894 3.125 2.211 2.188 1.390 1.338<br />
Polk 12054<br />
Calpine Construct Finance Co LP<br />
Osprey Energy Center<br />
2.742 . 0.001 1.157 1.355 1.528 1.736 1.407 1.574 1.339 1.683<br />
Polk 12232 Citrosuco North America 1.251 0.689 1.116 1.110 1.005 1.253 1.039 1.073 1.204 1.314 1.345<br />
Polk County Totals 65.142 25.065 27.122 27.616 25.143 26.955 25.987 26.022 27.540 27.676 28.153<br />
District Industrial/Commercial Totals 122.004 63.800 49.440 51.081 42.110 49.244 49.201 50.372 50.960 45.302 49.184<br />
Source: <strong>Estimated</strong> <strong>Water</strong> <strong>Use</strong> Tables derived from the WMIS WUP database, <strong>2011</strong>.<br />
Permits that were included in the 2010 list have been removed from this list if they were modified to be less than 1.0 MGD on an annual average basis.<br />
Permits that were in "Inactive" status on December 31, <strong>2011</strong> will not be listed.<br />
1 “Permitted" represents the total daily average quantity (mgd) permitted by the District as of <strong>2011</strong><br />
2 When no pumpage has been reported by a permittee during the year, " . " is shown.<br />
<strong>Southwest</strong> <strong>Florida</strong> <strong>Water</strong> <strong>Management</strong> District Page | 402
<strong>2011</strong> ESTIMATED WATER USE REPORT<br />
TABLE D5. TENYEAR HISTORIC ANNUAL AVERAGE PUMPAGE (MGD) FOR RECREATION/AESTHETIC PERMITS WITH ANNUAL AVERAGE QUANTITIES ><br />
1.0 MGD<br />
County<br />
WUP<br />
No.<br />
Citrus 7805<br />
Permittee Name<br />
Hampton Hills<br />
Partnership<br />
Permitted<br />
Quantity1<br />
2002 2003 2004 2005 2006 2007 2008 2009 2010 <strong>2011</strong><br />
1.229 0.487 0.579 0.701 0.807 1.098 0.848 1.040 1.039 1.132 1.142<br />
Hillsborough 2320<br />
Seaworld Parks &<br />
Entertainment, LLC<br />
1.810 1.872 1.112 1.727 1.522 1.409 1.372 1.356 1.416 1.194 1.329<br />
Hillsborough 6092 Clublink US Corporation 2.470 2.092 0.879 1.349 1.769 2.384 1.957 1.780 1.750 1.709 1.485<br />
Hillsborough County Totals 4.280 3.964 1.991 3.076 3.292 3.793 3.329 3.137 3.166 2.903 2.813<br />
Manatee 4443 Harbourvest LLC 2.753 0.444 0.453 0.835 0.928 0.983 1.473 1.090 1.509 1.636 1.120<br />
Manatee 7846<br />
Pinellas 7437<br />
Schroeder‐Manatee Ranch<br />
Inc<br />
16.793 5.036 4.900 5.084 4.047 4.504 6.258 6.142 5.959 5.088 7.645<br />
Manatee County Totals 19.546 5.481 5.353 5.919 4.975 5.487 7.732 7.232 7.469 6.724 8.765<br />
Club Corp Golf of <strong>Florida</strong><br />
LLC<br />
1.300 0.312 0.220 0.159 0.126 0.149 0.163 0.032 0.049 0.048 0.057<br />
Polk 143 Mountain Lake Corp 3.380 2.436 0.865 1.403 0.381 1.056 2.037 2.369 3.046 2.746 2.046<br />
Sarasota 6364<br />
Advanced <strong>Management</strong><br />
Inc<br />
1.275 1.095 0.491 0.922 0.742 1.264 1.331 0.785 1.103 0.946 0.934<br />
Sarasota 12772 Divosta LP 1.092 . . . 0.000 0.006 0.000 0.063 0.315 0.265 0.361<br />
Sarasota County Totals 2.367 1.095 0.491 0.922 0.742 1.270 1.331 0.848 1.418 1.211 1.294<br />
District Recreation/Aesthetic Totals 33.445 14.607 10.140 12.516 10.764 13.909 16.473 15.670 17.286 15.719 17.139<br />
DISTRICT GRAND TOTALS 1277.590 709.387 682.396 738.102 788.804 797.277 800.026 709.156 774.565 702.477 682.499<br />
Source: <strong>Estimated</strong> <strong>Water</strong> <strong>Use</strong> Tables derived from the WMIS WUP database, <strong>2011</strong>.<br />
Permits that were included in the 2010 list have been removed from this list if they were modified to be less than 1.0 MGD on an annual average basis.<br />
Permits that were in "Inactive" status on December 31, <strong>2011</strong> will not be listed.<br />
1 “Permitted" represents the total daily average quantity (mgd) permitted by the District as of <strong>2011</strong><br />
2 When no pumpage has been reported by a permittee during the year, " . " is shown.<br />
Note: WUP No. 11558 is removed from this list because it is for environmental augmentation associated with public supply use.<br />
<strong>Southwest</strong> <strong>Florida</strong> <strong>Water</strong> <strong>Management</strong> District Page | 403
<strong>2011</strong> ESTIMATED WATER USE REPORT<br />
TABLE D6. TENYEAR HISTORIC PUBLIC SUPPLY UNADJUSTED GROSS PER CAPITA WATER USE (GPD/PERSON)<br />
County of <strong>Use</strong><br />
WUP<br />
Number<br />
Permittee Name<br />
<strong>2011</strong><br />
Service Area<br />
Population<br />
Calendar Year<br />
2002 2003 2004 2005 2006 2007 2008 2009 2010 <strong>2011</strong><br />
CHARLOTTE 718 Gasparilla Island <strong>Water</strong> Assn Inc 5,658 251 251 287 280 309 248 245 295 169 182<br />
CHARLOTTE 871 City of Punta Gorda, f 36,305 129 127 139 118 136 138 111 113 118 115<br />
CHARLOTTE 1512 Charlotte Harbor <strong>Water</strong> Assoc Inc 4,380 71 70 68 76 71 77 72 81 79 80<br />
CHARLOTTE 3522 Fl <strong>Water</strong> Services/Burnt Store 6,153 73 88 99 91 82 72 67 64 60 65<br />
CHARLOTTE 7104 PR/MRWSA/Port Charlotte 119,992 118 106 111 105 88 77 . 73 76 75<br />
CHARLOTTE 7768 Island Harbor Bch Club Ltd / Knight Island 460 . 124 124 96 95 111 116 116 82 154<br />
CITRUS 207 City of Crystal River, 6,138 214 223 219 203 212 106 104 120 108 127<br />
CITRUS 419 City of Inverness, 24,309 127 181 147 137 194 175 157 154 124 47<br />
CITRUS 1118 Floral City <strong>Water</strong> Assoc Inc. 4,716 . 60 63 51 54 56 50 64 62 55<br />
CITRUS 2842 Fl <strong>Water</strong> Serv/Citrus Sprgs/Pine Ridge 17,737 161 136 175 180 209 198 163 155 158 149<br />
CITRUS 4153 Rolling Oaks Utilities, Inc. 11,395 185 176 191 165 198 163 131 129 140 153<br />
CITRUS 4406 Homosassa Special <strong>Water</strong> District 5,329 170 112 140 136 134 130 120 165 127 145<br />
CITRUS 6691 Gulf Highway Land Corporation 524 . . . . . . . 118 368 185<br />
CITRUS 7121 Citrus Co.& WRWSA / Meadowcrest 25,560 200 206 159 196 237 181 191 143 180 158<br />
CITRUS 7879 Fla Gov't Utility / Oak Forest 446 . 121 115 111 130 118 91 70 69 85<br />
CITRUS 9791 Fl <strong>Water</strong> Services/Sugarmill 10,877 199 155 199 233 296 267 205 214 182 221<br />
CITRUS 11839 Walden Woods Ltd 1,073 . . 170 174 213 225 142 140 362 147<br />
CITRUS 20230 Ozello <strong>Water</strong> Association Inc 3,956 NA NA NA NA NA NA NA NA NA 117<br />
DESOTO 4725 City of Arcadia 8,357 148 152 155 108 105 102 98 76 84 98<br />
HARDEE 30 City of Bowling Green 4,818 . 81 100 92 96 79 76 59 56 52<br />
HARDEE 4461 City of Wauchula 6,206 189 190 204 139 147 128 126 120 105 65<br />
HARDEE 7658 Town of Zolfo Springs, 2,530 . 137 129 135 132 138 141 128 67 59<br />
HARDEE 13026 Hardee County BOCC 796 . . . . . . . 48 56 75<br />
HERNANDO 2179 Hernando Co. Utilities Dept / Dogwood 739 . 180 180 . . . 164 125 131 141<br />
HERNANDO 2983 Hernando Co Utilities Dept / West 126,040 150 144 171 168 185 168 154 159 140 145<br />
HERNANDO 5789 Hernando Co Utilities Dept / East & H. N. D. 7,784 . 126 137 147 148 141 131 114 121 127<br />
HERNANDO 7627 City of Brooksville 14,710 130 120 110 116 115 95 94 92 98 84<br />
HERNANDO 1<strong>2011</strong> Hernando Co Utilities Dept 50 NA NA NA NA NA NA NA NA NA 160<br />
<strong>Southwest</strong> <strong>Florida</strong> <strong>Water</strong> <strong>Management</strong> District Page | 404
<strong>2011</strong> ESTIMATED WATER USE REPORT<br />
TABLE D6. TENYEAR HISTORIC PUBLIC SUPPLY UNADJUSTED GROSS PER CAPITA WATER USE (GPD/PERSON)<br />
County of <strong>Use</strong><br />
WUP<br />
Number<br />
Permittee Name<br />
<strong>2011</strong><br />
Service Area<br />
Population<br />
Calendar Year<br />
2002 2003 2004 2005 2006 2007 2008 2009 2010 <strong>2011</strong><br />
HIGHLANDS 4167 Aqua Utilities, Lake Josephine 1,374 . 40 62 107 117 72 60 60 . 90<br />
HIGHLANDS 4492 (2) City of Sebring 33,229 113 99 101 100 89 102 102 100 105 99<br />
HIGHLANDS 4980 Lake Placid Holding Company 4,377 . 97 93 85 88 84 88 76 74 66<br />
HIGHLANDS 5270 Town of Lake Placid 3,168 158 148 155 140 137 138 141 159 130 140<br />
HIGHLANDS 5786 (1) City Of Avon Park / Sebring Ridge NA . 70 84 69 79 71 71 71 . .<br />
HIGHLANDS 6029 City of Avon Park 19,065 164 110 97 98 113 107 103 99 108 89<br />
HIGHLANDS 6326 Highlands Co. / Tomoka Heights 2,352 . 63 65 68 76 74 83 83 75 68<br />
HIGHLANDS 7139 Buttonwood Bay Utilities 1,610 . 117 103 113 113 81 63 79 94 108<br />
HIGHLANDS 7704 Country Club Utilities, Inc. 897 . 342 256 320 332 235 221 210 277 285<br />
HIGHLANDS 7811 (1) Mink Assoc / Crystal Lake Club NA . 168 141 159 182 142 134 134 . .<br />
HIGHLANDS 9490 LP Utilities Inc 729 . 137 95 101 110 47 103 95 74 67<br />
HIGHLANDS 9516 (2) Sebring Land, Highlands Ridge Assoc. NA . 188 200 163 200 186 190 190 . .<br />
HIGHLANDS 11609 Highlands Co BOCC / Highway Park 902 . . . . . . . 78 73 52<br />
HIGHLANDS 13099 (3) Sun‐N‐Lake Of Sebring Impr. District 7,060 96 152 161 171 198 . . 84 86 79<br />
HIGHLANDS 13367 Silver Lakes Utilities 104 . . . . . . . 99 108 115<br />
HILLSBOROUGH 450 City of Temple Terrace 30,465 120 111 117 118 126 116 107 108 99 108<br />
HILLSBOROUGH 1776 City of Plant City 38,497 161 153 169 170 170 166 162 137 128 128<br />
HILLSBOROUGH 2062 City of Tampa 587,684 120 106 122 122 122 120 117 101 106 110<br />
HILLSBOROUGH 2285 Davpam MHP / Springer, Charles E. 1,135 . 65 77 95 97 99 105 102 100 101<br />
HILLSBOROUGH 2707 Eastlake <strong>Water</strong> Service, Inc. 2,975 . 96 103 108 115 79 76 76 68 42<br />
HILLSBOROUGH 4352 Tampa Bay <strong>Water</strong>/S. Central Hills. NA 117 101 104 114 107 110 108 108 NA NA<br />
HILLSBOROUGH 4757 Wilder Corporation / Hawaiian Isles 1,422 116 90 93 93 73 107 107 60 15<br />
HILLSBOROUGH 6879 C W Utility Systems LLC 2,023 . 69 77 69 75 69 93 95 104 99<br />
HILLSBOROUGH 7002 Hometown America / Featherock MHP 916 . 117 112 102 118 91 81 81 . 102<br />
HILLSBOROUGH 7637 CAX Riverside LLC 1,036 . 363 249 115 265 130 141 141 669 212<br />
HILLSBOROUGH 7790 Paradise Village / Uniprop Income Fund II 1,087 . 73 56 51 62 57 50 50 87 48<br />
HILLSBOROUGH 10443 Windemere Utility Company 2,732 . 108 116 121 135 115 112 94 93 114<br />
HILLSBOROUGH 12994 Pebble Creek Utilities 3,468 . . . . . . . 117 . 122<br />
<strong>Southwest</strong> <strong>Florida</strong> <strong>Water</strong> <strong>Management</strong> District Page | 405
<strong>2011</strong> ESTIMATED WATER USE REPORT<br />
TABLE D6. TENYEAR HISTORIC PUBLIC SUPPLY UNADJUSTED GROSS PER CAPITA WATER USE (GPD/PERSON)<br />
County of <strong>Use</strong><br />
WUP<br />
Number<br />
Permittee Name<br />
<strong>2011</strong><br />
Service Area<br />
Population<br />
Calendar Year<br />
2002 2003 2004 2005 2006 2007 2008 2009 2010 <strong>2011</strong><br />
HILLSBOROUGH 20141 Hillsborough County NW 534,982 114 99 104 103 102 106 105 105 92 95<br />
LEVY 5640 City of Williston 3,236 175 140 159 151 151 141 139 140 140 149<br />
LEVY 7755 Town of Yankeetown 870 . 105 113 101 103 175 101 79 44 59<br />
LEVY 8953 Town of Inglis 1,501 . 80 146 104 98 101 109 110 87 100<br />
MANATEE 5387 Manatee County / Lake Manatee 358,845 131 125 121 123 113 106 97 91 89 73<br />
MANATEE 6392 City of Bradenton 62,913 114 104 106 105 106 110 102 99 97 84<br />
MANATEE 10963 Longboat Key 16,810 148 99 91 80 81 80 100 84 98 99<br />
MANATEE 12443 City of Palmetto 16,987 124 109 113 110 116 114 98 98 73 74<br />
MARION 377 (4) Marion Co Utilities / S Glen & Marion Oaks 18,963 . . . . . . . 137 132 89<br />
MARION 1156 On Top Of The World Inc. 9,294 248 234 227 238 345 309 243 195 214 309<br />
MARION 2841 (4) Marion Co Utilities / Marion Oaks NA 103 95 116 127 140 . . . . .<br />
MARION 2999 Marion Utilities Inc 1,090 . . . . . . . 150 120 88<br />
MARION 4257 Rainbow Springs Utilities LC 5,824 . 145 208 235 295 261 267 244 290 129<br />
MARION 5643 Utilities, Inc. of <strong>Florida</strong> / Golden Hills 1,076 . 86 97 89 108 106 101 152 126 172<br />
MARION 6151 Marion County Utilities Dept 16,718 190 72 134 260 289 207 177 177 177 160<br />
MARION 6792 Saddle Oaks / Sun Communities 747 . 138 134 166 168 140 164 175 142 150<br />
MARION 7849 Marion Utilities Inc. 1,282 . . . . . . . 172 159 125<br />
MARION 8005 Century ‐ Fairfield Village Ltd 755 . . 197 237 240 142 104 104 116 89<br />
MARION 8020 Marion Landings Homeowners Assoc. 1,107 . 152 162 149 174 148 140 143 133 167<br />
MARION 8165 Marion Co Util /Quail Meadow, A. Farms 1,293 . 269 513 250 200 139 114 114 133 84<br />
MARION 8339 City of Dunnellon 1,843 . 157 140 105 115 129 149 149 53 163<br />
MARION 8481 Marion Utilities Inc / Spruce Creek 5,369 . . . . . . . 223 110 117<br />
MARION 9360 Windstream Utilities Company 2,110 . 698 859 436 333 278 250 250 233 263<br />
MARION 11752 Marion County Utilities / Golden Ocala 211 . . . . . . . 792 434 479<br />
MARION 12218 Marion Co. Util. / Spruce Creek Pres 1,250 . 168 164 318 334 231 192 192 219 NA<br />
PASCO 266 (5) Pasco Co. Utilities./ W / SC / SE Systems. ** . 125 110 112 117 132 124 127 . . .<br />
PASCO 279 Aqua Utilities <strong>Florida</strong>, Inc. / Jasmine 3,311 . 91 67 72 97 81 82 77 87 75<br />
<strong>Southwest</strong> <strong>Florida</strong> <strong>Water</strong> <strong>Management</strong> District Page | 406
<strong>2011</strong> ESTIMATED WATER USE REPORT<br />
TABLE D6. TENYEAR HISTORIC PUBLIC SUPPLY UNADJUSTED GROSS PER CAPITA WATER USE (GPD/PERSON)<br />
County of <strong>Use</strong><br />
WUP<br />
Number<br />
Permittee Name<br />
<strong>2011</strong><br />
Service Area<br />
Population<br />
Calendar Year<br />
2002 2003 2004 2005 2006 2007 2008 2009 2010 <strong>2011</strong><br />
PASCO 540 Holiday Gardens Utilities, Inc. 991 . 87 86 89 89 92 84 84 86 67<br />
PASCO 543 Crestridge Utility Corp 1,325 . 69 73 74 80 80 68 68 73 58<br />
PASCO 590 Mad Hatter Utilities 7,364 . 154 153 189 189 177 . 188 113 117<br />
PASCO 964 C S <strong>Water</strong> Company Inc 869 . . . . . . . 130 98 87<br />
PASCO 1631 City of Dade City 11,164 120 116 121 120 122 118 118 117 123 116<br />
PASCO 2043 Orangewood Lakes Mobile Home 1,040 . 73 82 81 94 80 87 87 28 46<br />
PASCO 2978 Lindrick Service Corporation 5,711 . 65 81 81 87 73 77 72 112 108<br />
PASCO 3182 FGUA / Seven Springs 29,198 121 96 102 96 113 107 113 115 113 95<br />
PASCO 3590 Utilities Inc of <strong>Florida</strong> / Buena Vista MHP 2,130 . 59 58 56 52 54 55 43 44 59<br />
PASCO 3668 Utilities Inc of <strong>Florida</strong> / Summertree 3,148 . 62 72 72 68 80 77 70 69 53<br />
PASCO 3677 Colonial Manor Utility Company 1,593 . 51 44 47 56 37 79 65 67 55<br />
PASCO 3692 City of Port Richey 14,719 115 104 92 98 95 112 86 68 88 53<br />
PASCO 4550 City of San Antonio 1,309 . 132 147 148 171 155 147 147 101 124<br />
PASCO 4668 Utilities, Inc. of Fl / Orangewood 1,762 . 78 78 73 76 62 50 47 71 49<br />
PASCO 4669 Hudson <strong>Water</strong> Works Inc. 6,881 98 86 95 90 91 84 81 90 99 92<br />
PASCO 4734 City of New Port Richey 31,100 106 98 96 99 103 101 97 84 88 89<br />
PASCO 6028 (5) Pasco Co Utilities / Forest Hills NA . 81 75 . . . . . . .<br />
PASCO 6040 City of Zephyrhills 21,738 119 115 123 127 124 107 98 115 119 112<br />
PASCO 6867 Labrador Utilities Inc. 1,631 . 49 49 38 35 33 44 42 40 40<br />
PASCO 7299 L W V Utilities Inc 889 . . . . . . . 109 156 85<br />
PASCO 7999 FGUA / Angus Valley 1,914 . 98 87 81 87 89 103 65 64 64<br />
PASCO 8417 FGUA / Aloha Gardens 7,307 . 45 48 46 48 43 52 38 60 49<br />
PASCO 8491 Parrish Properties V LLC 958 . . . . . . . 40 64 23<br />
PASCO 11863 (5) Pasco Co Utilities ‐ W/ SC / SE Systems 212,260 . . . . . . . 117 121 129<br />
PINELLAS 742 City of Tarpon Springs 30,355 155 112 116 109 109 107 99 93 112 72<br />
PINELLAS 2980 City of Dunedin 39,910 104 108 108 106 102 96 92 85 81 83<br />
PINELLAS 2981 City of Clearwater 122,709 95 83 83 84 89 81 101 95 92 87<br />
PINELLAS 7692 City of Belleair 6,013 187 184 184 185 198 199 125 106 171 121<br />
<strong>Southwest</strong> <strong>Florida</strong> <strong>Water</strong> <strong>Management</strong> District Page | 407
<strong>2011</strong> ESTIMATED WATER USE REPORT<br />
TABLE D6. TENYEAR HISTORIC PUBLIC SUPPLY UNADJUSTED GROSS PER CAPITA WATER USE (GPD/PERSON)<br />
County of <strong>Use</strong><br />
WUP<br />
Number<br />
Permittee Name<br />
<strong>2011</strong><br />
Service Area<br />
Population<br />
Calendar Year<br />
2002 2003 2004 2005 2006 2007 2008 2009 2010 <strong>2011</strong><br />
PINELLAS 10350 Utilities Inc of Fl / Lake Tarpon 826 . 54 54 52 47 34 38 28 28 61<br />
PINELLAS 10795 City of Gulfport 14,393 . 79 78 78 79 76 85 67 64 68<br />
PINELLAS 11218 City of Oldsmar 15,369 105 96 89 82 82 82 80 92 91 89<br />
PINELLAS 11245 City of Safety Harbor 15,316 138 135 124 119 141 108 . 115 92 88<br />
PINELLAS 12351 City of Pinellas Park 74,767 78 54 58 59 64 105 61 63 64 57<br />
PINELLAS 20142 Pinellas County 466,139 82 81<br />
PINELLAS 20143 City of St. Petersburg 271,838 . 90 91 99 99 98 93 84 79 96<br />
POLK 143* Mountain Lake Corp. NA . 213 245 269 304 311 335 434 464 *<br />
POLK 341 City of Bartow 21,395 203 165 167 157 159 142 139 124 84 109<br />
POLK 645 City of Fort Meade 5,659 97 119 124 104 121 102 98 98 101 96<br />
POLK 1616 Lake Region Mobile Home Owners 666 . 53 77 72 71 57 54 54 83 143<br />
POLK 1625 Four Lakes Golf Club Ltd 1,494 . 205 135 151 222 238 236 144 199 280<br />
POLK 2332 Town of Lake Hamilton, 1,712 . 142 152 126 128 199 163 128 123 128<br />
POLK<br />
2449* Sweetwater East / Lake Henry NA . 154 115 100 115 123 123 148 . *<br />
POLK 3415 Orchid Springs Develop. Corp 910 . 110 121 123 139 100 109 74 59 78<br />
POLK 4005 Park <strong>Water</strong> Co / Crooked Lake 2,544 . 99 90 108 134 142 125 90 89 90<br />
POLK 4279 (6) City of Winter Haven / Garden Grove . 185 121 102 . . . . . . .<br />
POLK 4607 (6) City of Winter Haven 67,066 141 141 158 149 153 147 135 128 127 126<br />
POLK 4658 City of Lake Wales 20,909 136 144 149 128 125 139 143 143 128 122<br />
POLK 4912 City of Lakeland 167,777 155 131 139 141 149 133 136 132 121 127<br />
POLK 5251 Grenelefe Resort LLC 1,872 398 274 266 273 252 119 316 388 647 529<br />
POLK 5750 City of Davenport 4,929 126 125 137 118 161 189 147 129 47 91<br />
POLK 5870 City of Frostproof 2,983 274 254 232 184 234 185 162 160 88 110<br />
POLK 5893 Town of Dundee, 5,048 150 132 139 126 170 137 144 144 116 59<br />
POLK 6124 City of Mulberry 4,826 139 90 84 85 92 81 74 89 89 94<br />
POLK 6174 Saddlebag Lake Owners Assn. Inc. 1,340 . 38 54 50 62 58 132 132 69 62<br />
POLK 6505 Polk Co. / Northwest Regional Serv. Area 30,534 139 135 142 132 158 130 116 116 107 97<br />
POLK 6506 Polk Co. / <strong>Southwest</strong> Regional Serv. Area 39,230 135 129 135 142 126 102 101 101 99 86<br />
<strong>Southwest</strong> <strong>Florida</strong> <strong>Water</strong> <strong>Management</strong> District Page | 408
<strong>2011</strong> ESTIMATED WATER USE REPORT<br />
TABLE D6. TENYEAR HISTORIC PUBLIC SUPPLY UNADJUSTED GROSS PER CAPITA WATER USE (GPD/PERSON)<br />
County of <strong>Use</strong><br />
WUP<br />
Number<br />
Permittee Name<br />
<strong>2011</strong><br />
Service Area<br />
Population<br />
Calendar Year<br />
2002 2003 2004 2005 2006 2007 2008 2009 2010 <strong>2011</strong><br />
POLK 6507 Polk Co. / Central Regional Serv. Area 13,779 139 111 117 103 118 83 82 78 76 69<br />
POLK 6508 Polk Co. / Southeast Regional Serv. Area 4,674 121 102 112 107 124 112 133 119 116 103<br />
POLK 6509 Polk Co. / Northeast Regional Serv. Area 53,256 259 170 149 107 104 92 104 96 134 132<br />
POLK 6624 City of Lake Alfred 6,595 131 124 128 139 171 159 155 138 147 144<br />
POLK 6920 City of Eagle Lake 3,227 . 104 118 90 120 106 99 109 108 112<br />
POLK 7119 City of Auburndale 26,073 147 145 141 144 188 184 173 175 184 171<br />
POLK 7187 CHC VII Century Realty Fund / Lake Henry 1,694 . 193 210 202 191 208 206 206 208 228<br />
POLK 7328 Carefree RV Country Club of Winter Haven 1,058 . . . . . . . 107 . 123<br />
POLK 7703* Orange Ranch Acres Ranch NA . . . . . . . 122 122 *<br />
POLK 7878 Aqua Util. <strong>Florida</strong> Inc. / Lake Gibson 2,015 . 119 111 112 117 121 134 134 100 76<br />
POLK 8054 Polk Co. / East Regional Serv. Area 5,995 . 123 88 130 111 92 84 84 77 86<br />
POLK 8344 Century Realty Funds / Swiss Village 1,420 . 137 139 129 146 131 153 150 139 141<br />
POLK 8468 Town of Polk City, 5,894 . 97 100 124 124 122 91 72 51 57<br />
POLK 8472* Cypress Lakes Venture NA . 102 158 113 197 105 79 79 * *<br />
POLK 8522 City of Haines City 30,223 179 142 171 160 160 160 157 160 122 114<br />
POLK 8753 Plantation Landings Ltd. 719 . 88 88 88 89 85 114 90 98 91<br />
POLK 8967 Sweetwater Community Inc. 720 . 103 133 127 198 141 234 159 150 192<br />
POLK 9807 Village of Highland Park NA . 571 405 364 349 330 . . . .<br />
POLK 13043 Cypress Lakes Utilities, Inc. 3,129 . 54 60 59 64 . 50 46 46 43<br />
SARASOTA 2923 City of Northport 44,323 104 63 76 69 67 66 77 64 58 69<br />
SARASOTA 4318 (7) City of Sarasota / Verna Wellfield 77,444 102 101 97 99 106 103 96 92 88 79<br />
SARASOTA 4709 (8) Siesta Key Utilities Authority NA . 106 113 119 127 . . . .<br />
SARASOTA 4866 Englewood <strong>Water</strong> District 34,413 73 55 57 55 58 57 45 68 51 77<br />
SARASOTA 5393 City of Venice 29,924 102 98 92 86 90 79 78 82 58 66<br />
SARASOTA 5807 Camelot Lakes Communities MHP Ltd 1,668 . 68 53 54 57 55 54 54 65 133<br />
SARASOTA 7411 (8) Sarasota Co. / Univ. Parkway NA 85 85 87 83 89 . . . . .<br />
SARASOTA 7448 Royalty Resorts / Sun 'N Fun RV 3,198 . 40 43 44 40 72 89 89 58 29<br />
SARASOTA 8836 (8) Sarasota Co. / Univ. Parkway 209,043 . . . . . . . 75 . 79<br />
<strong>Southwest</strong> <strong>Florida</strong> <strong>Water</strong> <strong>Management</strong> District Page | 409
<strong>2011</strong> ESTIMATED WATER USE REPORT<br />
TABLE D6. TENYEAR HISTORIC PUBLIC SUPPLY UNADJUSTED GROSS PER CAPITA WATER USE (GPD/PERSON)<br />
County of <strong>Use</strong><br />
WUP<br />
Number<br />
Permittee Name<br />
<strong>2011</strong><br />
Service Area<br />
Population<br />
Calendar Year<br />
2002 2003 2004 2005 2006 2007 2008 2009 2010 <strong>2011</strong><br />
SUMTER 1368 Lake Panasoffkee <strong>Water</strong> Assn Inc. 3,724 . 56 58 59 59 58 67 63 66 65<br />
SUMTER 2622 Continental Country Club, Inc. 1,640 158 148 146 118 176 149 . 247 226 257<br />
SUMTER 6519 City of Bushnell 2,644 . 163 188 205 181 191 178 143 95 138<br />
SUMTER 7185 City of Webster 1,035 . 95 114 111 125 125 118 118 125 84<br />
SUMTER 7799 Cedar Acres, Inc 729 . . . . . . . 59 NA 8<br />
SUMTER 8135 City of Wildwood 15,269 143 288 158 153 160 142 140 208 130 134<br />
SUMTER 11404 (9) Village Center CDD / Lake Sumter NA . 208 227 186 242 . . . . .<br />
SUMTER 12236 (9) North Sumter Utility Co NA . . 56 90 319 . . . . .<br />
SUMTER 13005 (9) Villages WCA / N & C Sumter Utilities 59,588 . . . . . . . 257 236 184<br />
SUMTER 13123 (10) <strong>Florida</strong> Grande Motor Coach Resort 542 . . . . . . . 296 90 NA<br />
Source: Public Supply Annual Reports<br />
* This permit is no longer required to submit the Public Supply Annual Report as of <strong>2011</strong>. It will be removed from this chart in 2012.<br />
Note 1: Permits that no longer exist because they have been combined are being removed from this report once they are no longer show their own data.<br />
Note 2: A dot (" . ") represents a lack of previous data because a permit that was not tracked in this report or the permit was only recently issued, or it represents a lack of data<br />
because the permit no longer exists.<br />
(1)<br />
WUPs 5786 and 7811 were combined into WUP 6029.<br />
(2)<br />
WUP 9516 was combined into WUP 4492.<br />
(3)<br />
WUP 13099 was formerly WUP 4708. Data shown for WUP 13099 includes data from 1999 ‐ 2006 from WUP 4708.<br />
(4)<br />
WUP 2841 combined into WUP 377 in 2007.<br />
(5)<br />
WUP 11863 now includes Permit # 25, #266, # 5245, # 6011 and # 6028.<br />
(6) WUP 4279 was combined into WUP 4607 in 2004.<br />
(7) WUP 4318 now includes WUP 10224.<br />
(8) WUPs 4836 and 7411 were consolidated into WUP 8836 on 08/28/07. WUP 8836 also now includes the service area for WUP 4709.<br />
(9) WUPs 11404 and 12236 were combined into WUP 13005 in 2007.<br />
(10) Pumpage occurred; however, the <strong>2011</strong> PSAR was required but not submitted.<br />
<strong>Southwest</strong> <strong>Florida</strong> <strong>Water</strong> <strong>Management</strong> District Page | 410
<strong>2011</strong> ESTIMATED WATER USE REPORT<br />
APPENDIX E.<br />
UNIFORM PER CAPITA REPORT<br />
PREPARED FOR THE<br />
DEPARTMENT OF ENVIRONMENTAL PROTECTION<br />
<strong>Southwest</strong> <strong>Florida</strong> <strong>Water</strong> <strong>Management</strong> District<br />
Page | 411
<strong>2011</strong> ESTIMATED WATER USE REPORT<br />
TABLE E1: UNIFORM PER CAPITA REPORT PREPARED FOR THE FLORIDA DEPARTMENT OF ENVIRONMENTAL PROTECTION, <strong>2011</strong><br />
WUP<br />
No.<br />
Permittee Name<br />
Average<br />
Annual<br />
Pumpage<br />
P<br />
S<br />
A<br />
R<br />
Treatment<br />
Loss<br />
Housing<br />
Units<br />
Served<br />
Residential<br />
Population<br />
Served<br />
DEP<br />
Gross<br />
Per<br />
Capita<br />
Gross<br />
Avg.<br />
Residential Residential<br />
Source Imports Exports<br />
<strong>Use</strong><br />
PPH<br />
<strong>Use</strong> Per Capita<br />
(mgd) Rec (mgd) (mgd) (mgd) (mgd) (gpcd) (mgd) (gpcd)<br />
(1) (2) (3) (4) (5) (6) (7) (8) (9) (10) (11)<br />
CHARLOTTE COUNTY<br />
718<br />
Gasparilla Island <strong>Water</strong><br />
Association, Inc.<br />
1.286 Y<br />
GW/<br />
RO<br />
0.034 0.000 0.288 1.032 1,941 2.30 4,464 231 0.798 179<br />
871 City Of Punta Gorda 4.700 Y SW 0.000 0.000 0.536 4.164 17,512 1.98 34,730 120 2.886 83<br />
1512<br />
Charlotte Harbor <strong>Water</strong><br />
GW/<br />
0.441 Y<br />
Association<br />
RO<br />
0.000 0.000 0.090 0.350 2,099 2.08 4,357 80 0.266 61<br />
3522 Charlotte County Utilities 0.551 Y<br />
GW/<br />
RO<br />
0.000 0.000 0.154 0.397 3,148 2.03 6,380 62 0.270 42<br />
7104 Charlotte Co BOCC 0.000 Y<br />
GW/<br />
SW<br />
9.470 0.447 0.000 9.022 57,473 2.19 126,120 72 6.586 52<br />
7768<br />
Island Harbor Bch Club Ltd, Char<br />
GW/<br />
0.071 N<br />
Harbor Land Co, Knight Island<br />
RO<br />
0.000 0.000 0.000 0.071 235 2.06 485 146 0.040 83<br />
Charlotte County Totals 7.049 9.504 0.447 1.068 15.037 82,408 2.14 176,536 85 10.847 61<br />
CITRUS COUNTY<br />
207 City Of Crystal River 0.779 Y GW 0.000 0.000 0.000 0.779 2,508 2.08 5,223 149 0.452 87<br />
419 City Of Inverness 1.132 N GW 0.000 0.000 0.000 1.132 5,189 2.17 11,263 100 0.566 50<br />
1118 Floral City <strong>Water</strong> Association Inc 0.273 Y GW 0.000 0.000 0.012 0.261 2,223 2.18 4,852 54 0.207 43<br />
2842 Citrus County <strong>Water</strong> Resources 2.700 Y GW 0.000 0.000 0.056 2.644 7,259 2.50 18,135 146 1.986 110<br />
4153 Rolling Oaks Utilities Inc 1.741 Y GW 0.000 0.000 0.000 1.741 5,630 2.04 11,503 151 1.380 120<br />
4406 Homosassa Special <strong>Water</strong> Dist. 0.783 Y GW 0.000 0.000 0.008 0.775 2,333 2.08 4,860 159 0.449 92<br />
6691 Gulf Highway Land Corporation 0.097 Y GW 0.000 0.000 0.000 0.097 253 2.14 542 178 0.097 178<br />
7121<br />
Citrus County & Withlacoochee<br />
Regional <strong>Water</strong> Supply Auth<br />
4.552 Y GW 0.000 0.492 0.032 4.028 11,801 2.14 25,212 160 3.263 129<br />
7879 Citrus County BOCC 0.038 Y GW 0.000 0.000 0.000 0.038 192 2.46 472 81 0.034 72<br />
9791 Citrus County <strong>Water</strong> Resources 2.442 Y GW 0.000 0.000 0.037 2.405 5,404 2.08 11,252 214 1.932 172<br />
<strong>Southwest</strong> <strong>Florida</strong> <strong>Water</strong> <strong>Management</strong> District Page | 412
<strong>2011</strong> ESTIMATED WATER USE REPORT<br />
TABLE E1: UNIFORM PER CAPITA REPORT PREPARED FOR THE FLORIDA DEPARTMENT OF ENVIRONMENTAL PROTECTION, <strong>2011</strong><br />
WUP<br />
No.<br />
Permittee Name<br />
Average<br />
Annual<br />
Pumpage<br />
P<br />
S<br />
A<br />
R<br />
Treatment<br />
Loss<br />
Housing<br />
Units<br />
Served<br />
Residential<br />
Population<br />
Served<br />
<strong>Southwest</strong> <strong>Florida</strong> <strong>Water</strong> <strong>Management</strong> District Page | 413<br />
DEP<br />
Gross<br />
Per<br />
Capita<br />
Gross<br />
Avg.<br />
Residential Residential<br />
Source Imports Exports<br />
<strong>Use</strong><br />
PPH<br />
<strong>Use</strong> Per Capita<br />
(mgd) Rec (mgd) (mgd) (mgd) (mgd) (gpcd) (mgd) (gpcd)<br />
(1) (2) (3) (4) (5) (6) (7) (8) (9) (10) (11)<br />
11839<br />
GCP Walden Woods One, LLC<br />
GCP Walden Woods Two, LLC<br />
0.148 Y GW 0.000 0.000 0.000 0.148 483 1.99 963 153 0.105 109<br />
20230 Ozello <strong>Water</strong> Association Inc 0.000 Y GW 0.464 0.000 0.000 0.464 1,865 1.99 3,703 125 0.234 63<br />
Citrus County Totals 14.684 0.464 0.492 0.145 14.511 45,140 2.20 97,982 148 10.706 109<br />
DESOTO COUNTY<br />
4725 City of Arcadia 0.832 Y GW 0.000 0.000 0.012 0.820 2,931 2.83 8,288 99 0.603 73<br />
6841 Desoto County Utilities 0.377 N<br />
GW/<br />
RO<br />
0.000 0.000 0.000 0.377 2,171 2.56 5,547 68 0.377 68<br />
10420 Peace River Manasota RWSA 30.233 Y<br />
SW/<br />
GW<br />
0.013 23.437 0.566 6.243 NA NA NA NA NA NA<br />
30<br />
DeSoto County Totals 31.441 0.013 23.437 0.578 7.439 5,102 2.71 13,835 538 0.979 71<br />
City Of Bowling Green Municipal<br />
<strong>Water</strong> System<br />
HARDEE COUNTY<br />
0.251 Y GW 0.000 0.000 0.000 0.251 1,360 3.69 5,013 50 0.248 50<br />
4461 City Of Wauchula 0.730 Y GW 0.000 0.040 0.000 0.690 2,016 3.10 6,255 110 0.366 58<br />
7658 Town Of Zolfo Springs 0.149 Y GW 0.000 0.000 0.000 0.149 805 3.51 2,826 53 0.082 29<br />
13026 Hardee County BOCC* 0.025 Y GW 0.040 0.000 0.004 0.061 262 3.16 828 74 0.036 44<br />
Hardee County Totals 1.155 0.040 0.040 0.004 1.151 4,443 3.12 14,922 77 0.732 49<br />
HERNANDO COUNTY<br />
2179 Hernando Co Utilities Dept 0.104 Y GW 0.000 0.000 0.000 0.104 313 2.53 792 132 0.082 104<br />
2983 Hernando Co Utilities Dept 18.232 Y GW 0.000 0.000 0.000 18.232 55,564 2.35 130,734 139 14.462 111<br />
5789 Hernando Co Utilities Dept 0.990 Y GW 0.000 0.000 0.000 0.990 2,932 2.53 7,431 133 0.668 90<br />
7627 City Of Brooksville 1.236 Y GW 0.000 0.000 0.000 1.236 6,356 2.28 14,516 85 0.758 52
<strong>2011</strong> ESTIMATED WATER USE REPORT<br />
TABLE E1: UNIFORM PER CAPITA REPORT PREPARED FOR THE FLORIDA DEPARTMENT OF ENVIRONMENTAL PROTECTION, <strong>2011</strong><br />
WUP<br />
No.<br />
Permittee Name<br />
Average<br />
Annual<br />
Pumpage<br />
P<br />
S<br />
A<br />
R<br />
Treatment<br />
Loss<br />
Housing<br />
Units<br />
Served<br />
Residential<br />
Population<br />
Served<br />
DEP<br />
Gross<br />
Per<br />
Capita<br />
Gross<br />
Avg.<br />
Residential Residential<br />
Source Imports Exports<br />
<strong>Use</strong><br />
PPH<br />
<strong>Use</strong> Per Capita<br />
(mgd) Rec (mgd) (mgd) (mgd) (mgd) (gpcd) (mgd) (gpcd)<br />
(1) (2) (3) (4) (5) (6) (7) (8) (9) (10) (11)<br />
1<strong>2011</strong> Hernando Co Utilities Dept 0.008 Y GW 0.000 0.000 0.000 0.008 23 2.16 50 153 0.006 127<br />
4167<br />
Hernando County Totals 20.571 0.000 0.000 0.000 20.571 65,188 2.38 153,523 134 15.977 104<br />
Aqua Utilities <strong>Florida</strong><br />
Incorporated<br />
HIGHLANDS COUNTY<br />
0.170 Y GW 0.000 0.000 0.046 0.124 669 2.14 1,434 86 0.046 32<br />
4492 City Of Sebring 3.302 Y GW 0.000 0.000 0.000 3.302 15,319 2.17 33,206 99 2.147 65<br />
4980 Lake Placid Holding Co 0.289 Y GW 0.000 0.000 0.000 0.289 1,995 2.34 4,660 62 0.290 62<br />
5270 Town Of Lake Placid 0.444 Y GW 0.000 0.000 0.000 0.444 1,364 2.31 3,148 141 0.230 73<br />
6029 City Of Avon Park 1.737 Y GW 0.000 0.000 0.045 1.692 7,729 2.50 19,323 88 1.085 56<br />
6326 Highlands County BOCC 0.161 Y GW 0.000 0.000 0.000 0.161 1,170 1.97 2,304 70 0.081 35<br />
7139 Buttonwood Bay Utilities 0.176 Y GW 0.000 0.000 0.002 0.174 943 1.74 1,638 106 0.159 97<br />
7704 Country Club Utilities Inc 0.259 Y GW 0.000 0.000 0.004 0.256 410 2.32 952 269 0.240 252<br />
9140 Eagle Lake Est. LLC 0.000 N GW 0.000 0.000 0.000 0.000 NA 2.50 NA NA 0.000 NA<br />
9490 LP Utilities Corporation 0.049 Y GW 0.000 0.000 0.000 0.049 424 1.75 742 66 0.041 55<br />
11609 Highlands County BOCC 0.047 Y GW 0.000 0.000 0.000 0.047 383 2.54 974 49 0.039 41<br />
13099 Sun N Lake Of Sebring Impr Dist 0.576 Y GW 0.000 0.000 0.016 0.560 3,434 2.19 7,527 74 0.359 48<br />
13367 Silver Lake Utilities 0.012 Y GW 0.000 0.000 0.000 0.012 46 2.43 112 108 0.012 108<br />
450<br />
Highlands County Totals 7.224 0.000 0.000 0.112 7.112 33,886 2.28 76,019 94 4.729 62<br />
City Of Temple Terrace Dept Of<br />
Public Works<br />
HILLSBOROUGH COUNTY<br />
3.707 Y GW 0.000 0.000 0.418 3.289 12,421 2.37 29,436 112 2.236 76<br />
1776 City Of Plant City 5.021 Y GW 0.005 0.041 0.000 4.985 13,293 2.84 37,755 132 2.808 74<br />
2062 City Of Tampa <strong>Water</strong> Dept 67.745 Y SW/ 3.477 3.054 6.125 62.042 211,704 2.41 510,590 122 36.480 71<br />
<strong>Southwest</strong> <strong>Florida</strong> <strong>Water</strong> <strong>Management</strong> District Page | 414
<strong>2011</strong> ESTIMATED WATER USE REPORT<br />
TABLE E1: UNIFORM PER CAPITA REPORT PREPARED FOR THE FLORIDA DEPARTMENT OF ENVIRONMENTAL PROTECTION, <strong>2011</strong><br />
WUP<br />
No.<br />
Permittee Name<br />
Average<br />
Annual<br />
Pumpage<br />
P<br />
S<br />
A<br />
R<br />
Treatment<br />
Loss<br />
Housing<br />
Units<br />
Served<br />
Residential<br />
Population<br />
Served<br />
DEP<br />
Gross<br />
Per<br />
Capita<br />
Gross<br />
Avg.<br />
Residential Residential<br />
Source Imports Exports<br />
<strong>Use</strong><br />
PPH<br />
<strong>Use</strong> Per Capita<br />
(mgd) Rec (mgd) (mgd) (mgd) (mgd) (gpcd) (mgd) (gpcd)<br />
(1) (2) (3) (4) (5) (6) (7) (8) (9) (10) (11)<br />
GW<br />
2285 Davpam Mobile Home Assoc LLC 0.115 Y GW 0.000 0.000 0.000 0.115 400 2.99 1,195 96 0.115 96<br />
2707 Pluris Eastlake LLC 0.224 Y GW 0.000 0.000 0.002 0.221 875 2.77 2,427 91 0.204 84<br />
4352 Tampa Bay <strong>Water</strong> 22.225 Y GW 0.000 22.225 0.000 0.000 NA NA NA NA NA NA<br />
4757<br />
Wilder Corporation C/O Colby<br />
Wilder Or Debby Reese<br />
0.045 Y GW 0.000 0.000 0.000 0.045 939 1.52 1,423 32 0.045 32<br />
6312 Tampa Bay <strong>Water</strong> 0.183 Y GW 0.000 0.183 0.000 0.000 NA NA NA NA NA NA<br />
6879<br />
MHC The Meadows At<br />
Countrywood LLC<br />
0.205 Y GW 0.000 0.000 0.000 0.205 1,160 1.70 1,975 104 0.205 104<br />
7002 Malco Industries Inc 0.098 Y GW 0.000 0.000 0.000 0.098 513 1.79 920 107 0.098 107<br />
7637 Riverside Golf Course Comm LLC NA N GW 0.000 0.000 0.000 NA 517 2.07 1,072 NA NA NA<br />
7790 Paradise Village Mhc, LLC 0.052 N GW 0.000 0.000 0.000 0.052 250 2.71 679 77 0.052 77<br />
10443 Windemere Utility Company 0.312 Y GW 0.000 0.000 0.000 0.312 1,024 2.70 2,763 113 0.312 113<br />
11732 Tampa Bay <strong>Water</strong> 4.192 Y GW 0.000 4.192 0.000 0.000 NA NA NA NA NA NA<br />
11771 Tampa Bay <strong>Water</strong> 78.443 Y<br />
SW/<br />
GW<br />
55.241 133.684 0.000 0.000 NA NA NA NA NA NA<br />
11794 Tampa Bay <strong>Water</strong> 7.186 Y<br />
SW/<br />
GW<br />
0.000 7.186 0.000 0.000 NA NA NA NA NA NA<br />
11796 Tampa Bay <strong>Water</strong> 43.680 Y<br />
SW/<br />
GW<br />
0.000 43.680 0.000 0.000 NA NA NA NA NA NA<br />
12994 Pluris PCU, Inc.* 0.000 Y GW 0.424 0.000 0.000 0.423 1,355 2.58 3,490 121 0.396 114<br />
20141 Hillsborough County BOCC* 0.000 Y<br />
SW/<br />
GW 50.947 0.000 0.000 50.947 207,845 2.62 544,566 94 40.198 74<br />
Hillsborough County Totals 233.431 110.094 214.244 6.546 122.734 452,296 2.55 1,138,290 108 83.148 73<br />
There are no Public Supply <strong>Water</strong> <strong>Use</strong> Permits in the SWFWMD portion of Lake County<br />
LEVY COUNTY<br />
<strong>Southwest</strong> <strong>Florida</strong> <strong>Water</strong> <strong>Management</strong> District Page | 415
<strong>2011</strong> ESTIMATED WATER USE REPORT<br />
TABLE E1: UNIFORM PER CAPITA REPORT PREPARED FOR THE FLORIDA DEPARTMENT OF ENVIRONMENTAL PROTECTION, <strong>2011</strong><br />
WUP<br />
No.<br />
Permittee Name<br />
Average<br />
Annual<br />
Pumpage<br />
P<br />
S<br />
A<br />
R<br />
Treatment<br />
Loss<br />
Housing<br />
Units<br />
Served<br />
Residential<br />
Population<br />
Served<br />
DEP<br />
Gross<br />
Per<br />
Capita<br />
Gross<br />
Avg.<br />
Residential Residential<br />
Source Imports Exports<br />
<strong>Use</strong><br />
PPH<br />
<strong>Use</strong> Per Capita<br />
(mgd) Rec (mgd) (mgd) (mgd) (mgd) (gpcd) (mgd) (gpcd)<br />
(1) (2) (3) (4) (5) (6) (7) (8) (9) (10) (11)<br />
5640 City of Williston 0.442 N GW 0.000 0.000 0.000 0.442 1,209 2.57 3,103 142 0.261 84<br />
7755 Town of Yankeetown 0.058 Y GW 0.000 0.000 0.007 0.051 423 2.05 868 59 0.026 30<br />
8953 Town of Inglis 0.150 N GW 0.000 0.000 0.000 0.150 708 2.13 1,508 99 0.091 61<br />
Levy County Totals 0.650 0.000 0.000 0.007 0.643 2,340 2.45 5,479 117 0.378 69<br />
MANATEE COUNTY<br />
5387<br />
Manatee County Utility<br />
SW/<br />
24.498 Y<br />
Operations<br />
GW<br />
15.449 8.922 2.214 28.811 155,800 2.33 363,224 79 20.461 56<br />
6392 City of Bradenton 5.221 Y SW 0.192 0.013 0.052 5.348 27,230 2.25 61,232 87 3.674 60<br />
7345<br />
Mosaic Fertilizer & Manatee<br />
SW/<br />
0.924 Y<br />
County Utility Operations<br />
GW<br />
0.000 0.924 0.000 0.000 0 NA NA NA NA NA<br />
7470<br />
Manatee County Utility<br />
SW/<br />
12.748 Y<br />
Operations<br />
GW<br />
0.000 12.748 0.000 0.000 0 NA NA NA NA NA<br />
10963 Town of Longboat Key* 0.000 Y SW 1.658 0.000 0.000 1.658 9,698 1.77 17,203 96 1.400 81<br />
12443 City of Palmetto* 0.000 Y<br />
SW/<br />
GW<br />
1.265 0.000 0.013 1.252 6,961 2.57 17,887 70 0.814 46<br />
Manatee County Totals 43.391 18.564 22.607 2.279 37.070 199,689 2.34 459,546 81 26.350 57<br />
MARION COUNTY<br />
377 Marion Co Utilities Dept 1.914 Y GW 0.000 0.000 0.235 1.679 6,782 2.81 19,068 88 1.461 77<br />
1156<br />
Bay Laurel Community<br />
Development District<br />
3.031 Y GW 0.000 0.000 0.135 2.896 5,326 1.74 9,249 313 2.598 281<br />
2999 Marion Utilities Inc 0.096 Y GW 0.000 0.000 0.000 0.096 478 2.28 1,090 88 0.096 88<br />
8339 City of Dunnellon 0.300 N GW 0.000 0.000 0.000 0.300 839 2.05 1,721 174 0.135 79<br />
5643 Utilities Inc of <strong>Florida</strong> 0.185 Y GW 0.000 0.000 0.000 0.185 527 2.10 1,106 167 0.167 151<br />
6151 Marion Co Utilities Dept 2.420 Y GW 0.000 0.000 0.002 2.417 5,870 2.74 16,108 150 1.501 93<br />
<strong>Southwest</strong> <strong>Florida</strong> <strong>Water</strong> <strong>Management</strong> District Page | 416
<strong>2011</strong> ESTIMATED WATER USE REPORT<br />
TABLE E1: UNIFORM PER CAPITA REPORT PREPARED FOR THE FLORIDA DEPARTMENT OF ENVIRONMENTAL PROTECTION, <strong>2011</strong><br />
WUP<br />
No.<br />
Permittee Name<br />
Average<br />
Annual<br />
Pumpage<br />
P<br />
S<br />
A<br />
R<br />
Treatment<br />
Loss<br />
Housing<br />
Units<br />
Served<br />
Residential<br />
Population<br />
Served<br />
DEP<br />
Gross<br />
Per<br />
Capita<br />
Gross<br />
Avg.<br />
Residential Residential<br />
Source Imports Exports<br />
<strong>Use</strong><br />
PPH<br />
<strong>Use</strong> Per Capita<br />
(mgd) Rec (mgd) (mgd) (mgd) (mgd) (gpcd) (mgd) (gpcd)<br />
(1) (2) (3) (4) (5) (6) (7) (8) (9) (10) (11)<br />
6792 Sun Communities Operating LP 0.113 Y GW 0.000 0.000 0.001 0.112 376 1.59 599 187 0.100 168<br />
7849 Marion Utilities Inc 0.161 Y GW 0.000 0.000 0.000 0.161 572 2.27 1,296 124 0.161 124<br />
8005 Century Fairfield Village Ltd 0.067 N GW 0.000 0.000 0.000 0.067 293 1.64 482 138 0.067 138<br />
8020<br />
Association of Marion Landing<br />
Owners, Inc<br />
0.185 Y GW 0.000 0.000 0.000 0.185 598 1.88 1,127 164 0.185 164<br />
8165 Marion Co Utilities 0.125 Y GW 0.000 0.000 0.016 0.109 547 1.90 1,041 105 0.098 94<br />
8481<br />
Marion Utilities Inc & Spruce<br />
Creek Development Company<br />
0.626 Y GW 0.000 0.000 0.000 0.626 2,129 2.56 5,451 115 0.626 115<br />
9360 Windstream Utilities Company 0.549 Y GW 0.000 0.000 0.034 0.515 898 2.38 2,136 241 0.468 219<br />
11752 Marion Co Utilities Dept 0.116 Y GW 0.000 0.000 0.015 0.101 92 2.39 220 458 0.088 398<br />
12218 Marion Co Utilities Dept 0.314 Y GW 0.000 0.000 0.018 0.296 713 1.77 1,261 235 0.278 221<br />
Marion County Totals 10.201 0.000 0.000 0.457 9.744 26,040 2.35 61,955 157 8.028 130<br />
PASCO COUNTY<br />
279<br />
Aqua Utilities <strong>Florida</strong><br />
Incorporated<br />
0.270 Y GW 0.000 0.000 0.020 0.250 1,534 2.39 3,665 68 0.192 52<br />
540 Holiday Gardens Utilities, Inc. 0.075 Y GW 0.000 0.000 0.008 0.067 448 2.35 1,051 64 0.054 52<br />
543 Crestridge Utility Corporation 0.083 Y GW 0.000 0.000 0.007 0.076 614 2.31 1,417 54 0.064 45<br />
590 Mad Hatter Utility Inc 0.910 Y GW 0.000 0.000 0.047 0.863 2,863 2.59 7,423 116 0.708 95<br />
964 C S <strong>Water</strong> Company Inc. 0.075 Y GW 0.000 0.000 0.000 0.075 370 2.65 980 77 0.072 74<br />
1631 City of Dade City 1.311 Y GW 0.000 0.000 0.012 1.299 4,233 2.66 11,262 115 0.974 86<br />
2043<br />
Orangewood Lakes Mobile<br />
Home Community Inc<br />
0.070 Y GW 0.000 0.000 0.000 0.070 492 2.14 1,051 66 0.068 64<br />
2978<br />
<strong>Florida</strong> Governmental Utility<br />
Authority<br />
0.623 Y GW 0.000 0.000 0.006 0.617 3,000 1.93 5,800 106 0.531 92<br />
3182<br />
<strong>Florida</strong> Governmental Utility<br />
Authority<br />
2.589 Y GW 0.199 0.000 0.026 2.762 12,511 2.41 30,126 92 2.088 69<br />
<strong>Southwest</strong> <strong>Florida</strong> <strong>Water</strong> <strong>Management</strong> District Page | 417
<strong>2011</strong> ESTIMATED WATER USE REPORT<br />
TABLE E1: UNIFORM PER CAPITA REPORT PREPARED FOR THE FLORIDA DEPARTMENT OF ENVIRONMENTAL PROTECTION, <strong>2011</strong><br />
WUP<br />
No.<br />
Permittee Name<br />
Average<br />
Annual<br />
Pumpage<br />
P<br />
S<br />
A<br />
R<br />
Treatment<br />
Loss<br />
Housing<br />
Units<br />
Served<br />
Residential<br />
Population<br />
Served<br />
DEP<br />
Gross<br />
Per<br />
Capita<br />
Gross<br />
Avg.<br />
Residential Residential<br />
Source Imports Exports<br />
<strong>Use</strong><br />
PPH<br />
<strong>Use</strong> Per Capita<br />
(mgd) Rec (mgd) (mgd) (mgd) (mgd) (gpcd) (mgd) (gpcd)<br />
(1) (2) (3) (4) (5) (6) (7) (8) (9) (10) (11)<br />
3590 Utilities Inc of <strong>Florida</strong> 0.126 Y GW 0.000 0.000 0.000 0.126 1,589 2.04 3,236 39 0.126 39<br />
3668 Utilities Inc of <strong>Florida</strong> 0.180 Y GW 0.000 0.000 0.012 0.168 1,794 2.14 3,831 44 0.165 43<br />
3677<br />
<strong>Florida</strong> Governmental Utility<br />
Authority<br />
0.000 Y GW 0.089 0.000 0.001 0.088 712 2.24 1,597 55 0.080 50<br />
3692 City of Port Richey 0.779 Y GW 0.000 0.000 0.000 0.779 5,991 2.13 12,779 61 0.670 52<br />
4550 City of San Antonio 0.140 Y GW 0.000 0.000 0.000 0.140 548 2.56 1,405 99 0.126 90<br />
4668 Utilities Inc of <strong>Florida</strong> 0.087 Y GW 0.000 0.000 0.000 0.087 789 2.40 1,893 46 0.086 45<br />
4669 Hudson <strong>Water</strong> Works Inc 0.618 Y GW 0.000 0.000 0.000 0.618 3,404 2.06 7,014 88 0.426 61<br />
4734 City of New Port Richey 0.462 Y GW 4.400 2.050 0.050 2.762 14,256 2.12 30,167 92 1.975 65<br />
6040 City of Zephyrhills 2.462 Y GW 0.000 0.000 0.029 2.433 10,899 2.20 24,013 101 1.297 54<br />
6867 Labrador Utilities Inc 0.066 Y GW 0.000 0.000 0.000 0.066 928 1.82 1,688 39 0.066 39<br />
7299 L W V Utilities Inc 0.076 Y GW 0.000 0.000 0.000 0.076 443 2.02 896 85 0.066 74<br />
7999<br />
<strong>Florida</strong> Governmental Utility<br />
Authority<br />
0.124 Y GW 0.000 0.000 0.001 0.123 700 2.76 1,932 64 0.120 62<br />
8417<br />
<strong>Florida</strong> Governmental Utility<br />
Authority<br />
0.072 Y GW 0.286 0.000 0.003 0.355 3,173 2.30 7,296 49 0.312 43<br />
8491 Parrish Properties V LLC 0.022 Y GW 0.000 0.000 0.000 0.022 502 2.06 1,034 21 0.022 21<br />
11863 Pasco Co Utilities 3.896 Y GW 23.601 0.517 0.052 26.928 95,566 2.47 236,444 114 18.422 78<br />
Pasco County Totals 15.115 28.576 2.567 0.275 40.849 167,359 2.42 397,999 103 28.709 72<br />
PINELLAS COUNTY<br />
742 City of Tarpon Springs 0.495 Y GW 1.720 0.042 0.000 2.173 13,360 2.25 30,120 72 1.673 56<br />
2980 City of Dunedin 4.308 Y<br />
GW/<br />
RO<br />
0.000 0.000 0.979 3.329 20,421 2.02 41,259 81 2.434 59<br />
2981 City of Clearwater 4.588 Y<br />
GW/<br />
RO<br />
6.371 0.000 0.390 10.569 56,407 2.15 121,177 87 6.828 56<br />
7692 Town of Belleair 0.769 Y GW 0.000 0.000 0.040 0.729 2,944 2.14 6,289 116 0.607 97<br />
<strong>Southwest</strong> <strong>Florida</strong> <strong>Water</strong> <strong>Management</strong> District Page | 418
<strong>2011</strong> ESTIMATED WATER USE REPORT<br />
TABLE E1: UNIFORM PER CAPITA REPORT PREPARED FOR THE FLORIDA DEPARTMENT OF ENVIRONMENTAL PROTECTION, <strong>2011</strong><br />
WUP<br />
No.<br />
Permittee Name<br />
Average<br />
Annual<br />
Pumpage<br />
P<br />
S<br />
A<br />
R<br />
Treatment<br />
Loss<br />
Housing<br />
Units<br />
Served<br />
Residential<br />
Population<br />
Served<br />
DEP<br />
Gross<br />
Per<br />
Capita<br />
Gross<br />
Avg.<br />
Residential Residential<br />
Source Imports Exports<br />
<strong>Use</strong><br />
PPH<br />
<strong>Use</strong> Per Capita<br />
(mgd) Rec (mgd) (mgd) (mgd) (mgd) (gpcd) (mgd) (gpcd)<br />
(1) (2) (3) (4) (5) (6) (7) (8) (9) (10) (11)<br />
10350 Utilities Inc of <strong>Florida</strong> 0.051 Y GW 0.000 0.000 0.001 0.050 507 1.67 845 59 0.050 59<br />
10795 City of Gulfport* 0.000 Y GW 0.975 0.000 0.000 0.975 7,562 1.98 14,938 65 0.815 55<br />
11218 City of Oldsmar* 0.000 Y GW 1.364 0.000 0.000 1.364 6,121 2.49 15,266 89 0.823 54<br />
12351 City of Pinellas Park* 0.000 Y GW 4.280 0.000 0.000 4.280 33,586 2.29 77,024 56 2.996 39<br />
11245 City of Safety Harbor* 0.000 N GW 1.347 0.000 0.000 1.347 7,157 2.33 16,704 81 1.035 62<br />
20142 Pinellas County* 0.000 Y GW 52.965 14.525 0.649 37.792 218,461 2.13 465,931 81 27.475 59<br />
20143 City of St. Petersburg* 0.000 Y GW 27.714 1.215 0.516 25.983 121,736 2.16 263,183 99 16.702 63<br />
Pinellas County Totals 10.211 96.737 15.782 2.575 88.591 488,262 2.16 1,052,737 84 61.438 58<br />
POLK COUNTY<br />
341 City of Bartow 2.977 Y GW 0.000 0.000 0.638 2.339 7,945 2.72 21,633 108 1.461 68<br />
645 City of Fort Meade 0.544 Y GW 0.000 0.000 0.000 0.544 2,049 2.88 5,903 92 0.370 63<br />
1616<br />
Lake Region Mobile Home<br />
Owners Inc<br />
0.088 Y GW 0.000 0.000 0.001 0.087 601 1.69 1,015 86 0.087 86<br />
1625 Four Lakes Golf Club Ltd 0.381 Y GW 0.000 0.000 0.000 0.381 814 1.81 1,477 258 0.236 160<br />
2332 Town Of Lake Hamilton 0.221 Y GW 0.000 0.000 0.002 0.219 716 2.50 1,790 122 0.185 103<br />
3415<br />
Orchid Springs Development<br />
Corp<br />
0.069 Y GW 0.002 0.000 0.000 0.071 496 1.86 922 77 0.069 75<br />
4005<br />
Crooked Lake Park <strong>Water</strong><br />
Company<br />
0.233 Y GW 0.000 0.000 0.004 0.229 1,000 2.62 2,619 87 0.149 57<br />
4607 City of Winter Haven 8.610 Y GW 0.000 0.000 0.159 8.451 27,773 2.41 67,031 126 5.155 77<br />
4658 City of Lake Wales 2.550 Y GW 0.000 0.002 0.000 2.548 8,609 2.47 21,243 120 1.735 82<br />
4912<br />
City of Lakeland <strong>Water</strong> Utilities<br />
<strong>Water</strong> Administration<br />
22.258 Y GW 0.000 0.507 0.076 21.675 66,040 2.48 163,900 132 14.401 88<br />
5251 Grenelefe Resort Llc 0.991 Y GW 0.000 0.000 0.000 0.991 843 2.31 1,945 510 0.123 63<br />
5750 City of Davenport 0.449 Y GW 0.000 0.000 0.000 0.449 1,909 2.91 5,552 81 0.380 68<br />
<strong>Southwest</strong> <strong>Florida</strong> <strong>Water</strong> <strong>Management</strong> District Page | 419
<strong>2011</strong> ESTIMATED WATER USE REPORT<br />
TABLE E1: UNIFORM PER CAPITA REPORT PREPARED FOR THE FLORIDA DEPARTMENT OF ENVIRONMENTAL PROTECTION, <strong>2011</strong><br />
WUP<br />
No.<br />
Permittee Name<br />
Average<br />
Annual<br />
Pumpage<br />
P<br />
S<br />
A<br />
R<br />
Treatment<br />
Loss<br />
Housing<br />
Units<br />
Served<br />
Residential<br />
Population<br />
Served<br />
DEP<br />
Gross<br />
Per<br />
Capita<br />
Gross<br />
Avg.<br />
Residential Residential<br />
Source Imports Exports<br />
<strong>Use</strong><br />
PPH<br />
<strong>Use</strong> Per Capita<br />
(mgd) Rec (mgd) (mgd) (mgd) (mgd) (gpcd) (mgd) (gpcd)<br />
(1) (2) (3) (4) (5) (6) (7) (8) (9) (10) (11)<br />
5870 City of Frostproof 0.303 Y GW 0.000 0.000 0.000 0.303 1,379 2.43 3,353 90 0.158 47<br />
5893<br />
Town of Dundee Public Works<br />
Dept<br />
0.538 Y GW 0.000 0.000 0.000 0.538 2,031 2.68 5,438 99 0.290 53<br />
6124 City of Mulberry 0.455 Y GW 0.000 0.000 0.000 0.455 1,924 2.53 4,871 93 0.391 80<br />
6174<br />
Saddlebag Lake Owners<br />
Association Inc.<br />
0.084 Y GW 0.000 0.000 0.001 0.083 795 1.71 1,362 61 0.066 48<br />
6505 Polk Co BOCC Util. Division 2.829 Y GW 0.192 0.000 0.070 2.952 11,683 2.72 31,780 93 2.462 77<br />
6506 Polk Co BOCC Util. Division 3.379 Y GW 0.052 0.000 0.057 3.373 13,939 2.86 39,880 85 3.106 78<br />
6507 Polk Co BOCC Util. Division 0.794 Y GW 0.000 0.000 0.030 0.764 4,980 2.79 13,897 55 0.645 46<br />
6508 Polk Co BOCC Util. Division 0.509 Y GW 0.000 0.000 0.027 0.482 1,593 2.74 4,361 110 0.246 56<br />
6509 Polk Co BOCC Util. Division 4.493 Y GW 2.708 0.000 0.197 7.004 22,181 2.64 58,449 120 5.736 98<br />
6624 City Of Lake Alfred 0.973 Y GW 0.000 0.001 0.000 0.972 2,458 2.43 5,973 163 0.923 155<br />
6920 City Of Eagle Lake 0.362 Y GW 0.000 0.000 0.000 0.362 1,172 3.13 3,663 99 0.337 92<br />
7119 City Of Auburndale 4.466 Y GW 0.000 0.000 0.000 4.466 9,804 2.61 25,617 174 2.126 83<br />
7187 CHC VII Ltd Century Realty Fund 0.386 Y GW 0.000 0.000 0.000 0.386 962 1.73 1,664 232 0.208 125<br />
7328<br />
Carefree RV Country Club of<br />
Winter Haven Inc<br />
0.124 Y GW 0.000 0.000 0.000 0.124 500 1.99 994 125 0.068 69<br />
7653<br />
Aqua Utilities <strong>Florida</strong><br />
Incorporated<br />
0.037 Y GW 0.000 0.000 0.000 0.036 248 2.84 704 51 0.034 48<br />
7878<br />
Aqua Utilities <strong>Florida</strong><br />
Incorporated<br />
0.142 Y GW 0.000 0.000 0.001 0.141 761 2.77 2,107 67 0.116 55<br />
8054 Polk Co BOCC Util. Division 0.524 Y GW 0.000 0.000 0.008 0.516 2,491 2.54 6,331 82 0.328 52<br />
8344 S V Utilities Ltd 0.200 Y GW 0.000 0.000 0.000 0.200 714 1.99 1,423 140 0.200 140<br />
8468 City of Polk City 0.339 Y GW 0.000 0.000 0.000 0.339 1,954 2.67 5,224 65 0.318 61<br />
8522 City of Haines City 3.727 Y GW 0.000 0.000 0.280 3.446 11,053 2.87 31,710 109 3.171 100<br />
8753 Plantation Landings Ltd 0.066 Y GW 0.000 0.000 0.000 0.066 394 1.80 707 93 0.065 92<br />
8967 Sweetwater Community Inc 0.138 Y GW 0.000 0.000 0.000 0.138 415 1.70 705 196 0.111 157<br />
<strong>Southwest</strong> <strong>Florida</strong> <strong>Water</strong> <strong>Management</strong> District Page | 420
<strong>2011</strong> ESTIMATED WATER USE REPORT<br />
TABLE E1: UNIFORM PER CAPITA REPORT PREPARED FOR THE FLORIDA DEPARTMENT OF ENVIRONMENTAL PROTECTION, <strong>2011</strong><br />
WUP<br />
No.<br />
Permittee Name<br />
Average<br />
Annual<br />
Pumpage<br />
P<br />
S<br />
A<br />
R<br />
Treatment<br />
Loss<br />
Housing<br />
Units<br />
Served<br />
Residential<br />
Population<br />
Served<br />
DEP<br />
Gross<br />
Per<br />
Capita<br />
Gross<br />
Avg.<br />
Residential Residential<br />
Source Imports Exports<br />
<strong>Use</strong><br />
PPH<br />
<strong>Use</strong> Per Capita<br />
(mgd) Rec (mgd) (mgd) (mgd) (mgd) (gpcd) (mgd) (gpcd)<br />
(1) (2) (3) (4) (5) (6) (7) (8) (9) (10) (11)<br />
10141 Polk County BOCC/Utilities Div. 0.000 Y GW 0.000 0.000 0.000 0.000 0 2.81 0 NA 0.000 NA<br />
12800 Jordans Grove LLC 0.000 Y GW 0.000 0.000 0.000 0.000 0 NA NA NA NA NA<br />
12964<br />
Alafia Preserve LLC, Eagle Ridge<br />
LLC, and Donaldson Knoll LLC<br />
0.000 Y GW 0.000 0.000 0.000 0.000 0 NA NA NA NA NA<br />
13043 Cypress Lakes Utilities Inc 0.201 Y GW 0.000 0.000 0.067 0.135 1,677 1.89 3,176 42 0.135 42<br />
Polk County Totals 64.439 2.954 0.509 1.619 65.264 213,903 2.59 548,420 119 45.592 83<br />
SARASOTA COUNTY<br />
2923 City of North Port 2.029 Y SW 1.068 0.000 0.036 3.060 18,704 2.43 45,540 67 2.071 45<br />
4318 City of Sarasota Public Works 7.644 Y GW 0.000 0.000 1.504 6.140 30,562 2.08 63,633 96 3.213 50<br />
4866 Englewood <strong>Water</strong> District 3.560 Y<br />
GW/<br />
RO<br />
0.000 0.012 0.888 2.659 18,109 1.91 34,531 77 2.048 59<br />
5393 City of Venice 3.672 Y<br />
GW/<br />
RO<br />
0.000 0.000 2.102 1.570 17,342 1.77 30,642 51 1.094 36<br />
5807 Camelot Communities MHP, LLC 0.266 Y<br />
GW/<br />
RO<br />
0.000 0.000 0.032 0.234 879 1.92 1,692 138 0.234 138<br />
7448 Royalty Resort Corporation 0.104 Y<br />
GW/<br />
RO<br />
0.000 0.000 0.012 0.091 1,519 1.91 2,908 31 0.091 31<br />
8836<br />
Sarasota County Board of<br />
County Commissioners<br />
3.079 Y<br />
GW/<br />
RO<br />
15.794 1.608 0.790 16.474 99,097 2.10 207,996 79 12.359 59<br />
9638 Palmer Enterprises 0.000 Y GW 0.000 0.000 0.000 0.000 0 NA NA NA NA NA<br />
Sarasota County Totals 20.353 16.861 1.621 5.365 30.229 186,212 2.13 386,941 78 21.109 55<br />
SUMTER COUNTY<br />
1368<br />
Lake Panasoffkee <strong>Water</strong> Assoc<br />
Inc<br />
0.251 Y GW 0.000 0.000 0.008 0.243 1,797 2.26 4,060 60 0.213 53<br />
2622 Continental Country Club Rd Inc 0.421 Y GW 0.000 0.000 0.000 0.421 963 1.73 1,664 253 0.160 96<br />
<strong>Southwest</strong> <strong>Florida</strong> <strong>Water</strong> <strong>Management</strong> District Page | 421
<strong>2011</strong> ESTIMATED WATER USE REPORT<br />
TABLE E1: UNIFORM PER CAPITA REPORT PREPARED FOR THE FLORIDA DEPARTMENT OF ENVIRONMENTAL PROTECTION, <strong>2011</strong><br />
WUP<br />
No.<br />
Permittee Name<br />
Average<br />
Annual<br />
Pumpage<br />
P<br />
S<br />
A<br />
R<br />
Treatment<br />
Loss<br />
Housing<br />
Units<br />
Served<br />
Residential<br />
Population<br />
Served<br />
DEP<br />
Gross<br />
Per<br />
Capita<br />
Gross<br />
Avg.<br />
Residential Residential<br />
Source Imports Exports<br />
<strong>Use</strong><br />
PPH<br />
<strong>Use</strong> Per Capita<br />
(mgd) Rec (mgd) (mgd) (mgd) (mgd) (gpcd) (mgd) (gpcd)<br />
(1) (2) (3) (4) (5) (6) (7) (8) (9) (10) (11)<br />
6519 City of Bushnell 0.365 Y GW 0.000 0.000 0.000 0.365 1,116 2.41 2,686 136 0.095 35<br />
7185 City of Webster 0.188 Y GW 0.000 0.000 0.000 0.188 382 2.78 1,062 177 0.107 101<br />
7799 Cedar Acres, Inc. NA N GW 0.000 0.000 0.000 NA NA 2.32 NA NA NA NA<br />
8135 City of Wildwood City MNG 2.047 Y GW 0.000 0.000 0.000 2.047 3,819 2.32 8,844 231 0.467 53<br />
13005<br />
Sumter & Villages WCA/ N & C<br />
Sumter Utilities<br />
20.098 Y<br />
GW/<br />
SW<br />
0.000 0.000 0.179 19.919 33,941 1.80 61,210 325 14.780 241<br />
13123 Madison <strong>Florida</strong> Grande, LLC 0.063 N GW 0.000 0.000 0.000 0.063 NA NA NA NA NA NA<br />
Sumter County Totals 23.433 0.000 0.000 0.187 23.246 42,018 2.04 79,526 292 15.822 199<br />
(GPCD) = gallons per capita per day<br />
(GPD) = gallons per day<br />
(MGD) = million gallons per day<br />
(*) Wholesale water importer<br />
DISTRICT TOTALS 503.347 283.807 281.747 21.216 484.191 2,014,286 2.32 4,663,711 104 334.545 72<br />
(1) GW = ground water, SW = surface water, RO = reverse osmosis<br />
(2) IMPORT = <strong>Water</strong> purchased or transferred from another utility.<br />
(3) EXPORT = <strong>Water</strong> sold or transferred to another utility.<br />
(4) TREATMENT LOSS = Annual average gallons per day which are lost in routine treatment for potability. This includes, but is not limited to, desaliNAtion reject water, sand filtration<br />
backwash, and quantities used to maintain appropriate water quality in pipelines or tanks. Treatment losses are calculated as raw water into the plant minus treated water out of the<br />
plant. In addition, this can include no more than 1% of treated water volume delivered to the distribution system for flushing distribution lines for potability.<br />
(5) GROSS USE (also called "finished") = (withdrawal) + (import) ‐ (export) ‐ (treatment loss).<br />
(6) HOUSING UNITS SERVED = Housing units served reported by the utility. If no <strong>2011</strong> data was submitted, the estimated housing units served was based on parcel‐level BEBR‐MED<br />
projections published in <strong>2011</strong> (October <strong>2011</strong> GISA deliverable) ÷ 2010 US Census Persons Per Household.<br />
(7) AVG PPH = 2010 Census PPH by utility service area. 1<strong>2011</strong>1 Data to Complete Appendix C Worksheets, Demographics web page.<br />
<strong>Southwest</strong> <strong>Florida</strong> <strong>Water</strong> <strong>Management</strong> District Page | 422
<strong>2011</strong> ESTIMATED WATER USE REPORT<br />
TABLE E1: UNIFORM PER CAPITA REPORT PREPARED FOR THE FLORIDA DEPARTMENT OF ENVIRONMENTAL PROTECTION, <strong>2011</strong><br />
WUP<br />
No.<br />
Permittee Name<br />
Average<br />
Annual<br />
Pumpage<br />
P<br />
S<br />
A<br />
R<br />
Treatment<br />
Loss<br />
Housing<br />
Units<br />
Served<br />
Residential<br />
Population<br />
Served<br />
DEP<br />
Gross<br />
Per<br />
Capita<br />
Gross<br />
Avg.<br />
Residential Residential<br />
Source Imports Exports<br />
<strong>Use</strong><br />
PPH<br />
<strong>Use</strong> Per Capita<br />
(mgd) Rec (mgd) (mgd) (mgd) (mgd) (gpcd) (mgd) (gpcd)<br />
(1) (2) (3) (4) (5) (6) (7) (8) (9) (10) (11)<br />
(8) RESIDENTIAL POPULATION SERVED = (housing units served reported by the utility) * (2010 census utility service area avg pph). If no <strong>2011</strong> data was submitted, the estimated<br />
housing units served was based on parcel‐level BEBR‐MED Projections published in <strong>2011</strong> (October <strong>2011</strong> GISA deliverable) ÷ 2010 US Census Persons Per Household.<br />
(9) DEP GROSS PER CAPITA = (gross use) / (residential population served). Population‐related withdrawals associated with residential, business, institutioNAl, industrial,<br />
miscellaneous metered, and water loss uses are applicable to all public supply permits.<br />
(10) RESIDENTIAL USE = <strong>Use</strong> reported by utility for only residential purposes. If no data was submitted for 2010 the countywide % residential use was applied.<br />
(11) RESIDENTIAL PER CAPITA = = [(residential use) / (residential population served).<br />
NA = Not available.<br />
If the PSAR was not received, withdrawal totals were based on reported annual metered pumpage (WMIS) and 2010 dwelling units served.<br />
<strong>Southwest</strong> <strong>Florida</strong> <strong>Water</strong> <strong>Management</strong> District Page | 423
<strong>2011</strong> ESTIMATED WATER USE REPORT<br />
APPENDIX F<br />
ESTIMATED WATER USE REPORT<br />
METHODOLOGY AND CHANGES<br />
<strong>Southwest</strong> <strong>Florida</strong> <strong>Water</strong> <strong>Management</strong> District Page | 424
<strong>2011</strong> ESTIMATED WATER USE REPORT<br />
WATER USE PERMIT BUSINESS RULES AND CONSTRUCTION<br />
All water use permits (WUPs) have at least one active withdrawal point, at least one water demand,<br />
and at least one gallon of water per day permitted. The sum of the permitted annual average<br />
quantity and maximum daily quantity for the demand for each withdrawal point should be equal to<br />
the permitted annual average quantity and maximum daily quantity of the withdrawal point that is<br />
used to obtain the demand quantities. The sum of the permitted annual average quantity and<br />
maximum daily quantity of all active withdrawal points should be equal to the WUP total annual<br />
average quantity and maximum daily quantity. Another quantity type is the peak month quantity,<br />
and since those are relative to the month of use, the same business rules just given do not apply to<br />
them.<br />
Withdrawal points are either groundwater wells or surface water withdrawal pipes. Each<br />
withdrawal point is described with respect to its type, purpose and intent. The descriptions are<br />
codified to facilitate analyses (described below).<br />
All WUPs have water demand. The water demand is codified by a series of water use codes that<br />
describe the reason a WUP is needed. These codes are alphanumeric and the alpha portion of the<br />
code puts the use code into one of five water use categories:<br />
Agriculture,<br />
Public Supply,<br />
Recreation/Aesthetic,<br />
Industrial/Commercial, And<br />
Mining/Dewatering.<br />
Most WUPs have many detailed uses catalogued. The detailed uses are grouped into the five water<br />
use categories mentioned earlier, but just grouping the metered plus estimated pumpage into the<br />
five water use categories does not give enough detail on why more water is used for certain water<br />
demand categories than others. However, the report would become overly complicated if each<br />
detailed use was tallied alone. This report assigns the detailed uses into groups based on general<br />
similarities. To illustrate, a WUP that is issued predominantly for agriculture use could be<br />
permitted for water to irrigate a mixture of crop types (for example, beans, broccoli, and citrus), as<br />
well as water for livestock and for potable water provided to farm workers. The crops will be in the<br />
agriculture water use category, and the detailed use will show citrus in its own group, but the<br />
quantities for beans will be put into the “Field Crops,” and the quantities for broccoli will be put into<br />
the “Vegetables” group. The water permitted for livestock will be put into the “Animals” group, and<br />
the potable water will be put into the “Public Supply” water use category.<br />
As awareness that fresh water was a limited resources in the District increased, so did the<br />
complexity of how permittees used it, the complexity of how it is regulated in light of its complex<br />
use, and the complexity of water use permits to use it. Prior to 2000, demand was not listed to the<br />
withdrawal point used to obtain it. Now, most of the use codes are assigned to a withdrawal point.<br />
In the case of public supply utilities that treat the water before it is distributed for use, the use is<br />
not described at the withdrawal point level.<br />
For management purposes, all water use permits (WUPs) are given a series of alpha‐numeric codes<br />
that define attributes of the WUP with respect to its location, purpose, and the intent and use of the<br />
water. Only certain attributes of the WUP are saved for this report. These are attributes associated<br />
with the permit itself (permit number, revision, issue date(s), delete date(s), status, county, water<br />
use caution area, total permitted annual average and maximum daily quantities); with withdrawal<br />
points (District identification number, type, status, function (use), operation, permitted annual<br />
average and maximum day quantities, latitude/longitude, county, and metering and pumpage<br />
<strong>Southwest</strong> <strong>Florida</strong> <strong>Water</strong> <strong>Management</strong> District Page | 425
<strong>2011</strong> ESTIMATED WATER USE REPORT<br />
condition codes); and permitted uses (predominant use, detail uses, District identification number<br />
associated with the uses, and annual average permitted quantities per detailed use). All WUPs have<br />
a status in WMIS to indicate if they are active. WUP applications received are given a status of<br />
“Submitted”. When the WUP is issued, the status changes to “Approved”. However, after a WUP is<br />
issued on paper to the permittee, the WUP may not be fully input to the WUP database in WMIS.<br />
Thus, a WUP can still be in the “Submitted” status when the snapshot is taken, even though it has<br />
been issued. If so, it will be missed initially (but it will be found during the quality control<br />
operations of this process). Other WUPs are shown as “Expired”, Cancelled”, or “Denied”.<br />
Applications that are withdrawn by the applicant before issuance are shown as “Withdrawn”.<br />
ESTIMATED WATER USE REPORT METHODOLOGY<br />
The <strong>Estimated</strong> <strong>Water</strong> <strong>Use</strong> Reports utilize SAS programs to access water use permitting data from<br />
the District mainframe database. These programs were originally written in 1994, and only minor<br />
changes were performed on them to conform to District internal and external boundaries. The<br />
internal boundaries are the water use caution areas (WUCAs) and other areas of water resource<br />
concern as they were created, modified and terminated from 1994 to <strong>2011</strong> The external boundary<br />
was changed when the District received an area of responsibility in Polk County around Lake<br />
Lowery in July 2003 from the St. John’s River <strong>Water</strong> <strong>Management</strong> District. In 2010, changes were<br />
introduced to what data were kept for analysis and what data were ignored by the SAS programs.<br />
The basic process was not changed, and it will be described first.<br />
Data Capture<br />
The entire <strong>Water</strong> <strong>Use</strong> Permit (WUP) database in the <strong>Water</strong> <strong>Management</strong> Information System<br />
(WMIS) is copied, preferably on December 31 by an initial SAS program. If that day falls on a<br />
weekend, the following Monday is the copy date. For this report, the WUP database in WMIS was<br />
copied “as‐is” on December 31, <strong>2011</strong>, becoming the <strong>Estimated</strong> <strong>Water</strong> <strong>Use</strong> (EWU) database. A<br />
program retrieves pumpage for the year on all WUPs for which pumpage was submitted.<br />
Data Filtering<br />
Another set of SAS programs takes the output from the pumpage program and the EWU database<br />
program and applies filters to remove WUPs, withdrawal points, and uses (use codes) that do not<br />
pertain to quantities of water withdrawn from the resource. Some filtering always was applied in<br />
that only WUPs in “Approved” status were kept, only groundwater and surface water withdrawal<br />
points were kept, and only proposed and existing withdrawal points were kept. Additional filtering<br />
was first implemented in 2010 and expanded in <strong>2011</strong>. Details are given below in the section,<br />
CHANGES TO THE ESTIMATED WATER USE REPORT.<br />
Data Correction<br />
The 2010 and <strong>2011</strong> data on WUPs for the 2010 EWU Report and <strong>2011</strong> EWU Report were heavily<br />
corrected by this author and water use permitting staff who knew how the water use was supposed<br />
to be coded to describe the water use accurately. Most of the proposed corrections were corrected<br />
in the database by <strong>Water</strong> <strong>Use</strong> Permit Compliance Section staff in time for the next EWU snapshot<br />
(December 31, 2012). All were programmatically input into the <strong>2011</strong> <strong>Estimated</strong> <strong>Water</strong> <strong>Use</strong><br />
database. Because the corrections just dealt with internally codifying water use, none of the WUPs<br />
involved had to be corrected and reissued.<br />
Quality Assessment/Quality Control (QA/QC) After a good dataset with respect to included and<br />
excluded components is created, another set of SAS programs are run to look for incongruities in<br />
each WUP with respect to the business rules for water use permits. Each WUP is given numerous<br />
codes that define the purpose, intent and use of the water as well as identifying special conditions<br />
applied to the WUP. These codes allow the evaluation of the construction of a WUP according to the<br />
business rules. Programming is tied to these codes. As the way a WUP was codified changed<br />
<strong>Southwest</strong> <strong>Florida</strong> <strong>Water</strong> <strong>Management</strong> District Page | 426
<strong>2011</strong> ESTIMATED WATER USE REPORT<br />
significantly from 2005 through 2009, there was opportunity for miscoding mistakes to occur.<br />
Changes to the WUP application evaluation process and to the database from the IBM format to the<br />
Oracle format for WMIS were still in the developmental state when they were implemented. This<br />
resulted in codification mistakes where it appeared that permits were issued with quantities<br />
permitted to withdrawal points for which there was no stated demand; demand on WUPs but no<br />
active withdrawal points listed with which to access the water; and variations between these.<br />
Monthly pumpage by metered WUPs are analyzed for outlier quantities. These are monthly<br />
pumpage values of a certain magnitude higher or significantly lower than permitted withdrawal<br />
point quantities.<br />
Correction Programs Staff assigned to the EWU report have SAS programs to assist in the research<br />
for corrections to both incongruities in the construction of the WUP and for errors in pumpage<br />
recorded. Once the correct data is identified, it is programmed into correction programs that will<br />
replace the error in the EWU database with the correct data.<br />
Iterative QA/QC When corrections have been identified, they are input into various SAS correction<br />
programs to correct the basic data (never overriding the original data, which is kept as historic<br />
record within the SAS folder on the mainframe). The SAS programs from the first one that gathered<br />
the pertinent pumpage through the QA/QC programs are rerun. Multiple iterations are run until<br />
the programs that look for apparent errors show zero errors. The found errors are communicated<br />
to Resource Regulation in an ongoing manner where they are vetted by water use permitting staff<br />
before being corrected in the WMIS database. If an apparent correction was not approved,<br />
discussion ensued to find the correction and that solution is programmed into the appropriate<br />
correction program.<br />
Data Compilation<br />
The now‐filtered and corrected EWU database goes through another suite of SAS programs that<br />
compile the multifaceted demand data into demand groups, identify the predominant demand use<br />
type category for each WUP, and that determine how much of the WUP pumpage should be<br />
attributed to each withdrawal point.<br />
Scaling Even after the filtering process, there are a minority of WUPs where the sum of permitted<br />
quantities per withdrawal point is not equal to the permit quantity total. Permitted quantities per<br />
withdrawal point are normalized to the WUP total. Each withdrawal point’s annual average<br />
quantity is scaled up or down proportionately so that their sum is equal to the WUP’s permitted<br />
annual average total.<br />
Fractioning This process apportions pumpage to water uses. The water use category having the<br />
highest quantity of water permitted is the predominant use of the permit. Generally, this is also<br />
how the quantities are described in this report. However, if a withdrawal point on the permit is<br />
specifically labeled for a different water use category, the permitted and pumped totals for it are<br />
put into the “different” water use category in the tables and charts.<br />
The normalized (scaled) withdrawal point annual average totals are applied to the withdrawal<br />
point associated water use (detailed demand). If the water use is not listed per withdrawal point,<br />
the detailed demands are shared equally among the withdrawal points. Each water use demand on<br />
a WUP then gets a fraction of the pumpage recorded or estimated for the entire WUP. The fraction<br />
is equal to the total WUP pumpage multiplied by the ratio of the withdrawal point scaled permitted<br />
annual average total to the WUP annual average total. The resulting “use‐pumpage” numbers are<br />
then tallied by source type (groundwater or surface water), by month, by county, and by water use<br />
caution areas.<br />
<strong>Southwest</strong> <strong>Florida</strong> <strong>Water</strong> <strong>Management</strong> District Page | 427
<strong>2011</strong> ESTIMATED WATER USE REPORT<br />
Quantity Tiers WUPs are divided into four tiers according to the total annual average quantity<br />
permitted to it. This is not the same as the three classes of WUPs that are issued based on total<br />
annual average quantity permitted to it. Tier 1 is for WUPs with annual average quantities less<br />
than 50,000 gpd; tier 2 is for WUPs with annual average quantities for 50,000 gpd to 100,000 gpd;<br />
Tier 3 is for WUPs for greater than 100,000 but less than 500,000 gpd; and Tier 4 is for WUPs for<br />
500,000 gpd and more. Each tier is divided into the five use type categories making 20 “use‐tiers”.<br />
The monthly pumped quantities from metered withdrawal points in each “use‐tier” are divided by<br />
the WUP permitted total for that use. The ratios are put into an ordered distribution from smallest<br />
ratio to largest ratio. In an ordered distribution, the 50 th percentile is the median. In a perfectly<br />
normal distribution, the average (mean) and the median are equal. If the distribution is skewed,<br />
the median is not equal to the mean. Pumpage data in the District includes zeros for permittees<br />
that not only do not pump their withdrawal points, but that do pump but do not submit their meter<br />
readings. It also includes over‐pumpers who have a ratio greater than 1.0. Reporting errors create<br />
outliers much greater than 1.0. Research of pumpage data at the District indicated that out of the<br />
metered WUPs, there are more permittees that use the water than not. This skews the distribution<br />
to the right. However, at the same time, there are zeros for permittees who either do not have to<br />
submit their pumpage or those who do have to submit it but do not. There are more of these than<br />
over‐pumpers or erroneous outlier values, so to negate the affect of the non‐submitters, a range of<br />
percentiles greater than the median but less than what could contain the erroneous outliers is<br />
analyzed. These percentiles are the 55 th through the 80 th within the distribution. A series of<br />
graphing SAS programs checks the validity of the percentiles chosen per use per “use‐tier” for a<br />
visual check on the best percentiles to use, and adjustments are made per use per tier if necessary.<br />
Estimating Pumpage for Unmetered WUPs The unmetered WUPs are divided into the same 20<br />
“use‐tiers” as was done for the metered WUPs. For each “use‐tier”, monthly pumpage of nonmetered<br />
permits are estimated based upon the ratio of actual pumpage quantities to permitted<br />
quantities that was calculated for permits that are metered in that same “use‐tier”. <strong>Water</strong> use type<br />
category, size of permit, and season of usage (for irrigation permits) determine which ratio is<br />
applied to the non‐metered permits. The total permitted annual average quantity for the WUP is<br />
multiplied by the appropriate ratio to generate an estimate of its pumpage.<br />
Final Compilation The data from all of the calculation programs is compiled to generate permitted<br />
quantity totals and used quantity totals per predominant use type category, water source, county,<br />
and water use caution area. The data is separated into that which is directly metered and that<br />
which is estimated. Each WUP is listed according to its county and use type, and its metered or<br />
estimated pumpage, total permitted quantity, and permitted quantity to the use type is recorded.<br />
The EWU report staff use the output from these programs to generate the charts, tables, and<br />
appendices used in the report.<br />
A final SAS program compiles use data for WUPs that are permitted for 1,000,000 gpd or more of<br />
water on an annual average basis.<br />
Outside data<br />
Other data used in the report are the Public Supply Annual Reports submitted by the larger public<br />
supply utilities, population data from the University of <strong>Florida</strong> Bureau of Economic and Business<br />
Research, and the <strong>Florida</strong> Department of Environmental Protection Uniform Per Capita Report.<br />
<strong>Southwest</strong> <strong>Florida</strong> <strong>Water</strong> <strong>Management</strong> District Page | 428
<strong>2011</strong> ESTIMATED WATER USE REPORT<br />
METERING HISTORY AT THE SOUTHWEST FLORIDA WATER MANAGEMENT DISTRICT<br />
Prior to 1989, metering was required only on WUPs for 500,000 gallons (of water) per day (gpd) or<br />
more quantities on an annual average basis. Between 1989 and 1992, metering was required on all<br />
WUPs for 100,000 gpd or more quantities on an annual average basis in the Northern Tampa Bay<br />
<strong>Water</strong> <strong>Use</strong> Caution Area (NTB WUCA) and in part of the Southern <strong>Water</strong> <strong>Use</strong> Caution Area<br />
(SWUCA), formerly known as the Eastern Tampa Bay WUCA and Highlands Ridge WUCA. By<br />
January 1992 all that were required to be metered were metered (under a meter costreimbursement<br />
program by the District). In 2003, the SWUCA was established, replacing the<br />
Eastern Tampa Bay WUCA and the Highlands Ridge WUCA and including the counties between<br />
those two former WUCAs. Metering requirements were added to WUPs for 100,000 gpd or more on<br />
an annual average basis in the new area added to the SWUCA. Permittees began installing these<br />
meters (under another meter cost‐reimbursement program) beginning in 1995. By 2003 all<br />
permits in the SWUCA that were required to be metered were metered. In 2007, the NTB WUCA<br />
was expanded to include all of Pasco County and all of Hillsborough County that was not in the<br />
SWUCA. Metering conditions were applied to all WUPs for 100,000 gpd or more on an annual<br />
average basis in the added area under another meter cost‐reimbursement program by the District.<br />
In <strong>2011</strong>, rules for Dover/Plant City WUCA were implemented. These rules required meters to be<br />
installed on all withdrawal points permitted for freeze protection quantities or withdrawal points<br />
permitted for annual average quantities for a use that typically requires freeze protection. The<br />
District reimbursed the affected permittees for the cost of buying and installing the meters. It also<br />
paid for automatic meter reading (AMR) devices to be installed on each new or existing meter<br />
associated with freeze protection pumping. Further, the District paid (and is committed to continue<br />
to pay) the subscription costs to have a vendor electronically read the meters and transmit the data<br />
to the District in real time.<br />
CHANGES TO THE ESTIMATED WATER USE REPORT<br />
A summary of some changes made to the compilation of the estimated water use report in 2010 and<br />
<strong>2011</strong> are:<br />
Exclusion of certain types of withdrawal points In the process of apportioning metered or<br />
estimated water use to one of the five water use categories, the EWU process sums the annual<br />
average permitted quantities of all withdrawal points on a permit. This sum is compared to the<br />
WUP total annual average quantity, and all withdrawal points annual average quantity is scaled so<br />
that the sum of their “new” annual average quantity equals the permit total annual average<br />
quantity. This “new” annual average quantity for the withdrawal point determines how much<br />
pumpage is apportioned to it and its associated use (demand).<br />
The <strong>Florida</strong> Administrative Code requires a WUP to be issued for a withdrawal point if its outer<br />
diameter is above a certain threshold (Rule 40D‐2.041). There are instances where the water is<br />
used for its geothermal properties and then put back into the source from which it was withdrawn.<br />
The use is categorized in the database, but it is not really a water withdrawal. Historically, surface<br />
water pumps that were used to route water around a property were not included on a WUP.<br />
However, surface water withdrawal points that withdrew water from a pond or other storage<br />
facility into which resource water are put on a WUP to ensure that the amount input was at least<br />
the amount pumped out. This was because aesthetic augmentation of artificial impoundments is<br />
not allowed (unless grandfathered in from the 1980’s). Since many of these “withdrawal points”<br />
didn’t really remove water from the resource, they were removed from the estimated water use<br />
process.<br />
The filtering for the 2010 and <strong>2011</strong> EWU reports removes categories of withdrawal points<br />
depending upon what is being counted: pumpage quantities or permitted quantities. For example,<br />
<strong>Southwest</strong> <strong>Florida</strong> <strong>Water</strong> <strong>Management</strong> District Page | 429
<strong>2011</strong> ESTIMATED WATER USE REPORT<br />
rotational withdrawal points (those only used sequentially per year) and standby withdrawal<br />
points are not included in the count of permitted quantities; however, the pumpage from them has<br />
to be included in the tally of withdrawals from the resource. Withdrawal points that are permitted<br />
with full permit quantities each in order to afford the permittee flexibility in which withdrawal<br />
point to use are not included in the tally of permitted quantities but are included in the tally of<br />
pumpage. Other withdrawal points that withdraw water from a storage pond or reservoir into<br />
which resource water was put are excluded in both counts. The water that was permitted to and<br />
withdrawn by the augmentation withdrawal point, or water that was obtained from an outside<br />
source were already counted.<br />
Dewatering withdrawal points are not included in either tally unless the water is discharged offsite.<br />
If it is routed to recirculation ponds, only the losses associated with the routing and evaporation are<br />
included in the tally of permitted quantities. Wells listed on the permit that only inject disposal<br />
water into the aquifer, or are used to recharge the aquifer or to put water into aquifer storage for<br />
later recovery are not counted in either tally. The latter two types have had the permitted and<br />
pumped quantities counted on the withdrawal point used to obtain the water that is recharged to<br />
the aquifer or is stored in the aquifer. Reclaimed water and other types of alternative water supply<br />
sources are excluded in both counts, with the exception of captured stormwater. Stormwater is<br />
considered a natural resource even though it can be categorized as an alternative water supply, if it<br />
is captured in an impoundment created specifically to capture excess stormwater runoff.<br />
Previously, all of these “withdrawal points” were included in the sum of the annual average<br />
quantities of the withdrawal points, and then all withdrawal points on the permit were scaled back<br />
to match to the permit total. This caused excess scaling back of quantities permitted to withdrawal<br />
points that actually did withdraw water from the resource. Thus, too little of the total pumpage<br />
quantities were apportioned to them and their uses.<br />
Exclusion of certain type of water uses Some use codes that are in the database exist to quantify<br />
amounts of water that fall into certain regulatory categories, such as “Significant <strong>Use</strong>” on public<br />
supply WUPs in the Southern <strong>Water</strong> <strong>Use</strong> Caution Area. All such use codes and associated quantities<br />
are now removed from the WUP prior to the calculations.<br />
Freeze protection & Standby Withdrawal Points Since the <strong>Estimated</strong> <strong>Water</strong> <strong>Use</strong> Reports dealt only<br />
with annual average pumpage, withdrawal points that did not have an annual average quantity<br />
permitted to it were excluded. Some standby withdrawal points were not given an annual average<br />
quantity in the “annual average quantity” data field but were given it in the “additional standby”<br />
field. Since the field targeted by the SAS program was blank, the program did not keep any records<br />
for such withdrawal points, including pumpage. Also, withdrawal points used only for freeze<br />
protection of crops often do not have an annual average quantity assigned to them. This is because<br />
freeze protection quantities are not annualized and added to the total annual average quantity. So<br />
the SAS program did not keep such withdrawal points and their pumpage. The <strong>2011</strong> EWU process<br />
has been changed so that it captures the pumpage from freeze‐protection‐only withdrawal points<br />
and makes estimates on the use of freeze‐protection‐only withdrawal points that are not metered.<br />
Estimates of pumpage on unmetered standby withdrawal points were never made and will not be<br />
made because there is no predictive tool for the use of a standby withdrawal point.<br />
Missed WUPs/Missed Pumpage The District does not delay the issuance of permits so that they can<br />
be entered into the database first. Thus, for WUPs that require manual input of some components<br />
(usually those issued for 100,000 gpd or more), final entry into the database lags behind the issue<br />
date. For this reason, permits that are issued at the end of the year may not be shown in the end‐ofyear<br />
snapshot as an approved WUP. The longest time lags are for the larger, more complicated<br />
WUPs, and it can made a significant difference to the total quantities tallied in the water use<br />
categories and counties when they are included. Also, WUPs that existed under one WUP number<br />
<strong>Southwest</strong> <strong>Florida</strong> <strong>Water</strong> <strong>Management</strong> District Page | 430
<strong>2011</strong> ESTIMATED WATER USE REPORT<br />
for part of the year and under a different WUP number at the end of the year were missed. These<br />
are WUPs that were partially transferred to another permittee or were combined into another<br />
WUP. Their permitted quantity should not be included in the permitted quantity tally, but their<br />
pumpage under the old WUP number should be included in the pumpage tally for the new WUP<br />
number. For <strong>2011</strong> forward, another program is run after the snapshot to find these permits and<br />
programmatically add them to the EWU database.<br />
<strong>Southwest</strong> <strong>Florida</strong> <strong>Water</strong> <strong>Management</strong> District Page | 431


