Systems Analysis of Zaragoza Urban Water - SWITCH - Managing ...
Systems Analysis of Zaragoza Urban Water - SWITCH - Managing ...
Systems Analysis of Zaragoza Urban Water - SWITCH - Managing ...

You also want an ePaper? Increase the reach of your titles
YUMPU automatically turns print PDFs into web optimized ePapers that Google loves.
<strong>Systems</strong> <strong>Analysis</strong> <strong>of</strong> <strong>Zaragoza</strong> UWS<br />
Guillermo Penagos<br />
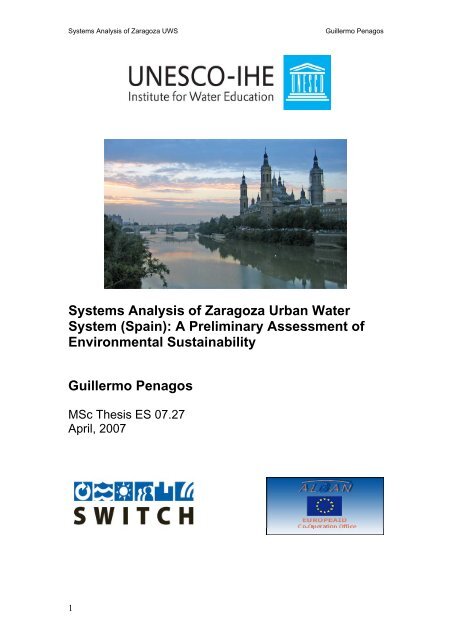
<strong>Systems</strong> <strong>Analysis</strong> <strong>of</strong> <strong>Zaragoza</strong> <strong>Urban</strong> <strong>Water</strong><br />
System (Spain): A Preliminary Assessment <strong>of</strong><br />
Environmental Sustainability<br />
Guillermo Penagos<br />
MSc Thesis ES 07.27<br />
April, 2007<br />
1
<strong>Systems</strong> <strong>Analysis</strong> <strong>of</strong> <strong>Zaragoza</strong> UWS<br />
Guillermo Penagos<br />
<strong>Systems</strong> <strong>Analysis</strong> <strong>of</strong> <strong>Zaragoza</strong> <strong>Urban</strong> <strong>Water</strong><br />
System (Spain): A Preliminary Assessment <strong>of</strong><br />
Environmental Sustainability<br />
Master <strong>of</strong> Science Thesis<br />
By<br />
Guillermo Penagos<br />
Supervision<br />
P. N. van der Steen, PhD, MSc (UNESCO-IHE)<br />
Examination Committee<br />
Pr<strong>of</strong> K. Vairavamoorthy (UNESCO-IHE), Chairman<br />
P. N. van der Steen, PhD, MSc (UNESCO-IHE)<br />
R de Graaf, MSc (external)<br />
This research is done for the partial fulfilment <strong>of</strong> the requirements for the Master<br />
<strong>of</strong> Science degree at UNESCO-IHE Institute for <strong>Water</strong> Education, Delft,<br />
the Netherlands<br />
Delft<br />
April, 2007
<strong>Systems</strong> <strong>Analysis</strong> <strong>of</strong> <strong>Zaragoza</strong> UWS<br />
Guillermo Penagos<br />
Abstract<br />
The environmental performance <strong>of</strong> <strong>Zaragoza</strong> urban water system <strong>of</strong> (Spain) is analyzed<br />
by means <strong>of</strong> LCA with focus on water withdrawal and use; energy and chemical products<br />
consumption; CO 2 emissions; and emissions <strong>of</strong> nutrients and heavy metals to the<br />
receiving water body and to sewage sludge. All these variables are recommended to be<br />
used as indicators for sustainability <strong>of</strong> this urban water system. The time horizon covers<br />
six years between 2000 and 2006; a period where the water supply system is being<br />
optimized and industrial and water consumption is being reduced. Results show that<br />
despite a significant reduction <strong>of</strong> water withdrawal and unaccounted, resource<br />
consumption and final releases to the environment have remained steady. Groundwater<br />
is an important component <strong>of</strong> the urban water cycle, but due to its origin as agriculture<br />
irrigation excess if facing issues <strong>of</strong> quality. This resource will be possibly threatened in<br />
the future if irrigation systems upstream from <strong>Zaragoza</strong> are optimized. A problem tree<br />
analysis revealed that mayor drivers <strong>of</strong> environmental sustainability for <strong>Zaragoza</strong> water<br />
cycle are population increase; Spanish national policies on water and environment and<br />
climate change. A scenario analysis showed that industrial recycling would be a good<br />
strategy to continue reducing water withdrawal and it will also contribute to reduce<br />
energy consumption as well as CO 2 emissions, whereas all other analyzed indicators are<br />
expected to worsen as long as current societal production and consumption patterns;<br />
and wastewater treatment technologies remain the same. Comprehensive strategies that<br />
involve not just technical solutions are required in order to assure the environmental<br />
sustainability <strong>of</strong> this system.<br />
Keywords: Environmental performance, Life cycle assessment, sustainability indicators,<br />
urban water systems, pollution loads, resource consumption, scenario analysis.<br />
Acknowledgements: This report is the result <strong>of</strong> research to the M Sc Programme in<br />
Environmental Science <strong>of</strong> the UNESCO-IHE Institute for <strong>Water</strong> Education, financed by<br />
the Programme Alßan – European Union Programme <strong>of</strong> High Level Scholarships for<br />
Latin America (no. E05M054643CO); and the UNESCO-IHE Fellowship Trust Fund. This<br />
research is part <strong>of</strong> the <strong>SWITCH</strong> project funded by the FP 6 programme <strong>of</strong> the European<br />
Union (no. 018530).<br />
3
<strong>Systems</strong> <strong>Analysis</strong> <strong>of</strong> <strong>Zaragoza</strong> UWS<br />
Guillermo Penagos<br />
Table <strong>of</strong> Contents<br />
Abstract 3<br />
Acknowledgements 3<br />
Table <strong>of</strong> contents 4<br />
List <strong>of</strong> figures 5<br />
List <strong>of</strong> tables 6<br />
List <strong>of</strong> annexes 6<br />
Abbreviations 7<br />
1. Introduction 8<br />
2. Background 9<br />
3 Materials and Methods 15<br />
3.1 Study site 15<br />
3.2 General Approach 16<br />
3.2.1 Developing flow diagram 17<br />
3.2.2 Time horizon 17<br />
3.2.3 Data collection 17<br />
3.2.4 Data analysis 18<br />
3.2.4.1 Storm water 18<br />
3.2.4.2 Energy consumption and CO 2 emissions from transportation 18<br />
3.2.4.3 CO 2 Emissions from electricity consumption 19<br />
3.2.4.4 CO 2 production from sludge 19<br />
3.2.5 Scenario analysis 19<br />
4 Results 20<br />
4.1 Data availability and information gaps 20<br />
4.2 . General features <strong>of</strong> <strong>Zaragoza</strong> UWS 20<br />
4.2.1 <strong>Water</strong> inputs 23<br />
4.2.1.1 Tap water source 23<br />
4.2.1.2 Storm water 24<br />
4.2.1.3 Agriculture irrigation systems 25<br />
4.2.1.4 Ground water 26<br />
4.2.2 Drinking water treatment 26<br />
4.2.3 Distribution network 27<br />
4.2.4 <strong>Water</strong> use 28<br />
4.2.5 Sewer system 30<br />
4.2.6 Wastewater treatment 31<br />
4.3 Environmental performance <strong>of</strong> <strong>Zaragoza</strong> UWS 32<br />
4.3.1 Use <strong>of</strong> chemical products 32<br />
4.3.2 Energy consumption and Atmospheric emissions 34<br />
4.3.3 Heavy metals 37<br />
4.3.4 Organic matter 38<br />
4.3.5 Nutrients 38<br />
4.3.6 Sludge production 42<br />
4.4 <strong>Zaragoza</strong> UWS in the future 42<br />
4.4.1 Focus problem and drivers affecting <strong>Zaragoza</strong> sustainability vision 43<br />
4.4.1 Criteria for classification <strong>of</strong> drivers 44<br />
4.4.1.1 Less important – less uncertain 44<br />
4.4.1.2 Less important – more uncertain 45<br />
4.4.1.3 More important – less uncertain 45<br />
4.4.1.4 More important – more uncertain 46<br />
4.4.3 Scenario analysis 47<br />
4.4.3.1 Setting Scenario 47<br />
4.4.3.2 Assumptions for Scenario analysis 47<br />
4.4.3.3 Suggested strategy: Industrial water recycling 48<br />
4.4.3.3.1 Effect <strong>of</strong> water recycling on water withdrawal 48<br />
4.4.3.3.2 Effect <strong>of</strong> water recycling on chemical products consumption 49<br />
4
<strong>Systems</strong> <strong>Analysis</strong> <strong>of</strong> <strong>Zaragoza</strong> UWS<br />
Guillermo Penagos<br />
4.4.3.3.3 Effect <strong>of</strong> water recycling on Energy consumption 50<br />
4.4.3.3.4 Effect <strong>of</strong> water recycling on CO 2 emissions to the atmosphere 51<br />
4.4.3.3.5 Effect <strong>of</strong> water recycling on pollution loads to the Ebro River 52<br />
4.4.3.4 Assessment <strong>of</strong> water quantity and quality for <strong>Zaragoza</strong> in the future 52<br />
4.4.3.5 Setting priorities for pollution loads 54<br />
5 Discussion 59<br />
5.1 Sustainability <strong>of</strong> UWS 59<br />
5.2 LCA as a tool for Sustainability assessment 60<br />
5.3 Sustainability Indicators 60<br />
5.4 Sustainability vision 63<br />
5.5 Drivers for sustainable urban water planning and management 65<br />
5.6 Set vs achieved goals for this research 68<br />
6 Conclusions 69<br />
7 References 71<br />
List <strong>of</strong> figures<br />
Figure 1. Satellite map for <strong>Zaragoza</strong> and its location in Spain 15<br />
Figure 2. Flow Diagram for <strong>Zaragoza</strong> UWS. 22<br />
Figure 3. Ebro river discharge at “Canal Imperial” diversion 23<br />
Figure 4. Annual precipitation hydrographs for <strong>Zaragoza</strong>. 24<br />
Figure 5. Irrigation in <strong>Zaragoza</strong> province. 25<br />
Figure 6. Scheme <strong>of</strong> a breaking pressure tank 30<br />
Figure 7. Chemical products consumption by <strong>Zaragoza</strong> UWS. Chlorine, Allum and 33<br />
PAC are used for DWT whereas Iron Chloride is used for WWT in “Carjuja”plant<br />
Figure 8. Energy consumption <strong>of</strong> <strong>Zaragoza</strong>’s UWS per process. 35<br />
Figure 9. Current Sources <strong>of</strong> Electric Energy in Spain. 36<br />
Figure 10. Direct and Indirect CO 2 emissions <strong>of</strong> <strong>Zaragoza</strong>’s UWS 37<br />
Figure 11. CO 2 emissions <strong>of</strong> <strong>Zaragoza</strong>’s UWS per process. 37<br />
Figure 12. Heavy metals in <strong>Zaragoza</strong> waste water 38<br />
Figure 13. Heavy metals loads to the environment from <strong>Zaragoza</strong> UWS. 40<br />
Figure 14. BOD and COD loads from <strong>Zaragoza</strong>’s UWS to the Ebro River 40<br />
Figure 15. Nitrogen loads to the environment from <strong>Zaragoza</strong> UWS. 41<br />
Figure 16. Phosphorus to the environment from <strong>Zaragoza</strong> UWS. 41<br />
Fig 17. Sludge (as dry matter) production by <strong>Zaragoza</strong> UWS 42<br />
Figure 18. An exercise <strong>of</strong> problem tree analysis for <strong>Zaragoza</strong>. The core problem would 44<br />
be to<br />
Figure 19. Matrix <strong>of</strong> uncertainty vs importance to classify drivers <strong>of</strong> <strong>Zaragoza</strong> UWS 44<br />
sustainability<br />
Figure 20. Composition <strong>of</strong> electric power production market in Spain projected by 46<br />
2015 by National Plan on Energy<br />
Figure 21. <strong>Water</strong> withdrawal discriminated by actual consumption and unaccounted 49<br />
water under Sc3 scenario and different strategies for water reuse<br />
Figure 22. Energy consumption <strong>of</strong> <strong>Zaragoza</strong> UWS in 2006 and 2020 scenario with 50<br />
different levels <strong>of</strong> Industrial water recycling strategy<br />
Figure 23. CO 2 emissions from <strong>Zaragoza</strong> UWS in 2006 and 2020 scenario with 51<br />
different levels <strong>of</strong> Industrial water recycling strategy<br />
Figure 24. Current and projected water storage regimes for Yesa reservoir on a 53<br />
hydrologic<br />
Figure 25. Regimes for Ebro River at <strong>Zaragoza</strong> under current conditions and projected 54<br />
conditions under Sc3 Scenario.<br />
Figure 26. Impact <strong>of</strong> <strong>Zaragoza</strong> UWS upon TP concentrations at the Ebro River. 55<br />
Figure 27. Seasonal variability <strong>of</strong> impact percentages <strong>of</strong> <strong>Zaragoza</strong> UWS on the Ebro 56<br />
River taking TP as example. Current and future scenarios.<br />
5
<strong>Systems</strong> <strong>Analysis</strong> <strong>of</strong> <strong>Zaragoza</strong> UWS<br />
Guillermo Penagos<br />
List <strong>of</strong> tables<br />
Table 1. <strong>Zaragoza</strong>’s Primary Distribution System. Current situation 27<br />
Table 2. Evolution <strong>of</strong> water withdrawal and consumption in <strong>Zaragoza</strong> 29<br />
Table 3. Classification <strong>of</strong> industrial discharges in <strong>Zaragoza</strong> in 2005 31<br />
Table 4. <strong>Zaragoza</strong> public WWTPs 32<br />
Table 5. Goals <strong>of</strong> the Aalborg summit that apply to the UWS <strong>of</strong> <strong>Zaragoza</strong> 43<br />
Table 6. Possible drivers scenarios for Zarzgoza UWS 47<br />
Table 7. Seasonal impact peaks <strong>of</strong> <strong>Zaragoza</strong> UWS upon the Ebro River under present 58<br />
conditions and worst climate change scenarios for 2020 and 2060.<br />
List <strong>of</strong> annexes<br />
Annex 1. Inventory for data necessary to perform LCA and its availability in <strong>Zaragoza</strong><br />
Annex 2. Raw Data for the Drinking <strong>Water</strong> Treatment Plant <strong>of</strong> <strong>Zaragoza</strong> on monthly<br />
basis<br />
Annex 3. Raw Data for Energy Consumption <strong>of</strong> the <strong>Water</strong> Distribution Network in<br />
<strong>Zaragoza</strong><br />
Annex 4. Groundwater flows and energy consumed for groundwater extraction<br />
Annex 5. Raw Data for “Cartuja” WWTP<br />
Annex 6. Raw Data for “Almozara” WWTP<br />
Annex 7. Raw Data for “Paper mills” WWTP<br />
Annex 8. Calculations <strong>of</strong> CO 2 emissions from electricity consumption<br />
Annex 9. Calculation <strong>of</strong> Environmental Impacts from Transportation<br />
Annex 10. Calculations for Storm water overflows to the Ebro River<br />
6
<strong>Systems</strong> <strong>Analysis</strong> <strong>of</strong> <strong>Zaragoza</strong> UWS<br />
Guillermo Penagos<br />
Abbreviations<br />
BOD<br />
Biological Oxygen Demand<br />
COD<br />
Chemical Oxygen Demand<br />
CHE<br />
Ebro River Hydrographic Confederation<br />
CO 2<br />
Carbon dioxide<br />
DBPs<br />
Disinfection By-products<br />
DOM<br />
Dissolved Organic Matter<br />
DWT<br />
Drinking <strong>Water</strong> Treatment<br />
DWTP<br />
Drinking <strong>Water</strong> Treatment Plant<br />
Gwh<br />
Giga watt per hour<br />
EU<br />
European Union<br />
GIS<br />
Geographic information system<br />
Ha<br />
Hectare<br />
LCA<br />
Life Cycle <strong>Analysis</strong><br />
LCI<br />
Life Cycle Inventory<br />
mg l -1<br />
milligrams per liter<br />
µg l -1 micrograms per liter<br />
mm<br />
millimeters<br />
m 3<br />
cubic meters<br />
m 3 year -1<br />
cubic meters per year<br />
Mwh<br />
Mega watt per hour<br />
l person -1 day -1<br />
liters per person per day<br />
OM<br />
Organic Matter<br />
PAC<br />
Powdered Activated Carbon<br />
SD<br />
Sustainable Development<br />
SDI<br />
Sustainable Development Indicator<br />
SFA<br />
Substance Flow <strong>Analysis</strong><br />
SS<br />
Suspended Solids<br />
TN<br />
Total Nitrogen<br />
TP<br />
Total Phosphorus<br />
UW<br />
<strong>Urban</strong> <strong>Water</strong><br />
UW<br />
<strong>Urban</strong> <strong>Water</strong> System<br />
WWT<br />
Wastewater Treatment<br />
WWTP<br />
Wastewater Treatment Plant<br />
7
<strong>Systems</strong> <strong>Analysis</strong> <strong>of</strong> <strong>Zaragoza</strong> UWS<br />
Guillermo Penagos<br />
1 Introduction<br />
Approximately half <strong>of</strong> the world’s population is nowadays living in cities. This percentage<br />
is increasing and so is doing their demand for natural resources as well as their pollution<br />
loads to the environment. It is reasonable to assume that if cities can become<br />
sustainable then society as a whole will follow the tendency. A key aspect on<br />
sustainability <strong>of</strong> the cities is the urban water system (UNESCO, 1999; Hellstrom et al,<br />
2004).<br />
A sustainable urban water system should provide its services while protecting human<br />
health and the environment, with an optimum use <strong>of</strong> scarce resources over a long term<br />
perspective (ASCE, 1998). There is a strong need <strong>of</strong> developing and implementing<br />
indicators that make the concept measurable by quantifying trends towards optimization,<br />
not just <strong>of</strong> existing water and wastewater technologies but <strong>of</strong> urban societies as a whole<br />
(Larsen and Guier, 1997).<br />
Along the whole urban water cycle, important impacts on the environment take place:<br />
water is consumed, as well as energy and chemical products. On the other hand organic<br />
matter, nutrients and persistent pollutants are entering the ecosystems. A quantification<br />
<strong>of</strong> all these negative effects upon the environment is considered to be a good indicator <strong>of</strong><br />
environmental sustainability (Larsen and Guier, 1997; Varis and Somlyody, 1997;<br />
Lundin; 1999).<br />
This study aims to analyze the environmental performance <strong>of</strong> <strong>Zaragoza</strong> <strong>Urban</strong> <strong>Water</strong><br />
System in Spain with regard to the use <strong>of</strong> natural resources and pollutant loads to the<br />
environment. The use <strong>of</strong> natural resources is assessed with regard to water withdrawal<br />
as well as energy and chemical products consumption. Considered pollution loads are<br />
atmospheric emissions, oxygen demands to the river, nitrogen, phosphorus and heavy<br />
metals. Such analysis will serve as baseline information for further assessment <strong>of</strong><br />
sustainable development. This research work only deals with the operational aspects <strong>of</strong><br />
the UWS and does not include construction, upgrading and demolition <strong>of</strong> infrastructure.<br />
The present research is included within the <strong>SWITCH</strong> project framework, program 1<br />
which aims to assess the adjustability <strong>of</strong> <strong>Urban</strong> <strong>Water</strong> <strong>Systems</strong> to global change<br />
pressures from a strategic approach based on sustainability and risk assessment.<br />
8
<strong>Systems</strong> <strong>Analysis</strong> <strong>of</strong> <strong>Zaragoza</strong> UWS<br />
Guillermo Penagos<br />
2 Background<br />
Sustainability <strong>of</strong> <strong>Water</strong> resources is a concept that concerns all levels <strong>of</strong> planning and<br />
management, from local to global agendas. Since cities are major water consumers,<br />
sustainability <strong>of</strong> urban water systems is increasingly becoming a major issue, receiving<br />
considerable effort from researchers and managers in both developed and developing<br />
countries (Larsen and Guier, 1997; Varis and Somlyody, 1997; Lundin; 1999).<br />
Several research projects have taken place during the last decade, mostly in European<br />
Countries. But there are also international partnerships which have included studies<br />
upon model cities in Africa and Asia. The Swedish <strong>Urban</strong> <strong>Water</strong> Project Mistra deserves<br />
special recognition since it produced numerous publications, PhD thesis and reports<br />
concerning several aspects <strong>of</strong> <strong>Urban</strong> <strong>Water</strong> <strong>Systems</strong> not just for European, but also to<br />
Asian and African cities such as Calcutta and Cairo (Hellstrom et al, 2004). Approaches<br />
similar to Mistra are taking place at different scales in Australia, Germany, and Belgium<br />
(Lundie et al, 2004).<br />
Assessing sustainability <strong>of</strong> <strong>Urban</strong> <strong>Water</strong> <strong>Systems</strong> is a major task considering the high<br />
complexity <strong>of</strong> such a system. Decision-making needs to consider several aspects <strong>of</strong><br />
health, environment, economy, socio-culture and technical function within a framework<br />
that includes interactions between users, organizations and technology. Important issues<br />
compromising sustainability in all these aspects are the efficient use <strong>of</strong> water and<br />
energy, the assessment for microbial risk, nutrient recycling and the emission toxic<br />
substances to the environment (Malmqvist and Palmquist, 2005, Jeppson and Hellstrom,<br />
2002).<br />
The efficient use <strong>of</strong> water and energy is related to all processes taking place in the<br />
<strong>Urban</strong> <strong>Water</strong> System, the microbial risk is <strong>of</strong> primary concern for drinking water supply,<br />
nutrient recycling and toxic substances are related to wastewater treatment and sludge<br />
disposal. Nevertheless, several studies have proven that untreated storm water is a<br />
major responsible for hazardous emissions coming form cities. This fact along with the<br />
well known risks related to floods has increasingly turned the attention towards planning<br />
and management <strong>of</strong> storm water as a key element for <strong>Urban</strong> Sustainability (Jeppson and<br />
Hellstrom, 2002)<br />
9
<strong>Systems</strong> <strong>Analysis</strong> <strong>of</strong> <strong>Zaragoza</strong> UWS<br />
Guillermo Penagos<br />
There is a need <strong>of</strong> information tools that serve to evaluate this complexity and search for<br />
alternatives that make the concept <strong>of</strong> sustainability fully operational for the <strong>Urban</strong> <strong>Water</strong><br />
System. Initial interest <strong>of</strong> researchers and decision makers in this regard was to produce<br />
ad hoc Indicators for Sustainable Development (Lundin and Morrison, 2002)<br />
A large number <strong>of</strong> indicators are used by water and waste water organizations to assess<br />
their technical performance. Such indicators may differ between different organizations<br />
and different countries. The results are large amounts <strong>of</strong> data, difficult to understand and<br />
to interpret. Besides only few <strong>of</strong> those indicators have been developed to quantify<br />
sustainability. There is still a need for a limited number <strong>of</strong> sustainability indicators for<br />
urban water systems (Lundin, 1999).<br />
One <strong>of</strong> the main problems <strong>of</strong> quantifying sustainability is the lack <strong>of</strong> a structured<br />
methodology to develop indicators, with the consequent risk that such indicators would<br />
be ineffective and, possibly detrimental in promoting sustainability objectives (Lundin<br />
and Morrison, 2002). Therefore, recent studies have based on <strong>Systems</strong> <strong>Analysis</strong><br />
Approach and have used techniques related to the concept <strong>of</strong> industrial ecology, such as<br />
Material Flow <strong>Analysis</strong> and Life Cycle Assessment. When properly followed, those<br />
techniques have proven to be quite effective to evaluate environmental performance <strong>of</strong><br />
<strong>Urban</strong> <strong>Water</strong> <strong>Systems</strong>. Some authors have concluded that such techniques are needed<br />
as a basis for all other studies concerning <strong>Urban</strong> <strong>Water</strong> <strong>Systems</strong> because the flows, the<br />
major sources and the fate <strong>of</strong> water and its major constituents such as nutrients,<br />
pathogens and harmful chemicals, must be clear for all alternative management<br />
strategies (Ahlman, 2006; Benedetti et al., 2005; Lindqvist and Malmborg, 2004).<br />
LCA analysis is suggested to be a comprehensive technique to assess environmental<br />
sustainability <strong>of</strong> UWS. The term “Life cycle” referes to the major activities in the course <strong>of</strong><br />
a product lifespan from its manufacture, use and maintenance, to its final disposal,<br />
including the raw material acquisition required to manufacture the product. Impacts<br />
related to outputs will be emissions to different environmental compartments (Lundin and<br />
Morrison, 2002).<br />
The main advantage <strong>of</strong> LCA is that it can contribute to evaluate the impacts upon<br />
different environmental compartments, preventing the implementation <strong>of</strong> management<br />
10
<strong>Systems</strong> <strong>Analysis</strong> <strong>of</strong> <strong>Zaragoza</strong> UWS<br />
Guillermo Penagos<br />
options that, in the search for mitigation, end up by shifting pollution from one place to<br />
another. This is the trade-<strong>of</strong>f <strong>of</strong> for instance, the alternative <strong>of</strong> nutrient recycling from<br />
wastewater treatment sludge, which will protect the receiving water body, but can<br />
constitute a further risk for arable land protection, since such sludge may content not just<br />
nutrients, but also heavy metals, being also a further risk for food security (Malmqvist &<br />
Palmquist, 2005).<br />
During the last decade there have been many research works using LCA to assess<br />
urban water systems. One <strong>of</strong> the major problems faced by this technique is the definition<br />
<strong>of</strong> system boundaries. Many choices can be made in terms <strong>of</strong> time horizon, geographic<br />
borders as well as functional boundaries. Results will be very much affected by such<br />
choices, being <strong>of</strong>ten not comparable. For instance most studies have focused on either<br />
water supply or on WWT systems.<br />
Crettaz et al. (1997) evaluated different alternatives for alternatives drinking water<br />
distribution and treatment as well as wastewater treatment. They also assessed on-site<br />
alternatives such as rainwater storage, sewage separation and water-saving toilets.<br />
Authors found that rainwater use was not favorable in terms <strong>of</strong> energy consumption and<br />
also it would lead to a higher contamination <strong>of</strong> heavy metals to water and soils.<br />
Roeleveld et al. (1997) performed an LCA <strong>of</strong> different conventional wastewater treatment<br />
methods in at a national level in the Netherlands. The authors concluded that to improve<br />
the sustainability, the discharge <strong>of</strong> emissions should be reduced from the effluent.<br />
Energy use, construction and the use <strong>of</strong> chemicals were considered less important as<br />
compared to the operation <strong>of</strong> the system.<br />
Matsuhashi et al. (1997) compared different sludge treatment processes: landfilling,<br />
incineration, ozonation and composting. One conclusion the authors draw was that when<br />
sludge is used to improve soil fertility, the benefit should be compared with an LCA for<br />
production and use <strong>of</strong> chemical fertilizer.<br />
Neumayr et al. (1997) compared six different alternatives for sludge recycling strategies.<br />
Authors found that energy consumption, foil fuels used for transportation and direct<br />
11
<strong>Systems</strong> <strong>Analysis</strong> <strong>of</strong> <strong>Zaragoza</strong> UWS<br />
Guillermo Penagos<br />
emissions from composting and dewatering were the most significant impacts. Anaerobic<br />
treatment showed lower energy consumption than aerobic digestion.<br />
Swage management alternatives in contraposition form end-<strong>of</strong>-pipe technologies were<br />
evaluated by Bengtsson et al., (1997) compared conventional wastewater systems with<br />
liquid composting and urine separation. The study showed that the separation system<br />
has lower pollution loads to water and is more efficient for nutrient recycling than<br />
conventional systems.<br />
Only few studies have addressed the whole urban water cycle (Lassaux et al, 2005) and<br />
even with similar choices <strong>of</strong> system boundaries, the outcomes might be contrasting.<br />
Some publications give more importance to energy and chemical consumption, other<br />
stress groundwater withdrawal, other suggest that more attention should be given to<br />
pollution burdens (nutrients, BOD, heavy metals, etc). Results will differ from each other<br />
depending on the scale <strong>of</strong> the system, the economic development <strong>of</strong> the city subjected<br />
to study, the external activities that are considered and even the base unit for impact<br />
calculation: per year, per person and per year, per cubic meter <strong>of</strong> water.<br />
System Boundaries should be chosen according to the purpose <strong>of</strong> the study (Lundin and<br />
Morrison, 2002), but LCA is aimed to avoid planning and operation alternatives that<br />
improve environmental performance <strong>of</strong> one sub process but worsen other part <strong>of</strong> the<br />
cycle. In principle an LCA should include as many upstream and downstream<br />
externalities associated with the system as possible.<br />
Upstream activities considered in LCA studies <strong>of</strong> UWS largely focus on chemical use for<br />
both drinking and waste water treatment, energy consumption and atmospheric<br />
emissions related to transporting chemicals from producers to water facilities should be<br />
included within system boundaries. A more comprehensive approach would also include<br />
energy consumption and hazardous emissions related to the production <strong>of</strong> such<br />
chemicals (Lassaux et al., 2005; Lundie et al., 2004)<br />
Most evident downstream activity <strong>of</strong> a UWS is WW discharge. Most LCA studies also<br />
focus on sludge production and final disposal. <strong>Water</strong> recovering, nutrient recycling and<br />
minimizing hazardous emissions are the main subject here. Once again energy<br />
12
<strong>Systems</strong> <strong>Analysis</strong> <strong>of</strong> <strong>Zaragoza</strong> UWS<br />
Guillermo Penagos<br />
consumption and atmospheric emissions derived from sludge disposal are suggested to<br />
be included within system boundaries.<br />
Another important question concerning system boundaries is water infrastructure. The<br />
usual time perspective to plan and construct a UWS is <strong>of</strong> several decades. But<br />
sustainability is a long term concept, therefore a time horizon projection <strong>of</strong> about 100<br />
years is suggested. The construction <strong>of</strong> the water supply also may have significant<br />
environmental impacts which can be quantified such impact on the basis <strong>of</strong> the mass <strong>of</strong><br />
material needed to construct the pipes, considering lengths, diameters and comparing<br />
different materials. Environmental Impact <strong>of</strong> putting pipes into the ground may also be<br />
considered (Lundin & Morrison, 2002)<br />
Lassaux et al. (2005) found infrastructure construction as having a significant<br />
contribution to the overall environmental impacts <strong>of</strong> the UWS. This is very important<br />
since improving WWT systems will increase environmental impacts in one way, because<br />
materials are used for construction, and then chemicals and energy are consumed. The<br />
authors also found that construction phase is responsible for important environmental<br />
impacts before tap (withdrawal pipeline, drinking water treatment, and distribution<br />
network) have less impact than stages after tap (sewer system and WWTP). In fact<br />
sewer network construction was the factor that contributed the most to the global<br />
environmental load <strong>of</strong> the anthropogenic water cycle from the Wallon region in Belgium.<br />
In contrast, Lundie et al. (2004) found infrastructure construction to contribute with less<br />
than 4% <strong>of</strong> all different categories <strong>of</strong> burdens to the environment, for both present<br />
conditions and alternative future scenarios <strong>of</strong> Sydney’s UWS.<br />
Lundie et al. (2004) used an LCA approach for assessing alternative future scenarios for<br />
strategic planning <strong>of</strong> Sydney’s UWS with a high degree <strong>of</strong> segmentation within the<br />
system. In order to select the best environmental performance different alternatives were<br />
classified after LCA in two categories: (1) options that improve the overall environmental<br />
performance and (2) options that improve one area <strong>of</strong> the system but worsen other<br />
areas. Sustainability is about management options that improve the system as a whole.<br />
This is one <strong>of</strong> few LCA studies covering the whole UWS. Main focus regarding<br />
environmental performance was given to water withdrawal and energy consumption.<br />
13
<strong>Systems</strong> <strong>Analysis</strong> <strong>of</strong> <strong>Zaragoza</strong> UWS<br />
Guillermo Penagos<br />
Evaluated scenarios included different degrees <strong>of</strong> upgrading existing technology,<br />
centralize vs on-site treatment and demand management. The aim <strong>of</strong> this study was<br />
perform a holistic assessment <strong>of</strong> the system in order to show which aspects <strong>of</strong> the<br />
business are responsible for the largest environmental burdens and to compare<br />
alternative future scenarios. This was part <strong>of</strong> reviewing the Local <strong>Water</strong> plan 21.<br />
Authors concluded that implementing desalination plants for drinking water treatment<br />
would significantly increase greenhouse emissions while achieving a fairly small<br />
increase <strong>of</strong> water supply, upgrading existing WWTPs to perform tertiary treatment would<br />
decrease the potential for eutrophication <strong>of</strong> coastal waters but it will worsen all other<br />
indicators <strong>of</strong> environmental performance. Authors conclude that scenarios that integrate<br />
several management options than just upgrading existing technology are the ones that<br />
actually improve the overall environmental performance.<br />
14
<strong>Systems</strong> <strong>Analysis</strong> <strong>of</strong> <strong>Zaragoza</strong> UWS<br />
Guillermo Penagos<br />
3 Materials and Methods<br />
3.1 Study site<br />
Figure 1. Satellite map for <strong>Zaragoza</strong> and its location in Spain (Source: google maps,<br />
http://maps.google.es/maps?oi=eu_map&q=<strong>Zaragoza</strong>&hl=en)<br />
<strong>Zaragoza</strong> is the capital city <strong>of</strong> the autonomous region <strong>of</strong> Aragon in Spain, and is located<br />
on the Ebro River Catchment, and its tributaries the Huerva and Gállego. The city is 199<br />
metres above sea level and is near the centre <strong>of</strong> the region. The population <strong>of</strong> the city is<br />
around 700.000, ranking fifth in Spain. Climatic conditions <strong>of</strong> <strong>Zaragoza</strong> are a transition<br />
between Mediterranean and Continental climate with an average temperature <strong>of</strong> 15ºC.<br />
The Ebro River Valley at <strong>Zaragoza</strong> is a semiarid region with an average annual<br />
precipitation <strong>of</strong> 367 mm concentrated in 67 days, ranking as the driest inland region in<br />
Europe. The Ebro River drains a triangular basin with an area <strong>of</strong> 85.820 Km², between<br />
the Pyrenees and the Iberian Mountains, with the Cantabrian Mountains as northern<br />
border. The Ebro is the largest river in Spain with a course 928 km long and total annual<br />
discharge <strong>of</strong> 19,000 million m 3 . The main use <strong>of</strong> water resources along the Ebro River<br />
Catchment is agricultural irrigation, followed by hydropower generation, urban supply<br />
and Industrial activities. The river is characterized by a wide range <strong>of</strong> seasonal variation<br />
<strong>of</strong> the river discharge. Therefore, since the 1930’s, 138 reservoirs have been<br />
constructed in the river basin, with a total storage capacity <strong>of</strong> 6,837 Hm³ (CHE, 2007)<br />
15
<strong>Systems</strong> <strong>Analysis</strong> <strong>of</strong> <strong>Zaragoza</strong> UWS<br />
Guillermo Penagos<br />
The Municipality <strong>of</strong> <strong>Zaragoza</strong> is responsible for water planning and management in the<br />
city. They own and operate facilities for drinking water supply, sewers and wastewater<br />
treatment plants. During the last decade <strong>Zaragoza</strong> has carried out several important<br />
projects concerning water management. In 1993 a WWTP providing tertiary treatment<br />
was built. At the same time sewerage system began expanding and nowadays almost all<br />
industrial discharges -with two special exceptions that will be further discussed in this<br />
report- are connected to sewers.<br />
In 1997 the city started a project called “<strong>Zaragoza</strong> water saving city”, consisting <strong>of</strong><br />
education programs to encourage rational water use at households and industries by<br />
means <strong>of</strong> water saving devices and improving consumption habits. The municipality<br />
committed within this project to a rational use <strong>of</strong> water for landscaping. In 2005 this<br />
project managed to considerably reduce water demand and it was selected by Habitat<br />
UN as one <strong>of</strong> the 100 successful projects concerning urban sustainability worldwide.<br />
Currently municipality is using tariffs for water supply and WWT services as an<br />
instrument to punish excessive consumption as well as to reward saving. In the year<br />
2000 both national and regional government approved a project aimed to shift the tap<br />
water source from the Ebro to the Aragon River regulated in “Yesa” reservoir in the<br />
Pyrenees, where water quality is more suitable for human consumption than in the Ebro<br />
River.<br />
In 2002 municipality initiated a seven years project aimed to improve water supply for<br />
<strong>Zaragoza</strong>. This project consists on (1) upgrading the DWTP, (2) replacing, upgrading or<br />
taking out <strong>of</strong> work existing tanks and pumping stations and (3) replacing a considerable<br />
percentage <strong>of</strong> the pipeline network. Total investment for this project is around 82 million<br />
euro. As result <strong>of</strong> all these efforts <strong>Zaragoza</strong>’s water withdrawal has significantly<br />
decreased.<br />
3.2 General Approach<br />
A systems approach is used here to analyze the <strong>Urban</strong> <strong>Water</strong> System <strong>of</strong> <strong>Zaragoza</strong> by<br />
means <strong>of</strong> Life Cycle <strong>Analysis</strong> (LCA). The procedure usually comprises four steeps: (1)<br />
goal and system definition, (2) life cycle inventory (3) impact assessment and (4)<br />
16
<strong>Systems</strong> <strong>Analysis</strong> <strong>of</strong> <strong>Zaragoza</strong> UWS<br />
Guillermo Penagos<br />
interpretation (U.S EPA, 2006; Ayers and Ayers, 2002). For the present work the step 3<br />
was not carried out and interpretation is made from the life cycle inventory.<br />
3.2.1 Developing flow diagram<br />
First step to define system boundaries is developing a flow diagram showing the<br />
processes to be evaluated. In the present work the aim is to analyze all the major<br />
processes for the urban water system: water withdrawal, water treatment and<br />
distribution, water use, wastewater transportation and wastewater treatment. Along<br />
these processes a water balance is made and major flows and stocks <strong>of</strong> chemical<br />
products, nutrients and heavy metals are considered. The direct and indirect<br />
consumptions <strong>of</strong> energy (transportation <strong>of</strong> chemical products and sludge) are also<br />
considered, as well as direct (sewage sludge treatment and disposal) and indirect<br />
atmospheric emissions (derived from energy consumption).<br />
3.2.2 Time horizon<br />
An assessment <strong>of</strong> sustainability should ideally extend over a time horizon <strong>of</strong> several<br />
decades (Lundin and Morrison, 2002). However due to time and data constraints, the<br />
time period considered here is six years, which considers major investments on<br />
improving the technical performance <strong>of</strong> the water system.<br />
3.2.3 Data collection<br />
Data collection for this M Sc research lasted from November the 8 th up to December the<br />
29 th . As starting point staff from the Local Agenda 21 Office provided some reports<br />
concerning water management in <strong>Zaragoza</strong> as well as specific features <strong>of</strong> the <strong>Urban</strong><br />
<strong>Water</strong> System and its evolution during the last decade.<br />
Most time was devoted to carefully review those reports in order to fully understand the<br />
sustainability issues that have been already identified by the municipality as well as<br />
other issues, probably neglected so far and which might be interesting for the <strong>SWITCH</strong><br />
project.<br />
Recent data necessary to perform mass and energy balances are partially available in<br />
different electronic formats such as notepad, pdf, word, excel, etc. Historical data are<br />
17
<strong>Systems</strong> <strong>Analysis</strong> <strong>of</strong> <strong>Zaragoza</strong> UWS<br />
Guillermo Penagos<br />
mostly available only in hard copies. When specific information concerning <strong>Zaragoza</strong><br />
system was not available, the extrapolation <strong>of</strong> general information has been considered.<br />
3.2.4 Data analysis<br />
A water balance was performed from the information available at <strong>Zaragoza</strong> municipality<br />
(figure 2, and annexes). Mass balances were performed for BOD 5 , COD, TN, TP and<br />
Heavy metals at the WWTPs. As shown in Annex 1 there are several processes for<br />
which there are no data available at <strong>Zaragoza</strong> municipality. For such processes,<br />
assumptions and extrapolations from literature values were made. A description <strong>of</strong> these<br />
assumptions and calculations is provided next.<br />
3.2.4.1 Storm water<br />
No data concerning storm water quality exits in <strong>Zaragoza</strong> (which is understandable for a<br />
semiarid region) therefore the possible effects <strong>of</strong> storm water upon WWT performance<br />
are completely unknown. The possible effect <strong>of</strong> storm water upon the Ebro River is here<br />
extrapolated from the chemical characteristics <strong>of</strong> sewage and the possible overflows,<br />
which have not been actually measured, but have been estimated as follows (for raw<br />
data and calculations for storm water refer to annexe 10):<br />
Estimated storm water = Precipitation * impervious area<br />
Overflows = Estimated storm water + Expected WWTPs inflow – Actual inflow to WWTPs<br />
Daily precipitation data for <strong>Zaragoza</strong> was provided by the Local Agenda 21 Office at<br />
<strong>Zaragoza</strong> municipality. There were no data concerning evaporation, extrapolation was made<br />
from Marti (2000).<br />
3.2.4.2 Energy consumption and CO 2 emissions from transportation<br />
Environmental impacts derived from transporting both chemical products and sludge<br />
were calculated as energy consumption and CO 2 emissions to the atmosphere. Factors<br />
from Thonstad (2005) were used (for raw data and calculations refer to annex 9)<br />
18
<strong>Systems</strong> <strong>Analysis</strong> <strong>of</strong> <strong>Zaragoza</strong> UWS<br />
Guillermo Penagos<br />
3.2.4.3 CO 2 Emissions from electricity consumption<br />
Raw data concerning energy consumption <strong>of</strong> the DWTP and the WWTPs were provided<br />
by the Local Agenda 21 Office at <strong>Zaragoza</strong>. The derived CO 2 emissions were calculated<br />
regarding the electric energy sources in Spain provided by Ministerio de Industria,<br />
Turismo y Comercio de España (2007) referred in figure 9. Emission factors from<br />
European Commission (1995) were used (for raw data and calculations refer to annex<br />
8).<br />
3.2.4.4 CO 2 production from sludge<br />
Wastewater sludge emits CO 2 as a function <strong>of</strong> the OM concentration. Raw data<br />
regarding wastewater sludge production at the WWTPs were provided by the Local<br />
Agenda 21 Office at <strong>Zaragoza</strong> municipality. COD content in the sludge was calculated<br />
from the mass balance between inflow and outflow load at each facility. Multiplication<br />
factors from Levlin (2005) were used to calculate TOC content and CO 2 :<br />
TOC = 40% <strong>of</strong> COD<br />
CO 2 = 3.66*TOC<br />
3.2.5 Scenario analysis<br />
Based on the collected data, an exercise for Scenario <strong>Analysis</strong> is presented following the<br />
methodology suggested by Assimacopoulos (2007) in which the main drivers for change<br />
and sustainability are identified by means <strong>of</strong> a problem tree analysis. Drivers are<br />
qualitatively discriminated under the criteria <strong>of</strong> importance and uncertainty. Possible<br />
scenarios resulting from the combination <strong>of</strong> drivers considered as more important and<br />
more uncertain are set. Finally strategies to cope with such scenarios are suggested.<br />
The aim <strong>of</strong> the strategies is to adapt the system to reach a sustainability vision.<br />
19
<strong>Systems</strong> <strong>Analysis</strong> <strong>of</strong> <strong>Zaragoza</strong> UWS<br />
Guillermo Penagos<br />
4 Results<br />
4.1 Data availability and information gaps<br />
In order to improve processes it is necessary to get a set <strong>of</strong> data that describes such<br />
processes as best as possible. Therefore, one <strong>of</strong> the goals <strong>of</strong> this research was to<br />
identify current information gaps that need to be filled in order for <strong>Zaragoza</strong><br />
municipality and other stakeholders to get a better picture <strong>of</strong> the weaknesses and<br />
strengths <strong>of</strong> the urban water system, which will significantly contribute to set up<br />
priorities. The following are the information gaps identified to be important in this<br />
research:<br />
1. Groundwater recharge<br />
2. Parasitic water to the sewers<br />
3. Storm water quantity and quality<br />
4. Industrial vs Domestic contribution to pollution loads to the sewage<br />
5. Actual leakage in the distribution network<br />
6. Distribution and Sewer network modeling<br />
Both distribution and sewer network are fully mapped and implemented in a GIS,<br />
which is <strong>of</strong> high potential for covering information gaps and improve water<br />
management.<br />
Annex 1 lists the information necessary for LCA and its availability at <strong>Zaragoza</strong><br />
municipality. The frequency <strong>of</strong> measurements or samplings, the type <strong>of</strong> data and the<br />
aggregation level are also described. Most data are available from 2000, previous<br />
data exists as hardcopies deposited in archives which were not assessed due to time<br />
limitation for this M Sc project. Most data gathered were measured with some<br />
exceptions were estimations were made from printed reports. Since no modeling has<br />
been implemented by the Municipality to any <strong>of</strong> the UWS process there are no<br />
modeled data.<br />
4.2 General features <strong>of</strong> <strong>Zaragoza</strong> UWS<br />
Figure 2 shows the flow diagram for <strong>Zaragoza</strong> UWS, including a water balance and<br />
material inputs (chemical products) and outputs (sludge). The general features <strong>of</strong> this<br />
water system are summarized in this figure where 8 levels are recognized: (1) water<br />
inputs which includes storm water, tap water source, agriculture irrigation and<br />
groundwater; (2) drinking water treatment process; (3) distribution system; (4) <strong>Water</strong><br />
20
<strong>Systems</strong> <strong>Analysis</strong> <strong>of</strong> <strong>Zaragoza</strong> UWS<br />
Guillermo Penagos<br />
consumption and use, which includes households, public facilities, landscaping,<br />
industry connected to the sewer system and industry using exclusively groundwater<br />
and not connected to the sewer system; (5) combined sewer system (6) WWTP<br />
which includes two public facilities and two private ones (7) receiving environment<br />
and (8) chemical products used for both DWT and WWT. Every level will be<br />
explained in more detail next and figure 2 will remain as recurrent reference along<br />
the text.<br />
21
<strong>Systems</strong> <strong>Analysis</strong> <strong>of</strong> <strong>Zaragoza</strong> UWS<br />
Guillermo Penagos<br />
(8.1)<br />
CHLORINE<br />
2.4<br />
(1.3)<br />
AGRICULTURE<br />
IRRIGATION<br />
SYSTEMS<br />
?<br />
(1.2)<br />
STORM WATER<br />
?<br />
(1.1)<br />
SURFACE<br />
WATER<br />
64.1<br />
20.2*<br />
(1.4)<br />
GROUND<br />
WATER<br />
(8.2)<br />
ALLUM<br />
5.9<br />
(2.1)<br />
DRINKING<br />
WATER<br />
TREATMENT<br />
7.7<br />
(2.2)<br />
DWT SLUDGE<br />
(8.3)<br />
PAC<br />
0.2<br />
?<br />
?<br />
20.4*<br />
63.5<br />
(3)<br />
DISTRIBUTION<br />
SYSTEM<br />
43.1<br />
27.1<br />
0.8<br />
0.2<br />
15.0<br />
16.0*<br />
(4.1)<br />
HOUSEHOLDS<br />
(4.2)<br />
PUBLIC<br />
FACILITIES<br />
(4.3)<br />
LANDSCAPING<br />
2.7<br />
1.5<br />
(4.4.1)<br />
INDUSTRY<br />
(4.4.2)<br />
INDUSTRY<br />
25.1***<br />
39.9***<br />
14.8***<br />
26.2*<br />
(5)<br />
SEWER SYSTEM<br />
14.4***<br />
54.4 11.7 0.2 to 2.7**<br />
(8.4)<br />
IRON<br />
CHLORIDE<br />
4.7<br />
(6.1.1)<br />
TERTIARY<br />
WWTP<br />
70<br />
(6.1.2)<br />
SECONDARY<br />
WWTP<br />
13.6*<br />
(6.1.3)<br />
PRIVATE<br />
WWTPs<br />
(6.2.1)<br />
SLUDGE<br />
(6.2.2)<br />
SLUDGE<br />
(6.2.3)<br />
SLUDGE<br />
(6.3)<br />
INCINERATED<br />
SLUDGE<br />
4.1<br />
83.8 to 86.3**<br />
1.0 1.3<br />
7.7<br />
(7.2)<br />
RECEIVING<br />
WATER BODY<br />
(7.3)<br />
AGRICULTURE<br />
(7.4)<br />
HAZARDOUS<br />
DISPOSAL<br />
Figure 2. Flow Diagram for <strong>Zaragoza</strong> UWS. Lines and numbers in blue stand for water flows (units are<br />
million m 3 per year). Chemical products as well as sludge flows are represented by lines and numbers in<br />
green (units are thousand tons per year). Data used for this diagram are from the year 2006.<br />
* Values that have not been measured but estimated<br />
** Storm water overflows were estimated for the period 2001 – 2006 and are completely different<br />
between years. Therefore an average value is not given, but rather a range.<br />
*** 90% <strong>of</strong> water use is assumed to go to the wastewater system<br />
? Indicates balances that could not be completed due to information gaps<br />
Values that have been actually measured are not given any mark in this figure<br />
22
<strong>Systems</strong> <strong>Analysis</strong> <strong>of</strong> <strong>Zaragoza</strong> UWS<br />
Guillermo Penagos<br />
4.2.1 <strong>Water</strong> inputs<br />
4.2.1.1 Tap water source<br />
Tap water source which is the Ebro river diverted 110 km upstream from <strong>Zaragoza</strong><br />
by “Canal Imperial de Aragon”. Ebro river discharge strongly fluctuates on a seasonal<br />
basis, being as high as 500 m 3 s -1 in March and as low as 30 m 3 s -1 in August.<br />
Quantity is sufficient to supply the city all over the year because the river is largely<br />
regulated by dams up stream, otherwise the city would suffer from shortages during<br />
summer time. For the year 2006 total water withdrawal for <strong>Zaragoza</strong> was 64.1 million<br />
m 3 without including ground water (see figure 3).<br />
600<br />
500<br />
Discharge (m 3 s -1 )<br />
400<br />
300<br />
200<br />
100<br />
0<br />
oct nov dec jan feb mar apr may jun jul aug sep<br />
Months<br />
Figure 3. Ebro river discharge at “Canal Imperial” diversion (Source: CHE, 2007)<br />
Raw water quality in <strong>Zaragoza</strong> is very much affected by the seasonal fluctuations <strong>of</strong><br />
the Ebro River. Conductivity and hardness increase in summer time due to the strong<br />
reduction in water discharge, making water eventually unsuitable for drinking<br />
purposes. During spring and fall high discharges reduce conductivity but suspended<br />
solids and organic matter –mostly humic substances exerting high chlorine<br />
demands– significantly increase. More suitable water quality is achieved only during<br />
winter time. High chlorine demands eventually lead to hyper-chlorination and to high<br />
concentrations <strong>of</strong> oxidation and disinfection by-products. Several parameters <strong>of</strong> tap<br />
water quality <strong>of</strong>ten exceed standard regulations (Local Agenda 21 Office <strong>of</strong><br />
<strong>Zaragoza</strong>, 2002). Due to these characteristics <strong>of</strong> raw water quality, drinking water<br />
23
<strong>Systems</strong> <strong>Analysis</strong> <strong>of</strong> <strong>Zaragoza</strong> UWS<br />
Guillermo Penagos<br />
treatment in <strong>Zaragoza</strong> requires large amounts <strong>of</strong> chemical reagents implying not jus<br />
a high cost <strong>of</strong> water treatment, but also a risk to public health due to DBPs.<br />
Shifting to a different raw water source and thereby reducing treatment cost and<br />
improving water quality is a strong need for the city. From 2008 the city will receive<br />
water from the Pyrenees, specifically from the Yesa reservoir which regulates the<br />
Aragon River and is also used for irrigation and hydropower production. A significant<br />
improvement <strong>of</strong> tap water quality for <strong>Zaragoza</strong> is expected from this new source. This<br />
will be discussed further on in the Scenario <strong>Analysis</strong> section.<br />
4.2.1.2 Storm water<br />
<strong>Zaragoza</strong> is located in a semiarid region with an average precipitation <strong>of</strong> 270 mm per<br />
year, which is concentrated within 70 to 80 days (see figure 4a, showing 2006 daily<br />
based hydrograph as example). Precipitation per day in <strong>Zaragoza</strong> would rarely<br />
exceed 20 mm and dry and wet periods are not quite distinct. However, highest<br />
maximums and highest averages are reached in May and in September, but rarely<br />
exceeding 50 mm per month. Lowest averages and lowest minimums are usually<br />
reached in August and in December (see figure 4b).<br />
Daily p recip itation for 2006 ( mm)<br />
50<br />
40<br />
30<br />
20<br />
10<br />
0<br />
Total precipitation = 288 mm<br />
Days with precipitation = 86<br />
J F M A M J J A S O N D<br />
Month<br />
a<br />
Month p recip itation (m m)<br />
50<br />
40<br />
30<br />
20<br />
10<br />
0<br />
J F M A M J J A S O N D<br />
Month<br />
b<br />
Figure 4. Annual precipitation hydrographs for <strong>Zaragoza</strong>.<br />
4a. Daily based hydrograph for 2006<br />
4b. Month averages. Error bars represent standard deviation<br />
Source Local Agenda 21 Office <strong>of</strong> <strong>Zaragoza</strong><br />
Due to these hydrologic conditions storm water is not considered an issue by the<br />
Municipality. Nevertheless eventual overflows <strong>of</strong> storm water are discharged directly<br />
in the Ebro River without any treatment. Therefore Municipality is building two storm<br />
24
<strong>Systems</strong> <strong>Analysis</strong> <strong>of</strong> <strong>Zaragoza</strong> UWS<br />
Guillermo Penagos<br />
water tanks to prevent the consequent pollution <strong>of</strong> the river. They are also<br />
considering about using storm water for cleaning public facilities or for landscaping.<br />
According to the municipality staff the sewer system has got serous dimensional<br />
limitations. Therefore, even under the consideration that <strong>Zaragoza</strong> is a semiarid<br />
region, storm water might saturate the system and overflow to the Ebro River under<br />
strong rain events<br />
4.2.1.3 Agriculture irrigation systems<br />
The Ebro Valley at Aragon is the driest inland region <strong>of</strong> Europe. In fact most <strong>of</strong> the<br />
area around <strong>Zaragoza</strong> is naturally either bare or covered with desert-like vegetation.<br />
<strong>Water</strong> deficits are high due to low precipitation (less than 300 mm) and high<br />
evapotranspiration (more than 800 mm). Most <strong>of</strong> the soils <strong>of</strong> the region are Aridisols,<br />
and show similarities to those <strong>of</strong> North African deserts. However agriculture is an<br />
important activity along the Ebro catchment and the most relevant use <strong>of</strong> water<br />
resources in the catchment is agricultural irrigation. In <strong>Zaragoza</strong> province, including<br />
the surroundings <strong>of</strong> <strong>Zaragoza</strong> city, the irrigated area is nearly 177,000 ha (see figure<br />
5).<br />
Figure 5. Irrigation in <strong>Zaragoza</strong> province. This satellite picture shows the desert surroundings <strong>of</strong><br />
<strong>Zaragoza</strong> city. All the green areas are irrigated agricultural lands (Source: google maps,<br />
http://maps.google.es/maps?oi=eu_map&q=<strong>Zaragoza</strong>&hl=en)<br />
.<br />
25
<strong>Systems</strong> <strong>Analysis</strong> <strong>of</strong> <strong>Zaragoza</strong> UWS<br />
Guillermo Penagos<br />
Irrigation water is considered here as an input for <strong>Zaragoza</strong> UWS for two reasons: 1)<br />
excess water from irrigation is 100% responsible for recharging the city’s aquifer and<br />
2) some irrigation systems in the borders <strong>of</strong> urban area become parasitic water to the<br />
sewer system and end up in the WWTP. Both total contributions to the aquifer as well<br />
as to the sewer system are currently unknown.<br />
4.2.1.4 Ground water<br />
In <strong>Zaragoza</strong> groundwater is not given any price and the water table is relatively<br />
shallow (5m in average). It is being extracted for industrial activities and for<br />
landscaping but it is not included by <strong>Zaragoza</strong>’s municipality in its account for total<br />
water withdrawal because it does not enter the distribution network. The institution<br />
responsible for authorizing groundwater extraction is not the Municipality but the<br />
CHE.<br />
Figure 2 shows groundwater withdrawal and its use in <strong>Zaragoza</strong>. The major<br />
consumer is Industry that is not connected to sewer system, corresponding to two<br />
paper mills owning private WWTPs and discharging into the Gallego and the Ebro<br />
River. If groundwater extraction is added to the calculation <strong>of</strong> water withdrawal, the<br />
actual consumption <strong>of</strong> <strong>Zaragoza</strong> UWS is 84 million m 3 year -1 <strong>of</strong> which 23% is<br />
groundwater.<br />
As stated previously, ground water in <strong>Zaragoza</strong> is not recharged by a natural water<br />
cycle. There is no recharge from the Ebro River either. All groundwater in <strong>Zaragoza</strong><br />
come form agricultural irrigation in the surrounding area. Current rates are estimated<br />
in 10,000 m 3 ha -1 but the total irrigation area that is contributing to recharging the<br />
aquifer <strong>of</strong> the city is unknown and therefore so it is the total recharge (Ebroagua<br />
working group, personal communication).<br />
4.2.2 Drinking water treatment<br />
<strong>Water</strong> from the Canal Imperial is treated in a plant with an installed capacity <strong>of</strong> 6 m 3<br />
s 1 . Conventional treatment is applied, comprising: pre-chlorination, flocculation,<br />
sedimentation, rapid sand filtration and disinfection with chlorine. The consumption <strong>of</strong><br />
chemical products for DWT is summarized in figure 2 and also it will be explained in<br />
more detail further on.<br />
As part <strong>of</strong> the policy <strong>of</strong> reducing water consumption adopted by the municipality the<br />
DWTP has been upgraded to dewater the sludge. Up to the year 2002 sludge with<br />
26
<strong>Systems</strong> <strong>Analysis</strong> <strong>of</strong> <strong>Zaragoza</strong> UWS<br />
Guillermo Penagos<br />
nearly 90% water content was directly discharged into the Huerva River. From 2003<br />
approximately 5 million m 3 <strong>of</strong> water per year (7.7% <strong>of</strong> total water withdrawal) are<br />
being recovered from sludge and recycled into the DWT process.<br />
4.2.3 Distribution network<br />
By the year 2002 <strong>Zaragoza</strong> water distribution network was rather old. Most facilities<br />
ranged between 30 and 90 years <strong>of</strong> being built. Pipelines and reservoirs suffered<br />
important leakages and required to be either upgraded or replaced. Uncovered<br />
reservoirs were common, which is not convenient for stability <strong>of</strong> water quality.<br />
Table 1 shows the current situation <strong>of</strong> distribution network reservoirs. From<br />
Casablanca reservoir at the DWTP (currently under upgrading) water is distributed to<br />
the whole system. It can be seen that most <strong>of</strong> the system works by gravity and only<br />
one reservoir is a pumping station. Therefore energy consumption by distribution<br />
network is very low as compared to other processes <strong>of</strong> the UWS.<br />
Table 1. <strong>Zaragoza</strong>’s Primary Distribution System. Current situation (Source Infrastructure<br />
Department, <strong>Urban</strong> <strong>Water</strong> Cycle Office <strong>of</strong> <strong>Zaragoza</strong>, 2006)<br />
Tank name<br />
Operation<br />
mode<br />
Capacity<br />
(m 3 )<br />
Age<br />
(years)<br />
Stage before plan<br />
enforcement<br />
Current<br />
Stage<br />
Casablanca 180.000 90 Bad Upgrading<br />
Pignatelli 82.000 125 Bad Out <strong>of</strong> work<br />
Valdespartera 50.000 30 Excellent Same<br />
Canteras 14.400 70 Suitable Upgraded<br />
Los Leones Gravity 4.000 35 Suitable Upgraded<br />
Academia 15.000 35 Suitable Upgraded<br />
Villamayor 150 25 Good Same<br />
Peñaflor (alto) 200 25 Good Same<br />
Garrapinillos 100 25 Good Same<br />
Villarrapa<br />
560 25 Good Same<br />
Valdefierro - - Bad Out <strong>of</strong> work<br />
D.B Oliver Pumping<br />
- - Bad Out <strong>of</strong> work<br />
Garrapinillos<br />
- - Good Same<br />
Pipelines are being actively replaced in order to reduce leakages, current<br />
replacement rate is about 33 km a year, requiring approximately 53 million euro,<br />
being therefore the highest investment issue after the construction <strong>of</strong> the new<br />
pipeline bringing water from the Yesa dam.<br />
One important limitation to properly assess the environmental performance <strong>of</strong><br />
<strong>Zaragoza</strong> UWS is the lack <strong>of</strong> information concerning the flows through the distribution<br />
27
<strong>Systems</strong> <strong>Analysis</strong> <strong>of</strong> <strong>Zaragoza</strong> UWS<br />
Guillermo Penagos<br />
network. There are online meters at most facilities, but there is no data base.<br />
Therefore it is not possible to differentiate actual leakages at the distribution network<br />
from other factors contributing to unaccounted water, which has been reducing<br />
during the last decade, but still continues to be considerably high.<br />
In 2002, starting point <strong>of</strong> the water supply improvement plan, unaccounted water was<br />
as high as 34 million m 3 a year, nearly 45% <strong>of</strong> total withdrawal. Municipality<br />
estimated by that time approximately 17 million m 3 to be actual leakage in the<br />
distribution system, but this is just a rough estimation. In 2006 unaccounted water<br />
was around 32% <strong>of</strong> total withdrawal (see table 2). The goal is to reduce it below 15%.<br />
The main demonstration activity for <strong>Zaragoza</strong> within <strong>SWITCH</strong> project is to carry out a<br />
complete water balance for one sector <strong>of</strong> the city in order to improve the current<br />
knowledge about water consumption and leakage in order to reduce the percentage<br />
<strong>of</strong> unaccounted water.<br />
4.2.4 <strong>Water</strong> use<br />
As it can be seen in figure 2, domestic use accounts for approximately the 62% <strong>of</strong><br />
metered consumption. Industrial activities represent the 36% and public facilities plus<br />
landscaping consume only 2%.<br />
Data concerning water withdrawal and water consumption from 1997 –when<br />
campaigns for rationalizing water use at households and industries started– to 2006<br />
are shown in table 2. Along this period water withdrawal has been reduced by 20<br />
million m 3 year -1 due to both consumption reduction and infrastructure upgrading.<br />
Along the last decade domestic consumption has gone down from 140 to 110 l<br />
person -1 day -1 , leading to 6 million m 3 year -1 less withdrawal; even with population<br />
increasing with around 50 thousand people during the same period. Thus<br />
infrastructure upgrading accounts for 14 million m 3 year -1 reduction.<br />
28
<strong>Systems</strong> <strong>Analysis</strong> <strong>of</strong> <strong>Zaragoza</strong> UWS<br />
Guillermo Penagos<br />
Table 2. Evolution <strong>of</strong> water withdrawal and consumption in <strong>Zaragoza</strong><br />
Year Withdrawal<br />
(million m 3<br />
per year)<br />
Population<br />
(thousand inh)<br />
Average<br />
consumption<br />
(l person -1 day -1 )<br />
Metered<br />
consumption<br />
(million m 3 /year)<br />
Unaccounted tap<br />
water<br />
(%)<br />
1997 84.7 601.6 139.8 39.9 45.6<br />
1998 80.2 606.0 132.2 41.5 43.0<br />
1999 80.4 607.3 132.2 41.2 43.2<br />
2000 79.3 608.1 129.4 41.8 41.2<br />
2001 79.7 613.4 128.8 42.5 39.0<br />
2002 74.5 622.6 124.6 42.7 39.9<br />
2003 71.7 628.4 122.4 44.1 38.2<br />
2004 70.8 641.6 123.3 44.3 37.4<br />
2005 68.2 650.6 118.0 44.6 35.0<br />
2006 64.1 657.0 110.0 43.1 32.8<br />
In spite <strong>of</strong> the important contribution <strong>of</strong> domestic water savings to the overall<br />
reduction <strong>of</strong> <strong>Zaragoza</strong> water withdrawal, municipality assumes that households are<br />
the major contributor to tap water loses since all over the city there are about 7000 to<br />
7500 drinking water storage tanks installed between 30 to 40 years ago at the<br />
basement <strong>of</strong> buildings with the aim to assure continuous availability <strong>of</strong> water. At that<br />
time shortages were relatively common. Nowadays <strong>Zaragoza</strong> municipality considers<br />
such facilities not just unnecessary -since shortages have became very unusual- but<br />
also a source <strong>of</strong> problems since these tanks are poorly or even not maintained at all.<br />
There are three sustainability issues concerning these tanks:<br />
• Energy losses. By definition these facilities break the pressure existing in the<br />
pipeline –which would be enough otherwise to bring water up to the top <strong>of</strong> the<br />
building– making necessary for the building to consume electricity in order to<br />
pump water up.<br />
• <strong>Water</strong> losses. Municipality considers these tanks as the main source for water<br />
losses since poor maintenance may leave to continuous overflows that are<br />
discharged into the sewers (figure 5), mostly during low demand time (night<br />
time and holydays). Such losses become part <strong>of</strong> unaccounted water since<br />
meters are located at the outflow <strong>of</strong> the tanks (figure 5).<br />
• Public health. Legionella, Mycobacterium, enteric Amoebas as well as other<br />
opportunistic pathogens and nuisance organisms, some <strong>of</strong> these largely<br />
resistant to chlorine, may multiply inside these tanks when residence time<br />
increases (WHO, 2004).<br />
Due to these problems <strong>Zaragoza</strong> Municipality wants the tanks to be taken out <strong>of</strong><br />
work, which they cannot do directly since those are private facilities. Municipality is<br />
considering to carry out campaigns to inform people about the disadvantages <strong>of</strong> such<br />
29
<strong>Systems</strong> <strong>Analysis</strong> <strong>of</strong> <strong>Zaragoza</strong> UWS<br />
Guillermo Penagos<br />
facilities, but nothing has been done yet. The Local Agenda 21 Office also suggested<br />
an assessment <strong>of</strong> water losses and energy consumption for these tanks as part <strong>of</strong><br />
demonstration activities for <strong>Zaragoza</strong> within the <strong>SWITCH</strong> framework. Figure 6 shows<br />
a scheme <strong>of</strong> the typical breaking pressure tank as described by municipality staff.<br />
Meters<br />
Ground floor<br />
Bassement<br />
Pump<br />
Breaking pressure tank<br />
Sewer<br />
Drinking water pipeline<br />
Figure 6. Scheme <strong>of</strong> a breaking pressure tank<br />
4.2.5 Sewer system<br />
<strong>Zaragoza</strong> has got a combined sewer system to which nearly all Industries and<br />
neighborhoods are nowadays connected. As previously described, some excess <strong>of</strong><br />
irrigation water may also reach the sewer system. Nearly all industrial activities are<br />
currently taking place in areas surrounding the city, so called “Industrial Polygons”.<br />
Industrial discharges are regulated by a local law since 1986. There are 23 physicchemical<br />
parameters that industrial waste waters must meet to be discharged into<br />
municipal sewers. Local Agenda 21 Office asks each industry for a discharge<br />
statement where all substances and processes involved in the industrial activity must<br />
be described. Industries should also implement management options intended to<br />
reduce WW pollution. Substances classified as harmful or toxic are not to be<br />
discharged into municipal sewers. Agenda 21 Office carries out inspection visits in<br />
order to confirm the information provided by the industry. Industrial discharge<br />
statements are classified as shown in table 3.<br />
30
<strong>Systems</strong> <strong>Analysis</strong> <strong>of</strong> <strong>Zaragoza</strong> UWS<br />
Guillermo Penagos<br />
Table 3. Classification <strong>of</strong> industrial discharges in <strong>Zaragoza</strong> in 2005<br />
Class Definition<br />
% <strong>of</strong> Industrial<br />
activities falling<br />
in each category<br />
in 2005<br />
0 Similar to domestic WW. No statement required 25<br />
1 Discharge < 15 m 3 day -1 . No toxic substances 65<br />
2 Discharge > 15 m 3 day -1 and < 50 m 3 day -1 . No toxic<br />
5<br />
Discharge < 15 m 3 day -1 possible content <strong>of</strong> toxic substances<br />
3 > 50 m 3 day -1 5<br />
Iinformation concerning each industrial discharge statement is introduced into a data<br />
base. Included aspects are:<br />
• Discharge location<br />
• Industrial activity<br />
• Both potential and actual pollutants emitted to the environment<br />
• Toxic substances used along the industrial process<br />
• <strong>Water</strong> consumption<br />
• WW quality<br />
• WWT or processes aimed to reduce WW pollution<br />
• Legal information (licences, etc)<br />
<strong>Zaragoza</strong> sewer infrastructure is fully mapped in a GIS, but it has not been yet<br />
modelled, therefore there are no data concerning flows or substances transport and<br />
transformation.<br />
4.2.6 Wastewater treatment<br />
<strong>Zaragoza</strong> has got two public WWTP. General features for the two plants are provided<br />
in table 4. The average inflow for “La Almozara” is 12 million m 3 year -1 for “La<br />
Cartuja” is 59 million m 3 year -1 . In addition to those public treatment plants there are<br />
also two private ones treating industrial sewage from two paper mills which do not<br />
use tap water but extract groundwater. Since these two companies own WWTPs they<br />
are not connected to <strong>Zaragoza</strong> sewer system, but discharge into the Gallego and the<br />
Ebro River (see figure 2). The authority in charge <strong>of</strong> controlling such discharges is<br />
not the Local Agenda 21 Office but the CHE. These two WWTPs provide the same<br />
sewage and sludge treatment than “Almozara” and together they treat even more<br />
water, around 13.6 million m 3 year -1 (see figure 2). Therefore they are also<br />
considered for all analyses in this report and they will be referred to as “Paper mills”.<br />
31
<strong>Systems</strong> <strong>Analysis</strong> <strong>of</strong> <strong>Zaragoza</strong> UWS<br />
Guillermo Penagos<br />
Table 4. <strong>Zaragoza</strong> public WWTPs<br />
WWTP Cartuja<br />
Almozara<br />
Parameter<br />
Sewage Origin Industrial and domestic Industrial and domestic<br />
Average flow at design<br />
3.00 0.40<br />
(m 3 s -1 )<br />
Average actual flow in<br />
1.72 0.37<br />
2006 (m 3 s -1 )<br />
<strong>Water</strong> treatment<br />
Primary sedimentation, Biological Primary decantation, Biological<br />
treatment by activated sludge and treatment by activated sludge and<br />
secondary decantation<br />
secondary<br />
decantation,<br />
Phosphorus removal with Iron<br />
Chloride<br />
Sludge treatment Primary and secondary digestion<br />
plus dehydration by filter press<br />
Centrifuge dehydration flowed by<br />
incineration<br />
As it can be seen in table 4 “Almozara” is working near its actual capacity whereas<br />
“Cartuja” seems to be over dimensioned and is working at half <strong>of</strong> its actual capacity.<br />
4.3 Environmental performance <strong>of</strong> <strong>Zaragoza</strong> UWS<br />
4.3.1 Use <strong>of</strong> chemical products<br />
Figure 7 shows the annual consumption <strong>of</strong> chemical products by <strong>Zaragoza</strong> UWS<br />
from 2000 for DWT and from 2001 for WWT. There is a steady trend over these<br />
years, but Chlorine and Allum shows a clear reduction for 2005 and 2006, from<br />
around 3000 to 2500 ton and from 8000 to 6000 ton respectively. PAC use for DWT<br />
started in 2003 and it has not been steady since then.<br />
32
<strong>Systems</strong> <strong>Analysis</strong> <strong>of</strong> <strong>Zaragoza</strong> UWS Guillermo Penagos<br />
Chlorine consumption<br />
Alum consumption<br />
4,000<br />
12,000<br />
Chloride (tons)<br />
3,500<br />
3,000<br />
2,500<br />
2,000<br />
1,500<br />
1,000<br />
500<br />
Alum (tons)<br />
10,000<br />
8,000<br />
6,000<br />
4,000<br />
2,000<br />
0<br />
2000 2001 2002 2003 2004 2005 2006<br />
Year<br />
0<br />
2000 2001 2002 2003 2004 2005 2006<br />
Year<br />
Powdered Activated Carbon consumption<br />
Iron Chloride consumption<br />
400<br />
12,000<br />
350<br />
300<br />
10,000<br />
PAC (tons)<br />
250<br />
200<br />
150<br />
100<br />
FeCl 3 (ton)<br />
8,000<br />
6,000<br />
4,000<br />
50<br />
0<br />
2000 2001 2002 2003 2004 2005 2006<br />
Year<br />
2,000<br />
0<br />
2001 2002 2003 2004 2005 2006<br />
year<br />
Figure 7. Chemical products consumption by <strong>Zaragoza</strong> UWS. Chlorine, Allum and PAC are used for DWT whereas Iron Chloride is used for WWT in “Carjuja”plant<br />
33
<strong>Systems</strong> <strong>Analysis</strong> <strong>of</strong> <strong>Zaragoza</strong> UWS<br />
Guillermo Penagos<br />
4.3.2 Energy consumption and Atmospheric emissions<br />
Figure 8 shows the total energy consumption <strong>of</strong> <strong>Zaragoza</strong> UWS discriminated by<br />
process. Both direct as well as indirect energy consumption are included. Direct<br />
consumption is electric power required for operation. Indirect consumption is the one<br />
required for transportation <strong>of</strong> both sludge and chemical products. It can be seen that<br />
around 60% <strong>of</strong> total consumption is due to WWT process. The contribution <strong>of</strong><br />
groundwater extraction to total energy consumption is negligible. Energy<br />
consumption per water cubic meter is around 0.35 Kwh for WWT, 0.12 Kwh for DWT<br />
and 0.02 Kwh for groundwater extraction. Sludge digestion at “Almozara” and “Paper<br />
mills” as well as heat recovery at “Cartuja” allow energy production by the UWS for<br />
about 4 Gwh every year, which represents 10% <strong>of</strong> total energy consumption by the<br />
UWS system. (see figure 8).<br />
34
<strong>Systems</strong> <strong>Analysis</strong> <strong>of</strong> <strong>Zaragoza</strong> UWS Guillermo Penagos<br />
10<br />
Energy (Gwh)<br />
50<br />
40<br />
30<br />
20<br />
10<br />
<strong>Water</strong> supply Ground water WWT<br />
Energy recovery (Gwh)<br />
8<br />
6<br />
4<br />
2<br />
0<br />
2001 2002 2003 2004 2005 2006<br />
Year<br />
0<br />
2001 2002 2003 2004 2005 2006<br />
Year<br />
<strong>Water</strong> supply Ground water WWT<br />
0.40<br />
Energy (Kwh m 3 )<br />
0.30<br />
0.20<br />
0.10<br />
0.00<br />
2001 2002 2003 2004 2005 2006<br />
Year<br />
Figure 8. Energy consumption <strong>of</strong> <strong>Zaragoza</strong>’s UWS per process. Left up: Total<br />
energy consumption. Right: Energy recovery (energy produced by sludge digestion<br />
and heat recovering at WWTPs). Left down: Energy consumption per cubic meter.<br />
35
<strong>Systems</strong> <strong>Analysis</strong> <strong>of</strong> <strong>Zaragoza</strong> UWS<br />
Guillermo Penagos<br />
Figure 9 shows the current composition <strong>of</strong> electric sources in the market stock for<br />
Spain. It can be seen that nearly half <strong>of</strong> electric production is using fossil fuels (coal<br />
and combined cycles). From these percentages CO2 emissions produced by electric<br />
energy consumption are 436 ton per Gwh.<br />
27%<br />
4%<br />
41%<br />
Coal<br />
Hydropower<br />
Combined cycles<br />
Eolic<br />
Nuclear<br />
9%<br />
19%<br />
Figure 9. Current Sources <strong>of</strong> Electric Energy in Spain.<br />
Figure 10 shows the main causes for atmospheric emissions derived from the<br />
operation <strong>of</strong> <strong>Zaragoza</strong> UWS. It is important to point out that water supply does not<br />
directly produce atmospheric emissions, but only indirectly from transportation <strong>of</strong><br />
chemical products as well as from electricity use. Groundwater produces only indirect<br />
emissions from electricity use. All direct emissions from <strong>Zaragoza</strong> UWS are derived<br />
from WWT and correspond to: 1) sludge digestion; 2) further emissions from digested<br />
sludge degradation at landfill site (for paper mills); as well as 3) at agriculture fields<br />
(Almozara), and finally from sludge incineration (Cartuja). It is remarkable that only<br />
36% are direct emissions whereas 63% are indirect emissions derived from electricity<br />
use, which results from the market composition described in figure 9.<br />
36
<strong>Systems</strong> <strong>Analysis</strong> <strong>of</strong> <strong>Zaragoza</strong> UWS<br />
Guillermo Penagos<br />
36%<br />
Direct<br />
Transportation<br />
63%<br />
Electricity<br />
1%<br />
Figure 10. Direct and Indirect CO 2 emissions <strong>of</strong> <strong>Zaragoza</strong>’s UWS (Source: Ministerio de<br />
Industria, Turismo y Comercio de España, 2007),<br />
As result <strong>of</strong> facts described by figures 8 to 10 WWT process is responsible for most<br />
atmospheric emissions (see figure 11).<br />
15%<br />
0%<br />
<strong>Water</strong> supply<br />
Ground water<br />
WWT<br />
85%<br />
Figure 11. CO 2 emissions <strong>of</strong> <strong>Zaragoza</strong>’s UWS per process. Total CO 2 emissions = 23 ton<br />
4.3.3 Heavy metals<br />
Figure 12 shows the heavy metal loads in <strong>Zaragoza</strong> sewage. Zinc (48%) and nickel<br />
(25%) are the most abundant.<br />
37
<strong>Systems</strong> <strong>Analysis</strong> <strong>of</strong> <strong>Zaragoza</strong> UWS<br />
Guillermo Penagos<br />
2%<br />
11%<br />
48%<br />
13%<br />
1%<br />
Pb<br />
Cu<br />
Hg<br />
Ni<br />
Zn<br />
As<br />
25%<br />
Figure 12. Heavy metals in <strong>Zaragoza</strong> waste water<br />
Figure 13 shows the heavy metal annual loads from <strong>Zaragoza</strong> UWS to the<br />
environment. WWT technologies in <strong>Zaragoza</strong> are not designed to remove those,<br />
therefore it is not surprising that nearly 60% <strong>of</strong> total load every year is going to the<br />
Ebro river. Around 80% <strong>of</strong> the loads to the river are produced by “Cartuja” plant.<br />
“Almozara” produces loads that are quite similar to those from “Paper mills”. The<br />
impact <strong>of</strong> storm water is considerably low. Around 39% <strong>of</strong> heavy metals from sewage<br />
is disposed at landfill site and only a negligible fraction (around 1%) ends up in<br />
agriculture fields. Total annual loads to the river are around 23 ton year -1 whereas<br />
total loads to landfills are around 13 ton year -1 . Loads to agriculture are 300 kg year -1 .<br />
Comparison between years shows only small differences with no clear tendency <strong>of</strong><br />
heavy metal loads to either increase or decrease over time.<br />
4.3.4 Organic matter<br />
Biodegradable and non-biodegradable organic matter loads to the Ebro River<br />
expressed as BOD and COD respectively are shown in figure 14. BOD loads are<br />
around 1,000 ton year -1 and COD loads are around 4,500 ton year -1 . Again around<br />
80% loads come from “Cartuja” plant and loads from “Almozara” plant and from<br />
“Paper mills” are similar. Again the impacts from storm water are relatively low except<br />
for the year 2001 when it produced half <strong>of</strong> BOD load, increasing the city total two<br />
folds. COD load from storm water in the same year was not as high as BOD load, but<br />
it was comparable to those <strong>of</strong> “Almozara” and “Paper mills”.<br />
4.3.5 Nutrients<br />
Just as other pollution loads previously described annual loads <strong>of</strong> nitrogen and<br />
phosphorus do not show any tendency to either increase or decline over the years.<br />
Nitrogen loads to the Ebro River are around 3,000 ton year -1 . “Cartuja” plant accounts<br />
38
<strong>Systems</strong> <strong>Analysis</strong> <strong>of</strong> <strong>Zaragoza</strong> UWS<br />
Guillermo Penagos<br />
for 75% <strong>of</strong> the total load to the river. Once again “Almozara” and “Paper mills” loads<br />
are quite comparable. Nearly 60% <strong>of</strong> nitrogen is being removed from the sewage by<br />
the WWT system and ends up in the sludge (no data concerning denitrification were<br />
available).<br />
Since “Cartuja” plant is designed to remove phosphorus, the relative contribution <strong>of</strong><br />
this facility to the TP loads to the Ebro River is relatively low as compared with all<br />
other pollution loads that have been already mentioned and it is even comparable to<br />
those loads from the other two facilities. As consequence <strong>of</strong> TP removal at “Cartuja”<br />
plant 65% <strong>of</strong> this nutrient is disposed in a landfill for hazardous materials (see figure<br />
2) and only 3.5% is recycled to agriculture.<br />
39
<strong>Systems</strong> <strong>Analysis</strong> <strong>of</strong> <strong>Zaragoza</strong> UWS Guillermo Penagos<br />
30<br />
Cartuja Almozara Paper mills Storm water<br />
30<br />
Agriculture<br />
Landfill<br />
Heavy metals (ton)<br />
25<br />
20<br />
15<br />
10<br />
5<br />
Heavy metals (ton)<br />
25<br />
20<br />
15<br />
10<br />
5<br />
0<br />
0<br />
2001 2002 2003 2004 2005 2006<br />
2001 2002 2003 2004 2005 2006<br />
Year<br />
Year<br />
Figure 13. Heavy metals loads to the environment from <strong>Zaragoza</strong> UWS. Left: Loads to receiving water body. Right: Loads to landfill and agriculture<br />
2,500<br />
Cartuja Almozara Paper mills Storm water<br />
6,000<br />
Cartuja Almozara Paper mills Storm water<br />
2,000<br />
5,000<br />
BOD (ton)<br />
1,500<br />
1,000<br />
COD (ton)<br />
4,000<br />
3,000<br />
2,000<br />
500<br />
1,000<br />
0<br />
2001 2002 2003 2004 2005 2006<br />
Year<br />
Figure 14. BOD and COD loads from <strong>Zaragoza</strong>’s UWS to the Ebro River<br />
0<br />
2001 2002 2003 2004 2005 2006<br />
Year<br />
40
<strong>Systems</strong> <strong>Analysis</strong> <strong>of</strong> <strong>Zaragoza</strong> UWS Guillermo Penagos<br />
3,500<br />
Cartuja Almozara Paper mills Storm water<br />
3,500<br />
Cartuja Almozara Paper mills<br />
3,000<br />
3,000<br />
Total N (ton)<br />
2,500<br />
2,000<br />
1,500<br />
1,000<br />
Total N (ton)<br />
2,500<br />
2,000<br />
1,500<br />
1,000<br />
500<br />
500<br />
0<br />
2001 2002 2003 2004 2005 2006<br />
Year<br />
0<br />
2001 2002 2003 2004 2005 2006<br />
Year<br />
Figure 15. Nitrogen loads to the environment from <strong>Zaragoza</strong> UWS. Left: Loads to receiving water body. Right: Loads to landfill and agriculture<br />
500<br />
Cartuja Almozara Paper mills Storm water<br />
500<br />
Cartuja Almozara Paper mills<br />
400<br />
400<br />
Total P (ton)<br />
300<br />
200<br />
Total P (ton)<br />
300<br />
200<br />
100<br />
100<br />
0<br />
2001 2002 2003 2004 2005 2006<br />
Year<br />
0<br />
2001 2002 2003 2004 2005 2006<br />
Year<br />
Figure 16. Phosphorus to the environment from <strong>Zaragoza</strong> UWS. Left: Loads to receiving water body. Right: Loads to landfill and agriculture<br />
41
<strong>Systems</strong> <strong>Analysis</strong> <strong>of</strong> <strong>Zaragoza</strong> UWS<br />
Guillermo Penagos<br />
4.3.6 Sludge production<br />
Figure 17 shows the annual production <strong>of</strong> sludge (dry matter) produced by <strong>Zaragoza</strong><br />
UWS. Here both DWT and WWT sludge are presented together. Clearly those two<br />
are completely different kind <strong>of</strong> waste and impact the environment in different way.<br />
However, solid waste production as such is generally used as environmental<br />
performance indicator for urban systems. Hence it is also considered here as well.<br />
It is evident that solid waste production from this UWS has significantly increased<br />
from 2001. The reason is that DWTP began dewatering sludge from 2002. From<br />
2003 DWT sludge becomes the major component <strong>of</strong> solid waste for the water<br />
system. Total solid waste from the water system is around 14,000 ton year -1 .<br />
According to the Local Agenda 21 Office this amount represents around the 4% <strong>of</strong><br />
total solid waste produced by the city every year.<br />
16<br />
DWTP Cartuja Almozara Paper mills<br />
14<br />
Sludge (10 3 ton)<br />
12<br />
10<br />
8<br />
6<br />
4<br />
2<br />
0<br />
2001 2002 2003 2004 2005 2006<br />
Year<br />
Fig 17. Sludge (as dry matter) production by <strong>Zaragoza</strong> UWS<br />
4.4 <strong>Zaragoza</strong> UWS in the future<br />
The vision <strong>of</strong> <strong>Zaragoza</strong> for its UWS has been focused on water supply. The main<br />
goal was to reduce water withdrawal to 65 million 3 year -1 by 2010 and has already<br />
been achieved. Other goal is to reduce unaccounted tap water below 15%, but there<br />
is no time horizon for this goal. However this indicator has been reducing 2% per<br />
year on average since 2002 when the plan for improving water supply started (see<br />
table 2). If the city manages to keep decreasing unaccounted water at such rate, it<br />
will reach 15% by 2015.<br />
42
<strong>Systems</strong> <strong>Analysis</strong> <strong>of</strong> <strong>Zaragoza</strong> UWS<br />
Guillermo Penagos<br />
Other aspects <strong>of</strong> environmental urban water sustainability are not expressed as goals<br />
for the water system. However <strong>Zaragoza</strong> city signed the Aalborg summit for<br />
sustainable European cities. The goals <strong>of</strong> <strong>Zaragoza</strong> sustainability vision that apply to<br />
the UWS and a list <strong>of</strong> suggested actions to achieve each goal are shown in table 5.<br />
Table 5. Goals <strong>of</strong> the Aalborg summit that apply to the UWS <strong>of</strong> <strong>Zaragoza</strong><br />
Goal<br />
Necessary actions to achieve the goal<br />
1 To reduce water withdrawal <strong>Water</strong> recycling, infrastructureupgrading (on going<br />
action), demand management (demo activity within<br />
the <strong>SWITCH</strong> project)<br />
2 To reduce unaccounted water Infrastructure upgrading, demand management<br />
3 To improve water supply quality Shifting to a different raw water source (on going<br />
action), shifting to a different DWT technology<br />
4 To contribute to improve the<br />
ecological Status <strong>of</strong> the Ebro River<br />
5 To reduce dependence on fossil<br />
fuels<br />
To reduce pollution loads to the River<br />
Shifting to renewable energy sources (depends on<br />
National Government Policies)<br />
6 To reduce the ecological footprint To reduce resource consumption<br />
7 To reduce the production <strong>of</strong> solid<br />
waste<br />
To reduce sludge production<br />
4.4.2 Focus problem and drivers affecting <strong>Zaragoza</strong> sustainability vision<br />
The tree problem methodology is used here to define the goal <strong>of</strong> environmental<br />
sustainability as the focus problem <strong>of</strong> <strong>Zaragoza</strong> UWS. Several drivers that might<br />
affect the environmental performance <strong>of</strong> such system are shown in figure 18.<br />
43
<strong>Systems</strong> <strong>Analysis</strong> <strong>of</strong> <strong>Zaragoza</strong> UWS<br />
Guillermo Penagos<br />
Hydropower<br />
Generation<br />
Agriculture<br />
Climate<br />
change<br />
Upstream<br />
abstraction<br />
Upstream<br />
pollution<br />
Insufficient raw<br />
water quantity<br />
and quality<br />
Population<br />
growth<br />
People's<br />
consumption<br />
petterns<br />
Aging<br />
infrastructure<br />
Increased<br />
industrialization<br />
Limitations<br />
<strong>of</strong> existing<br />
technology<br />
Drinking <strong>Water</strong><br />
Treatment<br />
Inefficiency<br />
Inefficient water use<br />
and water losses<br />
Insufficient pollution<br />
removal from<br />
sewage<br />
Eficiency<br />
<strong>Urban</strong> <strong>Water</strong><br />
System<br />
Focus problem<br />
Excesive<br />
resource<br />
consumption<br />
High pollution<br />
loads to the<br />
environment<br />
Figure 18. An exercise <strong>of</strong> problem tree analysis for <strong>Zaragoza</strong>. The core problem would be to<br />
improve the effectiveness and the efficiency <strong>of</strong> the UWS.<br />
The drivers identified in figure 18 are classified in figure 19 by a matrix <strong>of</strong> uncertainty<br />
vs importance. The criteria for such classification are described next.<br />
Increasing importance <br />
More important – less uncertain<br />
• <strong>Urban</strong>ization<br />
• Availability <strong>of</strong> funds<br />
• Dependence on fossil fuels<br />
• Existing infrastructure<br />
Less important – less uncertain<br />
• DWT and WWT technologies<br />
Increasing uncertainty <br />
More important – more uncertain<br />
• Climate change<br />
• <strong>Water</strong> abstraction use<br />
• Population increase<br />
Less important – more uncertain<br />
• Storm water<br />
Figure 19. Matrix <strong>of</strong> uncertainty vs importance to classify drivers <strong>of</strong> <strong>Zaragoza</strong> UWS<br />
sustainability<br />
4.4.1 Criteria for classification <strong>of</strong> drivers<br />
4.4.1.1 Less important – less uncertain<br />
• Introduction <strong>of</strong> new DWT and/or WWT technologies is not planned for<br />
<strong>Zaragoza</strong> during the next decade since current infrastructure is being<br />
upgraded and costs will still be paid in the coming years.<br />
44
<strong>Systems</strong> <strong>Analysis</strong> <strong>of</strong> <strong>Zaragoza</strong> UWS<br />
Guillermo Penagos<br />
4.4.1.2 Less important – more uncertain<br />
• According to data analyzed in this report, storm water does not seem to be a<br />
determining issue for the environmental performance <strong>of</strong> <strong>Zaragoza</strong> UWS,<br />
which is also logic considering precipitation and evapotranspiration in this<br />
region. Given the erratic precipitation patterns that characterize <strong>Zaragoza</strong>, the<br />
uncertainty level is also high.<br />
4.4.1.3 More important – less uncertain<br />
• <strong>Urban</strong>ization in <strong>Zaragoza</strong> is increasing, but it is planned, therefore its<br />
uncertainty level is low, its importance for the environmental performance <strong>of</strong><br />
<strong>Zaragoza</strong> UWS is high.<br />
• Availability <strong>of</strong> funds for improving the system is an important issue, but it is<br />
assured for the upgrading plans and the education campaigns that are<br />
already in place.<br />
• From the data presented here it is evident that the dependency on fossil fuels<br />
for electricity production in Spain is still high and it is an important component<br />
<strong>of</strong> the UWS environmental impacts. However Spain has signed the Kyoto<br />
protocol and there are already plans to expand the electricity production from<br />
renewable sources. Figure 20 shows the expected composition <strong>of</strong> electric<br />
power production market projected by the National Plan on Energy proposed<br />
by 2015 in Spain (Ministerio de Industria, Turismo y Comercio, 2007). This<br />
composition will reduce the dependence on fossil fuels and also reduces<br />
atmospheric emissions from 436 to 320 ton Gwh -1 .<br />
45
<strong>Systems</strong> <strong>Analysis</strong> <strong>of</strong> <strong>Zaragoza</strong> UWS<br />
Guillermo Penagos<br />
16%<br />
21%<br />
6%<br />
Coal<br />
Hydropower<br />
Combined cycles<br />
Eolic<br />
Nuclear<br />
23%<br />
34%<br />
Figure 20. Composition <strong>of</strong> electric power production market in Spain projected by 2015<br />
by National Plan on Energy (Source: Ministerio de Industria, Turismo y Comercio de<br />
España, 2007)<br />
• Infrastructure ageing is one <strong>of</strong> the most important limitations for <strong>Zaragoza</strong><br />
UWS, moreover when water efficiency use is considered. However this<br />
upgrading has been taking place during the last decade and it is planned to<br />
continue during the years to come.<br />
4.4.1.4 More important – more uncertain<br />
• Spain is a country with problems <strong>of</strong> water stress. In addition to this, the<br />
Aragon valley is the driest region in Europe, as it was already mentioned.<br />
Therefore the effect <strong>of</strong> climate change upon the water resources is a major<br />
issue and this may threaten the quantity and the quality <strong>of</strong> the water required<br />
by <strong>Zaragoza</strong> in the future. In addition to this, the environmental impacts <strong>of</strong> the<br />
city upon the Ebro River downstream will be also dependent on the river<br />
discharges, which will also be affected by climate change.<br />
• Upstream water use is a major issue for <strong>Zaragoza</strong> since it can exacerbate the<br />
effects <strong>of</strong> climate change upon water quantity and quality. Additionally, as it<br />
was described previously, excess water for irrigation upstream from <strong>Zaragoza</strong><br />
is responsible for recharging city’s groundwater, which accounts for the 23%<br />
<strong>of</strong> current water requirements.<br />
46
<strong>Systems</strong> <strong>Analysis</strong> <strong>of</strong> <strong>Zaragoza</strong> UWS<br />
Guillermo Penagos<br />
• Population in <strong>Zaragoza</strong> has increased in a 1% average during the last<br />
decade. There is a study about population increase projections, but it ends up<br />
in 2008. Therefore it is not clear the rate <strong>of</strong> population increase in the future<br />
years. Therefore this is an uncertain factor that strongly affects both resource<br />
consumption (water, chemical products, energy, etc) and pollution loads.<br />
4.4.3 Scenario analysis<br />
4.4.3.1 Setting Scenario<br />
Several combinations <strong>of</strong> the 4 factors considered as more uncertain and more<br />
important are possible. Table 6 shows three examples for possible scenarios.<br />
Climate change effects are considered as percentage <strong>of</strong> projected reduction <strong>of</strong><br />
water availability in the Ebro catchment by 2020 (Ayala-Carcedo, 2000).<br />
Table 6. Possible drivers scenarios for Zarzgoza UWS<br />
Scenario<br />
Climate<br />
change<br />
<strong>Water</strong> use<br />
upstream<br />
Population<br />
Classification<br />
Sc1 0% < < best unlikely<br />
Sc2 -6% = = bad unlikely<br />
Sc3 -13% > 10% 1% worst likely<br />
Scenario Sc3 can be considered likely in every aspect since:<br />
• Climate change is expected to reduce water availability in the Ebro basin in<br />
40% to 2060 which means 13% by 2020 if a constant reduction rate is<br />
considered (Ayala-Carcedo, 2000).<br />
• The National Irrigation Plan that is about to be implemented in the years to<br />
come aims to increase 10% <strong>of</strong> current irrigated area in Spain by 2015 (MAPA,<br />
2007), which directly means 10% more water abstraction upstream from<br />
<strong>Zaragoza</strong> because irrigation is already the major water consumer in the Ebro<br />
Catchment.<br />
• <strong>Zaragoza</strong> urbanization plan assumes that city will continue expanding and<br />
therefore it is very likely that population will continue increasing.<br />
4.4.3.2 Assumptions for Scenario analysis<br />
<strong>Zaragoza</strong> sustainability vision will be analyzed for the time horizon 2020 under Sc3<br />
scenario considering climate change and Spanish national policies on water as major<br />
drivers. Due to time constraints, other likely scenarios are not analyzed. Under Sc3<br />
scenario, several assumptions that can be considered realistic are made:<br />
47
<strong>Systems</strong> <strong>Analysis</strong> <strong>of</strong> <strong>Zaragoza</strong> UWS<br />
Guillermo Penagos<br />
• From 2002 when water infrastructure started being upgraded, unaccounted<br />
water has been decreasing in 7% every year. Funds to continue upgrading<br />
are available. In addition to this, demand management is going to be<br />
implemented as demonstration activity for <strong>Zaragoza</strong> within the <strong>SWITCH</strong><br />
project. Therefore unaccounted water is expected to continue reducing. If<br />
current reduction rate is sustained, then unaccounted water will be around<br />
10% <strong>of</strong> total withdrawal by 2020.<br />
• Since most components <strong>of</strong> water infrastructure either are being upgraded or<br />
have been recently upgraded, there is no possibility that existing DWT and<br />
WWT technology in <strong>Zaragoza</strong> will change before 2020.<br />
• Consumption and production patterns in Spanish society are assumed to stay<br />
the same, or will even increase by 2020. Therefore pollution loads to the<br />
sewage system will increase at the same rate as population is increasing.<br />
4.4.3.3 Suggested strategy: Industrial water recycling<br />
4.4.3.3.1 Effect <strong>of</strong> water recycling on water withdrawal<br />
Under Sc3 scenario <strong>Zaragoza</strong> population is expected to be 14% larger than now by<br />
2020. As shown in figure 21, water withdrawal is expected to reduce from 64 million<br />
m 3 in 2006 to 56 million m 3 in 2020 just as a consequence <strong>of</strong> infrastructure<br />
upgrading, meaning 14% reduction <strong>of</strong> current water withdrawal. If the city aims to<br />
reduce water withdrawal below 56 million m 3 by 2020, then also domestic and<br />
industrial water consumption must be reduced. Current strategies going on in<br />
<strong>Zaragoza</strong> also aim to optimize water use for landscaping, however this use only<br />
represents 5% <strong>of</strong> total water requirements (including groundwater). Therefore such<br />
strategy is not going to have a significant effect.<br />
Presently domestic consumption in <strong>Zaragoza</strong> is already 110 l person -1 day -1 , which is<br />
already a low consumption, to reduce it below this level is not very likely. On the<br />
other hand, current industrial water needs in <strong>Zaragoza</strong> are approximately 40% <strong>of</strong><br />
total water requirements (including groundwater). A suitable alternative for continuing<br />
reducing water requirements <strong>of</strong> <strong>Zaragoza</strong> city would be recycling industrial water. For<br />
this scenario analysis two strategies consisting on 10% and 30% recycling are<br />
considered. This will represent additional 2% and 7% less water withdrawal<br />
respectively (see figure 21). This strategy considers both tap and groundwater.<br />
48
<strong>Systems</strong> <strong>Analysis</strong> <strong>of</strong> <strong>Zaragoza</strong> UWS<br />
Guillermo Penagos<br />
70<br />
<strong>Water</strong> consumption<br />
Unaccounted water<br />
Surface water withdrawal<br />
60<br />
50<br />
40<br />
30<br />
20<br />
10<br />
13.74 5.61<br />
5.4<br />
45.8<br />
51.0 49.0<br />
4.95<br />
45.0<br />
0<br />
2006 2020 no water<br />
recycling<br />
2020 with 10%<br />
Industrial water<br />
Recycling<br />
2020 with 30%<br />
Industrial water<br />
Recycling<br />
Figure 21. <strong>Water</strong> withdrawal discriminated by actual consumption and unaccounted water under<br />
Sc3 scenario and different strategies for water reuse<br />
4.4.3.3.2 Effect <strong>of</strong> water recycling on chemical products consumption<br />
Two factors have an effect on the use <strong>of</strong> chemical products for DWT: 1) water<br />
withdrawal and 2) raw water quality. The effect <strong>of</strong> projected water withdrawal may<br />
simply be calculated from figure 21. The effect <strong>of</strong> raw water quality is more complex<br />
since it is the consequence <strong>of</strong> several variables such as pH, SS, DOM, etc.<br />
The effect <strong>of</strong> water quality on the future use <strong>of</strong> chemical products is very relevant for<br />
<strong>Zaragoza</strong> since a new raw water source will be used from 2008. The Yesa reservoir<br />
is expected to provide a higher water quality than the Ebro River. In order to get a<br />
hint about how much less chemical products will be necessary to treat water from<br />
Yesa reservoir as compared to the Ebro River a regression analysis between<br />
chemical products dose per m 3 and raw water quality was performed. The considered<br />
variables <strong>of</strong> raw water were DOM (as UV absorbance) and SS. Unfortunately no<br />
significant correlation was found (data not shown). In addition to this, a comparison<br />
between the same two variables between Canal Imperial and Yesa reservoir was<br />
made. It was found that the two sources have very different values for suspended<br />
solids, but the values for DOM are quite similar (data not shown). Therefore the only<br />
assumption that can be made concerning chemical products consumption for water<br />
supply in <strong>Zaragoza</strong> is that it will decrease according to water withdrawal.<br />
49
<strong>Systems</strong> <strong>Analysis</strong> <strong>of</strong> <strong>Zaragoza</strong> UWS<br />
Guillermo Penagos<br />
4.4.3.3.3 Effect <strong>of</strong> water recycling on Energy consumption<br />
If water withdrawal is expected to decrease by 2020 then electric energy<br />
consumption is also expected to decrease. However, energy consumption <strong>of</strong> water<br />
facilities has got two components, a fixed value and a variable value that is<br />
proportional to the inflow. In order to identify such components a regression analysis<br />
between water inflow and energy consumption was performed for the water supply<br />
system in <strong>Zaragoza</strong>. The correlation is expressed by r 2 = 0.2 (data not shown).<br />
Meaning that 80% <strong>of</strong> energy consumption <strong>of</strong> the water supply process can be<br />
considered as a fixed value and 20% can be considered as flow dependent.<br />
The variable energy consumption for the water supply process is 0.1 Gwh per million<br />
m 3 . The energy consumption <strong>of</strong> pumping groundwater in <strong>Zaragoza</strong> is around 0.02<br />
Gwh per million m 3 . Recycling industrial water means increasing energy consumption<br />
because pumping will be necessary. An assumption here is made that recycling<br />
water will consume more energy than groundwater pumping, but <strong>of</strong> course much less<br />
than the variable energy consumption by water supply. This assumed value is 0.03<br />
Gwh per million m 3 . Figure 22 shows an analysis <strong>of</strong> energy consumption by<br />
<strong>Zaragoza</strong> UWS for 2006 and for scenario 2020 considering these values as well as<br />
different levels for the industrial water recycling strategy.<br />
35<br />
30<br />
Energy recovering (%)<br />
Energy consumption<br />
Energy (Gwh)<br />
25<br />
20<br />
15<br />
10<br />
5<br />
0<br />
29.7 28.2 28.1 27.7<br />
10%<br />
2006 2020 no water<br />
recycling<br />
12% 12.1 % 12.2 %<br />
2020 with 10%<br />
Industrial water<br />
Recycling<br />
2020 with 30%<br />
Industrial water<br />
Recycling<br />
Figure 22. Energy consumption <strong>of</strong> <strong>Zaragoza</strong> UWS in 2006 and 2020 scenario with different levels<br />
<strong>of</strong> Industrial water recycling strategy<br />
<strong>Water</strong> recycling will result in less energy consumption for Industries using tap water<br />
since recycling is less costly than tap water supplying. For industries that do not use<br />
tap water, recycling is more expensive than extracting groundwater. Their additional<br />
50
<strong>Systems</strong> <strong>Analysis</strong> <strong>of</strong> <strong>Zaragoza</strong> UWS<br />
Guillermo Penagos<br />
consumption would be 0.16 and 0.51 Gwh per year for 10% and 30% recycling<br />
respectively. However the energy savings supposed by tap water recycling are so<br />
significant, that <strong>Zaragoza</strong> taken as a whole system will be actually consuming slightly<br />
less energy if Industrial water recycling is implemented (see figure 22).<br />
4.4.3.3.4 Effect <strong>of</strong> water recycling on CO 2 emissions to the atmosphere<br />
Figure 23 shows an analysis <strong>of</strong> CO 2 emissions, considering the described figures for<br />
energy consumption, the National Plan on Energy and the expected increase on<br />
organic matter loads to the sewage by 2020.<br />
25<br />
Direct load Indirect due to electricity use Indirect due to transportation<br />
CO 2 emissions (10 3 ton)<br />
20<br />
15<br />
10<br />
5<br />
14.4<br />
10.3 10.2 10.1<br />
8.2 9.4 9.4 9.4<br />
0<br />
2006 2020 no water<br />
recycling<br />
2020 with 10%<br />
Industrial water<br />
Recycling<br />
2020 with 30%<br />
Industrial water<br />
Recycling<br />
Figure 23. CO 2 emissions from <strong>Zaragoza</strong> UWS in 2006 and 2020 scenario with different levels <strong>of</strong><br />
Industrial water recycling strategy<br />
As previously described, the major contribution to atmospheric emissions by<br />
<strong>Zaragoza</strong> UWS is indirectly by electricity use. As expected from figure 23, the joint<br />
effect <strong>of</strong> the National Energy Plan and the reduction on energy consumption<br />
supposed by decreasing water withdrawal, imply a significant reduction <strong>of</strong><br />
atmospheric emissions from 22,600 ton in 2006 to 19,700 in 2020.<br />
As organic matter loads to the sewage are expected to increase 14% (see section<br />
4.4.3.3.4) direct emissions will increase likewise, going from 8,200 to 9,400 ton per<br />
year. Indirect emissions by transportation <strong>of</strong> chemical products and sludge seem<br />
negligible in the figure, but those will increase from 250 in 2006 to 291 ton in 2020.<br />
The savings on energy supposed by industrial water recycling would represent an<br />
additional reduction <strong>of</strong> 50 and 100 ton per year for the 10% and the 30% strategies<br />
respectively.<br />
51
<strong>Systems</strong> <strong>Analysis</strong> <strong>of</strong> <strong>Zaragoza</strong> UWS<br />
Guillermo Penagos<br />
4.4.3.3.5 Effect <strong>of</strong> water recycling on pollution loads to the Ebro River<br />
Under the assumptions previously described it is expected that 14% larger pollution<br />
loads will be dumped into 14% less sewage volume by 2020. Hence BOD, nutrients<br />
and heavy metals will be 28% more concentrated in the sewage. If industrial water<br />
recycling is considered then pollutant concentrations in sewage will increase 30% for<br />
10% recycling and 37% for 30% strategy. As consequence <strong>of</strong> this increased<br />
concentration in the inflow, higher removal efficiency at WWTPs would be expected.<br />
In order to calculate how much this increasing efficiency would be a regression<br />
analysis between pollutant concentrations and removal efficiency was performed for<br />
all WWT facilities in <strong>Zaragoza</strong>. However, no significant correlation was found (r 2 =<br />
0.028, data not shown). Therefore, the assumption is made here that with the current<br />
WWT technology and current societal production and consumption patterns, pollution<br />
loads to the Ebro River will increase 14% by 2020, even if unaccounted water is<br />
reduced and even if industrial water is recycled.<br />
4.4.3.4 Assessment <strong>of</strong> water quantity and quality for <strong>Zaragoza</strong> in the<br />
future<br />
Considering the figures previously described for Sc3 concerning upstream water use<br />
and the effect <strong>of</strong> climate change upon water availability in the Ebro catchment. An<br />
assessment <strong>of</strong> the risk for water availability in <strong>Zaragoza</strong> was performed. Here an<br />
additional scenario for the year 2060 was projected. From figure 24 it is evident that<br />
<strong>Zaragoza</strong> can relay on Yesa reservoir as raw water source for the years to come<br />
since <strong>Zaragoza</strong> requirements projected by the year 2060 with increasing population<br />
and no water recycling are well below the projected capacity <strong>of</strong> the reservoir, even<br />
under the worst climate change and water extraction scenario.<br />
52
<strong>Systems</strong> <strong>Analysis</strong> <strong>of</strong> <strong>Zaragoza</strong> UWS<br />
Guillermo Penagos<br />
450<br />
Current 2020 2060 <strong>Zaragoza</strong> in 2060<br />
400<br />
<strong>Water</strong> (million m 3 )<br />
350<br />
300<br />
250<br />
200<br />
150<br />
100<br />
50<br />
0<br />
oct nov dec jan feb mar apr may jun jul aug sep<br />
Month<br />
Figure 24. Current and projected water storage regimes for Yesa reservoir on a hydrologic<br />
year basis under Sc3 scenario. Regimes also include the expected increase in water demand for<br />
agriculture as planned by the National Irrigation Plan (Sc3).<br />
In this analysis total <strong>Zaragoza</strong> requirements are included, even those that are<br />
currently fulfilled from groundwater. The reason is that National Irrigation Plan also<br />
considers the need <strong>of</strong> upgrading current irrigation technologies to minimize loses.<br />
This will reduce the groundwater recharge in <strong>Zaragoza</strong> and the water table might<br />
eventually drop so that it is not that feasible anymore. In such scenario, either the<br />
whole city becomes dependent on tap water or the activities that currently use<br />
groundwater will turn to the Ebro River, whose discharge will be already considerably<br />
reduced by that time.<br />
<strong>Water</strong> quality <strong>of</strong> Yesa reservoir is more difficult to project. However it is possible to<br />
consider TP concentrations as reference point. Current Yesa average TP<br />
concentrations on year basis are 21 ug/l. If current inputs are expected to remain<br />
constant, then by 2020 average TP concentrations might rise to around 40 ug/l and<br />
60 ug/l by 2060. This situation encompassed with increasing temperature and<br />
radiation (due to climate change) would increase the risk for the reservoir to<br />
experience algal blooms, which might negatively affect water supply quality for<br />
<strong>Zaragoza</strong>.<br />
53
<strong>Systems</strong> <strong>Analysis</strong> <strong>of</strong> <strong>Zaragoza</strong> UWS<br />
Guillermo Penagos<br />
4.4.3.5 Setting priorities for pollution loads<br />
This report provides insights about the environmental impacts <strong>of</strong> <strong>Zaragoza</strong> UWS<br />
operation on a year basis. However such impacts are not constant all over the year<br />
and might vary seasonally. In fact, even if pollution loads remained constant all over<br />
the year, there will be a seasonal variation <strong>of</strong> the receiving environment. This is more<br />
evident for the water bodies and is remarkable for the Ebro River which exhibits an<br />
important variation <strong>of</strong> its discharge along the year. The current hydrograph for the<br />
Ebro river on a month average basis is provided in figure 25. This figure also shows<br />
the worst climate change scenario expected for water availability in this basin for the<br />
year 2020 and the year 2060.<br />
500<br />
Current 2020 2060<br />
Average discharge (m 3 s -1 )<br />
400<br />
300<br />
200<br />
100<br />
0<br />
Oct Nov Dec Jan Feb Mar Apr May Jun Jul Aug Sep<br />
Month<br />
Figure 25. Regimes for Ebro River at <strong>Zaragoza</strong> under current conditions and projected<br />
conditions under Sc3 Scenario. Error bars represent standard deviations on a month basis (Source<br />
for current regime: CHE, 2007)<br />
In current conditions maximum discharges <strong>of</strong> nearly 400 m 3 s -1 are expected between<br />
December and April. Minimum discharges are expected during summer time,<br />
especially in August, where they can be as low as 30 m 3 s -1 . This also means that the<br />
impact <strong>of</strong> <strong>Zaragoza</strong> UWS upon the Ebro River is not constant all over the year and it<br />
reaches a maximum in August. Figure 26 provides an example <strong>of</strong> the seasonality <strong>of</strong><br />
this impact taking total phosphorus as an example.<br />
54
<strong>Systems</strong> <strong>Analysis</strong> <strong>of</strong> <strong>Zaragoza</strong> UWS<br />
Guillermo Penagos<br />
TP concentration (ug l -1 )<br />
1000<br />
800<br />
600<br />
400<br />
200<br />
Concentration upstream<br />
<strong>Zaragoza</strong><br />
Current impact<br />
2020<br />
2060<br />
0<br />
Oct Nov Dec Jan Feb Mar Apr May Jun Jul Aug Sep<br />
Month<br />
Figure 26. Impact <strong>of</strong> <strong>Zaragoza</strong> UWS upon TP concentrations at the Ebro River. Only upstream<br />
concentrations have been actually measured (CHE, 2007). Error bars represents standard deviation on<br />
a month basis. The other three concentrations are the ones that can be predicted from <strong>Zaragoza</strong> TP<br />
loads to the river at current conditions and at worst climate change scenario (Sc3?...worst climate<br />
change conditions, population growing at same rate as in the last ten years, no changes on WWT<br />
technology, no changes on people consumption patterns)<br />
TP concentrations in the Ebro River, upstream from <strong>Zaragoza</strong>, range between 100 to<br />
200 µg l -1 . Under current conditions the city does not have a significant impact on the<br />
river from October to May, but from June onwards the impact becomes more<br />
important and it may raise the TP concentrations up to 400 µg l -1 . In August when –as<br />
previously described– river discharge may drop down to 30 m 3 s -1 . For the 2020<br />
scenario the pattern is quite similar, but for the 2060 scenario August TP<br />
concentration goes up to 900 µg l -1 , which is more than three times the present<br />
upstream concentration.<br />
55
<strong>Systems</strong> <strong>Analysis</strong> <strong>of</strong> <strong>Zaragoza</strong> UWS<br />
Guillermo Penagos<br />
% <strong>of</strong> Impact regarding upstream<br />
concentrations<br />
500<br />
400<br />
300<br />
200<br />
100<br />
Current impact<br />
2020<br />
2060<br />
0<br />
Oct Nov Dec Jan Feb Mar Apr May Jun Jul Aug Sep<br />
Month<br />
Figure 27. Seasonal variability <strong>of</strong> impact percentages <strong>of</strong> <strong>Zaragoza</strong> UWS on the Ebro River taking<br />
TP as example. Current and future scenarios.<br />
If the differences between upstream concentrations and the predicted ones are<br />
converted into percentages, then these can be called impact percentages on the river<br />
and might possibly be used as indicators for sustainability. Figure 27 shows such<br />
percentages, again with reference to TP as an example.<br />
Current scenario shows an impact below 20% from November to May. Again in June<br />
it begins increasing and it goes up to 110% in August. For the 2020 scenario the<br />
peak impact also in August is nearly 150%, and finally the seasonal impact peak for<br />
the 2060 scenario goes up to 350%.<br />
Table 7 shows the values <strong>of</strong> these seasonal impact peaks for BOD, COD, TN, TP<br />
and Heavy Metals at: 1) current, 2) 2020 and 3) 2060 scenarios. Interestingly the<br />
highest value goes to TP with 110% for present scenario, followed by COD with 50%,<br />
TN with 33%, Heavy metals with 17% and finally BOD with 13%.<br />
Considering these results it would be possible to say that priorities for <strong>Zaragoza</strong><br />
UWS to increase its environmental performance, at least with regard to the receiving<br />
water body are as follows:<br />
56
<strong>Systems</strong> <strong>Analysis</strong> <strong>of</strong> <strong>Zaragoza</strong> UWS<br />
Guillermo Penagos<br />
1. Phosphorus<br />
2. Non biodegradable organic matter<br />
3. Nitrogen<br />
4. Heavy metals<br />
5. BOD<br />
This is a very interesting outcome that reflects several internal aspects <strong>of</strong> <strong>Zaragoza</strong><br />
UWS as well as its relation to the surrounding environment.<br />
Secondary WWT via activated sludge is a technology for BOD removal and it works<br />
quite well on this regard. Therefore it is possible to say that improving BOD removal<br />
is not a priority for this UWS.<br />
Since activated sludge is a biological treatment it does not work that well to remove<br />
non biodegradable OM, remaining COD in treated sewage has got a relatively high<br />
impact on the receiving water body.<br />
<strong>Zaragoza</strong> WWT system is not designed to remove nitrogen. However biodegradable<br />
OM removal is also removing about 40% nitrogen from sewage. The remaining 60%<br />
is still high but it does not seem to have an important impact on the Ebro River, which<br />
might be explained by the fact that nitrogen concentrations in the river are already<br />
high (see table 7).<br />
Concerning heavy metals, again it is important to say that <strong>Zaragoza</strong> WWT system is<br />
not designed to remove those, nearly 40% are retained by the sludge though. Also<br />
untreated <strong>Zaragoza</strong> sewage does not contain high heavy metal concentrations.<br />
Therefore this impact is not that significant.<br />
Concerning phosphorus it is possible to say that 68% <strong>of</strong> <strong>Zaragoza</strong> WWT system<br />
(Cartuja plant) is actually designed to remove phosphorus. However the<br />
effectiveness <strong>of</strong> this technology is just around 80%, in addition to this, the combined<br />
impact <strong>of</strong> Almozara and paper mills WWTPs, which do not remove nutrients, is so<br />
important that TP has got a large impact on the Ebro River. Therefore reducing<br />
phosphorous loads may be considered as the priority for improving <strong>Zaragoza</strong> UWS<br />
with regard to the Ebro River.<br />
57
<strong>Systems</strong> <strong>Analysis</strong> <strong>of</strong> <strong>Zaragoza</strong> UWS Guillermo Penagos<br />
Table 7. Seasonal impact peaks <strong>of</strong> <strong>Zaragoza</strong> UWS upon the Ebro River under present conditions and worst climate change scenarios for 2020 and<br />
2060. These impacts are calculated on the basis <strong>of</strong> current pollutant concentrations in August, when river discharge is at minimum and projected river flows<br />
for the same month in 2020 and 2060. (see figure 27). So this can be considered as the maximum impact that <strong>Zaragoza</strong> might annually have upon the Ebro<br />
River<br />
Parameter<br />
Current<br />
Current impact <strong>of</strong> <strong>Zaragoza</strong> 2020 2060<br />
concentrations<br />
upstream from<br />
<strong>Zaragoza</strong> during<br />
Expected<br />
%* Expected<br />
%* Expected<br />
%*<br />
summer time<br />
raising <strong>of</strong><br />
raising <strong>of</strong><br />
raising <strong>of</strong><br />
Concentration<br />
Concentration<br />
Concentration<br />
BOD (mg l -1 ) 6.4 – 10.4 7.5 – 11.5 13 7.9 – 11.9 18 6.7 – 13.7 20<br />
COD (mg l -1 ) 5.2 – 14.4 10.1 -19.3 50 11.8 – 21.0 67 19.6 – 28.8 147<br />
TN (mg l -1 ) 2.8 – 7.9 4.6 – 9.7 33 5.2 – 10.3 45 7.9 – 13.0 95<br />
TP (µg l -1 ) 120 – 200 326 - 406 110 396 – 476 173 718 – 798 374<br />
Heavy metals (µg l -1 ) 113 – 324 152 - 363 17 165 – 376 24 225 – 436 51<br />
* The percentage in this table refers to the increasing with respect to the current value.<br />
58
<strong>Systems</strong> <strong>Analysis</strong> <strong>of</strong> <strong>Zaragoza</strong> UWS<br />
Guillermo Penagos<br />
5 Discussion<br />
The main goal <strong>of</strong> water management in <strong>Zaragoza</strong> in the recent years has been to<br />
reduce fresh water withdrawal below 65 million m 3 year -1 . The time horizon for this<br />
goal was the year 2010 but it has been already achieved in 2006. In addition to this,<br />
unaccounted water in <strong>Zaragoza</strong> has been significantly reduced along these years<br />
from 40 to 32%, but it still remains too high and the volume <strong>of</strong> actual leakages is still<br />
unknown. This particular aspect is to be assessed by the <strong>SWITCH</strong> project in<br />
<strong>Zaragoza</strong> as a demo activity. However it is possible to say that water supply is<br />
significantly and consistently improving in the city. The open question now is whether<br />
this improving makes the urban system as a whole more sustainable.<br />
5.1 Sustainability <strong>of</strong> UWS<br />
The starting point for assessing sustainability <strong>of</strong> urban water systems is a definition <strong>of</strong><br />
the basic services the system is supposed to provide, before start looking for<br />
alternatives to improve existing technology (Larsen and Gujer, 1997). The services<br />
the urban system should meet are basically three:<br />
• Reliable supply <strong>of</strong> safe water to all residents for drinking,<br />
hygiene and household purposes<br />
• Safe transport and treatment <strong>of</strong> wastewater<br />
• Adequate drainage <strong>of</strong> impervious areas<br />
<strong>Zaragoza</strong> UWS is currently providing these basic services. However in a second<br />
level, there are some requirements for such services to be considered sustainable<br />
that also need to be assessed. Lundin (1999) propose the following list:<br />
a. Technical performance: defined as the degree <strong>of</strong> effectiveness (degree <strong>of</strong><br />
goal achieving) and efficiency (resource optimization).<br />
b. Reliability, flexibility and adaptability: defined as the capacity <strong>of</strong> continuing on<br />
providing the service when unexpected events occur, encompassed with the<br />
potential for the system to change.<br />
c. Durability: referring to infrastructure<br />
d. Environmental protection: pollutant emissions as low as required to maintain<br />
the quality <strong>of</strong> the environment (atmosphere, aquatic ecosystems and soil)<br />
e. Cost-effectiveness: cost recovering <strong>of</strong> the service and affordability <strong>of</strong><br />
investments<br />
59
<strong>Systems</strong> <strong>Analysis</strong> <strong>of</strong> <strong>Zaragoza</strong> UWS<br />
Guillermo Penagos<br />
f. Skilled and sufficient staff: to operate and maintain the system. But also<br />
personal with knowledge on microbiology, chemistry and ecology. Gender<br />
diversity is also required.<br />
g. Social dimension: the service should be socially and culturally acceptable<br />
h. Public awareness: on sustainable behavior<br />
This work has quantitatively analyzed the aspects a. and d. <strong>of</strong> <strong>Zaragoza</strong> UWS. One<br />
important aspect that has been neglected in this research is the water infrastructure,<br />
which is determinant for sustainable urban planning in terms <strong>of</strong> scale, use <strong>of</strong> space<br />
and longevity (Lundin & Morrison, 2002). Nevertheless for the <strong>SWITCH</strong> project it<br />
might be interesting to evaluate, for instance, the environmental impacts and the long<br />
time perspective <strong>of</strong> the ongoing projects on infrastructure upgrading in <strong>Zaragoza</strong>.<br />
5.2 LCA as a tool for Sustainability assessment<br />
The methodology used for this research is based on the LCA methodology, that is<br />
being extensively used to assess environmental sustainability <strong>of</strong> <strong>Urban</strong> <strong>Water</strong><br />
<strong>Systems</strong> and it has proven to be very useful. However it has got some important<br />
drawbacks as well. For instance some authors criticize the fact that it overlooks<br />
important geographic variations such as the resilience <strong>of</strong> receiving water, also some<br />
qualitative aspects, such as sludge quality or ecosystem health are difficult to assess<br />
with LCA. Finally, water consumption is not incorporated in the analysis, therefore, it<br />
can be considered as a useful tool, but complementary information should also be<br />
included for a more complete approach to evaluate urban sustainability (Lundin,<br />
1999)<br />
The present work evaluated the sustainability aspects <strong>of</strong> water extraction, but also<br />
resource consumption and pollution impacts. Such values are presented as<br />
indicators for environmental sustainability with the main purpose <strong>of</strong> providing<br />
comprehensive and quantitative information to decision makers in <strong>Zaragoza</strong>.<br />
5.3 Sustainability Indicators<br />
There are many indicators that are currently being used by water organizations<br />
around the world to assess their performance and they are suggested to be<br />
sustainability indicators but only few actually are (Lundin and Morrison, 2002). For<br />
instance percentages <strong>of</strong> pollution removal at WWT facilities are <strong>of</strong>ten suggested as<br />
sustainability indicators but those provide information only about the performance <strong>of</strong><br />
existing end-<strong>of</strong>-pipe technologies. Percentages <strong>of</strong> removal can for instance remain<br />
60
<strong>Systems</strong> <strong>Analysis</strong> <strong>of</strong> <strong>Zaragoza</strong> UWS<br />
Guillermo Penagos<br />
the same over time while both pollution concentrations and pollution loads to the<br />
environment are actually increasing. Additionally, higher effectiveness may decrease<br />
the efficiency, since more resources are required per amount <strong>of</strong> pollutant that is<br />
removed. In this sense, total loads are more useful indicators, since they can actually<br />
reflect, not just the technical performance <strong>of</strong> WWT, but also whether pollution<br />
sources within the city are controlled. An example <strong>of</strong> this is the management <strong>of</strong> heavy<br />
metals and other toxic substances by Local Agenda 21 Office in <strong>Zaragoza</strong>. Being<br />
aware that the existing WWTPs in the city are unable to treat such substances, they<br />
are controlling industrial activities to prevent those to enter the sewer system. Such<br />
control on industrial activities will be reflected in the total heavy metal loads, but it<br />
won’t be quantified by the percentage removal at all.<br />
In this report the definition <strong>of</strong> sustainability indicator from Lundin (1999) is used as<br />
reference point: “A sustainability indicator should link (or at least balance) different<br />
areas <strong>of</strong> society e.g. life styles, economy, resource use and environmental problems<br />
or relate to a sustainability target. Consequently, an indicator <strong>of</strong> environmental<br />
sustainability can be defined as an environmental performance indicator (EPI) where<br />
the target reflects a sustainable situation. It should ideally provide an early warning<br />
for potential problems, being understandable and usable, within the urban water<br />
sector and/or for the public and information for calculated should be available”.<br />
Basically most data presented here more or less fulfill this definition and is therefore<br />
are suggested to continue being used as part a pool <strong>of</strong> sustainability indicators<br />
<strong>Zaragoza</strong> <strong>Urban</strong> <strong>Water</strong> System. Evidently these indicators relate only with the<br />
environmental dimension <strong>of</strong> sustainability. The social and economic dimensions will<br />
require different ones. Also additional indicators would be necessary to fully evaluate<br />
the environmental performance <strong>of</strong> the system. A list <strong>of</strong> indicators derived from this<br />
work is provided next:<br />
1. <strong>Water</strong> withdrawal<br />
2. <strong>Water</strong> consumption<br />
3. Energy consumption<br />
4. Chemical product consumption<br />
5. CO 2 direct and indirect emissions<br />
6. Pollution loads to the Ebro River (TP, TN, BOD, COD and Heavy Metals)<br />
7. Percentage <strong>of</strong> Impact upon the river by target pollutants (TP, TN, BOD, COD<br />
and Heavy Metals)<br />
61
<strong>Systems</strong> <strong>Analysis</strong> <strong>of</strong> <strong>Zaragoza</strong> UWS<br />
Guillermo Penagos<br />
8. Sludge production<br />
9. Nutrient recycling to agriculture<br />
10. Heavy metals loads to agriculture<br />
So far water withdrawal and water consumption have already been discussed, but<br />
there is major component <strong>of</strong> water withdrawal which is not being considered by<br />
<strong>Zaragoza</strong> municipality within its goals is groundwater, which is under the authority <strong>of</strong><br />
the Ebro River Confederation (CHE). Ground water is currently fulfilling 23% <strong>of</strong> water<br />
requirements for <strong>Zaragoza</strong> city. Major consumers are industries not connected to<br />
sewer system, corresponding to two paper mills owning private WWTPs.<br />
Groundwater preservation is one <strong>of</strong> the criteria used to evaluate environmental<br />
sustainability. Being relatively cheaper and usually <strong>of</strong> higher quality than surface<br />
water, groundwater reserves are being over-exploited in several European countries,<br />
leading to the drying up <strong>of</strong> spring waters, destruction <strong>of</strong> wetlands and saline intrusion<br />
<strong>of</strong> aquifers in coastal zones (Hellstrom et al, 2004). All those problems have been<br />
indeed taking place in Spain, and especially in the Ebro Delta, which is a Ramsar site<br />
and it’s considered as the second most important natural reserve <strong>of</strong> the country<br />
(CHE, 2007).<br />
The role <strong>of</strong> groundwater extraction on the environmental impacts <strong>of</strong> <strong>Zaragoza</strong> city on<br />
the Ebro Catchment is difficult to assess because this groundwater is not part <strong>of</strong> the<br />
natural water cycle, but the result <strong>of</strong> inefficient use <strong>of</strong> water for irrigation upstream.<br />
According to the Ebro River Working Group this artificial recharge is also feeding the<br />
Ebro River flow (personal communication). Considering that 177,000 ha in <strong>Zaragoza</strong><br />
province are currently irrigated and percolation is around 10,000 m 3 ha -1 the influence<br />
<strong>of</strong> <strong>Zaragoza</strong> upon this artificial aquifer is probably negligible, but this would require<br />
further research.<br />
In addition to quantity there is also a matter <strong>of</strong> quality that requires to be assessed<br />
concerning groundwater. First, due to its origin, this groundwater is contaminated<br />
with nitrates (Mema et al, 2006) and probably also with pesticides. Additionally there<br />
is a contamination by persistent chlorinated substances in one <strong>of</strong> the largest<br />
industrial polygon <strong>of</strong> <strong>Zaragoza</strong> city. This is consequence <strong>of</strong> the inadequate practices<br />
<strong>of</strong> a large company that used to work there between 1976 and 1985; and it was<br />
discovered in 2006 (CHE, 2006). The implications <strong>of</strong> speeding up the cycle <strong>of</strong> this<br />
polluted groundwater in <strong>Zaragoza</strong> are still unclear. <strong>Zaragoza</strong> municipality and CHE<br />
62
<strong>Systems</strong> <strong>Analysis</strong> <strong>of</strong> <strong>Zaragoza</strong> UWS<br />
Guillermo Penagos<br />
must work together to make clear not just this aspect, but in general all matters<br />
related to groundwater planning and management.<br />
Concerning the indicators not related to water withdrawal but to water pollution.<br />
<strong>Zaragoza</strong> city introduced WWT between late 1980s and early 1990s in order to<br />
minimize pollution loads to the Ebro River. This time period was not analyzed here. If<br />
the time horizon were expanded over two or three decades it would become evident<br />
that the city reduced has reduced its oxygen demanding loads to the Ebro River.<br />
However there are yet several environmental burdens that require attention<br />
regardless the compliance with local and national regulations.<br />
During the time period <strong>of</strong> the present study the consumption <strong>of</strong> energy and chemical<br />
products, as well as the pollution loads to the Ebro River and the atmospheric<br />
emissions have remained more or less constant. Optimizing the water system to<br />
reduce such environmental impacts should be expressively included within the goals<br />
for water management. To become sustainable WWT systems have to evolve from a<br />
reactive approach aimed to remove environmental pollutants to process optimization<br />
where the focus is cycling materials as well as saving energy (Lundin & Morrison,<br />
2002).<br />
5.4 Sustainability vision<br />
<strong>Zaragoza</strong> has committed to a list <strong>of</strong> environmental goals derived from the Aalborg<br />
summit for sustainable European cities. This work suggests seven <strong>of</strong> such goals to<br />
be specifically included as environmental goals for the urban water system. In order<br />
to do so, the whole <strong>Zaragoza</strong> sustainability vision has to be adjusted to the SMART<br />
principle: Specific, Measurable, Acceptable, Realistic and Time bound<br />
(Assinmacopoulos, 2007). This principle was implicit in the goal for reducing water<br />
withdrawal and it showed to be very successful.<br />
Setting sustainability goals would also require setting action priorities. From the<br />
results presented here it is possible to conclude that energy consumption and its<br />
indirect impacts on atmospheric emissions would be a priority, specifically for WWT<br />
system. Technical options for optimization should be explored by the municipality.<br />
But due to time constraints, such options where not explored by this research work.<br />
However a follow-up to the National Plan on Energy would provide some hints about<br />
how to reduce the atmospheric emissions derived from electricity production. Since<br />
this resource is subjected to an open market dynamics, the municipality could<br />
63
<strong>Systems</strong> <strong>Analysis</strong> <strong>of</strong> <strong>Zaragoza</strong> UWS<br />
Guillermo Penagos<br />
indirectly influence its CO 2 emissions by selecting the company that is using more<br />
sustainable sources.<br />
Concerning pollution loads, a methodology to set priorities, based on comparing<br />
upstream concentrations vs expected concentrations downstream was used in this<br />
work and the seasonality <strong>of</strong> such impacts was included as an important component.<br />
From this methodology BOD, heavy metal and nitrogen loads from <strong>Zaragoza</strong><br />
apparently don’t have an important impact upon the water quality <strong>of</strong> the Ebro River.<br />
Therefore such loads should still be considered, but a priority action for sustainability<br />
would be reducing Phosphorus loads considering the impact <strong>of</strong> more than two fold<br />
increase on downstream concentrations. This impact is also expected to exacerbate<br />
as a consequence <strong>of</strong> climate change. A reasonable goal would be, for instance: “to<br />
reduce by half the emissions <strong>of</strong> phosphorus to the Ebro River by the year 2020”.<br />
The methodology based on impact percentages seems to be straight forward and it<br />
could be used to also evaluate the impacts <strong>of</strong> heavy metals on agriculture soil. But it<br />
has got several drawbacks because it could lead to the wrong assumption that, if the<br />
environment is already polluted it wont be that important to produce more pollution.<br />
This is <strong>of</strong> particular importance when the effect <strong>of</strong>, for instance, atmospheric<br />
emissions on global change is considered. Additionally, this methodology does not<br />
consider the fact that environmental impacts are not necessarily linear to the scale <strong>of</strong><br />
loads. This is particularly valid for heavy metals and for persistent pollutants in<br />
general. In such cases, other factors such the dispersion <strong>of</strong> pollutants, the exposure,<br />
the potential for bioaccumulation and biotransformation, as well as dose-response<br />
functions should be <strong>of</strong> major concern.<br />
In addition to waste water, storm water is also considered as a major component <strong>of</strong><br />
the urban environmental burden (Ahlman, 2006). The present study included a rough<br />
estimation <strong>of</strong> the possible pollution loads from storm water. Due to the lack <strong>of</strong> data for<br />
storm water quality, such estimation is probably far from reality since pollution loads<br />
were assumed to be the same as for untreated sewage, but heavy rain events are<br />
rare in <strong>Zaragoza</strong>, therefore it is reasonable to expect that large loads <strong>of</strong> pollutants<br />
accumulate in the streets and buildings and they are washed away by rain water<br />
when heavy rain events take place. The resulting run<strong>of</strong>f must have a very different<br />
composition as compared to the dry period sewage. Additionally, the methodology<br />
used here to calculate potential overflows is inaccurate since daily precipitation was<br />
used as input data. It is evident that two different days with same cumulative value<br />
64
<strong>Systems</strong> <strong>Analysis</strong> <strong>of</strong> <strong>Zaragoza</strong> UWS<br />
Guillermo Penagos<br />
for precipitation might have completely different hydrographs that, may or may not,<br />
lead to sewer overflows. Finally the expected inflow to WWTPs used for storm water<br />
calculation is not a reliable value due to the lack <strong>of</strong> data concerning parasite flows to<br />
the sewer system from irrigation channels and overflows from breaking pressure<br />
tanks. Therefore the pollution loads from storm water presented here are not to be<br />
interpreted as actual impacts but rather as potential scenarios. Further studies for<br />
<strong>Zaragoza</strong> concerning this matter are required.<br />
5.5 Drivers for sustainable urban water planning and management<br />
With this overview <strong>of</strong> current situation <strong>of</strong> water management in <strong>Zaragoza</strong> it is now<br />
valid to discuss the drivers that will contribute to define the future <strong>of</strong> water<br />
management in the city. There are some internal drivers that are under the control <strong>of</strong><br />
<strong>Zaragoza</strong> planning, such as urbanization, population increase and availability <strong>of</strong><br />
funds. But cities are far from being isolated systems and they are in fact very much<br />
affected by local, national and global processes at environmental, social, political and<br />
economical level. Therefore a more comprehensive analysis it is important to widen<br />
the perspective both in geography and time. Major external drivers for water<br />
management in <strong>Zaragoza</strong> that have been considered here are National Policies<br />
(National Plan on Energy and National Irrigation Plan) and Climate change.<br />
The concern <strong>of</strong> <strong>Zaragoza</strong> about water withdrawal makes sense since between 30-<br />
60% <strong>of</strong> Spain is at immediate risk from desertification and the Ebro Valley at Aragon<br />
is already the driest inland region <strong>of</strong> Europe (UNCD, 2007). Under current trends is<br />
very possible that <strong>Zaragoza</strong> will still continue to reduce its fresh water withdrawal via<br />
infrastructure upgrading. However, if a further reduction is pursued then additional<br />
strategies will be required. Ongoing strategies in <strong>Zaragoza</strong> also aim to optimize water<br />
use for landscaping, but this use only represents 5% <strong>of</strong> total water requirements<br />
(including groundwater). Therefore such strategy is probably not going to have a<br />
significant effect. Presently domestic consumption is already 110 l person -1 day -1 ,<br />
which is already a low consumption. On the other hand, industrial consumption in<br />
<strong>Zaragoza</strong> is approximately the 40% <strong>of</strong> total water requirements (including<br />
groundwater). In this report industrial water recycling is proposed as a suitable<br />
alternative to continue reducing water withdrawal. This alternative has not been<br />
considered by the city yet because extracting ground water is technically more<br />
feasible and economically cheaper. However this seems to be the only possibility to<br />
continue reducing water consumption, considering the constraints <strong>of</strong> reducing<br />
domestic consumption already have.<br />
65
<strong>Systems</strong> <strong>Analysis</strong> <strong>of</strong> <strong>Zaragoza</strong> UWS<br />
Guillermo Penagos<br />
A likely scenario for the year 2020, considering different levels <strong>of</strong> water recycling was<br />
analyzed here, and the probable performance <strong>of</strong> the UWS under the most negative<br />
predictions for climate change and upstream water extraction was assessed by<br />
means <strong>of</strong> the sustainability indicators previously presented and discussed.<br />
According to the scenario assessed here, water from Yesa reservoir will remain<br />
available for the city and it will be able to fulfill all requirements during the next 50<br />
years, even under worst possible scenario for climate change and irrigation.<br />
However, as consequence <strong>of</strong> very low volumes during summer time, coupled with<br />
expected increased radiation and temperature there is some possibility for algal<br />
blooms that might threaten drinking water quality in the years to come. Under this<br />
scenario, water from Ebro River will be even more unsuitable for drinking purposes.<br />
Therefore <strong>Zaragoza</strong> will have to completely relay on the Yesa reservoir to fulfill its<br />
water demand.<br />
In current conditions it seems also that ground water supply for <strong>Zaragoza</strong> is granted.<br />
However the National Irrigation Plan that is about to be implemented has the purpose<br />
<strong>of</strong> upgrading the existing irrigation technology to optimize water use. If increasing<br />
evapotranspiration is also expected due to climate change (Ayala-Carcedo, 2000).<br />
As consequence it is probable that groundwater recharge for <strong>Zaragoza</strong> will not<br />
remain at the current rate, and the water table will probably drop down and ground<br />
water extraction will not be as feasible as now, but this is not possible to know now<br />
since there are no studies about groundwater recharge in this aquifer. Such studies<br />
are urgently required and this is partially the subject <strong>of</strong> the Ebro River Working Group<br />
(2007).<br />
The recycling water strategy proposed here would obviously have a direct benefit<br />
upon water withdrawal. Also a slightly positive effect is expected on energy<br />
consumption and thereby also on CO 2 emissions to the atmosphere. No effect <strong>of</strong> this<br />
strategy is expected on pollution loads to the Ebro River neither to agriculture soil. In<br />
fact if population and industrial activities continue to increase, even under a reduction<br />
<strong>of</strong> water withdrawal scenario, pollution loads to the environment are expected to<br />
increase likewise. Therefore, with current WWT technology and societal behaviors it<br />
will be possible to improve just some aspects <strong>of</strong> the environmental performance <strong>of</strong><br />
the system.<br />
66
<strong>Systems</strong> <strong>Analysis</strong> <strong>of</strong> <strong>Zaragoza</strong> UWS<br />
Guillermo Penagos<br />
Along this work it has been stated that sustainability <strong>of</strong> urban systems is a broad<br />
concept involving more than just the technical components and the end <strong>of</strong> pipe<br />
solutions to reduce pollution. But so far, only these technical aspects have been<br />
discussed. There are, <strong>of</strong> course important links between society and environment<br />
that are the focus <strong>of</strong> research on sustainability. For a long period, industries were the<br />
target <strong>of</strong> environmental issues. Today, households are recognized to contribute<br />
about 50% <strong>of</strong> the chemicals and metals ending up in wastewater. Domestic use <strong>of</strong><br />
water is also a focal point for reducing urban water consumption. Minimizing hot<br />
water use is <strong>of</strong> particular interest, since it represents 15% <strong>of</strong> the households’ overall<br />
energy use (Krantz, 2005).<br />
<strong>Urban</strong> systems nowadays are characterized by an alienation <strong>of</strong> households from<br />
nature. Specialized organizations are responsible <strong>of</strong> water supply and WWT, and<br />
hence they are seen as responsible for the environmental impact, the effect <strong>of</strong><br />
household routines is usually overlooked (Krantz, 2005). Sustainability is very much<br />
about using fewer resources at every level <strong>of</strong> society. In this sense sustainable water<br />
organizations would be the ones that, in addition to optimizing technical performance<br />
also promote public awareness on sustainable practices. It is possible to say that<br />
municipality and other stake holders in <strong>Zaragoza</strong> (mainly NGOs) have been<br />
particularly successful on promoting sustainable practices regarding water<br />
consumption at industries and households. As mentioned before, public awareness<br />
campaigns in this city reduced water withdrawal in about 6 million m 3 , which was<br />
acknowledged by Habitat UN as one <strong>of</strong> the 100 successful projects concerning urban<br />
sustainability worldwide.<br />
Public awareness also demonstrated to be in a high level one in 8 th October 2000,<br />
around 400,000 people (more than 60% <strong>of</strong> <strong>Zaragoza</strong>’s population) went to the streets<br />
in order to protest against the National <strong>Water</strong> Plan proposed by the former national<br />
government to divert around <strong>of</strong> a billion cubic meters <strong>of</strong> water each year from the<br />
River Ebro to arid regions on the Mediterranean zone <strong>of</strong> the country. The plan was<br />
not implemented by the current government.<br />
It can be concluded then, that <strong>Zaragoza</strong> citizenships are very much aware about<br />
water related issues and this is <strong>of</strong> a high potential to improve the overall<br />
environmental performance <strong>of</strong> this UWS.<br />
67
<strong>Systems</strong> <strong>Analysis</strong> <strong>of</strong> <strong>Zaragoza</strong> UWS<br />
Guillermo Penagos<br />
5.6 Set vs achieved goals for this research<br />
It is possible to say that the goals set for this research were achieved on a large<br />
proportion. A total water balance for the UWS was performed, although some subbalances<br />
could not be closed due to missing data. Energy and chemical products<br />
consumption were fully calculated. Pollution loads to the Ebro River in terms <strong>of</strong> BOD,<br />
COD, nutrients and heavy metals were quantified. A quantification <strong>of</strong> toxic organic<br />
substances would be also necessary, but it was not possible due to the lack <strong>of</strong><br />
information. According to its purpose, this work is going to serve as baseline<br />
information for further assessment <strong>of</strong> sustainable development for this UWS.<br />
It is possible also to say that goals were surpassed regarding the future perspectives<br />
for <strong>Zaragoza</strong> UWS derived from the scenario analysis, which was not part <strong>of</strong> the<br />
initial goals for this research. However, this scenario analysis can be considered<br />
incipient because it only focuses on the aspects related to the collected data. The<br />
suggested strategy is just a technical solution that could be useful, but it has been<br />
included in this work basically as an exercise in order to extract more information<br />
form the provided data. However, this scenario analysis has defined some important<br />
problems that <strong>Zaragoza</strong> might face in the future. Comprehensive strategies to cope<br />
with such problems are to be set by all important stakeholders in <strong>Zaragoza</strong> and the<br />
<strong>SWITCH</strong> project would contribute with important initiatives to the process. A follow-up<br />
<strong>of</strong> the parameters presented here as sustainability indicators will contribute to assess<br />
the success <strong>of</strong> the set strategies.<br />
68
<strong>Systems</strong> <strong>Analysis</strong> <strong>of</strong> <strong>Zaragoza</strong> UWS<br />
Guillermo Penagos<br />
6 Conclusions<br />
6.1 The present work evaluated the sustainability aspects <strong>of</strong> water extraction,<br />
resource consumption and pollution impacts by means <strong>of</strong> LCA, which showed to<br />
be a useful methodology even when the impact assessment phase is not applied.<br />
However, complementary information such as surface water withdrawal, water<br />
consumption, ground water extraction, water leakages in distribution network, etc<br />
should also be included for a more comprehensive approach.<br />
6.2 <strong>Zaragoza</strong> has been successfully reducing fresh water withdrawal by means <strong>of</strong><br />
integral strategies involving infrastructure upgrading and promotion <strong>of</strong> public<br />
awareness. The success <strong>of</strong> these projects shows a good potential to improve the<br />
overall environmental performance <strong>of</strong> this UWS.<br />
6.3 <strong>Zaragoza</strong> will still reduce its fresh water withdrawal via infrastructure<br />
upgrading. However, further reduction requires additional measures. The ongoing<br />
strategy <strong>of</strong> optimizing water for landscaping won’t be very significant. Presently<br />
domestic consumption is already low, therefore Industrial water recycling is<br />
proposed as a suitable alternative. From this strategy also a slightly positive<br />
effect is expected on energy consumption, CO 2 emissions. No effect is expected<br />
on pollution loads to the Ebro River neither to agriculture soil.<br />
6.4 Ground water is a major component <strong>of</strong> <strong>Zaragoza</strong> urban water cycle. Due to its<br />
origin on agriculture irrigation and also due to industrial pollution <strong>of</strong> soil in the<br />
past, groundwater is subjected to important threats <strong>of</strong> both quantity and quality.<br />
<strong>Zaragoza</strong> municipality and catchment authority should plan together the<br />
adequate use <strong>of</strong> this resource.<br />
6.5 During the time period <strong>of</strong> the present study (last six years) the consumption <strong>of</strong><br />
energy and chemical products, as well as the pollution loads to the Ebro River<br />
and the atmospheric emissions have remained more or less constant. Optimizing<br />
the urban water system to reduce such environmental impacts should be<br />
expressively included within the goals for water management.<br />
6.6 <strong>Zaragoza</strong> has committed to the Aalborg summit for sustainable European<br />
cities, and it has set a sustainability vision. However it still requires adjusting such<br />
goals to be Specific, Measurable, Acceptable, Realistic and Time bound.<br />
69
<strong>Systems</strong> <strong>Analysis</strong> <strong>of</strong> <strong>Zaragoza</strong> UWS<br />
Guillermo Penagos<br />
Otherwise it won’t be possible to monitor the trends <strong>of</strong> the system towards<br />
sustainability.<br />
6.7 Priorities for urban water sustainability would be: 1) continuing on reducing<br />
water withdrawal and unaccounted for water, 2) optimizing energy consumption<br />
and its indirect impacts on atmospheric emissions 3) reducing phosphorus loads<br />
to the Ebro. The impact <strong>of</strong> heavy metals and other persistent pollutants also<br />
deserves attention since such impact is not necessarily linear to the scale <strong>of</strong><br />
loads. Storm water does not seem to be a major problem for <strong>Zaragoza</strong>, but the<br />
results presented here are not reliable enough. Further studies concerning this<br />
matter are required.<br />
6.8 Major drivers for water management in <strong>Zaragoza</strong> are population increase,<br />
National Policies on water and environment and climate change. Combined<br />
effects are expected to worsen problems <strong>of</strong> water management for <strong>Zaragoza</strong> in<br />
the future.<br />
6.9 <strong>Water</strong> from the new source, the Yesa reservoir will be able to fulfill <strong>Zaragoza</strong>’s<br />
water requirements during the next 50 years, even under worst possible scenario<br />
for climate change and irrigation. However in the future might experience some<br />
negative changes on water quality. Ebro River will be even more unsuitable for<br />
drinking purposes. Therefore <strong>Zaragoza</strong> will have to completely relay on the Yesa<br />
reservoir to fulfill its water demand.<br />
6.10 Comprehensive strategies to cope with such problems are to be set by all<br />
important stakeholders in <strong>Zaragoza</strong> and the <strong>SWITCH</strong> project would contribute<br />
with important initiatives to the process. The parameters presented here as<br />
sustainability indicators will contribute to assess the success <strong>of</strong> the set strategies.<br />
70
<strong>Systems</strong> <strong>Analysis</strong> <strong>of</strong> <strong>Zaragoza</strong> UWS<br />
Guillermo Penagos<br />
7 References<br />
ASCE (1998), Sustainability Criteria for <strong>Water</strong> Resource <strong>Systems</strong>, prepared by Task<br />
Committee on Sustainability Criteria, <strong>Water</strong> Resource Planning and Management<br />
Division, ASCE and Working Group UNESCO,/IHP IV Project M-4.3.<br />
Ahlman S. (2006), Modeling substance Flows in <strong>Urban</strong> Darainage <strong>Systems</strong>. Thesis for<br />
the degree <strong>of</strong> Doctor <strong>of</strong> Philosophy. Chalmers University <strong>of</strong> Technology. Goteborg.<br />
Assimacopoulos. D. (2007), Developing Long-term Vision and Scenarios for the Demo-<br />
Cities. The Example <strong>of</strong> Alexandria. SWICTH Annual meeting. Birmingham, 11 th<br />
Jannuary.<br />
Ayala-Carcedo, F.J. e Iglesias, A. (2000). Impactos del posible Cambio Climático<br />
sobre los recursos hídricos, el diseño y la planificación hidrológica en la España<br />
Peninsular. In Balairón edit., El Cambio Climático, El Campo de las Ciencias y las<br />
Artes, Servicio de Estudios del BBVA, Madrid, 201-222.<br />
Ayers R. U and Ayers L.W. (2002), A handbook <strong>of</strong> industrial ecology. Edward Elgar<br />
Publishing Limited. Cheltenham, UK.<br />
Benedetti L., Blumensaat F., G. Bonisch., Dirclxx G., Jardin N., Krebs P. and<br />
Vanrolleghem P.A. (2005), <strong>Systems</strong> <strong>Analysis</strong> <strong>of</strong> <strong>Urban</strong> wastewater systems – two<br />
systematic approaches to analyze a complex system. <strong>Water</strong> Science and technology.<br />
52(12): 171-179.<br />
Bengtsson, M, Lundin, M and Molander, S, 1997, Life Cycle Assessment <strong>of</strong> Wastewater<br />
<strong>Systems</strong> – Case studies <strong>of</strong> Conventional Wastewater Treatment, Urine Sorting and<br />
Liquid Composting in Three Swedish Municipalities, Technical Environmental Planning,<br />
Report 1997:9, Göteborg, Sweden.<br />
CHE. (2007), Ebro River Hydrographic Confederation web site. http://www.chebro.es,<br />
26/03/2007<br />
Ebro-Agua Working group. Institute <strong>of</strong> Applied Geosciences, Darmstadt University <strong>of</strong><br />
Technology. Department <strong>of</strong> Geography and Spatial Management, University <strong>of</strong><br />
<strong>Zaragoza</strong>. http://www.unizar.es/EbroAguaWorkingGroup/index.html, 23/03/2007<br />
European Commission (1995). ExternE, Externalities <strong>of</strong> Energy. Vol.1: Summary.<br />
Directorate-General XXII. Science, Research and Development. L-2920 Luxemburg.<br />
(available on line at http://www.externe.info)<br />
Hellstrom D., Hjerpe., van Moeffaert D. (2004), Indicators to assess ecological<br />
sustainability <strong>of</strong> the <strong>Urban</strong> <strong>Water</strong> Sector. <strong>Urban</strong> <strong>Water</strong> Report Series. Report 204:3.<br />
Chalmers University <strong>of</strong> Technology. Goteborg.<br />
Infrastructure Department, <strong>Urban</strong> <strong>Water</strong> Cycle Office <strong>of</strong> <strong>Zaragoza</strong> (2006). Informe Plan<br />
de mejora en la gestion del abastecimiento de agua en <strong>Zaragoza</strong>.<br />
Jeppsson U. and Hellstrom D. (2002), <strong>Systems</strong> <strong>Analysis</strong> for environmental assessment<br />
<strong>of</strong> urban water and wastewater systems. <strong>Water</strong> Science and technology. 46 (6-7): 121-<br />
129<br />
71
<strong>Systems</strong> <strong>Analysis</strong> <strong>of</strong> <strong>Zaragoza</strong> UWS<br />
Guillermo Penagos<br />
Krantz H. (2005). A Study <strong>of</strong> household routines in a process <strong>of</strong> changing water and<br />
sanitation arrangements. Linkoping Studies in Arts and Science. 316. Department <strong>of</strong><br />
<strong>Water</strong> and Environmental Studies. Linkoping University, Sweden (available on line at:<br />
htttp://www.urbanwater.org), 18/03/2007<br />
Larsen T.A. and Gujer W. (1997), The concept <strong>of</strong> sustainable <strong>Urban</strong> Management.<br />
<strong>Water</strong> Science and technology. 35(9): 3-10<br />
Lassaux S., Renzoni R., and Germain A. (2005), Life Cycle Assessment <strong>of</strong> <strong>Water</strong>: From<br />
the Pumping Station to the Wastewater Treatment Plant. International Journal on LCA.<br />
1: 1 -9.<br />
Levlin. E (2005). Sustainable and Integrated sewage and organic waste handling with<br />
global warming impact. In Integration and optimization <strong>of</strong> urban sanitation systems.<br />
Report n 11. Royal Institute <strong>of</strong> Technology in Stockholm. (Available on line at:<br />
http://www.lwr.kth.se), 12/03/2007<br />
Lindqvist A. and von Malmborg F. (2004), What can we learn from local substance flow<br />
analyses? The review <strong>of</strong> cadmium flows in Swedish municipalities. Journal <strong>of</strong> Cleaner<br />
Production. 12: 909-918.<br />
Local Agenda 21 Office <strong>of</strong> <strong>Zaragoza</strong> (2002). Auditoria de gestión y uso del agua en<br />
<strong>Zaragoza</strong>.<br />
Lundie S., Peters G. and Beavis P. (2004), Life cycle assessment for Sustainable<br />
Metropolitan <strong>Water</strong> <strong>Systems</strong> Planning. <strong>Water</strong> Science and technology. 38: 3465-3473.<br />
Lundin M. (1999), Assessment <strong>of</strong> the environmental Sustainability <strong>of</strong> <strong>Urban</strong> <strong>Water</strong><br />
<strong>Systems</strong>. Department <strong>of</strong> Technical Environmental Planning. Chalmers University <strong>of</strong><br />
Technology. Goteborg.<br />
Lundin M. and Morrison G.M. (2002). A life cycle assessment based procedure for<br />
development <strong>of</strong> environmental sustainability indicators for urban water systems. <strong>Urban</strong><br />
<strong>Water</strong> 4(2):145-152<br />
Malmqvist P. A. and Palmquist H. (2005), Decision support tools for urban and<br />
wastewater systems – focusing on hazardous flows assessment. <strong>Water</strong> Science and<br />
technology. 51(8): 41-49<br />
MAPA (2007), Plan Nacional de Regadios. Ministerio de Agridultura Pesca y<br />
Alimentacion de España. (available at<br />
http://www.mapa.es/es/desarrollo/pags/pnr/principal.htm), 20/03/2007<br />
Marti O. (2000). When the rain in Spain is not enough. UNESCO courier. December<br />
2000 (available on line at: http://www.unesco.org/courier/2000_12/uk/planet.htm),<br />
04/02/2007<br />
Matsuhashi, R, Sudoh, O, Nakane K, Hidenari, Y, Nakayarna, S, and Ishitani H, 1997,<br />
Life Cycle Assessment <strong>of</strong> Sewage Treatment Technologies, Presented at IAWQ<br />
Conference on ”Sludge - Waste or Resource?” held in Czestochowa, Poland 26-28<br />
June.<br />
Mema. M., Calvo E., and Albiac J. (2006), Agricultural nonpoint pollution in Aragon:<br />
emission loads and control issues. Final Report. Spanish Ministry <strong>of</strong> Education and<br />
Science. Projects CICYT AGL2001-2333-C02 and RTA04-141-C2.<br />
72
<strong>Systems</strong> <strong>Analysis</strong> <strong>of</strong> <strong>Zaragoza</strong> UWS<br />
Guillermo Penagos<br />
Ministerio de Industria, Turismo y Comercio de España (2007), Plan Energetico<br />
Nacional. (available at http://www.mityc.es/Desarrollo/Seccion/IDI/PlanesNacionales/),<br />
20/03/2007<br />
Neumayr, R, Dietrich, R and Steinmüller, H, 1997, Life Cycle Assessment <strong>of</strong> Sewage<br />
Sludge Treatment, Proc 5th SETAC Annual Conference, Brussels, December.<br />
Roeleveld, P J, Klapwijk A, Eggels, P G, Rulkens, W H, and Starkenburg, W van, 1997,<br />
Sustainability <strong>of</strong> Municipal Wastewater Treatment, <strong>Water</strong> Science and Technology<br />
35(10), 221-228.<br />
Thonstad E. (2005). Environmental Impacts <strong>of</strong> Intermodal freight transport. Report no.<br />
0513. Molde Universitty College (available on line at: http://mfm.no), 12/02/2007<br />
U.S. EPA. (2006), Life Cycle Assessment: Principles and Practice. National Risk<br />
Management Research Laboratory. Cincinaty, Ohio. Document reference 600/R-06/060.<br />
Available on-line at http:\\www.epa.gov<br />
UNCCD (2007), United Nations Convention to Combat Desertification. Regional Pr<strong>of</strong>iles.<br />
http://www.unccd.int, 20/03/2007<br />
UNESCO (1999), Working Group M.I.V. Sustainability Criteria for <strong>Water</strong> Resource<br />
<strong>Systems</strong>. Cambridge, UK: Cambridge University Press<br />
Varis O. and Somlyody L. (1997), Global urbanization and <strong>Urban</strong> <strong>Water</strong>: Can<br />
sustainability be afforded?. <strong>Water</strong> Science and technology. 35(9): 21-32<br />
73
<strong>Systems</strong> <strong>Analysis</strong> <strong>of</strong> <strong>Zaragoza</strong> UWS<br />
Guillermo Penagos<br />
Annexes<br />
74
<strong>Systems</strong> <strong>Analysis</strong> <strong>of</strong> <strong>Zaragoza</strong> UWS Guillermo Penagos<br />
Annex 1.<br />
Inventory for data necessary to perform LCA and its availability in <strong>Zaragoza</strong><br />
Process Availability Frequency Data type Aggregation level<br />
1 Inputs<br />
1.1 Surface water withdrawal<br />
1.1.1 Energy<br />
1.1.1.1 Consumption 2000 – 2006 Monthly Measured Individual<br />
1.1.1.2 Energy sources No data<br />
1.1.2 Inflow water<br />
1.2 Groundwater extraction<br />
1.2.1 Energy<br />
1.2.1.1 Energy consumption 2000 Sporadic Measured From one well and extrapolated<br />
to the whole system<br />
1.2.1.2 Energy sources No data<br />
1.2.2 <strong>Water</strong><br />
1.2.2.1 Flow 2003 – 2006 Trimester Measured Composite<br />
1.3 Storm water<br />
1.3.1 Precipitation 2000 – 2006 Daily Measured Composite<br />
1.3.2 N No data<br />
1.3.3 P No data<br />
1.3.4 Heavy metal concentration No data<br />
1.3.5 Persistent Organics No data<br />
2 Drinking water treatment<br />
2.1 Energy<br />
2.1.1 Energy consumption 2000 – 2006 Monthly Measured Individual<br />
2.1.2 Energy sources No data<br />
2.2 <strong>Water</strong><br />
2.2.1 Inflow 2000 – 2006 Daily Measured Individual<br />
2.2.2 Outflow 2000 – 2006 Daily Measured Individual<br />
2.3 Chemical products consumption<br />
2.3.1 Alum 2000 – 2006 Monthly Measured Individual<br />
2.3.2 Powdered Activated Carbon 2000 – 2006 Monthly Measured Individual<br />
2.3.3 Chlorine 2000 – 2006 Monthly Measured Individual<br />
2.4 Sludge production 2000 – 2006 Monthly Measured Individual<br />
3 Distribution system<br />
3.1 Energy<br />
3.1.1 Energy consumption 2002 – 2006 Trimester Measured Composite Dist Netwrk<br />
3.1.2 Energy sources No data<br />
75
<strong>Systems</strong> <strong>Analysis</strong> <strong>of</strong> <strong>Zaragoza</strong> UWS Guillermo Penagos<br />
3.2 <strong>Water</strong><br />
3.2.1 Flows No data<br />
3.2.2 Leakage No data<br />
4 <strong>Water</strong> consumption<br />
4.1 Household 2000 – 2006 Trimester Measured Composite<br />
4.2 Public Facilities 2003 – 2006 Trimester Measured Composite and incomplete*<br />
4.3 Landscaping<br />
4.3.1 Tap water consumption 2003 – 2006 Trimester Measured Composite and incomplete*<br />
4.3.2 Groundwater consumption 2003 – 2006 Trimester Measured Composite and incomplete*<br />
4.4 Industry<br />
4.4.1 Connected to sewers<br />
4.4.1.1 Tap water 2002 – 2006 Trimester Measured Individual<br />
4.4.1.2 Groundwater 2002 – 2006 Trimester Measured Individual<br />
4.4.2 No connected to sewers** 2000, 2000, 2003 Sporadic Estimated Individual<br />
4.4.2.1 Tap water No consumption<br />
4.4.2.2 Groundwater 1995, 2000, 2003 Annual Estimated Average<br />
5 Sewer system<br />
5.1 Industrial<br />
5.1.1 Flow 2005, 2006 Annual Measured Composite***<br />
5.1.2 N 2005, 2006 Annual Measured Composite***<br />
5.1.3 P 2005, 2006 Annual Measured Composite***<br />
5.1.4 Heavy metals 2005, 2006 Annual Measured Composite***<br />
5.2 Household<br />
5.2.1 Flow No data<br />
5.2.2 N No data<br />
5.2.3 P No data<br />
5.2.4 Heavy metals No data<br />
5.3 Storm water<br />
5.3.1 Flow No data<br />
5.3.2 N No data<br />
5.3.3 P No data<br />
5.3.4 Heavy metals No data<br />
6 Wastewater treatment<br />
6.1 “La Cartuja” (tertiary treatment)<br />
6.1.1 Energy<br />
6.1.1.1 Energy consumption 2000 – 2006 Monthly Measured Individual<br />
6.1.1.2 Energy Production 2000 – 2006 Monthly Measured Individual<br />
6.1.1.3 Energy sources No data<br />
76
<strong>Systems</strong> <strong>Analysis</strong> <strong>of</strong> <strong>Zaragoza</strong> UWS Guillermo Penagos<br />
6.1.2 <strong>Water</strong><br />
6.1.2.1 Inflow<br />
6.1.2.1.1 Flow 2000 – 2006 Daily Measured Individual<br />
6.1.2.1.2 N 1997 – 2006 Daily Measured Individual<br />
6.1.2.1.3 P 2001 – 2006 Daily Measured Individual<br />
6.1.2.1.4 BOD 5 2001 – 2006 Daily Measured Individual<br />
6.1.2.1.5 COD 2001 – 2006 Daily Measured Individual<br />
6.1.2.1.6 Heavy metals 2000, 2003, 2005 Sporadic Measured Average<br />
6.1.2.2 Outflow<br />
6.1.2.2.1 Flow 2001 – 2006 Daily Measured Individual<br />
6.1.2.2.2 N 2001 – 2006 Daily Measured Individual<br />
6.1.2.2.3 P 2001 – 2006 Daily Measured Individual<br />
6.1.2.2.4 BOD 5 2001 – 2006 Daily Measured Individual<br />
6.1.2.2.5 COD 2001 – 2006 Daily Measured Individual<br />
6.1.2.2.6 Heavy metals 2000, 2003 Sporadic Measured Average<br />
6.1.3 Iron Chloride consumption 2001 – 2006 Daily Measured Individual<br />
6.1.4 Sludge****<br />
6.1.4.1 Production 2001 – 2006 Daily Measured Individual<br />
6.1.4.2 N 2000, 2003, 2005 Sporadic Measured Average<br />
6.1.4.3 P 2000, 2003, 2005 Sporadic Measured Average<br />
6.1.4.4 Heavy metals 2000, 2003, 2005 Sporadic Measured Average<br />
6.1.5 Atmospheric emissions<br />
6.1.5.1 Flow 2000, 2003, 2005 Sporadic Measured Average<br />
6.1.5.2 CO 2 2000, 2003, 2005 Sporadic Measured Average<br />
6.1.5.3 NO x 2000, 2003, 2005 Sporadic Measured Average<br />
6.1.5.4 Heavy metals 2000, 2003, 2005 Sporadic Measured Average<br />
6.2 “La Almozara” (Conventional treat)<br />
6.2.1 Energy<br />
6.2.1.1 Energy consumption 2001 – 2006 Monthly Measured Individual<br />
6.2.1.2 Energy Production 2001 – 2006 Monthly Measured Individual<br />
6.2.1.3 Energy sources No data<br />
6.2.2 <strong>Water</strong><br />
6.2.2.1 Inflow<br />
6.2.2.1.1 Flow 2001 – 2006 Daily Measured Individual<br />
6.2.2.1.2 N 2000, 2003, 2005 Sporadic Measured Average<br />
6.2.2.1.3 P 2000, 2003, 2005 Sporadic Measured Average<br />
6.2.2.1.4 BOD 5 2001 – 2006 Daily Measured Individual<br />
6.2.2.1.5 COD 2001 – 2006 Daily Measured Individual<br />
6.2.2.1.6 Heavy metals 2000, 2003, 2005 Sporadic Measured Average<br />
77
<strong>Systems</strong> <strong>Analysis</strong> <strong>of</strong> <strong>Zaragoza</strong> UWS Guillermo Penagos<br />
6.2.2.2 Outflow<br />
6.2.2.2.1 Flow 2001 – 2006 Daily Measured Individual<br />
6.2.2.2.2 N 2000, 2003, 2005 Sporadic Measured Average<br />
6.2.2.2.3 P 2000, 2003, 2005 Sporadic Measured Average<br />
6.2.2.2.4 BOD 5 2001 – 2006 Daily Measured Individual<br />
6.2.2.2.5 COD 2001 – 2006 Daily Measured Individual<br />
6.2.2.2.6 Heavy metals 2000, 2003, 2005 Sporadic Measured Average<br />
6.2.3 Sludge<br />
6.2.3.1 Production 2001 – 2006 Daily Measured Individual<br />
6.2.3.2 N 2000, 2003, 2005 Sporadic Measured Average<br />
6.2.3.3 P 2000, 2003, 2005 Sporadic Measured Average<br />
6.2.3.4 Heavy metals 2000, 2003, 2005 Sporadic Measured Average<br />
6.3 Paper mills<br />
6.3.1 Inflow<br />
6.3.1.1 Flow 2005 Sporadic Measured Average<br />
6.3.1.2 N 2005 Sporadic Measured Average<br />
6.3.1.3 P 2005 Sporadic Measured Average<br />
6.3.1.4 Heavy metals 2005 Sporadic Measured Average<br />
6.3.2 Outflow<br />
6.3.2.1 Flow 2005 Sporadic Measured Average<br />
6.3.2.2 N 2005 Sporadic Measured Average<br />
6.3.2.3 P 2005 Sporadic Measured Average<br />
6.3.2.4 Heavy metals 2005 Sporadic Measured Average<br />
78
<strong>Systems</strong> <strong>Analysis</strong> <strong>of</strong> <strong>Zaragoza</strong> UWS<br />
Guillermo Penagos<br />
Annex 2<br />
Raw Data for the Drinking <strong>Water</strong> Treatment Plant <strong>of</strong> <strong>Zaragoza</strong> on monthly basis<br />
Year<br />
Month<br />
<strong>Water</strong><br />
Inflow<br />
(m3)<br />
<strong>Water</strong><br />
Outflow<br />
(m3)<br />
Electricity<br />
consumption<br />
(kW/h)<br />
Chlorine<br />
(ton)<br />
Alum<br />
(ton)<br />
PAC<br />
(ton)<br />
Sludge<br />
as Dry<br />
matter<br />
(ton)<br />
2000 Jan 6,770,097 6,606,332 422,389 129 493<br />
2000 Feb 6,173,221 6,053,436 424,006 231 539<br />
2000 Mar 6,434,724 6,242,472 423,525 206 873<br />
2000 Apr 5,914,356 5,573,862 422,125 207 748<br />
2000 May 6,644,068 6,141,830 425,700 254 954<br />
2000 Jun 7,108,234 227,622 424,344 305 946<br />
2000 Jul 7,275,509 6,624,409 430,381 441 697<br />
2000 Aug 6,826,737 6,376,162 413,254 418 815<br />
2000 Sep 6,835,202 6,570,241 412,545 418 820<br />
2000 Oct 6,549,294 5,311,733 392,909 289 750<br />
2000 Nov 6,216,782 5,412,375 400,145 130 760<br />
2000 Dec 6,605,970 5,012,027 428,945 182 508<br />
2001 Jan 6,526,381 6,252,197 406,363 131 515<br />
2001 Feb 5,858,885 5,620,512 422,539 102 546<br />
2001 Mar 6,352,281 6,015,076 445,242 234 639<br />
2001 Apr 6,054,660 5,789,890 392,909 289 750<br />
2001 May 6,450,521 6,082,503 453,096 102 664<br />
2001 Jun 7,166,591 6,721,492 451,972 466 816<br />
2001 Jul 7,066,998 6,637,223 449,333 467 853<br />
2001 Aug 6,874,706 6,465,713 412,272 365 954<br />
2001 Sep 6,786,170 6,389,769 404,713 469 873<br />
2001 Oct 6,735,425 6,332,661 408,636 491 1,144<br />
2001 Nov 6,562,416 6,228,397 407,091 181 1,116<br />
2001 Dec 6,902,742 6,637,920 414,498 68 1,175<br />
2002 Jan 6,671,771 6,336,940 425,772 219 961<br />
2002 Feb 5,689,575 5,545,301 416,763 126 816<br />
2002 Mar 6,234,004 5,965,224 428,447 126 689<br />
2002 Apr 5,761,476 5,661,557 435,805 151 83<br />
2002 May 6,097,677 6,035,169 436,828 301 786<br />
2002 Jun 6,508,874 6,412,899 441,668 289 750 454<br />
2002 Jul 6,669,855 6,564,184 429,573 529 1,156 366<br />
2002 Aug 6,093,249 6,000,995 418,739 375 658 612<br />
2002 Sep 6,199,178 6,169,763 408,178 329 824 777<br />
2002 Oct 6,231,246 6,150,255 408,734 303 875 677<br />
2002 Nov 6,173,832 6,121,811 413,999 126 852 373<br />
79
<strong>Systems</strong> <strong>Analysis</strong> <strong>of</strong> <strong>Zaragoza</strong> UWS<br />
Guillermo Penagos<br />
Year<br />
Month<br />
<strong>Water</strong><br />
Inflow<br />
(m3)<br />
<strong>Water</strong><br />
Outflow<br />
(m3)<br />
Electricity<br />
consumption<br />
(kW/h)<br />
Chlorine<br />
(ton)<br />
Alum<br />
(ton)<br />
PAC<br />
(ton)<br />
Sludge<br />
as Dry<br />
matter<br />
(ton)<br />
2002 Dec 6,134,871 6,012,239 416,031 100 640 230<br />
2003 Jan 6,089,380 6,028,486 421,370 148 557 252<br />
2003 Feb 5,371,790 5,318,072 426,697 74 679 484<br />
2003 Mar 5,693,297 5,636,364 429,461 150 710 555<br />
2003 Apr 5,387,239 5,333,367 435,687 175 600 372<br />
2003 May 5,932,808 5,873,480 435,968 327 712 708<br />
2003 Jun 6,339,409 6,276,015 331,702 476 874 791<br />
2003 Jul 6,549,021 6,483,531 424,539 377 986 811<br />
2003 Aug 6,313,334 6,250,201 416,306 401 863 510<br />
2003 Sep 6,041,265 5,980,852 512,727 328 914 903<br />
2003 Oct 6,144,342 6,082,899 539,999 278 733 18 693<br />
2003 Nov 5,822,186 5,763,964 501,818 100 740 27 920<br />
2003 Dec 5,999,298 5,939,305 558,181 75 964 0 596<br />
2004 Jan 5,634,038 5,577,698 530,909 174 495 0 482<br />
2004 Feb 5,270,245 5,217,543 476,363 149 354 0 151<br />
2004 Mar 5,848,789 5,790,301 519,999 220 547 0 331<br />
2004 Apr 5,451,585 5,397,069 492,727 224 465 0 504<br />
2004 May 5,936,482 5,877,117 521,818 273 789 0 452<br />
2004 Jun 6,520,613 6,455,407 576,363 372 1,110 0 546<br />
2004 Jul 6,416,490 6,352,325 570,909 368 1,137 22 733<br />
2004 Aug 5,912,750 5,853,623 567,272 397 899 58 605<br />
2004 Sep 6,171,743 6,110,026 570,909 325 1,118 43 733<br />
2004 Oct 6,047,407 5,986,933 607,272 223 982 58 645<br />
2004 Nov 5,827,125 5,768,854 534,545 274 1,159 29 478<br />
2004 Dec 5,796,132 5,738,171 543,636 75 785 128 336<br />
2005 Jan 5,921,724 5,862,507 634,040 126 596 0 366<br />
2005 Feb 5,505,974 5,450,914 578,600 126 515 0 277<br />
2005 Mar 5,860,462 5,801,857 573,528 148 299 0 165<br />
2005 Apr 5,601,426 5,545,412 572,869 149 299 0 343<br />
2005 May 5,771,352 5,713,638 602,325 201 272 0 703<br />
2005 Jun 5,960,140 5,900,539 609,514 245 517 0 747<br />
2005 Jul 6,017,296 5,957,123 607,388 247 488 2 482<br />
2005 Aug 5,463,150 5,408,519 580,835 268 1,135 29 752<br />
2005 Sep 5,645,151 5,588,699 567,770 226 1,032 29 671<br />
2005 Oct 5,404,662 5,350,615 595,041 224 1,135 59 579<br />
2005 Nov 5,261,737 5,209,120 578,447 151 380 30 531<br />
2005 Dec 5,772,795 5,715,067 515,920 126 859 30 358<br />
2006 Jan 5,768,970 5,711,280 669,661 156 325 0 411<br />
2006 Feb 4,772,922 4,725,193 489,938 128 216 0 172<br />
2006 Mar 5,227,862 5,175,583 554,199 129 298 0 464<br />
2006 Apr 4,855,018 4,806,468 448,916 153 297 0 474<br />
2006 May 5,620,081 5,563,880 576,937 206 432 0 722<br />
2006 Jun 5,856,470 5,797,905 579,142 305 460 36 714<br />
2006 Jul 5,870,798 5,812,090 619,655 279 807 0 927<br />
2006 Aug 5,266,321 5,213,658 569,217 282 644 15 709<br />
2006 Sep 5,473,739 5,419,002 586,965 256 453 33 1,003<br />
2006 Oct 5,331,003 5,277,693 549,326 207 896 32 1,028<br />
2006 Nov 4,918,971 4,869,781 517,497 154 311 24 458<br />
2006 Dec 5,187,183 5,135,312 580,419 200 849 39 594<br />
80
<strong>Systems</strong> <strong>Analysis</strong> <strong>of</strong> <strong>Zaragoza</strong> UWS<br />
Guillermo Penagos<br />
Annex 3<br />
Raw Data for Energy Consumption <strong>of</strong> the <strong>Water</strong> Distribution Network in <strong>Zaragoza</strong><br />
Year<br />
Month<br />
Energy<br />
consumption<br />
(Kwh) Year Month<br />
Energy<br />
consumption<br />
(Kwh) Year Month<br />
Energy<br />
consumption<br />
(Kwh)<br />
2001 jan 81,273 2003 jan 63,206 2005 jan 56,364<br />
2001 feb 84,508 2003 feb 64,005 2005 feb 51,455<br />
2001 mar 89,048 2003 mar 64,419 2005 mar 51,273<br />
2001 apr 78,582 2003 apr 65,353 2005 apr 51,091<br />
2001 may 90,619 2003 may 65,395 2005 may 53,311<br />
2001 jun 90,394 2003 jun 49,755 2005 jun 54,144<br />
2001 jul 89,867 2003 jul 63,681 2005 jul 54,182<br />
2001 aug 82,454 2003 aug 62,446 2005 aug 50,909<br />
2001 sep 80,943 2003 sep 76,909 2005 sep 50,182<br />
2001 oct 81,727 2003 oct 81,000 2005 oct 51,636<br />
2001 nov 81,418 2003 nov 75,273 2005 nov 50,364<br />
2001 dec 82,900 2003 dec 83,727 2005 dec 45,636<br />
2002 jan 76,639 2004 jan 53,091 2006 jan 60,727<br />
2002 feb 75,017 2004 feb 47,636 2006 feb 44,364<br />
2002 mar 77,120 2004 mar 52,000 2006 mar 48,727<br />
2002 apr 78,445 2004 apr 49,273 2006 apr 43,818<br />
2002 may 78,629 2004 may 52,182 2006 may 50,727<br />
2002 jun 79,500 2004 Jun 57,636 2006 jun 51,091<br />
2002 jul 77,323 2004 Jul 57,091 2006 jul 54,000<br />
2002 aug 75,373 2004 Aug 56,727 2006 aug 49,455<br />
2002 sep 73,472 2004 Sep 57,091 2006 sep 51,636<br />
2002 oct 73,572 2004 Oct 60,727 2006 oct 48,398<br />
2002 nov 74,520 2004 Nov 53,455 2006 nov 46,909<br />
2002 dec 74,886 2004 Dec 54,364 2006 dec 50,727<br />
81
<strong>Systems</strong> <strong>Analysis</strong> <strong>of</strong> <strong>Zaragoza</strong> UWS Guillermo Penagos<br />
Annex 4<br />
Groundwater flows and energy consumed for groundwater extraction<br />
Energy consumption has been extrapolated from the following assumptions:<br />
- Average groundwater table depth in <strong>Zaragoza</strong> = 5m<br />
(Personal communication, Local agenda 21 Office)<br />
- Average energy consumption for groundwater extraction<br />
= 0.02 Kwh/m3 at 5m height<br />
(Personal communication, Local agenda 21 Office)<br />
<strong>Water</strong> extraction (m 3 )<br />
Energy consumption (Kwh)<br />
Year<br />
Industries<br />
connected to<br />
the sewer<br />
system Landscaping Paper mills<br />
Total<br />
groundwater<br />
extraction<br />
Industries<br />
connected to<br />
the sewer<br />
system Landscaping Paper mills<br />
Total<br />
groundwater<br />
extraction<br />
2001 1,369,411 18,831,712 27,388 376,634<br />
2002 1,566,324 19,028,625 31,326 380,573<br />
2003 1,457,208 18,919,509 29,144 378,390<br />
1,462,301 16,000,000<br />
29,246 320,000<br />
2004 1,568,466 19,030,767 31,369 380,615<br />
2005 1,309,231 18,771,532 26,185 375,431<br />
2006 1,481,114<br />
18,943,415 29,622<br />
378,868<br />
82
<strong>Systems</strong> <strong>Analysis</strong> <strong>of</strong> <strong>Zaragoza</strong> UWS Guillermo Penagos<br />
Annex 5<br />
Raw Data for “Cartuja” WWTP<br />
year month Inflow<br />
BOD<br />
in<br />
COD<br />
in<br />
TP<br />
in<br />
TN<br />
in FeCl3<br />
BOD<br />
out<br />
COD<br />
out<br />
TP<br />
out TN out<br />
TP<br />
sludge<br />
TN to the<br />
atmosphere<br />
as NOx<br />
TN<br />
sludge Sludge as ash<br />
(m 3 ) (ton) (ton) (ton) (ton) (ton) (ton) (ton) (ton) (ton) (ton) (ton) (ton) (ton)<br />
2001 jan 4,403,500 1,442 3,252 42 183 439 60 269 6 89 36 92 455<br />
2001 feb 3,959,200 1,184 2,793 38 166 398 51 240 6 81 33 83 413<br />
2001 mar 4,183,100 1,169 2,653 38 172 420 34 214 6 85 32 86 354<br />
2001 apr 4,966,700 1,205 2,842 44 198 390 61 299 7 97 36 98 386<br />
2001 may 5,452,700 1,293 3,065 50 208 480 57 279 8 103 43 103 457<br />
2001 jun 5,499,800 1,350 3,268 51 201 477 78 327 8 99 44 100 398<br />
2001 jul 5,634,700 1,286 3,117 45 201 427 58 298 7 99 38 100 383<br />
2001 aug 5,319,000 1,012 2,520 43 180 412 56 262 7 90 37 89 307<br />
2001 sep 4,907,500 1,124 2,766 43 170 410 62 261 7 84 36 84 422<br />
2001 oct 5,204,400 1,260 2,962 46 195 425 61 300 7 96 40 97 513<br />
2001 nov 4,641,200 1,247 3,226 43 185 376 66 291 7 91 37 93 360<br />
2001 dec 4,542,600 1,332 3,274 44 187 411 54 274 7 92 37 93 307<br />
1.90<br />
2002 jan 4,602,000 1,419 3,317 42 186 419 54 281 7 91 36 94 400<br />
2002 feb 4,301,120 1,224 2,879 41 176 370 53 263 6 85 34 89 299<br />
2002 mar 4,798,200 1,300 3,024 43 186 411 58 275 7 91 36 93 391<br />
2002 apr 4,729,700 1,287 3,010 45 183 420 68 287 7 90 38 92 414<br />
2002 may 5,111,600 1,321 3,075 49 195 500 91 333 7 96 43 98 438<br />
2002 jun 4,770,400 1,341 3,260 45 184 425 75 314 7 91 38 92 389<br />
2002 jul 4,834,300 1,186 2,830 43 179 408 46 248 7 88 36 89 449<br />
2002 aug 4,531,100 1,088 2,492 38 156 375 37 203 6 77 32 77 346<br />
2002 sep 4,929,900 1,272 2,992 40 192 275 68 265 6 96 34 95 356<br />
2002 oct 5,032,400 1,477 3,472 45 199 410 94 346 7 98 38 99 395<br />
2002 nov 5,027,900 1,609 3,789 45 204 402 104 370 7 100 38 102 361<br />
2002 dec 4,328,100 1,368 3,288 43 174 426 78 285 6 85 37<br />
86 403<br />
83
<strong>Systems</strong> <strong>Analysis</strong> <strong>of</strong> <strong>Zaragoza</strong> UWS Guillermo Penagos<br />
year month Inflow<br />
BOD<br />
in<br />
COD<br />
in<br />
TP<br />
in<br />
TN<br />
in<br />
FeCl3<br />
BOD<br />
out<br />
COD<br />
out<br />
TP<br />
out<br />
TN out<br />
TP<br />
sludge<br />
TN to the<br />
atmosphere<br />
as NOx<br />
TN<br />
sludge<br />
(m 3 ) (ton) (ton) (ton) (ton) (ton) (ton) (ton) (ton) (ton) (ton) (ton) (ton) (ton)<br />
2003 jan 4,761,500 1,576 3,754 43 190 426 108 364 7 94 36 94 382<br />
2003 feb 2,435,300 1,221 2,945 36 146 120 78 285 5 48 30 96 132<br />
2003 mar 4,918,700 1,292 3,050 45 189 408 96 362 7 92 38 94 305<br />
2003 apr 5,655,600 1,297 3,032 44 202 410 95 351 8 101 37 99 457<br />
2003 may 5,288,600 1,303 3,121 40 189 385 93 348 7 95 34 92 544<br />
2003 jun 5,372,300 1,217 2,931 47 186 399 104 369 8 93 40 91 449<br />
2003 jul 5,232,400 1,142 2,824 48 180 452 95 330 7 90 40 88 410<br />
2003 aug 4,992,800 963 2,320 42 163 405 37 235 7 82 35 79 392<br />
2003 sep 5,445,400 1,186 2,896 42 185 409 41 240 7 92 35 90 557<br />
2003 oct 5,560,600 1,278 3,193 46 205 428 97 262 7 102 39 100 481<br />
2003 nov 4,914,400 1,242 3,012 47 192 430 43 219 7 96 40 94 547<br />
2.05<br />
2003 dec 4,790,800 1,243 3,028 43 193 419 66 280 7 96 37 95 457<br />
2004 jan 3,782,200 1,046 2,590 38 172 379 51 224 6 84 32 86 241<br />
2004 feb 4,299,600 1,210 2,728 38 183 360 60 265 6 90 33 91 292<br />
2004 mar 3,935,100 1,308 2,959 36 181 357 49 213 5 88 31 91 311<br />
2004 apr 4,753,500 1,230 2,733 43 198 412 74 288 7 97 36 99 290<br />
2004 may 4,501,400 1,269 2,813 40 187 372 67 280 6 92 33 93 286<br />
2004 jun 5,730,100 1,326 2,930 47 218 435 101 377 7 108 40 107 297<br />
2004 jul 5,409,100 1,225 2,806 44 200 399 53 274 7 99 37 99 317<br />
2004 aug 4,905,300 1,031 2,456 38 175 360 50 251 6 87 32 87 283<br />
2004 sep 4,786,600 1,254 2,884 38 189 356 64 270 6 93 32 94 405<br />
2004 oct 5,453,500 1,432 3,273 46 215 417 89 366 7 107 38 106 333<br />
2004 nov 4,529,400 1,347 3,148 42 193 423 97 344 7 96 36 95 347<br />
2004 dec 4,753,600 1,415 3,379 42 202 412 95 348 6 101 35<br />
99 296<br />
Sludge<br />
as ash<br />
84
<strong>Systems</strong> <strong>Analysis</strong> <strong>of</strong> <strong>Zaragoza</strong> UWS Guillermo Penagos<br />
year month Inflow<br />
BOD<br />
in<br />
COD<br />
in<br />
TP<br />
in<br />
TN<br />
in<br />
FeCl3<br />
BOD<br />
out<br />
COD<br />
out<br />
TP<br />
out<br />
TN out<br />
TP<br />
sludge<br />
TN to the<br />
atmosphere<br />
as NOx<br />
(m 3 ) (ton) (ton) (ton) (ton) (ton) (ton) (ton) (ton) (ton) (ton) (ton) (ton) (ton)<br />
2005 jan 4,570,700 1,430 3,465 41 210 410 92 345 6 105 34 103 271<br />
2005 feb 4,402,000 1,574 3,266 42 198 414 88 356 7 99 35 97 328<br />
2005 mar 4,969,500 1,663 3,572 44 214 415 101 395 7 108 37 104 347<br />
2005 apr 5,303,500 1,655 3,599 46 223 461 84 378 7 113 39 108 362<br />
2005 may 5,707,300 1,772 4,000 52 229 490 121 434 9 117 44 111 371<br />
2005 jun 5,585,000 1,577 3,520 46 228 426 81 387 8 116 39 110 405<br />
2005 jul 5,198,800 1,484 3,198 46 218 435 51 319 8 110 38 106 338<br />
2005 aug 4,884,200 1,259 2,858 42 195 375 38 239 7 100 35 94 344<br />
2005 sep 5,470,100 1,413 3,143 46 224 426 44 297 8 114 38 108 388<br />
2005 oct 4,967,000 1,551 3,276 45 215 435 51 285 7 109 37 104 363<br />
2005 nov 4,479,100 1,375 2,900 40 199 390 56 276 6 100 34 97 281<br />
1.80<br />
2005 dec 4,294,600 1,407 3,001 38 193 365 56 258 6 96 32 94 249<br />
2006 jan 4,287,060 1,536 2,955 38 191 373 41 227 6 96 32 93 336<br />
2006 feb 3,370,800 1,228 2,696 34 182 357 57 272 5 92 29 88 338<br />
2006 mar 3,460,400 1,192 2,521 35 189 332 63 243 6 90 29 97 175<br />
2006 apr 4,393,600 1,421 3,320 44 207 412 87 312 7 104 37 101 303<br />
2006 may 5,045,900 1,707 3,756 49 236 464 127 391 8 120 41 114 323<br />
2006 jun 5,281,500 1,609 3,497 47 217 455 87 276 7 110 40 105 361<br />
2006 jul 4,575,600 1,225 2,666 40 169 345 34 212 6 85 34 82 426<br />
2006 aug 4,193,600 1,098 2,467 33 159 309 36 195 5 81 28 77 278<br />
2006 sep 5,327,500 1,443 3,092 44 196 401 40 237 7 99 37 95 475<br />
2006 oct 5,541,500 1,798 3,781 47 243 451 53 297 8 122 40 118 339<br />
2006 nov 5,163,700 1,620 3,437 46 219 426 46 267 7 111 38 107 407<br />
2006 dec 3,741,600 1,709 3,609 46 231 438 50 282 8 116 39<br />
113 373<br />
TN<br />
sludge<br />
Sludge<br />
as ash<br />
85
<strong>Systems</strong> <strong>Analysis</strong> <strong>of</strong> <strong>Zaragoza</strong> UWS Guillermo Penagos<br />
Energy consumption and production (Kwh)<br />
Year Month Consumed Produced Year Month Consumed Produced Year Month Consumed Produced<br />
2001 Jan 2,227,010 122,670 2003 Jan 2,411,570 78,040 2005 Jan 2,487,884 239,280<br />
2001 Feb 2,090,040 121,300 2003 Feb 1,422,640 22,730 2005 Feb 2,232,800 251,110<br />
2001 Mar 2,214,650 132,910 2003 Mar 2,198,220 281,060 2005 Mar 2,367,990 259,640<br />
2001 Apr 2,288,800 229,590 2003 Apr 2,409,870 204,120 2005 Apr 2,460,130 175,240<br />
2001 May 2,442,650 284,950 2003 May 2,493,660 232,820 2005 May 2,671,180 163,380<br />
2001 Jun 2,547,160 248,400 2003 Jun 2,439,510 476,850 2005 Jun 2,588,190 182,780<br />
2001 Jul 2,446,140 153,420 2003 Jul 2,587,670 519,480 2005 Jul 2,525,970 181,990<br />
2001 Aug 2,236,080 176,400 2003 Aug 2,472,360 438,740 2005 Aug 2,299,730 140,000<br />
2001 Sep 2,309,410 227,850 2003 Sep 2,480,480 165,710 2005 Sep 2,501,490 127,560<br />
2001 Oct 2,541,570 272,370 2003 Oct 2,634,590 127,350 2005 Oct 2,499,150 116,730<br />
2001 Nov 2,410,120 209,350 2003 Nov 2,546,550 130,240 2005 Nov 2,408,790 121,330<br />
2001 Dec 2,491,630 179,840 2003 Dec 2,586,830 139,270 2005 Dec 2,288,237 140,130<br />
2002 Jan 2,500,211 229,037 2004 Jan 2,472,190 55,800 2006 Jan 2,316,915 118,920<br />
2002 Feb 2,116,740 138,630 2004 Feb 2,334,170 77,800 2006 Feb 2,083,962 110,180<br />
2002 Mar 2,448,870 150,020 2004 Mar 2,260,280 52,350 2006 Mar 2,200,117 50,000<br />
2002 Apr 2,442,460 79,410 2004 Apr 2,358,720 139,770 2006 Apr 2,386,256 65,437<br />
2002 May 2,502,730 143,960 2004 May 2,413,670 76,690 2006 May 2,506,871 98,621<br />
2002 Jun 2,467,240 113,660 2004 Jun 2,560,730 168,730 2006 Jun 2,506,648 119,209<br />
2002 Jul 2,441,790 126,410 2004 Jul 2,542,780 179,140 2006 Jul 2,572,370 126,710<br />
2002 Aug 2,284,350 38,190 2004 Aug 2,347,320 91,890 2006 Aug 2,274,580 73,390<br />
2002 Sep 2,231,450 51,890 2004 Sep 2,336,470 226,420 2006 Sep 2,443,220 192,220<br />
2002 Oct 2,516,780 75,930 2004 Oct 2,590,310 245,450 2006 Oct 2,608,917 188,770<br />
2002 Nov 2,411,860 65,170 2004 Nov 2,321,780 212,760 2006 Nov 2,526,068 190,495<br />
2002 Dec 2,323,540 194,820 2004 Dec 2,487,874 226,550 2006 Dec 2,567,493 189,633<br />
86
<strong>Systems</strong> <strong>Analysis</strong> <strong>of</strong> <strong>Zaragoza</strong> UWS Guillermo Penagos<br />
Annex 6<br />
Raw Data for “Almozara” WWTP<br />
Energy<br />
consumption<br />
(Kwh)<br />
Energy<br />
production<br />
(Kwh)<br />
BOD<br />
in<br />
(ton)<br />
BOD<br />
out<br />
(ton)<br />
COD<br />
out<br />
(ton)<br />
TN<br />
out<br />
(ton)<br />
TP<br />
sludge<br />
(ton)<br />
Year Month<br />
Inflow<br />
(m 3 )<br />
Sludge<br />
(ton)<br />
COD in<br />
(ton)<br />
TP in<br />
(ton)<br />
TN in<br />
(ton)<br />
TP out<br />
(ton)<br />
2001 jan 880,154 199,643 0 185 86 431 6.2 30.8 12.3 49.3 4.4 16.9 1.8 7.7<br />
2001 feb 791,349 175,366 0 166 78 388 5.5 27.7 11.1 44.3 4.0 15.2 1.6 6.9<br />
2001 mar 836,101 114,882 94,500 176 82 410 5.9 29.3 11.7 46.8 4.2 16.1 1.7 7.3<br />
2001 apr 992,724 61,961 129,800 208 97 486 6.9 34.7 13.9 55.6 5.0 19.1 2.0 8.7<br />
2001 may 1,089,864 65,510 149,400 229 93 534 7.6 38.1 15.3 61.0 5.4 21.0 2.2 9.5<br />
2001 jun 1,099,278 55,502 144,400 231 101 539 7.7 38.5 15.4 61.6 5.5 21.2 2.2 9.6<br />
2001 jul 1,126,241 64,013 142,600 237 91 552 7.9 39.4 15.8 63.1 5.6 21.7 2.3 9.9<br />
2001 aug 1,063,140 93,152 111,600 223 85 521 7.4 37.2 14.9 59.5 5.3 20.5 2.1 9.3<br />
2001 sep 980,892 59,566 132,000 206 93 481 6.9 34.3 13.7 54.9 4.9 18.9 2.0 8.6<br />
2001 oct 1,040,235 54,437 140,600 218 106 510 7.3 36.4 14.6 58.3 5.2 20.0 2.1 9.1<br />
2001 nov 927,665 33,761 157,400 195 91 455 6.5 32.5 13.0 51.9 4.6 17.9 1.9 8.1<br />
2001 dec 907,957 37,575 163,300 191 76 445 6.4 31.8 12.7 50.8 4.5 17.5 1.8 7.9<br />
2002 jan 965,126 70,334 140,200 203 94 473 6.8 33.8 13.5 54.0 4.8 18.6 1.9 8.4<br />
2002 feb 902,025 36,589 147,200 189 88 442 6.3 31.6 12.6 50.5 4.5 17.4 1.8 7.9<br />
2002 mar 1,006,272 45,266 156,400 211 99 493 7.0 35.2 14.1 56.4 5.0 19.4 2.0 8.8<br />
2002 apr 991,907 47,158 147,400 208 97 486 6.9 34.7 13.9 55.5 5.0 19.1 2.0 8.7<br />
2002 may 1,071,998 43,152 159,800 225 105 525 7.5 37.5 15.0 60.0 5.4 20.6 2.1 9.4<br />
2002 jun 1,000,442 68,425 137,000 210 98 490 7.0 35.0 14.0 56.0 5.0 19.3 2.0 8.8<br />
2002 jul 1,013,843 61,906 136,000 213 99 497 7.1 35.5 14.2 56.8 5.1 19.5 2.0 8.9<br />
2002 aug 950,257 69,007 96,900 200 81 466 6.7 33.3 13.3 53.2 4.8 18.3 1.9 8.3<br />
2002 sep 1,033,892 81,280 107,300 217 95 507 7.2 36.2 14.5 57.9 5.2 19.9 2.1 9.0<br />
2002 oct 1,055,389 55,911 134,600 222 85 517 7.4 36.9 14.8 59.1 5.3 20.3 2.1 9.2<br />
2002 nov 1,054,445 50,431 137,600 221 84 517 7.4 36.9 14.8 59.0 5.3 20.3 2.1 9.2<br />
2002 dec 907,684 41,355 153,400 191 86 445 6.4 31.8 12.7 50.8 4.5 17.5 1.8 7.9<br />
TN<br />
sludge<br />
(ton)<br />
87
<strong>Systems</strong> <strong>Analysis</strong> <strong>of</strong> <strong>Zaragoza</strong> UWS Guillermo Penagos<br />
BOD<br />
in<br />
(ton)<br />
BOD<br />
out<br />
(ton)<br />
COD<br />
out<br />
(ton)<br />
TN<br />
out<br />
(ton)<br />
TP<br />
sludge<br />
(ton)<br />
Year Month<br />
Inflow<br />
(m 3 )<br />
Energy<br />
consumption<br />
Energy<br />
production<br />
Sludge<br />
(ton)<br />
COD in<br />
(ton)<br />
TP in<br />
(ton)<br />
TN in<br />
(ton)<br />
TP out<br />
(ton)<br />
2003 jan 948,925 66,363 124,786 199 96 465 6.6 33.2 13.3 53.1 4.7 18.3 1.9 8.3<br />
2003 feb 485,334 73,547 111,914 102 48 238 3.4 17.0 6.8 27.2 2.4 9.3 1.0 4.2<br />
2003 mar 980,254 99,758 128,400 206 82 480 6.9 34.3 13.7 54.9 4.9 18.9 2.0 8.6<br />
2003 apr 1,127,111 85,595 139,800 237 110 552 7.9 39.4 15.8 63.1 5.6 21.7 2.3 9.9<br />
2003 may 1,053,971 64,046 135,100 221 103 516 7.4 36.9 14.8 59.0 5.3 20.3 2.1 9.2<br />
2003 jun 1,070,652 66,636 126,800 225 105 525 7.5 37.5 15.0 60.0 5.4 20.6 2.1 9.4<br />
2003 jul 1,042,771 52,572 106,700 219 102 511 7.3 36.5 14.6 58.4 5.2 20.1 2.1 9.1<br />
2003 aug 995,021 66,868 104,000 209 98 488 7.0 34.8 13.9 55.7 5.0 19.2 2.0 8.7<br />
2003 sep 1,085,220 42,926 121,600 228 106 532 7.6 38.0 15.2 60.8 5.4 20.9 2.2 9.5<br />
2003 oct 1,108,179 57,714 126,900 233 108 543 7.8 38.8 15.5 62.1 5.5 21.3 2.2 9.7<br />
2003 nov 979,397 49,285 132,200 206 83 480 6.9 34.3 13.7 54.8 4.9 18.9 2.0 8.6<br />
2003 dec 954,764 94,797 128,600 201 88 468 6.7 33.4 13.4 53.5 4.8 18.4 1.9 8.4<br />
2004 jan 877,727 42,926 167,300 184 71 430 6.1 30.7 12.3 49.2 4.4 16.9 1.8 7.7<br />
2004 feb 997,799 57,714 121,100 210 79 489 7.0 34.9 14.0 55.9 5.0 19.2 2.0 8.7<br />
2004 mar 913,210 49,285 126,900 192 87 447 6.4 32.0 12.8 51.1 4.6 17.6 1.8 8.0<br />
2004 apr 1,103,135 94,797 68,500 232 112 541 7.7 38.6 15.4 61.8 5.5 21.2 2.2 9.7<br />
2004 may 1,044,630 60,329 126,100 219 102 512 7.3 36.6 14.6 58.5 5.2 20.1 2.1 9.1<br />
2004 jun 1,329,772 52,123 111,400 279 111 652 9.3 46.5 18.6 74.5 6.6 25.6 2.7 11.6<br />
2004 jul 1,255,278 69,079 98,700 264 123 615 8.8 43.9 17.6 70.3 6.3 24.2 2.5 11.0<br />
2004 aug 1,138,363 93,452 75,700 239 112 558 8.0 39.8 15.9 63.7 5.7 21.9 2.3 10.0<br />
2004 sep 1,110,816 57,469 110,800 233 109 544 7.8 38.9 15.6 62.2 5.6 21.4 2.2 9.7<br />
2004 oct 1,265,582 41,008 137,400 266 124 620 8.9 44.3 17.7 70.9 6.3 24.4 2.5 11.1<br />
2004 nov 1,051,128 156,556 35,400 221 103 515 7.4 36.8 14.7 58.9 5.3 20.2 2.1 9.2<br />
2004 dec 1,103,158 41,910 154,500 232 108 541 7.7 38.6 15.4 61.8 5.5 21.2 2.2 9.7<br />
TN<br />
sludge<br />
(ton)<br />
88
<strong>Systems</strong> <strong>Analysis</strong> <strong>of</strong> <strong>Zaragoza</strong> UWS Guillermo Penagos<br />
BOD<br />
in<br />
(ton)<br />
BOD<br />
out<br />
(ton)<br />
COD<br />
out<br />
(ton)<br />
TN<br />
out<br />
(ton)<br />
TP<br />
sludge<br />
(ton)<br />
Year Month<br />
Inflow<br />
(m 3 )<br />
Energy<br />
consumption<br />
Energy<br />
production<br />
Sludge<br />
(ton)<br />
COD in<br />
(ton)<br />
TP in<br />
(ton)<br />
TN in<br />
(ton)<br />
TP out<br />
(ton)<br />
2005 jan 1,059,861 48,682 162,600 223 104 519 7.4 37.1 14.8 59.4 5.3 20.4 2.1 9.3<br />
2005 feb 1,020,743 43,290 134,000 214 100 500 7.1 35.7 14.3 57.2 5.1 19.6 2.0 8.9<br />
2005 mar 1,152,335 50,801 165,500 242 113 565 8.1 40.3 16.1 64.5 5.8 22.2 2.3 10.1<br />
2005 apr 1,229,784 43,628 162,600 258 120 603 8.6 43.0 17.2 68.9 6.1 23.7 2.5 10.8<br />
2005 may 1,323,417 58,051 144,500 278 66 648 9.3 46.3 18.5 74.1 6.6 25.5 2.6 11.6<br />
2005 jun 1,295,058 45,184 150,600 272 119 635 9.1 45.3 18.1 72.5 6.5 24.9 2.6 11.3<br />
2005 jul 1,205,506 71,949 125,500 253 97 591 8.4 42.2 16.9 67.5 6.0 23.2 2.4 10.5<br />
2005 aug 1,132,556 83,718 97,700 238 90 555 7.9 39.6 15.9 63.4 5.7 21.8 2.3 9.9<br />
2005 sep 1,268,415 70,067 133,200 266 121 622 8.9 44.4 17.8 71.0 6.3 24.4 2.5 11.1<br />
2005 oct 1,151,756 41,330 159,400 242 117 564 8.1 40.3 16.1 64.5 5.8 22.2 2.3 10.1<br />
2005 nov 1,038,621 52,563 138,400 218 102 509 7.3 36.4 14.5 58.2 5.2 20.0 2.1 9.1<br />
2005 dec 995,838 49,308 153,100 209 83 488 7.0 34.9 13.9 55.8 5.0 19.2 2.0 8.7<br />
2006 jan 919,103 44,421 165,600 193 77 450 6.4 32.2 12.9 51.5 4.6 17.7 1.8 8.0<br />
2006 feb 722,666 32,712 150,100 152 71 354 5.1 25.3 10.1 40.5 3.6 13.9 1.4 6.3<br />
2006 mar 741,875 46,344 160,700 156 73 364 5.2 26.0 10.4 41.5 3.7 14.3 1.5 6.5<br />
2006 apr 941,944 50,437 149,000 198 92 462 6.6 33.0 13.2 52.7 4.7 18.1 1.9 8.2<br />
2006 may 1,081,790 58,563 158,400 227 106 530 7.6 37.9 15.1 60.6 5.4 20.8 2.2 9.5<br />
2006 jun 1,132,300 51,360 151,500 238 111 555 7.9 39.6 15.9 63.4 5.7 21.8 2.3 9.9<br />
2006 jul 980,963 57,142 137,700 206 96 481 6.9 34.3 13.7 54.9 4.9 18.9 2.0 8.6<br />
2006 aug 899,066 58,584 113,200 189 88 441 6.3 31.5 12.6 50.3 4.5 17.3 1.8 7.9<br />
2006 sep 1,142,162 49,258 136,900 240 97 560 8.0 40.0 16.0 64.0 5.7 22.0 2.3 10.0<br />
2006 oct 1,188,042 62,932 147,600 249 109 582 8.3 41.6 16.6 66.5 5.9 22.9 2.4 10.4<br />
2006 nov 1,107,045 56,307 155,100 232 89 542 7.7 38.7 15.5 62.0 5.5 21.3 2.2 9.7<br />
2006 dec 802,161 62,450 153,320 168 64 393 5.6 28.1 11.2 44.9 4.0 15.4 1.6 7.0<br />
TN<br />
sludge<br />
(ton)<br />
89
<strong>Systems</strong> <strong>Analysis</strong> <strong>of</strong> <strong>Zaragoza</strong> UWS<br />
Guillermo Penagos<br />
Annex 7<br />
Raw Data for “Paper mills” WWTP<br />
Source: Report submitted by Paper mills to Local agenda 21 Office in 2005<br />
Parameter<br />
Value<br />
Inflow (m 3 year -1 ) 14,400,000<br />
Energy consumption (Kwh) 744,971<br />
Energy production (Kwh) 1,539,236<br />
BOD in (kg) 2,596,051<br />
Sludge (ton) 1,139<br />
COD in (kg) 6,057,453<br />
TP in (kg) 86,535<br />
TN in (kg) 432,675<br />
Heavy metals in (kg) 11,730<br />
BOD out (kg) 173,070<br />
COD out (kg) 692,280<br />
TP out (kg) 61,811<br />
TN out (kg) 237,971<br />
Heavy metals out (kg) 3,499<br />
TP sludge (kg) 24,724<br />
TN sludge (kg) 108,169<br />
Heavy metals sludge (kg) 8,231<br />
90
<strong>Systems</strong> <strong>Analysis</strong> <strong>of</strong> <strong>Zaragoza</strong> UWS<br />
Guillermo Penagos<br />
Annex 8<br />
Calculations <strong>of</strong> CO 2 emissions from electricity consumption<br />
Relative proportion <strong>of</strong><br />
each source in Spain<br />
Factors<br />
for CO 2<br />
emissions<br />
(g/kWh)<br />
Resulting emissions<br />
(g/Kwh)<br />
Energy<br />
source Current<br />
Projections<br />
form National<br />
Energy Plan<br />
(2020)<br />
Current<br />
Projections<br />
form National<br />
Energy Plan<br />
(2020)<br />
Coal 0.40 0.20 980 395.4 196.0<br />
Hydropower 0.19 0.22 9 1.7 1.9<br />
362<br />
Combined<br />
cycles 0.09 0.33<br />
33.3 119.5<br />
Wind 0.04 0.06 7 0.3 0.4<br />
Nuclear 0.27 0.19 20 5.4 3.7<br />
Gas<br />
Thermal 0.00 0.00<br />
653<br />
0.0 0.0<br />
Resulting factors for Spain 436.1 321.5<br />
Source for Spain: Ministerio de Industria, Turismo y Comercio de España (2007)<br />
Source for Emission Factors: European Commission (1995)<br />
From previous annexes electricity consumptions per year can be obtained:<br />
Year<br />
DWTP<br />
Total energy consumption per year (Gwh)<br />
Distribution<br />
network Cartuja Almozara<br />
Groundwater<br />
extraction<br />
Paper<br />
mills<br />
2001 5.07 1.01 28.25 1.02 0.38 0.74<br />
2002 5.08 0.91 28.69 0.67 0.38 0.74<br />
2003 5.43 0.82 28.68 0.82 0.38 0.74<br />
2004 6.51 0.65 29.03 0.82 0.38 0.74<br />
2005 7.02 0.62 29.33 0.66 0.38 0.74<br />
2006 6.74 0.60 28.99 0.63 0.38 0.74<br />
When current emission factor for Spain (436.1 g/Kwh) is applied to the values <strong>of</strong> total energy<br />
consumption per year the CO 2 emissions are obtained:<br />
DWTP<br />
CO 2 emissions (ton)<br />
Distribution<br />
network Cartuja Almozara<br />
Groundwater<br />
extraction<br />
Paper<br />
mills<br />
2001 2,210 442 12,315 443 164 325<br />
2002 2,215 399 12,508 292 166 325<br />
2003 2,369 355 12,506 358 165 325<br />
2004 2,840 284 12,655 356 166 325<br />
2005 3,059 271 12,789 287 164 325<br />
2006 2,939 262 12,641 275 165 325<br />
91
<strong>Systems</strong> <strong>Analysis</strong> <strong>of</strong> <strong>Zaragoza</strong> UWS<br />
Guillermo Penagos<br />
Annex 9. Calculation <strong>of</strong> Environmental Impacts from Transportation<br />
Energy consumed and CO 2 emissions<br />
Total mass <strong>of</strong> chemical products and sludge per year at the different UWS facilities can be<br />
obtained from previous annexes.<br />
Factors for CO 2 emissions and energy consumption derived from transportation <strong>of</strong> products in<br />
Heavy trucks where obtained from Thonstad (2005):<br />
CO 2 emission factor (g/ton/km) = 69<br />
Energy consumption factor (Kwh/ton/km) = 0.22<br />
Distances between facilities and production companies (for chemical products) and between<br />
facilities and disposal sites (for sludge) were provided by the Local Agenda 21 Office <strong>of</strong> <strong>Zaragoza</strong>.<br />
Total annual mass (ton)<br />
DWTP Cartuja Almozara<br />
Paper<br />
mills<br />
Year Chlorine Alum PAC<br />
Sludge<br />
as Dry<br />
matter<br />
Iron<br />
Chloride<br />
Sludge<br />
as ash Sludge Sludge<br />
2001 3,365 10,045 0 0 5,065 4,754 1,077 1,139<br />
2002 2,974 9,090 0 3,489 4,843 4,640 1,112 1,139<br />
2003 2,909 9,331 45 7,594 4,692 5,113 1,129 1,139<br />
2004 3,074 9,840 337 5,995 4,681 3,698 1,240 1,139<br />
2005 2,237 7,526 178 5,974 5,042 4,048 1,231 1,139<br />
2006 2,456 5,989 179 7,674 4,763 4,135 1,073 1,139<br />
Distance<br />
(km) 25 32 18 21 18 21 15 21<br />
Resulting factors from multiplying distances<br />
CO 2 1725 2208 1242 1449 1242 1449 1035 1449<br />
Energy 5.5 7.04 3.96 4.62 3.96 4.62 3.3 4.62<br />
The values for Energy consumption are the following:<br />
Total energy consumption from transportation <strong>of</strong> sludge and chemical products (Kwh)<br />
DWTP Cartuja Almozara<br />
Paper<br />
mills<br />
Year Chlorine Alum PAC<br />
Sludge<br />
as Dry<br />
matter<br />
Iron<br />
Chloride<br />
Sludge<br />
as ash Sludge Sludge<br />
2001 18,508 70,714 0 0 20,057 21,965 3,555 5,264<br />
2002 16,356 63,992 0 16,120 19,177 21,439 3,669 5,264<br />
2003 15,997 65,692 178 35,082 18,579 23,622 3,726 5,264<br />
2004 16,906 69,274 1,333 27,696 18,539 17,084 4,093 5,264<br />
2005 12,305 52,984 704 27,600 19,968 18,701 4,064 5,264<br />
2006 13,506 42,162 708 35,454 18,863 19,104 3,539 5,264<br />
92
<strong>Systems</strong> <strong>Analysis</strong> <strong>of</strong> <strong>Zaragoza</strong> UWS<br />
Guillermo Penagos<br />
The values for CO 2 emissions are the following:<br />
Total CO 2 emissions from transportation <strong>of</strong> sludge and chemical products (ton)<br />
DWTP Cartuja Almozara<br />
Paper<br />
mills<br />
Year Chlorine Alum PAC<br />
Sludge<br />
as Dry<br />
matter<br />
Iron<br />
Chloride<br />
Sludge<br />
as ash Sludge Sludge<br />
2001 5.8 22.2 0.0 0.0 6.3 6.9 1.1 1.7<br />
2002 5.1 20.1 0.0 5.1 6.0 6.7 1.2 1.7<br />
2003 5.0 20.6 0.1 11.0 5.8 7.4 1.2 1.7<br />
2004 5.3 21.7 0.4 8.7 5.8 5.4 1.3 1.7<br />
2005 3.9 16.6 0.2 8.7 6.3 5.9 1.3 1.7<br />
2006 4.2 13.2 0.2 11.1 5.9 6.0 1.1 1.7<br />
93
<strong>Systems</strong> <strong>Analysis</strong> <strong>of</strong> <strong>Zaragoza</strong> UWS Guillermo Penagos<br />
Annex 10. Calculations for Storm water overflows to the Ebro River<br />
Year<br />
Precipitation<br />
* Inpervious<br />
area<br />
Expected<br />
from<br />
precipitation<br />
+<br />
consumption<br />
Total<br />
Inflow<br />
WWTPs<br />
Expected from<br />
consumption<br />
minus Total<br />
inflow WWTPs<br />
Overflows<br />
to the<br />
river<br />
Precipitation<br />
Month (mm)<br />
2001 Jan 30 837,480 5,893,629 5,283,654 227,505 609,975<br />
2001 Feb 4 105,840 4,561,242 4,750,549 295,147 0<br />
2001 Mar 24 665,280 5,564,739 5,019,201 119,743 545,537<br />
2001 Apr 7 198,800 4,854,963 5,959,424 1,303,262 0<br />
2001 May 50 1,405,880 6,418,318 6,542,564 1,530,126 0<br />
2001 Jun 8 213,080 5,869,981 6,599,078 942,178 0<br />
2001 Jul 46 1,300,320 6,882,947 6,760,941 1,178,315 122,005<br />
2001 Aug 4 113,400 5,522,964 6,382,140 972,577 0<br />
2001 Sep 73 2,047,640 7,377,521 5,888,392 558,510 1,489,130<br />
2001 Oct 17 482,440 5,743,443 6,244,635 983,632 0<br />
2001 Nov 12 326,480 5,431,775 5,568,865 463,570 0<br />
2001 Dec 0 0 5,411,588 5,450,557 38,968 0<br />
2002 Jan 31 879,480 6,074,230 5,567,126 372,376 507,104<br />
2002 Feb 6 177,240 4,488,013 5,203,145 892,372 0<br />
2002 Mar 37 1,029,840 5,830,599 5,804,472 1,003,713 26,127<br />
2002 Apr 26 731,360 5,095,437 5,721,607 1,357,530 0<br />
2002 May 1 33,600 4,700,258 6,183,598 1,516,940 0<br />
2002 Jun 14 397,600 5,434,335 5,770,842 734,107 0<br />
2002 Jul 16 448,000 5,704,241 5,848,143 591,902 0<br />
2002 Aug 9 252,000 4,989,296 5,481,357 744,061 0<br />
2002 Sep 23 644,000 5,476,632 5,963,792 1,131,160 0<br />
2002 Oct 38 1,052,800 5,908,543 6,087,789 1,232,046 0<br />
2002 Nov 10 268,800 5,072,870 6,082,345 1,278,275 0<br />
2002 Dec 21 599,200 5,368,205 5,235,784 466,778 132,422<br />
Formula<br />
Estimated storm water<br />
= Precipitation * impervious area<br />
Overflows = Estimated storm water +<br />
Expected WWTPs inflow – Actual inflow to<br />
WWTPs<br />
Impervious area (km 2 ) = 28,000<br />
94
<strong>Systems</strong> <strong>Analysis</strong> <strong>of</strong> <strong>Zaragoza</strong> UWS Guillermo Penagos<br />
Year<br />
Precipitation<br />
* Inpervious<br />
area<br />
Expected<br />
from<br />
precipitation<br />
+<br />
consumption<br />
Total<br />
Inflow<br />
WWTPs<br />
Expected from<br />
consumption<br />
minus Total<br />
inflow WWTPs<br />
Overflows<br />
to the<br />
river<br />
Precipitation<br />
Month (mm)<br />
2003 Jan 15 414,400 5,120,255 5,710,425 1,004,570 0<br />
2003 Feb 33 918,400 4,978,424 4,953,460 893,436 24,964<br />
2003 Mar 18 498,400 4,847,781 5,898,954 1,549,573 0<br />
2003 Apr 29 812,000 4,805,901 6,782,711 2,788,810 0<br />
2003 May 46 1,282,400 5,767,313 6,342,571 1,857,658 0<br />
2003 Jun 39 1,103,200 5,954,054 6,442,952 1,592,098 0<br />
2003 Jul 1 39,200 5,173,981 6,275,171 1,140,391 0<br />
2003 Aug 4 112,000 5,034,663 5,987,821 1,065,159 0<br />
2003 Sep 33 924,000 5,601,800 6,530,620 1,852,820 0<br />
2003 Oct 44 1,226,400 5,982,163 6,668,779 1,913,016 0<br />
2003 Nov 35 980,000 5,445,823 5,893,797 1,427,974 0<br />
2003 Dec 16 448,000 5,073,223 5,745,564 1,120,341 0<br />
2004 Jan 10 291,200 4,586,785 4,659,927 364,342 0<br />
2004 Feb 34 957,600 4,925,772 5,297,399 1,329,227 0<br />
2004 Mar 42 1,164,800 5,653,661 4,848,310 359,449 805,351<br />
2004 Apr 35 968,800 5,076,606 5,856,635 1,748,829 0<br />
2004 May 47 1,316,000 5,860,213 5,546,030 1,001,817 314,183<br />
2004 Jun 10 274,400 5,344,331 7,059,872 1,989,941 0<br />
2004 Jul 24 672,000 5,668,454 6,664,378 1,667,924 0<br />
2004 Aug 2 44,800 4,587,888 6,043,663 1,500,574 0<br />
2004 Sep 6 179,200 4,955,382 5,897,416 1,121,234 0<br />
2004 Oct 28 784,000 5,449,262 6,719,082 2,053,820 0<br />
2004 Nov 1 16,800 4,483,808 5,580,528 1,113,520 0<br />
2004 Dec 0 0 4,439,115 5,856,758 1,417,643 0<br />
95
<strong>Systems</strong> <strong>Analysis</strong> <strong>of</strong> <strong>Zaragoza</strong> UWS Guillermo Penagos<br />
Year<br />
Precipitation<br />
* Inpervious<br />
area<br />
Expected<br />
from<br />
precipitation<br />
+<br />
consumption<br />
Total<br />
Inflow<br />
WWTPs<br />
Expected from<br />
consumption<br />
minus Total<br />
inflow WWTPs<br />
Overflows<br />
to the<br />
river<br />
Precipitation<br />
Month (mm)<br />
2005 Jan 10 275,800 4,787,355 5,630,561 1,119,006 0<br />
2005 Feb 8 218,400 4,355,780 5,422,743 1,285,363 0<br />
2005 Mar 17 476,000 4,932,419 6,121,835 1,665,416 0<br />
2005 Apr 14 397,600 4,649,740 6,533,284 2,281,144 0<br />
2005 May 50 1,394,400 5,799,473 7,030,717 2,625,644 0<br />
2005 Jun 46 1,288,000 5,862,983 6,880,058 2,305,076 0<br />
2005 Jul 0 5,600 4,633,128 6,404,306 1,776,778 0<br />
2005 Aug 6 156,800 4,285,596 6,016,756 1,887,959 0<br />
2005 Sep 22 610,400 4,902,997 6,738,515 2,445,918 0<br />
2005 Oct 40 1,131,200 5,183,344 6,118,756 2,066,611 0<br />
2005 Nov 33 912,800 4,836,312 5,517,721 1,594,209 0<br />
2005 Dec 6 156,800 4,540,264 5,290,438 906,975 0<br />
2006 Jan 16 453,600 4,834,733 5,206,163 825,030 0<br />
2006 Feb 27 767,200 4,251,890 4,093,466 608,776 158,424<br />
2006 Mar 13 364,000 4,258,136 4,202,275 308,139 55,861<br />
2006 Apr 26 722,400 4,299,035 5,335,544 1,758,909 0<br />
2006 May 16 453,600 4,718,791 6,127,690 1,862,499 0<br />
2006 Jun 41 1,136,800 5,614,742 6,413,800 1,935,859 0<br />
2006 Jul 38 1,052,800 5,567,399 5,556,563 1,041,963 10,837<br />
2006 Aug 6 173,600 4,144,170 5,092,666 1,122,096 0<br />
2006 Sep 61 1,719,200 5,876,446 6,469,662 2,312,416 0<br />
2006 Oct 25 688,800 4,703,978 6,729,542 2,714,364 0<br />
2006 Nov 43 1,204,000 5,028,348 6,270,745 2,446,397 0<br />
2006 Dec 0 0 4,110,740 4,543,761 433,022 0<br />
96