Development of Standard Test Procedures for ... - Toolpoint
Development of Standard Test Procedures for ... - Toolpoint
Development of Standard Test Procedures for ... - Toolpoint

You also want an ePaper? Increase the reach of your titles
YUMPU automatically turns print PDFs into web optimized ePapers that Google loves.
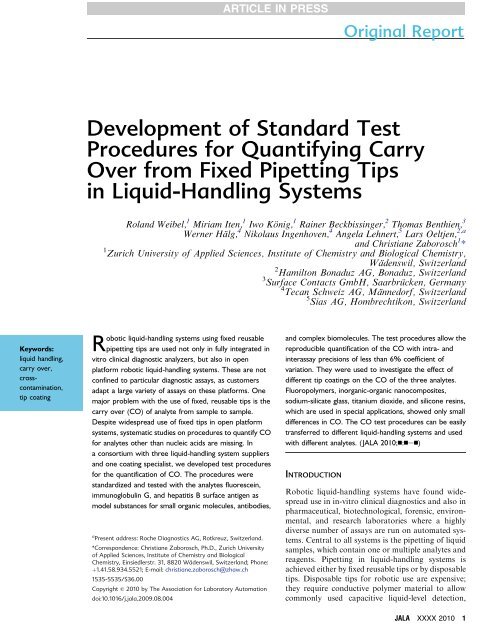
ARTICLE IN PRESS<br />
Original Report<br />
<strong>Development</strong> <strong>of</strong> <strong>Standard</strong> <strong>Test</strong><br />
<strong>Procedures</strong> <strong>for</strong> Quantifying Carry<br />
Over from Fixed Pipetting Tips<br />
in Liquid-Handling Systems<br />
Roland Weibel, 1 Miriam Iten, 1 Iwo König, 1 Rainer Beckbissinger, 2 Thomas Benthien, 3<br />
Werner Hälg, 4 Nikolaus Ingenhoven, 4 Angela Lehnert, 5 Lars Oeltjen, 2,a<br />
and Christiane Zaborosch 1 *<br />
1 Zurich University <strong>of</strong> Applied Sciences, Institute <strong>of</strong> Chemistry and Biological Chemistry,<br />
Wa¨denswil, Switzerland<br />
2 Hamilton Bonaduz AG, Bonaduz, Switzerland<br />
3 Surface Contacts GmbH, Saarbru¨cken, Germany<br />
4 Tecan Schweiz AG, Ma¨nnedorf, Switzerland<br />
5 Sias AG, Hombrechtikon, Switzerland<br />
Keywords:<br />
liquid handling,<br />
carry over,<br />
crosscontamination,<br />
tip coating<br />
Robotic liquid-handling systems using fixed reusable<br />
pipetting tips are used not only in fully integrated in<br />
vitro clinical diagnostic analyzers, but also in open<br />
plat<strong>for</strong>m robotic liquid-handling systems. These are not<br />
confined to particular diagnostic assays, as customers<br />
adapt a large variety <strong>of</strong> assays on these plat<strong>for</strong>ms. One<br />
major problem with the use <strong>of</strong> fixed, reusable tips is the<br />
carry over (CO) <strong>of</strong> analyte from sample to sample.<br />
Despite widespread use <strong>of</strong> fixed tips in open plat<strong>for</strong>m<br />
systems, systematic studies on procedures to quantify CO<br />
<strong>for</strong> analytes other than nucleic acids are missing. In<br />
a consortium with three liquid-handling system suppliers<br />
and one coating specialist, we developed test procedures<br />
<strong>for</strong> the quantification <strong>of</strong> CO. The procedures were<br />
standardized and tested with the analytes fluorescein,<br />
immunoglobulin G, and hepatitis B surface antigen as<br />
model substances <strong>for</strong> small organic molecules, antibodies,<br />
a Present address: Roche Diagnostics AG, Rotkreuz, Switzerland.<br />
*Correspondence: Christiane Zaborosch, Ph.D., Zurich University<br />
<strong>of</strong> Applied Sciences, Institute <strong>of</strong> Chemistry and Biological<br />
Chemistry, Einsiedlerstr. 31, 8820 Wädenswil, Switzerland; Phone:<br />
þ1.41.58.934.5521; E-mail: christiane.zaborosch@zhaw.ch<br />
1535-5535/$36.00<br />
Copyright c 2010 by The Association <strong>for</strong> Laboratory Automation<br />
doi:10.1016/j.jala.2009.08.004<br />
and complex biomolecules. The test procedures allow the<br />
reproducible quantification <strong>of</strong> the CO with intra- and<br />
interassay precisions <strong>of</strong> less than 6% coefficient <strong>of</strong><br />
variation. They were used to investigate the effect <strong>of</strong><br />
different tip coatings on the CO <strong>of</strong> the three analytes.<br />
Fluoropolymers, inorganic-organic nanocomposites,<br />
sodium-silicate glass, titanium dioxide, and silicone resins,<br />
which are used in special applications, showed only small<br />
differences in CO. The CO test procedures can be easily<br />
transferred to different liquid-handling systems and used<br />
with different analytes. (JALA 2010;n:nen)<br />
INTRODUCTION<br />
Robotic liquid-handling systems have found widespread<br />
use in in-vitro clinical diagnostics and also in<br />
pharmaceutical, biotechnological, <strong>for</strong>ensic, environmental,<br />
and research laboratories where a highly<br />
diverse number <strong>of</strong> assays are run on automated systems.<br />
Central to all systems is the pipetting <strong>of</strong> liquid<br />
samples, which contain one or multiple analytes and<br />
reagents. Pipetting in liquid-handling systems is<br />
achieved either by fixed reusable tips or by disposable<br />
tips. Disposable tips <strong>for</strong> robotic use are expensive;<br />
they require conductive polymer material to allow<br />
commonly used capacitive liquid-level detection,<br />
JALA XXXX 2010 1
ARTICLE IN PRESS<br />
Original Report<br />
and tip racks must fulfill stringent tolerance criteria to allow<br />
consistent tip pick-up by robotic arms. Assays usually require<br />
a large number <strong>of</strong> pipetting steps and the use <strong>of</strong> disposable tips<br />
can thus substantially increase assay costs. 1 In addition, assay<br />
throughput can be limited by tip logistic (space occupied on the<br />
worktable, disposal <strong>of</strong> used tips as clinical waste). Accordingly,<br />
the use <strong>of</strong> fixed reusable tips is an attractive alternative.<br />
The major problem with fixed tips is carry over (CO). The CO<br />
is the process by which materials are carried into a reaction<br />
mixture to which they do not belong. 2 These materials can<br />
be either the sample itself, that is, the respective analyte or<br />
the reagents used during the assay. Sample-to-sample CO (also<br />
termed as sample cross-contamination) can occur when a sample<br />
containing a high analyte concentration precedes one with<br />
a low (or zero) analyte concentration. The CO from the first to<br />
the second sample may cause the second sample to become<br />
false positive.<br />
There<strong>for</strong>e, manufacturers <strong>of</strong> in vitro diagnostic analyzers<br />
have to ensure that CO does not significantly affect results<br />
by carefully optimizing the pipetting and washing procedures<br />
<strong>for</strong> each analyte. In the guideline <strong>for</strong> the preliminary evaluation<br />
<strong>of</strong> quantitative clinical laboratory measurements from<br />
the Clinical and Laboratory <strong>Standard</strong>s Institute, a procedure<br />
<strong>for</strong> the analysis <strong>of</strong> linearity, bias, precision, drift, and sample<br />
CO is proposed. 3 Three samples <strong>of</strong> high, medium, and low<br />
analyte concentration are used. They are measured within<br />
one series in the order medium, high, low, medium, medium,<br />
low, low, high, high, and medium. This series <strong>of</strong> 10 measurements<br />
should be repeated 20 times. All the data are then<br />
analyzed in a multiple regression procedure, which simultaneously<br />
calculates effects <strong>of</strong> linearity, bias, precision, drift,<br />
and sample CO. The multiple regression is based on the<br />
assumption that sample CO is linearly dependent on the concentration<br />
<strong>of</strong> the preceding sample-an assumption that is difficult<br />
to verify over the full range <strong>of</strong> analyte concentrations.<br />
Alternate test procedures involved three measurements <strong>of</strong><br />
a sample with high analyte concentration followed by three<br />
measurements <strong>of</strong> a sample with low analyte concentration 2,4 ;<br />
three identical high samples followed by five low samples 5 or<br />
two identical high samples followed by two low samples. 6,7<br />
Similar procedures were used to describe the absence <strong>of</strong> clinically<br />
significant CO in commercial in vitro diagnostic analyzers.<br />
5,8e14 However, in these publications, pipetting and<br />
washing procedures are not described in detail.<br />
In contrast to fully integrated in vitro diagnostic analyzers,<br />
open plat<strong>for</strong>m robotic liquid-handling systems are<br />
not confined to particular diagnostic assays, as customers<br />
adapt all kind <strong>of</strong> assays on these plat<strong>for</strong>ms. Despite widespread<br />
use <strong>of</strong> fixed tips in these systems, we are not aware<br />
<strong>of</strong> systematic studies on procedures to quantify CO in such<br />
liquid-handling systems <strong>for</strong> analytes other than nucleic acids.<br />
The CO <strong>of</strong> nucleic acids has been investigated by several<br />
groups (Fre´geau et al. 15 and references therein).<br />
Together with a consortium <strong>of</strong> three liquid-handling system<br />
suppliers, we have there<strong>for</strong>e established and validated<br />
test procedures <strong>for</strong> measuring the CO <strong>of</strong> three model<br />
substances, a small organic molecule, a protein, and a lipid<br />
protein complex. <strong>Procedures</strong> were developed such that they<br />
can be easily adapted on each plat<strong>for</strong>m and used with different<br />
analytes. In the present paper, the development, set-up,<br />
and per<strong>for</strong>mance characteristics <strong>of</strong> the standard test procedures<br />
are described together with their ability to analyze<br />
the effects <strong>of</strong> different tip coatings on carry over. In a second<br />
paper, we will describe the use <strong>of</strong> the standard test procedures<br />
to reduce the CO to below required levels by optimization<br />
<strong>of</strong> the wash procedure (Iten et al., manuscript in<br />
preparation).<br />
MATERIALS AND METHODS<br />
Liquid-Handling System<br />
<strong>Standard</strong> test procedures <strong>for</strong> measuring CO were developed<br />
on a commercial liquid-handling system (Freedom<br />
EVO, Tecan Schweiz AG, Ma¨nnedorf, Switzerland) equipped<br />
with eight pipetting channels, a membrane pump, and<br />
a wash station (Low Volume Wash Station; Tecan Schweiz<br />
AG). Four channels were equipped with fixed multiuse tips<br />
and the remaining four channels were equipped with<br />
adapters <strong>for</strong> disposable tips, which were used <strong>for</strong> pipetting<br />
<strong>of</strong> calibration samples, reagents, and diluents. Fixed tips <strong>of</strong><br />
different liquid-handling systems have different geometries.<br />
There<strong>for</strong>e, special tips with a simplified geometry (hollow<br />
cylinder; length: 160 mm; outer diameter: 2 mm; inner diameter:<br />
0.8 mm) were used in this study to allow transferability<br />
<strong>of</strong> methods to the different liquid-handling plat<strong>for</strong>ms and<br />
comparability <strong>of</strong> results. The suitability <strong>of</strong> the test procedures<br />
<strong>for</strong> differentiating the effects <strong>of</strong> different tip coatings<br />
was evaluated with stainless steel tips, which were either left<br />
uncoated or which were coated inside and outside with<br />
fluoropolymers, inorganic-organic nanocomposite (ION),<br />
sodium-silicate glass (SSG), titanium dioxide, and different<br />
types <strong>of</strong> silicone resin coatings (Table 1). All coatings were<br />
produced by Surface Contacts GmbH, Saarbru¨cken,<br />
Germany.<br />
The liquid-handling systems from Tecan, Hamilton and<br />
Sias use water purified by reverse osmosis or ion exchange<br />
as the wash solution. In the Freedom EVO liquid-handling<br />
system, water purified by reverse osmosis was used as system<br />
liquid <strong>for</strong> pipetting and was selected as the washing solution<br />
<strong>for</strong> developing the CO standard test procedures.<br />
<strong>Procedures</strong> to Provoke CO<br />
The CO procedure was developed such that it could be<br />
used <strong>for</strong> the three analytes tested in this study and that it<br />
can be easily adapted to further analytes.<br />
Be<strong>for</strong>e each CO run, fixed tips were cleaned by pumping<br />
50 mL <strong>of</strong> wash solution through the tip into the waste, followed<br />
by a wash step with 100 mL <strong>of</strong> wash solution in the wash<br />
station (inside and outside wash using the membrane pump).<br />
The CO was provoked by the procedure shown in Figure 1,<br />
with two 96-well plates placed on the worktable. One plate<br />
contained the analyte stock solutions, whereas the second<br />
2 JALA XXXX 2010
ARTICLE IN PRESS<br />
Original Report<br />
Table 1. Characteristics <strong>of</strong> tip coatings<br />
Coating Coating type Characteristics<br />
USS Uncoated stainless steel X2CrNiMo18-15-3 steel; surface roughness Ra %0.2<br />
FP1 Fluoropolymer Polytetrafluoroethylene-based pigmented coating with very good antiadhesive properties,<br />
hydro-/oleophobicity, high hardness, and chemical stability against organic solvents<br />
FP2 Fluoropolymer Colorless coating with outstanding hydro-/oleophobicity but less mechanical hardness<br />
FP3 Fluoropolymer Colorless coating similar to FP2<br />
ION Inorganic-organic<br />
nanocomposite<br />
Sol-gel derived, very hydrophobic coating with very good antiadhesive properties<br />
and improved water drop-<strong>of</strong>f, <strong>of</strong>ten used as a seal coating and as a diffusion barrier to metal ions<br />
SSG Sodium-silicate glass Low-temperature curing coating<br />
TDC Titanium dioxide coated Sol-gel derived low-temperature curing coating<br />
MSR Methyl-modified silicone resin Colorless hard coating with very good antiadhesive properties<br />
PSR Propyl-modified silicone resin Similar to MSR with propyl modifications<br />
HSR Hexadecyl-modified silicone resin Similar to MSR with hexadecyl modifications<br />
served as a recipient plate <strong>for</strong> measuring the CO and contained<br />
buffer. The tips were immersed into the analyte stock solution<br />
(140 mL per well) with a tip end position <strong>of</strong> 0.75 mm above the<br />
bottom <strong>of</strong> the plate, resulting in an immersion depth <strong>of</strong><br />
3.5 mm. Analyte stock solution (70 mL) was aspirated at an aspiration<br />
speed <strong>of</strong> 150 mL/s, which resulted in an aspirated column<br />
height <strong>of</strong> 139.3 mm. The analyte solution was kept in the<br />
tips <strong>for</strong> 5 s, and was then dispensed back into the same well<br />
with a dispension speed <strong>of</strong> 600 mL/s. The tip position remained<br />
at 0.75 mm above the bottom <strong>of</strong> the plate <strong>for</strong> another 5 s be<strong>for</strong>e<br />
the tips were retracted from the solution. Subsequently, the<br />
tips were washed in a three-step procedure: First, the inside<br />
<strong>of</strong> tips was rinsed with 13-mL wash solution with the tip positioned<br />
above the waste tray (pump speed 0.9 mL/s). In the second<br />
washing step, the outer surface <strong>of</strong> the tips was washed in<br />
the wash station using the membrane pump (8 s, pump speed<br />
50%, which corresponds to 18.75 mL/s). In the third washing<br />
step, the tips were washed inside and outside by pumping<br />
13 mL through the tip. After the wash procedure, the tips were<br />
positioned in the recipient CO plate wells containing 150 mL<strong>of</strong><br />
buffer at a height <strong>of</strong> 0.75 mm above the bottom <strong>of</strong> the plate, resulting<br />
in an immersion depth <strong>of</strong> 3.8 mm. Buffer (71 mL) was<br />
Figure 1. Carry over provocation procedure. Washing intensities were varied by using five different wash volumes (26 mL, 11 mL, 6<br />
mL, 3.5 mL and 2 mL) in each carry-over measurement run. Half <strong>of</strong> these wash volumes was used in step 7 in which the wash solution was<br />
pumped through the tips into the waste. The other half <strong>of</strong> the wash volume was used in step 9 <strong>for</strong> an inside and outside wash in the wash<br />
station. In step 8, a membrane pump was used at 50% pump speed (18.75 mL/s) <strong>for</strong> an outside wash <strong>of</strong> the tips.<br />
JALA XXXX 2010 3
ARTICLE IN PRESS<br />
Original Report<br />
aspirated with an aspiration speed <strong>of</strong> 150 mL/s, which resulted<br />
in an aspirated column height <strong>of</strong> 141.3 mm. The buffer was<br />
kept in the tips <strong>for</strong> 5 s, and then dispensed into the same well.<br />
The tip position remained at 0.75 mm above the bottom <strong>of</strong> the<br />
plate <strong>for</strong> another 5 s be<strong>for</strong>e the empty tips were retracted from<br />
the solution. In initial experiments, the CO samples were transferred<br />
with disposable tips from the recipient plate into the enzyme-linked<br />
immunosorbent assay (ELISA) plates <strong>for</strong><br />
immunoglobulin G (IgG) and hepatitis B surface antigen<br />
(HBsAg) quantification, respectively. Further experiments<br />
showed that the CO could be provoked directly in the coated<br />
and blocked ELISA plates used as recipient plates <strong>for</strong> both<br />
IgG and HBsAg, which allowed the assay time to be reduced.<br />
Per<strong>for</strong>ming the CO directly in the ELISA plates affects the incubation<br />
time <strong>of</strong> samples with capture antibodies. However, it<br />
was found that there was no difference in the measured concentrations<br />
<strong>of</strong> IgG and HBsAg when sample incubation times differed<br />
by not more than 30 min.<br />
Be<strong>for</strong>e the next CO measurement, the tips were thoroughly<br />
cleaned by pumping 5 mL <strong>of</strong> wash solution through<br />
them, followed by a 50 mL wash in the wash station using<br />
the membrane pump.<br />
One CO measurement run consisted <strong>of</strong> three identical series<br />
<strong>of</strong> five CO measurements with four tips in parallel. The<br />
five CO measurements were per<strong>for</strong>med consecutively with<br />
decreasing wash volumes from 26 to 11, 6, 3.5, and 2 mL.<br />
For each <strong>of</strong> these wash conditions, half <strong>of</strong> the volume was<br />
pumped through the tips into the waste (Fig. 1, step 7) and<br />
the other half <strong>of</strong> the wash volume was pumped through the<br />
tip in the wash station (Fig. 1, step 9). Samples were arranged<br />
on one 96-well plate together with the calibration samples<br />
and blank samples in duplicates.<br />
Fluorescein Assay<br />
Detection limits <strong>of</strong> seven highly sensitive fluorescence dyes<br />
(Fluorescein sodium, Atto 550 NHS, CY3 NHS, Atto 647<br />
NHS, CY5 NHS, Alexa Fluor 647 and Mega 520 NHS) were<br />
determined in a microplate fluorescence reader (POLARstar<br />
OPTIMA; BMG Labtech, Offenburg, Germany). The lower<br />
limit <strong>of</strong> detection (LLOD) was calculated from the average<br />
signal <strong>of</strong> multiple measurements <strong>of</strong> a blank sample plus three<br />
standard deviations there<strong>of</strong>. Fluorescein sodium and Atto<br />
550 NHS were the most sensitive dyes with a limit <strong>of</strong> detection<br />
<strong>of</strong> 1.8 pg/mL. Fluorescein was selected <strong>for</strong> CO<br />
measurements.<br />
Fluorescein CO assays were per<strong>for</strong>med in a black 96-well<br />
plate (polypropylene, F-bottom, Greiner bio-one, St. Gallen,<br />
Switzerland). The fluorescein stock solution was made <strong>of</strong> 1-<br />
mg/mL fluorescein sodium (Merck, Darmstadt, Germany)<br />
in 50-mM Tris buffer (pH 8.5) supplemented with 0.01%<br />
Triton X-100. The fluorescein stock solution plate was filled<br />
with 140-mL stock solution per well. The recipient plate was<br />
filled with 150-mL buffer per well. Eleven calibration samples<br />
(1 pg/mL to 23 ng/mL in buffer) were prepared by serial<br />
dilution using disposable tips. Concentrations <strong>of</strong> fluorescein<br />
were determined after provocation <strong>of</strong> CO by fluorescence<br />
measurements in top reading mode with 50 flashes per well.<br />
The excitation wavelength was 490 5 nm, and the emission<br />
wavelength was 540 5 nm. The gain was adjusted such that<br />
the signal from the most concentrated calibration standard<br />
solution was about 95% <strong>of</strong> the maximum measurable signal.<br />
IgG Assay<br />
The IgG stock solution was made <strong>of</strong> 4.48 mg/mL IgG<br />
(Chrompure mouse IgG; Jackson Immuno Research, Wet<br />
Grove, PA) in phosphate buffered saline (PBS, pH 7.4)<br />
supplemented with 0.05% Triton X-100 (PBST). Eleven<br />
calibration samples (10 pg/mL to 50 ng/mL in buffer) were<br />
prepared by serial dilution using disposable tips.<br />
Concentrations <strong>of</strong> IgG were determined with an in-house<br />
sandwich ELISA, which had been optimized <strong>for</strong> sensitivity.<br />
ELISA plates (Maxisorp; Nunc Immuno, Roskilde, Denmark)<br />
were coated with capture antibody (goat anti-mouse<br />
F(ab’) 2 IgG; Jackson Immuno Research, Wet Grove, PA)<br />
at 1 mg/mL in coating buffer (10 mM sodium phosphate,<br />
250 mM NaCl, pH 7.6) <strong>for</strong> 16 h at 4 C. After removal <strong>of</strong><br />
the coating solution, wells were blocked with StartingBlock<br />
PBS (Pierce, Rock<strong>for</strong>d, IL) <strong>for</strong> 20 min at room temperature,<br />
followed by three washing steps with PBST.<br />
After provocation <strong>of</strong> CO, the plate was incubated <strong>for</strong> 1 h<br />
at 37 C. The analyte solution was discarded carefully to prevent<br />
cross-contamination. The plate was washed twice with<br />
PBST. Subsequently, detection antibody (HRP-conjugated<br />
goat anti-mouse IgG, Jackson Immuno Research; 1.6 mg/<br />
mL in StartingBlock T20; Pierce, Rock<strong>for</strong>d, IL) was added<br />
and incubated <strong>for</strong> 30 min at 37 C. After washing the plate<br />
six times with PBST, the substrate solution (orthophenylenediamine<br />
in peroxide substrate buffer; Pierce, Rock<strong>for</strong>d, IL)<br />
was added. The enzyme reaction was stopped with 2 M<br />
H 2 SO 4 after incubation <strong>for</strong> 30 min at room temperature.<br />
Absorbances were read in a microplate reader (POLARstar<br />
OPTIMA; BMG Labtech) using the 490-10 absorbance filter<br />
and 50 flashes per well. Plates were washed using a plate<br />
washer (Skan Washer 300, Version B; Molecular Devices,<br />
Bucher Biotec, Basel, Switzerland).<br />
HBsAg Assay<br />
HBsAg stock solution (32.9 mg/mL) was prepared by<br />
diluting recombinant HBsAg (ayw) (Genovac, Freiburg,<br />
Germany) in PBST. Nine calibration samples (15 pg/mL to<br />
6 ng/mL in buffer) were prepared by serial dilution using<br />
disposable tips.<br />
A commercial assay <strong>for</strong> the detection <strong>of</strong> HBsAg (Enzygnost<br />
HBsAg 5.0 kit; Dade Behring, Deerfield, IL) was used.<br />
This assay is semiquantitative but was trans<strong>for</strong>med to a quantitative<br />
assay by using a standard curve. The kit contains<br />
a precoated and preblocked assay plate, which was used<br />
directly <strong>for</strong> the assay.<br />
After provocation <strong>of</strong> CO, the HBsAg assay plate was<br />
incubated <strong>for</strong> 1 h at 37 C. The analyte solution was<br />
4 JALA XXXX 2010
ARTICLE IN PRESS<br />
Original Report<br />
discarded carefully to prevent cross-contamination. The<br />
plate was washed twice with PBST. The detection antibody<br />
(biotinylated monoclonal mouse anti-HBsAg) was incubated<br />
<strong>for</strong> 30 min at 37 C. After washing the plate four<br />
times with PBST, the streptavidin-HRPO conjugate was<br />
added and incubated <strong>for</strong> 30 min at 37 C. After a further<br />
washing step (five times with PBST), the substrate solution<br />
(1-Step ultra TMB; Pierce, Rock<strong>for</strong>d, IL) was added. The<br />
reaction was stopped with 2 M H 2 SO 4 after incubation <strong>for</strong><br />
30 min at room temperature in the dark. Absorbances were<br />
read in a microplate reader (POLARstar OPTIMA, BMG<br />
Labtech) using the 450-10 absorbance filter and 50 flashes<br />
per well.<br />
Quantification<br />
Calibration. A four-parameter logistic (4PL) function was<br />
fitted to the signal S (absorbance or fluorescence) <strong>of</strong> the calibration<br />
standards measured at different concentrations. The<br />
logistic function is given by eq 1:<br />
S ¼ fðlogðbÞÞ ¼ S Bottom þ S Top S Bottom<br />
ð1Þ<br />
1 þ 10 ðlogEC50 logðbÞÞh<br />
with b being the concentration <strong>of</strong> the analyte (ng/mL), S the<br />
signal (OD or fluorescence), S Bottom the signal at an analyte<br />
concentration <strong>of</strong> 0 ng/mL, S Top the signal at analyte<br />
saturation, EC50 the effective concentration <strong>of</strong> the analyte<br />
to reach 50% <strong>of</strong> the signal, and h describing the slope <strong>of</strong><br />
the curve. GraphPad Prism 5.0 was used to calculate the<br />
4PL fits. Sample concentrations were determined from the<br />
4PL fit using eq 1. To determine the LLOD and the lower<br />
limit <strong>of</strong> quantification (LLOQ), a blank (the respective<br />
assay buffer) was measured six times. The LLOD was<br />
calculated from the average signal <strong>of</strong> the six measurements<br />
plus three standard deviations there<strong>of</strong>. The LLOQ was<br />
defined as five times the limit <strong>of</strong> detection. The upper limit<br />
<strong>of</strong> quantification (ULOQ) was defined as the highest<br />
measurable value that showed a coefficient <strong>of</strong> variation<br />
(CV) smaller than 20%.<br />
CO quantification. The CO was quantified as the ratio <strong>of</strong> the<br />
concentration b n <strong>of</strong> the analyte, which is detected in an analyte-free<br />
solution after measurement <strong>of</strong> a sample with a high<br />
analyte concentration b 0 (eq 2). 2 In our case, b 0 corresponds<br />
to the analyte stock concentration used to provoke CO.<br />
CO ¼ b n<br />
b 0<br />
As CO values may be very small, pCO was defined as the<br />
negative logarithm <strong>of</strong> CO.<br />
<br />
bn<br />
pCO ¼ log 10 ð3Þ<br />
b 0<br />
ð2Þ<br />
RESULTS<br />
Selection <strong>of</strong> Analytes<br />
Three analytes were selected as models <strong>for</strong> studying CO<br />
and <strong>for</strong> the development <strong>of</strong> standardized test procedures.<br />
Fluorescein is a fluorophore with a molecular mass <strong>of</strong><br />
376 Da and carries two negative charges. Fluorescein shows<br />
a very strong fluorescence intensity, and thus an extremely<br />
low CO (pCO ¼ 8.8) can be detected. Measurement <strong>of</strong> fluorescein<br />
CO requires only a fluorescence reader and can thus<br />
be carried out in many laboratories. IgG is not only<br />
a clinically relevant analyte but is also widely used in pharmaceutical<br />
and biotechnological industries where mid- to<br />
high-throughput screenings are used, <strong>for</strong> example, <strong>for</strong> target<br />
identification. IgG has a molecular mass <strong>of</strong> 150,000 Da. As<br />
the third model, we selected HBsAg. HBsAg is composed<br />
<strong>of</strong> particles with a diameter <strong>of</strong> 17e22 nm, <strong>for</strong>med by a lipid<br />
bilayer into which the S protein <strong>of</strong> hepatitis B virus is integrated.<br />
HBsAg particles can be found in serum from patients<br />
infected with hepatitis B virus. HBsAg particles are also<br />
recombinantly produced in yeast and are used as a prophylactic<br />
vaccine against hepatitis B. Recombinantly produced<br />
HBsAg is noninfectious and nontoxic and can thus be used<br />
under standard laboratory safety conditions. Both IgG and<br />
HBsAg were quantified by ELISA.<br />
Per<strong>for</strong>mance Characteristics <strong>of</strong> Analyte-Specific<br />
Detection Assays<br />
The per<strong>for</strong>mance characteristics <strong>of</strong> the analysis methods<br />
<strong>for</strong> quantifying fluorescein, IgG, and HBsAg are given in<br />
Table 2. The lower limits <strong>of</strong> detection were between 1.8<br />
and 40 pg/mL. Intra-assay CVs were determined by 10 measurements<br />
<strong>of</strong> the same sample. The inter-assay CVs were<br />
determined in six independent assays.<br />
Establishment <strong>of</strong> a <strong>Standard</strong>ized CO Provocation<br />
Procedure<br />
The CO was provoked in a three-step procedure. First, the<br />
tips were exposed to highly concentrated analyte solutions to<br />
allow adsorption <strong>of</strong> the analytes to the tips. Thereafter, the<br />
tips were washed in a standard washing procedure and finally<br />
the tips were exposed to an analyte-free buffer solution to<br />
allow CO <strong>of</strong> remaining analyte to occur. This procedure replicates<br />
the situation where a sample with high analyte concentration<br />
is followed by a sample lacking analyte, which<br />
may lead to a false-positive result <strong>for</strong> the second sample.<br />
Sample-to-sample CO is not only influenced by the type <strong>of</strong><br />
analyte and its concentration, but also by multiple parameters<br />
<strong>of</strong> the pipetting procedure. The immersion depth during<br />
aspiration determines the area <strong>of</strong> the outer surface <strong>of</strong> the tip,<br />
which comes into contact with the analyte. The volume <strong>of</strong> aspirated<br />
analyte determines the area <strong>of</strong> the inner surface,<br />
which is covered by analyte solution. After aspiration, the<br />
tip is retracted out <strong>of</strong> the solution and positioned over the<br />
target dispension position. This transfer takes some time,<br />
which adds to the contact time <strong>of</strong> the analyte with the inner<br />
JALA XXXX 2010 5
ARTICLE IN PRESS<br />
Original Report<br />
Table 2. Per<strong>for</strong>mance characteristics <strong>of</strong> analysis methods<br />
Parameters<br />
Fluorescein<br />
assay IgG assay HBsAg assay<br />
LLOD (pg/mL) 1.8 13 40<br />
LLOQ (pg/mL) 9 65 200<br />
ULOQ (ng/mL) 10 50 5<br />
Accuracy (CV) 3.8e10.1% 4.3e23.3% 8.2e16.0%<br />
Intra-assay CV 2.1e8.3% 2.9e10.6% 6.0e14.5%<br />
Inter-assay CV 1.9e10.2% 2.0e11.0% 4.8e22.6%<br />
Max detectable<br />
pCO in CO<br />
procedure a 8.8 5.5 5.9<br />
IgG ¼ immunoglobulin G; HBsAg ¼ hepatitis B surface antigen; LLOD ¼ lower limit <strong>of</strong> detection;<br />
LLOQ ¼ lower limit <strong>of</strong> quantification; ULOQ ¼ upper limit <strong>of</strong> quantification; CV ¼ coefficient <strong>of</strong><br />
variation; CO ¼ carry over; pCO ¼ negative logarithm <strong>of</strong> CO. a Calculated with analyte concentrations<br />
as used in this study.<br />
surface <strong>of</strong> the tips. The times needed <strong>for</strong> aspiration and dispension<br />
are usually very short compared with the transfer<br />
time and aspiration, and dispension speeds were kept constant<br />
throughout this study. In liquid-handling systems, the<br />
retraction speeds <strong>of</strong> the tips out <strong>of</strong> the solution are optimized<br />
to avoid drop <strong>for</strong>mation; there<strong>for</strong>e, standard settings <strong>of</strong> the<br />
liquid-handling system were used.<br />
We chose conditions in which CO was likely to occur<br />
(large aspiration volume, long contact time) but which, nonetheless,<br />
were within the range used in the common practice.<br />
A washing step was also integrated, as minimal washing will<br />
always have to be used with fixed tips. After prescreening <strong>of</strong><br />
parameters and conditions, a test procedure was defined<br />
(Fig. 1) and its per<strong>for</strong>mance tested.<br />
A highly concentrated stock solution <strong>of</strong> analyte was aspirated<br />
and kept in the tips <strong>for</strong> 5 s. This was estimated to be the<br />
maximum contact time <strong>of</strong> analyte solution and tip between<br />
aspiration and dispension. Depending on worktable layout<br />
and parallel processes, it can take a few seconds to reposition<br />
the tips from start to target positions. To provoke potential<br />
CO from the outer surface, tips were kept immersed in the<br />
stock solutions <strong>for</strong> 5 s.<br />
In initial experiments, we observed, as expected, that the<br />
washing procedure can have a strong influence on the CO.<br />
However, the influence differed between analytes and tip<br />
coatings. We there<strong>for</strong>e decided to integrate the determination<br />
<strong>of</strong> CO <strong>for</strong> five wash conditions into one CO measurement<br />
run. The conditions differed by the volume <strong>of</strong> wash solution<br />
used. During the first CO measurement, the tips were washed<br />
with 26 mL, followed by 11 mL <strong>for</strong> the second measurement,<br />
6 mL <strong>for</strong> the third, 3.5 mL <strong>for</strong> the fourth, and 2 mL <strong>for</strong> the<br />
fifth measurement. At the end <strong>of</strong> each CO measurement,<br />
the tips were thoroughly washed with 55 mL. The latter<br />
extensive wash step was shown to remove remaining analyte<br />
to levels, which had no influence on the subsequent CO measurement<br />
with the same tip (data not shown).<br />
For measurement <strong>of</strong> CO, the tips were immersed in analyte-free<br />
buffer solution. A slightly higher volume <strong>of</strong> buffer<br />
was aspirated compared with the aspiration <strong>of</strong> the analyte<br />
stock solution. The additional volume <strong>of</strong> 1 mL, which led<br />
to a 2 mm higher liquid level in the tips, ensured that the liquid<br />
level <strong>of</strong> buffer was higher than the liquid level <strong>of</strong> the analyte<br />
stock solution. Potential influences <strong>of</strong> surface properties<br />
<strong>of</strong> coatings and viscosity <strong>of</strong> stock solutions should thus be<br />
excluded.<br />
In the final set-up, four fixed tips were used in parallel and<br />
the series <strong>of</strong> five CO measurements with the different wash<br />
volumes was repeated three times. Accordingly, in one run<br />
60 CO values were obtained. The procedure to provoke<br />
CO, including the washing steps, took 30 min.<br />
CO <strong>of</strong> Fluorescein<br />
A high fluorescein stock concentration (1 mg/mL) was<br />
used to maximize potential CO. After a standard wash procedure<br />
(3.5 mL wash volume), a fluorescein concentration<br />
<strong>of</strong> 0.2 ng/mL was detected <strong>for</strong> fluoropolymer FP1-coated<br />
tips, which results in a pCO <strong>of</strong> 6.63. This corresponds to<br />
aCO<strong>of</strong>2 10 5 %. The intra-assay precision <strong>of</strong> the CO<br />
measurement was calculated from the pCO values <strong>of</strong> 20 determinations<br />
and showed a %CV <strong>of</strong> 0.82 (Fig. 2A). An interassay<br />
variation <strong>of</strong> 0.54% was determined from five<br />
independent assays. Inter-assay variation did not differ between<br />
wash volumes (Fig. 2B). This demonstrates that the<br />
procedure allows precise and reproducible quantification <strong>of</strong><br />
fluorescein CO.<br />
A comparison <strong>of</strong> fluorescein CO with uncoated stainless<br />
steel (USS) tips and nine different coatings revealed similar<br />
pCO values <strong>of</strong> 6.5e7.0 <strong>for</strong> uncoated tips and tips coated with<br />
fluoropolymers (FP1eFP3), ION, SSG, and silicone resins<br />
(methyl-modified silicone resin [MSR], propyl-modified silicone<br />
resin [PSR], and hexadecyl-modified silicone resin<br />
[HSR]). Titanium dioxide-coated (TDC) tips showed 4- to<br />
13-fold higher CO (pCO ¼ 5.9e6.2) (Fig. 3). The CO with<br />
some coatings could be improved with higher wash volumes,<br />
whereas <strong>for</strong> others CO was independent <strong>of</strong> wash volumes.<br />
The data also allow a comparison <strong>of</strong> robustness <strong>of</strong> the coating<br />
procedure; <strong>for</strong> example, the variation <strong>of</strong> pCO values<br />
between tips was lower <strong>for</strong> fluoropolymer FP1-coated tips<br />
(%CV ¼ 0.71, n ¼ 4) compared with SSG-coated tips<br />
(%CV ¼ 1.68, n ¼ 4) and TDC tips (%CV ¼ 1.43, n ¼ 4).<br />
CO <strong>of</strong> IgG<br />
The test procedure was able to provoke a CO <strong>of</strong> IgG with<br />
a pCO value <strong>of</strong> 3.44 (Fig. 4). This corresponds to an IgG<br />
concentration in the recipient sample <strong>of</strong> 1.6 ng/mL and<br />
a CO <strong>of</strong> 3.6 10 2 %. The intra-assay precision <strong>of</strong> the CO<br />
measurement was calculated from pCO values <strong>of</strong> 20 determinations<br />
and showed a CV <strong>of</strong> 2.9% (Fig. 4A). An inter-assay<br />
variation <strong>of</strong> 5.8% was determined from four independent<br />
assays, and there was no difference in inter-assay variation<br />
between wash volumes (Fig. 4B). The difference in CO<br />
between tips was small; <strong>for</strong> example, fluoropolymer FP1-<br />
coated tips showed a CV <strong>of</strong> 0.94% (n ¼ 4). The intra- and<br />
6 JALA XXXX 2010
ARTICLE IN PRESS<br />
Original Report<br />
Figure 2. Intra- and inter-assay variability <strong>of</strong> the fluorescein carry over measurements. (A) Carry over was measured 20 times<br />
within one assay with fluorpolymer FP1-coated tips; pCO values are shown with standard deviation <strong>of</strong> the mean. Wash volume 3.5 mL. (B)<br />
Fluorescein carry over from four fluorpolymer FP1-coated tips was measured in five independent assays with five wash intensities each.<br />
inter-assay precision <strong>for</strong> the IgG CO was larger than that<br />
observed <strong>for</strong> fluorescein. This is most likely caused by the<br />
higher variability in the IgG quantification by ELISA compared<br />
with the direct fluorescence measurement <strong>for</strong> fluorescein.<br />
The data demonstrate that the procedure also allows<br />
precise and reproducible quantification <strong>of</strong> IgG CO.<br />
The CO values <strong>of</strong> tips with different coatings revealed less<br />
than 10-fold differences between coatings (Fig. 5). USS tips<br />
had the lowest pCO values (about 3), and pCO values <strong>of</strong><br />
up to four were obtained with MSR and HSR coatings. As<br />
seen <strong>for</strong> fluorescein, some coatings showed improvement <strong>of</strong><br />
CO with increased wash volumes, others not.<br />
CO <strong>of</strong> HBsAg<br />
For HBsAg, a pCO value <strong>of</strong> 4.22 was determined using<br />
SSG-coated tips. This corresponds to an HBsAg concentration<br />
after CO <strong>of</strong> 2.0 ng/mL and a CO <strong>of</strong> 6 10 3 %. The intra-assay<br />
precision was 3.4% (n ¼ 20), the inter-assay<br />
precision was 5.8% (n ¼ 3) (Fig. 6). Between-tip variation<br />
was low; <strong>for</strong> example, fluoropolymer FP1-coated tips showed<br />
Figure 3. Carry over <strong>of</strong> fluorescein with different tip coatings. Each coating was tested with the standard test procedure measuring<br />
carry over at five wash intensities. Fluorescein stock concentration was 1 mg/mL. Box plots show the median <strong>of</strong> 12 pCO values (four<br />
tips measured in triplicate) with 25th to 75th percentiles. Whiskers mark minimum and maximum values.<br />
JALA XXXX 2010 7
ARTICLE IN PRESS<br />
Original Report<br />
Figure 4. Intra- and inter-assay variability <strong>of</strong> IgG carry over measurements. (A) Carry over was measured 20 times within one<br />
assay with fluorpolymer FP1-coated tips; pCO values are shown with standard deviation <strong>of</strong> the mean. Wash volume 3.5 mL. (B) IgG carry<br />
over from four fluorpolymer FP1-coated tips was measured in four independent assays with five wash intensities each.<br />
a CV <strong>of</strong> 1.8% (n ¼ 4). The data confirm that the procedure is<br />
also suited to quantifying the CO <strong>of</strong> HBsAg.<br />
As seen <strong>for</strong> IgG, CO with different coatings differed by<br />
less than 10-fold. Similar CO values (pCO <strong>of</strong> about 5) were<br />
observed <strong>for</strong> USS tips, and all the coatings except SSG and<br />
PSR showed pCO values <strong>of</strong> around 4.2 (Fig. 7).<br />
DISCUSSION<br />
Sample-to-sample CO describes the phenomenon <strong>of</strong> contamination<br />
<strong>of</strong> a sample from the preceding sample. In general,<br />
the CO during pipetting in liquid-handling systems can be<br />
caused by liquid remaining on the tip surface after dispensing<br />
or by adsorption <strong>of</strong> analyte on the tip surface. Liquid<br />
remaining on the tip surface should be removed efficiently<br />
during washing. There<strong>for</strong>e, sample-to-sample CO is most<br />
likely caused by adsorption <strong>of</strong> analytes to tip surfaces during<br />
aspiration <strong>of</strong> a sample with a more or less high analyte concentration<br />
and desorption <strong>of</strong> the analyte into a subsequent<br />
sample. We there<strong>for</strong>e developed a procedure in which tips<br />
are first exposed to a solution with high analyte levels and<br />
Figure 5. Carry over <strong>of</strong> IgG with different tip coatings. Each coating was tested with the standard test procedure measuring carry<br />
over at five wash intensities. IgG stock concentration was 4.48 mg/mL. Box plots show the median <strong>of</strong> 12 pCO values (four tips measured in<br />
triplicate) with 25th to 75th percentiles. Whiskers mark minimum and maximum values.<br />
8 JALA XXXX 2010
ARTICLE IN PRESS<br />
Original Report<br />
Figure 6. Intra-and inter-assay variability <strong>of</strong> HBsAg carry over measurements. (A) Carry over was measured 20 times within<br />
one assay with SSG-coated tips; pCO values are shown with standard deviation <strong>of</strong> the mean. Wash volume 3.5 mL. (B) HBsAg carry over<br />
from fluorpolymer FP1-coated tips was measured in three independent assays with five wash intensities each.<br />
CO is measured in a subsequent recipient sample. The use <strong>of</strong><br />
a blank sample as the recipient sample simplifies the procedure,<br />
as each transfer <strong>of</strong> analyte from a high sample to<br />
a blank sample gives one value <strong>for</strong> the CO, whereas in other<br />
procedures measurement <strong>of</strong> 4, 6,7 6, 2 or even 10 samples 3 is<br />
needed to achieve one CO value. Furthermore, the use <strong>of</strong><br />
a blank sample as the recipient sample instead <strong>of</strong> a sample<br />
with a low analyte concentration broadens the range within<br />
which CO can be measured and eliminates the influence <strong>of</strong><br />
assay precision, which can pr<strong>of</strong>oundly complicate CO analysis.<br />
In a blank sample as the recipient, the CO is<br />
unequivocally detected when the concentration in the recipient<br />
sample is above the LLOD. Nonetheless, in cases where it<br />
is not possible to obtain analyte-free samples, samples with<br />
low analyte concentrations can also be tested with the procedure<br />
presented here.<br />
We routinely included five different wash volumes and repeated<br />
the measurements three times with four tips. However,<br />
several tip coatings did not show a significant<br />
influence from the wash volumes. In such cases, the CO measurement<br />
procedures can be simplified to the analysis <strong>of</strong> triplicate<br />
measurement <strong>of</strong> four tips with one wash volume, which<br />
Figure 7. Carry over <strong>of</strong> HBsAg with different tip coatings. Each coating was tested with the standard test procedure measuring<br />
carry over at five wash intensities. HBsAg stock concentration was 32.9 mg/mL. Box plots show the median <strong>of</strong> 12 pCO values (four tips<br />
measured in triplicate) with 25th to 75th percentiles. Whiskers mark minimum and maximum values.<br />
JALA XXXX 2010 9
ARTICLE IN PRESS<br />
Original Report<br />
should give sufficient statistical power <strong>for</strong> quantification <strong>of</strong><br />
CO.<br />
The standardized CO test procedures are characterized by<br />
intra- and inter-assay precisions smaller than 4% and 6%, respectively,<br />
and thus allow precise quantification <strong>of</strong> CO. The<br />
time needed to provoke CO (triplicate measurement <strong>of</strong> five<br />
washing conditions) was 30 min.<br />
The suitability <strong>of</strong> the CO procedures was tested by measuring<br />
the influence <strong>of</strong> tip coatings on CO. Fluoropolymers,<br />
ION, SSG, titanium dioxide, and different types <strong>of</strong> silicone<br />
resin coatings cover a broad range <strong>of</strong> surface properties.<br />
Surprisingly, only small effects on CO were observed. For<br />
fluorescein and HBsAg, uncoated steel tips per<strong>for</strong>med as well<br />
as the best coatings while <strong>for</strong> IgG uncoated steel tips were<br />
inferior to most coatings. However, the small differences<br />
(less than 10-fold) do not suggest a relevant improvement<br />
in CO when these coatings are used. It should be noted that<br />
the main issues <strong>for</strong> the use <strong>of</strong> coatings are the improved pipetting<br />
characteristics (e.g., dispensing behavior <strong>for</strong> optimized<br />
pipetting precision, water drop-<strong>of</strong>f), the protection<br />
<strong>of</strong> the steel against aggressive solutions, the <strong>for</strong>mation <strong>of</strong><br />
a diffusion barrier against heavy metal ions from the steel,<br />
and surface tailoring <strong>for</strong> special applications (e.g., blood or<br />
food analysis).<br />
The CO procedures were adapted to the liquid-handling<br />
systems from Hamilton and Sias and resulted in comparable<br />
CO values. This shows that the CO procedures can be<br />
transferred to liquid-handling systems with different pipetting<br />
principles (air displacement, system fluid) and different<br />
wash stations.<br />
CONCLUSIONS<br />
<strong>Test</strong> procedures were developed in which the CO <strong>of</strong> analytes<br />
from samples with high analyte concentrations to analytefree<br />
samples is provoked. The procedures were validated with<br />
the model substances fluorescein, IgG, and HBsAg and allow<br />
reliable and precise quantification <strong>of</strong> CO. The procedures can<br />
be easily adapted to any liquid-handling system plat<strong>for</strong>m, to<br />
any tip geometry, and to any analyte <strong>for</strong> which a quantification<br />
assay is available.<br />
Furthermore, we are currently investigating the use <strong>of</strong> the<br />
standardized test procedures to optimize washing conditions.<br />
Preliminary data show that very short washing steps using<br />
a decontamination solution can substantially lower CO (Iten<br />
et al., manuscript in preparation). This indicates that fixed<br />
reusable tips can potentially be used <strong>for</strong> a wider variety <strong>of</strong><br />
assays than in current practice.<br />
ACKNOWLEDGMENTS<br />
The project was initiated by <strong>Toolpoint</strong> <strong>for</strong> Life Science, Hombrechtikon,<br />
Switzerland and was financially supported by the Innovation Promotion<br />
Agency CTI <strong>of</strong> the Federal Office <strong>for</strong> Pr<strong>of</strong>essional Education and Technology,<br />
Switzerland (CTI 7627.2).<br />
Competing Interests Statement: The authors disclose the following: R. Beckbissinger<br />
and L. Oeltjen are employees <strong>of</strong> Hamilton Bonaduz AG. W. Ha¨lg<br />
and N. Ingenhoven are employees <strong>of</strong> Tecan Schweiz AG. A. Lehnert is an employee<br />
<strong>of</strong> Sias AG. T. Benthien is an employee <strong>of</strong> Surface Contacts GmbH.<br />
REFERENCES<br />
1. Frégeau, C. J.; Lett, C. M.; Elliott, J.; Yensen, C.; Fourney, R. M.<br />
Automated processing <strong>of</strong> <strong>for</strong>ensic casework samples using robotic workstations<br />
equipped with nondisposable tips: contamination prevention.<br />
J. Forensic Sci. 2008, 53, 632e651.<br />
2. Haeckel, R. Proposals <strong>for</strong> the description and measurement <strong>of</strong> carryover<br />
effects in clinical chemistry (Recommendations 1991). Pure Appl.<br />
Chem. 1991, 63, 301e306.<br />
3. Clinical and Laboratory <strong>Standard</strong>s Institute (CLSI). Preliminary<br />
evaluation <strong>of</strong> quantitative clinical laboratory measurements procedures.<br />
CLSI document EP10-A3, CLSI, 940 West Valley Road, Wayne, PA,<br />
2006; Vol. 26, p. 1e68.<br />
4. Broughton, P. M.; Gowenlock, A. H.; McCormack, J. J.; Neill, D. W. A<br />
revised scheme <strong>for</strong> the evaluation <strong>of</strong> automatic instruments <strong>for</strong> use in<br />
clinical chemistry. Ann. Clin. Biochem. 1974, 11, 207e218.<br />
5. Horowitz, G. L.; Zaman, Z.; Blanckaert, N. J. C.; Chan, D. W.; et al.<br />
Modular analytics: a new approach to automation in the clinical laboratory.<br />
J. Autom. Methods Manage. Chem. 2005, 1, 8e25.<br />
6. Broughton, P. M. G. Carry-over in automatic analysers. J. Autom.<br />
Chem. 1984, 6, 94e95.<br />
7. Dixon, K. A theoretical study <strong>of</strong> carryover in selective access analysers.<br />
Ann. Clin. Biochem. 1990, 27, 139e142.<br />
8. Armburster, D. A.; Alexander, D. B. Sample to sample carryover:<br />
a source <strong>of</strong> analytical laboratory error and its relevance to integrated<br />
clinical chemistry/immunoassay systems. Clin. Chim. Acta 2006, 373,<br />
37e43.<br />
9. Pauli, D.; Seyfarth, M.; Dibbelt, L. The Abbott Architect c8000: analytical<br />
per<strong>for</strong>mance and productivity characteristics <strong>of</strong> a new analyzer<br />
applied to general chemistry testing. Clin. Lab. 2005, 51, 31e41.<br />
10. Redondo, F. L.; Bermudez, P.; Cocco, C.; et al. Evaluation <strong>of</strong> Cobas Integra<br />
800 under simulated routine conditions in six laboratories. Clin.<br />
Chem. Lab. Med. 2003, 41, 365e381.<br />
11. Muser, J.; Bienvenu, J.; Blanckaert, N.; et al. Inter-laboratory evaluation<br />
<strong>of</strong> the Cobas Integra 400 analytical system. Clin. Chem. Lab.<br />
Med. 2001, 39, 539e559.<br />
12. Mora-Brugue´s, J.; Gascón-Roche, N.; Rodríguez-Espinosa, J.; Cortés-<br />
Rius, M.; González-Sastre, F. Evaluation <strong>of</strong> Ciba corning ACS:180<br />
automated immunoassay system. Clin. Chem. 1994, 40, 407e410.<br />
13. Schlain, B.; Frush, H.; Pennington, C.; Osikowicz, G.; Ford, K. Twostage<br />
procedure <strong>for</strong> evaluating interassay carryover on random-access<br />
instruments. Clin. Chem. 1996, 42, 725e731.<br />
14. Brenna, S.; Prencipe, L. Axon clinical chemistry analyzer evaluated<br />
according to ECCLS protocol. Clin. Chem. 1992, 38, 2096e2100.<br />
15. Frégeau, C. J.; Yensen, C.; Elliott, J.; Fourney, R. M. Optimized configuration<br />
<strong>of</strong> fixed-tip robotic liquid-handling stations <strong>for</strong> the elimination<br />
<strong>of</strong> biological sample cross-contamination. J. Assoc. Lab. Autom. 2007,<br />
12, 339e354.<br />
10 JALA XXXX 2010