8420/21/22-01 MEMORY HiLOGGER - Hioki
8420/21/22-01 MEMORY HiLOGGER - Hioki
8420/21/22-01 MEMORY HiLOGGER - Hioki

You also want an ePaper? Increase the reach of your titles
YUMPU automatically turns print PDFs into web optimized ePapers that Google loves.
Temperature/Analog, all inputs are isolated<br />
-Measurement Functions-<br />
2<br />
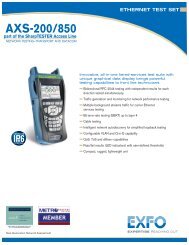
Universal isolated temperature, voltage and pulse inputs<br />
Universal isolated temperature, voltage and pulse<br />
inputs, Universal measurement inputs, voltage,<br />
temperature (thermocouple and Pt inputs *1 ) and<br />
humidity *1,2 can be selected for each channel. In<br />
addition, four input channels are provided for<br />
measuring pulse inputs (totalization/rotation count)<br />
simultaneously with voltage, temperature and<br />
humidity. In addition to channel-to-channel input<br />
isolation, the PC connection interface is completely<br />
isolated from the measurement terminals. Shock hazard<br />
is minimized even when thermocouples and voltage<br />
inputs are measured at the same time.<br />
(Maximum rated voltage above ground is 30 V rms or 60 V DC.)<br />
*1<br />
Pt and humidity measurement inputs are supported only by the <strong>8420</strong><br />
and 84<strong>21</strong>.<br />
*2<br />
Requires the 9681 or 9653 humidity sensor (both optional).<br />
Sample multiple channels at high speeds<br />
Real-Time Save to High-Capacity Memory Card<br />
Measurement data can be automatically saved to a PC<br />
Card. Binary (real-time) and text (post-measurement)<br />
formats can be selected. High-capacity Flash ATA<br />
cards up to 528 MB can be used for continuous longterm<br />
recording. Choose binary in normal use.This<br />
recording method is linked to writing measurements in<br />
real time. The supplied Wv Waveform Viewer software<br />
can convert the data into text format on a PC.<br />
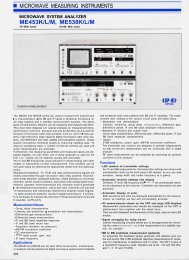
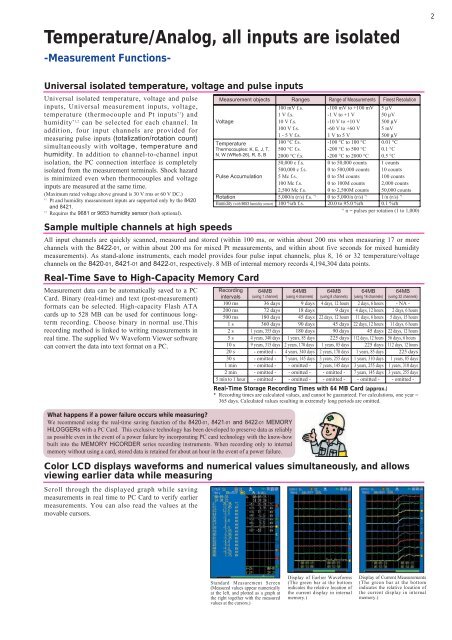
Color LCD displays waveforms and numerical values simultaneously, and allows<br />
viewing earlier data while measuring<br />
Scroll through the displayed graph while saving<br />
measurements in real time to PC Card to verify earlier<br />
measurements. You can also read the values at the<br />
movable cursors.<br />
Measurement objects Ranges Range of Measurements Finest Resolution<br />
100 mV f.s. -100 mV to +100 mV 5 µV<br />
1 V f.s. -1 V to +1 V 50 µV<br />
Voltage<br />
10 V f.s. -10 V to +10 V 500 µV<br />
100 V f.s. -60 V to +60 V 5 mV<br />
1 - 5 V f.s. 1 V to 5 V 500 µV<br />
Temperature<br />
100 °C f.s. -100 °C to 100 °C 0.<strong>01</strong> °C<br />
Thermocouples: K, E, J, T, 500 °C f.s. -200 °C to 500 °C 0.1 °C<br />
N, W (WRe5-26), R, S, B 2000 °C f.s. -200 °C to 2000 °C 0.5 °C<br />
50,000 c f.s. 0 to 50,000 counts 1 counts<br />
500,000 c f.s. 0 to 500,000 counts 10 counts<br />
Pulse Accumulation 5 Mc f.s. 0 to 5M counts 100 counts<br />
100 Mc f.s. 0 to 100M counts 2,000 counts<br />
2,500 Mc f.s. 0 to 2,500M counts 50,000 counts<br />
Rotation 5,000/n (r/s) f.s. *1 0 to 5,000/n (r/s) *1 1/n (r/s) *1<br />
Humidity (with 9653 humidity sensor) 100 %rh f.s. 20.0 to 95.0 %rh 0.1 %rh<br />
*1<br />
n = pulses per rotation (1 to 1,000)<br />
All input channels are quickly scanned, measured and stored (within 100 ms, or within about 200 ms when measuring 17 or more<br />
channels with the 84<strong>22</strong>-<strong>01</strong>, or within about 200 ms for mixed Pt measurements, and within about five seconds for mixed humidity<br />
measurements). As stand-alone instruments, each model provides four pulse input channels, plus 8, 16 or 32 temperature/voltage<br />
channels on the <strong>8420</strong>-<strong>01</strong>, 84<strong>21</strong>-<strong>01</strong> and 84<strong>22</strong>-<strong>01</strong>, respectively. 8 MB of internal memory records 4,194,304 data points.<br />
What happens if a power failure occurs while measuring?<br />
We recommend using the real-time saving function of the <strong>8420</strong>-<strong>01</strong>, 84<strong>21</strong>-<strong>01</strong> and 84<strong>22</strong>-<strong>01</strong> <strong>MEMORY</strong><br />
<strong>HiLOGGER</strong>s with a PC Card. This exclusive technology has been developed to preserve data as reliably<br />
as possible even in the event of a power failure by incorporating PC card technology with the know-how<br />
built into the <strong>MEMORY</strong> HiCORDER series recording instruments. When recording only to internal<br />
memory without using a card, stored data is retained for about an hour in the event of a power failure.<br />
Recording<br />
intervals<br />
64MB<br />
(using 1 channel)<br />
64MB<br />
(using 4 channels)<br />
64MB<br />
(using 8 channels)<br />
64MB<br />
(using 16 channels)<br />
64MB<br />
(using 32 channels)<br />
100 ms 36 days 9 days 4 days, 12 hours 2 days, 6 hours - NA -<br />
200 ms 72 days 18 days 9 days 4 days, 12 hours 2 days, 6 hours<br />
500 ms 180 days 45 days <strong>22</strong> days, 12 hours 11 days, 6 hours 5 days, 15 hours<br />
1 s 360 days 90 days 45 days <strong>22</strong> days, 12 hours 11 days, 6 hours<br />
2 s 1 years, 355 days 180 days 90 days 45 days <strong>22</strong> days, 12 hours<br />
5 s 4 years, 340 days 1 years, 85 days <strong>22</strong>5 days 112 days, 12 hours 56 days, 6 hours<br />
10 s 9 years, 315 days 2 years, 170 days 1 years, 85 days <strong>22</strong>5 days 112 days, 12 hours<br />
20 s - omitted - 4 years, 340 days 2 years, 170 days 1 years, 85 days <strong>22</strong>5 days<br />
30 s - omitted - 7 years, 145 days 3 years, 255 days 1 years, 310 days 1 years, 85 days<br />
1 min - omitted - - omitted - 7 years, 145 days 3 years, 255 days 1 years, 310 days<br />
2 min - omitted - - omitted - - omitted - 7 years, 145 days 3 years, 255 days<br />
5 min to 1 hour - omitted - - omitted - - omitted - - omitted - - omitted -<br />
Real-Time Storage Recording Times with 64 MB Card (approx.)<br />
* Recording times are calculated values, and cannot be guaranteed. For calculations, one year =<br />
365 days. Calculated values resulting in extremely long periods are omitted.<br />
Standard Measurement Screen<br />
(Measured values appear numerically<br />
at the left, and plotted as a graph at<br />
the right together with the measured<br />
values at the cursors.)<br />
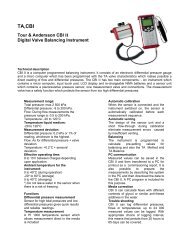
Display of Earlier Waveforms<br />
(The green bar at the bottom<br />
indicates the relative location of<br />
the current display in internal<br />
memory.)<br />
Display of Current Measurements<br />
(The green bar at the bottom<br />
indicates the relative location of<br />
the current display in internal<br />
memory.)