Section 2: The Maywood Community - The Lakota Group
Section 2: The Maywood Community - The Lakota Group
Section 2: The Maywood Community - The Lakota Group

Create successful ePaper yourself
Turn your PDF publications into a flip-book with our unique Google optimized e-Paper software.
<strong>Section</strong> 2: <strong>The</strong> <strong>Maywood</strong> <strong>Community</strong>
SECTION 2: <strong>The</strong> <strong>Maywood</strong> <strong>Community</strong><br />
AREA CONTEXT<br />
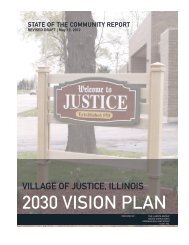
<strong>The</strong> Village of <strong>Maywood</strong> is a suburban community located 12 miles directly west of<br />
Downtown Chicago along Interstate 290 (Eisenhower Expressway). As an inner ring suburb<br />
in western Cook County, it is generally located near the geographic center of the Chicago<br />
metropolitan region.<br />
<strong>The</strong> Village is approximately bounded by 22nd Avenue on the west, Roosevelt Road on the<br />
south and the Des Plaines River and Cook County Forest Preserve (Thatcher Woods,<br />
<strong>Maywood</strong> Grove and G.A.R. Woods) on the east. <strong>The</strong> approximate northern boundary of<br />
the Village is the Union Pacific rail line, with a portion of the community extending further<br />
north just past Nichols Lane between Lake Street and North Avenue. (See Figure 2.1: Area<br />
Context.)<br />
<strong>The</strong> Village is a developed community of approximately 1,745 acres that had a population of<br />
26,987 in 2000. Although the community does contain multi-family housing, several<br />
commercial districts and industrial uses, single-family residential is its primary land use.<br />
Mature, developed suburban communities of similar size are located adjacent to <strong>Maywood</strong>,<br />
including Melrose Park, Bellwood, Broadview, Forest Park and River Forest.<br />
Commercial districts are located primarily along Lake Street, First Avenue, Fifth Avenue,<br />
Madison Street and Roosevelt Road. Industrial uses are located along St. Charles Road,<br />
<strong>Maywood</strong> Drive and the northeast quadrant of the First Avenue and Interstate 290<br />
interchange.<br />
Overall, <strong>Maywood</strong> is strategically located near major transportation routes, freight and<br />
commuter rail lines and major airports. <strong>The</strong> Des Plaines River and County Forest Preserve<br />
provide a natural open space along the community’s eastern edge.<br />
COMMUNITY BACKGROUND<br />
According to the 2002 <strong>Maywood</strong> <strong>Community</strong> Guide, <strong>Maywood</strong> was founded by Colonel<br />
William Nichols in 1869 and named for May Nichols, his deceased daughter. Colonel<br />
Nichols was a State Senator from Vermont who served in the Civil War. He formed the<br />
<strong>Maywood</strong> Company, which developed the Village. It was incorporated in 1881 under the<br />
General Cities and Villages Act of 1872.<br />
<strong>The</strong> Nichols home was located at the northwest corner of Fifth Avenue and Second Street<br />
(now Oak Street), and was demolished after World War I. <strong>The</strong> original plot of <strong>Maywood</strong> was<br />
approximately two miles north and south and one-half mile east and west along the western<br />
bank of the Des Plaines River with the Chicago Northwestern Railroad running through the<br />
center. <strong>The</strong> area south of the tracks was a farm owned by M.C. Niles of Oak Park, who sold<br />
it to the <strong>Maywood</strong> Company for $100 an acre. <strong>The</strong> farmhouse still stands at 104 Oak Street<br />
(presently the Way Back Inn).<br />
MAYWOOD COMPREHENSIVE PLAN Page 2.1
<strong>Maywood</strong> continued to grow through the late 1800’s into the turn of the century. In the<br />
early 1900’s <strong>Maywood</strong>’s expanded city limits were set and maintained as they are today.<br />
During this time <strong>Maywood</strong>’s population continued to grow until about 1930. Early settlers<br />
included Western and Eastern Europeans, African-Americans and eventually Hispanics.<br />
Throughout the mid 1900’s <strong>Maywood</strong>’s population continued to change until the 1970’s<br />
when it became predominantly African-American as it remains today.<br />
MAYWOOD COMPREHENSIVE PLAN Page 2.2
MAYWOOD COMPREHENSIVE PLAN Page 2.4
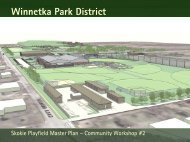
HISTORIC RESOURCES<br />
<strong>Maywood</strong>’s historic resources and structures represent elements of the community’s past<br />
that should be preserved when feasible. Structures of historical significance contribute to the<br />
fabric of the community and provide an image and identity of an earlier era. <strong>The</strong>se structures<br />
typically display architectural styles and features rarely seen in today’s modern building styles.<br />
Many of these early homes and buildings still stand today. Several have been listed on the<br />
National Register of Historic Places and are noted below. (See also Figure 2.2: Historic<br />
Properties.). <strong>The</strong> National Register is the nation’s official list of places recognized for their<br />
historical, architectural or archaeological significance, and considered worthy of preservation.<br />
<strong>Maywood</strong> - Historic Structures on National Register<br />
Jacob Bohlander House – 316 North Fourth Avenue<br />
Stone and red brick Queen Anne built in 1884.<br />
Masonic Temple – 200 South Fifth Avenue<br />
<strong>The</strong> Masonic Temple was built in 1917.<br />
Fire Station – 511 St. Charles Road<br />
Brick Dutch Revival built in 1904 as the Villages first public fire station.<br />
Caroline Millward House – 502 North Fifth Avenue<br />
Residential Prairie Style Four Square built in 1907.<br />
Caroline Grow House – 603 North Sixth Avenue<br />
Residential Four Square built circa 1902.<br />
Robinson House – 602 North Third Avenue<br />
Residential Vernacular Square Cottage built circa 1902.<br />
<strong>The</strong> Cluever House – 601 North First Avenue<br />
Classic Prairie School house built in 1913.<br />
William Frangenheim House – 410 North Third Avenue<br />
Residential Four Square built circa 1906.<br />
William & Caroline Gibbs House – 515 North Third Avenue<br />
Residential Four Square built circa 1906.<br />
Jennie S. Thompkins House – 503 North Third Avenue<br />
Residential Square Vernacular built circa 1872.<br />
Timothy Lynch House – 416 North Fourth Avenue<br />
Classic Chicago Bungalow built in 1927.<br />
Mads C. Larson House – 318 South First Avenue<br />
Residential Prairie Style Bungalow.<br />
Mrs. Henry F. Akin House – 901 South Eighth Avenue<br />
Prairie Bungalow built circa 1910.<br />
Harry H. Nichols House – 216 South Fourth Avenue<br />
Residential Queen Anne built circa 1894.<br />
Joseph Sullivan House – 142 South 17th Avenue<br />
Residential structure built by Proviso Land Association.<br />
Albert Soffel House - 508 North Fifth Avenue<br />
Two-flat brick foursquare, built in 1905.<br />
Source: “Welcome to <strong>Maywood</strong>’s Historic Architecture,” North <strong>Maywood</strong> <strong>Community</strong> Organization.<br />
MAYWOOD COMPREHENSIVE PLAN Page 2.5
Other Historic Resources<br />
Ten-Mile Freedom House<br />
Although not listed on the National Register and not standing today, the Ten-Mile Freedom<br />
House represents a significant part of <strong>Maywood</strong>’s history. It was a site of the Underground<br />
Railroad for runaway slaves in the late 1880’s. Its name signifies that it was ten miles from<br />
downtown Chicago.<br />
<strong>The</strong> site is located at the southeast corner of Lake Street and First Avenue, where a<br />
McDonald’s Restaurant is now located. A memorial was constructed there to acknowledge<br />
the historical importance of this site and the Underground Railroad.<br />
Checkerboard Field<br />
At First Avenue, between Roosevelt and Cermak Roads, was <strong>Maywood</strong>’s first and only<br />
airfield. Originally called <strong>Maywood</strong> Air Mail Field, it was renamed Checkerboard Field<br />
during the early 1920s when it was moved across First Avenue to what is now the Edward<br />
Hines Hospital site.<br />
On April 15, 1926, Charles Lindbergh made the first airmail flight from Chicago to St. Louis<br />
from this location. <strong>The</strong> airfield is also historically significant because Bessie Coleman, the<br />
first African-American woman pilot flew in and out of Checkerboard Field.<br />
Preservation Programs<br />
In 2005, the Village passed a historic preservation ordinance, the Landmarks Commission<br />
and Designation of Historic Sites. <strong>The</strong> ordinance establishes a preservation review<br />
commission; provides for the nominations and consideration of buildings, districts,<br />
landmarks, and structures; allows for public participation, and enables <strong>Maywood</strong> to become<br />
a Certified Local Government by the Illinois Historic Preservation Agency. It is the first step<br />
toward a community-wide preservation program.<br />
Status as a Certified Local Government allows the Village to participate in state and federal<br />
incentive programs, such as the Illinois Heritage Grants program. Financial incentives are<br />
also available to historic property owners. Most funds and incentives are linked to<br />
renovation projects. Sources include the Property Tax Assessment Freeze and Federal<br />
Historic Preservation Tax Credits. <strong>The</strong>se programs are administered through the Illinois<br />
Historic Preservation Agency.<br />
MAYWOOD COMPREHENSIVE PLAN Page 2.6
MAYWOOD COMPREHENSIVE PLAN Page 2.8
GOVERNANCE STRUCTURE<br />
<strong>The</strong> Village of <strong>Maywood</strong> is an Illinois home-rule corporation that operates under the Village<br />
Manager form of government. <strong>The</strong> Village Manager is appointed by the Village President<br />
and is responsible for the daily activities of the Village and its approximately 173 full-time<br />
employees.<br />
A seven-member board that consists of the President and six trustees, who are elected at<br />
large to four-year terms, govern the Village. <strong>The</strong> Village’s charter is to provide residents with<br />
police and fire protection, water, sewer, refuse collection, public works services, and other<br />
traditional municipal services.<br />
DEMOGRAPHIC PROFILE<br />
Population by Year<br />
Mature communities of similar size surround <strong>Maywood</strong> in all directions. Because the village<br />
limits have been determined since the early 1900’s and have not changed, population growth<br />
has not significantly increased since 1930.<br />
<strong>The</strong> current population of <strong>Maywood</strong> is 26,987 persons. Table 2.1 summarizes the population<br />
of <strong>Maywood</strong> over the last 100 years as recorded in each decennial census.<br />
Table 2.1: <strong>Maywood</strong> Population Year 1900-2000<br />
Year<br />
Population<br />
2000 26,987<br />
1990 27,139<br />
1980 27,998<br />
1970 30,036 peak<br />
1960 27,330<br />
1950 27,473<br />
1940 26,648<br />
1930 25,829<br />
1920 12,072<br />
1910 8,033<br />
1900 4,532<br />
Source: U.S. Census Bureau, 2000-1900<br />
Following steady but moderate population growth in the early 1900’s, <strong>Maywood</strong>’s population<br />
increased by 114% from 1920 to 1930. <strong>The</strong> population then slowed and leveled off in the<br />
ensuing years from 1930 to 1970, when it hit its peak at 30,036 persons. Since then the<br />
population has decreased by approximately 3,000 persons.<br />
MAYWOOD COMPREHENSIVE PLAN Page 2.9
Population by Ethnicity<br />
Table 2.2 presents data regarding the racial composition of <strong>Maywood</strong>. <strong>The</strong> Village is<br />
predominantly African-American (approximately 83%), with 10% Caucasian, and the<br />
remaining 7% comprised of other races or persons of two or more races. Table 2.3 indicates<br />
the portion of <strong>Maywood</strong>’s Population of Hispanic/Latino origin.<br />
Please note that the U.S. Census distinguishes between race and Hispanic/Latino origin as<br />
separate data sets. People of Hispanic or Non-Hispanic origin, indicated in Table 2.3, are<br />
distributed through the various ethnic categories in Table 2.2, i.e. an African-American or<br />
Asian person may also be of Hispanic origin. Hence, the total population for Table 2.2 and<br />
2.3 is consistent, however, the Non-Hispanic figure of 24,144 will not match the total<br />
population of all ethnicities in Table 2.2.<br />
Table 2.2: <strong>Maywood</strong> Population by Race<br />
Ethnicity Persons Percent of Total<br />
African-American 22,308 82.66%<br />
Caucasian 2,625 9.73%<br />
American Indian/Alaskan 34 0.13%<br />
Asian 80 0.30%<br />
Hawaiian/Pacific Islander 1 0%<br />
Other 1,500 5.56%<br />
Two or more races 439 1.63%<br />
Total 26,987 100%<br />
Source: U.S. Census Bureau, 2000<br />
Table 2.3: <strong>Maywood</strong> Population by Hispanic/Latino Origin<br />
Hispanic/Latino Origin Persons Percent of Total<br />
Hispanic or Latino 2,843 10.5%<br />
Non-Hispanic or Latino 24,144 89.5%<br />
Total 26,987 100%<br />
Source: U.S. Census Bureau, 2000<br />
Population by Sex<br />
Table 2.4 presents data regarding the number of males and females in the Village. As shown,<br />
there are approximately 1,700, or 6% more females than males. <strong>The</strong> Village compares<br />
reasonably with the same figures for Cook County, the State of Illinois and the United<br />
States. (See Appendix for Figures.)<br />
MAYWOOD COMPREHENSIVE PLAN Page 2.10
Table 2.4: <strong>Maywood</strong> Population by Sex<br />
Sex Persons Percent of Total<br />
Male 12,626 47%<br />
Female 14,361 53%<br />
Total 26,987 100%<br />
Source: U.S. Census Bureau, 2000<br />
Population by Age <strong>Group</strong><br />
According to the 2000 Census, the median age of the <strong>Maywood</strong>’s population is 30.7 years<br />
old. <strong>The</strong> median age for the male population is 28.6 and 32.5 for females. This information<br />
indicates that <strong>Maywood</strong> is a relatively young community. It is slightly younger than the<br />
region as a whole in comparison with Cook County with a median age of 33.6.<br />
Table 2.5 presents the breakdown of <strong>Maywood</strong>’s population by age group. <strong>The</strong> largest age<br />
group in <strong>Maywood</strong> is 25- to 44-year-olds, followed by the 5- to 14-year-olds. <strong>The</strong> third<br />
largest group is the 45- to 54-year-olds. If the 45 to 54 age group is combined with the 25 to<br />
44 age group, approximately 40% of the population is represented in the ages of 25 to 54.<br />
As mentioned, the 5- to 14-year-olds are the second largest group with approximately 18%<br />
of the population. <strong>The</strong> under 5-age group has the fourth highest total with 8%. <strong>The</strong> two<br />
youngest age groups combined indicate that 24% of the population is 17 years of age or<br />
younger.<br />
Table 2.5: <strong>Maywood</strong> Population by Age <strong>Group</strong><br />
Age <strong>Group</strong> Persons Percent of Total<br />
Under 5 years 2,152 7.97%<br />
5-14 years 4,966 18.4%<br />
15-19 years 2,295 8.5%<br />
20-24 years 1,955 7.2%<br />
25-44 years 7,482 27.72%<br />
45-54 years 3,191 11.82%<br />
55-59 years 1,270 4.71%<br />
60-64 years 1,085 4.02%<br />
65-74 years 1,630 6.04%<br />
75-84 years 693 2.57%<br />
85 years and over 268 0.99%<br />
Total 26,987 100%<br />
Source: U.S. Census Bureau, 2000<br />
This information indicates that in the near term the Village will continue to be a community<br />
of mostly families with children. This will continue to place demands on the services<br />
required by families and their children, especially parks and schools. <strong>The</strong> number of<br />
residents reaching retirement age, although not significant in the near term, will increase over<br />
MAYWOOD COMPREHENSIVE PLAN Page 2.11
the next twenty years. This indicates that a need for increased senior services will develop<br />
over time. Compared with the same data for Cook County, State of Illinois and United<br />
States, <strong>Maywood</strong> has a higher percentage of children and adolescents and lower percentage<br />
of adults. (See Appendix for Figures.)<br />
Household & Family Data<br />
Similar to population, the number of households in <strong>Maywood</strong> has decreased over the last<br />
twenty years. In 1980, there were 8,357 households. This figure decreased to 8,036 in 1990,<br />
and to 7,937 in 2000. Table 2.6 presents household and family information for the Village.<br />
Table 2.6: Household & Family Data<br />
Total Households 7,937<br />
Persons per Households 3.38<br />
Total Families 6,151<br />
Persons per Family 3.84<br />
Source: U.S. Census Bureau, 2000<br />
As noted above, there are more households than families, which indicates a significant<br />
number of single persons in the Village. This information indicates that single persons,<br />
including single parents, may have a special need for community services. Compared with<br />
the same data for Cook County, State of Illinois and United States, <strong>Maywood</strong> has a higher<br />
number of persons per household and family, 3.38 and 3.84 compared to 2.68 and 3.38 for<br />
Cook County, 2.63 and 3.23 for State of Illinois and 2.59 and 3.14 for the United States. (See<br />
Appendix for Figures.)<br />
Regional Population Projection<br />
<strong>The</strong> Northeastern Illinois Planning Commission (NIPC), the regional planning agency for<br />
the six-county Chicago metropolitan area, estimates that <strong>Maywood</strong>’s population will decrease<br />
over the next twenty years. <strong>The</strong> projections, produced in 2000, involve two different growth<br />
scenarios for the metropolitan region. NIPC indicates substantial population growth within<br />
the six-county region as a whole. However, the location of a third airport in the region, or<br />
the expansion and improvement of existing airports will determine the amount and location<br />
of the population increase. A third airport is expected to substantially increase population in<br />
southern Cook and Will counties, while expansion and improvement of existing airports will<br />
distribute the growth more evenly throughout the region. Across the region, NIPC projects<br />
that the six counties will increase in population from the 2000 Census count of 8,272,768<br />
people to 9,045,000 people in the year 2020. This is an overall increase of 9.3 percent.<br />
For the Village of <strong>Maywood</strong>, NIPC projects a population decrease from the 2000 Census<br />
count of 26,987 people to 25,689 without construction of a third airport or 25,958 in the<br />
year 2020, if the airport is constructed. However, as discussed below, local projections<br />
indicate that <strong>Maywood</strong>’s population could grow due to the significant development<br />
opportunities present in the Village for new housing.<br />
MAYWOOD COMPREHENSIVE PLAN Page 2.12
Local Population Projection<br />
Although NIPC projects that <strong>Maywood</strong>’s population will decline over the next twenty years,<br />
analysis of the community during the comprehensive planning process indicates that land<br />
area devoted to housing could increase. <strong>The</strong>re is potential for some in-fill, small lot<br />
development, as well as new development around the Fifth Avenue train station and in the<br />
area along the expressway designated for a new Town Center (see <strong>Section</strong> 9). If the vacant<br />
and underutilized properties designated for residential use and/or increased housing<br />
densities are developed, <strong>Maywood</strong> could have an increase of 900 housing units over the next<br />
ten years.<br />
<strong>The</strong>se housing units could transform into 3,042 additional persons in the Village based on<br />
<strong>Maywood</strong>’s average of 3.38 persons per household of the 2000 Census. This could represent<br />
an increase in population to approximately 30,000 by the year 2013.<br />
ECONOMIC DEVELOPMENT<br />
<strong>The</strong> overall goal for a strong local economy is to provide job opportunities and retail goods<br />
and services to residents and visitors ensuring a strong tax base necessary for providing<br />
municipal services. <strong>Maywood</strong>’s economic base consists of a range of business establishments<br />
that provide a wide variety of services and products. Maintaining these businesses while<br />
continuing to attract new business will contribute to a healthy economic environment in<br />
<strong>Maywood</strong>.<br />
Local Economy<br />
<strong>Maywood</strong> experienced a slow and steady economic decline since the closing of the American<br />
Can Company in 1973. <strong>The</strong> closure of this major business resulted in the loss of over 800<br />
jobs, which was the beginning of a pattern of failing businesses, and loss of workforce and<br />
tax base. However, recently the Village has been experiencing an economic return from new<br />
businesses establishing in <strong>Maywood</strong>.<br />
<strong>The</strong>re are approximately 524 businesses in <strong>Maywood</strong>. <strong>The</strong> majority of <strong>Maywood</strong>’s businesses<br />
consist of small, locally owned retail and service uses that operate on a neighborhood scale.<br />
Some franchise commercial activity, light industry and warehouse uses are also starting to<br />
become active in <strong>Maywood</strong>. Large corporations and industrial users are also starting to<br />
consider <strong>Maywood</strong> as a viable option for running their business. Most notably, Aetna<br />
Plywood and Cintas have opened facilities on the former site of the American Can<br />
Company, and United Concrete is developing a facility on the same site.<br />
Competitive Strengths<br />
<strong>Maywood</strong>’s competitive strengths include its location in the overall Chicago region, its<br />
proximity to major transportation routes and railroads and its availability of industrial land<br />
near major arterials and the railroad. <strong>Maywood</strong> has a good transportation system with major<br />
arterials linked to the state and federal highways. <strong>The</strong> Union Pacific Railroad travels through<br />
<strong>Maywood</strong> and is adjacent to its primary industrial district with vacant, available land.<br />
<strong>Maywood</strong>’s industrial area is incorporated into the St. Charles Road TIF District. A business<br />
Enterprise Zone also overlays this area.<br />
MAYWOOD COMPREHENSIVE PLAN Page 2.13
Workforce<br />
According to the 2000 Census, <strong>Maywood</strong> had a civilian labor force of 12,370 persons, of<br />
which, 10,926 were employed. <strong>The</strong> 1,444 persons not employed resulted in an<br />
unemployment rate of 7.5%. <strong>The</strong> following two tables represent the industry and<br />
occupational categories of the workforce.<br />
Table 2.7 - <strong>Maywood</strong> Employed Workforce - Occupational Category<br />
Occupation Category Number Percent of Total<br />
Management & Professional 2,263 20.7%<br />
Sales & Office 3,628 33.2%<br />
Service 1,953 17.9%<br />
Farming, Fishing & Forestry 30 0.3%<br />
Construction, Extraction & Maintenance 509 4.7%<br />
Production, Transportation & Moving 2,543 23.2%<br />
Total 10,926 100%<br />
Source: U.S. Census Bureau, 2000<br />
<strong>The</strong> table above indicates that about 54% of the employed workforce is engaged in<br />
professional related employment, which includes employees in management, professional,<br />
sales and office related occupations. However, even with this majority in professional or<br />
similar occupations the unemployment rate in the village remains high.<br />
Table 2.8 - <strong>Maywood</strong> Employed Workforce - Industry Category<br />
Industry Category Number Percent of Total<br />
Agriculture, Forestry, Fishing, Hunting & Mining 7 0.1%<br />
Construction 334 3.1%<br />
Manufacturing 1,775 16.2%<br />
Wholesale Trade 343 3.1%<br />
Retail Trade 1,123 10.3%<br />
Transportation, Warehousing & Utilities 1,489 13.6%<br />
Information Technology 334 3.1%<br />
Finance, Insurance, Real Estate 812 7.4%<br />
Professional, Scientific, Management & Admin. 781 7.1%<br />
Educational, Health & Social Services 2,353 21.5%<br />
Art, Entertainment, Recreation & Food Services 597 5.5%<br />
Public Administration 527 4.8%<br />
Other 451 4.1%<br />
Total 10,926 100%<br />
Source: U.S. Census Bureau, 2000<br />
Major Employers<br />
<strong>Maywood</strong> has a range of major employers that contribute to the economic vitality and tax<br />
base of the Village. <strong>The</strong> Village must retain these employers and industries to maintain an<br />
MAYWOOD COMPREHENSIVE PLAN Page 2.14
adequate revenue stream from property and sales tax. <strong>Maywood</strong>’s property tax revenue is<br />
significant and is the major source of income for the Village. <strong>The</strong> following tables list the<br />
major employers in the Village and the largest property taxpayers in the Village.<br />
Table 2.9 - <strong>Maywood</strong> Major Employers<br />
Employer Product/Service Employees<br />
Loyola Medical Center Healthcare 7,000<br />
Edward Hines Hospital Healthcare 2,300<br />
Commonwealth Edison Utility 500<br />
Cintas Business Services N/A<br />
Cook County Courthouse/Offices County Offices 600<br />
Med Care HMO Healthcare 110<br />
Aetna Plywood Building Materials 80<br />
Supreme Catering Food Catering 150<br />
Public School District 89 Education 460<br />
Proviso East High School Education 250<br />
Village of <strong>Maywood</strong> Municipal Government 173<br />
National Cycle, Inc. Motorcycle Accessories 100<br />
Source: Village of <strong>Maywood</strong><br />
Table 2.10: <strong>Maywood</strong> Principal Property Taxpayers<br />
Taxpayer Business/Service Assessed Value<br />
Commonwealth Edison Electric Utility $9,648,053<br />
Imperial Realty Commercial Real Estate $1,843,216<br />
Village of <strong>Maywood</strong> Municipal Government $1,361,267<br />
Roy Strom Excavating & Grading $1,216,154<br />
Greenwood Apartments Residential Properties $867,431<br />
<strong>Maywood</strong> Properties Commercial $798,713<br />
Supreme Catering Mobile Catering $797,666<br />
Aetna Plywood Building Materials N/A<br />
Source: Cook County Treasurer<br />
Business Retention And Attraction<br />
A business retention and attraction plan is needed for the Village to ensure business and<br />
industry is a major part of <strong>Maywood</strong>’s economic future. This type of plan can serve as a<br />
prioritization of needs to implement portions of the Comprehensive Plan as well other goals<br />
of the Village and Chamber of Commerce. This type of plan is aimed at aiding existing<br />
businesses while providing a framework of future improvements and actions to attract new<br />
business. <strong>The</strong>y can be critical to a community’s economic success. Improved transportation<br />
and parking services, a simplified permitting process, small business support services,<br />
education support programs and public/private partnerships are all examples of actions that<br />
can be included in such a plan.<br />
MAYWOOD COMPREHENSIVE PLAN Page 2.15