PhD Thesis, 2010 - University College Cork
PhD Thesis, 2010 - University College Cork
PhD Thesis, 2010 - University College Cork

You also want an ePaper? Increase the reach of your titles
YUMPU automatically turns print PDFs into web optimized ePapers that Google loves.
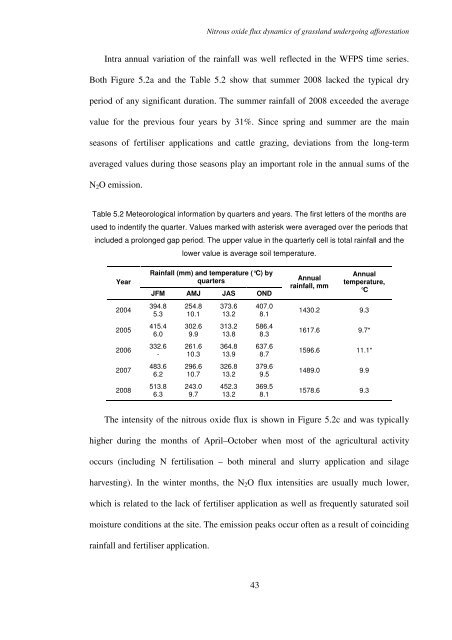
Nitrous oxide flux dynamics of grassland undergoing afforestation<br />
Intra annual variation of the rainfall was well reflected in the WFPS time series.<br />
Both Figure 5.2a and the Table 5.2 show that summer 2008 lacked the typical dry<br />
period of any significant duration. The summer rainfall of 2008 exceeded the average<br />
value for the previous four years by 31%. Since spring and summer are the main<br />
seasons of fertiliser applications and cattle grazing, deviations from the long-term<br />
averaged values during those seasons play an important role in the annual sums of the<br />
N 2 O emission.<br />
Table 5.2 Meteorological information by quarters and years. The first letters of the months are<br />
used to indentify the quarter. Values marked with asterisk were averaged over the periods that<br />
included a prolonged gap period. The upper value in the quarterly cell is total rainfall and the<br />
lower value is average soil temperature.<br />
Year<br />
2004<br />
2005<br />
2006<br />
2007<br />
2008<br />
Rainfall (mm) and temperature (°C) by<br />
quarters<br />
JFM AMJ JAS OND<br />
394.8<br />
5.3<br />
415.4<br />
6.0<br />
332.6<br />
-<br />
483.6<br />
6.2<br />
513.8<br />
6.3<br />
254.8<br />
10.1<br />
302.6<br />
9.9<br />
261.6<br />
10.3<br />
296.6<br />
10.7<br />
243.0<br />
9.7<br />
373.6<br />
13.2<br />
313.2<br />
13.8<br />
364.8<br />
13.9<br />
326.8<br />
13.2<br />
452.3<br />
13.2<br />
407.0<br />
8.1<br />
586.4<br />
8.3<br />
637.6<br />
8.7<br />
379.6<br />
9.5<br />
369.5<br />
8.1<br />
Annual<br />
rainfall, mm<br />
Annual<br />
temperature,<br />
°C<br />
1430.2 9.3<br />
1617.6 9.7*<br />
1596.6 11.1*<br />
1489.0 9.9<br />
1578.6 9.3<br />
The intensity of the nitrous oxide flux is shown in Figure 5.2c and was typically<br />
higher during the months of April–October when most of the agricultural activity<br />
occurs (including N fertilisation – both mineral and slurry application and silage<br />
harvesting). In the winter months, the N 2 O flux intensities are usually much lower,<br />
which is related to the lack of fertiliser application as well as frequently saturated soil<br />
moisture conditions at the site. The emission peaks occur often as a result of coinciding<br />
rainfall and fertiliser application.<br />
43