Extreme Weather, Climate and Natural Disasters in Ireland
Extreme Weather, Climate and Natural Disasters in Ireland
Extreme Weather, Climate and Natural Disasters in Ireland

Create successful ePaper yourself
Turn your PDF publications into a flip-book with our unique Google optimized e-Paper software.
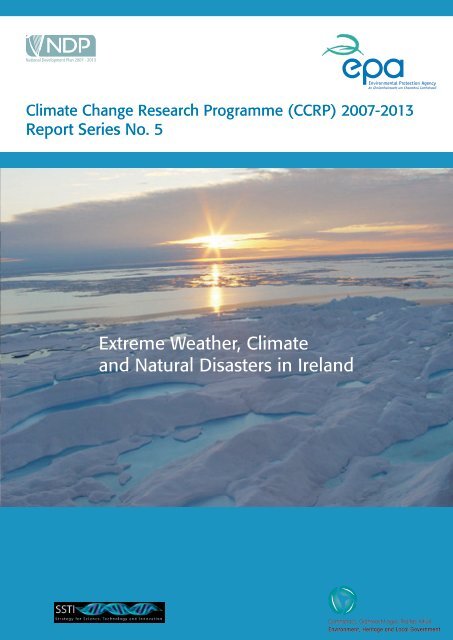
<strong>Climate</strong> Change Research Programme (CCRP) 2007-2013<br />
Report Series No. 5<br />
<strong>Extreme</strong> <strong>Weather</strong>, <strong>Climate</strong><br />
<strong>and</strong> <strong>Natural</strong> <strong>Disasters</strong> <strong>in</strong> Irel<strong>and</strong>
Environmental Protection Agency<br />
The Environmental Protection Agency (EPA) is<br />
a statutory body responsible for protect<strong>in</strong>g<br />
the environment <strong>in</strong> Irel<strong>and</strong>. We regulate <strong>and</strong><br />
police activities that might otherwise cause<br />
pollution. We ensure there is solid<br />
<strong>in</strong>formation on environmental trends so that<br />
necessary actions are taken. Our priorities are<br />
protect<strong>in</strong>g the Irish environment <strong>and</strong><br />
ensur<strong>in</strong>g that development is susta<strong>in</strong>able.<br />
The EPA is an <strong>in</strong>dependent public body<br />
established <strong>in</strong> July 1993 under the<br />
Environmental Protection Agency Act, 1992.<br />
Its sponsor <strong>in</strong> Government is the Department<br />
of the Environment, Heritage <strong>and</strong> Local<br />
Government.<br />
OUR RESPONSIBILITIES<br />
LICENSING<br />
We license the follow<strong>in</strong>g to ensure that their emissions<br />
do not endanger human health or harm the environment:<br />
waste facilities (e.g., l<strong>and</strong>fills,<br />
<strong>in</strong>c<strong>in</strong>erators, waste transfer stations);<br />
large scale <strong>in</strong>dustrial activities<br />
(e.g., pharmaceutical manufactur<strong>in</strong>g,<br />
cement manufactur<strong>in</strong>g, power plants);<br />
<strong>in</strong>tensive agriculture;<br />
the conta<strong>in</strong>ed use <strong>and</strong> controlled release<br />
of Genetically Modified Organisms (GMOs);<br />
large petrol storage facilities.<br />
Waste water discharges<br />
NATIONAL ENVIRONMENTAL ENFORCEMENT<br />
Conduct<strong>in</strong>g over 2,000 audits <strong>and</strong> <strong>in</strong>spections of<br />
EPA licensed facilities every year.<br />
Oversee<strong>in</strong>g local authorities’ environmental<br />
protection responsibilities <strong>in</strong> the areas of - air,<br />
noise, waste, waste-water <strong>and</strong> water quality.<br />
Work<strong>in</strong>g with local authorities <strong>and</strong> the Gardaí to<br />
stamp out illegal waste activity by co-ord<strong>in</strong>at<strong>in</strong>g a<br />
national enforcement network, target<strong>in</strong>g offenders,<br />
conduct<strong>in</strong>g <strong>in</strong>vestigations <strong>and</strong> oversee<strong>in</strong>g<br />
remediation.<br />
Prosecut<strong>in</strong>g those who flout environmental law <strong>and</strong><br />
damage the environment as a result of their actions.<br />
MONITORING, ANALYSING AND REPORTING ON THE<br />
ENVIRONMENT<br />
Monitor<strong>in</strong>g air quality <strong>and</strong> the quality of rivers,<br />
lakes, tidal waters <strong>and</strong> ground waters; measur<strong>in</strong>g<br />
water levels <strong>and</strong> river flows.<br />
Independent report<strong>in</strong>g to <strong>in</strong>form decision mak<strong>in</strong>g by<br />
national <strong>and</strong> local government.<br />
REGULATING IRELAND’S GREENHOUSE GAS EMISSIONS<br />
Quantify<strong>in</strong>g Irel<strong>and</strong>’s emissions of greenhouse gases<br />
<strong>in</strong> the context of our Kyoto commitments.<br />
Implement<strong>in</strong>g the Emissions Trad<strong>in</strong>g Directive,<br />
<strong>in</strong>volv<strong>in</strong>g over 100 companies who are major<br />
generators of carbon dioxide <strong>in</strong> Irel<strong>and</strong>.<br />
ENVIRONMENTAL RESEARCH AND DEVELOPMENT<br />
Co-ord<strong>in</strong>at<strong>in</strong>g research on environmental issues<br />
(<strong>in</strong>clud<strong>in</strong>g air <strong>and</strong> water quality, climate change,<br />
biodiversity, environmental technologies).<br />
STRATEGIC ENVIRONMENTAL ASSESSMENT<br />
Assess<strong>in</strong>g the impact of plans <strong>and</strong> programmes on<br />
the Irish environment (such as waste management<br />
<strong>and</strong> development plans).<br />
ENVIRONMENTAL PLANNING, EDUCATION AND<br />
GUIDANCE<br />
Provid<strong>in</strong>g guidance to the public <strong>and</strong> to <strong>in</strong>dustry on<br />
various environmental topics (<strong>in</strong>clud<strong>in</strong>g licence<br />
applications, waste prevention <strong>and</strong> environmental<br />
regulations).<br />
Generat<strong>in</strong>g greater environmental awareness<br />
(through environmental television programmes <strong>and</strong><br />
primary <strong>and</strong> secondary schools’ resource packs).<br />
PROACTIVE WASTE MANAGEMENT<br />
Promot<strong>in</strong>g waste prevention <strong>and</strong> m<strong>in</strong>imisation<br />
projects through the co-ord<strong>in</strong>ation of the National<br />
Waste Prevention Programme, <strong>in</strong>clud<strong>in</strong>g <strong>in</strong>put <strong>in</strong>to<br />
the implementation of Producer Responsibility<br />
Initiatives.<br />
Enforc<strong>in</strong>g Regulations such as Waste Electrical <strong>and</strong><br />
Electronic Equipment (WEEE) <strong>and</strong> Restriction of<br />
Hazardous Substances (RoHS) <strong>and</strong> substances that<br />
deplete the ozone layer.<br />
Develop<strong>in</strong>g a National Hazardous Waste Management<br />
Plan to prevent <strong>and</strong> manage hazardous waste.<br />
MANAGEMENT AND STRUCTURE OF THE EPA<br />
The organisation is managed by a full time Board,<br />
consist<strong>in</strong>g of a Director General <strong>and</strong> four Directors.<br />
The work of the EPA is carried out across four offices:<br />
Office of <strong>Climate</strong>, Licens<strong>in</strong>g <strong>and</strong> Resource Use<br />
Office of Environmental Enforcement<br />
Office of Environmental Assessment<br />
Office of Communications <strong>and</strong> Corporate Services<br />
The EPA is assisted by an Advisory Committee of twelve<br />
members who meet several times a year to discuss<br />
issues of concern <strong>and</strong> offer advice to the Board.
EPA <strong>Climate</strong> Change Research Programme 2007–2013<br />
<strong>Extreme</strong> <strong>Weather</strong>,<br />
<strong>Climate</strong> <strong>and</strong> <strong>Natural</strong> <strong>Disasters</strong> <strong>in</strong> Irel<strong>and</strong><br />
(2007-CCRP-2.7)<br />
CCRP Report<br />
End of Project Report available for download on http://erc.epa.ie/safer/reports<br />
Prepared for the Environmental Protection Agency<br />
by<br />
University College Cork<br />
Authors:<br />
Gerard Kiely, Paul Leahy, Francis Ludlow, Bett<strong>in</strong>a Stefan<strong>in</strong>i, Eileen Reilly,<br />
Michael Monk <strong>and</strong> Jason Harris<br />
ENVIRONMENTAL PROTECTION AGENCY<br />
An Ghníomhaireacht um Chaomhnú Comhshaoil<br />
PO Box 3000, Johnstown Castle, Co.Wexford, Irel<strong>and</strong><br />
Telephone: +353 53 916 0600 Fax: +353 53 916 0699<br />
Email: <strong>in</strong>fo@epa.ie Website: www.epa.ie
© Environmental Protection Agency 2010<br />
Acknowledgements<br />
This report is published as part of the <strong>Climate</strong> Change Research Programme (CCRP)<br />
2007–2013. The programme is f<strong>in</strong>anced by the Irish Government under the National<br />
Development Plan 2007–2013. It is adm<strong>in</strong>istered on behalf of the Department of<br />
the Environment, Heritage <strong>and</strong> Local Government by the Environmental Protection<br />
Agency which has the statutory function of co-ord<strong>in</strong>at<strong>in</strong>g <strong>and</strong> promot<strong>in</strong>g environmental<br />
research.<br />
The authors wish to acknowledge the contributions of the follow<strong>in</strong>g experts: Mike Baillie<br />
(Queen’s University Belfast); Peter Woodman (University College Cork); Diarmuid<br />
Scully (University College Cork); Tido Semmler (Met Éireann); Sean Rickard (Mary<br />
Immaculate College, Limerick); Paul Mayewski (University of Ma<strong>in</strong>e); Enda Murphy<br />
(Tr<strong>in</strong>ity College Dubl<strong>in</strong>); Kieran Hickey (National University of Irel<strong>and</strong> Galway);<br />
Noreen Brennan (Met Éireann).<br />
The support of the follow<strong>in</strong>g agencies <strong>and</strong> <strong>in</strong>stitutions, through data products or other<br />
co-operation is also acknowledged: Met Éireann; British Atmospheric Data Centre;<br />
Climatic Research Unit (UK); National Center for Atmospheric Research (USA); Royal<br />
Netherl<strong>and</strong>s Meteorological Institute KNMI; Hadley Centre (UK); National Oceanic<br />
<strong>and</strong> Atmospheric Adm<strong>in</strong>istration (USA). The authors thank the EPA for its cont<strong>in</strong>u<strong>in</strong>g<br />
support <strong>and</strong> <strong>in</strong> particular Phillip O’Brien, Margaret Desmond, <strong>and</strong> Frank McGovern.<br />
Disclaimer<br />
Although every effort has been made to ensure the accuracy of the material conta<strong>in</strong>ed<br />
<strong>in</strong> this publication, complete accuracy cannot be guaranteed. Neither the Environmental<br />
Protection Agency nor the authors accept any responsibility whatsoever for loss<br />
or damage occasioned or claimed to have been occasioned, <strong>in</strong> part or <strong>in</strong> full, as a<br />
consequence of any person act<strong>in</strong>g or refra<strong>in</strong><strong>in</strong>g from act<strong>in</strong>g, as a result of a matter<br />
conta<strong>in</strong>ed <strong>in</strong> this publication. All or part of this publication may be reproduced without<br />
further permission, provided the source is acknowledged.<br />
The EPA CCRP programme addresses the need for research <strong>in</strong> Irel<strong>and</strong> to <strong>in</strong>form<br />
policymakers <strong>and</strong> other stakeholders on a range of questions <strong>in</strong> relation to climate<br />
change. These reports are <strong>in</strong>tended as contributions to the necessary debate on climate<br />
change as it relates to Irel<strong>and</strong>.<br />
EPA CCRP PROGRAMME 2007-2013<br />
Published by the Environmental Protection Agency, Irel<strong>and</strong> .<br />
Pr<strong>in</strong>ted on recycled paper<br />
ISBN: 978-1-84095-363-3 06/10/200<br />
Price: Free<br />
ii
Details of Project Partners<br />
Professor Gerard Kiely<br />
HYDROMET Research Group<br />
Department of Civil & Environmental<br />
Eng<strong>in</strong>eer<strong>in</strong>g<br />
University College Cork<br />
Irel<strong>and</strong><br />
Tel.: +353-21-4902965<br />
Email: g.kiely@ucc.ie<br />
Dr Paul Leahy<br />
Department of Civil & Environmental<br />
Eng<strong>in</strong>eer<strong>in</strong>g<br />
University College Cork<br />
Irel<strong>and</strong><br />
Tel.: +353-21-4902017<br />
Email: paul.leahy@ucc.ie<br />
Dr Michael Monk<br />
Department of Archaeology<br />
University College Cork<br />
Tel.: +353-21-4904042<br />
Email: mmonk@archaelogy.ucc.ie<br />
Dr Jason Harris<br />
Department of History<br />
University College Cork<br />
Tel.: +353-21-4903585<br />
Email: j.harris@ucc.ie<br />
Mr Francis Ludlow<br />
Department of Geography<br />
Tr<strong>in</strong>ity College<br />
Dubl<strong>in</strong> 2<br />
Tel: +353-1- 8961576<br />
Email: ludlowf@tcd.ie<br />
Dr Bett<strong>in</strong>a Stefan<strong>in</strong>i<br />
Tr<strong>in</strong>ity College<br />
Dubl<strong>in</strong> 2<br />
Email: stefanb@tcd.ie<br />
Dr Eileen O’Reilly<br />
Tr<strong>in</strong>ity College<br />
Dubl<strong>in</strong> 2<br />
Email: ereilly@ipean.ie<br />
iii
Table of Contents<br />
Acknowledgements<br />
ii<br />
Disclaimer<br />
ii<br />
Details of Project Partners<br />
iii<br />
Executive Summary<br />
vii<br />
1 Introduction 1<br />
1.1 Project Aims 1<br />
1.2 Approach 2<br />
1.3 <strong>Climate</strong> Forc<strong>in</strong>g 3<br />
2 Historical Review of <strong>Extreme</strong> <strong>Weather</strong> 4<br />
2.1 Historical Documentary Evidence of <strong>Extreme</strong> <strong>Weather</strong> 4<br />
2.2 Chronologies of <strong>Extreme</strong>s from the Annals 6<br />
2.3 Conclusions 9<br />
3 Proxy Records 10<br />
3.1 Introduction 10<br />
3.2 General Conclusions 11<br />
4 Observational Records 13<br />
4.1 Introduction 13<br />
4.2 The Era of Instrumental <strong>Weather</strong> Observations <strong>in</strong> Irel<strong>and</strong> 13<br />
4.3 Air Temperature 13<br />
4.4 Ra<strong>in</strong>fall 16<br />
4.5 Evaporation 18<br />
4.6 Droughts 18<br />
4.7 River Flows 19<br />
4.8 W<strong>in</strong>ds 19<br />
4.9 L<strong>and</strong>slides <strong>and</strong> Bog Movements 20<br />
4.10 Conclusions 20<br />
5 Synthesis 21<br />
5.1 Global <strong>and</strong> Regional <strong>Extreme</strong>s Trends <strong>in</strong> Meteorological Time Series 21<br />
5.2 Comparison of Annals Information with Proxy Data 21<br />
5.3 Conclusions 26<br />
6 Conclusions 27<br />
6.1 Summary Conclusions 27<br />
6.2 Key F<strong>in</strong>d<strong>in</strong>gs 27<br />
6.3 Recommendations 28<br />
References 29<br />
Acronyms <strong>and</strong> Annotations 33<br />
Appendix: Gaelic Irish Annals 34<br />
v
Executive Summary<br />
The aim of this project was to collate historical, proxy<br />
<strong>and</strong> observational (recent) records, <strong>and</strong> analyse the<br />
<strong>in</strong>formation with<strong>in</strong> this variety of sources for <strong>in</strong>cidences<br />
of extreme weather events <strong>and</strong> natural disasters, which<br />
may give <strong>in</strong>sight <strong>in</strong>to the variability of climate <strong>in</strong> Irel<strong>and</strong>,<br />
<strong>and</strong> its impact on human society. The study focused on<br />
extreme weather conditions: historical analysis from the<br />
fifth through to the seventeenth century ad was derived<br />
from the Gaelic Annals of Irel<strong>and</strong> 1 <strong>and</strong> also from local<br />
<strong>and</strong> regional proxy data (e.g. tree r<strong>in</strong>gs <strong>and</strong> ice-core<br />
data). Observational data from the n<strong>in</strong>eteenth century<br />
onwards was analysed to identify extremes <strong>in</strong> ra<strong>in</strong>fall,<br />
w<strong>in</strong>ds, storms, floods <strong>and</strong> droughts.<br />
Modern <strong>in</strong>strumental records show that both maximum<br />
<strong>and</strong> m<strong>in</strong>imum temperatures are <strong>in</strong>creas<strong>in</strong>g across the<br />
isl<strong>and</strong>. In addition, there has been approximately a 10%<br />
<strong>in</strong>crease <strong>in</strong> annual ra<strong>in</strong>fall over parts of Irel<strong>and</strong> s<strong>in</strong>ce<br />
the 1970s. This is considered to reflect a climatic shift<br />
dur<strong>in</strong>g the mid-1970s, <strong>and</strong> this shift is also evident <strong>in</strong><br />
other records, such as river flow <strong>and</strong> evaporation. There<br />
has also been an <strong>in</strong>crease <strong>in</strong> extreme ra<strong>in</strong>fall events<br />
s<strong>in</strong>ce the mid-1970s. Aga<strong>in</strong>, this change is observed <strong>in</strong><br />
some river flow records. These f<strong>in</strong>d<strong>in</strong>gs suggest that<br />
the current practice of calculat<strong>in</strong>g return periods from<br />
the longest possible datasets (<strong>in</strong>clud<strong>in</strong>g pre- <strong>and</strong> post-<br />
1975 data) may result <strong>in</strong> underestimates of storm <strong>and</strong><br />
flood magnitude. This observation also suggests that<br />
the assumption of stationarity 2 (with regard to ra<strong>in</strong>fall)<br />
is now questioned.<br />
More than 50 bog burst or ‘l<strong>and</strong>slides’ <strong>in</strong> peatl<strong>and</strong>s<br />
have occurred s<strong>in</strong>ce the early 1900s. These appear to<br />
have been caused by extremes <strong>in</strong> ra<strong>in</strong>fall follow<strong>in</strong>g dry<br />
periods <strong>and</strong> possibly compounded at times by human<br />
activities.<br />
1 Irel<strong>and</strong> holds one of the oldest bodies of written literature<br />
of any European country. The most important sources are<br />
the Gaelic Irish Annals. These represent the accumulation<br />
of an annual chronicl<strong>in</strong>g of major local, national <strong>and</strong><br />
<strong>in</strong>ternational events by the educated elite <strong>in</strong> Irel<strong>and</strong>.<br />
2 Stationarity is a term used <strong>in</strong> statistical analysis to describe<br />
a variable whose properties such as mean <strong>and</strong> variance<br />
are constant over time. In this case, eng<strong>in</strong>eers have<br />
assumed that the risk of an occurrence of a flood events<br />
was constant with time.<br />
The analysis also shows the localised nature of some<br />
extremes, <strong>in</strong> the variation between the west <strong>and</strong> east of<br />
Irel<strong>and</strong>, <strong>and</strong> illustrates the difficulty of extrapolation of<br />
local results to wider areas.<br />
Irel<strong>and</strong>’s location <strong>and</strong> geography on the Atlantic<br />
fr<strong>in</strong>ge of Europe means that is <strong>in</strong>fluenced more by the<br />
North Atlantic circulation than cont<strong>in</strong>ental <strong>in</strong>fluences.<br />
European climatic reconstructions <strong>and</strong> projections may<br />
have less direct relevance for Irel<strong>and</strong> than cont<strong>in</strong>ental<br />
European countries. Ra<strong>in</strong>fall <strong>and</strong> river flow changes<br />
can be correlated to changes <strong>in</strong> the North Atlantic<br />
Oscillation.<br />
The current study was carried out to determ<strong>in</strong>e if<br />
historical records from the Annals could support<br />
evidence from other sources of regional climate forc<strong>in</strong>g<br />
events. For example, reported extremes of cold found<br />
<strong>in</strong> the Annals correlate with volcanic eruptions evident<br />
from the Greenl<strong>and</strong> Ice Sheet Project 2 (GISP2) core<br />
analysis. This shows the important contribution of<br />
volcanic events made to regional short-term cool<strong>in</strong>g,<br />
due to the emission of aerosols. The GISP2 record<br />
shows that aerosol sulfate levels <strong>in</strong>creased dur<strong>in</strong>g the<br />
twentieth century because of air pollution levels similar<br />
to those recorded dur<strong>in</strong>g a number of smaller volcanic<br />
eruptions. The associated cool<strong>in</strong>g is considered to have<br />
masked greenhouse warm<strong>in</strong>g.<br />
Documentary sources, such as the Annals, provide<br />
evidence for extremes of climate down through the<br />
centuries. The low event counts <strong>in</strong> many cases make it<br />
difficult to derive robust statistical measures. However,<br />
some results emerge – such as a decrease <strong>in</strong> reported<br />
extremes of cold <strong>in</strong> the late fourteenth <strong>and</strong> early fifteenth<br />
centuries; a lack of reported dry episodes dur<strong>in</strong>g the<br />
n<strong>in</strong>th <strong>and</strong> tenth centuries; <strong>and</strong> a relative <strong>in</strong>frequency of<br />
wet episodes reported dur<strong>in</strong>g the <strong>in</strong>terval 1250 ad–1450<br />
ad. The data rema<strong>in</strong> qualitative <strong>and</strong> it is not yet possible<br />
to ascribe return periods to extremes identified <strong>in</strong> these<br />
sources.<br />
It is impossible to go back <strong>in</strong> time <strong>and</strong> make <strong>in</strong>strumental<br />
observations of past weather <strong>and</strong> climate. To learn about<br />
past climate, it is necessary to look to those processes<br />
<strong>in</strong> nature which are affected by climate, <strong>and</strong> which leave<br />
vii
the signature of past climate <strong>in</strong> their structure. These<br />
natural <strong>in</strong>dicators of climate are known as ‘proxies’. For<br />
example, the grow<strong>in</strong>g conditions over time determ<strong>in</strong>e<br />
the pattern of tree-r<strong>in</strong>gs for a given tree. Temperature<br />
<strong>and</strong> water availability are key weather parameters<br />
that <strong>in</strong>fluence tree growth, although other confound<strong>in</strong>g<br />
factors such as pests <strong>and</strong> other damage also feature.<br />
Tree-r<strong>in</strong>g chronologies from multiple locations offer a<br />
means of overcom<strong>in</strong>g the localised nature of <strong>in</strong>dividual<br />
proxies. The ‘Belfast’ oak chronology dates back more<br />
than 7,000 years, <strong>and</strong> is derived from oaks from most<br />
of Irel<strong>and</strong>. Unusual growth patterns with<strong>in</strong> a tree-r<strong>in</strong>g<br />
chronology can be evidence for an extreme event with<br />
regional impact. Many, but not all, low-growth years<br />
found through tree-r<strong>in</strong>g chronologies correspond with<br />
episodes of cold reported <strong>in</strong> the Annals. The probabilities<br />
of other severe, non-climatic, global or local natural<br />
disasters, although uncerta<strong>in</strong> (e.g. earthquakes) are<br />
extremely low compared to weather extremes, even<br />
though their probable impacts may be high. While these<br />
proxy records allow frequencies of extreme events to be<br />
estimated, it is not possible to quantify the magnitude of<br />
such events. This cross-referenc<strong>in</strong>g between sources<br />
allows us to be confident that the records of unusual<br />
or extreme weather <strong>in</strong> the Annals are reliable. Whilst<br />
many are due to regional impact of volcanic activity,<br />
other records may <strong>in</strong>dicate the natural climate variability<br />
dur<strong>in</strong>g this period.<br />
In November 2009, widespread flood<strong>in</strong>g occurred<br />
across Irel<strong>and</strong>. It was the wettest November on record<br />
at many locations, lead<strong>in</strong>g to saturated catchments<br />
throughout the country. Flood<strong>in</strong>g followed a wet day<br />
(19 November, with approximately 50 mm or more of<br />
ra<strong>in</strong> for the 24-hour period <strong>in</strong> the south-west). Three<br />
catchments (the Shannon, the Lee <strong>and</strong> the Liffey) were<br />
affected significantly. With climate change, extremes<br />
of flood<strong>in</strong>g may become more frequent. The losses<br />
<strong>in</strong>curred <strong>in</strong> 2009 may be repeated, unless extensive<br />
flood alleviation is implemented along with significant<br />
improvements <strong>in</strong> flood monitor<strong>in</strong>g, forecast<strong>in</strong>g <strong>and</strong><br />
warn<strong>in</strong>g.<br />
The ma<strong>in</strong> recommendations from this study <strong>in</strong>clude:<br />
1 The establishment of a national repository for<br />
all data with potential for palaeoenvironmental<br />
reconstruction;<br />
2 An exam<strong>in</strong>ation of further early texts for weatherrelated<br />
references (e.g. the Annals) <strong>and</strong> a<br />
comparison of w<strong>in</strong>d reports <strong>in</strong> the Annals to other<br />
proxies of environmental <strong>and</strong> climatic <strong>in</strong>formation;<br />
3 A reanalysis of the Belfast tree-r<strong>in</strong>g chronologies<br />
with the specific purpose of palaeoenvironmental<br />
reconstruction;<br />
4 The digitisation <strong>and</strong> web dissem<strong>in</strong>ation of the<br />
rema<strong>in</strong><strong>in</strong>g undigitised meteorological records;<br />
5 An effort to collate <strong>in</strong>strumental data from dispersed,<br />
fragmentary sources such as weather diaries;<br />
6 A systematic homogenisation effort of the best<br />
available <strong>in</strong>strumental series;<br />
7 An acute need for a s<strong>in</strong>gle national authority to<br />
control all river monitor<strong>in</strong>g functions <strong>and</strong> make data<br />
available on public websites.<br />
viii
1 Introduction<br />
1.1 Project Aims<br />
The aim of this project was to collate historical, proxy<br />
<strong>and</strong> observational (recent) records <strong>and</strong> analyse them<br />
for <strong>in</strong>cidences of extreme weather events, climatic<br />
shifts, <strong>and</strong> natural disasters. This was to identify, where<br />
possible, event magnitudes <strong>and</strong> frequencies (return<br />
periods), probabilities of occurrence, <strong>and</strong> impacts on<br />
society. This analysis provides <strong>in</strong>sight <strong>in</strong>to the level of<br />
climate extremes that Irel<strong>and</strong> had to cope with <strong>in</strong> the<br />
past.<br />
The def<strong>in</strong>ition of an extreme event depends on the local<br />
reference distribution. In other words, events that would<br />
be classified as ‘extreme’ <strong>in</strong> one location might not be<br />
considered unusual <strong>in</strong> another. Very often, the degree of<br />
risk associated with a given event is also dependent on<br />
the local expectation or degree of preparedness. Storms<br />
of magnitudes sufficient to cause widespread disruption<br />
<strong>in</strong> the east of Irel<strong>and</strong> may be much more commonplace<br />
<strong>in</strong> the west. For this reason, spatial shifts <strong>in</strong> weather<br />
patterns or storm tracks are of particular <strong>in</strong>terest, as<br />
they may <strong>in</strong>troduce unexpected events to new regions.<br />
Seasonality is a further consideration. An event that is<br />
unexpected for a season may be considered as extreme,<br />
even though events of similar or even larger magnitudes<br />
may not be uncommon <strong>in</strong> that region <strong>in</strong> general dur<strong>in</strong>g<br />
other seasons. One prom<strong>in</strong>ent example is the series of<br />
storms of August <strong>and</strong> September 1588, which <strong>in</strong>cluded<br />
the storm on 21 September which destroyed much of<br />
the Spanish Armada off the coast of Irel<strong>and</strong> (Forsythe<br />
et al., 2000; Lamb, 2005, 2nd edition). Similarly, there<br />
were two large storms <strong>in</strong> August 1986. The first on<br />
5/6 August ma<strong>in</strong>ly affected the west <strong>and</strong> south. The<br />
second on 25/26 August (the remnants of Hurricane<br />
Charley) affected the east with severe flood<strong>in</strong>g <strong>in</strong> areas<br />
such as Bray, Co, Wicklow.<br />
By def<strong>in</strong>ition, extreme events are <strong>in</strong>frequent, but are<br />
recorded throughout human history <strong>and</strong> have resulted<br />
<strong>in</strong> environmental <strong>and</strong> economic damage as well as<br />
loss of life (Jentsch <strong>and</strong> Beierkuhnle<strong>in</strong>, 2008). <strong>Extreme</strong><br />
events can be def<strong>in</strong>ed <strong>in</strong> terms of their return periods<br />
calculated over long <strong>in</strong>tervals, i.e. 10-year, 50-year,<br />
100-year returns, or, for cont<strong>in</strong>uous variables such<br />
as ra<strong>in</strong>fall <strong>in</strong>tensities or air temperatures (a percentile<br />
such as 99%). Thus, a severe 24-hour ra<strong>in</strong>fall can be<br />
described by either its return period (e.g. 50 years) or<br />
as a percentile (2%).<br />
The general expectation is that climate change occurs<br />
gradually over a long time frame. However, a climatic<br />
shift can be described as a relatively abrupt transition<br />
<strong>in</strong> climatic conditions. For <strong>in</strong>stance, annual ra<strong>in</strong>fall<br />
amounts may <strong>in</strong>crease or decrease from the previous<br />
long-term averages. Similarly, temperature may undergo<br />
a climate shift – such as a warm<strong>in</strong>g <strong>in</strong> w<strong>in</strong>ter or a cool<strong>in</strong>g<br />
<strong>in</strong> summer. For <strong>in</strong>stance, for the northern hemisphere <strong>in</strong><br />
recent decades, there are <strong>in</strong>dications of a poleward shift<br />
of storm tracks <strong>and</strong> a strengthen<strong>in</strong>g of the storm tracks<br />
north of Brita<strong>in</strong> <strong>and</strong> Irel<strong>and</strong>. The transition time depends<br />
on the overall timescale of <strong>in</strong>terest, but is generally<br />
short, i.e. over a 2–5 year period. A shift <strong>in</strong> a climatic<br />
condition br<strong>in</strong>gs a change <strong>in</strong> climate parameters, which<br />
are reflected <strong>in</strong> the statistical properties of data series<br />
for these parameters. Rapid climatic shifts, as well as<br />
<strong>in</strong>dividual events, can result <strong>in</strong> stress for ecosystems,<br />
agricultural systems, <strong>in</strong>frastructure <strong>and</strong> societies<br />
(Budyko et al., 1988). A meteorological extreme event<br />
as dist<strong>in</strong>ct from a climate shift can occur dur<strong>in</strong>g a stable<br />
climate. For <strong>in</strong>stance, the floods <strong>in</strong> Irel<strong>and</strong> <strong>in</strong> November<br />
2009 <strong>and</strong> the cold <strong>in</strong> January 2010 are regarded as<br />
extreme events.<br />
People affected by an extreme weather event (e.g.<br />
extremely hot summer <strong>in</strong> Europe <strong>in</strong> 2003; Cork floods<br />
<strong>in</strong> 2009; cold spell <strong>in</strong> Irel<strong>and</strong> <strong>in</strong> December 2009 <strong>and</strong><br />
January 2010, which delayed the start to the grow<strong>in</strong>g<br />
season <strong>in</strong> Irel<strong>and</strong> <strong>in</strong> Spr<strong>in</strong>g 2010) often ask whether<br />
human <strong>in</strong>fluences on the climate are responsible. A<br />
wider range of extreme weather events is expected<br />
with an unchang<strong>in</strong>g climate, so it is difficult to attribute<br />
any <strong>in</strong>dividual event to a change <strong>in</strong> the climate. Several<br />
factors usually need to comb<strong>in</strong>e to produce an extreme<br />
event, so l<strong>in</strong>k<strong>in</strong>g a particular extreme event to a<br />
s<strong>in</strong>gle, specific cause is problematic. Simple statistical<br />
reason<strong>in</strong>g <strong>in</strong>dicates that substantial changes <strong>in</strong> the<br />
frequency of extreme events can result from a relatively<br />
small shift of the distribution of a weather or climate<br />
1
<strong>Extreme</strong> <strong>Weather</strong>, <strong>Climate</strong> <strong>and</strong> <strong>Natural</strong> <strong>Disasters</strong> <strong>in</strong> Irel<strong>and</strong><br />
Figure 1.1. Schematic show<strong>in</strong>g the effect on extreme temperatures when the mean temperature <strong>in</strong>creases,<br />
for a normal distribution (Box TS.5, Intergovernmental Panel on <strong>Climate</strong> Change, Assessment Report 4: 53).<br />
variable. <strong>Extreme</strong>s are the <strong>in</strong>frequent events at the<br />
high <strong>and</strong> low end of the range of values of a particular<br />
variable. The probability of occurrence of values <strong>in</strong> this<br />
range is called a probability distribution function (PDF)<br />
that for some variables is shaped similar to a Normal<br />
distribution. Figure 1.1 is a schematic of such a PDF<br />
<strong>and</strong> illustrates the effect a small shift can have on the<br />
frequency of extremes at either end of the distribution.<br />
An <strong>in</strong>crease <strong>in</strong> the frequency of one extreme (number of<br />
floods) will be accompanied by a decl<strong>in</strong>e <strong>in</strong> the opposite<br />
extreme (number of droughts) (Intergovernmental<br />
Panel on <strong>Climate</strong> Change [IPCC] Assessment Report<br />
4 [AR4]).<br />
A hazard is an event, or series of events, which has<br />
the potential to cause disruption, destruction, loss of<br />
life, loss of economic production <strong>and</strong>/or ecosystem<br />
function. The risk associated with such an event is often<br />
described as the product of the probability of occurrence<br />
of the event <strong>and</strong> the associated impact. High-impact<br />
low-probability events are the most damag<strong>in</strong>g <strong>and</strong><br />
difficult to deal with. In the context of this report, those<br />
extreme climate events that cause damag<strong>in</strong>g impact<br />
on human society or activity are discussed. The term<br />
‘‘natural hazards’’ encompasses a diverse range of<br />
phenomena associated with the natural environment,<br />
for example, floods, storms, l<strong>and</strong>slides, tsunamis <strong>and</strong><br />
earthquakes. The focus <strong>in</strong> this study is on climaterelated<br />
hazards.<br />
1.2 Approach<br />
Three types of material were used <strong>in</strong> this study:<br />
1 Historical records <strong>and</strong> literary references from<br />
approximately 400 ad (Chapter 2);<br />
2 Proxy records from about 2500 bc (Chapter 3);<br />
3 Observational records from 1800 to 2009 (Chapter<br />
4).<br />
These three categories possess very different temporal<br />
coverage, <strong>and</strong> resolution, <strong>and</strong> spatial resolution, density<br />
<strong>and</strong> reliability. The results are synthesised <strong>in</strong> Chapter 5.<br />
Table 1.1. Date conventions.<br />
Convention Description Ma<strong>in</strong> usage, notes.<br />
bc/ad Conventional Lat<strong>in</strong> Anno Dom<strong>in</strong>i system Instrumental, historical records<br />
os/ns<br />
Old Style/New Style. Refers to variants of the bc/<br />
ad system caused by the change from the Julian<br />
to Gregorian calendar. ns is assumed unless<br />
otherwise <strong>in</strong>dicated.<br />
Historical records. In the os, the new calendar year began on 25<br />
March (this persisted until 1752 <strong>in</strong> Engl<strong>and</strong> <strong>and</strong> her colonies). In ns<br />
the new calendar year beg<strong>in</strong>s on 1 January.<br />
Years bp (Uncalibrated) radiocarbon years before present Palaeoenvironmental records. The reference year is 1950.<br />
Cal years bp Calibrated years before present Palaeoenvironmental records. The reference year is 1950, <strong>and</strong><br />
the raw radiocarbon age has been cross-calibrated by reference<br />
to <strong>in</strong>dependently dated sources.<br />
2
G. Kiely et al. (2007-CCRP-2.7)<br />
1.2.1 Area <strong>and</strong> Time Period of Interest<br />
This study is focused on the isl<strong>and</strong> of Irel<strong>and</strong>. The<br />
events themselves may be local to Irel<strong>and</strong> (e.g.<br />
floods, bog bursts, etc.); local to another region (e.g.<br />
volcanic eruptions) but with possible effects on Irel<strong>and</strong>;<br />
regional (e.g. large tsunamis); or global (e.g. changes<br />
<strong>in</strong> <strong>in</strong>com<strong>in</strong>g global solar irradiance). The time frame is<br />
the period from about 2500 bc to the present. Table 1.1<br />
summarises the st<strong>and</strong>ard dat<strong>in</strong>g convention.<br />
1.3 <strong>Climate</strong> Forc<strong>in</strong>g<br />
<strong>Extreme</strong> events occur because of the natural variability<br />
with<strong>in</strong> the climate system. The global climate system<br />
also responds to forc<strong>in</strong>gs that alter the planet’s energy<br />
balance (Budyko et al., 1988; Kondratyev <strong>and</strong> Gal<strong>in</strong>do,<br />
1997). This <strong>in</strong>cludes natural forc<strong>in</strong>g such as the longterm<br />
solar cycles (Milancovich cycles) which have<br />
caused major changes to the Earth’s climate, such<br />
as Ice Ages. More recent climate forc<strong>in</strong>g is l<strong>in</strong>ked to<br />
enhanced levels of atmospheric greenhouse gases<br />
such as carbon dioxide <strong>and</strong> particulate pollutants know<br />
as aerosols. These forc<strong>in</strong>gs are of concern because<br />
of both long-term shifts <strong>in</strong> climate <strong>and</strong> changes to<br />
the frequency <strong>and</strong> characteristics of extreme climate<br />
events, <strong>and</strong> their implications for ecosystems <strong>and</strong><br />
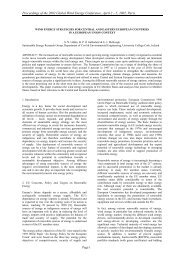
socio-economic systems. Radiative forc<strong>in</strong>g (RF) is<br />
a measure of the <strong>in</strong>fluence that a parameter has <strong>in</strong><br />
alter<strong>in</strong>g the balance of <strong>in</strong>com<strong>in</strong>g <strong>and</strong> outgo<strong>in</strong>g energy<br />
<strong>in</strong> the Earth’s atmosphere system, <strong>and</strong> is an <strong>in</strong>dex<br />
of the importance of the parameter as a potential<br />
climate change mechanism. Positive forc<strong>in</strong>g warms<br />
the surface while negative cools the surface. Figure<br />
1.2 compares the RF values for 2005 to pre-<strong>in</strong>dustrial<br />
time (1750). The comb<strong>in</strong>ed RF from <strong>in</strong>creases <strong>in</strong> CO 2<br />
,<br />
CH 4<br />
, <strong>and</strong> N 2<br />
O is +2.3 W m -2 <strong>and</strong> its rate of <strong>in</strong>creases<br />
dur<strong>in</strong>g the <strong>in</strong>dustrial era is very likely to have been<br />
unprecedented <strong>in</strong> more than 10,000 years. The CO 2<br />
radiative forc<strong>in</strong>g <strong>in</strong>creased by 20% from 1995 to 2005,<br />
the largest change <strong>in</strong> any decade <strong>in</strong> at least 200 years.<br />
(IPCC, 2007)<br />
Figure 1.2. Global average radiative forc<strong>in</strong>g (RF) estimates <strong>and</strong> ranges <strong>in</strong> 2005 for anthropogenic CO 2<br />
, CH 4<br />
,<br />
<strong>and</strong> N 2<br />
O <strong>and</strong> other important agents <strong>and</strong> mechanisms, together with the spatial extent <strong>and</strong> associated level<br />
of scientific underst<strong>and</strong><strong>in</strong>g (LOSU) (Figure SPM.2, Intergovernmental Panel on <strong>Climate</strong> Change, (IPCC, 2007).<br />
Summary for Policymakers: 4).<br />
3
<strong>Extreme</strong> <strong>Weather</strong>, <strong>Climate</strong> <strong>and</strong> <strong>Natural</strong> <strong>Disasters</strong> <strong>in</strong> Irel<strong>and</strong><br />
2 Historical Review of <strong>Extreme</strong> <strong>Weather</strong><br />
The potential for the reconstruction of past climatic<br />
conditions <strong>and</strong> weather extremes from the longest<br />
cont<strong>in</strong>uous written body of literature from Irel<strong>and</strong>, the<br />
Irish Annals, was <strong>in</strong>vestigated. 3 Direct references to<br />
episodes of extremes of cold, w<strong>in</strong>d, precipitation <strong>and</strong><br />
temperature were extracted. Indirect weather records<br />
or parameteorological phenomena such as floods <strong>and</strong><br />
droughts <strong>in</strong> the Annals were also noted. Other than the<br />
Annals, other <strong>in</strong>digenous Irish sources with the potential<br />
for describ<strong>in</strong>g past climatic conditions <strong>and</strong> extremes<br />
of weather are limited. Newspaper articles have been<br />
also used to construct a storm chronology for Dubl<strong>in</strong><br />
(Sweeney, 2000). The use of documentary evidence, for<br />
the period prior to systematic observations of climate/<br />
weather parameters, requires careful consideration<br />
of contemporaneous factors <strong>and</strong> reports as well as<br />
the established provenance <strong>and</strong> critical reviews of the<br />
reliability of the record.<br />
2.1 Historical Documentary Evidence of<br />
<strong>Extreme</strong> <strong>Weather</strong><br />
2.1.1 Available Historical Sources<br />
Irel<strong>and</strong> holds one of the oldest bodies of written<br />
literature of any European country. The most important<br />
sources are the Gaelic Irish Annals. These represent<br />
the accumulation of an annual chronicl<strong>in</strong>g of major<br />
local, national <strong>and</strong> <strong>in</strong>ternational events by the educated<br />
elite <strong>in</strong> Irel<strong>and</strong>. Record<strong>in</strong>g was <strong>in</strong>itially undertaken <strong>in</strong><br />
monastic sett<strong>in</strong>gs after the establishment of Christianity,<br />
but largely moved to secular schools of learn<strong>in</strong>g from the<br />
thirteenth century, with events recorded by professional<br />
hereditary historians (Mac Niocaill, 1975; Dumville,<br />
1999; McCarthy, 2008). This move was precipitated<br />
<strong>in</strong> part by the twelfth-century church reform (O’Dwyer,<br />
1972; Gwynn, 1992).<br />
The most recent <strong>and</strong> extensive study of the Annals<br />
(McCarthy, 2008: 161) argues that ‘a capacity for<br />
accurate chronicl<strong>in</strong>g <strong>in</strong> the most difficult of circumstances<br />
existed <strong>in</strong> an Irish monastic context by 538 ad <strong>and</strong><br />
possibly before’. McCarthy bases this assessment<br />
3 See Appendix.<br />
upon a comparison of evidence from the Annals of<br />
major societal stresses (implied food shortage <strong>and</strong><br />
disease) <strong>and</strong> co<strong>in</strong>cident severe downturn <strong>in</strong> northern<br />
hemisphere tree-r<strong>in</strong>g growth <strong>in</strong> the sixth century. The<br />
general reliability of later events recorded <strong>in</strong> the Annals<br />
can be determ<strong>in</strong>ed by compar<strong>in</strong>g them to major events<br />
<strong>and</strong> dates known from <strong>in</strong>dependent documentary<br />
sources with<strong>in</strong> <strong>and</strong> external to Irel<strong>and</strong> (e.g. Byrne,<br />
1967; McCarthy, 2000). This is further confirmed by the<br />
accurate record<strong>in</strong>g of astronomical phenomena, such<br />
as solar <strong>and</strong> lunar eclipses, the dates of which can be<br />
reconstructed <strong>in</strong>dependently.<br />
2.1.2 Past Investigations of the Annals<br />
Numerous authors have reported records of weather<br />
extremes, related phenomena <strong>and</strong> associated societal<br />
impacts <strong>in</strong> the Annals (e.g. Meaden, 1975; Dixon, 1987;<br />
Mallory <strong>and</strong> Baillie, 1988; Rowe, 1989; Baillie, 1994,<br />
1995, 1999, 2006; Kelly, 1997; McCarthy <strong>and</strong> Breen,<br />
1997a, b; Sweeney, 2000; Pfister et al., 1998; Hall <strong>and</strong><br />
Mauqouy, 2005; McCafferty <strong>and</strong> Baillie, 2005; National<br />
Research Council, 2006; McCormick et al., 2007;<br />
Down, 2008; McCarthy, 2008). As part of the Census<br />
of Irel<strong>and</strong>, 1851, Wilde’s survey <strong>in</strong>cluded records of<br />
weather extremes <strong>and</strong> unusual meteorological <strong>and</strong><br />
natural phenomena. In 1878, a survey of relevant<br />
material <strong>in</strong> the Annals was published by Walford <strong>in</strong> the<br />
Journal of the Statistical Society of London, entitled<br />
‘The fam<strong>in</strong>es of the world: past <strong>and</strong> present’. The next<br />
major attempt to compile material from the Annals<br />
was by Britton, published <strong>in</strong> Geophysical Memoirs<br />
<strong>in</strong> 1937. Britton’s ma<strong>in</strong> focus was on British <strong>and</strong> Irish<br />
sources <strong>and</strong> he adopts a critical stance <strong>in</strong> cit<strong>in</strong>g dates<br />
<strong>and</strong> sources. The next notable assessment of weather<br />
extremes <strong>in</strong> the Annals is by Dixon (1953, 1959).<br />
Rather than present<strong>in</strong>g a compilation of transcripts from<br />
the Annals, a more traditional essay is presented <strong>in</strong><br />
which major extremes (e.g. storms) are listed by date,<br />
with some representative examples quoted. The most<br />
recent published catalogue of extremes <strong>and</strong> related<br />
phenomena <strong>in</strong> the Annals is by Lyons (1989). Table<br />
2.1 gives examples that recognise a broad division<br />
between records of direct meteorological phenomena<br />
4
G. Kiely et al. (2007-CCRP-2.7)<br />
(e.g. ra<strong>in</strong>, w<strong>in</strong>d) or conditions (e.g. dry weather) <strong>and</strong><br />
<strong>in</strong>direct or proxy phenomena, from which underly<strong>in</strong>g<br />
meteorological conditions may be <strong>in</strong>ferred (e.g. drought,<br />
frost, flood<strong>in</strong>g, <strong>and</strong>, more <strong>in</strong>directly, harvest yields <strong>and</strong><br />
failures, fruit yields, scarcity, fam<strong>in</strong>e).<br />
Table 2.1. Examples <strong>and</strong> categories of relevant<br />
records <strong>in</strong> the Annals (Four Masters).<br />
Example text<br />
There was great frost <strong>in</strong> this<br />
year, so that the lakes <strong>and</strong><br />
rivers of Irel<strong>and</strong> were frozen<br />
…<br />
There was unusual ice <strong>and</strong><br />
great snow <strong>in</strong> this year, from<br />
Christmas to Shrovetide.<br />
A great w<strong>in</strong>d on the festival<br />
of St Mart<strong>in</strong> … caused great<br />
destruction of the woods <strong>in</strong><br />
Irel<strong>and</strong>, <strong>and</strong> swept oratories<br />
… from their respective sites.<br />
The cornfields rema<strong>in</strong>ed<br />
unreaped throughout Irel<strong>and</strong><br />
until after Michaelmas, <strong>in</strong><br />
consequence of the wet<br />
weather.<br />
Great dearth <strong>in</strong> this year,<br />
so that sixpence of the old<br />
money were given for a cake<br />
of bread <strong>in</strong> Connaught, or six<br />
white pence <strong>in</strong> Meath.<br />
Intense heat <strong>and</strong> extreme<br />
drought <strong>in</strong> the summer of<br />
this year; there was no ra<strong>in</strong><br />
for one hour, by night or day,<br />
from Bealta<strong>in</strong>e to Lammas.<br />
Categories <strong>and</strong> dates<br />
(Corrected, Julian<br />
Calendar)<br />
Indirect (parameteorological)<br />
phenomena (frost <strong>and</strong> frozen<br />
water bodies). 700 ad.<br />
Direct (snow) <strong>and</strong> <strong>in</strong>direct<br />
(parameteorological)<br />
phenomenon (ice). Christmas<br />
is 25 December 817 ad.<br />
Shrovetide falls <strong>in</strong> January of<br />
818 ad.<br />
Direct weather phenomenon<br />
(w<strong>in</strong>d) with associated impacts<br />
(destruction of trees <strong>and</strong><br />
build<strong>in</strong>gs). The Feast of Mart<strong>in</strong><br />
is 11 November. 892 ad.<br />
Indirect (phenological)<br />
phenomena (delayed harvest)<br />
associated with a direct<br />
weather phenomenon (wet<br />
weather). Michaelmas is St.<br />
Michael’s Day, 29 September.<br />
1329 ad.<br />
Economic <strong>in</strong>formation<br />
associated with <strong>in</strong>direct<br />
phenomenon (dearth)<br />
subcategorised under fam<strong>in</strong>e<br />
<strong>and</strong> scarcity. 1545 ad.<br />
Direct observations of<br />
meteorological conditions<br />
(heat, no ra<strong>in</strong>) <strong>and</strong> <strong>in</strong>direct<br />
phenomenon (drought).<br />
Bealta<strong>in</strong>e is 1 May <strong>and</strong><br />
Lammas is 1 August. 1575 ad.<br />
2.1.3 Reliability of Evidence<br />
Even records contemporary to the events <strong>and</strong><br />
phenomena they purport to describe must be assessed<br />
for reliability, <strong>in</strong> the context that other material supports<br />
the description. The <strong>in</strong>terpretation of natural events<br />
<strong>and</strong> phenomena before the modern period generally<br />
employed explanatory frameworks based upon myth,<br />
folklore <strong>and</strong> religion, which, <strong>in</strong> the case of Christianity,<br />
described the orig<strong>in</strong>s <strong>and</strong> operation of the natural<br />
world. Studies of the perception of weather extremes<br />
<strong>and</strong> other natural hazards <strong>in</strong> the pre- <strong>and</strong> early-Modern<br />
periods are scarce (e.g. Janković, 2000; Kempe, 2003;<br />
Kempe <strong>and</strong> Rohr, 2003; Rohr, 2003, 2005; Given-<br />
Wilson, 2004). McCarthy <strong>and</strong> Breen (1997a, b) <strong>and</strong><br />
Ludlow (2005a) have shown that many unusual events<br />
recorded <strong>in</strong> the Annals are expla<strong>in</strong>ed by reference<br />
to modern knowledge of rare physical phenomena.<br />
This is not to imply that every record <strong>in</strong> the Annals is<br />
reliable. Some may be exaggerated, manipulated or<br />
fabricated accord<strong>in</strong>g to the motives of scribes (or later<br />
copyists). Underst<strong>and</strong><strong>in</strong>g the motives for the record<strong>in</strong>g<br />
of natural phenomena can aid <strong>in</strong> identify<strong>in</strong>g <strong>in</strong>stances<br />
of potential unreliability. Based upon assessments of<br />
the astronomical records <strong>in</strong> the Annals, McCarthy <strong>and</strong><br />
Breen (1997a, b) suggest that a primary motive for<br />
record<strong>in</strong>g arose from the <strong>in</strong>terpretation of astronomical<br />
phenomena (e.g. eclipses) as portents foretell<strong>in</strong>g<br />
the com<strong>in</strong>g of the Biblical Last Days. However,<br />
Ludlow (2005b) suggests that the desire to document<br />
weather extremes arose because, unlike the majority<br />
of astronomical phenomena, extremes often had an<br />
impact upon society (e.g. damage to crops, mortality of<br />
humans <strong>and</strong> animals).<br />
Of concern <strong>in</strong> <strong>in</strong>vestigat<strong>in</strong>g changes <strong>in</strong> the frequency<br />
of extremes recorded <strong>in</strong> historical sources is the<br />
representivity of derived trends. For example, it may be<br />
that a period, <strong>in</strong> which fewer extremes are recorded,<br />
reflects not an actual decrease <strong>in</strong> the occurrence<br />
of extremes, but a decrease <strong>in</strong> available records of<br />
extremes. This might arise from the destruction of<br />
sources or a lack of <strong>in</strong>terest <strong>in</strong> record<strong>in</strong>g the <strong>in</strong>formation<br />
at that time. What is commonly observed is a decrease<br />
<strong>in</strong> the frequencies of extremes <strong>in</strong> earlier portions of<br />
reconstructions. This may reflect a paucity of available<br />
records as much as any real decrease <strong>in</strong> extremes.<br />
Such issues may be <strong>in</strong>vestigated for the Annals once<br />
the digitisation of major texts by the CELT (Corpus of<br />
Electronic Texts) 4 project, University College Cork, is<br />
complete. This will allow a quantification of the number<br />
of entries (of all types, e.g. obituaries of important<br />
personages). This data is given <strong>in</strong> Figure 2.1, show<strong>in</strong>g<br />
the comb<strong>in</strong>ed number of entries available per year <strong>in</strong><br />
4 CELT, Irel<strong>and</strong>’s longest runn<strong>in</strong>g Humanities Comput<strong>in</strong>g<br />
project, br<strong>in</strong>gs Irish literary <strong>and</strong> historical culture onto the<br />
Internet. It <strong>in</strong>cludes a searchable onl<strong>in</strong>e textbase consist<strong>in</strong>g<br />
of 13.6 million words, <strong>in</strong> over 1100 contemporary <strong>and</strong><br />
historical documents from many areas, <strong>in</strong>clud<strong>in</strong>g literature<br />
<strong>and</strong> the other arts.<br />
5
<strong>Extreme</strong> <strong>Weather</strong>, <strong>Climate</strong> <strong>and</strong> <strong>Natural</strong> <strong>Disasters</strong> <strong>in</strong> Irel<strong>and</strong><br />
seven major texts from 431 ad to 1649 ad. 5 The thick<br />
l<strong>in</strong>e is the 10-year mov<strong>in</strong>g average: each text ends on<br />
a different year <strong>and</strong> f<strong>in</strong>al pages are often lost to decay<br />
or <strong>in</strong>terference, whilst <strong>in</strong> other cases scattered entries<br />
have been added through time. Though many entries<br />
are duplicated between the texts, each provides different<br />
densities of coverage <strong>in</strong> entries per year. The mean<br />
value for Fig. 2.1 is 29.5 entries per year (median 27,<br />
st<strong>and</strong>ard deviation 18.9). Because the available entries<br />
are not distributed through time evenly, the mean,<br />
median <strong>and</strong> st<strong>and</strong>ard deviation are unrepresentative for<br />
many periods. It is tempt<strong>in</strong>g to <strong>in</strong>terpret the variation <strong>in</strong><br />
Fig. 2.1 as reflect<strong>in</strong>g the level of record<strong>in</strong>g undertaken<br />
through time, with marked trends correspond<strong>in</strong>g to<br />
known phases of Irish history (e.g. low but <strong>in</strong>creas<strong>in</strong>g<br />
numbers from 431 ad might represent the progressive<br />
establishment of Christianity <strong>and</strong> the spread of literacy<br />
among monasteries). This is, however, speculative<br />
as the seven texts from which the data is drawn have<br />
often abbreviated (or <strong>in</strong>corporated already abbreviated<br />
versions of) earlier texts, while material <strong>in</strong> unknown<br />
texts may not be <strong>in</strong>corporated <strong>in</strong> the surviv<strong>in</strong>g Annals.<br />
Because duplicates are not removed, a proportion of<br />
5 (i) Annals of the Four Masters; (ii) Annals of Ulster; (iii)<br />
Annals of Inisfallen; (iv) Carew Fragment; (v) Annals<br />
of Tigernach; (vi) Annals of Loch Ce; (vii) Annals of<br />
Connaught.<br />
the variation <strong>in</strong> Fig. 2.1 is controlled by the number of<br />
texts provid<strong>in</strong>g coverage for given periods rather than<br />
the absolute number of records surviv<strong>in</strong>g for those<br />
periods.<br />
2.2 Chronologies of <strong>Extreme</strong>s from the<br />
Annals<br />
It is possible to obta<strong>in</strong> chronologies of the comb<strong>in</strong>ed<br />
records of extremes of w<strong>in</strong>d, precipitation <strong>and</strong><br />
temperature from the Annals. As noted above, these are<br />
derived from the seven major texts. Relevant records<br />
have been taken from the respective texts from about<br />
431 ad to the date of their cessation around 1600.<br />
The differ<strong>in</strong>g meteorological orig<strong>in</strong> <strong>and</strong> spatial extent<br />
of certa<strong>in</strong> extremes also necessitates the exclusion of<br />
some records to allow a comparison of like with like<br />
(e.g. <strong>in</strong> the frequency of extremes per 50-year period).<br />
This means that the derived chronologies are likely to<br />
describe trends <strong>in</strong> events or episodes across Irel<strong>and</strong><br />
rather than local events, for example <strong>in</strong> Munster. It is<br />
acknowledged that even large-scale synoptic systems<br />
(e.g. storms) may have a variable impact across<br />
relatively small geographical areas. This is highlighted<br />
by major storms such as the great 1703 ad storm that<br />
severely affected Engl<strong>and</strong> (Wheeler, 2003) be<strong>in</strong>g felt<br />
only moderately <strong>in</strong> Irel<strong>and</strong>, while the ‘night of the big<br />
Figure 2.1. Comb<strong>in</strong>ed available yearly records.<br />
Time: 431-1649 AD<br />
6
G. Kiely et al. (2007-CCRP-2.7)<br />
w<strong>in</strong>d’ <strong>in</strong> 1839 ad that strongly affected Irel<strong>and</strong> (Shields<br />
<strong>and</strong> Fitzgerald, 1989; Hickey, 2008) was felt with much<br />
less force <strong>in</strong> Engl<strong>and</strong> (Lamb <strong>and</strong> Frydendahl, 1991).<br />
2.2.1 <strong>Extreme</strong>s of W<strong>in</strong>d<br />
A composite chronology of extremes of w<strong>in</strong>d derived<br />
from the seven major annalistic texts over the period<br />
431 to 1649 is presented <strong>in</strong> Fig. 2.2. The frequency of<br />
extremes is provided per 50-year period <strong>in</strong> Fig. 2.2a <strong>and</strong><br />
the deviation from the average <strong>in</strong> Fig. 2.2b. The median<br />
frequency of extremes of w<strong>in</strong>d per 50-year period is 3.<br />
The problematic nature of averages derived from such<br />
time series is noted, with a low number of cases (i.e. low<br />
number of 50-year periods, with only 20 from 600–1599<br />
ad) <strong>and</strong> the low number of extremes recorded per period<br />
(rang<strong>in</strong>g from 0 to a maximum of 6). The averages may<br />
thus be sensitive to small changes <strong>in</strong> the number of<br />
recorded extremes <strong>and</strong> the selection time <strong>in</strong>crement<br />
(e.g. 50- vs. 20-year periods).<br />
2.2.2 <strong>Extreme</strong>s of Precipitation<br />
A composite chronology of extremes of precipitation<br />
from the seven major Annals, arranged <strong>in</strong> 50-year<br />
periods, is presented <strong>in</strong> Fig. 2.3. The frequency is<br />
shown of recorded wet events/episodes (<strong>in</strong> blue)<br />
versus the number of dry events/episodes (<strong>in</strong> orange).<br />
On four occasions, records <strong>in</strong>cluded as dry events/<br />
episodes may be considered as <strong>in</strong>dicat<strong>in</strong>g actual<br />
conditions of drought, while on one occasion a similar<br />
consideration applies to wet events/episodes. In<br />
the chronology of dry events/episodes, these four<br />
<strong>in</strong>volve large rivers dry<strong>in</strong>g out for a specific period,<br />
namely, the Galway river (Corrib) on three occasions<br />
(i.e. 1178 ad, 1191 ad, 1462 ad) <strong>and</strong> once the River<br />
Liffey <strong>in</strong> Dubl<strong>in</strong> (i.e. 1152 ad). However, the records<br />
do not <strong>in</strong>clude descriptions of drought to support a<br />
def<strong>in</strong>ite meteorological contribution. Several records<br />
describ<strong>in</strong>g notably hot summers are <strong>in</strong>cluded, though<br />
these do not automatically equate with drought.<br />
(a)<br />
(b)<br />
Figure 2.2. Frequency of w<strong>in</strong>d events, 431–1649 ad . (a) total number of events per 50-year period with a<br />
median of 3 <strong>and</strong> (b) the deviation from the average.<br />
7
<strong>Extreme</strong> <strong>Weather</strong>, <strong>Climate</strong> <strong>and</strong> <strong>Natural</strong> <strong>Disasters</strong> <strong>in</strong> Irel<strong>and</strong><br />
Figure 2.3. Frequency of wet/dry events/episodes, 431–1649 ad.<br />
The frequency of wet events/episodes per period ranged<br />
from 0 to 4, with an average of approximately 2. The<br />
first reliably recorded extreme occurs <strong>in</strong> 700–749 ad <strong>and</strong><br />
the number of recorded extremes varies from 1 to 2 per<br />
period until 900–949 ad, for which 4 extremes are noted.<br />
This is one of the highest observed values, matched<br />
only by one later period (1550–1599). The frequency<br />
cont<strong>in</strong>ues to vary between 1 <strong>and</strong> 2 from 950–1149 ad,<br />
before <strong>in</strong>creas<strong>in</strong>g to 3 events/episodes per period from<br />
1150–1249 ad. A notable aspect of the series is only 1<br />
record for 1250–1349 ad <strong>and</strong> none from 1350–1449 ad.<br />
This marks one of the most susta<strong>in</strong>ed periods of belowaverage<br />
records. A steady <strong>in</strong>crease <strong>in</strong> the number of<br />
events follows from 1450 ad, reach<strong>in</strong>g a peak of 4 <strong>in</strong> the<br />
1550–1599 ad period. This f<strong>in</strong>al peak corresponds to a<br />
period known for its series of cold <strong>and</strong> wet years across<br />
much of Europe ow<strong>in</strong>g to persistent low pressure centred<br />
over Sc<strong>and</strong><strong>in</strong>avia <strong>and</strong> much of North West Europe<br />
(Pfister, 2007). No event/episode is recorded for 1600–<br />
1649 ad, likely reflect<strong>in</strong>g the fall <strong>in</strong> records generally<br />
available <strong>in</strong> this period.<br />
2.2.3 <strong>Extreme</strong>s of Temperature<br />
For extremes of temperature (e.g. low temperatures,<br />
Fig. 2.4), the chronology comprises records from the<br />
Annals <strong>and</strong> several lesser texts <strong>and</strong> one non-annalistic<br />
source for 1601 ad (Stafford, 1633). A more extensive<br />
search for recorded extremes of cold can be found <strong>in</strong><br />
the proxy Greenl<strong>and</strong> Ice Sheet Project 2 (GISP2) ice<br />
core record of past volcanism <strong>and</strong> the Irish oak tree-r<strong>in</strong>g<br />
record. The chronologies are broadly representative<br />
of the trends that would be apparent were all relevant<br />
records <strong>in</strong> the lesser rema<strong>in</strong><strong>in</strong>g Annals <strong>in</strong>cluded. This<br />
may be <strong>in</strong>ferred from the relatively few additions to the<br />
chronology of extremes of cold from the lesser texts <strong>and</strong><br />
the general small volume of these texts <strong>in</strong> comparison<br />
to the seven major texts.<br />
Very few extremes of heat are recorded <strong>in</strong> the Annals.<br />
Cold events/episodes are well represented <strong>and</strong> more<br />
likely reflect the actual frequency of extremes of cold<br />
experienced through time, so a chronology derived<br />
from these has potential for further <strong>in</strong>vestigation <strong>in</strong><br />
terms of statistical analysis. <strong>Extreme</strong>s of cold are<br />
under-<strong>in</strong>vestigated <strong>in</strong> an Irish context; however, the<br />
Annals can afford the opportunity to test the response of<br />
biologically environmental proxies such as tree-r<strong>in</strong>gs to<br />
known extremes of cold. Spatial patterns of temperature<br />
also tend to vary less across larger geographical areas<br />
than do patterns of precipitation that are more prone<br />
to variation from local orographic <strong>in</strong>fluences (Croxton<br />
et al., 2006). Thus, recorded cold may be more<br />
representative of extremes experienced across Irel<strong>and</strong><br />
as a whole. Figure 2.4 depicts 83 recorded direct <strong>and</strong><br />
<strong>in</strong>direct proxy phenomena <strong>and</strong> observations from<br />
which low temperatures may be <strong>in</strong>ferred for Irel<strong>and</strong>,<br />
arranged <strong>in</strong> 50-year periods from 431–1649 ad. Of the<br />
83 recorded cold events, 47 (or 56.6%) are records<br />
of snowfall (often with descriptions of unusual depth,<br />
widespread geographical extent, <strong>and</strong>/or duration of<br />
snow cover). Twenty-seven (or 32.5%) are records<br />
of frost or ice on water bodies, while 9 (or 10.8%) are<br />
observations of generally cold conditions. Figure 2.4<br />
shows significant variation <strong>in</strong> the frequency of extremes<br />
<strong>in</strong>volv<strong>in</strong>g low temperatures through time. Figure 2.4<br />
8
G. Kiely et al. (2007-CCRP-2.7)<br />
Figure 2.4. Recorded <strong>in</strong>formation from which low temperatures may be <strong>in</strong>ferred.<br />
therefore presents the frequency of <strong>in</strong>dividual episodes<br />
of cold (whether each <strong>in</strong>volves several phenomena or<br />
only one). Chapter 5 presents an <strong>in</strong>vestigation of the<br />
relationship between extremes of cold reported <strong>in</strong> the<br />
Annals <strong>and</strong> Irish oak dendrochronological records, <strong>and</strong><br />
a comparison of extremes of cold <strong>in</strong> the Annals to the<br />
record of Northern Hemisphere volcanic eruptions <strong>in</strong> the<br />
GISP2 ice core.<br />
2.3 Conclusions<br />
The Annals provide a unique <strong>and</strong> valuable record of<br />
the climate between 400 ad <strong>and</strong> 1649. Information from<br />
the Annals on extremes may offer more potential for<br />
underst<strong>and</strong><strong>in</strong>g the nature of the climate signal <strong>in</strong> other<br />
proxies than a def<strong>in</strong>itive record of climate. It can advance<br />
<strong>in</strong>vestigat<strong>in</strong>g the relationship between the <strong>in</strong>cidence of<br />
extremes <strong>and</strong> the mean state of climate variables (i.e.<br />
precipitation) should an appropriate <strong>and</strong> sufficiently<br />
high-resolution record be developed as discussed <strong>in</strong><br />
Chapter 5. The trends <strong>in</strong> extremes of w<strong>in</strong>d, precipitation<br />
<strong>and</strong> temperature reveal potentially significant variations<br />
<strong>in</strong> Irel<strong>and</strong>’s weather. Evidence from the Annals may be<br />
compared to or comb<strong>in</strong>ed with <strong>in</strong>formation from proxies<br />
to improve underst<strong>and</strong><strong>in</strong>g. It is recommended that a<br />
systematic review of the Annals <strong>and</strong> other sources be<br />
undertaken for extreme event related material.<br />
9
<strong>Extreme</strong> <strong>Weather</strong>, <strong>Climate</strong> <strong>and</strong> <strong>Natural</strong> <strong>Disasters</strong> <strong>in</strong> Irel<strong>and</strong><br />
3 Proxy Records<br />
3.1 Introduction<br />
<strong>Climate</strong> reconstructions are <strong>in</strong> part based on climate<br />
proxy data. <strong>Climate</strong> proxies are measured variables<br />
that can be used to <strong>in</strong>fer climate attributes such as<br />
temperature, precipitation or storm<strong>in</strong>ess. Some proxy<br />
records, like oxygen isotopes <strong>in</strong> lake/cave deposits<br />
describe long-term trends <strong>in</strong> climate change, while others<br />
like tree r<strong>in</strong>gs <strong>and</strong> shipwrecks may represent s<strong>in</strong>gle<br />
extreme events. Irel<strong>and</strong>’s climate is strongly <strong>in</strong>fluenced<br />
by the Atlantic ocean. This creates markedly different<br />
climatic conditions to other European (cont<strong>in</strong>ental)<br />
regions <strong>and</strong> makes the use of palaeo-climate data from<br />
outside Irel<strong>and</strong> unsuitable. The literature on Irish proxy<br />
data is reviewed under the head<strong>in</strong>gs: (i) temperature<br />
proxies; (ii) hydrological proxies; <strong>and</strong> (iii) l<strong>and</strong>slides<br />
proxies. Shipwrecks as a proxy for storm<strong>in</strong>ess are also<br />
exam<strong>in</strong>ed briefly.<br />
3.1.1 Temperature Proxies<br />
Biotic proxies <strong>in</strong>clude tree r<strong>in</strong>gs, sub-fossil <strong>in</strong>sects <strong>and</strong><br />
pollen. Sub-fossil <strong>in</strong>sects have been used <strong>in</strong> palaeotemperature<br />
reconstruction, especially to identify the<br />
late glacial/early post-glacial transition (i.e the end<br />
of the last Ice Age, <strong>and</strong> the beg<strong>in</strong>n<strong>in</strong>g of the present<br />
period, e.g. Brooks <strong>and</strong> Birks, 2000; Coope <strong>and</strong><br />
Lemdahl, 1995). Pollen data have also been used <strong>in</strong><br />
several <strong>in</strong>vestigations of early Holocene environments<br />
<strong>in</strong> Irel<strong>and</strong>. For <strong>in</strong>stance, Haslett et al. (2006) used<br />
pollen data from Glendalough, Co. Wicklow to calibrate<br />
a temperature reconstruction model based on Bayesian<br />
statistics.<br />
Tree-r<strong>in</strong>g widths have been variously used as a proxy<br />
to reconstruct past precipitation levels, temperature,<br />
volcanic activity <strong>and</strong> meteor impacts (Briffa et al.,<br />
1983; Baillie <strong>and</strong> Munro, 1988; Baillie et al., 2000).<br />
Tree-r<strong>in</strong>g widths often correlate with both precipitation<br />
<strong>and</strong> temperature, but the correlation with precipitation<br />
appears more significant (García-Suárez, 2005).<br />
Isotopic measurements on tree cellulose generally<br />
reflect climate parameters more closely than r<strong>in</strong>g width<br />
<strong>and</strong> may be more specific <strong>in</strong> its application (Loader et<br />
al., 1995). In locations such as Irel<strong>and</strong>, there is a very<br />
clear climate signal from tree-r<strong>in</strong>g widths <strong>in</strong> stressed<br />
environments (high altitudes, northern forest marg<strong>in</strong>s,<br />
etc.) (Baillie, 1995). Some of the Irish temperature<br />
proxy records show a detailed picture, particularly of the<br />
step-wise progress of post-glacial warm<strong>in</strong>g. Among the<br />
Holocene temperature proxies, several records st<strong>and</strong><br />
out for their accuracy, resolution <strong>and</strong> dat<strong>in</strong>g. Given the<br />
number of potentially excellent lake, cave <strong>and</strong> treer<strong>in</strong>g-based<br />
archives available <strong>in</strong> Irel<strong>and</strong>, it should be<br />
possible <strong>in</strong> the future to produce enough well-dated,<br />
high-resolution temperature proxy records to achieve a<br />
comprehensive underst<strong>and</strong><strong>in</strong>g of Holocene temperature<br />
change <strong>in</strong> Irel<strong>and</strong>.<br />
3.1.2 Hydrological Proxies<br />
In this context, ‘hydrological proxy’ is used to <strong>in</strong>clude<br />
palaeo-precipitation, surface water, water-table depth<br />
<strong>and</strong> flood <strong>in</strong>dicators. In Irel<strong>and</strong> few natural archives<br />
have been identified that store palaeo-precipitation<br />
proxy data. Most Irish surface water proxy records have<br />
been generated through macrofossil, testate amoebae,<br />
humification, sub-fossil <strong>in</strong>sect <strong>and</strong> peat stratigraphic<br />
analyses of raised bog sediments. Most of these proxies<br />
are thought to reflect the climate patterns of a number<br />
of years or decades rather than of a s<strong>in</strong>gle grow<strong>in</strong>g<br />
season. This can be due to several factors, such as<br />
a lag time between climate <strong>and</strong> vegetation change or<br />
the structure <strong>and</strong> growth of raised bog systems, which<br />
accumulate plant material first <strong>in</strong> the ‘acrotelm’ (the<br />
aerated top layer of the bog above the water table).<br />
After some decades this material is <strong>in</strong>corporated <strong>in</strong>to<br />
the permanently waterlogged substructure of the bog<br />
(the ‘catotelm’) where it is subject to much slower<br />
decay rates <strong>and</strong> is thus less <strong>in</strong>fluenced by later climate<br />
regimes. Most of the proxy records described here po<strong>in</strong>t<br />
to climate trends rather than specific extreme weather<br />
events.<br />
Bog bursts, which may be caused by a comb<strong>in</strong>ation<br />
of <strong>in</strong>ternal stress on the peat <strong>and</strong> high precipitation,<br />
have been separated successfully from climate signals<br />
(Berm<strong>in</strong>gham <strong>and</strong> Delaney, 2005; Casparie, 2005;<br />
Geary <strong>and</strong> Caseld<strong>in</strong>e, 2006). In two studies, <strong>in</strong> Derryville<br />
Bog, Co. Tipperary <strong>and</strong> Tumbeagh Bog, Co. Offaly,<br />
beetles produced important evidence for catastrophic<br />
bog bursts (Gowen et al., 2005; Berm<strong>in</strong>gham <strong>and</strong><br />
10
G. Kiely et al. (2007-CCRP-2.7)<br />
Delaney, 2005). In both cases, the response of beetles<br />
to changes <strong>in</strong> the hydrology of the bog could be<br />
identified <strong>in</strong> changes <strong>in</strong> the composition of water beetle<br />
assemblages before <strong>and</strong> after the dated bog bursts<br />
(Reilly, 2005; 2006). However, the sample resolution<br />
of the <strong>in</strong>sect assemblages was coarse so the changes<br />
observed might not have been recognisable specifically<br />
as bog bursts.<br />
Tree-r<strong>in</strong>g width, large-scale dy<strong>in</strong>g <strong>and</strong> germ<strong>in</strong>ation<br />
events <strong>in</strong> oaks <strong>and</strong> the number of oaks found <strong>in</strong> lake <strong>and</strong><br />
bog archives have been used as proxies for adverse <strong>and</strong><br />
favourable hydrology affect<strong>in</strong>g tree growth (Leuschner<br />
et al., 2002; Turney et al., 2005, 2006). Furthermore,<br />
runoff <strong>and</strong> erosion, as measured by magnetic<br />
susceptibility <strong>and</strong> other lake level <strong>in</strong>dicators, may have<br />
been due to <strong>in</strong>creased precipitation. However, runoff<br />
could also have followed from catchment deforestation<br />
<strong>and</strong> may thus be an ambiguous proxy signal. In the An<br />
Loch Mor <strong>and</strong> Lough Maumeen cores, climate change<br />
evidence could be separated from deforestation signals<br />
s<strong>in</strong>ce l<strong>and</strong>scape change was recorded <strong>in</strong>dependently<br />
through pollen analysis (Holmes et al., 2007; Huang,<br />
2002). The first record shows low lake levels around<br />
8300, 7500 <strong>and</strong> 7000 cal bp <strong>and</strong> ris<strong>in</strong>g lake levels from<br />
6400 until ca. 5200 cal bp while the second <strong>in</strong>dicates<br />
wetter conditions between 6250 <strong>and</strong> 6000 cal bp, as<br />
well as dur<strong>in</strong>g the Little Ice Age.<br />
3.1.3 L<strong>and</strong>slide Proxies<br />
The destabilisation of sediments <strong>in</strong> mounta<strong>in</strong>ous areas<br />
may be caused by either extreme weather events or<br />
l<strong>and</strong>-use changes. For example, it often occurs <strong>in</strong> the<br />
wake of human-<strong>in</strong>duced deforestation. Ancient debris<br />
sometimes encases one or several lenses of peat that<br />
accumulated while there was no geomorphic impact<br />
on the f<strong>in</strong>d site. These peat lenses can be used to <strong>in</strong>fer<br />
palaeo-environmental <strong>in</strong>formation. Macrofossils or bulk<br />
samples of extracted peat from such lenses provide a<br />
dat<strong>in</strong>g tool while pollen may <strong>in</strong>form on l<strong>and</strong> use at the<br />
time of peat growth. The publications reviewed identify<br />
times with <strong>in</strong>creased debris aggradation as co<strong>in</strong>cident<br />
with cultural periods <strong>and</strong> deforestation. From the pollen<br />
records, it appears that the aggradation followed on from<br />
<strong>in</strong>creas<strong>in</strong>g <strong>in</strong>tensive l<strong>and</strong> use of the catchment, <strong>in</strong>clud<strong>in</strong>g<br />
deforestation. Changes <strong>in</strong> l<strong>and</strong> use are shown by<br />
pastoral <strong>and</strong> <strong>in</strong> some cases arable <strong>in</strong>dicator pollen. The<br />
authors of publications on geomorphic activity speculate<br />
that an <strong>in</strong>terplay between l<strong>and</strong>-use changes <strong>and</strong> extreme<br />
weather events such as big storms lead to downslope<br />
movement of destabilised sediments (Creighton et<br />
al., 2006). The periods of debris aggradation <strong>in</strong> the<br />
Macgillycuddy Reeks are partly based on the Gaddagh<br />
Valley record (Anderson et al., 2004) <strong>and</strong> partly on<br />
the Hags Glen, Glen Coomloughra <strong>and</strong> Curraghmore<br />
records (Anderson et al., 2000). Both these sources rely<br />
on only a few dates while the Mount Br<strong>and</strong>on record is<br />
based on 26 dates <strong>and</strong> the Upper Liffey Valley record<br />
on 18 dates. Conclusions overall must rema<strong>in</strong> general<br />
as there are neither enough exam<strong>in</strong>ed sites nor wellconstra<strong>in</strong>ed<br />
dates to provide a firm l<strong>in</strong>k between sites,<br />
proxy climate <strong>and</strong> l<strong>and</strong>-use evidence.<br />
3.2 General Conclusions<br />
While Irel<strong>and</strong> has many useful, high-resolution archives<br />
that have generated important proxy data of past climate<br />
trends <strong>and</strong> s<strong>in</strong>gle extreme events, significant gaps –<br />
particularly <strong>in</strong> temperature proxy records – rema<strong>in</strong>. While<br />
proxy records may record a s<strong>in</strong>gle extreme event, such<br />
as a major storm or volcanic eruption, they seldom give<br />
an accurate picture of the amplitude of the event. Other<br />
proxy records may be useful to <strong>in</strong>fer general trends of<br />
temperature <strong>and</strong> hydrology but their applicability may<br />
be limited <strong>in</strong> geographical <strong>and</strong> chronological terms.<br />
<strong>Climate</strong> proxy research <strong>in</strong> Irel<strong>and</strong> is relatively new.<br />
Improvements <strong>in</strong> dat<strong>in</strong>g <strong>and</strong> analytical techniques<br />
help to develop the potential of such studies. Irel<strong>and</strong>’s<br />
position on the Atlantic fr<strong>in</strong>ge of Europe makes it an<br />
important stage for climate research as both ocean<br />
<strong>and</strong> solar-mediated climate change hypotheses can<br />
potentially be tested. It is therefore important that the<br />
exist<strong>in</strong>g gaps <strong>in</strong> our proxy records are filled <strong>and</strong> the<br />
potential offered by tree r<strong>in</strong>gs, tephra <strong>and</strong> accelerated<br />
mass spectrometry (AMS), <strong>and</strong> wiggle-matched dat<strong>in</strong>g<br />
techniques, to produce high-resolution chronologies<br />
for multi-proxy climate records, are fully exploited. The<br />
current <strong>in</strong>vestigation of proxies notes that:<br />
● There is a lack of temporally well-resolved,<br />
temperature proxy records (apart from tree r<strong>in</strong>gs,<br />
see Chapter 5). However, general early Holocene<br />
warm<strong>in</strong>g, subsequent cool<strong>in</strong>g <strong>and</strong> variable<br />
temperature conditions <strong>in</strong> recent millennia may be<br />
<strong>in</strong>ferred from exist<strong>in</strong>g records;<br />
11
<strong>Extreme</strong> <strong>Weather</strong>, <strong>Climate</strong> <strong>and</strong> <strong>Natural</strong> <strong>Disasters</strong> <strong>in</strong> Irel<strong>and</strong><br />
●<br />
There are common <strong>in</strong>dications of wet periods from<br />
multiple hydrological proxies from multiple sites <strong>in</strong><br />
some <strong>in</strong>stances, <strong>in</strong>clud<strong>in</strong>g the periods 4450–4300 cal<br />
bp; 3500–3000 cal bp; 2800–2500 cal bp; 2000–1800<br />
cal bp <strong>and</strong> 1600–1050 cal bp. Conditions appeared to<br />
be dry thereafter, followed by wetter periods around<br />
850 cal bp <strong>and</strong> 200 cal bp. The 3500–3000 bp wet<br />
period co<strong>in</strong>cides with an upsurge <strong>in</strong> the construction<br />
of wooden trackways <strong>in</strong> the midl<strong>and</strong>s <strong>and</strong> with an<br />
<strong>in</strong>crease <strong>in</strong> hillfort settlements, which may be due<br />
to the wetter conditions, although cultural <strong>in</strong>fluences<br />
cannot be ruled out;<br />
●<br />
Analyses of other <strong>in</strong>dicators such as documentary<br />
shipwreck records <strong>and</strong> aggraded sediments are<br />
complicated by strong confound<strong>in</strong>g, non-climatic<br />
<strong>in</strong>fluences. For example, a large surge <strong>in</strong> reported<br />
<strong>in</strong>cidence of shipwrecks <strong>in</strong> the second half of the<br />
n<strong>in</strong>eteenth century is probably due to <strong>in</strong>creased<br />
report<strong>in</strong>g frequency <strong>and</strong> may be unrelated to an<br />
<strong>in</strong>dependent record of storm<strong>in</strong>ess. In the case of<br />
sediments, shifts <strong>in</strong> cultivation practices (possibly <strong>in</strong><br />
response to climatic <strong>in</strong>fluences) may be the strongest<br />
<strong>in</strong>fluence.<br />
12
G. Kiely et al. (2007-CCRP-2.7)<br />
4 Observational Records<br />
4.1 Introduction<br />
Precipitation, temperature <strong>and</strong> w<strong>in</strong>d speed records<br />
are available at 13 stations <strong>in</strong> the Republic of Irel<strong>and</strong>.<br />
Records date back to 1794 at Armagh. Other climatic<br />
variables – <strong>in</strong>clud<strong>in</strong>g radiation, soil temperature <strong>and</strong><br />
barometric pressure, <strong>and</strong>, at some locations, evaporation<br />
– are more recently available at the synoptic stations.<br />
In the 1990s many of the stations were automated<br />
with new <strong>in</strong>strumentation. At that time, there were as<br />
many as 2000 daily ra<strong>in</strong> stations around the country,<br />
although the number has been decreas<strong>in</strong>g over the last<br />
two decades. River records at flow stations around the<br />
country do not have the same longevity as many of the<br />
ra<strong>in</strong> stations, The river flow stations are managed by<br />
multiple agencies <strong>in</strong>clud<strong>in</strong>g: the Office of Public Works<br />
(OPW), the Environmental Protection Agency (EPA),<br />
the Electricity Supply Board (ESB), the county councils<br />
<strong>and</strong> others. Some are managed for flood flows while<br />
others for low flows.<br />
4.2 The Era of Instrumental <strong>Weather</strong><br />
Observations <strong>in</strong> Irel<strong>and</strong><br />
The era of regular, <strong>in</strong>strumental, meteorological<br />
observations <strong>in</strong> Irel<strong>and</strong> started <strong>in</strong> Armagh <strong>in</strong> 1794<br />
with barometric pressure <strong>and</strong> w<strong>in</strong>d direction (Hickey,<br />
2003). Records commenced <strong>in</strong> Duns<strong>in</strong>k, near Dubl<strong>in</strong>,<br />
around the same time (Butler et al., 2005). Various<br />
other meteorological quantities (e.g. soil temperature;<br />
García-Suárez <strong>and</strong> Butler, 2005) have been added<br />
s<strong>in</strong>ce the commencement of the Armagh record. More<br />
stations began record<strong>in</strong>g dur<strong>in</strong>g the n<strong>in</strong>eteenth century<br />
(Table 4.1), for example, the Botanic Gardens, Dubl<strong>in</strong> <strong>in</strong><br />
1801, Valentia <strong>in</strong> 1860 <strong>and</strong> Birr <strong>in</strong> 1872 (Shields, 1987;<br />
Rohan, 1986). Not all the early records are digitised,<br />
which makes them difficult or impossible to analyse.<br />
Locations of stations are shown <strong>in</strong> Fig. 4.1 with details<br />
<strong>in</strong> Table 4.1.<br />
4.3 Air Temperature<br />
The regional patterns of <strong>in</strong>creas<strong>in</strong>g air temperatures<br />
dur<strong>in</strong>g the twentieth century have also been noted <strong>in</strong><br />
records from various stations <strong>in</strong> Scotl<strong>and</strong> <strong>and</strong> Irel<strong>and</strong>.<br />
A comb<strong>in</strong>ed Scottish–Northern Irish temperature time<br />
series found that 23 of the warmest months, seasons<br />
<strong>and</strong> years (out of a total of 51 series: 17 time series <strong>and</strong><br />
3 locations) <strong>in</strong> the period 1861–2002 have occurred after<br />
1988. Wavelet analysis has shown that the temperature<br />
time series has a periodic component of a period of 7.8<br />
years, correspond<strong>in</strong>g to the period of the North Atlantic<br />
Oscillation (NAO) (Butler et al., 2005). Statistically<br />
significant <strong>in</strong>creas<strong>in</strong>g trends have been noted for<br />
twentieth-century annual <strong>and</strong> particularly March–May<br />
temperatures at Valentia, <strong>and</strong> annual <strong>and</strong> all seasonal<br />
temperatures, except December–February at Armagh.<br />
The annual 99th percentiles of daily maximum <strong>and</strong><br />
m<strong>in</strong>imum temperatures for four Irish stations s<strong>in</strong>ce the<br />
1950s are shown <strong>in</strong> Fig. 4.2. There are clear <strong>in</strong>creas<strong>in</strong>g<br />
trends for maxima <strong>and</strong> m<strong>in</strong>ima. The rate of <strong>in</strong>crease of<br />
the m<strong>in</strong>ima range is between 0.27 <strong>and</strong> 0.42 °C /10-year<br />
while the rate of <strong>in</strong>crease of the maxima range is from<br />
0.04 to 0.33 °C /10-year. The <strong>in</strong>creas<strong>in</strong>g trends were<br />
generally stronger for daily m<strong>in</strong>imum temperatures<br />
Table 4.1. List of selected cont<strong>in</strong>uous, long-term meteorological records <strong>in</strong> Irel<strong>and</strong>.<br />
Location<br />
Station type<br />
2008<br />
Current operator<br />
Start<br />
date<br />
End<br />
date<br />
Values measured<br />
Armagh Automated Armagh Obs. 1794 present P, WD, Ts, SD, M<br />
Birr Synoptic Met ÉÉireann 1872 present P, Pr, Ta, SD, M<br />
Galway Daily Met Éireann 1861 present Pr, Ta, M<br />
Dubl<strong>in</strong>(Botanic Gardens) Daily Met Éireann 1801 present Pr, Ta, M<br />
Dubl<strong>in</strong> (Phoenix Park) Daily Met Éireann 1829 present Pr, Ta, SD, M<br />
Valentia Synoptic Met Éireann 1860 present Pr, Ta, P<br />
P = Pressure; WD = W<strong>in</strong>d Direction; Pr = Precipitation; Ta = Air Temperature; Ts = Soil Temperature; SD = Sunsh<strong>in</strong>e Duration; M = More.<br />
See the Armagh Observatory website (http://climate.arm.ac.uk/) for a full description <strong>and</strong> Met Éireann’s website (http://www.met.ie/) for<br />
the station names, types <strong>and</strong> records.<br />
13
<strong>Extreme</strong> <strong>Weather</strong>, <strong>Climate</strong> <strong>and</strong> <strong>Natural</strong> <strong>Disasters</strong> <strong>in</strong> Irel<strong>and</strong><br />
Figure 4.1. Locations of hourly synoptic (temperature, ra<strong>in</strong>fall etc) stations <strong>and</strong> pan-evaporation used (from<br />
Met Éireann).<br />
14
G. Kiely et al. (2007-CCRP-2.7)<br />
Figure 4.2. Annual 99th percentiles of daily maximum <strong>and</strong> m<strong>in</strong>imum air temperatures from Birr, Dubl<strong>in</strong>, Mal<strong>in</strong><br />
Head <strong>and</strong> Valentia.<br />
15
<strong>Extreme</strong> <strong>Weather</strong>, <strong>Climate</strong> <strong>and</strong> <strong>Natural</strong> <strong>Disasters</strong> <strong>in</strong> Irel<strong>and</strong><br />
(both means <strong>and</strong> extrema) than for daily maximum<br />
temperatures. This <strong>in</strong>dicates a narrow<strong>in</strong>g of the mean<br />
daily temperature range. Compar<strong>in</strong>g the trends <strong>in</strong><br />
annual means of daily m<strong>in</strong>imum temperature <strong>and</strong> the<br />
99th percentiles of daily m<strong>in</strong>imum temperatures, it is<br />
noted that the <strong>in</strong>creas<strong>in</strong>g trends of the 99th percentiles<br />
exceed those of the annual means. This suggests a<br />
decrease <strong>in</strong> the likelihood of extremes of cold. The rate<br />
of <strong>in</strong>crease of both the maxima <strong>and</strong> m<strong>in</strong>ima exceeds<br />
the rate of <strong>in</strong>crease of the means, suggest<strong>in</strong>g that the<br />
extremes are becom<strong>in</strong>g more extreme.<br />
4.4 Ra<strong>in</strong>fall<br />
The locations of hourly ra<strong>in</strong>fall stations <strong>and</strong> panevaporation<br />
stations operated by Met Éireann are<br />
shown <strong>in</strong> Fig. 4.1. Hourly precipitation from the 13<br />
synoptic stations were exam<strong>in</strong>ed for: (a) <strong>in</strong>terannual<br />
variability of total precipitation; (b) <strong>in</strong>terannual variability<br />
of seasonal distribution; (c) hourly <strong>in</strong>tensity; (d)<br />
frequency of wet hours; (e) <strong>in</strong>tensity-duration-frequency<br />
(IDF) relationships. Significant <strong>in</strong>creas<strong>in</strong>g trends <strong>in</strong><br />
total annual precipitation were found for the west coast<br />
stations of Belmullet (42.1 mm decade -1 ), Valentia (48.2<br />
mm decade -1 ) <strong>and</strong> Mal<strong>in</strong> Head (23.6 mm decade -1 ) for<br />
the period 1957–2006. The year 2008 experienced the<br />
break<strong>in</strong>g of many ra<strong>in</strong>fall records throughout the country<br />
(Lennon <strong>and</strong> Walsh, 2008). Met Éireann’s 2008 annual<br />
weather summary stated: ‘Annual ra<strong>in</strong>fall totals were<br />
above normal everywhere <strong>and</strong> it was the wettest year<br />
for between six <strong>and</strong> 22 years generally, while Shannon<br />
Airport’s total of 1270 mm was the highest at the station<br />
s<strong>in</strong>ce it opened <strong>in</strong> 1945’ (Met Éireann, 2009).<br />
Met Éireann noted that 2009 was wetter than normal<br />
everywhere – annual ra<strong>in</strong>fall totals were well above<br />
normal for the second successive year. They ranged<br />
from 981 mm at Dubl<strong>in</strong> Airport to 2175 mm at Valentia<br />
(between 12% <strong>and</strong> 55% higher than the 30-year<br />
annual average amounts respectively). November was<br />
the wettest November s<strong>in</strong>ce records began at most<br />
stations <strong>and</strong> the wettest of any month on record <strong>in</strong><br />
several places. Annual totals were highest <strong>in</strong> over 50<br />
years at Mull<strong>in</strong>gar <strong>and</strong> Wexford, while at Valentia it was<br />
the highest s<strong>in</strong>ce records began <strong>in</strong> 1866. The annual<br />
number of wet days (>1 mm per day) was above normal<br />
everywhere by between 10 <strong>and</strong> 20% generally, with 145<br />
wet days <strong>in</strong> Dubl<strong>in</strong> <strong>and</strong> 231 wet days at Valentia (Met<br />
Éireann, 2010; Smith, 2010). While the ra<strong>in</strong>fall for the<br />
month of November 2009 was extreme, the 24-hour<br />
<strong>and</strong> 48-hour ra<strong>in</strong>falls immediately prior to the flood<strong>in</strong>g of<br />
19/20 November were not extreme.<br />
Figure 4.3 shows the average precipitation anomaly over<br />
all Irish synoptic stations (from the 1961–1990 mean).<br />
An <strong>in</strong>creas<strong>in</strong>g trend l<strong>in</strong>e <strong>in</strong> the series can be seen.<br />
Annual ra<strong>in</strong>fall series were analysed for change po<strong>in</strong>ts,<br />
<strong>and</strong> there is strong statistical evidence (P >0.95) that<br />
change po<strong>in</strong>ts <strong>in</strong> the annual total precipitation occurred<br />
for stations near the west coast: Belmullet, Claremorris,<br />
Mal<strong>in</strong> Head <strong>and</strong> Valentia, with a transition to <strong>in</strong>creased<br />
ra<strong>in</strong>fall levels be<strong>in</strong>g evident. The change po<strong>in</strong>ts were<br />
Figure 4.3. Total annual precipitation anomaly, arithmetic average over all stations.<br />
16
G. Kiely et al. (2007-CCRP-2.7)<br />
shown to have occurred between 1975 <strong>and</strong> 1978, with<br />
the exception of Belmullet, where the change po<strong>in</strong>t was<br />
estimated to be 1983. A very high (P >0.99) probability<br />
was associated with the Belmullet <strong>and</strong> Valentia change<br />
po<strong>in</strong>ts. No significant change po<strong>in</strong>ts were detected for<br />
stations <strong>in</strong> the rema<strong>in</strong>der of the country, nor for the<br />
Shannon station despite its proximity to the west coast.<br />
In general, most stations, particularly those <strong>in</strong> the east<br />
<strong>and</strong> south-east showed decreases <strong>in</strong> July ra<strong>in</strong>fall after<br />
1975, <strong>and</strong> all stations showed <strong>in</strong>creases <strong>in</strong> the March<br />
<strong>and</strong> October ra<strong>in</strong>fall.<br />
This analysis extends that of Kiely (1999), who used<br />
ra<strong>in</strong>fall data from synoptic stations up to 1995. It<br />
confirms an <strong>in</strong>crease <strong>in</strong> annual precipitation amounts<br />
<strong>and</strong> <strong>in</strong> the occurrence of extreme precipitation events<br />
<strong>in</strong> Irel<strong>and</strong>, particularly <strong>in</strong> the west of the country, post-<br />
1975. The change to wetter conditions was co<strong>in</strong>cident<br />
with a change <strong>in</strong> the seasonal pattern of the NAO. The<br />
change <strong>in</strong> the seasonal pattern of the NAO has also<br />
been noted by others (Werner et al., 2000; Visbeck et<br />
al., 2001). Most of the <strong>in</strong>crease <strong>in</strong> annual precipitation<br />
was observed dur<strong>in</strong>g the two months of March <strong>and</strong><br />
October. Storm events at the Valentia station that had<br />
a 30-year return period before 1975 were estimated to<br />
have a 10-year return period after 1975. Furthermore,<br />
<strong>in</strong> a rank<strong>in</strong>g exercise, it was found the seven highest<br />
annual Valentia precipitation totals for the entire record<br />
occurred after 1975, <strong>and</strong> the five lowest annual totals<br />
occurred before 1975.<br />
Increas<strong>in</strong>g ra<strong>in</strong>fall amounts post-1975 suggest that the<br />
ra<strong>in</strong>fall amounts are non-stationary. This is relevant as<br />
it suggests that the traditional methodology of analys<strong>in</strong>g<br />
ra<strong>in</strong>fall data based on the assumption of stationarity may<br />
no longer be valid. It is suggested that <strong>in</strong> determ<strong>in</strong><strong>in</strong>g<br />
ra<strong>in</strong>fall amounts for particular return periods that the<br />
shorter post-1975 data set be considered rather than<br />
the longer datasets.<br />
4.4.1 Storm<strong>in</strong>ess <strong>and</strong> Ra<strong>in</strong>fall<br />
To exam<strong>in</strong>e the variation <strong>in</strong> ra<strong>in</strong>storm magnitudes over<br />
the second half of the twentieth century, ra<strong>in</strong>-event<br />
<strong>in</strong>tensities were calculated over 1-, 3-, 4-, 6-, 8-, 12-,<br />
18- <strong>and</strong> 24-hour <strong>in</strong>tervals. For each duration, only<br />
unique (i.e. completely non-overlapp<strong>in</strong>g) events were<br />
considered. Follow<strong>in</strong>g the approach of Willems (2000),<br />
<strong>in</strong> the cases of events of less than 12-hour duration,<br />
only events separated by a m<strong>in</strong>imum of 12 hours were<br />
considered <strong>in</strong> order to ensure statistical <strong>in</strong>dependence.<br />
The top 20 events of each duration category were then<br />
selected <strong>and</strong> ranked by <strong>in</strong>tensity. The total number of<br />
events fall<strong>in</strong>g <strong>in</strong>to each time range (full time range, pre-<br />
1975 <strong>and</strong> post-1975) was tabulated. Intensity-durationfrequency<br />
curves were computed for several locations<br />
<strong>and</strong> compared across the three time ranges: (i) the<br />
full extent of the record; (ii) up to 1975; <strong>and</strong> (iii) after<br />
1975. The IDF relations were then calculated for return<br />
periods of 10 years <strong>and</strong> 30 years. The partial duration<br />
series (PDS) approach was used to calculate event<br />
magnitudes for several return periods (Madsen et al.,<br />
1997). A generalised Pareto (GP) distribution was fitted<br />
to the observed distribution of extreme values over a<br />
def<strong>in</strong>ed threshold, I 0<br />
. The threshold was determ<strong>in</strong>ed<br />
by sort<strong>in</strong>g the partial series <strong>in</strong> descend<strong>in</strong>g order by<br />
magnitude, <strong>and</strong> by truncat<strong>in</strong>g the partial series at 2.7<br />
times the number of years <strong>in</strong> the series of observations<br />
under consideration. The threshold value is the f<strong>in</strong>al<br />
value <strong>in</strong> the truncated series (Kiely 1999). The method<br />
of moments was used to estimate the GP distribution<br />
parameters. The IDF analyses showed an <strong>in</strong>crease <strong>in</strong><br />
storm event magnitude for return periods of 10 <strong>and</strong> 30<br />
years at many, but not all, stations after 1975, when<br />
compared to pre-1975 (Figure 4.4). However, for many<br />
stations these <strong>in</strong>creases were small (
<strong>Extreme</strong> <strong>Weather</strong>, <strong>Climate</strong> <strong>and</strong> <strong>Natural</strong> <strong>Disasters</strong> <strong>in</strong> Irel<strong>and</strong><br />
Figure 4.4. 10-year <strong>and</strong> 30-year <strong>in</strong>tensity-duration-frequency (IDF) relationships for Dubl<strong>in</strong> Airport <strong>and</strong> Valentia<br />
before <strong>and</strong> after 1975. It is noted that for the higher storm durations (>12 h) the precipitation depth for the 30-<br />
year storm (pre-1975) is similar to the precipitation depth for the 10-year storm (post-1975).<br />
4.5 Evaporation<br />
Stanhill <strong>and</strong> Moller (2008) recently reported evidence<br />
for the enhancement of the hydrologic cycle over<br />
Brita<strong>in</strong> <strong>and</strong> Irel<strong>and</strong> with the general <strong>in</strong>crease <strong>in</strong> panevaporation<br />
s<strong>in</strong>ce the mid-twentieth century. F<strong>in</strong>d<strong>in</strong>gs<br />
from the current research confirm this result, <strong>and</strong> also<br />
<strong>in</strong>vestigate these trends on a seasonal basis <strong>and</strong><br />
exam<strong>in</strong>e the spatial variability. Pan-evaporation is a<br />
reasonable approximation of actual evapotranspiration,<br />
as surface moisture availability is rarely a limit<strong>in</strong>g<br />
factor <strong>in</strong> the Irish climate. Total annual evaporation,<br />
averaged over all stations that satisfied data-coverage<br />
requirements (Ballyshannon, Boora, Fermoy,<br />
Johnstown, Poulaphouca, Rosslare <strong>and</strong> Valentia),<br />
shows a significant negative trend of -14.6 mm decade -1<br />
between 1967 <strong>and</strong> 2006. Statistically significant positive<br />
l<strong>in</strong>ear trends, <strong>in</strong>dicated by the F-test of the fitted trend<br />
l<strong>in</strong>e, were found for two stations <strong>in</strong> the south-east:<br />
Johnstown (35.0 mm decade -1 ) <strong>and</strong> Rosslare (32.9 mm<br />
decade -1 ). Significant negative trends were found for the<br />
Ballyshannon (-14.4 mm decade -1 ) <strong>and</strong> Poulaphouca<br />
(-33.1 mm decade -1 ) stations. Change po<strong>in</strong>t tests<br />
of the annual evaporation time series from Valentia<br />
revealed change po<strong>in</strong>ts at the end of 1974 <strong>and</strong> 1976<br />
respectively, with a probability greater than 0.99. This<br />
change po<strong>in</strong>t is co<strong>in</strong>cident with the change po<strong>in</strong>t <strong>in</strong> the<br />
Valentia annual precipitation series. The evaporation<br />
change po<strong>in</strong>ts were more spatially heterogeneous<br />
than the precipitation change po<strong>in</strong>ts, reveal<strong>in</strong>g different<br />
change po<strong>in</strong>ts <strong>in</strong> annual totals <strong>in</strong> different parts of the<br />
country. In general, stations far from the west coast<br />
such as Boora, Derrygreenagh, Dungarvan, John F.<br />
Kennedy Park, Poulaphouca <strong>and</strong> Kilkenny, all displayed<br />
significant change po<strong>in</strong>ts from either or both tests. Most<br />
of these change po<strong>in</strong>ts were detected around 1990.<br />
However, it should be noted that the relatively short<br />
evaporation records, most of which date back only to<br />
the 1960s, make it more difficult to detect a change<br />
po<strong>in</strong>t <strong>in</strong> the mid-1970s reliably. Statistically significant<br />
trends were observed <strong>in</strong> the annual series of monthly<br />
pan-evaporation from several stations.<br />
4.6 Droughts<br />
Low ra<strong>in</strong>falls <strong>in</strong> 1976 <strong>and</strong> 1995 <strong>in</strong> particular produced<br />
droughts <strong>in</strong> Irel<strong>and</strong> (MacCarthaigh, 1996). Dur<strong>in</strong>g<br />
the 1976 drought, most stations recorded negligible<br />
ra<strong>in</strong>fall for 60 consecutive days up to early September.<br />
Although an exam<strong>in</strong>ation of the ra<strong>in</strong>fall records shows<br />
that the 1976 drought was more prolonged than that of<br />
1995 <strong>in</strong> most of the country, river flows at the end of<br />
18
G. Kiely et al. (2007-CCRP-2.7)<br />
the 1995 drought were comparable to those measured<br />
at the end of the 1976 drought. MacCarthaigh (1996)<br />
noted that groundwater generally beg<strong>in</strong>s to recede <strong>in</strong><br />
early Spr<strong>in</strong>g <strong>and</strong> the trend of the recession is largely<br />
unaffected by subsequent ra<strong>in</strong>fall <strong>in</strong> late Spr<strong>in</strong>g <strong>and</strong><br />
Summer. A subsequent long period of negligible ra<strong>in</strong>fall,<br />
end<strong>in</strong>g <strong>in</strong> September, produced exceptionally low river<br />
flows.<br />
4.7 River Flows<br />
River flows for the three rivers (The Suir, The Nore,<br />
The Fergus) were exam<strong>in</strong>ed with results for The Suir<br />
shown <strong>in</strong> Fig. 4.5. It was found that the annual, March<br />
<strong>and</strong> October means all showed an <strong>in</strong>crease particularly<br />
after the change po<strong>in</strong>t years of around 1976. The trends<br />
co<strong>in</strong>cide with the <strong>in</strong>creases <strong>in</strong> precipitation over the<br />
latter quarter of the twentieth century.<br />
4.8 W<strong>in</strong>ds<br />
In Irel<strong>and</strong>, extreme w<strong>in</strong>ds are generally caused by<br />
large-scale mid-latitude depressions. These typically<br />
pass to the west or north of the country, track<strong>in</strong>g<br />
easterly or north-easterly (Logue, 1989). Surface w<strong>in</strong>d<br />
speeds are usually measured close to 10 m height<br />
<strong>and</strong> thus the long-term records may be unaffected by<br />
changes <strong>in</strong> the surface roughness from development<br />
or tree growth. Two studies comb<strong>in</strong><strong>in</strong>g observational<br />
<strong>and</strong> <strong>in</strong>strumental records of high w<strong>in</strong>d events <strong>in</strong> Irel<strong>and</strong><br />
showed an <strong>in</strong>crease <strong>in</strong> storm occurrence <strong>in</strong> Dubl<strong>in</strong> <strong>and</strong><br />
Armagh dur<strong>in</strong>g the 1970s <strong>and</strong> 1980s, <strong>and</strong> a decrease<br />
thereafter (Sweeney, 2000; Hickey, 2003). These<br />
studies also noted that trends of storm<strong>in</strong>ess <strong>in</strong> the last<br />
three decades of the twentieth century were spatially<br />
variable, with locations <strong>in</strong> the north-west of the country<br />
(Belmullet <strong>and</strong> Mal<strong>in</strong> Head) register<strong>in</strong>g an <strong>in</strong>crease,<br />
<strong>and</strong> stations <strong>in</strong> the north-east <strong>and</strong> south-west (Armagh<br />
<strong>and</strong> Valentia) register<strong>in</strong>g a decrease. In an analysis of<br />
w<strong>in</strong>d data from 1953–1987, a fall-off <strong>in</strong> extreme w<strong>in</strong>ds<br />
<strong>in</strong> the period after 1975 was observed, which was<br />
ascribed to a decrease <strong>in</strong> the occurrence of extreme<br />
w<strong>in</strong>dstorms (Logue, 1989). Bengtsson et al. (2006)<br />
noted that there are <strong>in</strong>dications of a poleward shift of<br />
storm tracks – a reduced frequency of Mediterranean<br />
storm tracks <strong>and</strong> a strengthen<strong>in</strong>g of the Atlantic storm<br />
tracks north of Brita<strong>in</strong> <strong>and</strong> Irel<strong>and</strong> – which is consistent<br />
with the trends noted <strong>in</strong> local precipitation time series<br />
(e.g. Kiely, 1999; Serrano et al., 1999). However, the<br />
impact of this poleward shift has yet to be studied for<br />
Irel<strong>and</strong>.<br />
Figure 4.5. Annual mean, maximum, March mean <strong>and</strong> October mean flow for The Suir at Newbridge.<br />
19
<strong>Extreme</strong> <strong>Weather</strong>, <strong>Climate</strong> <strong>and</strong> <strong>Natural</strong> <strong>Disasters</strong> <strong>in</strong> Irel<strong>and</strong><br />
4.9 L<strong>and</strong>slides <strong>and</strong> Bog Movements<br />
Shallow l<strong>and</strong>slides occur relatively <strong>in</strong>frequently <strong>in</strong><br />
upl<strong>and</strong> areas <strong>and</strong> can have long-lived geomorphological<br />
effects <strong>and</strong> shorter-lived, local environmental impacts<br />
(Dykes <strong>and</strong> Warburton, 2008). Work has recently been<br />
undertaken to catalogue known <strong>in</strong>cidences of l<strong>and</strong>slides<br />
<strong>in</strong> Irel<strong>and</strong> (Creighton et al., 2006). Almost 50% of<br />
l<strong>and</strong>slides <strong>in</strong> Irel<strong>and</strong> occur <strong>in</strong> peatl<strong>and</strong> areas, <strong>and</strong> such<br />
events typically occur <strong>in</strong> the months of July <strong>and</strong> August,<br />
<strong>in</strong> areas between 300 <strong>and</strong> 500 metres <strong>in</strong> elevation <strong>and</strong><br />
of 4–10 degrees <strong>in</strong> slope (Flem<strong>in</strong>g, 2009). Bog slides<br />
of upl<strong>and</strong> blanket peat are of particular <strong>in</strong>terest <strong>in</strong><br />
Irel<strong>and</strong>, given the extent of surface peat cover <strong>in</strong> these<br />
areas, <strong>and</strong> the potential for human fatality, fish kills <strong>and</strong><br />
damage to <strong>in</strong>frastructure. <strong>Extreme</strong> ra<strong>in</strong>falls, particularly<br />
follow<strong>in</strong>g relatively dry periods, <strong>and</strong> human disturbance<br />
such as cutt<strong>in</strong>g, digg<strong>in</strong>g of dra<strong>in</strong>age channels or<br />
construction activity are often cited as contribut<strong>in</strong>g<br />
factors (Creighton et al., 2006; Dykes <strong>and</strong> Warburton,<br />
2008). Past bog movements can be <strong>in</strong>ferred from<br />
presently visible surface geomorphological features<br />
(Feehan <strong>and</strong> O’Donovan, 1996) or may occur as dat<strong>in</strong>g<br />
anomalies <strong>in</strong> other palaeoenvironmental studies due<br />
to lateral transportation of material result<strong>in</strong>g <strong>in</strong> older<br />
material overly<strong>in</strong>g new (Caseld<strong>in</strong>e <strong>and</strong> Gearey, 2005).<br />
‘Dry shifts’ <strong>in</strong> hydrological proxies <strong>in</strong> peat may be the<br />
result of bog bursts rather than shifts <strong>in</strong> environmental<br />
conditions (Stefan<strong>in</strong>i, 2008). Intact peatl<strong>and</strong> marg<strong>in</strong>s<br />
provide the structural <strong>in</strong>tegrity of peatl<strong>and</strong>s aga<strong>in</strong>st<br />
failure as the marg<strong>in</strong>s conta<strong>in</strong> peat of higher density<br />
<strong>and</strong> lower hydraulic conductivity than peatl<strong>and</strong> central<br />
areas.<br />
4.10 Conclusions<br />
An <strong>in</strong>creas<strong>in</strong>g trend <strong>in</strong> annual m<strong>in</strong>imum temperatures<br />
s<strong>in</strong>ce the second half of the twentieth century was<br />
<strong>in</strong>dicated by the 99th percentile of daily m<strong>in</strong>imum values<br />
suggest<strong>in</strong>g reduced frequencies of cold episodes. Two<br />
stations <strong>in</strong> the east <strong>and</strong> midl<strong>and</strong>s also exhibit <strong>in</strong>creas<strong>in</strong>g<br />
annual maximum temperatures over the same period.<br />
An <strong>in</strong>creased annual <strong>and</strong> seasonal ra<strong>in</strong>fall (particularly<br />
March <strong>and</strong> October) s<strong>in</strong>ce 1975 was observed <strong>in</strong> the<br />
<strong>in</strong>strumental record. Precipitation IDF analysis shows that<br />
at several record<strong>in</strong>g stations there has been an <strong>in</strong>crease <strong>in</strong><br />
extreme ra<strong>in</strong>fall events s<strong>in</strong>ce the mid-1970s, with the 30-<br />
year ra<strong>in</strong>fall event pre-1975 similar <strong>in</strong> magnitude to a 10-<br />
year event post-1975 at some locations. Correspond<strong>in</strong>g<br />
trends were found for some river flows. These changes <strong>in</strong><br />
w<strong>in</strong>ter precipitation receipt <strong>and</strong> storm<strong>in</strong>ess are correlated<br />
with large-scale changes <strong>in</strong> the NAO. Increas<strong>in</strong>g <strong>and</strong><br />
spatially variable trends <strong>in</strong> pan-evaporation have also<br />
been observed <strong>in</strong> the records from the second half of<br />
the twentieth century, with stations <strong>in</strong> the south-east<br />
record<strong>in</strong>g strong positive trends <strong>in</strong> pan-evaporation<br />
dur<strong>in</strong>g the summer months. Given the conditions of the<br />
1976 drought, the comb<strong>in</strong>ation of <strong>in</strong>creased evaporation<br />
<strong>and</strong> reduced precipitation <strong>in</strong> the south-east dur<strong>in</strong>g the<br />
summer is a cause for concern.<br />
20
G. Kiely et al. (2007-CCRP-2.7)<br />
5 Synthesis<br />
This chapter comb<strong>in</strong>es documentary (Annals) with<br />
proxy (GISP2 ice core <strong>and</strong> Irish oaks tree-r<strong>in</strong>g) analysis.<br />
Firstly, spatial correlations <strong>in</strong> <strong>in</strong>strumental data are<br />
exam<strong>in</strong>ed to determ<strong>in</strong>e the spatial extent of events.<br />
5.1 Global <strong>and</strong> Regional <strong>Extreme</strong>s Trends<br />
<strong>in</strong> Meteorological Time Series<br />
Trends <strong>in</strong> globally averaged climatic values are not<br />
always reflected at the regional scales. Shifts or trends<br />
<strong>in</strong> mean conditions do not imply correspond<strong>in</strong>g changes<br />
<strong>in</strong> extremes.<br />
5.1.1 Temperatures<br />
The global average air temperature <strong>in</strong>creased for most<br />
of the twentieth century. The series of record-break<strong>in</strong>g<br />
mean surface air temperatures <strong>in</strong> the period 1990 to<br />
2009 is unprecedented <strong>in</strong> the modern, <strong>in</strong>strumental era<br />
<strong>and</strong> is unlikely (P
<strong>Extreme</strong> <strong>Weather</strong>, <strong>Climate</strong> <strong>and</strong> <strong>Natural</strong> <strong>Disasters</strong> <strong>in</strong> Irel<strong>and</strong><br />
Figure 5.1. Greenl<strong>and</strong> Ice Sheet Project 2 (GISP2) sample SO4 levels, 431–1984 ad.<br />
representative of a background of sulphate (e.g. from<br />
cont<strong>in</strong>ental dust sources, Legr<strong>and</strong>, 1997) <strong>and</strong> also from<br />
equatorial <strong>and</strong> Northern Hemisphere volcanic emissions<br />
(Ziel<strong>in</strong>ski et al. 1994; 1996).<br />
The SO 4<br />
record from the GISP2 core is presented <strong>in</strong><br />
Fig. 5.1 for the period 431 ad to 1984 ad along with<br />
its distribution <strong>in</strong> Fig. 5.2. The core is of sufficient<br />
resolution <strong>and</strong> accuracy to compare to the Annals.<br />
Background SO 4<br />
levels above zero may be observed<br />
<strong>in</strong> all cases, along with significant spikes <strong>in</strong>dicative of<br />
volcanic eruptions. The largest visible spike, dated to<br />
1257 ad, reaches an SO 4<br />
level of 380.6 ppb, the highest<br />
value observed for several millennia. Ironically, the<br />
location <strong>and</strong> identity of this volcano rema<strong>in</strong>s unknown<br />
(Stothers, 2000; 2003), but other known eruptions such<br />
as the Laki fissure eruption (1783–1874 ad) <strong>in</strong> Icel<strong>and</strong><br />
are clearly identifiable <strong>in</strong> the core (Ziel<strong>in</strong>ski et al., 1994).<br />
The trend towards <strong>in</strong>creased SO 4<br />
concentrations seen<br />
to beg<strong>in</strong> shortly before the twentieth century is attributed<br />
to anthropogenic activity (Mayewski et al., 1993) <strong>and</strong><br />
is clearly visible <strong>and</strong> can disguise volcanic signals. An<br />
association between eruptions registered <strong>in</strong> the GISP2<br />
<strong>and</strong> several episodes of cold recorded <strong>in</strong> Irel<strong>and</strong> has<br />
been recognised by McCormick et al. (2007) <strong>in</strong> the<br />
eight, n<strong>in</strong>th <strong>and</strong> tenth centuries ad. Here, a simple<br />
approach was adopted. The sample SO 4<br />
levels >45ppb<br />
are taken as potentially represent<strong>in</strong>g deposition from<br />
explosive (<strong>and</strong> hence more likely climatically effective)<br />
volcanism. The mean SO 4<br />
level for 431–1648 ad is 36.9<br />
Figure 5.2. Distribution of sample SO 4<br />
levels, Greenl<strong>and</strong> Ice Sheet Project 2 (GISP2), 431.8–1648.3 ad.<br />
22
G. Kiely et al. (2007-CCRP-2.7)<br />
ppb <strong>and</strong> the st<strong>and</strong>ard deviation is 22.4 ppb. However,<br />
the distribution of SO 4<br />
levels shown <strong>in</strong> Fig. 5.2 is skewed<br />
by the presence of relatively few very large values (most<br />
likely result<strong>in</strong>g from major explosive eruptions).<br />
A 45 ppb threshold is chosen <strong>in</strong> light of the skewed<br />
character of the distribution <strong>and</strong> to avoid omission of<br />
signals represent<strong>in</strong>g eruptions that may have been<br />
climatically effective <strong>in</strong> the Northern Hemisphere.<br />
This threshold dist<strong>in</strong>guishes 75 samples from the 585<br />
available for 431–1648 ad <strong>and</strong> discards 87.2% of the<br />
available samples. The value of 75 is comparable to the<br />
65 recorded cold episodes <strong>in</strong> the Annals over the same<br />
period.<br />
The SO 4<br />
dates are taken as <strong>in</strong>dicat<strong>in</strong>g a potential<br />
correspondence between an explosive eruption <strong>and</strong><br />
an unusually severe cold <strong>in</strong> Irel<strong>and</strong>. In Fig. 5.3, of<br />
the 75 relevant GISP2 SO 4<br />
samples, 29 (or 38.7%)<br />
correspond to 1 or more dated episodes of cold <strong>in</strong><br />
Irel<strong>and</strong>. Conversely, of the 65 episodes of cold, 26 (or<br />
40%) correspond to 1 or more of the 75 relevant GISP2<br />
samples. This is a significant observation <strong>and</strong> highlights<br />
the role of volcanism <strong>in</strong> forc<strong>in</strong>g episodes of extreme<br />
cold (<strong>and</strong> associated phenomena, such as heavy snow<br />
<strong>and</strong> prolonged frost) <strong>in</strong> Irel<strong>and</strong>.<br />
5.2.2 Irish Oak Dendrochronological Records<br />
5.2.2.1 Background<br />
Investigation of the potential for dendrochronology on<br />
the isl<strong>and</strong> of Irel<strong>and</strong> began <strong>in</strong> a concerted manner <strong>in</strong> the<br />
1970s with Baillie <strong>in</strong> Queen’s University, Belfast (e.g.<br />
Baillie, 1988) focus<strong>in</strong>g on the tree-r<strong>in</strong>g widths of sessile<br />
<strong>and</strong> pedunculate oaks (Quercus Petraea <strong>and</strong> Quercus<br />
Robur, respectively). Both species are native to Irel<strong>and</strong><br />
<strong>and</strong> were found to be suitable for the construction of<br />
long dendrochronological records because of their<br />
longevity, clear annual r<strong>in</strong>gs <strong>and</strong> a general absence<br />
of problems with miss<strong>in</strong>g, partial or false r<strong>in</strong>gs that<br />
caused difficulties with the construction of long treer<strong>in</strong>g<br />
width series from other species. The availability<br />
of modern liv<strong>in</strong>g oaks, timbers from historic build<strong>in</strong>gs<br />
<strong>and</strong> archaeological sites, <strong>and</strong> still older preserved<br />
sub-fossil oaks from peat bogs, lake marg<strong>in</strong>s <strong>and</strong><br />
river gravels meant that overlapp<strong>in</strong>g chronologies of<br />
r<strong>in</strong>g widths could be anchored <strong>in</strong> time to the present<br />
<strong>and</strong> extended <strong>in</strong>to the prehistoric period. Efforts <strong>in</strong><br />
chronology construction culm<strong>in</strong>ated <strong>in</strong> the creation of<br />
an unbroken 7,272-year oak tree-r<strong>in</strong>g chronology for<br />
Western Europe, compris<strong>in</strong>g a series from the North<br />
of Irel<strong>and</strong>, Brita<strong>in</strong> <strong>and</strong> Germany, complement<strong>in</strong>g each<br />
other (Pilcher et al., 1984). For dendroclimatic studies<br />
attempt<strong>in</strong>g to utilise tree-r<strong>in</strong>g chronologies to <strong>in</strong>fer past<br />
climate conditions, or reconstruct annual temperatures<br />
or precipitation, very high levels of replication are<br />
required to m<strong>in</strong>imise local climatic or non-climatic<br />
<strong>in</strong>fluences (Jones et al., 2009). The possibility for oak<br />
chronologies <strong>in</strong> Irel<strong>and</strong> <strong>and</strong> Europe to allow quantitative<br />
reconstruction of annual temperature <strong>and</strong> precipitation<br />
was <strong>in</strong>vestigated <strong>in</strong> the 1970s <strong>and</strong> 1980s (e.g. Briffa et<br />
al., 1983a, b). A significant problem with the use of Irish<br />
oak r<strong>in</strong>g widths relates to Irel<strong>and</strong>’s maritime climate.<br />
An example of the complex relationship of oak growth<br />
to climate is provided by an observed strong negative<br />
growth response to warm Irish w<strong>in</strong>ters.<br />
There is evidence that Irish oaks reflect, via notably<br />
depressed growth, many environmental <strong>and</strong> climatic<br />
disturbances such as the reputedly volcanically <strong>in</strong>duced<br />
‘year without a summer’ of 1816 ad (Baillie, 1995).<br />
Whether oaks consistently register similar responses<br />
to cold episodes as recorded <strong>in</strong> the Annals (many also<br />
probably <strong>in</strong>duced by volcanic eruptions), is unknown.<br />
Although severe cold <strong>and</strong> frost are known to stress oaks<br />
(e.g. Thomas et al., 2002), for these to have a notable<br />
effect, it is probable that they must occur dur<strong>in</strong>g the<br />
grow<strong>in</strong>g season (i.e. April to September/October).<br />
5.2.2.2 Comparison with Documentary Sources<br />
Here, a simple comparison of the Irish<br />
dendrochronoligical oak research <strong>and</strong> studies of the<br />
Annals is presented, with a focus on recorded cold<br />
episodes. The oak record used for comparison is a<br />
st<strong>and</strong>ardised <strong>in</strong>dex chronology provided by Baillie,<br />
Queen’s University, Belfast. This chronology comprises<br />
multiple-site chronologies from Irel<strong>and</strong>, <strong>in</strong> which<br />
mean tree-r<strong>in</strong>g widths are smoothed statistically by<br />
application of a 30-year tapered cubic spl<strong>in</strong>e, <strong>and</strong> vary<br />
about a long-term mean of 100. This removes longterm<br />
trends of non-climatic orig<strong>in</strong>, aris<strong>in</strong>g, for example,<br />
where the chronology comprises young trees tend<strong>in</strong>g to<br />
exhibit wider (i.e. early growth) r<strong>in</strong>gs. Two periods for<br />
which episodes of recorded cold are pronounced (i.e.<br />
750–799 ad <strong>and</strong> 1250–1299 ad, each with six episodes)<br />
23
<strong>Extreme</strong> <strong>Weather</strong>, <strong>Climate</strong> <strong>and</strong> <strong>Natural</strong> <strong>Disasters</strong> <strong>in</strong> Irel<strong>and</strong><br />
Figure 5.3. Greenl<strong>and</strong> Ice Sheet Project 2 (GISP2) sample SO4 volcanic signals <strong>and</strong> associated cold episodes, 431–1648 ad<br />
24
G. Kiely et al. (2007-CCRP-2.7)<br />
are extracted from the overall <strong>in</strong>dex chronology. For<br />
750–799 ad, the mean of the extracted <strong>in</strong>dex values<br />
is 101.5, st<strong>and</strong>ard deviation 9.9, m<strong>in</strong>imum value 83.0.<br />
For 1250–1299 ad, the mean is 99.8, st<strong>and</strong>ard deviation<br />
8.9, m<strong>in</strong>imum value 80.0. Figure 5.4 presents each<br />
<strong>in</strong>dexed r<strong>in</strong>g width value per period as a departure<br />
from the respective mean, with horizontal l<strong>in</strong>es mark<strong>in</strong>g<br />
departures equall<strong>in</strong>g or exceed<strong>in</strong>g 0.5 <strong>and</strong> 1 st<strong>and</strong>ard<br />
deviation below the mean.<br />
For 750–799 ad, 25 of the 50 <strong>in</strong>dexed r<strong>in</strong>g width values<br />
are below the mean. Eight (16%) are 1 st<strong>and</strong>ard<br />
deviation (SD) or further below the mean. Allow<strong>in</strong>g a<br />
marg<strong>in</strong> of 3 years follow<strong>in</strong>g the date of recorded cold,<br />
where<strong>in</strong> any growth below the average is deemed<br />
a potential match, then all 6 dates of cold <strong>in</strong> the first<br />
period (760, 762, 764, 780, 789, 799 ad) correspond to<br />
observed <strong>in</strong>dex values below the mean. Of the 18 years<br />
for which growth is at least 0.5 SD below average, 7<br />
(38.9%) correspond to recorded cold with<strong>in</strong> the marg<strong>in</strong><br />
set out above. The relevant years of cold are 760, 764,<br />
780, 789 <strong>and</strong> 799 (or 5 of 6 years with recorded cold<br />
episodes for the period). Of the 7 years for which growth<br />
is at least 1 SD below the average, 2 (28.6%) correspond<br />
to recorded cold with<strong>in</strong> the allowed marg<strong>in</strong> (the relevant<br />
years of cold be<strong>in</strong>g 780 <strong>and</strong> 789 ad). Similar results are<br />
observed for the 1250–1299 ad period. All 6 recorded<br />
cold episodes (1251, 1270, 1271, 1280, 1281/1282,<br />
1296 ad) correspond to years of below average r<strong>in</strong>g<br />
growth.<br />
Of the 14 years for which growth is at least 0.5 SD<br />
below average, 28.6% correspond to a date of cold<br />
(1251, 1270, 1271, 1280 <strong>and</strong> 1281/1282 ad, 5 of the<br />
6 recorded dates of cold <strong>in</strong> the Annals). Of the 8 years<br />
where growth is at least 1 SD below average, 37.5%<br />
correspond to recorded cold for 1251, 1271, 1280<br />
<strong>and</strong> 1281/1282 ad. From this simple analysis, it may<br />
be tentatively proposed that episodes of cold may be<br />
registered by the Irish oaks by decreased averaged<br />
growth of at least 0.5 SD below the average. It is also<br />
clear that more years of notably depressed growth<br />
exist than there are recorded episodes of cold. This<br />
may imply that not all such episodes are recorded <strong>in</strong><br />
Figure 5.4. Indexed r<strong>in</strong>g widths, departures from means, 750–799 ad <strong>and</strong> 1250–1299 ad.<br />
25
<strong>Extreme</strong> <strong>Weather</strong>, <strong>Climate</strong> <strong>and</strong> <strong>Natural</strong> <strong>Disasters</strong> <strong>in</strong> Irel<strong>and</strong><br />
the Annals. However, numerous other factors may<br />
be proposed to expla<strong>in</strong> reduced oak growth, some of<br />
which are non-climatic, such as pest outbreaks or the<br />
deliberate coppic<strong>in</strong>g of trees for human consumption of<br />
oak timbers, known to produce reduced tree-r<strong>in</strong>g widths<br />
<strong>in</strong> many species <strong>in</strong> follow<strong>in</strong>g years (Rackham, 1990).<br />
Of the potential additional climatic factors, extremes<br />
of precipitation (wet <strong>and</strong> dry) are a further potential<br />
<strong>in</strong>fluence, as are storm events where branches are torn<br />
from trees, potentially <strong>in</strong>duc<strong>in</strong>g growth decreases as<br />
seen after coppic<strong>in</strong>g.<br />
5.3 Conclusions<br />
● Annual ra<strong>in</strong>fall extremes, extracted from multi-year<br />
series as 99th percentile amounts are far more<br />
spatially variable than daily precipitation amounts.<br />
While the 50% decorrelation distance for annual<br />
ra<strong>in</strong>fall <strong>in</strong> Irel<strong>and</strong> <strong>and</strong> Brita<strong>in</strong> is approximately 240<br />
km, the annual 99th percentiles of daily ra<strong>in</strong>fall are<br />
correlated by less than 50% over all distances. This<br />
●<br />
●<br />
●<br />
illustrates the localised nature of extremes, <strong>and</strong> the<br />
benefit of consider<strong>in</strong>g multiple, spatially distributed<br />
proxies when possible.<br />
There is a correspondence between <strong>in</strong>cidents<br />
of reported cold <strong>in</strong> the documentary evidence<br />
(Annals) <strong>and</strong> the record of explosive volcanism (with<br />
consequent cool<strong>in</strong>g effects) from the GISP2 ice core.<br />
Tree-r<strong>in</strong>g chronologies from multiple locations<br />
offer a means of overcom<strong>in</strong>g the localised nature<br />
of <strong>in</strong>dividual proxies. Many, but not all, low-growth<br />
years from the ‘Belfast’ oak chronology, derived from<br />
oaks from most of Irel<strong>and</strong>, correspond with episodes<br />
of cold reported <strong>in</strong> the Annals.<br />
More than 50 bog burst or ‘l<strong>and</strong>slides’ <strong>in</strong> peatl<strong>and</strong>s<br />
have occurred <strong>in</strong> the past century. They are the<br />
results of extremes <strong>in</strong> ra<strong>in</strong>fall follow<strong>in</strong>g dry periods<br />
(sometimes associated with human activities) <strong>and</strong><br />
have led to loss of human life as well as extensive<br />
ecosystem degradation.<br />
26
G. Kiely et al. (2007-CCRP-2.7)<br />
6 Conclusions<br />
6.1 Summary Conclusions<br />
While this study has used a comprehensive reference<br />
list of over 70 published <strong>and</strong> unpublished proxy climate<br />
<strong>in</strong>dicators for Irel<strong>and</strong>, it is still apparent that because of the<br />
localised nature of most of the <strong>in</strong>dicators, extrapolation to<br />
regional scales is difficult. ‘Colder’ or ‘wetter’ periods may<br />
be identifiable from the known records, but <strong>in</strong>dividual<br />
events are harder to discern, <strong>and</strong> ascrib<strong>in</strong>g magnitudes<br />
to either events or climatic shifts is not currently possible.<br />
However, some overall conclusions can be made from the<br />
proxy sources, particularly with respect to hydrological<br />
changes. Nevertheless, there are enough well-dated<br />
records <strong>in</strong> the dataset to ga<strong>in</strong> an impression of past<br />
hydrological conditions <strong>in</strong> Irel<strong>and</strong>. Periods of <strong>in</strong>creased<br />
wetness emerge from records between 4450 <strong>and</strong> 4300<br />
cal bp, between ca. 3500 <strong>and</strong> 3000 cal bp, between<br />
2800 <strong>and</strong> 2500 cal bp, around 2000 <strong>and</strong> 1800 cal bp<br />
<strong>and</strong> between 1600 <strong>and</strong> 1050 cal bp, particularly around<br />
1400 cal bp. After a drier <strong>in</strong>terval, conditions become wet<br />
aga<strong>in</strong> around 1100 cal bp, <strong>and</strong> aga<strong>in</strong> at 850 <strong>and</strong> 200 cal<br />
bp. The temperature proxies h<strong>in</strong>t at warm<strong>in</strong>g <strong>in</strong> the early<br />
to mid-Holocene <strong>and</strong> some cool<strong>in</strong>g <strong>and</strong> more unsettled<br />
conditions <strong>in</strong> recent millennia, but they have <strong>in</strong>sufficient<br />
temporal resolution to cross-check records aga<strong>in</strong>st each<br />
other or to provide <strong>in</strong>formation on changes at the decadal<br />
or even centennial scale. However, the ‘Belfast’ tree-r<strong>in</strong>g<br />
chronology does provide an opportunity to exam<strong>in</strong>e<br />
summers of lower than average temperatures, several of<br />
which have been observed to correspond with episodes<br />
of reported cold <strong>in</strong> the documentary evidence, as well<br />
as the ‘year without a summer’ follow<strong>in</strong>g the Tambora<br />
eruption <strong>in</strong> 1815.<br />
Documentary sources offer the potential for isolat<strong>in</strong>g<br />
<strong>in</strong>dividual extreme events, particularly cold episodes,<br />
but long-term trends or patterns may be difficult to<br />
isolate because of changes <strong>in</strong> record density over<br />
time. From a statistical comparison of documentary<br />
evidence of cold events <strong>in</strong> the Annals <strong>and</strong> the record of<br />
volcanic events from the Greenl<strong>and</strong> GISP2 core, of 65<br />
reported <strong>in</strong>dependent cold episodes, 40% correspond<br />
to large volcanic signals <strong>in</strong> the GISP2 ice core. This<br />
result, comb<strong>in</strong>ed with the widely reported ‘year without<br />
a summer’ <strong>in</strong> 1816, follow<strong>in</strong>g the Tambora eruption<br />
illustrates the <strong>in</strong>fluence of remote volcanic events<br />
on summertime temperatures, <strong>and</strong> consequently on<br />
agricultural productivity <strong>in</strong> Irel<strong>and</strong>. As noted above,<br />
the Annals suggest evidence of dry events/episodes<br />
<strong>in</strong>volv<strong>in</strong>g the dry<strong>in</strong>g of large rivers, namely, the Galway<br />
river (the Corrib) on three occasions (i.e. 1178 ad, 1191<br />
ad, 1462 ad) <strong>and</strong> once the River Liffey <strong>in</strong> Dubl<strong>in</strong> (i.e.<br />
1152 ad).<br />
Results from a comparison of the documentary <strong>and</strong><br />
dendrochronological evidence are less conclusive.<br />
Several years of reduced oak growth correspond<br />
with recorded cold episodes <strong>in</strong> the Annals, but any<br />
relationship may be at least partly disguised by<br />
autocorrelation <strong>in</strong> the oak chronologies. To improve<br />
confidence between the records, more robust methods<br />
of comparison should be sought <strong>and</strong> over longer time<br />
scales.<br />
6.2 Key F<strong>in</strong>d<strong>in</strong>gs<br />
● From the documentary sources (the Gaelic Annals)<br />
there is much evidence for extremes of climate<br />
through the centuries. The data is qualitative <strong>and</strong> it is<br />
not yet possible to ascribe return periods to extremes<br />
events. A proportion of cold events <strong>in</strong> the Annals is<br />
l<strong>in</strong>ked to volcanic events.<br />
● From proxy records (e.g. Belfast tree r<strong>in</strong>gs, GISP2<br />
ice core record) frequencies of extreme events can<br />
be ascribed, but it is not possible to quantify the<br />
magnitude of events.<br />
● The <strong>in</strong>strumental record s<strong>in</strong>ce about 1950 (e.g.<br />
temperature, ra<strong>in</strong>fall, w<strong>in</strong>d), which is extensive <strong>and</strong><br />
of high quality, is our best quantitative source <strong>and</strong><br />
is managed by Met Éireann. Very few digitised data<br />
sets exist prior to 1950. River records prior to 1980<br />
are sparse <strong>and</strong> <strong>in</strong> the case of many rivers, the data is<br />
of questionable quality. From the <strong>in</strong>strumental record<br />
it can be noted that:<br />
◊ The annual 99th percentiles of daily maximum<br />
<strong>and</strong> m<strong>in</strong>imum temperatures show clear<br />
<strong>in</strong>creas<strong>in</strong>g trends for maxima <strong>and</strong> m<strong>in</strong>ima. The<br />
rates of <strong>in</strong>crease of the m<strong>in</strong>ima range between<br />
0.27 <strong>and</strong> 0.42 °C /10-year while the rate of<br />
27
<strong>Extreme</strong> <strong>Weather</strong>, <strong>Climate</strong> <strong>and</strong> <strong>Natural</strong> <strong>Disasters</strong> <strong>in</strong> Irel<strong>and</strong><br />
◊<br />
◊<br />
◊<br />
<strong>in</strong>crease of the maxima is lower <strong>and</strong> range from<br />
0.04 to 0.33 °C /10-year. The <strong>in</strong>creas<strong>in</strong>g trends<br />
were generally stronger for daily m<strong>in</strong>imum<br />
temperatures (both means <strong>and</strong> extrema) than<br />
for daily maximum temperatures. This <strong>in</strong>dicates<br />
a narrow<strong>in</strong>g of the mean daily temperature<br />
range. Compar<strong>in</strong>g the trends <strong>in</strong> annual means<br />
of daily m<strong>in</strong>imum temperature <strong>and</strong> the 99th<br />
percentiles of daily m<strong>in</strong>imum temperatures, it<br />
is noted that the <strong>in</strong>creas<strong>in</strong>g trends of the 99th<br />
percentiles exceed those of the annual means,<br />
suggest<strong>in</strong>g a decrease <strong>in</strong> the likelihood of<br />
extremes of cold. The rate of <strong>in</strong>crease of both<br />
the maxima <strong>and</strong> m<strong>in</strong>ima exceeds the rate of<br />
<strong>in</strong>crease of the means, suggest<strong>in</strong>g that the<br />
extremes are becom<strong>in</strong>g more extreme;<br />
There was a shift <strong>in</strong> ra<strong>in</strong>fall patterns of the postmid<br />
1970s record by comparison with the pre-<br />
1975 record. The post-1975 record shows that<br />
the annual ra<strong>in</strong>fall amounts have <strong>in</strong>creased by<br />
approximately 10% over the pre-1975 amounts<br />
<strong>in</strong> the western half of Irel<strong>and</strong>. Most of the 10%<br />
annual <strong>in</strong>crease was found <strong>in</strong> the two months<br />
of March <strong>and</strong> October, with the <strong>in</strong>crease be<strong>in</strong>g<br />
<strong>in</strong> the number of wet hours/days rather than <strong>in</strong><br />
ra<strong>in</strong>fall <strong>in</strong>tensities;<br />
Analysed <strong>in</strong> terms of return periods, what was<br />
deemed a 30-year storm (ra<strong>in</strong>fall amount)<br />
prior to 1975 is now closer to a 10-year return<br />
period for storm durations >12 hours. This has<br />
implications for eng<strong>in</strong>eer<strong>in</strong>g design (e.g. bridge<br />
structures, flood magnitude etc.) where it is now<br />
more conservative (safer) to use the shorter<br />
post-1975 record to estimate the particular<br />
return period ra<strong>in</strong> amounts rather than the<br />
longer observations record (<strong>in</strong> some cases<br />
back to 1940). This change is also observed <strong>in</strong><br />
some river flow records;<br />
The ra<strong>in</strong>fall changes correspond to changes <strong>in</strong><br />
the NOA;<br />
sometimes compounded by human activities <strong>and</strong><br />
have led to loss of human life as well as extensive<br />
ecosystem degradation. Intact peatl<strong>and</strong> marg<strong>in</strong>s<br />
(e.g. near streams) provide the structural <strong>in</strong>tegrity of<br />
peatl<strong>and</strong>s aga<strong>in</strong>st failure as the marg<strong>in</strong>s conta<strong>in</strong> peat<br />
of higher density <strong>and</strong> lower hydraulic conductivity<br />
than peatl<strong>and</strong> central areas.<br />
6.3 Recommendations<br />
1 The establishment of a national repository for<br />
all data with potential for palaeoenvironmental<br />
reconstruction. Site <strong>in</strong>vestigators should be required<br />
to notify such a repository of their f<strong>in</strong>d<strong>in</strong>gs, cores<br />
retrieved, <strong>and</strong> so on. There is excellent potential <strong>in</strong><br />
lake, cave <strong>and</strong> tree r<strong>in</strong>g-based archives to produce<br />
enough well-dated, high-resolution temperature<br />
proxy record of Holocene temperatures <strong>in</strong> Irel<strong>and</strong>.<br />
2 An exam<strong>in</strong>ation of further early texts for weatherrelated<br />
references (e.g. the Annals); comparison<br />
of w<strong>in</strong>d reports <strong>in</strong> the Annals to other proxies<br />
of environmental <strong>and</strong> climatic <strong>in</strong>formation (e.g.<br />
reflect<strong>in</strong>g the state of the NAO) will be important<br />
<strong>in</strong> further underst<strong>and</strong><strong>in</strong>g of Irel<strong>and</strong>’s past w<strong>in</strong>d<br />
regime. Evidence of impacts (fam<strong>in</strong>e, <strong>in</strong>frastructural<br />
damage, disease) <strong>in</strong> the texts may also be a suitable<br />
area for further study.<br />
3 A reanalysis of the Belfast tree-r<strong>in</strong>g chronologies<br />
with the specific purpose of palaeoenvironmental<br />
reconstruction. Secondary <strong>in</strong>formation can be used<br />
<strong>in</strong> addition to tree-r<strong>in</strong>g widths to <strong>in</strong>fer additional<br />
climatic <strong>in</strong>formation.<br />
4 Digitisation <strong>and</strong> web dissem<strong>in</strong>ation of the rema<strong>in</strong><strong>in</strong>g<br />
undigitised meteorological records, follow<strong>in</strong>g the<br />
example of Armagh Observatory is desirable.<br />
5 An effort to collate <strong>in</strong>strumental data from dispersed,<br />
fragmentary sources such as weather diaries.<br />
6 A systematic homogenisation effort of the best<br />
available <strong>in</strong>strumental series, draw<strong>in</strong>g on the full<br />
network of daily ra<strong>in</strong> gauges.<br />
●<br />
◊ Summer <strong>in</strong>creases <strong>in</strong> evaporation <strong>and</strong><br />
decreases <strong>in</strong> precipitation <strong>in</strong> the south-east<br />
result <strong>in</strong> reduced available water <strong>and</strong> may exert<br />
seasonal pressure on water resources.<br />
More than 50 bog burst or ‘l<strong>and</strong>slides’ <strong>in</strong> peatl<strong>and</strong>s<br />
have occurred <strong>in</strong> the past century. They are the<br />
result of extremes <strong>in</strong> ra<strong>in</strong>fall follow<strong>in</strong>g dry periods <strong>and</strong><br />
7 The lack of adequate river data for monitor<strong>in</strong>g/<br />
analysis/research purposes is due to the multiplicity<br />
of authorities with overlapp<strong>in</strong>g briefs <strong>in</strong>volved <strong>in</strong><br />
river monitor<strong>in</strong>g. There is an acute need for a<br />
s<strong>in</strong>gle national authority control all river monitor<strong>in</strong>g<br />
functions <strong>and</strong> make data available on public<br />
websites.<br />
28
G. Kiely et al. (2007-CCRP-2.7)<br />
References<br />
Anderson, E., Harrison, S., Passmore, D.G. <strong>and</strong> Mighall,<br />
T.M. (2000) Holocene alluvial-fan development <strong>in</strong> the<br />
Macgillycuddy’s Reeks, southwest Irel<strong>and</strong>. Geological<br />
Society of America Bullet<strong>in</strong>, 112, 1834–1849.<br />
Anderson, E., Harrison, S., Passmore, D.G., Mighall, T.M.<br />
<strong>and</strong> Wathan, S. (2004) Late Quaternary river terrace<br />
development <strong>in</strong> the Macgillycuddy’s Reeks, southwest<br />
Irel<strong>and</strong>. Quaternary Science Reviews, 23, 1785–1801.<br />
Baillie, M. G. L. (2006) New Light on the Black Death.<br />
Stroud: Tempus.<br />
Baillie, M. G. L. & Pilcher, J. R. (1973) A recently developed<br />
Irish tree-r<strong>in</strong>g chronology, Tree-R<strong>in</strong>g Bull. 33, 7–14.<br />
Baillie, M. G. L. (1994) Dendrochronology raises questions<br />
about the nature of the ad 536 dust-veil event, The<br />
Holocene, 4 (2), 212–217.<br />
Baillie, M. G. L. (1995). Environmental Reconstruction from<br />
Tree R<strong>in</strong>gs. A Slice Through Time. Dendrochronology<br />
<strong>and</strong> Precision Dat<strong>in</strong>g. London, R. T. Batsford: 135–148.<br />
Baillie, M. G. L. (1999) Exodus to Arthur: Catastrophic<br />
Encounters With Comets. London: B.T. Batsford.<br />
Baillie, M.G.L. <strong>and</strong> Munro, M.A.R. (1988) Irish tree r<strong>in</strong>gs,<br />
Santor<strong>in</strong>i <strong>and</strong> volcanic dust veils. Nature, 332, 344–346.<br />
Baillie, M.G.L., Pilcher, J.R., Pollard, A.M. <strong>and</strong> Ramesh,<br />
R. (2000) Climatic significance of D/H <strong>and</strong> C-13/C-12<br />
ratios <strong>in</strong> Irish oak cellulose.Proceed<strong>in</strong>gs of the Indian<br />
Academy of Sciences, arth <strong>and</strong> Planetary Sciences,<br />
109, 117–127.<br />
Bengtsson L. <strong>and</strong> Hodges K. 2006. Storm tracks <strong>and</strong><br />
climate change. Journal of <strong>Climate</strong>, 3518–3542.<br />
Berm<strong>in</strong>gham, N. <strong>and</strong> Delaney, M. (2005) The bog body<br />
from Tumbeagh. Wordwell, Bray.<br />
Berm<strong>in</strong>gham, N.C. (2005) Palaeohydrology <strong>and</strong><br />
archaeology <strong>in</strong> raised mires: a case study from<br />
Kilnagarnagh. Unpublished PhD thesis, University of<br />
Hull:Hull.<br />
Briffa, K. R., P. D. Jones, et al. (1983a) ‘The potential for<br />
climate reconstruction <strong>in</strong> Engl<strong>and</strong> us<strong>in</strong>g tree r<strong>in</strong>gs.’<br />
<strong>Climate</strong> Monitor 12(4),117–122.<br />
Briffa, K. R., P. D. Jones, et al. (1983b) <strong>Climate</strong><br />
reconstruction from tree r<strong>in</strong>gs: Part 1, basic methodology<br />
<strong>and</strong> prelim<strong>in</strong>ary results for Engl<strong>and</strong>. Journal of<br />
Climatology,3,233–242.<br />
Brooks, S.J. <strong>and</strong> Birks, H.J.B. (2000) Chironmid-<strong>in</strong>ferred<br />
Late Glacial air temperatures at Whitrig Bog, southeast<br />
Scotl<strong>and</strong>. Journal of Quaternary Science, 15, 759–64.<br />
Budyko, M. I., G. S. Golitsyn <strong>and</strong> Izrael, Y. A. (1988).<br />
Global climatic catastrophes. New York:USA, Spr<strong>in</strong>ger-<br />
Verlag.<br />
Butler, C. J., a.-S. a. García-Suárez, A. M. et al. (2005).<br />
Air Temperatures At Armagh Observatory, Northern<br />
Irel<strong>and</strong>, from 1796 To 2002. International Journal of<br />
Climatology,25,1055–1079.<br />
Byrne, F. J. (1967) Seventh-Century Documents, Irish<br />
Ecclesiastical Record, 108, 164–182<br />
Carr, P. (1992) The Night of the Big W<strong>in</strong>d: The story of the<br />
legendary Big W<strong>in</strong>d of 1839, Irel<strong>and</strong>’s greatest natural<br />
disaster. Revised edn,elfast: White Row Press Ltd.<br />
Caseld<strong>in</strong>e, C. <strong>and</strong> B. Gearey. (2005) A multiproxy<br />
approach to reconstruct<strong>in</strong>g surface wetness changes<br />
<strong>and</strong> prehistoric bog bursts <strong>in</strong> a raised mire system at<br />
Derryville Bog, Co. Tipperary, Irel<strong>and</strong>. The Holocene,<br />
15(4), 585–601.<br />
Casparie, W.A. (2005) Peat morphology <strong>and</strong> bog<br />
development. The Lisheen M<strong>in</strong>e Archaeological Project<br />
1996–8 (eds M. Gowen, J. O’Neill <strong>and</strong> M. Phillips).<br />
Wordwell Ltd, Bray.<br />
Coope, G.R. <strong>and</strong> Lemdahl, G. (1995) Regional differences<br />
<strong>in</strong> the late glacial climate of northern Europe based on<br />
Coleopteran analysis. Journal of Quaternary Science,<br />
10, 391–395.<br />
Creighton, R., Doyle, A. et al. (2006). L<strong>and</strong>slides <strong>in</strong> Irel<strong>and</strong>,<br />
Geological Survey of Irel<strong>and</strong>.<br />
Croxton, P. J., Huber, K., Coll<strong>in</strong>son, N. <strong>and</strong> Sparks, T. H.<br />
(2006) How well do the Central Engl<strong>and</strong> Temperature<br />
<strong>and</strong> the Engl<strong>and</strong> <strong>and</strong> Wales Precipitation Series<br />
represent the climate of the UK? International Journal<br />
of Climatology, 2287–2292.<br />
Dixon, F. E. (1959) <strong>Weather</strong> <strong>in</strong> Old Dubl<strong>in</strong>, Dubl<strong>in</strong> Historical<br />
Record, 15 (3), 65–73.<br />
Dixon, F. E. (1953) <strong>Weather</strong> <strong>in</strong> Old Dubl<strong>in</strong>, Dubl<strong>in</strong> Historical<br />
Record, 13 (3), 94–107.<br />
Dixon, F. E. (1987) Early Irish <strong>Weather</strong> Records, In:<br />
Shields, L. (ed.), The Irish Meteorological Service: The<br />
First Fifty Years, 1936–1986. Dubl<strong>in</strong>: The Stationery<br />
Office, 59–61.<br />
Down, K. (2008) Agriculture <strong>and</strong> the Manorial Economy<br />
<strong>in</strong> County Carlow <strong>in</strong> the Late Thirteenth Century, In:<br />
McGrath, T. (ed.), Carlow: History <strong>and</strong> Society. Dubl<strong>in</strong>:<br />
Geography Publications, 259–272.<br />
29
<strong>Extreme</strong> <strong>Weather</strong>, <strong>Climate</strong> <strong>and</strong> <strong>Natural</strong> <strong>Disasters</strong> <strong>in</strong> Irel<strong>and</strong><br />
Dumville, D (1999) A Millennium of Gaelic Chronicl<strong>in</strong>g, In:<br />
Kooper, E. (ed.), The Medieval Chronicle: Proceed<strong>in</strong>gs<br />
of the 1st International Conference on the Medieval<br />
Chronicle, Driebergen/Utrecht, 13–16 July 1996.<br />
Amsterdam–Atlanta: Rodopi, 103–115.<br />
Dykes, A. P. <strong>and</strong> J. Warburton (2008). Failure of peatcovered<br />
hillslopes at Dooncarton Mounta<strong>in</strong>, Co. Mayo,<br />
Irel<strong>and</strong>: Analysis of topographic <strong>and</strong> geotechnical<br />
factors. Catena 72, 129–145.<br />
Feehan, J. <strong>and</strong> G. O’Donovan (1996). The Bogs of Irel<strong>and</strong>,<br />
The Environmental Institute, University College Dubl<strong>in</strong>.<br />
Flem<strong>in</strong>g, D. (2009). The Impacts From Development & The<br />
Assessment of Peat Instability. Geological Survey of<br />
Irel<strong>and</strong> L<strong>and</strong>slides Workshop.<br />
Forsythe, W., C. Breen, et al. (2000) Historic storms <strong>and</strong><br />
shipwrecks <strong>in</strong> Irel<strong>and</strong>: a prelim<strong>in</strong>ary survey of severe<br />
synoptic conditions as a causal factor <strong>in</strong> underwater<br />
archaeology. The International Journal of Nautical<br />
Archaeology 29(2), 247–259.<br />
García-Suárez, A. M. <strong>and</strong> C. J. Butler (2005) Soil<br />
temperatures at Armagh Observatory, Northern Irel<strong>and</strong>,<br />
from 1904 to 2002. International Journal of Climatology<br />
26(8), 1075–1089.<br />
Geary, B. <strong>and</strong> Caseld<strong>in</strong>e, C. (2006) A multiproxy approach to<br />
reconstruct<strong>in</strong>g surface wetness changes <strong>and</strong> prehistoric<br />
bog bursts <strong>in</strong> a raised mire system at Derryville Bog, Co.<br />
Tipperary, Irel<strong>and</strong>. The Holocene, 15, 585–601.<br />
Given-Wilson, C. (2004) Chronicles: The Writ<strong>in</strong>g of History<br />
<strong>in</strong> Medieval Engl<strong>and</strong>. London <strong>and</strong> New York: Hambledon<br />
<strong>and</strong> London.<br />
Gowen, M., O’Neill, J. <strong>and</strong> Phillips, M. (2005) The Lisheen<br />
M<strong>in</strong>e Archaeological Project 1996–8. Wordwell Ltd.,<br />
Bray.<br />
Gwynn, A. (1992) The Irish Church <strong>in</strong> the 11th <strong>and</strong> 12th<br />
Centuries. Dubl<strong>in</strong>: Four Courts Press.<br />
Hall, V. A. <strong>and</strong> Mauquoy, D. (2005) Tephra-dated climate<strong>and</strong><br />
human-impact studies dur<strong>in</strong>g the last 1500 years<br />
from a raised bog <strong>in</strong> central Irel<strong>and</strong>, The Holocene, 15<br />
(7), 1086–1093.<br />
Haslett, J. Whiley, M. Bhattacharya, S. Salter-Townshend,<br />
M. Wilson, Simon P., Allen, J. R. M., Huntley, B. <strong>and</strong><br />
Mitchell, F. J. G. Bayesian palaeoclimate reconstruction<br />
J.R. Statist. Soc. A (2006) 169, Part 3, pp. 395–438<br />
Hickey, K. (2008) Five M<strong>in</strong>utes to Midnight? Irel<strong>and</strong> <strong>and</strong><br />
<strong>Climate</strong> Change. Belfast: The White Row Press.<br />
Hickey, K. R. (2003) The storm<strong>in</strong>ess record from Armagh<br />
Observatory, Northern Irel<strong>and</strong>, 1796–1999. <strong>Weather</strong><br />
58(1), 28–35.<br />
Huang, C.C. (2002) Holocene l<strong>and</strong>scape development<br />
<strong>and</strong> human impact <strong>in</strong> the Connemara upl<strong>and</strong>s, western<br />
Irel<strong>and</strong>. Journal of Biogeography, 29, 153–165.Jones,<br />
P. D. <strong>and</strong> D. Lister (2004) ‘The Development Of Monthly<br />
Temperature Series For Scotl<strong>and</strong> And Northern Irel<strong>and</strong>.’<br />
International Journal of Climatology 24: 56–590.<br />
Janković, V. (2000) Read<strong>in</strong>g the Skies: A Cultural History of<br />
English <strong>Weather</strong>, 1650–1820. Chicago: The University<br />
of Chicago Press.<br />
Jentsch, A. <strong>and</strong> C. Beierkuhnle<strong>in</strong> (2008) Research frontiers<br />
<strong>in</strong> climate change: Effects of extreme meteorological<br />
events on ecosystems. Comptes Rendus Geoscience.<br />
Jones, P. D. et al. (2009) High-resolution Palaeoclimatology<br />
of the Last Millennium: A Review of Current Status <strong>and</strong><br />
Future Prospects. The Holocene 19(1), 3–49.<br />
Kelly, F. (1997) Early Irish Farm<strong>in</strong>g. Dubl<strong>in</strong>: Dubl<strong>in</strong> Institute<br />
for Advanced Studies.<br />
Kempe, M. (2003) Noah’s Flood: The Genesis Story <strong>and</strong><br />
<strong>Natural</strong> <strong>Disasters</strong> <strong>in</strong> Early Modern Times, Environment<br />
<strong>and</strong> History, 9 (2), 151–172.<br />
Kempe, M. <strong>and</strong> Rohr, C. (2003) Introduction, Environment<br />
<strong>and</strong> History, 9 (2), 123–126.<br />
Kiely, G. (1999) <strong>Climate</strong> change <strong>in</strong> Irel<strong>and</strong> from precipitation<br />
<strong>and</strong> streamflow observations. Advances <strong>in</strong> Water<br />
Resources 23: 141–151.<br />
Kondratyev, Y. A. <strong>and</strong> I. Gal<strong>in</strong>do (1997) Volcanic Activity<br />
<strong>and</strong> <strong>Climate</strong>, Deepak Publish<strong>in</strong>g.<br />
Lamb, H. (2005 2nd edition) Historic Storms of the North<br />
Sea, British Isles <strong>and</strong> Northwest Europe. Cambridge,<br />
Cambridge University Press.<br />
Lamb, H. H. <strong>and</strong> Frydendahl, K. (1991) Historic Storms<br />
of the North Sea, British Isles <strong>and</strong> Northwest Europe.<br />
Cambridge: Cambridge University Press.<br />
Legr<strong>and</strong>, M. (1997) Ice-core records of atmospheric<br />
sulphur. Philosophical Transactions: Biological<br />
Sciences, 352(1350), 241–250.<br />
Leuschner, H.H., Sass-Klaassen, U., Jansma, E., Baillie,<br />
M.G.L. & Spurk, M., 2002. Subfossil European bog oaks:<br />
population dynamics <strong>and</strong> long-term growth depressions<br />
as <strong>in</strong>dicators of changes <strong>in</strong> the Holocene hydro-regime<br />
<strong>and</strong> climate. The Holocene 12: 695–706.<br />
Loader, N.J., Switsur, V.R. <strong>and</strong> Field, E.M. (1995)<br />
High-resolution stable isotope analysis of tree<br />
r<strong>in</strong>gs: implications of ‘microdendroclimatology’ for<br />
palaeoenvironmental research. The Holocene, 5, 457–<br />
460.<br />
Logue, J. J. (1989) The estimation of extreme w<strong>in</strong>d speeds<br />
over st<strong>and</strong>ard terra<strong>in</strong> <strong>in</strong> Irel<strong>and</strong>. Dubl<strong>in</strong>, Meteorological<br />
Service.<br />
30
G. Kiely et al. (2007-CCRP-2.7)<br />
Lozano, I., R. J. N. Devoy, et al. (2004) Storm<strong>in</strong>ess <strong>and</strong><br />
vulnerability along the Atlantic coastl<strong>in</strong>es of Europe:<br />
analysis of storm records <strong>and</strong> of a greenhouse gases<br />
<strong>in</strong>duced climate scenario. Mar<strong>in</strong>e Geology 210: 205–<br />
225.<br />
Ludlow, F. (2005b) Interpretation of Celestial <strong>and</strong><br />
Environmental Phenomena <strong>in</strong> the Irish Annals, Atlas,<br />
10, 48–60.<br />
Ludlow, F. (2005a) A Surpris<strong>in</strong>gly Useful Source of<br />
Information about Irel<strong>and</strong>’s Past <strong>Climate</strong>, Geographical<br />
Viewpo<strong>in</strong>t, 33, 26–33.<br />
Lyons, M. C. (1989) <strong>Weather</strong>, Fam<strong>in</strong>e, Pestilence <strong>and</strong><br />
Plague <strong>in</strong> Irel<strong>and</strong>, 900–1500, In: Crawford, E. M. (ed.),<br />
Fam<strong>in</strong>e: The Irish Experience 900–1900: Subsistence<br />
Crises <strong>and</strong> Fam<strong>in</strong>es <strong>in</strong> Irel<strong>and</strong>. Ed<strong>in</strong>burgh: John Donald,<br />
31–74.<br />
Mac Carthaigh, M. (1996) An assessment of the 1995<br />
<strong>in</strong>clud<strong>in</strong>g a comparison with other known drought years.<br />
Wexford, Irel<strong>and</strong>, Environmental Protection Agency.<br />
Mac Niocaill, G. (1975) The Medieval Irish Annals. Dubl<strong>in</strong>:<br />
Dubl<strong>in</strong> Historical Association.<br />
Madsen, H., P. Rasmussen, <strong>and</strong> D. Rosbjerg, (1997)<br />
Comparison of annual maximum series <strong>and</strong> partial<br />
duration series methods for model<strong>in</strong>g extreme<br />
hydrologic events .1. At-site model<strong>in</strong>g. Water Resour.<br />
Res., 33, 747–757.<br />
Mallory, J. P. <strong>and</strong> Baillie, M. G. L. (1988) Tech ndaruch: The<br />
fall of the house of oak, Emania: Bullet<strong>in</strong> of the Navan<br />
Research Group, 5, 27–33.<br />
Maraun, D., T. J. Osborn, et al. (2008) United K<strong>in</strong>gdom<br />
daily precipitation <strong>in</strong>tensity: improved early data,<br />
error estimates <strong>and</strong> an update from 2000 to 2006.<br />
International Journal of Climatology 28(6), 833–842.<br />
Mayewski, P. A., G. Holdsworth, et al. (1993) Ice-Core<br />
Sulphate from Three Northern Hemisphere Sites:<br />
Source <strong>and</strong> Temperature Forc<strong>in</strong>g Implications.<br />
Atmospheric Environment 27A(17–18), 2915–2919.<br />
McCafferty, P. <strong>and</strong> Baillie, M. G. L. (2005) The Celtic Gods:<br />
Comets <strong>in</strong> Irish Mythology. Stroud: Tempus.<br />
McCarthy, D. (1998) The Chronology of the Irish Annals,<br />
Proceed<strong>in</strong>gs of the Royal Irish Academy, 98C, 203–255.<br />
McCarthy, D. (2000) The Chronology of St. Brigit of Kildare,<br />
Peritia, 14, 255–281.<br />
McCarthy, D. (2008) The Irish Annals: Their Genesis,<br />
Evolution <strong>and</strong> History. Dubl<strong>in</strong>: Four Courts Press.<br />
McCarthy, D. <strong>and</strong> Breen, A. (1997a) An evaluation of<br />
astronomical observations <strong>in</strong> the Irish Annals, Vistas <strong>in</strong><br />
Astronomy, 41 (1), 117–138.<br />
McCarthy, D. <strong>and</strong> Breen, A. (1997b) Astronomical<br />
Observations <strong>in</strong> the Irish Annals <strong>and</strong> their Motivation,<br />
Peritia, 11, 1–43.<br />
McCormick, M., Dutton, P. E. <strong>and</strong> Mayewski, P. A. (2007)<br />
Volcanoes <strong>and</strong> the <strong>Climate</strong> Forc<strong>in</strong>g of Carol<strong>in</strong>gian<br />
Europe, A.D. 750–950, Speculum, 82, 865–895.<br />
McCormick, M., P. E. Dutton, et al. (2007) Volcanoes <strong>and</strong><br />
the <strong>Climate</strong> Forc<strong>in</strong>g of Carol<strong>in</strong>gian Europe, A.D. 750–<br />
950. Speculum 82: 865–895.<br />
Meaden, G. T. (1975) The earliest-known British <strong>and</strong> Irish<br />
tornadoes, The Journal of Met 1 (3), 96–99.<br />
National Research Council (2006) Surface Temperature<br />
Reconstructions for the Last 2,000 Years. Wash<strong>in</strong>gton,<br />
D.C.: National Academies Press.<br />
O’Dwyer, B. W. (1972) The Annals of Connacht <strong>and</strong> Loch<br />
Cé <strong>and</strong> the Monasteries of Boyle <strong>and</strong> Holy Tr<strong>in</strong>ity,<br />
Proceed<strong>in</strong>gs of the Royal Irish Academy, 72C, 83–104.<br />
Paul<strong>in</strong>g, A. <strong>and</strong> H. Paeth (2007) On the variability of return<br />
periods of European w<strong>in</strong>ter precipitation extremes over<br />
the last three centuries. <strong>Climate</strong> of the Past 3: 65–76.<br />
Pfister, C. (2007) Climatic <strong>Extreme</strong>s, Recurrent Crises<br />
<strong>and</strong> Witch Hunts: Strategies of European Societies <strong>in</strong><br />
Cop<strong>in</strong>g with Exogenous Shocks <strong>in</strong> the Late Sixteenth<br />
<strong>and</strong> Early Seventeenth Centuries. The Medieval History<br />
Journal 10: 33–73.<br />
Pfister, C., Luterbacher, J., Schwarz-Zanetti, C. <strong>and</strong><br />
Wegmann, M. (1998) W<strong>in</strong>ter air temperature variations<br />
<strong>in</strong> western Europe dur<strong>in</strong>g the Early <strong>and</strong> High Middle<br />
Ages (ad 750–1300), The Holocene, 8 (5), 547–564.<br />
Pfister, C., Luterbacher, J., Schwarz-Zanetti, G. <strong>and</strong><br />
Wegmann, M. (1998) W<strong>in</strong>ter air temperature variations<br />
<strong>in</strong> Central Europe dur<strong>in</strong>g the Early <strong>and</strong> High Middle<br />
Ages (ad 750–1300) Holocene, 8, 547–564.<br />
Pilcher, J. R., M. G. L. Baillie, et al. (1984) A 7,272-year<br />
tree–r<strong>in</strong>g chronology for Western Europe. Nature 312:<br />
150–152.<br />
Rackham, O. (1990) Trees & Woodl<strong>and</strong> <strong>in</strong> the British<br />
L<strong>and</strong>scape: The Complete History of Brita<strong>in</strong>’s Trees,<br />
Woods & Hedgerows. London, J. M. Dent.<br />
Reilly, E. (2005) Coleoptera, pp. 187–209. The Lisheen<br />
M<strong>in</strong>e Archaeological Project 1996–8 (eds. M. Gowen, J.<br />
O’Neill & M. Phillips). Wordwell Ltd., Dubl<strong>in</strong>.<br />
Reilly, E. (2006) The <strong>in</strong>sects, the body <strong>and</strong> the bog. The<br />
Tumbeagh Bog Body (eds. N. Berm<strong>in</strong>gham & M.<br />
Delaney). Wordwell Ltd., Dubl<strong>in</strong>, pp. 155–171.<br />
Robock, A. (1983) The Mount St. Helens Volcanic Eruption<br />
of 18 May 1980: M<strong>in</strong>imal Climatic Effect. Science, 212:<br />
1381–1382.<br />
31
<strong>Extreme</strong> <strong>Weather</strong>, <strong>Climate</strong> <strong>and</strong> <strong>Natural</strong> <strong>Disasters</strong> <strong>in</strong> Irel<strong>and</strong><br />
Rohan, P. K. (1986) The <strong>Climate</strong> of Irel<strong>and</strong>. Dubl<strong>in</strong>, The<br />
Stationery Office.<br />
Rohr, C. (2003) Man <strong>and</strong> <strong>Natural</strong> Disaster <strong>in</strong> the Late Middle<br />
Ages: The Earthquake <strong>in</strong> Car<strong>in</strong>thia <strong>and</strong> Northern Italy on<br />
25 January 1348 <strong>and</strong> its Perception. Environment <strong>and</strong><br />
History, 9 (2), 127–150.<br />
Rohr, C. (2005) The Danube Floods <strong>and</strong> Their Human<br />
Response <strong>and</strong> Perception (14th to 17th C), History of<br />
Meteorology, 2, 71–86.<br />
Rowe, M. (1989) The Earliest Documented Tornado <strong>in</strong> the<br />
British Isles: Rosdalla, County Westmeath, Eire, April<br />
1054. The Journal of Meteorology, 14 (137), 86–90.<br />
Semmler, T., S. Varghese, et al. (2008) Influence of an<br />
<strong>in</strong>creased sea surface temperature on North Atlantic<br />
cyclones. Draft manuscript retrieved from http://www.c4i.ie/<br />
Shields, L. (ed.) (1987) The Irish Meteorological Service:<br />
The first fifty years 1936–1986. Dubl<strong>in</strong>, Irel<strong>and</strong>, The<br />
Stationery Office.<br />
Shields, L. <strong>and</strong> Fitzgerald, D. (1989) The ‘Night of the Big<br />
W<strong>in</strong>d’ <strong>in</strong> Irel<strong>and</strong>, 6–7 January 1839. Irish Geography,<br />
22, 31–43.<br />
Smith S. 2010. Report on ra<strong>in</strong>fall on November 2009.<br />
Climatological note No. 12. Met Éireann, Glasnev<strong>in</strong> Hill,<br />
Dubl<strong>in</strong> 9.<br />
Stafford, T. (1633) Pacata Hibernia: Irel<strong>and</strong> appeased <strong>and</strong><br />
reduced. London: August<strong>in</strong>e Mathewes.<br />
Stanhill, G. <strong>and</strong> l. Moller, M. (2008) Evaporative climate<br />
change <strong>in</strong> the British Isles. International Journal of<br />
Climatology, 28: 1127–1137.<br />
Stefan<strong>in</strong>i, B. (2008) A comparison of climate <strong>and</strong> vegetation<br />
dynamics <strong>in</strong> central Irel<strong>and</strong> <strong>and</strong> NW Spa<strong>in</strong> s<strong>in</strong>ce the<br />
mid–Holocene Botany. Dubl<strong>in</strong>, Tr<strong>in</strong>ity College. PhD.<br />
Stothers, R. B. (2000) Climatic <strong>and</strong> demographic<br />
consequences of the massive volcanic eruption of 1258.<br />
<strong>Climate</strong> Change, 45: 361–374.<br />
Sweeney, J. (2000) A three-century Storm Climatology for<br />
Dubl<strong>in</strong> 1715–2000. Irish Geog, 33 (1), 1–14.<br />
Thomas, F. M., R. Blank, et al. (2002) Abiotic <strong>and</strong> biotic<br />
factors <strong>and</strong> their <strong>in</strong>teractions as causes of oak decl<strong>in</strong>e<br />
<strong>in</strong> Central Europe. Forest Pathology, 32(4–5), 277–307.<br />
Turney, C., Baillie, M., Clemens, S., Brown, D., Palmer,<br />
J., Pilcher, J., Reimer, P. <strong>and</strong> Leuschner, H. H. 2005.<br />
Test<strong>in</strong>g solar forc<strong>in</strong>g of pervasive Holocene climate<br />
cycles. Journal of Quaternary Science, 20, 511–518.<br />
Turney, C., Baillie, M., Palmer, J. <strong>and</strong> Brown, D. (2006)<br />
Holocene climatic change <strong>and</strong> past Irish societal<br />
response. Journal of Archaeological Science, 33, 34–<br />
38.<br />
Visbeck, M. H., J. W. Hurrell, et al. (2001) The North Atlantic<br />
Oscillation: Past, present, <strong>and</strong> future. Proceed<strong>in</strong>gs of<br />
the National Academy of Sciences of the United States<br />
of America 98(23), 12876–12877.<br />
Werner, P. C., F.-W. Gerstengarbe, et al. (2000) Recent<br />
climate change <strong>in</strong> the North Atlantic/European sector.<br />
International Journal of Climatology 20(5), 463–471.<br />
Wheeler, D. (2003) The Great Storm of November 1703:<br />
A new look at the seamen’s records, <strong>Weather</strong>, 58 (11),<br />
419–427.<br />
Wilde, W. (1851) Census of Irel<strong>and</strong> 1851. Vol. 1 (Part 5)<br />
Dubl<strong>in</strong>.<br />
Willems, P. (2000) Compound <strong>in</strong>tensity/duration/frequencyrelationships<br />
of extreme precipitation for two seasons<br />
<strong>and</strong> two storm types. Journal of Hydrology 233(1–4),<br />
189–205.<br />
Ziel<strong>in</strong>ski, G. A. (2000) Use of paleo-records <strong>in</strong> determ<strong>in</strong><strong>in</strong>g<br />
variability with<strong>in</strong> the volcanism-climate system.<br />
Quaternary Science Reviews, 19: 417–438.<br />
Ziel<strong>in</strong>ski, G. A., Mayewski, P. A., Meeker, S, Whitlow, L.,<br />
Twickler, M. S, Taylor, K. (1996) A 110,000-Yr Record<br />
of Explosive Volcanism from the GISP2 (Greenl<strong>and</strong>) Ice<br />
Core. Quaternary Research 45: 109–118.<br />
Ziel<strong>in</strong>ski, G. A., P. A. Mayewski, Meeker, L. D., Whitlow, S.,<br />
Twickler, M.S., Morrison, M., Meese, D.A., Gow, A. J.,<br />
<strong>and</strong> Alley, R.B. (1994) Record of volcanism s<strong>in</strong>ce 7000<br />
BC from the GISP2 Greenl<strong>and</strong> Ice Core <strong>and</strong> implications<br />
for the volcano-climate system. Science, 264: 948–952.<br />
Zorita, E., T. F. Stocker <strong>and</strong> von Storch, H. (2008) How<br />
unusual is the recent series of warm years?’ Geophysical<br />
Research Letters, 35(L24706).<br />
32
Acronyms <strong>and</strong> Annotations<br />
AD<br />
AMS<br />
AR4<br />
BC<br />
CAL<br />
Anno Dom<strong>in</strong>o<br />
Accelerated mass spectrometry<br />
Assessment Report 4 (IPPC)<br />
Before Christ<br />
Calibrated years before present<br />
GISP2 Greenl<strong>and</strong> Ice Sheet Project 2<br />
GP<br />
IDF<br />
IPPC<br />
NAO<br />
PDF<br />
PDS<br />
RCMs<br />
RF<br />
SST<br />
TAP<br />
Generalised Pareto<br />
Intensity-duration-frequency<br />
Intergovernmental Panel on <strong>Climate</strong> Change<br />
North Atlantic Oscillation<br />
Probability distribution function<br />
Partial duration series<br />
Regional climate models<br />
Radiative forc<strong>in</strong>g<br />
Sea surface temperature<br />
Total annual precipitation<br />
33
Appendix: Gaelic Irish Annals<br />
• Annals of the Four Masters (O’Donovan, 1848–1851);<br />
• Annals of Ulster (Mac Airt <strong>and</strong> Mac Niocaill, 1983;<br />
Hennessy <strong>and</strong> MacCarthy, 1887–1901);<br />
• Annals of Loch Cé (Hennessy, 1871);<br />
• Annals of Connacht (Freeman, 1944);<br />
• Annals of Inisfallen (Mac Airt, 1944);<br />
• Annals of Tigernach (Wilde, 1851; Stokes, 1895,<br />
1896, 1897a,b);<br />
• Annals of Irel<strong>and</strong>: Three Fragments/Fragmentary<br />
Annals of Irel<strong>and</strong> (O’Donovan, 1860; Radner, 1978);<br />
• Mac Carthaigh’s Book – Fragment 1 (Ó hInnse,<br />
1947);<br />
• Annals of Boyle (Freeman, 1924, 1925, 1926, 1927);<br />
• Egerton Annals (O’Grady, 1892); Fragment 2 (Ó<br />
hInnse, 1947);<br />
• Annals of Oileán Na Naomh – Fragment 3 (Ó hInnse,<br />
1947);<br />
• Mageoghagan’s Book (Murphy, 1896);<br />
• Annals from the Book of Le<strong>in</strong>ster (Stokes, 1887);<br />
• The Annals of Irel<strong>and</strong>, from the Year 1443 to 1468<br />
(O’Donovan, 1845);<br />
• Memor<strong>and</strong>a Gadelica (Breathnach, 1931);<br />
• Short Annals of Tirconaill (Breathnach, 1934);<br />
• Short Annals of Fir Manach (Breathnach, 1935);<br />
• Short Annals of Le<strong>in</strong>ster (Breathnach, 1936);<br />
• Annala Gearra as Proibh<strong>in</strong>se Ard Macha (Mac<br />
Niocaill, 1958–9);<br />
• Carew Fragment (Ó Cuív, 1981).<br />
34
An Ghníomhaireacht um Chaomhnú Comhshaoil<br />
Is í an Gníomhaireacht um Chaomhnú<br />
Comhshaoil (EPA) comhlachta reachtúil a<br />
chosnaíonn an comhshaol do mhu<strong>in</strong>tir na tíre<br />
go léir. Rialaímid agus déanaimid maoirsiú ar<br />
ghníomhaíochtaí a d'fhéadfadh truailliú a<br />
chruthú murach s<strong>in</strong>. C<strong>in</strong>ntímid go bhfuil eolas<br />
cru<strong>in</strong>n ann ar threochtaí comhshaoil ionas<br />
go nglactar aon chéim is gá. Is iad na<br />
príomh-nithe a bhfuilimid gníomhach leo<br />
ná comhshaol na hÉireann a chosa<strong>in</strong>t agus<br />
c<strong>in</strong>ntiú go bhfuil forbairt <strong>in</strong>bhuanaithe.<br />
Is comhlacht poiblí neamhspleách í an<br />
Ghníomhaireacht um Chaomhnú Comhshaoil<br />
(EPA) a bunaíodh i mí Iúil 1993 fao<strong>in</strong><br />
Acht fán nGníomhaireacht um Chaomhnú<br />
Comhshaoil 1992. Ó thaobh an Rialtais, is í<br />
an Ro<strong>in</strong>n Comhshaoil agus Rialtais Áitiúil a<br />
dhéanann urraíocht uirthi.<br />
ÁR bhFREAGRACHTAÍ<br />
CEADÚNÚ<br />
Bíonn ceadúnais á n-eisiú<strong>in</strong>t aga<strong>in</strong>n i gcomhair na nithe<br />
seo a leanas chun a ch<strong>in</strong>ntiú nach mbíonn astuithe uathu<br />
ag cur slá<strong>in</strong>te an phobail ná an comhshaol i mbaol:<br />
áiseanna dramhaíola (m.sh., líonadh talún,<br />
loisceoirí, stáisiú<strong>in</strong> aistrithe dramhaíola);<br />
gníomhaíochtaí tionsclaíocha ar scála mór (m.sh.,<br />
déantúsaíocht cógaisíochta, déantúsaíocht<br />
stroighne, stáisiú<strong>in</strong> chumhachta);<br />
diantalmhaíocht;<br />
úsáid faoi shrian agus scaoileadh smachtaithe<br />
Orgánach Gé<strong>in</strong>athraithe (GMO);<br />
mór-áiseanna stórais peitreail.<br />
Scardadh dramhuisce<br />
FEIDHMIÚ COMHSHAOIL NÁISIÚNTA<br />
Stiúradh os cionn 2,000 <strong>in</strong>iúchadh agus cigireacht<br />
de áiseanna a fuair ceadúnas ón nGníomhaireacht<br />
gach blia<strong>in</strong>.<br />
Maoirsiú freagrachtaí cosanta comhshaoil údarás<br />
áitiúla thar sé earnáil - aer, fuaim, dramhaíl,<br />
dramhuisce agus caighdeán uisce.<br />
Obair le húdaráis áitiúla agus leis na Gardaí chun<br />
stop a chur le gníomhaíocht mhídhleathach<br />
dramhaíola trí comhordú a dhéanamh ar líonra<br />
forfheidhmithe náisiúnta, díriú isteach ar chiontóirí,<br />
stiúradh fiosrúchá<strong>in</strong> agus maoirsiú leigheas na<br />
bhfadhbanna.<br />
An dlí a chur orthu siúd a bhriseann dlí comhshaoil<br />
agus a dhéanann dochar don chomhshaol mar<br />
thoradh ar a ngníomhaíochtaí.<br />
MONATÓIREACHT, ANAILÍS AGUS TUAIRISCIÚ AR<br />
AN GCOMHSHAOL<br />
Monatóireacht ar chaighdeán aeir agus caighdeá<strong>in</strong><br />
aibhneacha, locha, uiscí taoide agus uiscí talaimh;<br />
leibhéil agus sruth aibhneacha a thomhas.<br />
Tuairisciú neamhspleách chun cabhrú le rialtais<br />
náisiúnta agus áitiúla c<strong>in</strong>ntí a dhéanamh.<br />
RIALÚ ASTUITHE GÁIS CEAPTHA TEASA NA HÉIREANN<br />
Ca<strong>in</strong>níochtú astuithe gáis ceaptha teasa na<br />
hÉireann i gcomhthéacs ár dtiomantas Kyoto.<br />
Cur i bhfeidhm na Treorach um Thrádáil Astuithe, a<br />
bhfuil ba<strong>in</strong>t aige le hos cionn 100 cuideachta atá<br />
<strong>in</strong>a mór-gh<strong>in</strong>eadóirí dé-ocsaíd charbó<strong>in</strong> <strong>in</strong> Éir<strong>in</strong>n.<br />
TAIGHDE AGUS FORBAIRT COMHSHAOIL<br />
Taighde ar sha<strong>in</strong>cheisteanna comhshaoil a chomhordú<br />
(cosúil le caighdéan aeir agus uisce, athrú aeráide,<br />
bithéagsúlacht, teicneolaíochtaí comhshaoil).<br />
MEASÚNÚ STRAITÉISEACH COMHSHAOIL<br />
Ag déanamh measúnú ar thionchar phleananna agus<br />
chláracha ar chomhshaol na hÉireann (cosúil le<br />
pleananna ba<strong>in</strong>istíochta dramhaíola agus forbartha).<br />
PLEANÁIL, OIDEACHAS AGUS TREOIR CHOMHSHAOIL<br />
Treoir a thabhairt don phobal agus do thionscal ar<br />
cheisteanna comhshaoil éagsúla (m.sh., iarratais ar<br />
cheadúnais, seacha<strong>in</strong>t dramhaíola agus rialachá<strong>in</strong><br />
chomhshaoil).<br />
Eolas níos fearr ar an gcomhshaol a scaipeadh (trí<br />
cláracha teilifíse comhshaoil agus pacáistí<br />
acmha<strong>in</strong>ne do bhunscoileanna agus do<br />
mheánscoileanna).<br />
BAINISTÍOCHT DRAMHAÍOLA FHORGHNÍOMHACH<br />
Cur chun c<strong>in</strong>n seacha<strong>in</strong>t agus laghdú dramhaíola trí<br />
chomhordú An Chláir Náisiúnta um Chosc<br />
Dramhaíola, lena n-áirítear cur i bhfeidhm na<br />
dTionscnamh Freagrachta Táirgeoirí.<br />
Cur i bhfeidhm Rialachán ar nós na treoracha maidir<br />
le Trealamh Leictreach agus Leictreonach Caite agus<br />
le Srianadh Substa<strong>in</strong>tí Guaiseacha agus substa<strong>in</strong>tí a<br />
dhéanann ídiú ar an gcrios ózó<strong>in</strong>.<br />
Plean Náisiúnta Ba<strong>in</strong>istíochta um Dramhaíl<br />
Ghuaiseach a fhorbairt chun dramhaíl ghuaiseach a<br />
sheacha<strong>in</strong>t agus a bha<strong>in</strong>istiú.<br />
STRUCHTÚR NA GNÍOMHAIREACHTA<br />
Bunaíodh an Ghníomhaireacht i 1993 chun comhshaol<br />
na hÉireann a chosa<strong>in</strong>t. Tá an eagraíocht á bha<strong>in</strong>istiú<br />
ag Bord lánaimseartha, ar a bhfuil Príomhstiúrthóir<br />
agus ceithre Stiúrthóir.<br />
Tá obair na Gníomhaireachta ar siúl trí ceithre Oifig:<br />
An Oifig Aeráide, Ceadúnaithe agus Úsáide<br />
Acmha<strong>in</strong>ní<br />
An Oifig um Fhorfheidhmiúchán Comhshaoil<br />
An Oifig um Measúnacht Comhshaoil<br />
An Oifig Cumarsáide agus Seirbhísí Corparáide<br />
Tá Coiste Comhairleach ag an nGníomhaireacht le<br />
cabhrú léi. Tá dáréag ball air agus tagann siad le chéile<br />
cúpla uair <strong>in</strong> aghaidh na bliana le plé a dhéanamh ar<br />
cheisteanna ar ábhar imní iad agus le comhairle a<br />
thabhairt don Bhord.
<strong>Climate</strong> Change Research Programme (CCRP) 2007-2013<br />
The EPA has taken a lead<strong>in</strong>g role <strong>in</strong> the development of the CCRP structure<br />
with the co-operation of key state agencies <strong>and</strong> government departments.<br />
The programme is structured accord<strong>in</strong>g to four l<strong>in</strong>ked thematic areas with a<br />
strong cross cutt<strong>in</strong>g emphasis.<br />
Research be<strong>in</strong>g carried out ranges from fundamental process studies to the<br />
provision of high-level analysis of policy options.<br />
For further <strong>in</strong>formation see<br />
www.epa.ie/whatwedo/climate/climatechangeresearch<br />
ENVIRONMENTAL PROTECTION AGENCY<br />
PO Box 3000, Johnstown Castle Estate, Co. Wexford, Irel<strong>and</strong><br />
t 053 916 0600 f 053 916 0699<br />
LoCall 1890 33 55 99<br />
e <strong>in</strong>fo@epa.ie w http://www.epa.ie