Three-dimensional dose reconstruction of breast cancer treatment ...
Three-dimensional dose reconstruction of breast cancer treatment ...
Three-dimensional dose reconstruction of breast cancer treatment ...

Create successful ePaper yourself
Turn your PDF publications into a flip-book with our unique Google optimized e-Paper software.
<strong>Three</strong>-<strong>dimensional</strong> <strong>dose</strong> <strong>reconstruction</strong> <strong>of</strong> <strong>breast</strong> <strong>cancer</strong> <strong>treatment</strong><br />
using portal imaging<br />
R. J. W. Louwe, E. M. F. Damen, M. van Herk, A. W. H. Minken, O. Törzsök,<br />
and B. J. Mijnheer a)<br />
The Netherlands Cancer Institute/Antoni van Leeuwenhoek Hospital, Department <strong>of</strong> Radiotherapy,<br />
Amsterdam, The Netherlands<br />
Received 30 August 2002; accepted for publication 12 May 2003; published 22 August 2003<br />
In this study, we present an algorithm for three-<strong>dimensional</strong> 3-D <strong>dose</strong> <strong>reconstruction</strong> using portal<br />
images obtained with an electronic portal imaging device EPID. For this purpose an algorithm for<br />
2-D <strong>dose</strong> <strong>reconstruction</strong>, which was previously developed in our institution, was adapted. The<br />
external contour <strong>of</strong> the patient was used to correct for absorption <strong>of</strong> primary photons, but the<br />
presence <strong>of</strong> inhomogeneities was not taken into account. The accuracy <strong>of</strong> the algorithm was determined<br />
by irradiating two anthropomorphic <strong>breast</strong> phantoms with 6 MV photons. The <strong>dose</strong> values<br />
derived from portal images were compared with results from 3-D <strong>dose</strong> calculations, which, in turn,<br />
were verified with data obtained with an ionization chamber and film dosimetry. It was found that<br />
the application <strong>of</strong> contour information significantly improves the accuracy <strong>of</strong> 2-D <strong>dose</strong> <strong>reconstruction</strong>.<br />
If the total <strong>dose</strong> at the isocenter plane resulting from all <strong>treatment</strong> beams is reconstructed, the<br />
average deviation from the planned <strong>dose</strong> is 0.1%1.7% 1 SD. If contour information is not<br />
available, the differences increase up to 20% for the individual beams. In that case, the <strong>dose</strong> can<br />
only be reconstructed with reasonable accuracy when nearly opposing beams are used. The<br />
average deviation <strong>of</strong> the 3-D reconstructed <strong>dose</strong> from the planned <strong>dose</strong> in the irradiated volume is<br />
1.4%5.4% 1 SD. If the irradiated volume is enclosed by planes less than 5 cm distant from the<br />
isocenter plane, then the average deviation is only 0.5%3.4% 1 SD. It can be concluded that the<br />
proposed algorithm for a 3-D <strong>dose</strong> <strong>reconstruction</strong> allows a determination <strong>of</strong> the <strong>dose</strong> at the isocenter<br />
plane and the <strong>dose</strong>–volume histogram with an accuracy acceptable for an independent verification<br />
<strong>of</strong> the <strong>treatment</strong>. © 2003 American Association <strong>of</strong> Physicists in Medicine.<br />
DOI: 10.1118/1.1589496<br />
Key words: Radiotherapy, <strong>breast</strong> <strong>cancer</strong>, <strong>dose</strong> verification, EPID, portal dosimetry<br />
I. INTRODUCTION<br />
Portal transit dosimetry, using electronic portal imaging devices<br />
EPIDs, is a technique where <strong>dose</strong> measurements<br />
made behind a patient are used to verify the <strong>dose</strong> delivered to<br />
that patient. Several classes <strong>of</strong> portal dosimetry methods<br />
have been developed, which can be divided in two main<br />
categories. The first group, which can be defined as class a<br />
solutions, uses planning CT data, the prescribed number <strong>of</strong><br />
monitor units, and information concerning the beam setup to<br />
predict the <strong>dose</strong> at the level <strong>of</strong> the EPID, and compares the<br />
measured and predicted <strong>dose</strong> distributions. 1–4 By adapting<br />
the primary energy fluence in an iterative way, the <strong>dose</strong> distribution<br />
at the position <strong>of</strong> the EPID can then be recalculated<br />
until agreement with the measured <strong>dose</strong> distribution is<br />
obtained. 2,3 In this way the actual <strong>dose</strong> delivered to a patient<br />
can be reconstructed from EPID images. The second category<br />
consists <strong>of</strong> techniques that back-project the EPID <strong>dose</strong><br />
distribution to the patient level, either at the exit plane, or at<br />
the midplane, or through the whole irradiated volume. The<br />
differences between these back-projection methods are<br />
mainly related to the amount <strong>of</strong> knowledge about the patient<br />
anatomy that is used during the back-projection stage. In our<br />
institution, methods have been developed that are based on<br />
rather simplifying assumptions about the patient anatomy<br />
class b, such as symmetry <strong>of</strong> the irradiated part <strong>of</strong> the<br />
body. 5,6 Other groups have used planning CT scans to derive<br />
the <strong>dose</strong> in a specific plane class c. 7,8 The most advanced<br />
approaches apply on-line acquired CT data to compute the<br />
actual <strong>treatment</strong>-time <strong>dose</strong> distribution using various sophisticated<br />
algorithms class d. 9,10<br />
The validity <strong>of</strong> these approaches mainly depends on the<br />
type <strong>of</strong> errors that may occur and should be traced by portal<br />
dosimetry, as well as on the availability <strong>of</strong> planning or online<br />
CT data. Because portal dosimetry is generally used as<br />
independent verification <strong>of</strong> the <strong>treatment</strong> similar to an independent<br />
monitor unit calculation, its accuracy does not need<br />
to be as high as the <strong>dose</strong> calculation performed by the clinically<br />
applied <strong>treatment</strong> planning system. The accuracy <strong>of</strong> the<br />
portal dosimetry procedure determines the magnitude <strong>of</strong> errors<br />
that can be detected. The following types <strong>of</strong> errors may<br />
potentially be detected by portal dosimetry: 1 machine output,<br />
field flatness, or intensity modulation errors; 2 errors in<br />
monitor unit calculations; 3 patient setup errors; 4 errors<br />
due to patient shape changes and organ motion. Machine<br />
output errors are detected by all methods. Methods in class<br />
a are insensitive to errors in the monitor unit calculations<br />
because the same number <strong>of</strong> MUs is used for the measurement<br />
and calculation <strong>of</strong> the portal <strong>dose</strong> images. 8 Methods in<br />
2376 Med. Phys. 30 „9…, September 2003 0094-2405Õ2003Õ30„9…Õ2376Õ14Õ$20.00 © 2003 Am. Assoc. Phys. Med. 2376
2377 Louwe et al.: 3-D <strong>dose</strong> <strong>reconstruction</strong> 2377<br />
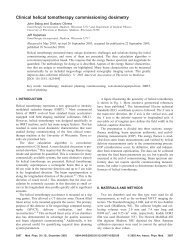
FIG. 1. Beam setup and location <strong>of</strong> the radiographic films during irradiation <strong>of</strong> the anthropomorphic phantoms. Panel a: axial slice <strong>of</strong> phantom A films<br />
oriented in sagittal planes. Panel b: coronal slice <strong>of</strong> phantom B films oriented in transversal planes. For phantom B, at most, three films are applied<br />
simultaneously, placed at positions B1, B2, or B3, and B4. The positions <strong>of</strong> the radiological midplane 1, the isocenter plane 2, the isocenter 3, and lungs<br />
4 have been indicated. Panel c: construction <strong>of</strong> the total <strong>dose</strong> distribution broken line, 2 sum ) resulting from all <strong>treatment</strong> beams at the plane bisecting the<br />
isocenter planes <strong>of</strong> the medial and lateral beams solid lines, 2 med and 2 lat , respectively.<br />
classes a, b, and c are, in principle, insensitive to dosimetric<br />
errors caused by patient setup errors in the beam direction.<br />
Consequently, these methods should be combined<br />
with a geometrical verification protocol, preferentially based<br />
on an orthogonal set <strong>of</strong> EPID images, to minimize the influence<br />
<strong>of</strong> patient setup errors. Only the class d methods can<br />
detect organ motion and patient deformation and allow a<br />
complete dosimetric and geometric verification. With methods<br />
in classes a–c the source <strong>of</strong> a deviation between the<br />
planned and measured <strong>dose</strong> may not always be clear. For<br />
instance, weight loss <strong>of</strong> the patient may cause similar dosimetric<br />
deviations as a machine error. For this reason, clinical<br />
protocols need to be devised on how to handle observed<br />
errors, for instance, including a rescan <strong>of</strong> the patient.<br />
Planning CT data are not always available, and on-line<br />
CT data is currently only available to a few centers. We<br />
therefore adapted our class b portal dosimetry method to<br />
achieve a semiclass c or class d application by including<br />
only external patient contour data, which may be acquired<br />
during simulation class c or during <strong>treatment</strong> class d.<br />
Such an adapted algorithm can also be applied if CT data are<br />
available. The advantage <strong>of</strong> including more patient data is<br />
that <strong>treatment</strong> verification becomes more reliable in those<br />
cases that the <strong>dose</strong> calculation algorithm was inaccurate<br />
large contour variations, inhomogeneities. Clearly, the<br />
drawback <strong>of</strong> including pre<strong>treatment</strong> patient contour data in<br />
the verification system is that the sensitivity for dosimetric<br />
deviations due to contour changes is reduced and the advantages<br />
and disadvantages should therefore be carefully<br />
weighted.<br />
In <strong>breast</strong> radiotherapy, portal dosimetry is applied either<br />
to improve <strong>dose</strong> homogeneity in the irradiated volume 11–17<br />
or to verify the <strong>dose</strong> delivery. 18,19 Improvement <strong>of</strong> <strong>dose</strong> homogeneity<br />
may be achieved by applying portal dosimetry to<br />
design either compensators or intensity-modulated radiotherapy<br />
IMRT fields for individual patients. In our institution,<br />
the application <strong>of</strong> IMRT is planned for <strong>breast</strong> <strong>cancer</strong><br />
patients with the main goal the reduction <strong>of</strong> the <strong>dose</strong> to the<br />
heart. 20,21 Criteria for selecting patients, who would benefit<br />
most from IMRT, are currently being developed in <strong>treatment</strong><br />
planning studies. 21,22 Portal dosimetry may then be used to<br />
estimate the <strong>dose</strong> delivered to the heart. However, a comparison<br />
<strong>of</strong> patient <strong>dose</strong> distributions or its derivatives, e.g.,<br />
<strong>dose</strong>–volume histograms, which have been reconstructed<br />
from portal images, with those obtained from the <strong>treatment</strong><br />
planning system, is not straightforward.<br />
In many institutions, the <strong>dose</strong> distribution is calculated<br />
only in a single plane during <strong>treatment</strong> planning <strong>of</strong> <strong>breast</strong><br />
<strong>cancer</strong> patients. The patient contour is measured during the<br />
simulator session in a plane through the isocenter perpendicular<br />
to the long axis <strong>of</strong> the patient. Subsequently, the <strong>dose</strong><br />
distribution in that plane is calculated using a <strong>treatment</strong> planning<br />
system, maximizing the uniformity <strong>of</strong> the <strong>dose</strong> distribution<br />
by beam weight optimization, and determining the number<br />
<strong>of</strong> monitor units <strong>of</strong> the <strong>treatment</strong> beams.<br />
For these <strong>breast</strong> <strong>cancer</strong> patients, the planes used for the<br />
<strong>dose</strong> <strong>reconstruction</strong> from portal images do not correspond<br />
with the plane used for <strong>treatment</strong> planning. In portal dosimetry,<br />
the <strong>dose</strong> is generally reconstructed in the isocenter<br />
plane, i.e., the plane through the isocenter perpendicular to<br />
the direction <strong>of</strong> the <strong>treatment</strong> beam. 5,23–25 However, if the<br />
patient contour and/or the electron density distribution<br />
within the patient are not symmetric with respect to the isocenter<br />
plane, the <strong>dose</strong> will be reconstructed in the radiological<br />
midplane. The radiological midplane is, in fact, a surface<br />
that connects those points <strong>of</strong> the rays emerging from the<br />
radiation source in the direction <strong>of</strong> the portal imager that<br />
have an equal transmission within the patient at either side <strong>of</strong><br />
that ray. For <strong>breast</strong> <strong>cancer</strong> patients in particular, the isocenter<br />
plane and radiological midplane do not coincide, as is shown<br />
Medical Physics, Vol. 30, No. 9, September 2003
2378 Louwe et al.: 3-D <strong>dose</strong> <strong>reconstruction</strong> 2378<br />
schematically in Fig. 1a; the radiological midplane is<br />
curved and does not always include the isocenter.<br />
Our first aim in this study was to modify the original<br />
<strong>reconstruction</strong> algorithm to enable <strong>dose</strong> <strong>reconstruction</strong> at the<br />
isocenter plane by incorporating patient contour data. Next,<br />
the accuracy <strong>of</strong> the <strong>dose</strong> <strong>reconstruction</strong> using the modified<br />
algorithm was assessed by a comparison with film and a<br />
<strong>treatment</strong> planning system see Sec. II F. The accuracy <strong>of</strong><br />
the original algorithm has been previously investigated for<br />
various geometries. 5,6,23–25 In particular, for configurations<br />
representative for pelvic <strong>treatment</strong>s, the <strong>dose</strong> could be determined<br />
from EPID images with a maximum deviation <strong>of</strong><br />
about 2% from the actual <strong>dose</strong>. The accuracy decreases when<br />
the tissue density distribution is inhomogeneous and/or<br />
asymmetrically distributed, especially if CT data is not used.<br />
The accuracy <strong>of</strong> <strong>dose</strong> <strong>reconstruction</strong> was also not yet assessed<br />
for <strong>breast</strong> <strong>cancer</strong> <strong>treatment</strong>. In addition to complicating<br />
factors such as the asymmetry <strong>of</strong> the patient contour and<br />
the presence <strong>of</strong> lungs, the accuracy <strong>of</strong> <strong>dose</strong> <strong>reconstruction</strong> for<br />
this patient group may be further decreased due to the relatively<br />
small distance between the patient and the portal imager.<br />
This air gap must be relatively small to allow imaging<br />
<strong>of</strong> the largest <strong>treatment</strong> fields. Consequently, the contribution<br />
<strong>of</strong> scatter from the patient to the portal imager will be larger<br />
and less homogeneous than accounted for in the original algorithm.<br />
Therefore, a more accurate correction for the scatter<br />
contribution from the patient to the portal imager has to be<br />
considered as well.<br />
Pre<strong>treatment</strong> verification using phantoms is currently the<br />
only way to verify <strong>dose</strong> delivery using 3-D conformal or<br />
IMRT techniques. It will, however, be very reassuring if also<br />
the actual <strong>dose</strong> delivered by these sophisticated techniques to<br />
patients could be verified. In addition to a more general and<br />
more accurate 2-D <strong>dose</strong> delivery validation, 3-D verification<br />
<strong>of</strong> the patient <strong>dose</strong> using portal images would be very useful.<br />
Especially in the absence <strong>of</strong> CT data, and for those patients<br />
whose <strong>dose</strong> is only calculated in one plane during <strong>treatment</strong><br />
planning, 3-D <strong>dose</strong> <strong>reconstruction</strong> may prove to be a valuable<br />
tool to assess the <strong>dose</strong> delivery. Our second purpose <strong>of</strong><br />
this study was therefore to extend the existing 2-D <strong>dose</strong> <strong>reconstruction</strong><br />
algorithm and to test the accuracy <strong>of</strong> 3-D <strong>dose</strong><br />
<strong>reconstruction</strong>.<br />
II. MATERIALS AND METHODS<br />
A. 2-D <strong>dose</strong> <strong>reconstruction</strong><br />
We modified the original algorithm 6 to include contour<br />
information, but also other modifications have been made.<br />
The steps <strong>of</strong> the modified <strong>reconstruction</strong> algorithm are described<br />
below. The portal images <strong>of</strong> the <strong>treatment</strong> beams<br />
acquired with and without patient the latter will be called<br />
‘‘open images’’ are used as input for the <strong>reconstruction</strong> algorithm.<br />
In the first step, the measured pixel values I exp <strong>of</strong><br />
both images are multiplied with a sensitivity matrix S ij to<br />
correct for the differences in gain and <strong>of</strong>fset values <strong>of</strong> the<br />
individual pixels. In this equation also the calibration applied<br />
to the raw pixel values is described: 26<br />
I corr ij S ij I exp ij S ij I raw ij D ij <br />
F ij D ij F ijD ij ij , 1<br />
in which F and D are the flood- and dark-field calibration<br />
images that are applied for normal clinical use <strong>of</strong> the EPID,<br />
respectively, and ij denotes an average over all pixels<br />
within an image. In the second step, the corrected pixel values<br />
are converted to <strong>dose</strong> rate values. A power law <strong>dose</strong>response<br />
curve is used for this purpose with two fit parameters:<br />
called ‘‘a’’ and ‘‘b.’’ Subsequently, the applied number<br />
<strong>of</strong> monitor units MU and the monitor signal MS <strong>of</strong> the accelerator<br />
simultaneously digitized during the acquisition <strong>of</strong><br />
the portal images, are used to convert the <strong>dose</strong> rate values<br />
into a <strong>dose</strong> image D EPID :<br />
D EPID ij Ḋ EPID ij MU/MS I corr 1/b<br />
ij<br />
MU/MS. 2<br />
a<br />
The third step consists <strong>of</strong> a deconvolution <strong>of</strong> D EPID with a<br />
2-D scatter kernel K EPID to correct for the lateral scatter<br />
within the plane <strong>of</strong> the imager:<br />
D EPID,corr EPID<br />
ij D ij 1 K EPID ij ,<br />
in which<br />
K EPID ij C 1 e •r /r 2 ,<br />
3<br />
where C 1 is a calibration constant, r is the distance to the<br />
origin, and is the linear attenuation coefficient <strong>of</strong> water. In<br />
the fourth step, the transmission T, through the patient, is<br />
estimated by the ratio <strong>of</strong> the patient and open portal <strong>dose</strong><br />
values. Those pixels where the transmission is less than one<br />
for practical reasons, we use less than 0.9 correspond with<br />
tissue in the patient, and are set to 1 in image ; all other<br />
pixels are set to 0. The product <strong>of</strong> and the portal <strong>dose</strong> is<br />
then convolved with a 2-D scatter kernel K pat to estimate the<br />
contribution <strong>of</strong> patient scatter to the portal <strong>dose</strong> image,<br />
S pat→EPID :<br />
S pat→EPID D EPID,corr ij K pat ij ,<br />
in which<br />
K pat ij const.<br />
4<br />
This scatter contribution is subtracted from the portal <strong>dose</strong><br />
image to determine the primary <strong>dose</strong> at the portal imager and<br />
the transmission through the patient is subsequently recalculated<br />
as the ratio <strong>of</strong> the primary and open portal <strong>dose</strong>. In the<br />
next step, the primary <strong>dose</strong> at the midplane <strong>of</strong> the patient is<br />
calculated using the inverse square law and a correction for<br />
the attenuation <strong>of</strong> the photon beam see further below. To<br />
calculate the contribution <strong>of</strong> scattered radiation to the total<br />
midplane patient <strong>dose</strong>, the primary <strong>dose</strong> at the midplane is<br />
weighted with the normalized scatter-to-primary ratio,<br />
NSPR, which is a polynomial fit function depending on the<br />
recalculated transmission T 6 and subsequently convolved<br />
with another 2-D scatter kernel. Finally, the estimated scatter<br />
is added to the primary <strong>dose</strong> to yield the total patient midplane<br />
<strong>dose</strong>:<br />
D mid P mid S mid P mid K mid NSPRTP mid ,<br />
Medical Physics, Vol. 30, No. 9, September 2003
2379 Louwe et al.: 3-D <strong>dose</strong> <strong>reconstruction</strong> 2379<br />
in which<br />
K mid ij C 1 e C 2 •r /r C 3.<br />
5<br />
The sensitivity matrix, the calibration constants, and the<br />
fit parameters for the NSPR and scatter kernels are determined<br />
for each EPID-<strong>treatment</strong> beam combination for all<br />
clinically relevant field sizes from a series <strong>of</strong> experiments<br />
in which a set <strong>of</strong> polystyrene slabs with various thickness<br />
is applied.<br />
In the original algorithm, the midplane <strong>dose</strong> was determined<br />
indirectly, by first calculating the exit <strong>dose</strong>, which was<br />
subsequently converted to the midplane <strong>dose</strong>. 6 For this conversion,<br />
the inverse square law ISQL and a correction for<br />
the attenuation between the exit point and the midplane were<br />
applied to calculate the primary <strong>dose</strong> at the midplane. For the<br />
latter correction, it was assumed that the radiological midplane<br />
coincides with the isocenter plane. However, the ISQL<br />
and attenuation correction may refer to different planes: the<br />
isocenter plane and radiological midplane, respectively. For<br />
prostate <strong>treatment</strong>s, these planes will, more or less, coincide,<br />
but for <strong>breast</strong> patients a significant error may be introduced,<br />
as shown in Fig. 1a. Furthermore, the conversion <strong>of</strong> exit to<br />
midplane <strong>dose</strong> introduces additional data and corresponding<br />
uncertainties and is redundant, since the fit parameters in the<br />
<strong>reconstruction</strong> algorithm can be optimized for direct midplane<br />
<strong>dose</strong> <strong>reconstruction</strong>. For these reasons, the original algorithm<br />
was adapted to explicitly distinguish between <strong>dose</strong><br />
<strong>reconstruction</strong> in the isocenter plane i.e., with attenuation<br />
correction or in the radiological midplane i.e., without attenuation<br />
correction.<br />
For simple configurations e.g., if the radiological midplane<br />
and isocenter plane coincide, the <strong>dose</strong> at the isocenter<br />
plane can be reconstructed without the application <strong>of</strong> additional<br />
data. In that case, the primary portal <strong>dose</strong> image is<br />
scaled using the ISQL and T to calculate the primary <strong>dose</strong><br />
at the isocenter plane. If this calculation would be used for<br />
asymmetric configurations, the primary <strong>dose</strong> would be approximately<br />
reconstructed at the radiological midplane. To<br />
calculate the primary <strong>dose</strong> at the isocenter plane, 3-D contour<br />
data are required to correct for the difference in attenuation<br />
<strong>of</strong> the <strong>treatment</strong> beam in the volume proximal to and distal<br />
from the isocenter plane. The scaling factor T is then replaced<br />
by a single exponential function: exp(•x), where <br />
and x represent the linear mass attenuation coefficient <strong>of</strong> water<br />
for a specific beam quality and the geometrical path<br />
length along a ray through the patient from the isocenter<br />
plane up to the exit surface, respectively. To compare the<br />
accuracy <strong>of</strong> both <strong>reconstruction</strong> algorithms, the patient <strong>dose</strong><br />
was reconstructed both with and without the attenuation correction.<br />
At this stage <strong>of</strong> our study, the presence <strong>of</strong> lung tissue<br />
and bony anatomy is not taken into account, and is the topic<br />
<strong>of</strong> future work to extend the application <strong>of</strong> the algorithm to<br />
sites including these tissues.<br />
B. 3-D <strong>dose</strong> <strong>reconstruction</strong><br />
An important new application <strong>of</strong> the modified algorithm is<br />
its ability to reconstruct the <strong>dose</strong> in three dimensions. To test<br />
the feasibility <strong>of</strong> this technique with the existing s<strong>of</strong>tware,<br />
the patient <strong>dose</strong> was reconstructed in various planes. For the<br />
calculation <strong>of</strong> the primary <strong>dose</strong> at each <strong>reconstruction</strong> plane,<br />
the appropriate ISQL and attenuation correction, based on<br />
the external patient contour, are applied. Currently, the scatter<br />
kernel is taken independently <strong>of</strong> the depth <strong>of</strong> the <strong>reconstruction</strong><br />
plane to limit the number <strong>of</strong> experiments required<br />
for the determination <strong>of</strong> the fit parameters. Because the lateral<br />
and medial beams are not exactly opposing, the planes at<br />
which the patient <strong>dose</strong> is reconstructed do not coincide.<br />
Therefore, the reconstructed <strong>dose</strong> distributions <strong>of</strong> the<br />
individual beams are geometrically projected on the plane<br />
bisecting the individual planes Fig. 1c. Subsequently,<br />
these <strong>dose</strong> distributions are added to calculate the total<br />
<strong>dose</strong>. In this way the error, which would be introduced if<br />
two noncoplanar <strong>dose</strong> distributions were directly added,<br />
is circumvented. A small error still may persist since the<br />
<strong>dose</strong> distributions are assumed to be invariant under<br />
projection. 27<br />
C. Portal imaging<br />
A Varian-MARK I-type detector Varian Inc., Palo Alto,<br />
CA was applied for portal imaging in this study. This detector<br />
has a sensitive area <strong>of</strong> 3232 cm 2 and an image is acquired<br />
in 5.2 s. A polystyrene build-up layer <strong>of</strong> 8 mm was<br />
placed on top <strong>of</strong> the EPID to obtain electron equilibrium at<br />
the position <strong>of</strong> the liquid <strong>of</strong> the ionization chambers in the<br />
experiments using 6 MV photon beams. The source–detector<br />
distance is equal to 145 cm, a distance at which for most<br />
<strong>breast</strong> <strong>treatment</strong>s the complete <strong>treatment</strong> field could be<br />
imaged. For each beam, open images and images made with<br />
an anthropomorphic phantom were acquired. The <strong>dose</strong><br />
distribution in the phantom was reconstructed from these<br />
images using the algorithm described in the previous<br />
sections. 24,25<br />
D. Beam setup and <strong>dose</strong> determination<br />
for the anthropomorphic phantoms<br />
Two anthropomorphic phantoms were irradiated using 6<br />
MV photon beams generated with an Elekta SL15 linear accelerator<br />
applying the standard <strong>treatment</strong> technique used for<br />
<strong>breast</strong> <strong>cancer</strong> patients in our clinic. This technique encompasses<br />
two nearly opposing tangential <strong>treatment</strong> fields, each<br />
consisting <strong>of</strong> an open and a wedged beam using a 60° motorized<br />
wedge. The individual beams are designated as<br />
medial-open, medial-wedged, lateral-open, and lateralwedged,<br />
respectively. The anthropomorphic phantoms have a<br />
geometry based on patient CT data as previously described 28<br />
and consist <strong>of</strong> polystyrene and cork, the latter being used as<br />
replacement for the lungs. Depending on the type <strong>of</strong> phantom,<br />
radiographic films can be positioned in sagittal phantom<br />
A or transversal phantom B planes Fig. 1. The lateral<br />
displacement from the isocenter <strong>of</strong> the radiographic<br />
films in phantom A was 4.5, 1.5, and 1 cm, respectively<br />
Fig. 1a. In phantom B, the radiographic films were<br />
placed at 5.5, 0.5 or 0.5, and 4.5 cm from the iso-<br />
Medical Physics, Vol. 30, No. 9, September 2003
2380 Louwe et al.: 3-D <strong>dose</strong> <strong>reconstruction</strong> 2380<br />
center, respectively Fig. 1b. The absolute <strong>dose</strong> at the isocenter<br />
<strong>of</strong> phantom B could be measured by positioning a<br />
calibrated Farmer-type ionization chamber NE Technology<br />
Limited, NE2571 in a hole drilled in a slab <strong>of</strong> polystyrene.<br />
The charge was measured with a Keithley, K3 electrometer.<br />
Because phantom A has been glued together, we decided not<br />
to drill a hole for the placement <strong>of</strong> an ionization chamber.<br />
The beam configurations for the two phantoms were identical,<br />
but the isocenter position was slightly different in the<br />
two phantoms; more lung was irradiated in phantom A compared<br />
to phantom B, resulting in small differences in the<br />
<strong>dose</strong> distributions in the two phantoms.<br />
Treatment planning was performed using Pinnacle<br />
ADAC/Philips release 5.2g, applying the collapsed cone<br />
superposition/convolution algorithm. Radiographic films<br />
were positioned in the anthropomorphic phantoms during CT<br />
scanning to assure an identical phantom geometry as during<br />
irradiation. Since the elemental composition <strong>of</strong> cork is not<br />
known, the relative electron density <strong>of</strong> cork in the anthropomorphic<br />
phantom was set to 0.25. To trace inaccuracies in<br />
the <strong>reconstruction</strong> algorithm, which are specific for a particular<br />
<strong>treatment</strong> beam e.g., due to the application <strong>of</strong> wedges,<br />
the <strong>dose</strong> distributions <strong>of</strong> all beams were determined separately,<br />
both experimentally and with the TPS.<br />
E. Film dosimetry<br />
Sensitometric curves <strong>of</strong> the radiographic films KODAK<br />
X-OMAT V were obtained by irradiating seven films with<br />
varying exposures, ranging between 0–120 monitor units<br />
MUs, using a field size <strong>of</strong> 1010 cm 2 . These calibration<br />
films were placed at 10 cm depth in a phantom consisting <strong>of</strong><br />
ten polystyrene slabs with a total thickness <strong>of</strong> 20 cm. The<br />
absolute <strong>dose</strong> at the position <strong>of</strong> these films was measured<br />
using a calibrated Farmer-type ionization chamber. Each<br />
measurement was repeated at least once to check the reproducibility<br />
<strong>of</strong> the calibration experiments, and for each box<br />
<strong>of</strong> radiographic films a new sensitometric curve was<br />
measured. All radiographic films were processed using a<br />
Kodak X-Omat ME-3 film processor and digitized using<br />
a Konica KFDR-S film reader. After fitting the individual<br />
sensitometric curves using a third-order polynomial, the<br />
pixel readings <strong>of</strong> the radiographic films were converted into<br />
<strong>dose</strong> values.<br />
The total number <strong>of</strong> MUs used for irradiating the anthropomorphic<br />
phantoms was adapted to exploit the dynamic<br />
range <strong>of</strong> the radiographic films as much as possible, while<br />
avoiding saturation effects. The experiments were repeated<br />
several times to assess the reproducibility, and to eliminate<br />
possible differences in the handling <strong>of</strong> the films i.e., positioning,<br />
irradiating, developing and digitizing the films<br />
and/or differences between various film batches. In total, 192<br />
films were irradiated at the seven film positions. The reproducibility<br />
was calculated for each film position and <strong>treatment</strong><br />
beam by first determining the average film <strong>dose</strong> and standard<br />
deviation <strong>of</strong> individual pixels and subsequently determining<br />
the average <strong>of</strong> the standard deviations over all pixels. If the<br />
average deviation between the <strong>dose</strong> distribution <strong>of</strong> a specific<br />
film and the mean <strong>dose</strong> distribution at that film position was<br />
larger than 3 times the standard deviation, that particular film<br />
measurement was considered to be an outlier and excluded<br />
from further analysis ten films in total. The film <strong>dose</strong> distributions<br />
were normalized, applying a single normalization<br />
factor for all measured film <strong>dose</strong> distributions. To calculate<br />
this normalization factor, the ratio <strong>of</strong> the <strong>dose</strong> distributions<br />
obtained with film dosimetry and with Pinnacle was determined<br />
for all pixels and averaged for each film position.<br />
Subsequently, these averages obtained for all film positions<br />
were averaged for both phantoms, applying a weighing factor<br />
for the number <strong>of</strong> pixels at each film position. In this way,<br />
trends due to systematic errors originating from film dosimetry<br />
and/or the <strong>dose</strong> calculation algorithm may be identified<br />
see the Appendix.<br />
F. Comparison <strong>of</strong> <strong>dose</strong> distributions<br />
The exact orientation <strong>of</strong> the films in a particular plane <strong>of</strong><br />
the anthropomorphic phantoms is different in each measurement.<br />
In addition, the experimental and reconstructed <strong>dose</strong><br />
distributions correspond to different planes and volumes.<br />
Therefore, the various <strong>dose</strong> distributions were geometrically<br />
matched, averaged and compared using 3-D matching s<strong>of</strong>tware<br />
developed in our institution. 29 All matching was performed<br />
manually and the quality <strong>of</strong> the match was judged by<br />
eye. Alignment <strong>of</strong> the films with respect to each other and<br />
with respect to the CT data could be achieved straightforwardly,<br />
because the external contour <strong>of</strong> the anthropomorphic<br />
phantoms could easily be distinguished on individual films<br />
and the film positions were clearly visible in the CT data.<br />
The error resulting from misaligning film and CT data is<br />
estimated to be 2 mm at maximum for the irradiated part <strong>of</strong><br />
the radiographic films.<br />
The EPID and film <strong>dose</strong> distributions correspond to different<br />
planes, and can only be compared directly at the intersection<br />
<strong>of</strong> these planes. Therefore, we have first validated the<br />
calculations <strong>of</strong> the absolute and relative 3-D <strong>dose</strong> distribution<br />
with the results <strong>of</strong> ionization chamber and film dosimetry,<br />
respectively. The 3-D <strong>dose</strong> calculations were then used as<br />
reference values for evaluating the results <strong>of</strong> 2-D EPID <strong>dose</strong><br />
determinations. In addition, the feasibility <strong>of</strong> 3-D portal dosimetry<br />
was tested, by comparing the reconstructed <strong>dose</strong> distributions<br />
in several planes with 3-D <strong>dose</strong> calculations obtained<br />
with Pinnacle. For comparing the reconstructed <strong>dose</strong><br />
distributions with calculated 3-D <strong>dose</strong> distributions, the geometrical<br />
information <strong>of</strong> the planned setup <strong>of</strong> the <strong>treatment</strong><br />
beams was used and the experimental error in aligning the<br />
phantoms was ignored.<br />
For the quantitative analysis <strong>of</strong> the results, the lung region<br />
and the region with distances less than 2 cm from the skin<br />
were excluded.<br />
III. RESULTS<br />
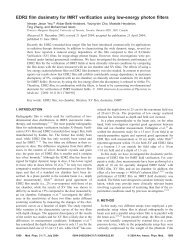
The planned and experimental total <strong>dose</strong> distributions resulting<br />
from all <strong>treatment</strong> beams Fig. 2 display <strong>dose</strong> gradients,<br />
which are commonly observed for the standard <strong>treatment</strong><br />
technique for <strong>breast</strong> <strong>cancer</strong> patients. In the AP<br />
Medical Physics, Vol. 30, No. 9, September 2003
2381 Louwe et al.: 3-D <strong>dose</strong> <strong>reconstruction</strong> 2381<br />
FIG. 2. Dose distributions obtained with film bottom<br />
and calculated with the TPS top at the sagittal film<br />
positions A1–A3 in phantom A, and the transversal film<br />
positions B1–B4 in phantom B. The color scale indicates<br />
deviations from the <strong>dose</strong> at the isocenter.<br />
direction, a more or less homogeneous <strong>dose</strong> distribution was<br />
obtained by the application <strong>of</strong> a wedge to compensate for the<br />
variation <strong>of</strong> the <strong>breast</strong> contour. At the cranial and caudal<br />
parts <strong>of</strong> the <strong>breast</strong> and at the proximity <strong>of</strong> the lungs, however,<br />
regions with <strong>dose</strong> differences up to 10% relative to the prescribed<br />
<strong>dose</strong> were observed.<br />
A. Validation <strong>of</strong> TPS calculations with ionization<br />
chamber and film dosimetry<br />
The calculated <strong>dose</strong> and the <strong>dose</strong> measured at the isocenter<br />
<strong>of</strong> phantom B using an ionization chamber were equal<br />
to 150.0 cGy and 150.60.3 cGy 1 SD, respectively. The<br />
difference between these values was less than the tolerated<br />
output fluctuation <strong>of</strong> the <strong>treatment</strong> machine. The difference<br />
in isocenter position <strong>of</strong> the two phantoms resulted in a lower<br />
calculated <strong>dose</strong> for phantom A <strong>of</strong> 140.1 cGy at the isocenter.<br />
The <strong>dose</strong> distributions calculated with the TPS corresponded<br />
very well with the normalized total film <strong>dose</strong> distributions<br />
for both phantoms Fig. 2. The difference between the calculated<br />
and measured film <strong>dose</strong>, averaged over all pixels,<br />
was 0.5%1.3% 1 SD and 0.2%2.1% 1 SD for phantoms<br />
A and B, respectively. In the Appendix it is shown that<br />
these deviations are consistent with the observed reproducibility<br />
<strong>of</strong> the film measurements.<br />
B. Accuracy <strong>of</strong> 2-D <strong>dose</strong> <strong>reconstruction</strong><br />
If the attenuation correction was applied, the deviation<br />
between the reconstructed and planned total <strong>dose</strong> distributions<br />
resulting from all <strong>treatment</strong> beams is 0.3%1.6% 1<br />
SD and 0.3%1.8% 1 SD for phantoms A and B, re-<br />
TABLE I. Average deviation between the <strong>dose</strong> reconstructed at the isocenter<br />
plane from EPID measurements either with or without attenuation<br />
correction, and the <strong>dose</strong> calculated with the TPS. Results for the individual<br />
beams MO: medial open, MW: medial wedged, LO: lateral open, LW:<br />
lateral wedged as well as for multiple beams are shown. All values have<br />
been obtained by averaging the observed deviations over all pixels within<br />
the region <strong>of</strong> interest. The values in brackets represent the corresponding<br />
variations 1 SD.<br />
Phantom A<br />
Phantom B<br />
<br />
MO 3.6%2.0% 5.6%8.8% 0.2%1.5% 2.3%5.8%<br />
MW 2.3%1.7% 0.7%7.5% 3.6%1.6% 1.3%5.3%<br />
LO 0.9%2.0% 3.8%7.6% 1.2%3.0% 0.4%4.6%<br />
LW 2.8%2.1% 1.7%7.0% 2.3%2.5% 1.7%3.9%<br />
Sum open 2.2%1.7% 4.3%2.7% 0.3%1.8% 1.3%1.8%<br />
Sum wedge 2.5%1.5% 0.9%1.9% 3.0%1.7% 1.6%1.7%<br />
Total <strong>dose</strong> 0.3%1.6% 2.9%2.3% 0.3%1.8% 1.6%1.8%<br />
Medical Physics, Vol. 30, No. 9, September 2003
2382 Louwe et al.: 3-D <strong>dose</strong> <strong>reconstruction</strong> 2382<br />
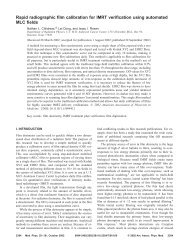
FIG. 3. Frequency distribution <strong>of</strong> the deviations between the reconstructed EPID isocenter plane <strong>dose</strong> relative to the <strong>dose</strong> calculated with the TPS: a total<br />
<strong>dose</strong> reconstructed with — and without --- the attenuation correction for phantom A; b the same as a but for phantom B; c <strong>dose</strong> reconstructed without<br />
the attenuation correction for the medial open beam —, the medial wedged beam ---, the lateral open beam –––, and the lateral wedged beam –-– for<br />
phantom A; d the same as c but <strong>dose</strong> reconstructed with the attenuation correction; e <strong>dose</strong> resulting from the two open beams — and the two wedged<br />
beams –––, reconstructed without the attenuation correction for phantom A; f the same as e but <strong>dose</strong> reconstructed with the attenuation correction.<br />
Medical Physics, Vol. 30, No. 9, September 2003
2383 Louwe et al.: 3-D <strong>dose</strong> <strong>reconstruction</strong> 2383<br />
attenuation correction, while the error distributions were almost<br />
unchanged Table I, Figs. 3a, 3b, 3e, 3f. Ifthe<br />
attenuation correction was not applied for <strong>dose</strong> <strong>reconstruction</strong><br />
<strong>of</strong> the individual beams, the average deviation for these<br />
beams ranged from 0% to 6%, with standard deviations up<br />
to 10% Table I, Fig. 3c.<br />
Several trends can be observed if the results obtained for<br />
the individual beams are inspected in Table I. The error in<br />
the <strong>dose</strong> reconstructed from the portal images was systematically<br />
higher more positive for phantom A than for phantom<br />
B, which had less lung tissue within the irradiated volume.<br />
Furthermore, a comparison <strong>of</strong> the results for open and<br />
wedged beams shows that <strong>dose</strong> <strong>reconstruction</strong> for beams<br />
with wedges probably results in too low <strong>dose</strong> values Figs.<br />
3e, 3f. However, the largest improvement in the accuracy<br />
<strong>of</strong> <strong>dose</strong> <strong>reconstruction</strong> was obtained if the attenuation correction<br />
was applied or if only the contribution <strong>of</strong> opposing<br />
beams was considered. This effect was considerably larger<br />
than the influence <strong>of</strong> inhomogeneities or wedges on the results<br />
for this <strong>treatment</strong> technique.<br />
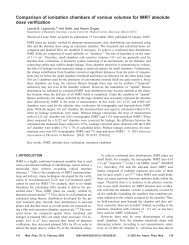
FIG. 4. Error map <strong>of</strong> the reconstructed total <strong>dose</strong> distribution resulting from<br />
all <strong>treatment</strong> beams for phantom A. The black, hatched, gray, and white<br />
areas represent error levels <strong>of</strong> 0%–1%, 1%–2%, 2%–5%, and 5%, respectively.<br />
See also Fig. 5e.<br />
spectively Table I, Figs. 3a, 3b. At the isocenter, the<br />
deviation between the reconstructed and planned total <strong>dose</strong><br />
was smaller than 1% for both phantoms. The spatial distribution<br />
<strong>of</strong> these deviations, as plotted in Fig. 4 for phantom<br />
A, shows that the difference was less than 2% at the major<br />
part <strong>of</strong> the isocenter plane. At the cranial and caudal side <strong>of</strong><br />
the isocenter plane, the deviations were larger up to 2.5%<br />
as well as in a small region toward the outer contour up to<br />
1.5%. Only at the position <strong>of</strong> the lung and skin, the regions<br />
that have been excluded from quantitative analysis,<br />
this deviation increased up to 10%. The spatial distribution<br />
<strong>of</strong> deviations in phantom B displayed the same trend. The<br />
deviation between the reconstructed and planned total <strong>dose</strong><br />
averaged over all pixels <strong>of</strong> the isocenter plane <strong>of</strong> both phantoms<br />
was 0.1%1.7% 1 SD.<br />
For the individual beams, the average deviation between<br />
the reconstructed and planned <strong>dose</strong> ranged from 3.6%<br />
to 3.6% with standard deviations <strong>of</strong> about 2% Table I,<br />
Fig. 3d. If the combined <strong>dose</strong> <strong>of</strong> opposing beams<br />
was considered, the deviations are slightly smaller Table I,<br />
Fig. 3f.<br />
If the attenuation correction was not applied, the accuracy<br />
<strong>of</strong> the <strong>dose</strong> <strong>reconstruction</strong> remained acceptable if the <strong>dose</strong><br />
distributions <strong>of</strong> nearly opposing beam segments were combined.<br />
If the <strong>dose</strong> resulting from the sum <strong>of</strong> all individual<br />
beams, from the sum <strong>of</strong> the open, or from the sum <strong>of</strong> the<br />
wedged beams was reconstructed, the average deviations decreased<br />
by approximately 2% upon the application <strong>of</strong> the<br />
C. Accuracy <strong>of</strong> 3-D <strong>dose</strong> <strong>reconstruction</strong><br />
In planes oriented parallel to the isocenter plane, the deviations<br />
between the reconstructed and planned <strong>dose</strong> were <strong>of</strong><br />
the same order <strong>of</strong> magnitude, as observed for the isocenter<br />
plane Fig. 5. Also in these planes, the deviation between<br />
the planned and reconstructed <strong>dose</strong> was most pronounced in<br />
regions that are closest to the skin. In particular, in planes<br />
located 8 cm from the isocenter, the deviations were significantly<br />
larger. The average deviation over all <strong>reconstruction</strong><br />
planes within the irradiated volume, excluding the lung<br />
region and the region less than 2 cm from the skin, was<br />
1.4%5.4% 1 SD. For planes within 5 cm <strong>of</strong> the isocenter<br />
plane, the deviation was 0.53.4% 1 SD.<br />
D. Accuracy <strong>of</strong> the <strong>dose</strong>–volume histogram<br />
Our algorithm provides both the 2-D <strong>dose</strong> <strong>reconstruction</strong><br />
at the isocenter plane, and a 3-D <strong>dose</strong> <strong>reconstruction</strong> <strong>of</strong> the<br />
irradiated volume. It seemed therefore worthwhile to compare<br />
reconstructed 2-D <strong>dose</strong> distributions, given as <strong>dose</strong>–<br />
area histograms DAHs, with planned <strong>dose</strong>–volume histograms<br />
DVHs. It can be seen Figs. 6a–6c that the<br />
accuracy <strong>of</strong> assessing the uniformity <strong>of</strong> the delivered <strong>dose</strong><br />
was limited if 2-D dosimetry was performed, especially if no<br />
attenuation correction was applied. In that case, the <strong>dose</strong> in<br />
the irradiated volume was overestimated by using the corresponding<br />
DAH, compared to the cumulative <strong>dose</strong>–volume<br />
histogram <strong>of</strong> the 3-D <strong>dose</strong> distribution obtained with the TPS<br />
Fig. 6a. Figure 6b shows that some improvement was<br />
obtained by including contour information during 2-D <strong>dose</strong><br />
<strong>reconstruction</strong>. However, even if the TPS is used, assessing<br />
the uniformity <strong>of</strong> the delivered <strong>dose</strong> in the irradiated volume<br />
by applying the DAH from a 2-D <strong>dose</strong> distribution instead <strong>of</strong><br />
the complete DVH is obviously limited Fig. 6c. Only if<br />
Medical Physics, Vol. 30, No. 9, September 2003
2384 Louwe et al.: 3-D <strong>dose</strong> <strong>reconstruction</strong> 2384<br />
FIG. 5. Deviations between the reconstructed <strong>dose</strong> EPID and the calculated <strong>dose</strong> Pinnacle in various planes that are oriented parallel to the isocenter plane<br />
for phantom A. a, b,...,h, i correspond to planes oriented at 8 cm, 6 cm,...,6 cm,8 cm medially from the isocenter plane. The color scale indicates<br />
the magnitude <strong>of</strong> the observed deviations.<br />
the true DVH was calculated from the nine reconstructed<br />
<strong>dose</strong> distributions presented above, a high accuracy could be<br />
obtained Fig. 6d.<br />
IV. DISCUSSION<br />
A. Comparison <strong>of</strong> 3-D <strong>dose</strong> calculations and film<br />
dosimetry<br />
A large number <strong>of</strong> contradicting results have been reported<br />
concerning the response <strong>of</strong> radiographic film obtained<br />
under various experimental conditions. 28,30–40 Because the<br />
problems involved in applying film dosimetry for absolute<br />
<strong>dose</strong> determinations are beyond the scope <strong>of</strong> our present<br />
study, we decided to limit ourselves to relative film dosimetry.<br />
Under the application <strong>of</strong> an overall normalization factor,<br />
the observed deviations between the <strong>dose</strong> distributions obtained<br />
with film dosimetry and with the TPS did not show a<br />
trend with the orientation or depth <strong>of</strong> the radiographic films.<br />
Consequently, the effects <strong>of</strong> film orientation and/or the presence<br />
<strong>of</strong> air gaps as observed by Suchowerska et al. 40 have<br />
not introduced systematic errors in this study. However, the<br />
uncertainty in the positioning <strong>of</strong> the phantoms in combination<br />
with the steep change in film response with the angle <strong>of</strong><br />
incidence <strong>of</strong> the photon beam at nearly parallel irradiation as<br />
observed by Suchowerska et al., 40 may have caused the<br />
somewhat reduced reproducibility <strong>of</strong> the results for phantom<br />
B. Because the 95% confidence interval <strong>of</strong> the measured film<br />
<strong>dose</strong> as calculated from the observed reproducibility see the<br />
Appendix, is larger than the magnitude <strong>of</strong> the observed deviations<br />
between the measured and planned <strong>dose</strong> distributions,<br />
we may conclude that the deviations between the film<br />
and planned <strong>dose</strong> mainly originate from film dosimetry. In<br />
addition, we found that the deviations between ionization<br />
chamber measurements and calculations performed with the<br />
TPS are smaller than the output fluctuations <strong>of</strong> the accelerator.<br />
Therefore, we estimate that the error in the 3-D <strong>dose</strong><br />
calculations obtained with the TPS are less than 1% 1 SD<br />
over the volume <strong>of</strong> interest and that it is justified to use the<br />
3-D calculations obtained with the TPS as a reference for our<br />
EPID dosimetry work.<br />
Medical Physics, Vol. 30, No. 9, September 2003
2385 Louwe et al.: 3-D <strong>dose</strong> <strong>reconstruction</strong> 2385<br />
FIG. 6. The comparison <strong>of</strong> various <strong>dose</strong>–volume histograms <strong>of</strong> the irradiated volume. The solid lines in a–d represent the DVH calculated with the TPS.<br />
The dotted lines are DVHs approximated by a a <strong>dose</strong>–area histogram <strong>of</strong> the <strong>dose</strong> reconstructed in the radiological midplane, b a <strong>dose</strong>–area histogram <strong>of</strong><br />
the <strong>dose</strong> reconstructed in the isocenter plane, c a <strong>dose</strong>-area histogram <strong>of</strong> the <strong>dose</strong> in the isocenter plane calculated with the TPS, and d a DVH calculated<br />
from the 3-D <strong>dose</strong> <strong>reconstruction</strong>.<br />
B. Accuracy <strong>of</strong> 2-D <strong>dose</strong> <strong>reconstruction</strong> at the<br />
midplane<br />
One might argue that the <strong>dose</strong> <strong>reconstruction</strong> at the isocenter<br />
plane or radiological midplane i.e., with or without<br />
using contour information yields an equally valid representation<br />
<strong>of</strong> the patient <strong>dose</strong> and that the exact location <strong>of</strong> the<br />
<strong>reconstruction</strong> plane is not <strong>of</strong> clinical importance. However,<br />
the comparison <strong>of</strong> the reconstructed and planned <strong>dose</strong> can<br />
only be carried out if contour information is included and the<br />
two <strong>dose</strong> distributions correspond to the same plane. If the<br />
attenuation correction is applied, the average deviation between<br />
the reconstructed and planned total <strong>dose</strong> at the isocenter<br />
plane averaged over both phantoms is 0.1%1.7%<br />
1 SD. For the actual <strong>treatment</strong> <strong>of</strong> <strong>breast</strong> <strong>cancer</strong> patients, the<br />
amount <strong>of</strong> lung within the <strong>treatment</strong> beam, the external contour<br />
<strong>of</strong> each patient and the wedge angles will vary from<br />
patient to patient. To estimate the corresponding change in<br />
accuracy, the results for the individual beams as given in<br />
Table I can be analyzed. First, the average deviations<br />
observed for phantom A are approximately 3% higher more<br />
positive than those obtained for phantom B. In phantom<br />
B, the isocenter is located more to the apex <strong>of</strong> the <strong>breast</strong>,<br />
resulting in a negligible amount <strong>of</strong> lung tissue within<br />
the irradiated volume for phantom A. Therefore, the different<br />
results for phantoms A and B show that the contribution<br />
<strong>of</strong> scattered radiation to the <strong>dose</strong> in the target volume<br />
is overestimated by the <strong>reconstruction</strong> algorithm if lung<br />
tissue is present. Second, the deviations for the wedged<br />
beams are approximately 3% lower than those obtained<br />
for the open beams. Because the calibration constants and<br />
Medical Physics, Vol. 30, No. 9, September 2003
2386 Louwe et al.: 3-D <strong>dose</strong> <strong>reconstruction</strong> 2386<br />
fit parameters for the <strong>dose</strong> <strong>reconstruction</strong> algorithm have<br />
been determined for open beams only, this effect is most<br />
likely related to beam hardening due to the application<br />
<strong>of</strong> wedges. Finally, the average deviations are approximately<br />
3% lower if the attenuation correction is applied, showing<br />
the influence <strong>of</strong> the asymmetric external contour. These different<br />
effects cannot simply be combined, but the results<br />
obtained for a <strong>reconstruction</strong> <strong>of</strong> the total <strong>dose</strong> show that the<br />
overall effect is small if the attenuation correction is applied.<br />
Therefore, the same accuracy for 2-D <strong>dose</strong> <strong>reconstruction</strong><br />
may be expected during the <strong>treatment</strong> <strong>of</strong> patients as observed<br />
in this study. If contour information is not available, the accuracy<br />
<strong>of</strong> <strong>dose</strong> <strong>reconstruction</strong> is only sufficient for nearly<br />
opposing beams. One should note, however, that larger errors<br />
may be expected if contours <strong>of</strong> the <strong>breast</strong> obtained during<br />
<strong>treatment</strong> planning are used, rather than contours obtained<br />
during <strong>treatment</strong>. The effect <strong>of</strong> anatomical changes during a<br />
complete series <strong>of</strong> <strong>treatment</strong> fractions on the <strong>dose</strong> estimation<br />
is under study.<br />
C. Accuracy <strong>of</strong> 3-D <strong>dose</strong> <strong>reconstruction</strong><br />
The <strong>reconstruction</strong> <strong>of</strong> the <strong>dose</strong> in planes parallel to the<br />
isocenter plane yields surprisingly small deviations from the<br />
planned <strong>dose</strong> values, considering the fact that the same scatter<br />
kernel has been used to convolve the primary photon<br />
beam in each plane. Although the skin region itself has not<br />
been included in the analysis, the accuracy <strong>of</strong> <strong>dose</strong> <strong>reconstruction</strong><br />
for <strong>breast</strong> patients with the algorithms presented in<br />
this work is mainly determined by the deviations occurring<br />
toward the skin. This is true, in particular, for 3-D <strong>dose</strong> <strong>reconstruction</strong>,<br />
since the region near the skin, which is included<br />
in the analysis, is relatively large. The experimental<br />
dataset, which is used to determine the parameters <strong>of</strong> the<br />
<strong>reconstruction</strong> algorithm, was obtained for phantoms with a<br />
thickness larger than 5 cm. Therefore, the PDD curve has<br />
most likely not been modeled properly for depths around the<br />
<strong>dose</strong> maximum. To improve the accuracy <strong>of</strong> <strong>dose</strong> <strong>reconstruction</strong><br />
for these depths, a more dedicated fit parameter dataset<br />
is required. The applied model <strong>of</strong> the dependence <strong>of</strong> the reconstructed<br />
<strong>dose</strong> on phantom thickness i.e., the NSPR in<br />
the currently used algorithms is sufficiently flexible to manage<br />
an extended experimental dataset. An improved accuracy<br />
<strong>of</strong> the <strong>dose</strong> <strong>reconstruction</strong> at depths around the depth <strong>of</strong> <strong>dose</strong><br />
maximum is part <strong>of</strong> our future work.<br />
Within a distance <strong>of</strong> 5 cm from the isocenter plane, the<br />
average deviation between the reconstructed and planned<br />
<strong>dose</strong> is 0.5%3.4% 1 SD. For a number <strong>of</strong> <strong>treatment</strong>s<br />
other than the one considered in this study, the planning target<br />
volume lies within this volume. Also, the variation <strong>of</strong> the<br />
external contour is <strong>of</strong>ten much smaller and the target volume<br />
located farther away from the skin. Therefore, it is reasonable<br />
to expect that if contour variation or inhomogeneities<br />
are not important, the 3-D <strong>dose</strong> <strong>reconstruction</strong> will be more<br />
accurate than observed here. Still, a higher accuracy may be<br />
needed for future applications, e.g., for a 3-D <strong>dose</strong> verification<br />
<strong>of</strong> whole <strong>breast</strong> <strong>treatment</strong>s. In those cases, appropriate<br />
scaling <strong>of</strong> the scatter kernels has to be applied. To obtain an<br />
extended dataset for scaling the scatter kernels, only a limited<br />
number <strong>of</strong> additional ionization chamber measurements<br />
in polystyrene slab phantoms would be involved for standard<br />
<strong>treatment</strong> configurations.<br />
Although the DVHs presented in this study are calculated<br />
using a relatively simple algorithm that may be further refined,<br />
a reasonably accurate estimate <strong>of</strong> the <strong>dose</strong> homogeneity<br />
in the irradiated volume is obtained if a 3-D <strong>dose</strong> <strong>reconstruction</strong><br />
is applied Fig. 6d.<br />
D. Patient scatter to the image<br />
An assumption in the original <strong>dose</strong> <strong>reconstruction</strong> algorithm,<br />
which may not be completely justified for EPID dosimetry<br />
during <strong>breast</strong> <strong>cancer</strong> <strong>treatment</strong>, concerns the scatter<br />
from the patient reaching the EPID. It has been shown that<br />
this scatter contribution is small and homogeneously distributed<br />
if the distance between the patient and portal imager is<br />
large e.g., during prostate <strong>treatment</strong>s. 5 In those cases, the<br />
contribution <strong>of</strong> patient scatter to the portal <strong>dose</strong> can be approximated<br />
using a simple proportionality between this scatter<br />
contribution and the uncorrected transmission <strong>of</strong> the irradiated<br />
volume. For the <strong>treatment</strong> <strong>of</strong> <strong>breast</strong> <strong>cancer</strong> patients,<br />
however, the distance between patient and portal imager has<br />
to be reduced to enable imaging <strong>of</strong> the large <strong>treatment</strong> fields.<br />
This reduced air gap may lead to a larger and nonuniform<br />
scatter contribution from the patient to the EPID and may<br />
deteriorate the accuracy <strong>of</strong> the <strong>dose</strong> <strong>reconstruction</strong> algorithm.<br />
Several investigators have studied this phenomenon and have<br />
proposed alternative methods to calculate the scatter contribution<br />
<strong>of</strong> the patient to the portal imager. 41–45<br />
In our approach, the scatter distribution at the position <strong>of</strong><br />
the EPID is assumed to be uniform. Furthermore, for the<br />
phantom measurements we found that the scatter to primary<br />
ratio SPR is only 2.5%, which is in line with former values<br />
for this beam energy and field size. 41 Thus, the patient scatter<br />
correction effectively contributes 2.5% to the total <strong>dose</strong> at<br />
the isocenter plane if we ignore its influence on the NSPR at<br />
that plane. The latter approximation is valid because it is a<br />
second-order effect only. The error in the reconstructed 2-D<br />
<strong>dose</strong> <strong>reconstruction</strong> would therefore increase by 0.25%, at<br />
most, if the error in the calculation <strong>of</strong> the patient scatter<br />
would be as high as 10%. Given the applied beam qualities,<br />
the thickness <strong>of</strong> the irradiated volumes, and the size <strong>of</strong> the<br />
largest field sizes that may be applied clinically for <strong>breast</strong><br />
<strong>cancer</strong> <strong>treatment</strong>, we estimate that the SPR at the position <strong>of</strong><br />
the EPID will always be less than 10%. 41 Even if that would<br />
be the case and maintaining the previously assumed error<br />
level <strong>of</strong> 10%, the error in the reconstructed 2-D <strong>dose</strong> would<br />
only be 1% higher compared to the application <strong>of</strong> an exact<br />
calculation <strong>of</strong> the patient to EPID scatter contribution. Therefore,<br />
we conclude that the simple algorithm to estimate the<br />
patient scatter to the imager, as applied in our approach,<br />
suffices in practical applications. As an additional test, we<br />
implemented an extended algorithm, which improved the accuracy<br />
<strong>of</strong> the calculation <strong>of</strong> the scatter contribution by several<br />
percent for large field sizes. This extended algorithm<br />
includes an iterative loop similar to the routine described by<br />
Medical Physics, Vol. 30, No. 9, September 2003
2387 Louwe et al.: 3-D <strong>dose</strong> <strong>reconstruction</strong> 2387<br />
Hansen et al., 41 although measured beam data were used as<br />
input in our approach. The results <strong>of</strong> <strong>dose</strong> <strong>reconstruction</strong><br />
changed less than 0.5% for the experiments presented in this<br />
work, and the extended algorithm was not applied in the<br />
analysis.<br />
E. Comparison with other 3-D <strong>dose</strong> <strong>reconstruction</strong><br />
methods<br />
Several authors have presented methods for a 3-D <strong>reconstruction</strong><br />
<strong>of</strong> the patient <strong>dose</strong> using CT data, which are representative<br />
for the patient anatomy during <strong>treatment</strong>. In the<br />
concept originally presented by McNutt et al., 2,3 an iterative<br />
convolution/superposition method was used to determine the<br />
primary energy fluence and subsequently the patient <strong>dose</strong><br />
applying predefined scatter kernels. Partridge et al. 10 also apply<br />
an iterative method to determine the primary energy fluence,<br />
but propose either the application <strong>of</strong> the original TPS<br />
or an independent algorithm e.g., Monte Carlo planning calculation<br />
to reconstruct the patient <strong>dose</strong>. Both methods require<br />
a more sophisticated algorithm to determine the primary<br />
fluence and patient <strong>dose</strong>, and/or a low-level access to<br />
the TPS, and rely on the validity <strong>of</strong> the CT data. On-line CT<br />
data are currently not available in many institutions, however,<br />
and will most likely only be available in a limited number<br />
<strong>of</strong> <strong>treatment</strong> centers and obtained for a limited number<br />
<strong>of</strong> patients in the near future. The relatively simple method<br />
we present in this study is therefore especially useful when<br />
CT data, whether on-line or not, are not available.<br />
F. Clinical factors influencing the accuracy <strong>of</strong> <strong>dose</strong><br />
<strong>reconstruction</strong><br />
During actual patient <strong>treatment</strong>s, positioning errors may<br />
influence the accuracy <strong>of</strong> the <strong>dose</strong> <strong>reconstruction</strong>. When appropriate<br />
3-D setup verification and correction procedures<br />
are applied, patient-positioning errors can generally be minimized<br />
to a few mm, 46 in which case the accuracy <strong>of</strong> <strong>dose</strong><br />
<strong>reconstruction</strong> will be within the previously specified range.<br />
Setup verification and correction <strong>of</strong> patient positioning is<br />
generally not performed for the <strong>treatment</strong> <strong>of</strong> <strong>breast</strong> <strong>cancer</strong><br />
patients with the tangential field technique, however. Although<br />
the reconstructed patient <strong>dose</strong> will still represent the<br />
<strong>dose</strong> actually delivered to the irradiated volume if patient<br />
positioning errors occur, a determination <strong>of</strong> the coverage <strong>of</strong><br />
the target volume and <strong>of</strong> the <strong>dose</strong> to organs at risk requires<br />
an independent analysis.<br />
If contour information is used to reconstruct the <strong>dose</strong>,<br />
patient positioning errors along the axis <strong>of</strong> the <strong>treatment</strong><br />
beam will yield an opposite effect for the medial and lateral<br />
beams and will cancel out in the total <strong>dose</strong> per fraction.<br />
Patient positioning errors, perpendicular to the beam axis,<br />
can first be corrected by matching the portal images to the<br />
available reference images simulator images or DRRs.<br />
Next, contours can be shifted accordingly prior to <strong>dose</strong> <strong>reconstruction</strong>.<br />
Although the accuracy <strong>of</strong> a 2-D correction on<br />
the 3-D setup error will be limited, we estimate that the<br />
influence <strong>of</strong> the remaining setup error on the accuracy <strong>of</strong> the<br />
<strong>dose</strong> <strong>reconstruction</strong> is negligible because it will be a secondorder<br />
effect only the attenuation correction is the first-order<br />
effect on the accuracy <strong>of</strong> <strong>dose</strong> <strong>reconstruction</strong>.<br />
Because the heart was not simulated in these phantoms,<br />
the accuracy <strong>of</strong> reconstructing the heart <strong>dose</strong> during <strong>breast</strong><br />
<strong>cancer</strong> <strong>treatment</strong> could not be assessed. Considering the position<br />
<strong>of</strong> the heart within the lung region, the radiological<br />
midplane will be located more closely to the central plane <strong>of</strong><br />
the heart than the isocenter plane. Therefore, it may be expected<br />
that <strong>reconstruction</strong> <strong>of</strong> the heart <strong>dose</strong> in the radiological<br />
midplane when contour information is not used will<br />
yield a more accurate representation <strong>of</strong> the heart <strong>dose</strong> than<br />
the <strong>dose</strong> in the isocenter plane. The use <strong>of</strong> the EPID for the<br />
verification <strong>of</strong> heart <strong>dose</strong> during patient <strong>treatment</strong> is the topic<br />
<strong>of</strong> further study.<br />
During the initial phase <strong>of</strong> this study, we observed that the<br />
EPID response varied considerably with time. By applying a<br />
thorough QA procedure, including regular recalibration <strong>of</strong><br />
the EPID, the high accuracy <strong>of</strong> <strong>dose</strong> <strong>reconstruction</strong> as reported<br />
in this paper could be obtained. The study <strong>of</strong> the<br />
long-term stability <strong>of</strong> the EPID will be dealt with in a separate<br />
paper.<br />
V. CONCLUSIONS<br />
We have extended a previously developed algorithm to<br />
reconstruct the patient <strong>dose</strong> in the isocenter plane, specifically<br />
for the <strong>treatment</strong> <strong>of</strong> <strong>breast</strong> <strong>cancer</strong> patients. A simple<br />
attenuation correction is used based on the external contour<br />
<strong>of</strong> the patient. In addition to a more accurate 2-D <strong>dose</strong> <strong>reconstruction</strong><br />
in the isocenter plane, we have shown that now<br />
also a reasonably accurate 3-D <strong>dose</strong> <strong>reconstruction</strong> is possible<br />
in planes within 5 cm from the isocenter plane using the<br />
extended <strong>dose</strong> <strong>reconstruction</strong> algorithm. The largest errors<br />
result from limitations <strong>of</strong> our algorithm in the presence <strong>of</strong><br />
inhomogeneities lungs and at depths around the <strong>dose</strong> maximum<br />
skin. Furthermore, we have shown that 3-D <strong>dose</strong> <strong>reconstruction</strong><br />
yields accurate values <strong>of</strong> the DVH <strong>of</strong> the irradiated<br />
volume, thus allowing the in vivo verification <strong>of</strong> the<br />
<strong>dose</strong> delivery to the irradiated volume. The uncertainty in the<br />
contribution <strong>of</strong> patient scatter to the imager has only a limited<br />
effect on the accuracy <strong>of</strong> <strong>dose</strong> <strong>reconstruction</strong>, and a<br />
crude estimate <strong>of</strong> this quantity is sufficient for most applications.<br />
ACKNOWLEDGMENT<br />
This work was financially supported by the Dutch Cancer<br />
Society Grant No. NKI 2000-2255.<br />
APPENDIX: ACCURACY OF TPS CALCULATIONS<br />
The contribution <strong>of</strong> random noise in the film <strong>dose</strong> determinations<br />
to the observed differences between the planned<br />
and film <strong>dose</strong> distributions was estimated from the observed<br />
reproducibility <strong>of</strong> film <strong>dose</strong> measurements. Because the<br />
variations in film <strong>dose</strong> were approximately normally distributed<br />
at all film positions data not shown, these variations<br />
were treated as random noise. For each film position, the<br />
total <strong>dose</strong> was calculated by averaging and adding the <strong>dose</strong><br />
distributions <strong>of</strong> the individual beams. The final noise level<br />
Medical Physics, Vol. 30, No. 9, September 2003
2388 Louwe et al.: 3-D <strong>dose</strong> <strong>reconstruction</strong> 2388<br />
TABLE II. The contribution <strong>of</strong> noise from film dosimetry to the observed<br />
deviations column 7 between the film and the planned <strong>dose</strong> distributions.<br />
The contribution <strong>of</strong> the individual beam segments to the noise level <strong>of</strong><br />
the measured total film <strong>dose</strong> Mmedial, Llateral, Wwedge, Oopen is<br />
given as the average standard error <strong>of</strong> mean, SEM, for specific film positions<br />
columns 2–5. The estimated noise level SEM tot <strong>of</strong> the total <strong>dose</strong> distribution<br />
after averaging and summing the individual film <strong>dose</strong> measurements is<br />
given in column 6. Values in brackets represent the corresponding variations<br />
1 SD. Percentages marked with † have been obtained by excluding a single<br />
film outlier.<br />
Position SEM MW SEM MO SEM LW SEM LO SEM tot film,calc<br />
A1 0.5% † 0.6% 0.4% 0.8% 1.2% 0.2% 1.0%<br />
A2 0.4% 0.7% 0.7% 0.8% † 1.4% 0.2% 1.4%<br />
A3 0.5% 0.8% 1.0% 0.5% † 1.4% 1.3% 1.3%<br />
B1 1.1% 0.8% 1.0% 0.6% † 1.8% 0.6% 0.8%<br />
B2 1.0% † 2.1% 0.7% 0.9% † 2.6% 2.2% 1.2%<br />
B3 1.1% 0.9% † 1.0% 0.8% 1.9% 0.3% 1.0%<br />
B4 0.8% 0.9% † 0.9% † 1.5% † 2.2% 1.8% 0.6%<br />
for the total film <strong>dose</strong> distribution at a particular film position<br />
was calculated accordingly. First, the standard error <strong>of</strong> the<br />
mean, SEM ij , was calculated at each pixel position. These<br />
numbers were subsequently averaged for each film position P<br />
and for each <strong>treatment</strong> beam B to determine their contribution<br />
to the overall noise level <strong>of</strong> film dosimetry, SEM BP<br />
Table II:<br />
SEM BP SEM ij<br />
ij ij /N BP <br />
, A1<br />
n ij n ij<br />
in which ij , n ij , and N BP represent the standard deviation<br />
and the number <strong>of</strong> pixels at a specific film position, and the<br />
number <strong>of</strong> film measurements, respectively. The noise level<br />
<strong>of</strong> the total film <strong>dose</strong> was then calculated for each film position<br />
by quadratically summing the SEM <strong>of</strong> the individual<br />
beams:<br />
SEM P <br />
B<br />
SEM BP 2 . A2<br />
For phantom A, the overall noise level was 1.3% SEM.<br />
<strong>Three</strong> films out <strong>of</strong> 72 were marked as outlier and excluded<br />
from further analysis. For phantom B, an overall noise level<br />
<strong>of</strong> 2.1% SEM was obtained, while 7 films out <strong>of</strong> 120 were<br />
marked as an outlier. At each film position, the observed<br />
deviations between the planned and measured <strong>dose</strong> lie within<br />
the 95% confidence interval 1.96SEM <strong>of</strong> the total film<br />
<strong>dose</strong> Table II. Furthermore, the deviations in Table II as<br />
well as the deviations plotted in Figs. 2–3, do not show a<br />
systematic trend. Therefore, possible errors in the <strong>dose</strong> calculated<br />
with the TPS can be neglected.<br />
a Author to whom correspondence should be addressed: B. J. Mijnheer, The<br />
Netherlands, Cancer Institute/Antoni van Leeuwenhoek Hospital, Department<br />
<strong>of</strong> Radiotherapy, Plesmanlaan 121, 1066 CX Amsterdam, The Netherlands.<br />
Telephone: 3120-5122203; fax: 3120-6691101; electronic<br />
mail: bmijnh@nki.nl<br />
1 X. G. Ying, L. Y. Geer, and J. W. Wong, ‘‘Portal <strong>dose</strong> images. II: Patient<br />
<strong>dose</strong> estimation,’’ Int. J. Radiat. Oncol., Biol., Phys. 18, 1465–1475<br />
1990.<br />
2 T. R. McNutt, T. R. Mackie, P. Reckwerdt, N. Papanikolaou, and B. R.<br />
Paliwal, ‘‘Calculation <strong>of</strong> portal <strong>dose</strong> using the convolution/superposition<br />
method,’’ Med. Phys. 23, 527–535 1996.<br />
3 T. R. McNutt, T. R. Mackie, P. Reckwerdt, and B. R. Paliwal, ‘‘Modeling<br />
<strong>dose</strong> distributions from portal <strong>dose</strong> images using the convolution/<br />
superposition method,’’ Med. Phys. 23, 1381–1392 1996.<br />
4 K. L. Pasma, B. J. Heijmen, M. Kroonwijk, and A. G. Visser, ‘‘Portal<br />
<strong>dose</strong> image PDI prediction for dosimetric <strong>treatment</strong> verification in radiotherapy.<br />
I. An algorithm for open beams,’’ Med. Phys. 25, 830–840<br />
1998.<br />
5 R. Boellaard, M. van Herk, H. Uiterwaal, and B. Mijnheer, ‘‘Two<strong>dimensional</strong><br />
exit dosimetry using a liquid-filled electronic portal imaging<br />
device and a convolution model,’’ Radiother. Oncol. 44, 149–157 1997.<br />
6 R. Boellaard, M. Essers, M. van Herk, and B. J. Mijnheer, ‘‘A new<br />
method to obtain the midplane <strong>dose</strong> using portal in vivo dosimetry,’’ Int.<br />
J. Radiat. Oncol., Biol., Phys. 41, 465–474 1998.<br />
7 V. N. Hansen, P. M. Evans, and W. Swindell, ‘‘The application <strong>of</strong> transit<br />
dosimetry to precision radiotherapy,’’ Med. Phys. 23, 713–721 1996.<br />
8 K. L. Pasma, M. Kroonwijk, S. Quint, A. G. Visser, and B. J. Heijmen,<br />
‘‘Transit dosimetry with an electronic portal imaging device EPID for<br />
115 prostate <strong>cancer</strong> patients,’’ Int. J. Radiat. Oncol., Biol., Phys. 45,<br />
1297–1303 1999.<br />
9 J. M. Kapatoes, G. H. Olivera, J. P. Balog, H. Keller, P. J. Reckwerdt, and<br />
T. R. Mackie, ‘‘On the accuracy and effectiveness <strong>of</strong> <strong>dose</strong> <strong>reconstruction</strong><br />
for tomotherapy,’’ Phys. Med. Biol. 46, 943–966 2001.<br />
10 M. Partridge, M. Ebert, and B. M. Hesse, ‘‘IMRT verification by three<strong>dimensional</strong><br />
<strong>dose</strong> <strong>reconstruction</strong> from portal beam measurements,’’ Med.<br />
Phys. 29, 1847–1858 2002.<br />
11 W. P. Mayles, J. R. Yarnold, and S. Webb, ‘‘Improved <strong>dose</strong> homogeneity<br />
in the <strong>breast</strong> using tissue compensators,’’ Radiother. Oncol. 22, 248–251<br />
1991.<br />
12 K. L. Pasma, M. Kroonwijk, E. B. van Dieren, A. G. Visser, and B. J.<br />
Heijmen, ‘‘Verification <strong>of</strong> compensator thicknesses using a fluoroscopic<br />
electronic portal imaging device,’’ Med. Phys. 26, 1524–1529 1999.<br />
13 P. M. Evans, V. N. Hansen, W. P. Mayles, W. Swindell, M. Torr, and J. R.<br />
Yarnold, ‘‘Design <strong>of</strong> compensators for <strong>breast</strong> radiotherapy using electronic<br />
portal imaging,’’ Radiother. Oncol. 37, 43–54 1995.<br />
14 P. M. Evans, E. M. Donovan, N. Fenton, V. N. Hansen, I. Moore, M.<br />
Partridge, S. Reise, B. Suter, J. R. Symonds-Tayler, and J. R. Yarnold,<br />
‘‘Practical implementation <strong>of</strong> compensators in <strong>breast</strong> radiotherapy,’’ Radiother.<br />
Oncol. 49, 255–265 1998.<br />
15 P. M. Evans, E. M. Donovan, M. Partridge, A. M. Bidmead, A. Garton,<br />
and C. Mubata, ‘‘Radiological thickness measurement using a liquid ionization<br />
chamber electronic portal imaging device,’’ Phys. Med. Biol. 44,<br />
N89–N97 1999.<br />
16 E. M. Donovan, U. Johnson, G. Shentall, P. M. Evans, A. J. Neal, and J.<br />
R. Yarnold, ‘‘Evaluation <strong>of</strong> compensation in <strong>breast</strong> radiotherapy: a planning<br />
study using multiple static fields,’’ Int. J. Radiat. Oncol., Biol., Phys.<br />
46, 671–679 2000.<br />
17 L. L. Kestin, M. B. Sharpe, R. C. Frazier, F. A. Vicini, D. Yan, R. C.<br />
Matter, A. A. Martinez, and J. W. Wong, ‘‘Intensity modulation to improve<br />
<strong>dose</strong> uniformity with tangential <strong>breast</strong> radiotherapy: initial clinical<br />
experience,’’ Int. J. Radiat. Oncol., Biol., Phys. 48, 1559–1568 2000.<br />
18 C. Weltens, D. Huyskens, A. Dutreix, and E. van der Schueren, ‘‘Assessment<br />
<strong>of</strong> <strong>dose</strong> inhomogeneities in clinical practice by film dosimetry,’’<br />
Radiother. Oncol. 49, 287–294 1998.<br />
19 R. Bogaerts, A. Van Esch, R. Reymen, and D. Huyskens, ‘‘A method to<br />
estimate the transit <strong>dose</strong> on the beam axis for verification <strong>of</strong> <strong>dose</strong> delivery<br />
with portal images,’’ Radiother. Oncol. 54, 39–462000.<br />
20 C. W. Hurkmans, B. C. J. Cho, E. Damen, L. Zijp, and B. J. Mijnheer,<br />
‘‘Reduction <strong>of</strong> cardiac and lung complication probabilities after <strong>breast</strong><br />
irradiation using conformal radiotherapy with or without intensity modulation,’’<br />
Radiother. Oncol. 62, 163–171 2002.<br />
21 B. C. Cho, C. W. Hurkmans, E. M. F. Damen, L. J. Zijp, and B. J.<br />
Mijnheer, ‘‘Intensity modulated versus non-intensity modulated radiotherapy<br />
in the <strong>treatment</strong> <strong>of</strong> the left <strong>breast</strong> and upper internal mammary<br />
lymph node chain: a comparative planning study,’’ Radiother. Oncol. 62,<br />
127–136 2002.<br />
22 C. W. Hurkmans, J. H. Borger, L. J. Bos, A. van der Horst, B. R. Pieters,<br />
J. V. Lebesque, and B. J. Mijnheer, ‘‘Cardiac and lung complication probabilities<br />
after <strong>breast</strong> <strong>cancer</strong> irradiation,’’ Radiother. Oncol. 55, 145–151<br />
2000.<br />
23 R. Boellaard, M. van Herk, and B. J. Mijnheer, ‘‘The <strong>dose</strong> response<br />
Medical Physics, Vol. 30, No. 9, September 2003
2389 Louwe et al.: 3-D <strong>dose</strong> <strong>reconstruction</strong> 2389<br />
relationship <strong>of</strong> a liquid-filled electronic portal imaging device,’’ Med.<br />
Phys. 23, 1601–1611 1996.<br />
24 R. Boellaard, M. van Herk, H. Uiterwaal, and B. Mijnheer, ‘‘First clinical<br />
tests using a liquid-filled electronic portal imaging device and a convolution<br />
model for the verification <strong>of</strong> the midplane <strong>dose</strong>,’’ Radiother. Oncol.<br />
47, 303–312 1998.<br />
25 M. Essers, R. Boellaard, M. van Herk, H. Lanson, and B. Mijnheer,<br />
‘‘Transmission dosimetry with a liquid-filled electronic portal imaging<br />
device,’’ Int. J. Radiat. Oncol., Biol., Phys. 34, 931–941 1996.<br />
26 M. Essers, B. R. Hoogervorst, M. van Herk, H. Lanson, and B. J. Mijnheer,<br />
‘‘Dosimetric characteristics <strong>of</strong> a liquid-filled electronic portal imaging<br />
device,’’ Int. J. Radiat. Oncol., Biol., Phys. 33, 1265–1272 1995.<br />
27 B. C. Cho, M. van Herk, B. J. Mijnheer, and H. Bartelink, ‘‘The effect <strong>of</strong><br />
set-up uncertainties, contour changes, and tissue inhomogeneities on target<br />
<strong>dose</strong>–volume histograms,’’ Med. Phys. 29, 2305–2318 2002.<br />
28 N. A. van Bree, M. H. Idzes, H. Huizenga, and B. J. Mijnheer, ‘‘Film<br />
dosimetry for radiotherapy <strong>treatment</strong> planning verification <strong>of</strong> a6MV<br />
tangential <strong>breast</strong> irradiation,’’ Radiother. Oncol. 31, 251–255 1994.<br />
29 M. van Herk, A. R. Peters, and J. C. de Munck, ‘‘A comprehensive<br />
system for three-<strong>dimensional</strong> image registration in radiotherapy,’’ Proceedings<br />
<strong>of</strong> the XIIth International Conference on the Use <strong>of</strong> Computers<br />
in Radiotherapy, May 1997, Salt Lake City, edited by D. D. Leavitt and<br />
G. Starkschall Medical Physics Publishing, Madison, 1997 pp. 237–<br />
240.<br />
30 L. J. Bos, C. Danciu, C.-W. Cheng, M. J. Brugmans, A. van der Horst, A.<br />
W. Minken, and B. Mijnheer, ‘‘Inter-institutional variations <strong>of</strong> sensitometric<br />
curves <strong>of</strong> radiographic dosimetric films,’’ Med. Phys. 29, 1772–<br />
1780 2002.<br />
31 J. F. Williamson, F. M. Khan, and S. C. Sharma, ‘‘Film dosimetry <strong>of</strong><br />
megavoltage photon beams: a practical method <strong>of</strong> isodensity-to-iso<strong>dose</strong><br />
curve conversion,’’ Med. Phys. 8, 94–981981.<br />
32 J. I. Hale, A. T. Kerr, and P. C. Shragge, ‘‘Calibration <strong>of</strong> film for accurate<br />
megavoltage photon dosimetry,’’ Med. Dosim 19, 43–461994.<br />
33 M. D. Evans and L. J. Schreiner, ‘‘A simple technique for film dosimetry,’’<br />
Radiother. Oncol. 23, 265–267 1992.<br />
34 J. L. Robar and B. G. Clark, ‘‘The use <strong>of</strong> radiographic film for linear<br />
accelerator stereotactic radiosurgical dosimetry,’’ Med. Phys. 26, 2144–<br />
2150 1999.<br />
35 L. J. van Battum and B. J. Heijmen, ‘‘Film dosimetry in water in a<br />
23 MV therapeutic photon beam,’’ Radiother. Oncol. 34, 152–159<br />
1995.<br />
36 R. L. Stern, B. A. Fraass, A. Gerhardsson, D. L. McShan, and K. L.<br />
Lam, ‘‘Generation and use <strong>of</strong> measurement-based 3-D <strong>dose</strong> distributions<br />
for 3-D <strong>dose</strong> calculation verification,’’ Med. Phys. 19, 165–173 1992.<br />
37 J. R. Sykes, H. V. James, and P. C. Williams, ‘‘How much does film<br />
sensitivity increase at depth for larger field sizes?,’’ Med. Phys. 26, 329–<br />
330 1999.<br />
38 S. E. Burch, K. J. Kearfott, J. H. Trueblood, W. C. Sheils, J. I. Yeo, and<br />
C. K. Wang, ‘‘A new approach to film dosimetry for high energy photon<br />
beams: lateral scatter filtering,’’ Med. Phys. 24, 775–783 1997.<br />
39 C. Danciu, B. S. Proimos, J. C. Rosenwald, and B. J. Mijnheer, ‘‘Variation<br />
<strong>of</strong> sensitometric curves <strong>of</strong> radiographic films in high energy photon<br />
beams,’’ Med. Phys. 28, 966–974 2001.<br />
40 N. Suchowerska, P. Hoban, M. Butson, A. Davison, and P. Metcalfe,<br />
‘‘Directional dependence in film dosimetry: radiographic and radiochromic<br />
film,’’ Phys. Med. Biol. 46, 1391–1397 2001.<br />
41 V. N. Hansen, W. Swindell, and P. M. Evans, ‘‘Extraction <strong>of</strong> primary<br />
signal from EPIDs using only forward convolution,’’ Med. Phys. 24,<br />
1477–1484 1997.<br />
42 M. Partridge and P. M. Evans, ‘‘The practical implementation <strong>of</strong> a scatter<br />
model for portal imaging at 10 MV,’’ Phys. Med. Biol. 43, 2685–2693<br />
1998.<br />
43 W. Swindell and P. M. Evans, ‘‘Scattered radiation in portal images: a<br />
Monte Carlo simulation and a simple physical model,’’ Med. Phys. 23,<br />
63–73 1996.<br />
44 B. M. McCurdy and S. Pistorius, ‘‘Photon scatter in portal images: accuracy<br />
<strong>of</strong> a fluence based pencil beam superposition algorithm,’’ Med. Phys.<br />
27, 913–922 2000.<br />
45 S. R. Ozard and E. E. Grein, ‘‘Analytical calculation <strong>of</strong> the portal scatter<br />
to primary <strong>dose</strong> ratio: an EGS4 Monte Carlo and experimental validation at<br />
large air gaps,’’ Phys. Med. Biol. 46, 1719–1736 2001.<br />
46 C. W. Hurkmans, P. Remeijer, J. V. Lebesque, and B. J. Mijnheer,<br />
‘‘Set-up verification using portal imaging; review <strong>of</strong> current clinical practice,’’<br />
Radiother. Oncol. 58, 105–120 2001.<br />
Medical Physics, Vol. 30, No. 9, September 2003