A First Look at the Literacy of America's Adults in the 21st Century
A First Look at the Literacy of America's Adults in the 21st Century
A First Look at the Literacy of America's Adults in the 21st Century

Create successful ePaper yourself
Turn your PDF publications into a flip-book with our unique Google optimized e-Paper software.
U.S. Department <strong>of</strong> Educ<strong>at</strong>ion<br />
Institute <strong>of</strong> Educ<strong>at</strong>ion Sciences<br />
NCES 2006-470<br />
INSIDE THIS ISSUE<br />
2 Description <strong>of</strong> <strong>Literacy</strong><br />
Levels<br />
2 Assessment Design<br />
2 Def<strong>in</strong><strong>in</strong>g <strong>Literacy</strong><br />
4 Changes <strong>in</strong> Adult<br />
<strong>Literacy</strong><br />
4 Nonliter<strong>at</strong>e <strong>in</strong> English<br />
5 Pr<strong>of</strong>ile <strong>of</strong> <strong>Adults</strong> With<br />
Below Basic Prose<br />
<strong>Literacy</strong><br />
6 <strong>Literacy</strong> by Gender<br />
8 <strong>Literacy</strong> by<br />
Race/Ethnicity<br />
10 <strong>Literacy</strong> by Age<br />
12 <strong>Literacy</strong> by Language<br />
Spoken Before Start<strong>in</strong>g<br />
School<br />
14 <strong>Literacy</strong> by Educ<strong>at</strong>ional<br />
Atta<strong>in</strong>ment<br />
16 <strong>Literacy</strong> by Employment<br />
St<strong>at</strong>us<br />
18 Popul<strong>at</strong>ion and Sample<br />
Size, and D<strong>at</strong>a Collection<br />
Procedures<br />
18 Variable Def<strong>in</strong>itions<br />
19 Sample Assessment<br />
Questions<br />
28 Future NAAL Reports<br />
28 NAAL on <strong>the</strong> Web<br />
N<strong>at</strong>ional Assessment <strong>of</strong> Adult <strong>Literacy</strong> (NAAL)<br />
A <strong>First</strong> <strong>Look</strong> <strong>at</strong> <strong>the</strong> <strong>Literacy</strong> <strong>of</strong><br />
America’s <strong>Adults</strong> <strong>in</strong> <strong>the</strong> 21 st <strong>Century</strong><br />
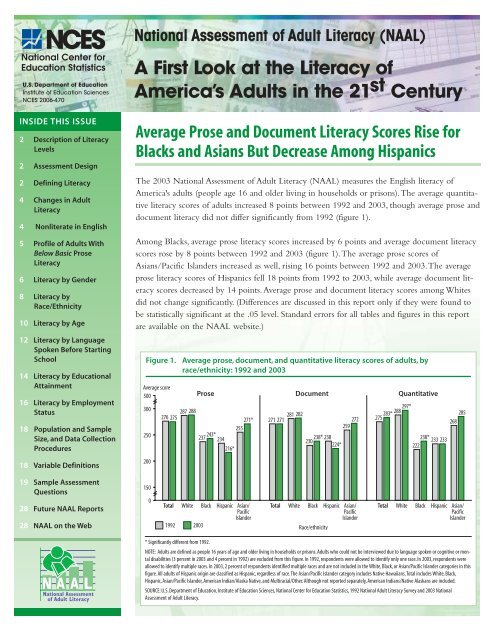
Average Prose and Document <strong>Literacy</strong> Scores Rise for<br />
Blacks and Asians But Decrease Among Hispanics<br />
The 2003 N<strong>at</strong>ional Assessment <strong>of</strong> Adult <strong>Literacy</strong> (NAAL) measures <strong>the</strong> English literacy <strong>of</strong><br />
<strong>America's</strong> adults (people age 16 and older liv<strong>in</strong>g <strong>in</strong> households or prisons).The average quantit<strong>at</strong>ive<br />
literacy scores <strong>of</strong> adults <strong>in</strong>creased 8 po<strong>in</strong>ts between 1992 and 2003, though average prose and<br />
document literacy did not differ significantly from 1992 (figure 1).<br />
Among Blacks, average prose literacy scores <strong>in</strong>creased by 6 po<strong>in</strong>ts and average document literacy<br />
scores rose by 8 po<strong>in</strong>ts between 1992 and 2003 (figure 1).The average prose scores <strong>of</strong><br />
Asians/Pacific Islanders <strong>in</strong>creased as well, ris<strong>in</strong>g 16 po<strong>in</strong>ts between 1992 and 2003.The average<br />
prose literacy scores <strong>of</strong> Hispanics fell 18 po<strong>in</strong>ts from 1992 to 2003, while average document literacy<br />
scores decreased by 14 po<strong>in</strong>ts. Average prose and document literacy scores among Whites<br />
did not change significantly. (Differences are discussed <strong>in</strong> this report only if <strong>the</strong>y were found to<br />
be st<strong>at</strong>istically significant <strong>at</strong> <strong>the</strong> .05 level. Standard errors for all tables and figures <strong>in</strong> this report<br />
are available on <strong>the</strong> NAAL website.)<br />
Figure 1. Average prose, document, and quantit<strong>at</strong>ive literacy scores <strong>of</strong> adults, by<br />
race/ethnicity: 1992 and 2003<br />
Average score<br />
500<br />
300<br />
250<br />
200<br />
150<br />
0<br />
287 288<br />
276 275<br />
Prose Document Quantit<strong>at</strong>ive<br />
237 243* 234<br />
216*<br />
281 282<br />
271* 271 271<br />
255<br />
238* 238<br />
230<br />
224*<br />
272<br />
259<br />
297*<br />
283* 288<br />
275<br />
238* 233 233<br />
222<br />
285<br />
268<br />
Total White Black Hispanic Asian/<br />
Pacific<br />
Islander<br />
Total White Black Hispanic Asian/<br />
Pacific<br />
Islander<br />
Total White Black Hispanic Asian/<br />
Pacific<br />
Islander<br />
1992 2003 Race/ethnicity<br />
* Significantly different from 1992.<br />
NOTE: <strong>Adults</strong> are def<strong>in</strong>ed as people 16 years <strong>of</strong> age and older liv<strong>in</strong>g <strong>in</strong> households or prisons. <strong>Adults</strong> who could not be <strong>in</strong>terviewed due to language spoken or cognitive or mental<br />
disabilities (3 percent <strong>in</strong> 2003 and 4 percent <strong>in</strong> 1992) are excluded from this figure. In 1992, respondents were allowed to identify only one race. In 2003, respondents were<br />
allowed to identify multiple races. In 2003, 2 percent <strong>of</strong> respondents identified multiple races and are not <strong>in</strong>cluded <strong>in</strong> <strong>the</strong> White, Black, or Asian/Pacific Islander c<strong>at</strong>egories <strong>in</strong> this<br />
figure. All adults <strong>of</strong> Hispanic orig<strong>in</strong> are classified as Hispanic, regardless <strong>of</strong> race.The Asian/Pacific Islander c<strong>at</strong>egory <strong>in</strong>cludes N<strong>at</strong>ive Hawaiians.Total <strong>in</strong>cludes White, Black,<br />
Hispanic, Asian/Pacific Islander, American Indian/Alaska N<strong>at</strong>ive, and Multiracial/O<strong>the</strong>r. Although not reported separ<strong>at</strong>ely, American Indians/N<strong>at</strong>ive Alaskans are <strong>in</strong>cluded.<br />
SOURCE: U.S. Department <strong>of</strong> Educ<strong>at</strong>ion, Institute <strong>of</strong> Educ<strong>at</strong>ion Sciences, N<strong>at</strong>ional Center for Educ<strong>at</strong>ion St<strong>at</strong>istics, 1992 N<strong>at</strong>ional Adult <strong>Literacy</strong> Survey and 2003 N<strong>at</strong>ional<br />
Assessment <strong>of</strong> Adult <strong>Literacy</strong>.
A <strong>First</strong> <strong>Look</strong> <strong>at</strong> <strong>the</strong> <strong>Literacy</strong> <strong>of</strong> America’s <strong>Adults</strong> <strong>in</strong> <strong>the</strong> 21 st <strong>Century</strong><br />
Description <strong>of</strong> <strong>Literacy</strong> Levels<br />
The N<strong>at</strong>ional Center for<br />
Educ<strong>at</strong>ion St<strong>at</strong>istics (NCES)<br />
asked <strong>the</strong> N<strong>at</strong>ional Research<br />
Council’s Board on Test<strong>in</strong>g<br />
and Assessment (BOTA) to<br />
recommend a set <strong>of</strong> literacy<br />
levels for <strong>the</strong> 2003 assessment<br />
Def<strong>in</strong><strong>in</strong>g <strong>Literacy</strong><br />
The assessment def<strong>in</strong>es literacy<br />
as “us<strong>in</strong>g pr<strong>in</strong>ted and written<br />
<strong>in</strong>form<strong>at</strong>ion to function <strong>in</strong><br />
society, to achieve one’s goals,<br />
and to develop one’s knowledge<br />
and potential.” Results<br />
are reported on three literacy<br />
scales (see Sample Assessment<br />
Questions section <strong>of</strong> <strong>the</strong><br />
report):<br />
Prose <strong>Literacy</strong><br />
The knowledge and skills<br />
needed to perform prose<br />
tasks (i.e., to search, comprehend,<br />
and use <strong>in</strong>form<strong>at</strong>ion<br />
from cont<strong>in</strong>uous texts).<br />
Document <strong>Literacy</strong><br />
The knowledge and skills<br />
needed to perform document<br />
tasks (i.e., to search, comprehend,<br />
and use <strong>in</strong>form<strong>at</strong>ion<br />
from noncont<strong>in</strong>uous texts <strong>in</strong><br />
various form<strong>at</strong>s).<br />
Quantit<strong>at</strong>ive <strong>Literacy</strong><br />
The knowledge and skills<br />
required to perform quantit<strong>at</strong>ive<br />
tasks (i.e., to identify and<br />
perform comput<strong>at</strong>ions, ei<strong>the</strong>r<br />
alone or sequentially, us<strong>in</strong>g<br />
numbers embedded <strong>in</strong> pr<strong>in</strong>ted<br />
m<strong>at</strong>erials).<br />
th<strong>at</strong> would permit comparisons<br />
with results from <strong>the</strong><br />
1992 assessment.<br />
Draw<strong>in</strong>g on recommend<strong>at</strong>ions<br />
from BOTA’s Committee on<br />
Performance Levels for Adult<br />
Assessment Design<br />
Unlike <strong>in</strong>direct measures <strong>of</strong><br />
literacy, which rely on selfreports<br />
<strong>of</strong> literacy skills or<br />
educ<strong>at</strong>ional <strong>at</strong>ta<strong>in</strong>ment, <strong>the</strong><br />
assessment measures literacy by<br />
ask<strong>in</strong>g respondents to demonstr<strong>at</strong>e<br />
th<strong>at</strong> <strong>the</strong>y understand <strong>the</strong><br />
mean<strong>in</strong>g <strong>of</strong> <strong>in</strong>form<strong>at</strong>ion found<br />
<strong>in</strong> texts <strong>the</strong>y are asked to read.<br />
The literacy tasks <strong>in</strong> <strong>the</strong> assessment<br />
were drawn from actual<br />
texts and documents, which<br />
were ei<strong>the</strong>r used <strong>in</strong> <strong>the</strong>ir orig<strong>in</strong>al<br />
form<strong>at</strong> or reproduced <strong>in</strong><br />
<strong>the</strong> assessment booklets. Each<br />
question appeared before <strong>the</strong><br />
m<strong>at</strong>erials needed to answer it,<br />
thus encourag<strong>in</strong>g respondents<br />
to read with purpose.<br />
Respondents could correctly<br />
answer many assessment questions<br />
by skimm<strong>in</strong>g <strong>the</strong> text or<br />
document for <strong>the</strong> <strong>in</strong>form<strong>at</strong>ion<br />
necessary to perform a<br />
given literacy task. All tasks<br />
were open-ended.<br />
A total <strong>of</strong> 152 prose, document,<br />
and quantit<strong>at</strong>ive literacy<br />
tasks were <strong>in</strong>cluded <strong>in</strong> <strong>the</strong><br />
2<br />
<strong>Literacy</strong>, NCES has decided to<br />
report <strong>the</strong> assessment results<br />
by us<strong>in</strong>g four literacy levels.<br />
Descriptions <strong>of</strong> <strong>the</strong> abilities<br />
associ<strong>at</strong>ed with each level and<br />
<strong>the</strong> types <strong>of</strong> tasks th<strong>at</strong> adults <strong>at</strong><br />
each level could complete are<br />
2003 assessment. Sixty-five <strong>of</strong><br />
<strong>the</strong> tasks were taken from <strong>the</strong><br />
1992 survey and 87 were<br />
developed for <strong>the</strong> 2003 assessment.Tasks<br />
from <strong>the</strong> 1992<br />
survey were <strong>in</strong>cluded <strong>in</strong> <strong>the</strong><br />
2003 assessment to measure<br />
changes <strong>in</strong> literacy between<br />
1992 and 2003.<br />
Ask<strong>in</strong>g each respondent to<br />
complete all <strong>the</strong> tasks would<br />
be too time-consum<strong>in</strong>g, so <strong>the</strong><br />
tasks were organized <strong>in</strong>to 13<br />
unique blocks. Respondents<br />
were asked to complete an<br />
assessment booklet th<strong>at</strong><br />
<strong>in</strong>cluded seven literacy screen<strong>in</strong>g<br />
tasks (with questions asked<br />
<strong>in</strong> ei<strong>the</strong>r English or Spanish<br />
but based upon written m<strong>at</strong>erials<br />
presented <strong>in</strong> English only)<br />
common to all booklets, followed<br />
by three blocks <strong>of</strong> tasks.<br />
<strong>Adults</strong> who were unable to<br />
answer a m<strong>in</strong>imum number <strong>of</strong><br />
literacy screen<strong>in</strong>g tasks, but<br />
who were able to communic<strong>at</strong>e<br />
<strong>in</strong> ei<strong>the</strong>r English or<br />
Spanish, were adm<strong>in</strong>istered an<br />
altern<strong>at</strong>ive assessment with<br />
presented <strong>in</strong> table 1 on <strong>the</strong><br />
follow<strong>in</strong>g page.The complete<br />
BOTA report expla<strong>in</strong><strong>in</strong>g <strong>the</strong>ir<br />
methodology <strong>in</strong> sett<strong>in</strong>g levels<br />
is available on <strong>the</strong> Web <strong>at</strong><br />
http://books.nap.edu/<br />
c<strong>at</strong>alog/11267.html.<br />
questions asked orally <strong>in</strong> ei<strong>the</strong>r<br />
English or Spanish based upon<br />
pr<strong>in</strong>ted m<strong>at</strong>erials presented <strong>in</strong><br />
English only.<strong>Adults</strong> who were<br />
not screened <strong>in</strong>to <strong>the</strong> altern<strong>at</strong>ive<br />
assessment and completed<br />
<strong>the</strong> ma<strong>in</strong> assessment <strong>at</strong>tempted<br />
approxim<strong>at</strong>ely 40 literacy tasks<br />
(adm<strong>in</strong>istered <strong>in</strong> English only).<br />
To compare results between<br />
1992 and 2003, <strong>the</strong> 1992<br />
results were rescaled us<strong>in</strong>g <strong>the</strong><br />
criteria and methods established<br />
for <strong>the</strong> 2003 assessment.<br />
The assessment also <strong>in</strong>cluded a<br />
background questionnaire th<strong>at</strong><br />
was used to collect d<strong>at</strong>a about<br />
<strong>the</strong> rel<strong>at</strong>ionship between literacy<br />
and various demographic<br />
and background characteristics.The<br />
background questionnaire<br />
was adm<strong>in</strong>istered before<br />
<strong>the</strong> assessment and <strong>the</strong> questions<br />
were asked orally <strong>in</strong><br />
ei<strong>the</strong>r English or Spanish.<br />
See Popul<strong>at</strong>ion and Sample<br />
Size, and D<strong>at</strong>a Collection<br />
Procedures section <strong>of</strong> this<br />
report for more <strong>in</strong>form<strong>at</strong>ion<br />
about <strong>the</strong> assessment.
Table 1. Overview <strong>of</strong> <strong>the</strong> literacy levels<br />
A <strong>First</strong> <strong>Look</strong> <strong>at</strong> <strong>the</strong> <strong>Literacy</strong> <strong>of</strong> America’s <strong>Adults</strong> <strong>in</strong> <strong>the</strong> 21 st <strong>Century</strong><br />
Level and def<strong>in</strong>ition Key abilities associ<strong>at</strong>ed with level Sample tasks typical <strong>of</strong> level<br />
Below Basic <strong>in</strong>dic<strong>at</strong>es no<br />
more than <strong>the</strong> most simple<br />
and concrete literacy skills.<br />
Score ranges for Below<br />
Basic:<br />
Prose: 0–209<br />
Document: 0–204<br />
Quantit<strong>at</strong>ive: 0–234<br />
Basic <strong>in</strong>dic<strong>at</strong>es skills necessary<br />
to perform simple<br />
and everyday literacy<br />
activities.<br />
Score ranges for Basic:<br />
Prose: 210–264<br />
Document: 205–249<br />
Quantit<strong>at</strong>ive: 235–289<br />
Intermedi<strong>at</strong>e <strong>in</strong>dic<strong>at</strong>es<br />
skills necessary to perform<br />
moder<strong>at</strong>ely challeng<strong>in</strong>g literacy<br />
activities.<br />
Score ranges for<br />
Intermedi<strong>at</strong>e:<br />
Prose: 265–339<br />
Document: 250–334<br />
Quantit<strong>at</strong>ive: 290–349<br />
Pr<strong>of</strong>icient <strong>in</strong>dic<strong>at</strong>es skills<br />
necessary to perform more<br />
complex and challeng<strong>in</strong>g<br />
literacy activities.<br />
Score ranges for Pr<strong>of</strong>icient:<br />
Prose: 340–500<br />
Document: 335–500<br />
Quantit<strong>at</strong>ive: 350–500<br />
<strong>Adults</strong> <strong>at</strong> <strong>the</strong> Below Basic level range from be<strong>in</strong>g nonliter<strong>at</strong>e <strong>in</strong><br />
English to hav<strong>in</strong>g <strong>the</strong> abilities listed below:<br />
■ loc<strong>at</strong><strong>in</strong>g easily identifiable <strong>in</strong>form<strong>at</strong>ion <strong>in</strong> short, commonplace<br />
prose texts<br />
■ loc<strong>at</strong><strong>in</strong>g easily identifiable <strong>in</strong>form<strong>at</strong>ion and follow<strong>in</strong>g written<br />
<strong>in</strong>structions <strong>in</strong> simple documents (e.g.,charts or forms)<br />
■ loc<strong>at</strong><strong>in</strong>g numbers and us<strong>in</strong>g <strong>the</strong>m to perform simple<br />
quantit<strong>at</strong>ive oper<strong>at</strong>ions (primarily addition) when <strong>the</strong><br />
m<strong>at</strong>hem<strong>at</strong>ical <strong>in</strong>form<strong>at</strong>ion is very concrete and familiar<br />
■ read<strong>in</strong>g and understand<strong>in</strong>g <strong>in</strong>form<strong>at</strong>ion <strong>in</strong> short,<br />
commonplace prose texts<br />
■ read<strong>in</strong>g and understand<strong>in</strong>g <strong>in</strong>form<strong>at</strong>ion <strong>in</strong> simple documents<br />
■ loc<strong>at</strong><strong>in</strong>g easily identifiable quantit<strong>at</strong>ive <strong>in</strong>form<strong>at</strong>ion and<br />
us<strong>in</strong>g it to solve simple, one-step problems when <strong>the</strong><br />
arithmetic oper<strong>at</strong>ion is specified or easily <strong>in</strong>ferred<br />
■ read<strong>in</strong>g and understand<strong>in</strong>g moder<strong>at</strong>ely dense, less<br />
commonplace prose texts as well as summariz<strong>in</strong>g, mak<strong>in</strong>g<br />
simple <strong>in</strong>ferences, determ<strong>in</strong><strong>in</strong>g cause and effect, and<br />
recogniz<strong>in</strong>g <strong>the</strong> author’s purpose<br />
■ loc<strong>at</strong><strong>in</strong>g <strong>in</strong>form<strong>at</strong>ion <strong>in</strong> dense, complex documents and<br />
mak<strong>in</strong>g simple <strong>in</strong>ferences about <strong>the</strong> <strong>in</strong>form<strong>at</strong>ion<br />
■ loc<strong>at</strong><strong>in</strong>g less familiar quantit<strong>at</strong>ive <strong>in</strong>form<strong>at</strong>ion and us<strong>in</strong>g it to<br />
solve problems when <strong>the</strong> arithmetic oper<strong>at</strong>ion is not<br />
specified or easily <strong>in</strong>ferred<br />
■ read<strong>in</strong>g lengthy,complex, abstract prose texts as well as<br />
syn<strong>the</strong>siz<strong>in</strong>g <strong>in</strong>form<strong>at</strong>ion and mak<strong>in</strong>g complex <strong>in</strong>ferences<br />
■ <strong>in</strong>tegr<strong>at</strong><strong>in</strong>g,syn<strong>the</strong>siz<strong>in</strong>g, and analyz<strong>in</strong>g multiple pieces <strong>of</strong><br />
<strong>in</strong>form<strong>at</strong>ion loc<strong>at</strong>ed <strong>in</strong> complex documents<br />
■ loc<strong>at</strong><strong>in</strong>g more abstract quantit<strong>at</strong>ive <strong>in</strong>form<strong>at</strong>ion and us<strong>in</strong>g it<br />
to solve multistep problems when <strong>the</strong> arithmetic oper<strong>at</strong>ions<br />
are not easily <strong>in</strong>ferred and <strong>the</strong> problems are more complex<br />
3<br />
■ search<strong>in</strong>g a short, simple text to f<strong>in</strong>d out wh<strong>at</strong> a<br />
p<strong>at</strong>ient is allowed to dr<strong>in</strong>k before a medical test<br />
■ sign<strong>in</strong>g a form<br />
■ add<strong>in</strong>g <strong>the</strong> amounts on a bank deposit slip<br />
■ f<strong>in</strong>d<strong>in</strong>g <strong>in</strong> a pamphlet for prospective jurors an<br />
explan<strong>at</strong>ion <strong>of</strong> how people were selected for<br />
<strong>the</strong> jury pool<br />
■ us<strong>in</strong>g a television guide to f<strong>in</strong>d out wh<strong>at</strong><br />
programs are on <strong>at</strong> a specific time<br />
■ compar<strong>in</strong>g <strong>the</strong> ticket prices for two events<br />
■ consult<strong>in</strong>g reference m<strong>at</strong>erials to determ<strong>in</strong>e<br />
which foods conta<strong>in</strong> a particular vitam<strong>in</strong><br />
■ identify<strong>in</strong>g a specific loc<strong>at</strong>ion on a map<br />
■ calcul<strong>at</strong><strong>in</strong>g <strong>the</strong> total cost <strong>of</strong> order<strong>in</strong>g specific<br />
<strong>of</strong>fice supplies from a c<strong>at</strong>alog<br />
■ compar<strong>in</strong>g viewpo<strong>in</strong>ts <strong>in</strong> two editorials<br />
■ <strong>in</strong>terpret<strong>in</strong>g a table about blood pressure, age,<br />
and physical activity<br />
■ comput<strong>in</strong>g and compar<strong>in</strong>g <strong>the</strong> cost per ounce<br />
<strong>of</strong> food items<br />
NOTE: Although <strong>the</strong> literacy levels share common names with <strong>the</strong> NAEP levels, <strong>the</strong>y do not correspond to <strong>the</strong> NAEP levels.<br />
SOURCE: Hauser, R.M, Edley, C.F. Jr., Koenig, J.A., and Elliott, S.W. (Eds.). (2005). Measur<strong>in</strong>g <strong>Literacy</strong>: Performance Levels for <strong>Adults</strong>, Interim Report.Wash<strong>in</strong>gton, DC: N<strong>at</strong>ional Academies Press; White, S. and Dillow, S. (2005). Key Concepts and Fe<strong>at</strong>ures <strong>of</strong><br />
<strong>the</strong> 2003 N<strong>at</strong>ional Assessment <strong>of</strong> Adult <strong>Literacy</strong> (NCES 2006-471). U.S. Department <strong>of</strong> Educ<strong>at</strong>ion.Wash<strong>in</strong>gton, DC: N<strong>at</strong>ional Center for Educ<strong>at</strong>ion St<strong>at</strong>istics.
A <strong>First</strong> <strong>Look</strong> <strong>at</strong> <strong>the</strong> <strong>Literacy</strong> <strong>of</strong> America’s <strong>Adults</strong> <strong>in</strong> <strong>the</strong> 21 st <strong>Century</strong><br />
Changes <strong>in</strong> Adult <strong>Literacy</strong><br />
The percentage <strong>of</strong> adults<br />
(people age 16 and older liv<strong>in</strong>g<br />
<strong>in</strong> households or prisons)<br />
with Below Basic document<br />
literacy decreased 2 percentage<br />
po<strong>in</strong>ts between 1992 and<br />
2003 and <strong>the</strong> percentage <strong>of</strong><br />
adults with Below Basic quantit<strong>at</strong>ive<br />
literacy decreased by 4<br />
percentage po<strong>in</strong>ts (figure 2).<br />
The percentage <strong>of</strong> adults with<br />
Basic literacy did not change<br />
significantly between 1992<br />
Nonliter<strong>at</strong>e <strong>in</strong> English<br />
An additional component <strong>of</strong><br />
<strong>the</strong> adult popul<strong>at</strong>ion (def<strong>in</strong>ed<br />
as people age 16 and older liv<strong>in</strong>g<br />
<strong>in</strong> households or prisons)<br />
is not shown <strong>in</strong> figure 2. Field<br />
<strong>in</strong>terviewers determ<strong>in</strong>ed th<strong>at</strong> 2<br />
percent <strong>of</strong> adults <strong>in</strong> 2003 and<br />
3 percent <strong>in</strong> 1992 could not<br />
be tested because <strong>the</strong>y spoke a<br />
language o<strong>the</strong>r than English or<br />
Spanish and were unable to<br />
communic<strong>at</strong>e <strong>in</strong> English or<br />
Spanish.These adults are<br />
<strong>in</strong>cluded <strong>in</strong> <strong>the</strong> popul<strong>at</strong>ion<br />
th<strong>at</strong> is <strong>the</strong> basis for <strong>the</strong> percentages<br />
<strong>in</strong> figure 3, but not <strong>in</strong><br />
<strong>the</strong> popul<strong>at</strong>ion <strong>of</strong> adults th<strong>at</strong> is<br />
<strong>the</strong> basis for figure 2 and <strong>the</strong><br />
o<strong>the</strong>r figures <strong>in</strong> this report,<br />
because <strong>the</strong>re is little or no<br />
background d<strong>at</strong>a on adults<br />
who could not be tested.<br />
In 2003, about 3 percent <strong>of</strong><br />
adults took an altern<strong>at</strong>ive<br />
assessment because <strong>the</strong>y were<br />
and 2003 on any <strong>of</strong> <strong>the</strong> three<br />
scales.The percentage <strong>of</strong><br />
adults with Intermedi<strong>at</strong>e document<br />
literacy <strong>in</strong>creased by<br />
4 percentage po<strong>in</strong>ts and <strong>the</strong><br />
percentage <strong>of</strong> adults with<br />
Intermedi<strong>at</strong>e quantit<strong>at</strong>ive literacy<br />
<strong>in</strong>creased by 3 percentage<br />
po<strong>in</strong>ts.The percentage <strong>of</strong><br />
adults with Pr<strong>of</strong>icient prose<br />
and document literacy<br />
decreased 2 percentage po<strong>in</strong>ts<br />
between 1992 and 2003.<br />
unable to complete a m<strong>in</strong>imum<br />
number <strong>of</strong> simple literacy<br />
screen<strong>in</strong>g questions.These<br />
adults also performed <strong>in</strong> <strong>the</strong><br />
Below Basic c<strong>at</strong>egory <strong>in</strong> figure<br />
2. Questions on <strong>the</strong> altern<strong>at</strong>ive<br />
assessment were asked <strong>in</strong><br />
ei<strong>the</strong>r English or Spanish, but<br />
all written m<strong>at</strong>erials were <strong>in</strong><br />
English only.While some <strong>of</strong><br />
<strong>the</strong>se <strong>in</strong>dividuals were able to<br />
identify letters, numbers, and<br />
simple words and phrases,<br />
most were unable to read and<br />
understand connected text <strong>in</strong><br />
English.These adults are also<br />
nonliter<strong>at</strong>e <strong>in</strong> English.<br />
For 2003, <strong>the</strong>se two groups <strong>of</strong><br />
adults who were nonliter<strong>at</strong>e<br />
<strong>in</strong> English—<strong>the</strong> 2 percent<br />
who could not be tested<br />
because <strong>the</strong>y could not communic<strong>at</strong>e<br />
<strong>in</strong> English or<br />
Spanish and <strong>the</strong> 3 percent<br />
who received <strong>the</strong> altern<strong>at</strong>ive<br />
4<br />
Figure 2. Percentage <strong>of</strong> adults <strong>in</strong> each literacy level: 1992<br />
and 2003<br />
<strong>Literacy</strong> scale<br />
and year<br />
1992<br />
Prose<br />
2003<br />
1992<br />
Document<br />
2003<br />
1992<br />
Quantit<strong>at</strong>ive<br />
2003<br />
26<br />
22*<br />
14<br />
14<br />
14<br />
12*<br />
28 43 15<br />
29 44 13*<br />
22 49 15<br />
22 53* 13*<br />
32 30 13<br />
33 33* 13<br />
70 60 50 40 30 20 10 0 10 20 30 40 50 60 70 80 90 100<br />
Percent Below Basic Percent Basic and above<br />
assessment—account for<br />
5 percent <strong>of</strong> <strong>the</strong> popul<strong>at</strong>ion<br />
(11 million). For 1992, <strong>the</strong><br />
correspond<strong>in</strong>g percentage<br />
could not be estim<strong>at</strong>ed.An<br />
unknown proportion <strong>of</strong> <strong>the</strong><br />
Below Basic popul<strong>at</strong>ion <strong>in</strong> th<strong>at</strong><br />
year would have required such<br />
an altern<strong>at</strong>ive assessment, but<br />
it was not available <strong>the</strong>n. In<br />
Below Basic Basic Intermedi<strong>at</strong>e Pr<strong>of</strong>icient<br />
* Significantly different from 1992.<br />
NOTE: Detail may not sum to totals because <strong>of</strong> round<strong>in</strong>g. <strong>Adults</strong> are def<strong>in</strong>ed as people 16 years <strong>of</strong> age and older liv<strong>in</strong>g<br />
<strong>in</strong> households or prisons. <strong>Adults</strong> who could not be <strong>in</strong>terviewed due to language spoken or cognitive or mental disabilities<br />
(3 percent <strong>in</strong> 2003 and 4 percent <strong>in</strong> 1992) are excluded from this figure.<br />
SOURCE: U.S. Department <strong>of</strong> Educ<strong>at</strong>ion, Institute <strong>of</strong> Educ<strong>at</strong>ion Sciences, N<strong>at</strong>ional Center for Educ<strong>at</strong>ion St<strong>at</strong>istics, 1992<br />
N<strong>at</strong>ional Adult <strong>Literacy</strong> Survey and 2003 N<strong>at</strong>ional Assessment <strong>of</strong> Adult <strong>Literacy</strong>.<br />
Figure 3. Percentage <strong>of</strong> adults <strong>in</strong> selected prose literacy<br />
levels, <strong>in</strong>clud<strong>in</strong>g adults who could not be tested:<br />
1992 and 2003<br />
Year<br />
1992 3 13 83<br />
2003<br />
Altern<strong>at</strong>ive assessment: 3<br />
70 60 50 40 30 20 10 0 10 20 30 40 50 60 70 80 90 100<br />
Percent Below Basic Percent Basic and above<br />
Could not be tested<br />
due to language<br />
2 13 84<br />
Below Basic Basic and above<br />
NOTE: <strong>Adults</strong> are def<strong>in</strong>ed as people 16 years <strong>of</strong> age and older liv<strong>in</strong>g <strong>in</strong> households or prisons. Results do not add to 100<br />
percent; adults who could not be <strong>in</strong>terviewed because <strong>of</strong> cognitive or mental disabilities are not <strong>in</strong>cluded <strong>in</strong> <strong>the</strong> totals.<br />
SOURCE: U.S. Department <strong>of</strong> Educ<strong>at</strong>ion, Institute <strong>of</strong> Educ<strong>at</strong>ion Sciences, N<strong>at</strong>ional Center for Educ<strong>at</strong>ion St<strong>at</strong>istics, 1992<br />
N<strong>at</strong>ional Adult <strong>Literacy</strong> Survey and 2003 N<strong>at</strong>ional Assessment <strong>of</strong> Adult <strong>Literacy</strong>.<br />
addition to <strong>the</strong> adults who<br />
could not be tested because <strong>of</strong><br />
a language difficulty (3 percent<br />
<strong>in</strong> 1992 and 2 percent <strong>in</strong><br />
2003), o<strong>the</strong>r adults could not<br />
be tested because <strong>of</strong> a cognitive<br />
or mental disability th<strong>at</strong><br />
precluded conduct<strong>in</strong>g <strong>the</strong><br />
<strong>in</strong>terview (1 percent <strong>in</strong> 1992<br />
and 1 percent <strong>in</strong> 2003).
In 2003, 14 percent <strong>of</strong><br />
American adults (def<strong>in</strong>ed as<br />
people age 16 and older liv<strong>in</strong>g<br />
<strong>in</strong> households or prisons)<br />
had Below Basic prose literacy<br />
(figure 2). Exam<strong>in</strong><strong>in</strong>g <strong>the</strong><br />
characteristics <strong>of</strong> <strong>the</strong>se adults<br />
provides a pr<strong>of</strong>ile <strong>of</strong> <strong>the</strong><br />
adults with <strong>the</strong> lowest prose<br />
literacy performance.<br />
Hispanics, who represent 12<br />
percent <strong>of</strong> <strong>the</strong> NAAL popul<strong>at</strong>ion,<br />
accounted for 39 percent<br />
<strong>of</strong> <strong>the</strong> adults with Below<br />
Basic prose literacy (table 2).<br />
Twenty percent <strong>of</strong> adults with<br />
Below Basic prose literacy<br />
were Black. In contrast, while<br />
70 percent <strong>of</strong> <strong>the</strong> NAAL<br />
popul<strong>at</strong>ion is White, 37 percent<br />
<strong>of</strong> adults with Below<br />
Basic prose literacy were<br />
White.<br />
<strong>Adults</strong> age 65 or older represent<br />
15 percent <strong>of</strong> <strong>the</strong> NAAL<br />
popul<strong>at</strong>ion but 26 percent <strong>of</strong><br />
adults <strong>in</strong> <strong>the</strong> lowest prose literacy<br />
level (table 2). Although<br />
35 percent <strong>of</strong> adults with<br />
Below Basic prose literacy<br />
spoke Spanish or Spanish and<br />
A <strong>First</strong> <strong>Look</strong> <strong>at</strong> <strong>the</strong> <strong>Literacy</strong> <strong>of</strong> America’s <strong>Adults</strong> <strong>in</strong> <strong>the</strong> 21 st <strong>Century</strong><br />
Pr<strong>of</strong>ile <strong>of</strong> <strong>Adults</strong> With Below Basic Prose <strong>Literacy</strong><br />
ano<strong>the</strong>r non-English language<br />
before start<strong>in</strong>g school, <strong>the</strong>se<br />
<strong>in</strong>dividuals account for 8 percent<br />
<strong>of</strong> <strong>the</strong> popul<strong>at</strong>ion.<br />
<strong>Adults</strong> without a high school<br />
degree or GED represent 15<br />
percent <strong>of</strong> <strong>the</strong> total NAAL<br />
popul<strong>at</strong>ion but 55 percent <strong>of</strong><br />
<strong>the</strong> adults <strong>in</strong> <strong>the</strong> lowest prose<br />
literacy level (table 2). Fiftytwo<br />
percent <strong>of</strong> adults <strong>in</strong> <strong>the</strong><br />
total NAAL popul<strong>at</strong>ion completed<br />
<strong>at</strong> least some educ<strong>at</strong>ion<br />
beyond high school,<br />
compared to 14 percent <strong>of</strong><br />
adults with Below Basic prose<br />
literacy.<br />
Forty-six percent <strong>of</strong> adults<br />
with Below Basic prose literacy<br />
had one or more disabilities,<br />
compared to 30 percent <strong>of</strong><br />
adults <strong>in</strong> <strong>the</strong> NAAL popul<strong>at</strong>ion<br />
(table 2).The percentage<br />
<strong>of</strong> adults with multiple disabilities<br />
<strong>in</strong> <strong>the</strong> Below Basic<br />
prose level (21 percent) was<br />
significantly higher than <strong>the</strong><br />
percentage <strong>of</strong> adults with<br />
multiple disabilities <strong>in</strong> <strong>the</strong><br />
NAAL popul<strong>at</strong>ion (9 percent).<br />
5<br />
Table 2. Percentage <strong>of</strong> adults with selected characteristics <strong>in</strong><br />
<strong>the</strong> Below Basic prose literacy level and <strong>in</strong> <strong>the</strong> total<br />
NAAL popul<strong>at</strong>ion: 2003<br />
Characteristic<br />
Race/ethnicity<br />
Below Basic<br />
Total NAAL<br />
popul<strong>at</strong>ion<br />
White 37 70<br />
Black 20 12<br />
Hispanic 39 12<br />
Asian/Pacific Islander<br />
Gender<br />
4 4<br />
Male 46 49<br />
Female<br />
Age<br />
54 51<br />
16–18 5 6<br />
19–24 9 11<br />
25–39 25 28<br />
40–49 16 20<br />
50–64 20 21<br />
65+<br />
Language spoken before<br />
start<strong>in</strong>g school<br />
26 15<br />
English only 52 81<br />
English and Spanish 2 2<br />
English and o<strong>the</strong>r language 2 4<br />
Spanish 35 8<br />
O<strong>the</strong>r language 9 5<br />
Educ<strong>at</strong>ional <strong>at</strong>ta<strong>in</strong>ment<br />
Less than/some high school 55 15<br />
GED/high school equivalency 4 5<br />
High school gradu<strong>at</strong>e 23 26<br />
Voc<strong>at</strong>ional/trade/bus<strong>in</strong>ess school 4 6<br />
Some college 4 11<br />
Associ<strong>at</strong>e’s/2-year degree 3 12<br />
College gradu<strong>at</strong>e 2 12<br />
Gradu<strong>at</strong>e studies/degree 1 11<br />
Disability st<strong>at</strong>us<br />
Vision problem only 7 5<br />
Hear<strong>in</strong>g problem only 4 5<br />
Learn<strong>in</strong>g disability only 4 3<br />
O<strong>the</strong>r disability only 10 8<br />
Multiple disabilities 21 9<br />
No disabilities 54 70<br />
NOTE: Detail may not sum to totals because <strong>of</strong> round<strong>in</strong>g. <strong>Adults</strong> are def<strong>in</strong>ed as people 16 years <strong>of</strong> age and older liv<strong>in</strong>g<br />
<strong>in</strong> households or prisons. <strong>Adults</strong> who could not be <strong>in</strong>terviewed due to language spoken or cognitive or mental<br />
disabilities (3 percent <strong>in</strong> 2003 and 4 percent <strong>in</strong> 1992) are excluded from this table. In 1992, respondents were<br />
allowed to identify only one race. In 2003, respondents were allowed to identify multiple races. In 2003, 2 percent <strong>of</strong><br />
respondents identified multiple races and are not <strong>in</strong>cluded <strong>in</strong> <strong>the</strong> White, Black, or Asian/Pacific Islander c<strong>at</strong>egories <strong>in</strong><br />
this table. All adults <strong>of</strong> Hispanic orig<strong>in</strong> are classified as Hispanic, regardless <strong>of</strong> race.The Asian/Pacific Islander c<strong>at</strong>egory<br />
<strong>in</strong>cludes N<strong>at</strong>ive Hawaiians.The English and Spanish c<strong>at</strong>egory <strong>in</strong>cludes adults who spoke only English and<br />
Spanish, as well as adults who spoke English, Spanish, and ano<strong>the</strong>r non-English language.The Spanish c<strong>at</strong>egory<br />
<strong>in</strong>cludes adults who spoke only Spanish, as well as adults who spoke Spanish and ano<strong>the</strong>r non-English language.<br />
The O<strong>the</strong>r language c<strong>at</strong>egory <strong>in</strong>cludes only adults who did not speak English or Spanish.<br />
SOURCE: U.S. Department <strong>of</strong> Educ<strong>at</strong>ion, Institute <strong>of</strong> Educ<strong>at</strong>ion Sciences, N<strong>at</strong>ional Center for Educ<strong>at</strong>ion St<strong>at</strong>istics, 2003<br />
N<strong>at</strong>ional Assessment <strong>of</strong> Adult <strong>Literacy</strong>.
A <strong>First</strong> <strong>Look</strong> <strong>at</strong> <strong>the</strong> <strong>Literacy</strong> <strong>of</strong> America’s <strong>Adults</strong> <strong>in</strong> <strong>the</strong> 21 st <strong>Century</strong><br />
<strong>Literacy</strong> by Gender<br />
In 2003, average prose literacy<br />
and average document literacy<br />
were higher for women<br />
than for men, while average<br />
quantit<strong>at</strong>ive literacy was higher<br />
for men than for women<br />
(figure 4).<br />
Between 1992 and 2003, <strong>the</strong><br />
average prose score for<br />
women rema<strong>in</strong>ed <strong>at</strong> 277,<br />
while <strong>the</strong> average prose score<br />
for men decreased by 4<br />
po<strong>in</strong>ts (figure 4). On <strong>the</strong> document<br />
literacy scale, women<br />
ga<strong>in</strong>ed 4 po<strong>in</strong>ts between<br />
1992 and 2003, while <strong>the</strong><br />
average score for men<br />
dropped by 5 po<strong>in</strong>ts.<br />
In 2003, <strong>the</strong> average quantit<strong>at</strong>ive<br />
literacy score for<br />
women <strong>in</strong>creased 10 po<strong>in</strong>ts<br />
from 1992, while average<br />
Figure 4. Average prose, document, and quantit<strong>at</strong>ive<br />
literacy scores <strong>of</strong> adults, by gender: 1992 and 2003<br />
Average score<br />
500 Prose Document Quantit<strong>at</strong>ive<br />
300<br />
250<br />
200<br />
150<br />
0<br />
276 272* 277 277 274 269* 268 272*<br />
1992 2003<br />
Gender<br />
283 286<br />
269 279*<br />
Men Women Men Women<br />
Men Women<br />
* Significantly different from 1992.<br />
NOTE: <strong>Adults</strong> are def<strong>in</strong>ed as people 16 years <strong>of</strong> age and older liv<strong>in</strong>g <strong>in</strong> households or prisons. <strong>Adults</strong> who could not<br />
be <strong>in</strong>terviewed due to language spoken or cognitive or mental disabilities (3 percent <strong>in</strong> 2003 and 4 percent <strong>in</strong> 1992)<br />
are excluded from this figure.<br />
SOURCE: U.S. Department <strong>of</strong> Educ<strong>at</strong>ion, Institute <strong>of</strong> Educ<strong>at</strong>ion Sciences, N<strong>at</strong>ional Center for Educ<strong>at</strong>ion St<strong>at</strong>istics, 1992<br />
N<strong>at</strong>ional Adult <strong>Literacy</strong> Survey and 2003 N<strong>at</strong>ional Assessment <strong>of</strong> Adult <strong>Literacy</strong>.<br />
6<br />
quantit<strong>at</strong>ive literacy for men<br />
was not significantly different<br />
from 1992 (figure 4).<br />
The distribution <strong>of</strong> men and<br />
women across <strong>the</strong> literacy levels<br />
also changed between 1992<br />
and 2003 (figures 5, 6, and 7).
On <strong>the</strong> quantit<strong>at</strong>ive scale, for<br />
example, <strong>the</strong> percentage <strong>of</strong><br />
men and women with Below<br />
Basic literacy decreased<br />
between 1992 and 2003 (figure<br />
7). For men, <strong>the</strong> percentage<br />
with Below Basic quantit<strong>at</strong>ive<br />
literacy decl<strong>in</strong>ed by 3 per-<br />
Figure 5. Percentage <strong>of</strong> adults <strong>in</strong> each prose literacy level, by<br />
gender: 1992 and 2003<br />
Gender and year<br />
1992<br />
Men<br />
2003<br />
1992<br />
Women<br />
2003<br />
15<br />
15<br />
13<br />
12<br />
A <strong>First</strong> <strong>Look</strong> <strong>at</strong> <strong>the</strong> <strong>Literacy</strong> <strong>of</strong> America’s <strong>Adults</strong> <strong>in</strong> <strong>the</strong> 21 st <strong>Century</strong><br />
centage po<strong>in</strong>ts, while <strong>the</strong> percentage<br />
<strong>of</strong> women with Below<br />
Basic quantit<strong>at</strong>ive literacy fell<br />
by 6 percentage po<strong>in</strong>ts.<br />
The percentage <strong>of</strong> women<br />
with Below Basic document<br />
literacy also decreased, from<br />
27 42 16<br />
29 43 13*<br />
29 44 14<br />
29 46 14<br />
70 60 50 40 30 20 10 0 10 20 30 40 50 60 70 80 90 100<br />
Percent Below Basic Percent Basic and above<br />
Below Basic Basic Intermedi<strong>at</strong>e Pr<strong>of</strong>icient<br />
* Significantly different from 1992.<br />
NOTE: Detail may not sum to totals because <strong>of</strong> round<strong>in</strong>g. <strong>Adults</strong> are def<strong>in</strong>ed as people 16 years <strong>of</strong> age and older liv<strong>in</strong>g<br />
<strong>in</strong> households or prisons. <strong>Adults</strong> who could not be <strong>in</strong>terviewed due to language spoken or cognitive or mental disabilities<br />
(3 percent <strong>in</strong> 2003 and 4 percent <strong>in</strong> 1992) are excluded from this figure.<br />
SOURCE: U.S. Department <strong>of</strong> Educ<strong>at</strong>ion, Institute <strong>of</strong> Educ<strong>at</strong>ion Sciences, N<strong>at</strong>ional Center for Educ<strong>at</strong>ion St<strong>at</strong>istics, 1992<br />
N<strong>at</strong>ional Adult <strong>Literacy</strong> Survey and 2003 N<strong>at</strong>ional Assessment <strong>of</strong> Adult <strong>Literacy</strong>.<br />
Figure 7. Percentage <strong>of</strong> adults <strong>in</strong> each quantit<strong>at</strong>ive literacy<br />
level, by gender: 1992 and 2003<br />
Gender and year<br />
1992<br />
Men<br />
2003<br />
1992<br />
Women<br />
2003<br />
24<br />
21*<br />
22*<br />
7<br />
14 percent <strong>in</strong> 1992 to 11<br />
percent <strong>in</strong> 2003 (figure 6).<br />
Despite <strong>the</strong> overall ga<strong>in</strong> made<br />
by women <strong>in</strong> quantit<strong>at</strong>ive literacy,<br />
<strong>in</strong> 2003, <strong>the</strong> percentage<br />
<strong>of</strong> men with Pr<strong>of</strong>icient quantit<strong>at</strong>ive<br />
literacy was 5 percent-<br />
Figure 6. Percentage <strong>of</strong> adults <strong>in</strong> each document literacy<br />
level, by gender: 1992 and 2003<br />
Gender and year<br />
1992<br />
Men<br />
2003<br />
1992<br />
Women<br />
2003<br />
29 31 17<br />
31* 33* 16<br />
28 34 28 9<br />
35 32* 11*<br />
70 60 50 40 30 20 10 0 10 20 30 40 50 60 70 80 90 100<br />
Percent Below Basic Percent Basic and above<br />
Below Basic Basic Intermedi<strong>at</strong>e Pr<strong>of</strong>icient<br />
* Significantly different from 1992.<br />
NOTE: Detail may not sum to totals because <strong>of</strong> round<strong>in</strong>g. <strong>Adults</strong> are def<strong>in</strong>ed as people 16 years <strong>of</strong> age and older liv<strong>in</strong>g<br />
<strong>in</strong> households or prisons. <strong>Adults</strong> who could not be <strong>in</strong>terviewed due to language spoken or cognitive or mental disabilities<br />
(3 percent <strong>in</strong> 2003 and 4 percent <strong>in</strong> 1992) are excluded from this figure.<br />
SOURCE: U.S. Department <strong>of</strong> Educ<strong>at</strong>ion, Institute <strong>of</strong> Educ<strong>at</strong>ion Sciences, N<strong>at</strong>ional Center for Educ<strong>at</strong>ion St<strong>at</strong>istics, 1992<br />
N<strong>at</strong>ional Adult <strong>Literacy</strong> Survey and 2003 N<strong>at</strong>ional Assessment <strong>of</strong> Adult <strong>Literacy</strong>.<br />
14<br />
14<br />
14<br />
11*<br />
age po<strong>in</strong>ts higher than <strong>the</strong><br />
percentage <strong>of</strong> women (figure<br />
7). For <strong>the</strong> prose and document<br />
scales, <strong>the</strong>re were no<br />
significant differences between<br />
<strong>the</strong> percentage <strong>of</strong> men and<br />
women with Pr<strong>of</strong>icient literacy<br />
(figures 5 and 6).<br />
21 49 17<br />
23* 51* 13*<br />
23 50 13<br />
22 54* 13<br />
70 60 50 40 30 20 10 0 10 20 30 40 50 60 70 80 90 100<br />
Percent Below Basic Percent Basic and above<br />
Below Basic Basic Intermedi<strong>at</strong>e Pr<strong>of</strong>icient<br />
* Significantly different from 1992.<br />
NOTE: Detail may not sum to totals because <strong>of</strong> round<strong>in</strong>g. <strong>Adults</strong> are def<strong>in</strong>ed as people 16 years <strong>of</strong> age and older liv<strong>in</strong>g<br />
<strong>in</strong> households or prisons. <strong>Adults</strong> who could not be <strong>in</strong>terviewed due to language spoken or cognitive or mental<br />
disabilities (3 percent <strong>in</strong> 2003 and 4 percent <strong>in</strong> 1992) are excluded from this figure.<br />
SOURCE: U.S. Department <strong>of</strong> Educ<strong>at</strong>ion, Institute <strong>of</strong> Educ<strong>at</strong>ion Sciences, N<strong>at</strong>ional Center for Educ<strong>at</strong>ion St<strong>at</strong>istics, 1992<br />
N<strong>at</strong>ional Adult <strong>Literacy</strong> Survey and 2003 N<strong>at</strong>ional Assessment <strong>of</strong> Adult <strong>Literacy</strong>.
A <strong>First</strong> <strong>Look</strong> <strong>at</strong> <strong>the</strong> <strong>Literacy</strong> <strong>of</strong> America’s <strong>Adults</strong> <strong>in</strong> <strong>the</strong> 21 st <strong>Century</strong><br />
<strong>Literacy</strong> by Race/Ethnicity<br />
The percentage <strong>of</strong> Whites,<br />
Blacks, and Asians/Pacific<br />
NAAL Popul<strong>at</strong>ion,<br />
1992 and 2003<br />
Table 3. Percentage <strong>of</strong><br />
adults, by<br />
race/ethnicity:<br />
1992 and 2003<br />
Race/ethnicity 1992 2003<br />
White 77 70*<br />
Black 11 12<br />
Hispanic 8 12*<br />
Asian/Pacific Islander 2 4*<br />
* Significantly different from 1992.<br />
NOTE: Detail may not sum to totals because <strong>of</strong><br />
round<strong>in</strong>g. <strong>Adults</strong> are def<strong>in</strong>ed as people 16 years <strong>of</strong><br />
age and older. <strong>Adults</strong> who could not be <strong>in</strong>terviewed<br />
due to language spoken or cognitive or<br />
mental disabilities (3 percent <strong>in</strong> 2003 and 4 percent<br />
<strong>in</strong> 1992) are excluded from this table. In 1992,<br />
respondents were allowed to identify only one<br />
race. In 2003, respondents were allowed to identify<br />
multiple races. In 2003, 2 percent <strong>of</strong> respondents<br />
identified multiple races and are not <strong>in</strong>cluded <strong>in</strong><br />
<strong>the</strong> White, Black, or Asian/Pacific Islander c<strong>at</strong>egories<br />
<strong>in</strong> this table. All adults <strong>of</strong> Hispanic orig<strong>in</strong> are<br />
classified as Hispanic, regardless <strong>of</strong> race.The<br />
Asian/Pacific Islander c<strong>at</strong>egory <strong>in</strong>cludes N<strong>at</strong>ive<br />
Hawaiians.<br />
SOURCE: U.S. Department <strong>of</strong> Educ<strong>at</strong>ion, Institute <strong>of</strong><br />
Educ<strong>at</strong>ion Sciences, N<strong>at</strong>ional Center for Educ<strong>at</strong>ion<br />
St<strong>at</strong>istics, 1992 N<strong>at</strong>ional Adult <strong>Literacy</strong> Survey and<br />
2003 N<strong>at</strong>ional Assessment <strong>of</strong> Adult <strong>Literacy</strong>.<br />
The percentage <strong>of</strong> Whites<br />
decreased between 1992<br />
and 2003, while <strong>the</strong> percentage<br />
<strong>of</strong> Hispanics and<br />
Asians/Pacific Islanders<br />
<strong>in</strong>creased.The percentage<br />
<strong>of</strong> Hispanics rose 4 percentage<br />
po<strong>in</strong>ts and <strong>the</strong><br />
percentage <strong>of</strong> Asians/<br />
Pacific Islanders <strong>in</strong>creased<br />
2 percentage po<strong>in</strong>ts.The<br />
percentage <strong>of</strong> Blacks did<br />
not differ significantly<br />
between 1992 and 2003.<br />
Islanders with Below Basic literacy<br />
decreased between<br />
1992 and 2003 on <strong>the</strong> prose,<br />
document, and quantit<strong>at</strong>ive<br />
scales (figures 8, 9, and 10).<br />
Among Hispanics, <strong>the</strong> percentage<br />
with Below Basic<br />
prose literacy <strong>in</strong>creased 9<br />
percentage po<strong>in</strong>ts between<br />
1992 and 2003, while <strong>the</strong><br />
percentage with Below Basic<br />
document literacy <strong>in</strong>creased 8<br />
percentage po<strong>in</strong>ts (figures 8<br />
and 9).The percentage <strong>of</strong><br />
Figure 8. Percentage <strong>of</strong> adults <strong>in</strong> each prose literacy level,<br />
by race/ethnicity: 1992 and 2003<br />
Race/ethnicity<br />
and year<br />
1992<br />
White<br />
2003<br />
Black<br />
1992<br />
2003<br />
Hispanic<br />
1992<br />
2003<br />
Asian/<br />
Pacific Islander<br />
1992<br />
2003<br />
44*<br />
35<br />
30<br />
24*<br />
25<br />
9<br />
14*<br />
7*<br />
25 48 18<br />
25 51* 17<br />
41 27 2<br />
43 31* 2<br />
33 28 5<br />
30* 23* 4*<br />
30 36 9<br />
32 42 12<br />
70 60 50 40 30 20 10 0 10 20 30 40 50 60 70 80 90 100<br />
Percent Below Basic Percent Basic and above<br />
Below Basic Basic Intermedi<strong>at</strong>e Pr<strong>of</strong>icient<br />
* Significantly different from 1992.<br />
NOTE: Detail may not sum to totals because <strong>of</strong> round<strong>in</strong>g. <strong>Adults</strong> are def<strong>in</strong>ed as people 16 years <strong>of</strong> age and older liv<strong>in</strong>g<br />
<strong>in</strong> households or prisons. <strong>Adults</strong> who could not be <strong>in</strong>terviewed due to language spoken or cognitive or mental<br />
disabilities (3 percent <strong>in</strong> 2003 and 4 percent <strong>in</strong> 1992) are excluded from this figure. In 1992, respondents were<br />
allowed to identify only one race. In 2003, respondents were allowed to identify multiple races. In 2003, 2 percent<br />
<strong>of</strong> respondents identified multiple races and are not <strong>in</strong>cluded <strong>in</strong> <strong>the</strong> White, Black, or Asian/Pacific Islander c<strong>at</strong>egories<br />
<strong>in</strong> this figure. All adults <strong>of</strong> Hispanic orig<strong>in</strong> are classified as Hispanic, regardless <strong>of</strong> race.The Asian/Pacific<br />
Islander c<strong>at</strong>egory <strong>in</strong>cludes N<strong>at</strong>ive Hawaiians.<br />
SOURCE: U.S. Department <strong>of</strong> Educ<strong>at</strong>ion, Institute <strong>of</strong> Educ<strong>at</strong>ion Sciences, N<strong>at</strong>ional Center for Educ<strong>at</strong>ion St<strong>at</strong>istics, 1992<br />
N<strong>at</strong>ional Adult <strong>Literacy</strong> Survey and 2003 N<strong>at</strong>ional Assessment <strong>of</strong> Adult <strong>Literacy</strong>.<br />
8<br />
Hispanics with Below Basic<br />
quantit<strong>at</strong>ive literacy was 50<br />
percent <strong>in</strong> both 1992 and<br />
2003 (figure 10).<br />
Although <strong>the</strong> percentage <strong>of</strong><br />
Hispanics with Below Basic
document literacy <strong>in</strong>creased<br />
between 1992 and 2003, <strong>the</strong><br />
percentage <strong>of</strong> Hispanics with<br />
Below Basic document literacy<br />
was lower than <strong>the</strong> percentage<br />
<strong>of</strong> Hispanics with<br />
Below Basic prose or quanti-<br />
A <strong>First</strong> <strong>Look</strong> <strong>at</strong> <strong>the</strong> <strong>Literacy</strong> <strong>of</strong> America’s <strong>Adults</strong> <strong>in</strong> <strong>the</strong> 21 st <strong>Century</strong><br />
t<strong>at</strong>ive literacy (figures 8, 9,<br />
and 10).<br />
For prose, document, and<br />
quantit<strong>at</strong>ive literacy <strong>in</strong> 2003,<br />
<strong>the</strong> percentage <strong>of</strong> Whites and<br />
Asians/Pacific Islanders with<br />
Figure 9. Percentage <strong>of</strong> adults <strong>in</strong> each document literacy<br />
level, by race/ethnicity: 1992 and 2003<br />
Race/ethnicity<br />
and year<br />
1992<br />
White<br />
2003<br />
Black<br />
1992<br />
2003<br />
Hispanic<br />
1992<br />
2003<br />
Asian/<br />
Pacific Islander<br />
1992<br />
2003<br />
31<br />
36*<br />
24*<br />
28<br />
19<br />
10<br />
8*<br />
11*<br />
19 53 18<br />
19 58* 15*<br />
33 34 2<br />
35 40* 2<br />
29 38 5<br />
26* 33* 5<br />
23 48 10<br />
22 54 13<br />
70 60 50 40 30 20 10 0 10 20 30 40 50 60 70 80 90 100<br />
Percent Below Basic Percent Basic and above<br />
Below Basic Basic Intermedi<strong>at</strong>e Pr<strong>of</strong>icient<br />
* Significantly different from 1992.<br />
NOTE: Detail may not sum to totals because <strong>of</strong> round<strong>in</strong>g. <strong>Adults</strong> are def<strong>in</strong>ed as people 16 years <strong>of</strong> age and older liv<strong>in</strong>g<br />
<strong>in</strong> households or prisons. <strong>Adults</strong> who could not be <strong>in</strong>terviewed due to language spoken or cognitive or mental<br />
disabilities (3 percent <strong>in</strong> 2003 and 4 percent <strong>in</strong> 1992) are excluded from this figure. In 1992, respondents were<br />
allowed to identify only one race. In 2003, respondents were allowed to identify multiple races. In 2003, 2 percent<br />
<strong>of</strong> respondents identified multiple races and are not <strong>in</strong>cluded <strong>in</strong> <strong>the</strong> White, Black, or Asian/Pacific Islander c<strong>at</strong>egories<br />
<strong>in</strong> this figure. All adults <strong>of</strong> Hispanic orig<strong>in</strong> are classified as Hispanic, regardless <strong>of</strong> race.The Asian/Pacific<br />
Islander c<strong>at</strong>egory <strong>in</strong>cludes N<strong>at</strong>ive Hawaiians.<br />
SOURCE: U.S. Department <strong>of</strong> Educ<strong>at</strong>ion, Institute <strong>of</strong> Educ<strong>at</strong>ion Sciences, N<strong>at</strong>ional Center for Educ<strong>at</strong>ion St<strong>at</strong>istics, 1992<br />
N<strong>at</strong>ional Adult <strong>Literacy</strong> Survey and 2003 N<strong>at</strong>ional Assessment <strong>of</strong> Adult <strong>Literacy</strong>.<br />
9<br />
Pr<strong>of</strong>icient literacy was significantly<br />
higher than <strong>the</strong><br />
percentage <strong>of</strong> Blacks and<br />
Hispanics (figures 8, 9, and<br />
10). A higher percentage <strong>of</strong><br />
Whites than Asians/Pacific<br />
Islanders had Pr<strong>of</strong>icient prose<br />
literacy (figure 8). On all<br />
three scales, Hispanics were<br />
more likely than Blacks to<br />
have Pr<strong>of</strong>icient literacy (figures<br />
8, 9, and 10).<br />
Figure 10. Percentage <strong>of</strong> adults <strong>in</strong> each quantit<strong>at</strong>ive literacy<br />
level, by race/ethnicity: 1992 and 2003<br />
Race/ethnicity<br />
and year<br />
1992<br />
White<br />
2003<br />
Black<br />
1992<br />
2003<br />
Hispanic<br />
1992<br />
2003<br />
Asian/<br />
Pacific Islander<br />
1992<br />
2003<br />
57<br />
47*<br />
50<br />
50<br />
31<br />
19<br />
13*<br />
19*<br />
32 34 15<br />
32 39* 17<br />
30 12 1<br />
36* 15* 2<br />
31 16 3<br />
29 17 4<br />
29 28 12<br />
34 35 12<br />
70 60 50 40 30 20 10 0 10 20 30 40 50 60 70 80 90 100<br />
Percent Below Basic Percent Basic and above<br />
Below Basic Basic Intermedi<strong>at</strong>e Pr<strong>of</strong>icient<br />
* Significantly different from 1992.<br />
NOTE: Detail may not sum to totals because <strong>of</strong> round<strong>in</strong>g. <strong>Adults</strong> are def<strong>in</strong>ed as people 16 years <strong>of</strong> age and older liv<strong>in</strong>g<br />
<strong>in</strong> households or prisons. <strong>Adults</strong> who could not be <strong>in</strong>terviewed due to language spoken or cognitive or mental<br />
disabilities (3 percent <strong>in</strong> 2003 and 4 percent <strong>in</strong> 1992) are excluded from this figure. In 1992, respondents were<br />
allowed to identify only one race. In 2003, respondents were allowed to identify multiple races. In 2003, 2 percent<br />
<strong>of</strong> respondents identified multiple races and are not <strong>in</strong>cluded <strong>in</strong> <strong>the</strong> White, Black, or Asian/Pacific Islander c<strong>at</strong>egories<br />
<strong>in</strong> this figure. All adults <strong>of</strong> Hispanic orig<strong>in</strong> are classified as Hispanic, regardless <strong>of</strong> race.The Asian/Pacific<br />
Islander c<strong>at</strong>egory <strong>in</strong>cludes N<strong>at</strong>ive Hawaiians.<br />
SOURCE: U.S. Department <strong>of</strong> Educ<strong>at</strong>ion, Institute <strong>of</strong> Educ<strong>at</strong>ion Sciences, N<strong>at</strong>ional Center for Educ<strong>at</strong>ion St<strong>at</strong>istics, 1992<br />
N<strong>at</strong>ional Adult <strong>Literacy</strong> Survey and 2003 N<strong>at</strong>ional Assessment <strong>of</strong> Adult <strong>Literacy</strong>.
A <strong>First</strong> <strong>Look</strong> <strong>at</strong> <strong>the</strong> <strong>Literacy</strong> <strong>of</strong> America’s <strong>Adults</strong> <strong>in</strong> <strong>the</strong> 21 st <strong>Century</strong><br />
<strong>Literacy</strong> by Age<br />
The average prose, document,<br />
and quantit<strong>at</strong>ive literacy <strong>of</strong><br />
adults <strong>in</strong> <strong>the</strong> oldest age groups<br />
(50 to 64 and 65 and older)<br />
<strong>in</strong>creased between 1992 and<br />
2003 (figure 11). For <strong>the</strong> same<br />
NAAL Popul<strong>at</strong>ion,<br />
1992 and 2003<br />
Table 4. Percentage <strong>of</strong><br />
adults, by age<br />
groups: 1992 and<br />
2003<br />
Age 1992 2003<br />
16–18 6 6<br />
19–24 13 11*<br />
25–39 33 28*<br />
40–49 17 20*<br />
50–64 16 21*<br />
65+ 15 15<br />
* Significantly different from 1992.<br />
NOTE: Detail may not sum to totals because <strong>of</strong><br />
round<strong>in</strong>g. <strong>Adults</strong> are def<strong>in</strong>ed as people 16 years <strong>of</strong><br />
age and older liv<strong>in</strong>g <strong>in</strong> households or prisons.<br />
<strong>Adults</strong> who could not be <strong>in</strong>terviewed due to language<br />
spoken or cognitive or mental disabilities (3<br />
percent <strong>in</strong> 2003 and 4 percent <strong>in</strong> 1992) are excluded<br />
from this table.<br />
SOURCE: U.S. Department <strong>of</strong> Educ<strong>at</strong>ion, Institute <strong>of</strong><br />
Educ<strong>at</strong>ion Sciences, N<strong>at</strong>ional Center for Educ<strong>at</strong>ion<br />
St<strong>at</strong>istics, 1992 N<strong>at</strong>ional Adult <strong>Literacy</strong> Survey and<br />
2003 N<strong>at</strong>ional Assessment <strong>of</strong> Adult <strong>Literacy</strong>.<br />
The ag<strong>in</strong>g <strong>of</strong> America’s<br />
adults is reflected <strong>in</strong> <strong>the</strong><br />
<strong>in</strong>crease <strong>in</strong> <strong>the</strong> percentage<br />
<strong>of</strong> adults between <strong>the</strong> ages<br />
<strong>of</strong> 40 and 49 and between<br />
<strong>the</strong> ages <strong>of</strong> 50 and 64.<br />
While <strong>the</strong> percentage <strong>of</strong><br />
adults <strong>in</strong> <strong>the</strong>se age groups<br />
rose between 1992 and<br />
2003, <strong>the</strong> percentage <strong>of</strong><br />
adults between <strong>the</strong> ages <strong>of</strong><br />
19 and 24 and between 25<br />
and 39 decreased.<br />
groups <strong>of</strong> adults, <strong>the</strong> percentage<br />
with Below Basic literacy<br />
fell across <strong>the</strong> literacy scales<br />
(figures 12 and 13; results for<br />
<strong>the</strong> quantit<strong>at</strong>ive scale are not<br />
shown here but are available<br />
on <strong>the</strong> NAAL website).<br />
Although <strong>the</strong> average literacy<br />
<strong>of</strong> adults age 65 and older<br />
<strong>in</strong>creased between 1992 and<br />
2003, adults <strong>in</strong> this age group<br />
had <strong>the</strong> lowest average literacy<br />
<strong>in</strong> 2003 and accounted for<br />
<strong>the</strong> largest percentage <strong>of</strong><br />
adults with Below Basic prose,<br />
document, and quantit<strong>at</strong>ive<br />
literacy <strong>in</strong> 2003 (figures 11,<br />
12, and 13; quantit<strong>at</strong>ive levels<br />
not shown). Among adults<br />
age 65 and older, 23 percent<br />
had Below Basic prose literacy,<br />
27 percent had Below Basic<br />
document literacy, and<br />
Figure 11. Average prose, document, and quantit<strong>at</strong>ive literacy scores <strong>of</strong> adults, by age:<br />
1992 and 2003<br />
Average score<br />
500<br />
300<br />
250<br />
200<br />
150<br />
0<br />
270<br />
267<br />
280<br />
276<br />
Prose Document Quantit<strong>at</strong>ive<br />
288<br />
293<br />
283* 282*<br />
278*<br />
269<br />
248*<br />
235<br />
270<br />
268<br />
282 286 284<br />
277 282 277*<br />
16–18 19–24 25–39 40–49 50–64 65+ 16–18 19–24 25–39 40–49 50–64<br />
Age<br />
65+ 16–18 19–24 25–39 40–49 50–64 65+<br />
1992 2003<br />
* Significantly different from 1992.<br />
NOTE: <strong>Adults</strong> are def<strong>in</strong>ed as people 16 years <strong>of</strong> age and older liv<strong>in</strong>g <strong>in</strong> households or prisons. <strong>Adults</strong> who could not be <strong>in</strong>terviewed due to language spoken or cognitive or mental<br />
disabilities (3 percent <strong>in</strong> 2003 and 4 percent <strong>in</strong> 1992) are excluded from this figure.<br />
SOURCE: U.S. Department <strong>of</strong> Educ<strong>at</strong>ion, Institute <strong>of</strong> Educ<strong>at</strong>ion Sciences, N<strong>at</strong>ional Center for Educ<strong>at</strong>ion St<strong>at</strong>istics, 1992 N<strong>at</strong>ional Adult <strong>Literacy</strong> Survey and 2003 N<strong>at</strong>ional<br />
Assessment <strong>of</strong> Adult <strong>Literacy</strong>.<br />
10<br />
270*<br />
258<br />
235*<br />
221<br />
267<br />
264<br />
279<br />
277<br />
292*<br />
286<br />
292<br />
289<br />
289*<br />
272<br />
257*<br />
235
34 percent had Below Basic<br />
quantit<strong>at</strong>ive literacy.<br />
Average prose literacy scores<br />
for adults <strong>in</strong> <strong>the</strong> 25 to 39 and<br />
40 to 49 age groups fell from<br />
1992 to 2003 (figure 11).<br />
Average document literacy<br />
A <strong>First</strong> <strong>Look</strong> <strong>at</strong> <strong>the</strong> <strong>Literacy</strong> <strong>of</strong> America’s <strong>Adults</strong> <strong>in</strong> <strong>the</strong> 21 st <strong>Century</strong><br />
decreased for adults ages 40<br />
to 49, while <strong>the</strong> average<br />
quantit<strong>at</strong>ive literacy <strong>of</strong> adults<br />
ages 25 to 39 <strong>in</strong>creased.<br />
Average literacy for adults <strong>in</strong><br />
<strong>the</strong> 16 to 18 and 19 to 24<br />
age groups was not significantly<br />
different <strong>in</strong> 1992 and<br />
Figure 12. Percentage <strong>of</strong> adults <strong>in</strong> each prose literacy level,<br />
by age: 1992 and 2003<br />
Age and year<br />
16–18<br />
19–24<br />
25–39<br />
40–49<br />
50–64<br />
65+<br />
1992<br />
2003<br />
1992<br />
2003<br />
1992<br />
2003<br />
1992<br />
2003<br />
1992<br />
2003<br />
1992<br />
2003<br />
10<br />
11<br />
10<br />
11<br />
10<br />
12*<br />
9<br />
11<br />
16<br />
13*<br />
33<br />
23*<br />
35 49 6<br />
37 48 5<br />
29 49 13<br />
29 48 12<br />
24 46 20<br />
25 45 18<br />
23 45 23<br />
27* 47 15*<br />
31 43 11<br />
27* 44 15*<br />
37 27 3<br />
38 34* 4<br />
70 60 50 40 30 20 10 0 10 20 30 40 50 60 70 80 90 100<br />
Percent Below Basic Percent Basic and above<br />
Below Basic Basic Intermedi<strong>at</strong>e Pr<strong>of</strong>icient<br />
* Significantly different from 1992.<br />
NOTE: Detail may not sum to totals because <strong>of</strong> round<strong>in</strong>g. <strong>Adults</strong> are def<strong>in</strong>ed as people 16 years <strong>of</strong> age and older liv<strong>in</strong>g<br />
<strong>in</strong> households or prisons. <strong>Adults</strong> who could not be <strong>in</strong>terviewed due to language spoken or cognitive or mental<br />
disabilities (3 percent <strong>in</strong> 2003 and 4 percent <strong>in</strong> 1992) are excluded from this figure.<br />
SOURCE: U.S. Department <strong>of</strong> Educ<strong>at</strong>ion, Institute <strong>of</strong> Educ<strong>at</strong>ion Sciences, N<strong>at</strong>ional Center for Educ<strong>at</strong>ion St<strong>at</strong>istics, 1992<br />
N<strong>at</strong>ional Adult <strong>Literacy</strong> Survey and 2003 N<strong>at</strong>ional Assessment <strong>of</strong> Adult <strong>Literacy</strong>.<br />
11<br />
2003 across <strong>the</strong> literacy scales<br />
(figure 11).<br />
Among adults ages 50 to 64,<br />
<strong>the</strong> percentage with Pr<strong>of</strong>icient<br />
prose, document, and quantit<strong>at</strong>ive<br />
literacy <strong>in</strong>creased<br />
between 1992 and 2003<br />
(figures 12 and 13; quantit<strong>at</strong>ive<br />
d<strong>at</strong>a not shown).The<br />
percentage <strong>of</strong> adults age 65<br />
and older with Pr<strong>of</strong>icient literacy<br />
did not change on any <strong>of</strong><br />
<strong>the</strong> three scales between 1992<br />
and 2003.<br />
Figure 13. Percentage <strong>of</strong> adults <strong>in</strong> each document literacy<br />
level, by age: 1992 and 2003<br />
Age and year<br />
1992<br />
16–18<br />
2003<br />
1992<br />
19–24<br />
2003<br />
1992<br />
25–39<br />
2003<br />
1992<br />
40–49<br />
2003<br />
1992<br />
50–64<br />
2003<br />
1992<br />
65+<br />
2003<br />
38<br />
27*<br />
10<br />
11<br />
7<br />
9<br />
9<br />
8<br />
10<br />
10<br />
17<br />
12*<br />
24 57 10<br />
24 56 9<br />
19 58 15<br />
20 58 13<br />
18 53 21<br />
19 56* 17*<br />
18 52 20<br />
20* 54 15*<br />
27 48 9<br />
23* 54* 12*<br />
31 29 2<br />
33 38* 3<br />
70 60 50 40 30 20 10 0 10 20 30 40 50 60 70 80 90 100<br />
Percent Below Basic Percent Basic and above<br />
Below Basic Basic Intermedi<strong>at</strong>e Pr<strong>of</strong>icient<br />
* Significantly different from 1992.<br />
NOTE: Detail may not sum to totals because <strong>of</strong> round<strong>in</strong>g. <strong>Adults</strong> are def<strong>in</strong>ed as people 16 years <strong>of</strong> age and older liv<strong>in</strong>g<br />
<strong>in</strong> households or prisons. <strong>Adults</strong> who could not be <strong>in</strong>terviewed due to language spoken or cognitive or mental<br />
disabilities (3 percent <strong>in</strong> 2003 and 4 percent <strong>in</strong> 1992) are excluded from this figure.<br />
SOURCE: U.S. Department <strong>of</strong> Educ<strong>at</strong>ion, Institute <strong>of</strong> Educ<strong>at</strong>ion Sciences, N<strong>at</strong>ional Center for Educ<strong>at</strong>ion St<strong>at</strong>istics, 1992<br />
N<strong>at</strong>ional Adult <strong>Literacy</strong> Survey and 2003 N<strong>at</strong>ional Assessment <strong>of</strong> Adult <strong>Literacy</strong>.
A <strong>First</strong> <strong>Look</strong> <strong>at</strong> <strong>the</strong> <strong>Literacy</strong> <strong>of</strong> America’s <strong>Adults</strong> <strong>in</strong> <strong>the</strong> 21 st <strong>Century</strong><br />
<strong>Literacy</strong> by Language Spoken Before Start<strong>in</strong>g School<br />
NAAL Popul<strong>at</strong>ion,<br />
1992 and 2003<br />
Table 5. Percentage <strong>of</strong><br />
adults, by<br />
language spoken<br />
before start<strong>in</strong>g<br />
school: 1992 and<br />
2003<br />
Language spoken<br />
before start<strong>in</strong>g school 1992 2003<br />
English only 86 81*<br />
English and Spanish 2 2<br />
English and o<strong>the</strong>r language 3 4<br />
Spanish 5 8*<br />
O<strong>the</strong>r language 4 5<br />
* Significantly different from 1992.<br />
NOTE: Detail may not sum to totals because <strong>of</strong><br />
round<strong>in</strong>g. <strong>Adults</strong> are def<strong>in</strong>ed as people 16 years <strong>of</strong><br />
age and older liv<strong>in</strong>g <strong>in</strong> households or prisons.<br />
<strong>Adults</strong> who could not be <strong>in</strong>terviewed due to language<br />
spoken or cognitive or mental disabilities (3<br />
percent <strong>in</strong> 2003 and 4 percent <strong>in</strong> 1992) are excluded<br />
from this table. The English and Spanish c<strong>at</strong>egory<br />
<strong>in</strong>cludes adults who spoke only English and<br />
Spanish, as well as adults who spoke English,<br />
Spanish, and ano<strong>the</strong>r non-English language.The<br />
Spanish c<strong>at</strong>egory <strong>in</strong>cludes adults who spoke only<br />
Spanish, as well as adults who spoke Spanish and<br />
ano<strong>the</strong>r non-English language.The O<strong>the</strong>r language<br />
c<strong>at</strong>egory <strong>in</strong>cludes only adults who did not speak<br />
English or Spanish.<br />
SOURCE: U.S. Department <strong>of</strong> Educ<strong>at</strong>ion, Institute <strong>of</strong><br />
Educ<strong>at</strong>ion Sciences, N<strong>at</strong>ional Center for Educ<strong>at</strong>ion<br />
St<strong>at</strong>istics, 1992 N<strong>at</strong>ional Adult <strong>Literacy</strong> Survey and<br />
2003 N<strong>at</strong>ional Assessment <strong>of</strong> Adult <strong>Literacy</strong>.<br />
The language background<br />
<strong>of</strong> America’s adults<br />
changed between 1992<br />
and 2003.The percentage<br />
<strong>of</strong> adults who spoke<br />
English before start<strong>in</strong>g<br />
school decreased, while <strong>the</strong><br />
percentage <strong>of</strong> adults who<br />
spoke Spanish or Spanish<br />
and ano<strong>the</strong>r non-English<br />
language before start<strong>in</strong>g<br />
school <strong>in</strong>creased.<br />
Scores for adults who spoke<br />
Spanish or Spanish and ano<strong>the</strong>r<br />
non-English language<br />
before start<strong>in</strong>g school dropped<br />
17 po<strong>in</strong>ts from 1992 to 2003<br />
for prose and document literacy<br />
but did not change significantly<br />
for quantit<strong>at</strong>ive literacy<br />
(figure 14).The average prose<br />
and document literacy <strong>of</strong><br />
adults who spoke English<br />
before start<strong>in</strong>g school (English<br />
only, English and Spanish,<br />
English and o<strong>the</strong>r language)<br />
did not change significantly<br />
between 1992 and 2003,<br />
although <strong>the</strong>ir average quantit<strong>at</strong>ive<br />
literacy <strong>in</strong>creased.<br />
Fewer adults who spoke<br />
English only or English and<br />
a non-Spanish language<br />
before start<strong>in</strong>g school had<br />
Below Basic prose, document,<br />
and quantit<strong>at</strong>ive literacy <strong>in</strong><br />
2003 than <strong>in</strong> 1992 (figures<br />
15 and 16; results for <strong>the</strong><br />
quantit<strong>at</strong>ive scale are not<br />
Figure 14. Average prose, document, and quantit<strong>at</strong>ive literacy scores <strong>of</strong> adults, by<br />
language spoken before start<strong>in</strong>g school: 1992 and 2003<br />
Average score<br />
500<br />
300<br />
250<br />
200<br />
150<br />
0<br />
282 283<br />
273 278<br />
262<br />
255<br />
English<br />
only<br />
English<br />
and<br />
Spanish<br />
1992 2003<br />
Prose Document Quantit<strong>at</strong>ive<br />
205<br />
188*<br />
239 249<br />
English Spanish O<strong>the</strong>r<br />
and o<strong>the</strong>r language<br />
language<br />
275 276<br />
English<br />
only<br />
268<br />
253<br />
259 260<br />
English<br />
and<br />
Spanish<br />
216<br />
199*<br />
257*<br />
241<br />
English Spanish O<strong>the</strong>r<br />
and o<strong>the</strong>r language<br />
language<br />
Language spoken before start<strong>in</strong>g school<br />
280 289*<br />
English<br />
only<br />
261*<br />
247<br />
271<br />
English<br />
and<br />
Spanish<br />
289*<br />
212 211<br />
246<br />
270*<br />
English Spanish O<strong>the</strong>r<br />
and o<strong>the</strong>r language<br />
language<br />
* Significantly different from 1992.<br />
NOTE: <strong>Adults</strong> are def<strong>in</strong>ed as people 16 years <strong>of</strong> age and older liv<strong>in</strong>g <strong>in</strong> households or prisons. <strong>Adults</strong> who could not be <strong>in</strong>terviewed due to language spoken or cognitive or mental<br />
disabilities (3 percent <strong>in</strong> 2003 and 4 percent <strong>in</strong> 1992) are excluded from this figure.The English and Spanish c<strong>at</strong>egory <strong>in</strong>cludes adults who spoke only English and Spanish, as<br />
well as adults who spoke English, Spanish, and ano<strong>the</strong>r non-English language.The Spanish c<strong>at</strong>egory <strong>in</strong>cludes adults who spoke only Spanish, as well as adults who spoke<br />
Spanish and ano<strong>the</strong>r non-English language.The O<strong>the</strong>r language c<strong>at</strong>egory <strong>in</strong>cludes only adults who did not speak English or Spanish.<br />
SOURCE: U.S. Department <strong>of</strong> Educ<strong>at</strong>ion, Institute <strong>of</strong> Educ<strong>at</strong>ion Sciences, N<strong>at</strong>ional Center for Educ<strong>at</strong>ion St<strong>at</strong>istics, 1992 N<strong>at</strong>ional Adult <strong>Literacy</strong> Survey and 2003 N<strong>at</strong>ional<br />
Assessment <strong>of</strong> Adult <strong>Literacy</strong>.<br />
12
shown here but are available<br />
on <strong>the</strong> NAAL website).<br />
Among adults who spoke<br />
Spanish or Spanish and<br />
ano<strong>the</strong>r non-English language<br />
before start<strong>in</strong>g school,<br />
<strong>the</strong> percentage with Below<br />
Basic prose and document literacy<br />
<strong>in</strong>creased between<br />
Figure 15. Percentage <strong>of</strong> adults <strong>in</strong> each prose literacy level,<br />
by language spoken before start<strong>in</strong>g school:<br />
1992 and 2003<br />
Language spoken<br />
before start<strong>in</strong>g school<br />
and year<br />
1992<br />
English only<br />
2003<br />
English and<br />
Spanish<br />
English and<br />
o<strong>the</strong>r<br />
language<br />
1992<br />
2003<br />
1992<br />
2003<br />
1992<br />
Spanish<br />
2003<br />
O<strong>the</strong>r<br />
language<br />
1992<br />
2003<br />
61*<br />
52<br />
32<br />
26<br />
19<br />
11<br />
14<br />
15<br />
A <strong>First</strong> <strong>Look</strong> <strong>at</strong> <strong>the</strong> <strong>Literacy</strong> <strong>of</strong> America’s <strong>Adults</strong> <strong>in</strong> <strong>the</strong> 21 st <strong>Century</strong><br />
1992 and 2003 (figures 15<br />
and 16).<br />
Average document literacy <strong>in</strong><br />
2003 was highest for <strong>the</strong><br />
English-language-only group<br />
(figure 14). Prose and quantit<strong>at</strong>ive<br />
literacy did not differ<br />
significantly between <strong>the</strong><br />
27 46 16<br />
9* 27 49* 15<br />
7*<br />
38 39 4<br />
38 42 6<br />
30 43 13<br />
33 51* 9<br />
30 16 2<br />
25* 13* 1*<br />
35 29 5<br />
33 34 7<br />
70 60 50 40 30 20 10 0 10 20 30 40 50 60 70 80 90 100<br />
Percent Below Basic Percent Basic and above<br />
Below Basic Basic Intermedi<strong>at</strong>e Pr<strong>of</strong>icient<br />
* Significantly different from 1992.<br />
NOTE: Detail may not sum to totals because <strong>of</strong> round<strong>in</strong>g. <strong>Adults</strong> are def<strong>in</strong>ed as people 16 years <strong>of</strong> age and older liv<strong>in</strong>g<br />
<strong>in</strong> households or prisons. <strong>Adults</strong> who could not be <strong>in</strong>terviewed due to language spoken or cognitive or mental<br />
disabilities (3 percent <strong>in</strong> 2003 and 4 percent <strong>in</strong> 1992) are excluded from this figure.The English and Spanish c<strong>at</strong>egory<br />
<strong>in</strong>cludes adults who spoke only English and Spanish, as well as adults who spoke English, Spanish, and ano<strong>the</strong>r<br />
non-English language.The Spanish c<strong>at</strong>egory <strong>in</strong>cludes adults who spoke only Spanish, as well as adults who spoke<br />
Spanish and ano<strong>the</strong>r non-English language.The O<strong>the</strong>r language c<strong>at</strong>egory <strong>in</strong>cludes only adults who did not speak<br />
English or Spanish.<br />
SOURCE: U.S. Department <strong>of</strong> Educ<strong>at</strong>ion, Institute <strong>of</strong> Educ<strong>at</strong>ion Sciences, N<strong>at</strong>ional Center for Educ<strong>at</strong>ion St<strong>at</strong>istics, 1992<br />
N<strong>at</strong>ional Adult <strong>Literacy</strong> Survey and 2003 N<strong>at</strong>ional Assessment <strong>of</strong> Adult <strong>Literacy</strong>.<br />
13<br />
English-language-only and<br />
<strong>the</strong> English and o<strong>the</strong>r language<br />
groups.<br />
In 2003, among adults who<br />
spoke Spanish or Spanish and<br />
ano<strong>the</strong>r non-English language<br />
before start<strong>in</strong>g school, 61 percent<br />
had Below Basic prose lit-<br />
Figure 16. Percentage <strong>of</strong> adults <strong>in</strong> each document literacy<br />
level, by language spoken before start<strong>in</strong>g<br />
school: 1992 and 2003<br />
Language spoken<br />
before start<strong>in</strong>g school<br />
and year<br />
1992<br />
English only<br />
2003<br />
English and<br />
Spanish<br />
English and<br />
o<strong>the</strong>r<br />
language<br />
1992<br />
2003<br />
1992<br />
2003<br />
1992<br />
Spanish<br />
2003<br />
O<strong>the</strong>r<br />
language<br />
1992<br />
2003<br />
49*<br />
41<br />
29<br />
18<br />
19<br />
20*<br />
12<br />
9*<br />
12<br />
10*<br />
eracy, 49 percent had Below<br />
Basic document literacy, and<br />
62 percent had Below Basic<br />
quantit<strong>at</strong>ive literacy (figures<br />
15 and 16; quantit<strong>at</strong>ive d<strong>at</strong>a<br />
not shown).<br />
21 51 16<br />
21 56* 13*<br />
30 45 7<br />
29 54*<br />
24 46 11<br />
25 57* 8<br />
30 27 2<br />
25* 23 3<br />
26 39 7<br />
24 46* 10*<br />
70 60 50 40 30 20 10 0 10 20 30 40 50 60 70 80 90 100<br />
Percent Below Basic Percent Basic and above<br />
Below Basic Basic Intermedi<strong>at</strong>e Pr<strong>of</strong>icient<br />
* Significantly different from 1992.<br />
NOTE: Detail may not sum to totals because <strong>of</strong> round<strong>in</strong>g. <strong>Adults</strong> are def<strong>in</strong>ed as people 16 years <strong>of</strong> age and older liv<strong>in</strong>g<br />
<strong>in</strong> households or prisons. <strong>Adults</strong> who could not be <strong>in</strong>terviewed due to language spoken or cognitive or mental<br />
disabilities (3 percent <strong>in</strong> 2003 and 4 percent <strong>in</strong> 1992) are excluded from this figure.The English and Spanish c<strong>at</strong>egory<br />
<strong>in</strong>cludes adults who spoke only English and Spanish, as well as adults who spoke English, Spanish, and ano<strong>the</strong>r<br />
non-English language.The Spanish c<strong>at</strong>egory <strong>in</strong>cludes adults who spoke only Spanish, as well as adults who spoke<br />
Spanish and ano<strong>the</strong>r non-English language.The O<strong>the</strong>r language c<strong>at</strong>egory <strong>in</strong>cludes only adults who did not speak<br />
English or Spanish.<br />
SOURCE: U.S. Department <strong>of</strong> Educ<strong>at</strong>ion, Institute <strong>of</strong> Educ<strong>at</strong>ion Sciences, N<strong>at</strong>ional Center for Educ<strong>at</strong>ion St<strong>at</strong>istics, 1992<br />
N<strong>at</strong>ional Adult <strong>Literacy</strong> Survey and 2003 N<strong>at</strong>ional Assessment <strong>of</strong> Adult <strong>Literacy</strong>.<br />
5
A <strong>First</strong> <strong>Look</strong> <strong>at</strong> <strong>the</strong> <strong>Literacy</strong> <strong>of</strong> America’s <strong>Adults</strong> <strong>in</strong> <strong>the</strong> 21 st <strong>Century</strong><br />
<strong>Literacy</strong> by Educ<strong>at</strong>ional Atta<strong>in</strong>ment<br />
Average prose literacy<br />
decreased for all levels <strong>of</strong> educ<strong>at</strong>ional<br />
<strong>at</strong>ta<strong>in</strong>ment between<br />
1992 and 2003, with <strong>the</strong><br />
NAAL Popul<strong>at</strong>ion,<br />
1992 and 2003<br />
Table 6. Percentage <strong>of</strong><br />
adults, by<br />
educ<strong>at</strong>ional<br />
<strong>at</strong>ta<strong>in</strong>ment: 1992<br />
and 2003<br />
Educ<strong>at</strong>ional <strong>at</strong>ta<strong>in</strong>ment 1992 2003<br />
Still <strong>in</strong> high school 4 3*<br />
Less than/some high school 21 15*<br />
GED/high school equivalency 4 5*<br />
High school gradu<strong>at</strong>e 27 26*<br />
Voc<strong>at</strong>ional/trade/<br />
bus<strong>in</strong>ess school 5 6<br />
Some college 9 11*<br />
Associ<strong>at</strong>e’s/2-year degree 11 12*<br />
College gradu<strong>at</strong>e 10 12*<br />
Gradu<strong>at</strong>e studies/degree 9 11*<br />
* Significantly different from 1992.<br />
NOTE: Detail may not sum to totals because <strong>of</strong><br />
round<strong>in</strong>g. <strong>Adults</strong> are def<strong>in</strong>ed as people 16 years <strong>of</strong><br />
age and older liv<strong>in</strong>g <strong>in</strong> households or prisons.<br />
<strong>Adults</strong> who could not be <strong>in</strong>terviewed due to language<br />
spoken or cognitive or mental disabilities (3<br />
percent <strong>in</strong> 2003 and 4 percent <strong>in</strong> 1992) are excluded<br />
from this table.<br />
SOURCE: U.S. Department <strong>of</strong> Educ<strong>at</strong>ion, Institute <strong>of</strong><br />
Educ<strong>at</strong>ion Sciences, N<strong>at</strong>ional Center for Educ<strong>at</strong>ion<br />
St<strong>at</strong>istics, 1992 N<strong>at</strong>ional Adult <strong>Literacy</strong> Survey and<br />
2003 N<strong>at</strong>ional Assessment <strong>of</strong> Adult <strong>Literacy</strong>.<br />
The educ<strong>at</strong>ional <strong>at</strong>ta<strong>in</strong>ment<br />
<strong>of</strong> America’s adults<br />
<strong>in</strong>creased between 1992<br />
and 2003.The percentage<br />
<strong>of</strong> adults with less than a<br />
high school degree or<br />
GED/Equivalency<br />
decreased by 6 percentage<br />
po<strong>in</strong>ts, while more adults<br />
completed an associ<strong>at</strong>e’s<br />
degree or more educ<strong>at</strong>ion.<br />
exception <strong>of</strong> adults who were<br />
still <strong>in</strong> high school or completed<br />
a GED (table 7).<br />
Average document literacy<br />
also decreased among adults<br />
who completed educ<strong>at</strong>ion<br />
above a voc<strong>at</strong>ional, trade, or<br />
bus<strong>in</strong>ess school. Differences <strong>in</strong><br />
document literacy <strong>in</strong> 1992<br />
and 2003 were not significant<br />
14<br />
for adults with educ<strong>at</strong>ional<br />
<strong>at</strong>ta<strong>in</strong>ment less than some<br />
college.There were no significant<br />
differences <strong>in</strong> average<br />
quantit<strong>at</strong>ive literacy between<br />
1992 and 2003 for any educ<strong>at</strong>ional<br />
<strong>at</strong>ta<strong>in</strong>ment level.<br />
In 2003, literacy was lowest<br />
across <strong>the</strong> three scales for<br />
Table 7. Average prose, document, and quantit<strong>at</strong>ive literacy scores<br />
<strong>of</strong> adults, by educ<strong>at</strong>ional <strong>at</strong>ta<strong>in</strong>ment: 1992 and 2003<br />
<strong>Literacy</strong> scale and<br />
educ<strong>at</strong>ional <strong>at</strong>ta<strong>in</strong>ment<br />
Prose<br />
1992 2003<br />
Still <strong>in</strong> high school 268 262<br />
Less than/some high school 216 207*<br />
GED/high school equivalency 265 260<br />
High school gradu<strong>at</strong>e 268 262*<br />
Voc<strong>at</strong>ional/trade/bus<strong>in</strong>ess school 278 268*<br />
Some college 292 287*<br />
Associ<strong>at</strong>e’s/2-year degree 306 298*<br />
College gradu<strong>at</strong>e 325 314*<br />
Gradu<strong>at</strong>e studies/degree<br />
Document<br />
340 327*<br />
Still <strong>in</strong> high school 270 265<br />
Less than/some high school 211 208<br />
GED/high school equivalency 259 257<br />
High school gradu<strong>at</strong>e 261 258<br />
Voc<strong>at</strong>ional/trade/bus<strong>in</strong>ess school 273 267<br />
Some college 288 280*<br />
Associ<strong>at</strong>e’s/2-year degree 301 291*<br />
College gradu<strong>at</strong>e 317 303*<br />
Gradu<strong>at</strong>e studies/degree<br />
Quantit<strong>at</strong>ive<br />
328 311*<br />
Still <strong>in</strong> high school 263 261<br />
Less than/some high school 209 211<br />
GED/high school equivalency 265 265<br />
High school gradu<strong>at</strong>e 267 269<br />
Voc<strong>at</strong>ional/trade/bus<strong>in</strong>ess school 280 279<br />
Some college 295 294<br />
Associ<strong>at</strong>e’s/2-year degree 305 305<br />
College gradu<strong>at</strong>e 324 323<br />
Gradu<strong>at</strong>e studies/degree 336 332<br />
adults who did not complete<br />
high school; <strong>the</strong>se adults also<br />
accounted for <strong>the</strong> largest<br />
group with Below Basic prose,<br />
document, and quantit<strong>at</strong>ive literacy<br />
(tables 7 and 8). On <strong>the</strong><br />
quantit<strong>at</strong>ive scale, for example,<br />
over 60 percent <strong>of</strong> adults<br />
without a high school degree<br />
had Below Basic literacy.<br />
* Significantly different from 1992.<br />
NOTE: <strong>Adults</strong> are def<strong>in</strong>ed as people 16 years <strong>of</strong> age and older liv<strong>in</strong>g <strong>in</strong> households or prisons. <strong>Adults</strong> who could not be <strong>in</strong>terviewed<br />
due to language spoken or cognitive or mental disabilities (3 percent <strong>in</strong> 2003 and 4 percent <strong>in</strong> 1992) are excluded from this table.<br />
SOURCE: U.S. Department <strong>of</strong> Educ<strong>at</strong>ion, Institute <strong>of</strong> Educ<strong>at</strong>ion Sciences, N<strong>at</strong>ional Center for Educ<strong>at</strong>ion St<strong>at</strong>istics, 1992 N<strong>at</strong>ional<br />
Adult <strong>Literacy</strong> Survey and 2003 N<strong>at</strong>ional Assessment <strong>of</strong> Adult <strong>Literacy</strong>.
In 2003, prose, document, and<br />
quantit<strong>at</strong>ive literacy rose with<br />
successive levels <strong>of</strong> educ<strong>at</strong>ional<br />
<strong>at</strong>ta<strong>in</strong>ment beg<strong>in</strong>n<strong>in</strong>g with<br />
<strong>the</strong> completion <strong>of</strong> high school<br />
(table 7).Average prose, document,<br />
and quantit<strong>at</strong>ive literacy<br />
for adults who completed a<br />
GED was not significantly<br />
different from th<strong>at</strong> <strong>of</strong> adults<br />
A <strong>First</strong> <strong>Look</strong> <strong>at</strong> <strong>the</strong> <strong>Literacy</strong> <strong>of</strong> America’s <strong>Adults</strong> <strong>in</strong> <strong>the</strong> 21 st <strong>Century</strong><br />
who stopped <strong>the</strong>ir educ<strong>at</strong>ion<br />
after gradu<strong>at</strong><strong>in</strong>g high school.<br />
The decl<strong>in</strong><strong>in</strong>g performance <strong>of</strong><br />
adults with higher educ<strong>at</strong>ional<br />
<strong>at</strong>ta<strong>in</strong>ment was reflected <strong>in</strong><br />
<strong>the</strong> decrease between 1992<br />
and 2003 <strong>in</strong> <strong>the</strong> percentage <strong>of</strong><br />
adults with postsecondary<br />
degrees with Pr<strong>of</strong>icient prose<br />
and document literacy (table<br />
8). On <strong>the</strong> prose scale, <strong>the</strong><br />
percentage <strong>of</strong> college gradu<strong>at</strong>es<br />
with Pr<strong>of</strong>icient literacy<br />
decreased from 40 percent <strong>in</strong><br />
1992 to 31 percent <strong>in</strong> 2003.<br />
For adults who took gradu<strong>at</strong>e<br />
classes or completed a gradu<strong>at</strong>e<br />
degree, <strong>the</strong> percentage<br />
with Pr<strong>of</strong>icient prose literacy<br />
Table 8. Percentage <strong>of</strong> adults <strong>in</strong> each prose, document, and quantit<strong>at</strong>ive literacy level, by<br />
educ<strong>at</strong>ional <strong>at</strong>ta<strong>in</strong>ment: 1992 and 2003<br />
<strong>Literacy</strong> scale and<br />
Below Basic Basic Intermedi<strong>at</strong>e Pr<strong>of</strong>icient<br />
educ<strong>at</strong>ional <strong>at</strong>ta<strong>in</strong>ment<br />
Prose<br />
1992 2003 1992 2003 1992 2003 1992 2003<br />
Still <strong>in</strong> high school 11 14 36 37 47 45 6 4<br />
Less than/some high school 45 50* 38 33* 17 16 1 1<br />
GED/high school equivalency 9 10 42 45 46 43 3 3<br />
High school gradu<strong>at</strong>e 11 13 37 39 48 44* 5 4<br />
Voc<strong>at</strong>ional/trade/bus<strong>in</strong>ess school 9 10 29 36* 53 49 9 5*<br />
Some college 4 5 23 25 59 59 14 11<br />
Associ<strong>at</strong>e’s/2-year degree 2 4* 16 20* 58 56 23 19<br />
College gradu<strong>at</strong>e 2 3 10 14* 49 53 40 31*<br />
Gradu<strong>at</strong>e studies/degree<br />
Document<br />
1 1 6 10* 43 48 51 41*<br />
Still <strong>in</strong> high school 10 13 24 24 57 54 9 9<br />
Less than/some high school 44 45 32 29* 23 25 1 2<br />
GED/high school equivalency 9 13 31 30 58 53 3 4<br />
High school gradu<strong>at</strong>e 12 13 28 29 54 52 6 5<br />
Voc<strong>at</strong>ional/trade/bus<strong>in</strong>ess school 8 9 22 26 60 59 10 7<br />
Some college 4 5 15 19* 67 65 14 10<br />
Associ<strong>at</strong>e’s/2-year degree 3 3 12 15 60 66* 25 16*<br />
College gradu<strong>at</strong>e 2 2 9 11 52 62* 37 25*<br />
Gradu<strong>at</strong>e studies/degree<br />
Quantit<strong>at</strong>ive<br />
1 1 5 9* 48 59* 45 31*<br />
Still <strong>in</strong> high school 31 31 37 38 27 25 6 5<br />
Less than/some high school 65 64 25 25 9 10 1 1<br />
GED/high school equivalency 25 26 46 43 26 28 3 3<br />
High school gradu<strong>at</strong>e 26 24 41 42 29 29 5 5<br />
Voc<strong>at</strong>ional/trade/bus<strong>in</strong>ess school 18 18 39 41 35 35 8 6<br />
Some college 11 10 34 36 42 43 13 11<br />
Associ<strong>at</strong>e’s/2-year degree 8 7 29 30 45 45 18 18<br />
College gradu<strong>at</strong>e 5 4 21 22 44 43 31 31<br />
Gradu<strong>at</strong>e studies/degree 2 3 15 18 43 43 39 36<br />
* Significantly different from 1992.<br />
NOTE: Detail may not sum to totals because <strong>of</strong> round<strong>in</strong>g. <strong>Adults</strong> are def<strong>in</strong>ed as people 16 years <strong>of</strong> age and older liv<strong>in</strong>g <strong>in</strong> households or prisons. <strong>Adults</strong> who could not be <strong>in</strong>terviewed<br />
due to language spoken or cognitive or mental disabilities (3 percent <strong>in</strong> 2003 and 4 percent <strong>in</strong> 1992) are excluded from this table.<br />
SOURCE: U.S. Department <strong>of</strong> Educ<strong>at</strong>ion, Institute <strong>of</strong> Educ<strong>at</strong>ion Sciences, N<strong>at</strong>ional Center for Educ<strong>at</strong>ion St<strong>at</strong>istics, 1992 N<strong>at</strong>ional Adult <strong>Literacy</strong> Survey and 2003 N<strong>at</strong>ional Assessment<br />
<strong>of</strong> Adult <strong>Literacy</strong>.<br />
15<br />
fell 10 percentage po<strong>in</strong>ts<br />
between 1992 and 2003.<br />
The distribution <strong>of</strong> adults<br />
across <strong>the</strong> four literacy levels<br />
on <strong>the</strong> quantit<strong>at</strong>ive scale did<br />
not change significantly<br />
between 1992 and 2003<br />
with<strong>in</strong> any <strong>of</strong> <strong>the</strong> educ<strong>at</strong>ional<br />
<strong>at</strong>ta<strong>in</strong>ment c<strong>at</strong>egories.
A <strong>First</strong> <strong>Look</strong> <strong>at</strong> <strong>the</strong> <strong>Literacy</strong> <strong>of</strong> America’s <strong>Adults</strong> <strong>in</strong> <strong>the</strong> 21 st <strong>Century</strong><br />
<strong>Literacy</strong> by Employment St<strong>at</strong>us<br />
The ability to complete different<br />
literacy tasks may <strong>in</strong>fluence<br />
employability, so it is<br />
useful to look <strong>at</strong> <strong>the</strong> distribution<br />
<strong>of</strong> adults by literacy levels<br />
across <strong>the</strong> four c<strong>at</strong>egories<br />
<strong>of</strong> employment. Among adults<br />
with Below Basic prose literacy,<br />
51 percent were not <strong>in</strong> <strong>the</strong><br />
labor force <strong>in</strong> 2003, while 35<br />
NAAL Popul<strong>at</strong>ion,<br />
1992 and 2003<br />
Table 9. Percentage <strong>of</strong><br />
adults, by<br />
employment<br />
st<strong>at</strong>us: 1992 and<br />
2003<br />
Employment st<strong>at</strong>us 1992 2003<br />
Full time 49 50<br />
Part time 13 13<br />
Unemployed 5 5<br />
Not <strong>in</strong> labor force 33 32<br />
NOTE: Detail may not sum to totals because <strong>of</strong><br />
round<strong>in</strong>g. <strong>Adults</strong> are def<strong>in</strong>ed as people 16 years <strong>of</strong><br />
age or older liv<strong>in</strong>g <strong>in</strong> households. <strong>Adults</strong> who could<br />
not be <strong>in</strong>terviewed due to language spoken or cognitive<br />
or mental disabilities (3 percent <strong>in</strong> 2003 and<br />
4 percent <strong>in</strong> 1992) are excluded from this table.<br />
SOURCE: U.S. Department <strong>of</strong> Educ<strong>at</strong>ion, Institute <strong>of</strong><br />
Educ<strong>at</strong>ion Sciences, N<strong>at</strong>ional Center for Educ<strong>at</strong>ion<br />
St<strong>at</strong>istics, 1992 N<strong>at</strong>ional Adult <strong>Literacy</strong> Survey and<br />
2003 N<strong>at</strong>ional Assessment <strong>of</strong> Adult <strong>Literacy</strong>.<br />
The employment st<strong>at</strong>us <strong>of</strong><br />
America’s adults did not<br />
change significantly<br />
between 1992 and 2003.<br />
Over 60 percent <strong>of</strong> all<br />
adults were employed<br />
ei<strong>the</strong>r full or part time.<br />
percent were employed full<br />
time (figure 17; results for <strong>the</strong><br />
document and quantit<strong>at</strong>ive<br />
scales are not shown here but<br />
are available on <strong>the</strong> NAAL<br />
website).<br />
The percentage <strong>of</strong> adults<br />
with Below Basic prose literacy<br />
who were employed full<br />
time <strong>in</strong>creased 6 percentage<br />
po<strong>in</strong>ts between 1992 and<br />
2003, and <strong>the</strong> percentage<br />
with Below Basic document<br />
literacy who were employed<br />
full time <strong>in</strong>creased 5 percentage<br />
po<strong>in</strong>ts (figure 17; document<br />
and quantit<strong>at</strong>ive results<br />
not shown). For adults with<br />
Basic prose literacy, 38 per-<br />
Figure 17. Percentage <strong>of</strong> adults <strong>in</strong> each employment<br />
c<strong>at</strong>egory, by prose literacy level: 1992 and 2003<br />
Percent<br />
employed<br />
100<br />
90<br />
80<br />
70<br />
60<br />
50<br />
40<br />
30<br />
20<br />
10<br />
0<br />
10<br />
20<br />
Percent not 30<br />
employed<br />
40<br />
50<br />
60<br />
70<br />
Full time<br />
29<br />
8<br />
6<br />
57<br />
35*<br />
10<br />
5<br />
51*<br />
1992 2003<br />
Below Basic<br />
Part time<br />
42<br />
12<br />
6<br />
40<br />
44<br />
12<br />
6<br />
38<br />
1992 2003<br />
Basic<br />
54<br />
15<br />
5<br />
26<br />
54<br />
14<br />
5<br />
27<br />
1992 2003<br />
Intermedi<strong>at</strong>e<br />
<strong>Literacy</strong> level and year<br />
Unemployed<br />
66<br />
14<br />
3<br />
17<br />
cent were not <strong>in</strong> <strong>the</strong> labor<br />
force and 6 percent were<br />
unemployed.<br />
Sixty-four percent <strong>of</strong> adults<br />
with Pr<strong>of</strong>icient prose literacy<br />
and 54 percent <strong>of</strong> adults with<br />
Intermedi<strong>at</strong>e prose literacy<br />
were employed full time<br />
(figure 17). Eighteen percent<br />
64<br />
14<br />
3<br />
18<br />
1992 2003<br />
Pr<strong>of</strong>icient<br />
Not <strong>in</strong> labor force<br />
* Significantly different from 1992.<br />
NOTE: Detail may not sum to totals because <strong>of</strong> round<strong>in</strong>g.<strong>Adults</strong> are def<strong>in</strong>ed as people 16 years <strong>of</strong> age or older liv<strong>in</strong>g<br />
<strong>in</strong> households. <strong>Adults</strong> who could not be <strong>in</strong>terviewed due to language spoken or cognitive or mental disabilities (3<br />
percent <strong>in</strong> 2003 and 4 percent <strong>in</strong> 1992) are excluded from this figure.<br />
SOURCE: U.S. Department <strong>of</strong> Educ<strong>at</strong>ion, Institute <strong>of</strong> Educ<strong>at</strong>ion Sciences, N<strong>at</strong>ional Center for Educ<strong>at</strong>ion St<strong>at</strong>istics, 1992<br />
N<strong>at</strong>ional Adult <strong>Literacy</strong> Survey and 2003 N<strong>at</strong>ional Assessment <strong>of</strong> Adult <strong>Literacy</strong>.<br />
16
<strong>of</strong> adults with Pr<strong>of</strong>icient prose<br />
literacy and 27 percent <strong>of</strong><br />
adults with Intermedi<strong>at</strong>e prose<br />
literacy were not <strong>in</strong> <strong>the</strong> labor<br />
force; 3 percent <strong>of</strong> adults with<br />
Pr<strong>of</strong>icient prose literacy and 5<br />
percent <strong>of</strong> adults with<br />
Intermedi<strong>at</strong>e prose literacy<br />
were unemployed.<br />
Figure 18. Average prose, document, and quantit<strong>at</strong>ive literacy scores <strong>of</strong> adults, by<br />
employment st<strong>at</strong>us: 1992 and 2003<br />
Average score<br />
500<br />
300<br />
250<br />
200<br />
150<br />
0<br />
290 285* 285 281<br />
A <strong>First</strong> <strong>Look</strong> <strong>at</strong> <strong>the</strong> <strong>Literacy</strong> <strong>of</strong> America’s <strong>Adults</strong> <strong>in</strong> <strong>the</strong> 21 st <strong>Century</strong><br />
Among adults employed full<br />
time, average prose and document<br />
literacy scores decreased<br />
by 5 po<strong>in</strong>ts between 1992<br />
and 2003, while average<br />
quantit<strong>at</strong>ive scores rose by<br />
4 po<strong>in</strong>ts (figure 18). Average<br />
quantit<strong>at</strong>ive literacy also<br />
<strong>in</strong>creased between 1992 and<br />
2003 for adults employed part<br />
Prose Document Quantit<strong>at</strong>ive<br />
263 269<br />
252 255<br />
Full time Part time Unemployed Not <strong>in</strong><br />
labor force<br />
286 281* 279 277<br />
17<br />
261 265<br />
244 250*<br />
Full time Part time Unemployed Not <strong>in</strong><br />
labor force<br />
1992 2003 Employment st<strong>at</strong>us<br />
time and those not <strong>in</strong> <strong>the</strong><br />
labor force.<br />
In 2003, average prose and<br />
document literacy was highest<br />
among adults employed<br />
full or part time (<strong>the</strong> differences<br />
between <strong>the</strong>se groups<br />
were not st<strong>at</strong>istically significant),<br />
and average quantita-<br />
292 296*<br />
281 287*<br />
261 270<br />
261*<br />
247<br />
Full time Part time Unemployed Not <strong>in</strong><br />
labor force<br />
* Significantly different from 1992.<br />
NOTE: <strong>Adults</strong> are def<strong>in</strong>ed as people 16 years <strong>of</strong> age or older liv<strong>in</strong>g <strong>in</strong> households. <strong>Adults</strong> who could not be <strong>in</strong>terviewed due to language spoken or cognitive or mental disabilities<br />
(3 percent <strong>in</strong> 2003 and 4 percent <strong>in</strong> 1992) are excluded from this figure.<br />
SOURCE: U.S. Department <strong>of</strong> Educ<strong>at</strong>ion, Institute <strong>of</strong> Educ<strong>at</strong>ion Sciences, N<strong>at</strong>ional Center for Educ<strong>at</strong>ion St<strong>at</strong>istics, 1992 N<strong>at</strong>ional Adult <strong>Literacy</strong> Survey and 2003 N<strong>at</strong>ional<br />
Assessment <strong>of</strong> Adult <strong>Literacy</strong>.<br />
tive literacy was highest for<br />
adults employed full time<br />
(figure 18). <strong>Literacy</strong> was lowest<br />
across <strong>the</strong> three scales for<br />
adults who were not <strong>in</strong> <strong>the</strong><br />
labor force.
A <strong>First</strong> <strong>Look</strong> <strong>at</strong> <strong>the</strong> <strong>Literacy</strong> <strong>of</strong> America’s <strong>Adults</strong> <strong>in</strong> <strong>the</strong> 21 st <strong>Century</strong><br />
Popul<strong>at</strong>ion and Sample Size, and D<strong>at</strong>a Collection Procedures<br />
The 2003 assessment was<br />
adm<strong>in</strong>istered to a n<strong>at</strong>ionally<br />
represent<strong>at</strong>ive sample <strong>of</strong><br />
19,714 adults ages 16 and<br />
older resid<strong>in</strong>g <strong>in</strong> households<br />
or prisons.<br />
A smaller number <strong>of</strong> respondents<br />
(1,173) were selected<br />
for <strong>the</strong> prison sample and<br />
were <strong>in</strong>terviewed <strong>in</strong> <strong>the</strong> facilities<br />
where <strong>the</strong>y were <strong>in</strong>carcer<strong>at</strong>ed.<br />
Sampled adults resid<strong>in</strong>g<br />
<strong>in</strong> households, but temporarily<br />
<strong>in</strong> jail—where <strong>the</strong><br />
median stay is about two<br />
weeks—would have been<br />
<strong>in</strong>terviewed <strong>at</strong> some o<strong>the</strong>r<br />
time dur<strong>in</strong>g <strong>the</strong> ten month<br />
period <strong>of</strong> d<strong>at</strong>a collection.<br />
The household sample is represent<strong>at</strong>ive<br />
<strong>of</strong> <strong>the</strong> 221,020,000<br />
adults <strong>in</strong> households, while<br />
<strong>the</strong> prison sample is represent<strong>at</strong>ive<br />
<strong>of</strong> <strong>the</strong> 1,380,000 adults<br />
Variable Def<strong>in</strong>itions<br />
Def<strong>in</strong>itions <strong>of</strong> all popul<strong>at</strong>ion<br />
groups presented <strong>in</strong> this report<br />
are available on <strong>the</strong> NAAL website.<br />
<strong>Literacy</strong> results for adults<br />
who <strong>in</strong>dic<strong>at</strong>ed <strong>the</strong>y were<br />
American Indian/Alaska N<strong>at</strong>ive<br />
or Multiracial/O<strong>the</strong>r are not<br />
reported separ<strong>at</strong>ely but are<br />
<strong>in</strong>cluded <strong>in</strong> <strong>the</strong> total popul<strong>at</strong>ion<br />
literacy estim<strong>at</strong>es.<br />
Comparisons between 1992 and<br />
2003 for multiracial adults are not<br />
possible because respondents<br />
were allowed to identify only one<br />
race <strong>in</strong> 1992. In 2003, about 2 per-<br />
<strong>in</strong> prisons <strong>in</strong> 2003.<br />
D<strong>at</strong>a collection for <strong>the</strong><br />
household sample was conducted<br />
between May 2003<br />
and February 2004 and for<br />
<strong>the</strong> prison sample between<br />
March 2004 and July 2004.<br />
The household and prison<br />
samples were comb<strong>in</strong>ed to<br />
cre<strong>at</strong>e a n<strong>at</strong>ional sample represent<strong>at</strong>ive<br />
<strong>of</strong> <strong>the</strong> 222,400,000<br />
American adults <strong>in</strong> households<br />
or prisons.<br />
Adm<strong>in</strong>istr<strong>at</strong>ion procedures for<br />
<strong>the</strong> 2003 assessment were<br />
changed to provide more<br />
accur<strong>at</strong>e d<strong>at</strong>a about English<br />
literacy levels <strong>of</strong> adults. One<br />
change was designed to<br />
<strong>in</strong>crease <strong>the</strong> number <strong>of</strong><br />
Spanish speak<strong>in</strong>g adults who<br />
could particip<strong>at</strong>e <strong>in</strong> <strong>the</strong> study.<br />
In 1992, <strong>the</strong> easy literacy tasks<br />
<strong>at</strong> <strong>the</strong> beg<strong>in</strong>n<strong>in</strong>g <strong>of</strong> <strong>the</strong> assess-<br />
cent <strong>of</strong> respondents identified<br />
multiple races. Due to small sample<br />
sizes, <strong>the</strong> Multiracial and<br />
O<strong>the</strong>r c<strong>at</strong>egories were comb<strong>in</strong>ed.<br />
Results for Multiracial/O<strong>the</strong>r and<br />
American Indian/Alaska N<strong>at</strong>ive<br />
adults, as well as results by<br />
Hispanic orig<strong>in</strong>, will be <strong>in</strong>cluded<br />
<strong>in</strong> future NAAL reports.<br />
All respondents were asked to<br />
report <strong>the</strong>ir birth d<strong>at</strong>es, and this<br />
<strong>in</strong>form<strong>at</strong>ion was used to calcul<strong>at</strong>e<br />
<strong>the</strong>ir age. Age groups<br />
reported are 16 to 18, 19 to 24,<br />
25 to 39, 40 to 49, 50 to 64, and<br />
18<br />
ment were presented <strong>in</strong><br />
English only. In 2003, <strong>the</strong><br />
correspond<strong>in</strong>g tasks were presented<br />
<strong>in</strong> ei<strong>the</strong>r English or<br />
Spanish, although <strong>the</strong> m<strong>at</strong>erials<br />
to be read were presented<br />
only <strong>in</strong> English. As a result,<br />
fewer adults had to be<br />
excluded due to <strong>the</strong> language<br />
<strong>of</strong> <strong>the</strong> <strong>in</strong>terview.<br />
A second change was<br />
designed to make <strong>the</strong> assessment<br />
more like <strong>the</strong> demands<br />
<strong>of</strong> everyday life. In 1992,<br />
respondents were not allowed<br />
to use a calcul<strong>at</strong>or for most<br />
quantit<strong>at</strong>ive literacy questions.<br />
In 2003, respondents had<br />
access to a calcul<strong>at</strong>or.<br />
Allow<strong>in</strong>g respondents to use<br />
calcul<strong>at</strong>ors is consistent with<br />
<strong>the</strong> assessment's functional<br />
def<strong>in</strong>ition <strong>of</strong> literacy. Both <strong>of</strong><br />
<strong>the</strong>se changes require some<br />
caution <strong>in</strong> <strong>in</strong>terpret<strong>in</strong>g <strong>the</strong><br />
65 and older. Age groups were<br />
selected to correspond to <strong>the</strong><br />
key life stages <strong>of</strong> many adults<br />
(though not all adults enter <strong>the</strong><br />
stages <strong>at</strong> <strong>the</strong> ages specified):<br />
■ 16 to 18: Completion <strong>of</strong><br />
secondary educ<strong>at</strong>ion<br />
■ 19 to 24: College or job<br />
tra<strong>in</strong><strong>in</strong>g<br />
■ 25 to 39: Early career<br />
■ 40 to 49: Mid career<br />
■ 50 to 64: L<strong>at</strong>e career<br />
■ 65 and older: Retirement<br />
changes <strong>in</strong> literacy levels from<br />
1992 to 2003, but result <strong>in</strong><br />
<strong>the</strong> ability <strong>of</strong> <strong>the</strong> 2003 assessment<br />
to provide more accur<strong>at</strong>e<br />
d<strong>at</strong>a about <strong>the</strong> English<br />
literacy levels <strong>of</strong> adults.<br />
The f<strong>in</strong>al household sample<br />
response r<strong>at</strong>e was 62 percent<br />
and <strong>the</strong> f<strong>in</strong>al prison sample<br />
response r<strong>at</strong>e was 88 percent.<br />
NCES st<strong>at</strong>istical standards<br />
require a nonresponse bias<br />
analysis when <strong>the</strong> unit<br />
response r<strong>at</strong>e for a sample is<br />
less than 85 percent.The<br />
nonresponse bias analysis <strong>of</strong><br />
<strong>the</strong> household sample revealed<br />
differences <strong>in</strong> <strong>the</strong> background<br />
characteristics <strong>of</strong> respondents<br />
who particip<strong>at</strong>ed <strong>in</strong> <strong>the</strong> assessment<br />
compared to those who<br />
refused. Detailed <strong>in</strong>form<strong>at</strong>ion<br />
about <strong>the</strong> nonresponse bias<br />
analysis is available on <strong>the</strong><br />
NAAL website.<br />
A nonresponse bias adjustment<br />
was performed to<br />
reduce <strong>the</strong> bias due to<br />
respondent refusal.The<br />
adjustment corrected for <strong>the</strong><br />
<strong>in</strong>itial nonresponse bias,<br />
result<strong>in</strong>g <strong>in</strong> negligible bias for<br />
<strong>the</strong> household sample.The<br />
adjustment procedures are<br />
discussed <strong>in</strong> detail <strong>in</strong> <strong>the</strong><br />
forthcom<strong>in</strong>g 2003 NAAL<br />
Technical Report.The analyses<br />
presented <strong>in</strong> this report<br />
are based on d<strong>at</strong>a from <strong>the</strong><br />
corrected household sample<br />
and <strong>the</strong> prison sample.