2010 annual report - touax group
2010 annual report - touax group
2010 annual report - touax group

Create successful ePaper yourself
Turn your PDF publications into a flip-book with our unique Google optimized e-Paper software.
Annual <strong>report</strong> <strong>2010</strong><br />
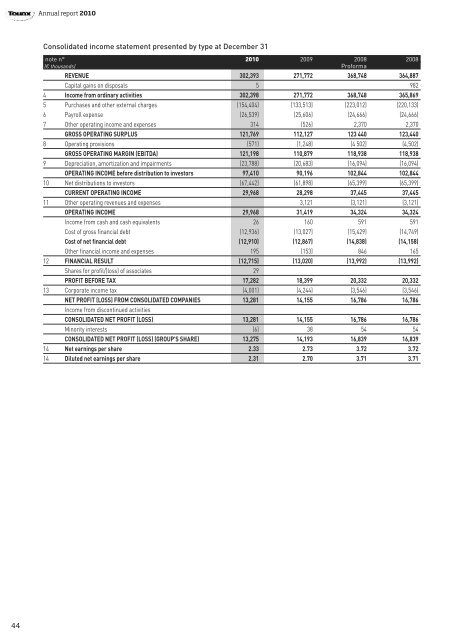
Consolidated income statement presented by type at December 31<br />
note n° <strong>2010</strong> 2009 2008 2008<br />
(€ thousands) Proforma<br />
REVENUE 302,393 271,772 368,748 364,887<br />
Capital gains on disposals 5 982<br />
4 Income from ordinary activities 302,398 271,772 368,748 365,869<br />
5 Purchases and other external charges (154,404) (133,513) (223,012) (220,133)<br />
6 Payroll expense (26,539) (25,606) (24,666) (24,666)<br />
7 Other operating income and expenses 314 (526) 2,370 2,370<br />
GROSS OPERATING SURPLUS 121,769 112,127 123 440 123,440<br />
8 Operating provisions (571) (1,248) (4 502) (4,502)<br />
GROSS OPERATING MARGIN (EBITDA) 121,198 110,879 118,938 118,938<br />
9 Depreciation, amortization and impairments (23,788) (20,683) (16,094) (16,094)<br />
OPERATING INCOME before distribution to investors 97,410 90,196 102,844 102,844<br />
10 Net distributions to investors (67,442) (61,898) (65,399) (65,399)<br />
CURRENT OPERATING INCOME 29,968 28,298 37,445 37,445<br />
11 Other operating revenues and expenses 3,121 (3,121) (3,121)<br />
OPERATING INCOME 29,968 31,419 34,324 34,324<br />
Income from cash and cash equivalents 26 160 591 591<br />
Cost of gross financial debt (12,936) (13,027) (15,429) (14,749)<br />
Cost of net financial debt (12,910) (12,867) (14,838) (14,158)<br />
Other financial income and expenses 195 (153) 846 165<br />
12 FINANCIAL RESULT (12,715) (13,020) (13,992) (13,992)<br />
Shares for profil/(loss) of associates 29<br />
PROFIT BEFORE TAX 17,282 18,399 20,332 20,332<br />
13 Corporate income tax (4,001) (4,244) (3,546) (3,546)<br />
NET PROFIT (LOSS) FROM CONSOLIDATED COMPANIES 13,281 14,155 16,786 16,786<br />
Income from discontinued activities<br />
CONSOLIDATED NET PROFIT (LOSS) 13,281 14,155 16,786 16,786<br />
Minority interests (6) 38 54 54<br />
CONSOLIDATED NET PROFIT (LOSS) (GROUP'S SHARE) 13,275 14,193 16,839 16,839<br />
14 Net earnings per share 2.33 2.73 3.72 3.72<br />
14 Diluted net earnings per share 2.31 2.70 3.71 3.71<br />
44