MelbourneâBrisbane Inland Rail Alignment Study - Australian Rail ...
MelbourneâBrisbane Inland Rail Alignment Study - Australian Rail ...
MelbourneâBrisbane Inland Rail Alignment Study - Australian Rail ...

Create successful ePaper yourself
Turn your PDF publications into a flip-book with our unique Google optimized e-Paper software.
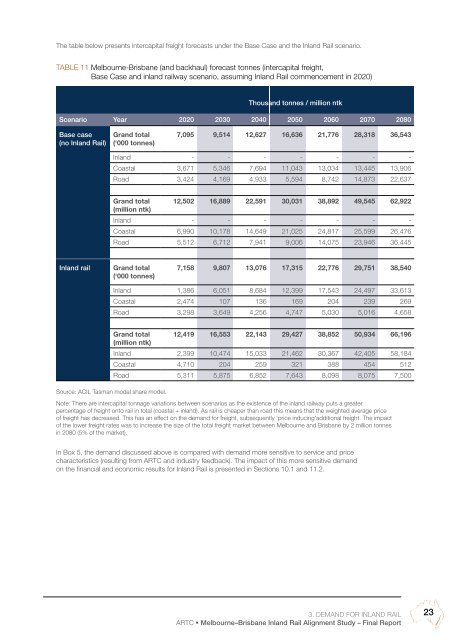
The table below presents intercapital freight forecasts under the Base Case and the <strong>Inland</strong> <strong>Rail</strong> scenario.<br />
Table 11 Melbourne-Brisbane (and backhaul) forecast tonnes (intercapital freight,<br />
Base Case and inland railway scenario, assuming <strong>Inland</strong> <strong>Rail</strong> commencement in 2020)<br />
Thousand tonnes / million ntk<br />
Scenario Year 2020 2030 2040 2050 2060 2070 2080<br />
Base case<br />
(no <strong>Inland</strong> <strong>Rail</strong>)<br />
Grand total<br />
(‘000 tonnes)<br />
7,095 9,514 12,627 16,636 21,776 28,318 36,543<br />
<strong>Inland</strong> - - - - - - -<br />
Coastal 3,671 5,346 7,694 11,043 13,034 13,445 13,906<br />
Road 3,424 4,169 4,933 5,594 8,742 14,873 22,637<br />
Grand total 12,502 16,889 22,591 30,031 38,892 49,545 62,922<br />
(million ntk)<br />
<strong>Inland</strong> - - - - - - -<br />
Coastal 6,990 10,178 14,649 21,025 24,817 25,599 26,476<br />
Road 5,512 6,712 7,941 9,006 14,075 23,946 36,445<br />
<strong>Inland</strong> rail<br />
Grand total<br />
(‘000 tonnes)<br />
7,158 9,807 13,076 17,315 22,776 29,751 38,540<br />
<strong>Inland</strong> 1,386 6,051 8,684 12,399 17,543 24,497 33,613<br />
Coastal 2,474 107 136 169 204 239 269<br />
Road 3,298 3,649 4,256 4,747 5,030 5,016 4,658<br />
Grand total 12,419 16,553 22,143 29,427 38,852 50,934 66,196<br />
(million ntk)<br />
<strong>Inland</strong> 2,399 10,474 15,033 21,462 30,367 42,405 58,184<br />
Coastal 4,710 204 259 321 388 454 512<br />
Road 5,311 5,875 6,852 7,643 8,098 8,075 7,500<br />
Source: ACIL Tasman modal share model.<br />
Note: There are intercapital tonnage variations between scenarios as the existence of the inland railway puts a greater<br />
percentage of freight onto rail in total (coastal + inland). As rail is cheaper than road this means that the weighted average price<br />
of freight has decreased. This has an effect on the demand for freight, subsequently ‘price inducing’additional freight. The impact<br />
of the lower freight rates was to increase the size of the total freight market between Melbourne and Brisbane by 2 million tonnes<br />
in 2080 (5% of the market).<br />
In Box 5, the demand discussed above is compared with demand more sensitive to service and price<br />
characteristics (resulting from ARTC and industry feedback). The impact of this more sensitive demand<br />
on the financial and economic results for <strong>Inland</strong> <strong>Rail</strong> is presented in Sections 10.1 and 11.2.<br />
3. Demand for <strong>Inland</strong> <strong>Rail</strong><br />
ARTC • Melbourne–Brisbane <strong>Inland</strong> <strong>Rail</strong> <strong>Alignment</strong> <strong>Study</strong> – Final Report<br />
23