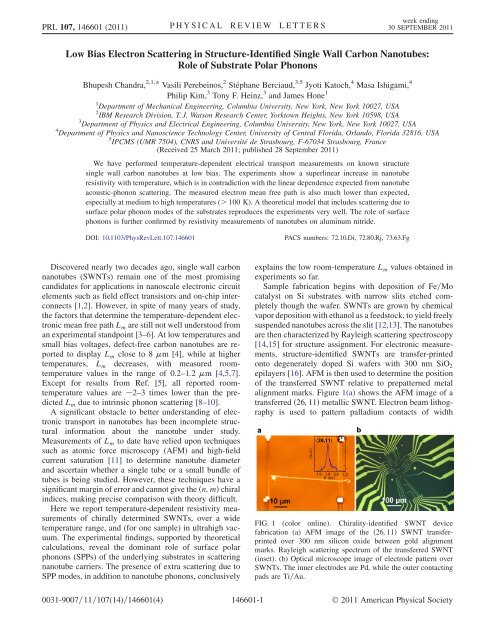
Low Bias Electron Scattering in Structure ... - Researcher - IBM
Low Bias Electron Scattering in Structure ... - Researcher - IBM
Low Bias Electron Scattering in Structure ... - Researcher - IBM

Create successful ePaper yourself
Turn your PDF publications into a flip-book with our unique Google optimized e-Paper software.
PRL 107, 146601 (2011) PHYSICAL REVIEW LETTERS<br />
week end<strong>in</strong>g<br />
30 SEPTEMBER 2011<br />
<strong>Low</strong> <strong>Bias</strong> <strong>Electron</strong> <strong>Scatter<strong>in</strong>g</strong> <strong>in</strong> <strong>Structure</strong>-Identified S<strong>in</strong>gle Wall Carbon Nanotubes:<br />
Role of Substrate Polar Phonons<br />
Bhupesh Chandra, 2,1, * Vasili Perebe<strong>in</strong>os, 2 Stéphane Berciaud, 3,5 Jyoti Katoch, 4 Masa Ishigami, 4<br />
Philip Kim, 3 Tony F. He<strong>in</strong>z, 3 and James Hone 1<br />
1 Department of Mechanical Eng<strong>in</strong>eer<strong>in</strong>g, Columbia University, New York, New York 10027, USA<br />
2 <strong>IBM</strong> Research Division, T. J. Watson Research Center, Yorktown Heights, New York 10598, USA<br />
3 Department of Physics and Electrical Eng<strong>in</strong>eer<strong>in</strong>g, Columbia University, New York, New York 10027, USA<br />
4 Department of Physics and Nanoscience Technology Center, University of Central Florida, Orlando, Florida 32816, USA<br />
5 IPCMS (UMR 7504), CNRS and Université de Strasbourg, F-67034 Strasbourg, France<br />
(Received 25 March 2011; published 28 September 2011)<br />
We have performed temperature-dependent electrical transport measurements on known structure<br />
s<strong>in</strong>gle wall carbon nanotubes at low bias. The experiments show a superl<strong>in</strong>ear <strong>in</strong>crease <strong>in</strong> nanotube<br />
resistivity with temperature, which is <strong>in</strong> contradiction with the l<strong>in</strong>ear dependence expected from nanotube<br />
acoustic-phonon scatter<strong>in</strong>g. The measured electron mean free path is also much lower than expected,<br />
especially at medium to high temperatures (> 100 K). A theoretical model that <strong>in</strong>cludes scatter<strong>in</strong>g due to<br />
surface polar phonon modes of the substrates reproduces the experiments very well. The role of surface<br />
phonons is further confirmed by resistivity measurements of nanotubes on alum<strong>in</strong>um nitride.<br />
DOI: 10.1103/PhysRevLett.107.146601<br />
PACS numbers: 72.10.Di, 72.80.Rj, 73.63.Fg<br />
Discovered nearly two decades ago, s<strong>in</strong>gle wall carbon<br />
nanotubes (SWNTs) rema<strong>in</strong> one of the most promis<strong>in</strong>g<br />
candidates for applications <strong>in</strong> nanoscale electronic circuit<br />
elements such as field effect transistors and on-chip <strong>in</strong>terconnects<br />
[1,2]. However, <strong>in</strong> spite of many years of study,<br />
the factors that determ<strong>in</strong>e the temperature-dependent electronic<br />
mean free path L m are still not well understood from<br />
an experimental standpo<strong>in</strong>t [3–6]. At low temperatures and<br />
small bias voltages, defect-free carbon nanotubes are reported<br />
to display L m close to 8 m [4], while at higher<br />
temperatures, L m decreases, with measured roomtemperature<br />
values <strong>in</strong> the range of 0:2–1:2 m [4,5,7].<br />
Except for results from Ref. [5], all reported roomtemperature<br />
values are 2–3 times lower than the predicted<br />
L m due to <strong>in</strong>tr<strong>in</strong>sic phonon scatter<strong>in</strong>g [8–10].<br />
A significant obstacle to better understand<strong>in</strong>g of electronic<br />
transport <strong>in</strong> nanotubes has been <strong>in</strong>complete structural<br />
<strong>in</strong>formation about the nanotube under study.<br />
Measurements of L m to date have relied upon techniques<br />
such as atomic force microscopy (AFM) and high-field<br />
current saturation [11] to determ<strong>in</strong>e nanotube diameter<br />
and ascerta<strong>in</strong> whether a s<strong>in</strong>gle tube or a small bundle of<br />
tubes is be<strong>in</strong>g studied. However, these techniques have a<br />
significant marg<strong>in</strong> of error and cannot give the ðn; mÞ chiral<br />
<strong>in</strong>dices, mak<strong>in</strong>g precise comparison with theory difficult.<br />
Here we report temperature-dependent resistivity measurements<br />
of chirally determ<strong>in</strong>ed SWNTs, over a wide<br />
temperature range, and (for one sample) <strong>in</strong> ultrahigh vacuum.<br />
The experimental f<strong>in</strong>d<strong>in</strong>gs, supported by theoretical<br />
calculations, reveal the dom<strong>in</strong>ant role of surface polar<br />
phonons (SPPs) of the underly<strong>in</strong>g substrates <strong>in</strong> scatter<strong>in</strong>g<br />
nanotube carriers. The presence of extra scatter<strong>in</strong>g due to<br />
SPP modes, <strong>in</strong> addition to nanotube phonons, conclusively<br />
expla<strong>in</strong>s the low room-temperature L m values obta<strong>in</strong>ed <strong>in</strong><br />
experiments so far.<br />
Sample fabrication beg<strong>in</strong>s with deposition of Fe=Mo<br />
catalyst on Si substrates with narrow slits etched completely<br />
though the wafer. SWNTs are grown by chemical<br />
vapor deposition with ethanol as a feedstock, to yield freely<br />
suspended nanotubes across the slit [12,13]. The nanotubes<br />
are then characterized by Rayleigh scatter<strong>in</strong>g spectroscopy<br />
[14,15] for structure assignment. For electronic measurements,<br />
structure-identified SWNTs are transfer-pr<strong>in</strong>ted<br />
onto degenerately doped Si wafers with 300 nm SiO 2<br />
epilayers [16]. AFM is then used to determ<strong>in</strong>e the position<br />
of the transferred SWNT relative to prepatterned metal<br />
alignment marks. Figure 1(a) shows the AFM image of a<br />
transferred ð26; 11Þ metallic SWNT. <strong>Electron</strong> beam lithography<br />
is used to pattern palladium contacts of width<br />
FIG. 1 (color onl<strong>in</strong>e). Chirality-identified SWNT device<br />
fabrication (a) AFM image of the ð26; 11Þ SWNT transferpr<strong>in</strong>ted<br />
over 300 nm silicon oxide between gold alignment<br />
marks. Rayleigh scatter<strong>in</strong>g spectrum of the transferred SWNT<br />
(<strong>in</strong>set). (b) Optical microscope image of electrode pattern over<br />
SWNTs. The <strong>in</strong>ner electrodes are Pd, while the outer contact<strong>in</strong>g<br />
pads are Ti=Au.<br />
0031-9007=11=107(14)=146601(4) 146601-1 Ó 2011 American Physical Society
PRL 107, 146601 (2011) PHYSICAL REVIEW LETTERS<br />
week end<strong>in</strong>g<br />
30 SEPTEMBER 2011<br />
800 nm over the SWNT with vary<strong>in</strong>g channel lengths<br />
(0:2–20 m, given by the distance between contact edges),<br />
as shown <strong>in</strong> Fig. 1(b).<br />
The conductance of the SWNT devices is measured <strong>in</strong> a<br />
three-term<strong>in</strong>al configuration with the Si wafer as the back<br />
gate. <strong>Low</strong>-frequency lock-<strong>in</strong> measurements are performed<br />
to m<strong>in</strong>imize noise. Figure 2(a) shows device conductance<br />
G vs back gate voltage (V g ) for the ð26; 11Þ metallic<br />
SWNTs for different tube length segments. The ð26; 11Þ<br />
SWNTs possess a small band gap due to curvature and<br />
electron-electron <strong>in</strong>teractions [17,18], which can be seen as<br />
a dip <strong>in</strong> the conductance. Away from the band-gap region,<br />
the current becomes <strong>in</strong>dependent of V g ; we use the<br />
p-channel branch (negative V g ), which has higher conductance<br />
than n-channel due to a lower Schottky barrier [19],<br />
to obta<strong>in</strong> the resistance. In the diffusive regime, the device<br />
resistance is R ¼ L þ h þ R<br />
4e 2 C , where is the nanotube<br />
h<br />
resistivity, L is the channel length, 6:5 k is the<br />
4e 2<br />
resistance of a (fourfold-degenerate) ballistic 1D channel,<br />
and R C is the extra resistance due to imperfect<br />
contacts. To extract , R is plotted as a function of L,<br />
as shown <strong>in</strong> Fig. 2(b); for this device, the slope gives<br />
¼ 9:4 k=m at room temperature. The mean free<br />
path is given by L m ¼ 6:5 k= and is 0:7 m at<br />
room T, at par with the best room-temperature values<br />
published so far [4,7]. For L L m , the SWNT channel<br />
becomes ballistic and R 6:5 kþ R C [Fig. 2(b)]. The<br />
measured value of R C is 2:5 kfor this device, <strong>in</strong>dicat<strong>in</strong>g<br />
that the contacts are highly transparent outside the bandgap<br />
region. Figures 2(c) and 2(d) show the temperature<br />
dependence of the device properties. As expected, both<br />
the resistance [Fig. 2(c)] and resistivity [slope of l<strong>in</strong>es <strong>in</strong><br />
Fig. 2(d)] decrease with decreas<strong>in</strong>g temperature.<br />
In order to provide the best possible data set with which<br />
to compare theory to experiment, the devices were<br />
measured over a wide temperature range (up to 475 K) <strong>in</strong><br />
UHV conditions (5 10 10 T), to rule out contributions<br />
from adsorbate-<strong>in</strong>duced resistivity. Figure 3 shows the<br />
temperature-dependent resistivity of the ð26; 11Þ nanotube,<br />
where was extracted by fitt<strong>in</strong>g R vs L as above. The<br />
resistivity <strong>in</strong>creases with temperature <strong>in</strong> a superl<strong>in</strong>ear fashion,<br />
reach<strong>in</strong>g a value of 25 k=m at 475 K.<br />
Models of electron-phonon scatter<strong>in</strong>g <strong>in</strong> nanotubes predict<br />
a roughly l<strong>in</strong>ear temperature dependence of the resistivity,<br />
which seems to be <strong>in</strong> conflict with the measured data.<br />
For <strong>in</strong>stance, the dot-dashed l<strong>in</strong>e <strong>in</strong> Fig. 3 shows the<br />
resistivity calculated by us<strong>in</strong>g a simple model ðTÞ ¼<br />
static þ e-pðTÞ. Here static is a free parameter represent<strong>in</strong>g<br />
the temperature-<strong>in</strong>dependent resistivity due to defects<br />
and fixed scatter<strong>in</strong>g sites and has a value of 1:8 k=m for<br />
this nanotube. The l<strong>in</strong>ear slope of the resistivity due to<br />
electron-phonon scatter<strong>in</strong>g, e-pðTÞ, is given by the model<br />
for acoustic-phonon scatter<strong>in</strong>g <strong>in</strong> Ref. [5]. Clearly,<br />
the acoustic-phonon carrier scatter<strong>in</strong>g model alone is unable<br />
to expla<strong>in</strong> the observed results, particularly the superl<strong>in</strong>ear<br />
temperature dependence of . It also greatly<br />
underestimates the magnitude of , by a factor of 4 at<br />
high temperature.<br />
20<br />
Data (26,11) SWNT<br />
Model without SPP<br />
Model with SPP<br />
J. Y. Park et al. [5]<br />
ρ(kΩ/µm)<br />
10<br />
FIG. 2 (color onl<strong>in</strong>e). SWNT resistance measurements at<br />
vary<strong>in</strong>g channel lengths (a) G vs V g for the ð26; 11Þ SWNT<br />
(T ¼ 300 K). The dashed l<strong>in</strong>e corresponds to G ¼ 4e 2 =h, conductance<br />
of a fourfold-degenerate sublevel. (b) Log-log plot for<br />
R vs L at T ¼ 300 K. The solid l<strong>in</strong>e is a fit to the data. (c) G vs<br />
V g for a 7 m SWNT section, at 20 K <strong>in</strong>tervals. (d) R vs L at<br />
vary<strong>in</strong>g T.<br />
0<br />
0 100 200 300 400 500<br />
T(K)<br />
FIG. 3 (color onl<strong>in</strong>e). Resistivity vs temperature for the<br />
ð26; 11Þ SWNT. The dot-dashed l<strong>in</strong>e represents the calculated<br />
resistivity orig<strong>in</strong>at<strong>in</strong>g from nanotube acoustic phonons us<strong>in</strong>g<br />
electron scatter<strong>in</strong>g rates from Ref. [5]. Small dashed l<strong>in</strong>es<br />
show the simulation without <strong>in</strong>clud<strong>in</strong>g SPP scatter<strong>in</strong>g. The solid<br />
l<strong>in</strong>e shows model results with SPP scatter<strong>in</strong>g.<br />
146601-2
PRL 107, 146601 (2011) PHYSICAL REVIEW LETTERS<br />
week end<strong>in</strong>g<br />
30 SEPTEMBER 2011<br />
In order to exam<strong>in</strong>e whether the observed superl<strong>in</strong>ear<br />
temperature dependence of could arise from SWNT<br />
optical phonon modes [20], a numerical model is developed<br />
that calculates T ð Þ by solv<strong>in</strong>g the Boltzmann transport<br />
equation us<strong>in</strong>g a s<strong>in</strong>gle electron-phonon coupl<strong>in</strong>g<br />
g ¼ 5:3 eV= A [9]. This value of g provides the strength<br />
of the scatter<strong>in</strong>g matrix element with all the vibrational<br />
modes <strong>in</strong> the carbon nanotube (CNT) structure described<br />
by the phonon model [21]. The small-dashed l<strong>in</strong>e <strong>in</strong> Fig. 3<br />
represents the results from this model for the measured<br />
ð26; 11Þ SWNT. This model does <strong>in</strong>deed cause nonl<strong>in</strong>earity<br />
<strong>in</strong> T ð Þ. However, the calculated magnitude of the additional<br />
scatter<strong>in</strong>g is not sufficient to expla<strong>in</strong> the experiments.<br />
More fundamentally, the onset of optical phonon<br />
scatter<strong>in</strong>g ( 300 K) reflects the frequency of the radial<br />
breath<strong>in</strong>g mode, which has a well-established dependence<br />
on nanotube structure. Therefore, use of a structurally<br />
def<strong>in</strong>ed nanotube allows us to def<strong>in</strong>itively rule out radial<br />
breath<strong>in</strong>g mode scatter<strong>in</strong>g as the source of the observed<br />
superl<strong>in</strong>ear T ð Þ behavior from 100 to 300 K.<br />
Rul<strong>in</strong>g out contributions from acoustic and optical nanotube<br />
phonons as well as adsorbate-<strong>in</strong>duced scatter<strong>in</strong>g<br />
leaves only phonon modes of the underly<strong>in</strong>g substrates as<br />
a probable cause for the low electronic mean free path<br />
observed <strong>in</strong> the experiments. Similar substrate phonons<br />
have been shown to play a large role <strong>in</strong> transport properties<br />
of graphene [22], and a theoretical study on semiconduct<strong>in</strong>g<br />
SWNTs predicted the SPP modes to be important [23].<br />
To <strong>in</strong>vestigate the role of SPP scatter<strong>in</strong>g on metallic SWNT<br />
transport, its effect is <strong>in</strong>cluded <strong>in</strong> the resistivity calculations<br />
for the ð26; 11Þ SWNT. The strength of the SPP<br />
phonon scatter<strong>in</strong>g depends on the distance from the CNT<br />
to the polar substrate h and the dielectric properties of the<br />
substrate [24]. The coupl<strong>in</strong>g is strongest when the azimuthal<br />
angular momentum is conserved [25], for which case<br />
the scatter<strong>in</strong>g rate of an electron with momentum k has the<br />
form [23]<br />
1<br />
k<br />
¼ 2 @<br />
Z<br />
dq<br />
e 2 @! so<br />
<br />
e 2hq<br />
<br />
1<br />
1 þ 1<br />
<br />
1<br />
0 þ 1<br />
p<br />
qd ffiffiffiffiffiffiffiffiffiffiffiffiffiffiffiffiffiffiffiffiffiffiffiffiffiffiffi ½n so ð" k " kþq þ @! so Þ<br />
2qðd þ 2hÞ<br />
þð1 þ n so Þð" k " kþq @! so ÞŠ; (1)<br />
where 0 and 1 are the low- and high-frequency dielectric<br />
constants of the polar substrate, respectively, d is the<br />
tube diameter, @! so is the SPP energy, and n so is the Bose-<br />
E<strong>in</strong>ste<strong>in</strong> occupation number, which leads to the activated<br />
temperature dependence. These material properties can be<br />
measured <strong>in</strong>dependently, and we use their values for<br />
SiO 2 [25] and AlN [26]. The distance from the CNT to<br />
the substrate is fixed at the van der Waals distance of<br />
h ¼ 3:5 A. The temperature dependence shown <strong>in</strong> Fig. 3<br />
is measured when the device is <strong>in</strong> the on state, i.e.,<br />
V g -V n ¼ 8V, where V n is a gate voltage correspond<strong>in</strong>g<br />
to the CNT <strong>in</strong> the charge neutral state. Us<strong>in</strong>g a<br />
classical electrostatic capacitance C g ¼ 2"" 0 =lnð4t=dÞ<br />
0:34 pF=cm for the CNT on t ¼ 300 nm SiO 2 with " ¼ 3:9,<br />
we can estimate a charge carrier density of n 1:7e=nm.<br />
For such a charge carrier density, the Fermi level is expected<br />
to lie with<strong>in</strong> the first metallic band <strong>in</strong> a 2 nm<br />
diameter CNT. Figure 3 shows the simulated temperaturedependent<br />
resistivity <strong>in</strong>clud<strong>in</strong>g SPP scatter<strong>in</strong>g for this<br />
dop<strong>in</strong>g level (solid l<strong>in</strong>e). The SPP model accurately predicts<br />
the superl<strong>in</strong>ear trend as well as absolute resistivity<br />
values. The robustness of the fit, particularly its dependence<br />
on the distance to the substrate h, is discussed <strong>in</strong><br />
detail <strong>in</strong> Ref. [27]. When h is changed by 30%, there is a<br />
15%–20% change observed <strong>in</strong> (400 K). Most importantly,<br />
because the onset temperature of SPP scatter<strong>in</strong>g<br />
depends only on the known SPP energy, the close agreement<br />
between the theory and experiment for the onset of<br />
superl<strong>in</strong>ear behavior <strong>in</strong> T ð Þ at 100 K provides direct<br />
evidence for the SPP scatter<strong>in</strong>g mechanism that does not<br />
depend on any adjustable parameters.<br />
This significant effect of SPP scatter<strong>in</strong>g <strong>in</strong> SWNTs<br />
suggests that dielectric materials with higher SPP frequencies<br />
should <strong>in</strong>crease the room-temperature mean free path.<br />
To observe the effect of chang<strong>in</strong>g substrate material on SPP<br />
L m (µm)<br />
L m (µm)<br />
4<br />
1<br />
0.2<br />
2<br />
1<br />
(a)<br />
Silicon Oxide<br />
(b)<br />
Alum<strong>in</strong>um Nitride<br />
0.3<br />
20 100 700<br />
T (K)<br />
FIG. 4 (color onl<strong>in</strong>e). SWNT mean free path vs temperature on<br />
SiO 2 and AlN surfaces. (a) L m vs T for the ð26; 11Þ SWNT on<br />
SiO 2 . (b) L m vs T for a ð17; 15) semiconduct<strong>in</strong>g SWNT with<br />
d 2:2 nmon AlN. In both plots, the dashed l<strong>in</strong>es represent<br />
simulation results us<strong>in</strong>g nanotube phonons only, while the solid<br />
l<strong>in</strong>es represent results with SPP phonons <strong>in</strong>cluded. Vertical<br />
dotted l<strong>in</strong>es represent the temperature where tube phonon calculations<br />
diverge from SPP calculations.<br />
146601-3
PRL 107, 146601 (2011) PHYSICAL REVIEW LETTERS<br />
week end<strong>in</strong>g<br />
30 SEPTEMBER 2011<br />
scatter<strong>in</strong>g, a 2 nm diameter semiconduct<strong>in</strong>g SWNT<br />
(with undeterm<strong>in</strong>ed chirality) is transfer-pr<strong>in</strong>ted on an<br />
AlN layer deposited over degenerately doped silicon.<br />
Figure 4 compares the temperature dependence of L m for<br />
the previously described ð26; 11Þ SWNT on SiO 2 and the<br />
semiconduct<strong>in</strong>g SWNT on AlN. The fitted l<strong>in</strong>es represent<br />
the numerical model results with and without the <strong>in</strong>clusion<br />
of SPP scatter<strong>in</strong>g from respective substrates. The numerical<br />
model accurately predicts the experiments on the AlN<br />
surface (at n ¼ 1:1e=nm). The vertical dotted l<strong>in</strong>es po<strong>in</strong>t to<br />
the onset temperature of the SPP scatter<strong>in</strong>g modes. It is<br />
clear from Fig. 4 that AlN surface phonon modes start<br />
contribut<strong>in</strong>g to carrier scatter<strong>in</strong>g at a much higher temperature<br />
than on SiO 2 . This provides further confirmation of the<br />
SPP scatter<strong>in</strong>g model and also <strong>in</strong>dicates that substrate<br />
materials with higher SPP energies such as AlN should<br />
<strong>in</strong>crease the performance of nanotube-based devices near<br />
room temperature. We note that, although it would have<br />
been preferable to use known-chirality nanotubes for both<br />
tests, the model shows weak dependence of SPP scatter<strong>in</strong>g<br />
on chirality [27].<br />
In summary, we have measured the temperaturedependent<br />
resistivity of a known-chirality metallic<br />
SWNT over a wide temperature range, <strong>in</strong> UHV. Our measurements<br />
elim<strong>in</strong>ate adsorbates, acoustic phonons, and<br />
optical phonons as the cause for the anomalously low L m<br />
measured for SWNTs and identify the SPP modes as the<br />
dom<strong>in</strong>ant scatterers. The experiments on SWNTs<br />
deposited over an AlN surface are consistent with this<br />
conclusion. The accompany<strong>in</strong>g theoretical analysis that<br />
<strong>in</strong>cludes the <strong>in</strong>tr<strong>in</strong>sic and SPP phonon modes reproduces<br />
the experiments very well. These results po<strong>in</strong>t towards the<br />
importance of substrate selection <strong>in</strong> maximiz<strong>in</strong>g the electronic<br />
mean free path <strong>in</strong> SWNTs.<br />
We acknowledge support from the National Science<br />
Foundation under collaborative Grants No. DMR-<br />
1006230 (M. I.) and No. DMR-1006533 (J. H.), the<br />
U.S. Department of Energy under Grant No. DE-FG02-<br />
07ER15842 (T. F. H.), Honda Motor Company, and Intel<br />
Company. B. C. was funded by an Intel PhD Fellowship.<br />
*To whom all correspondence should be addressed.<br />
bchandr@us.ibm.com<br />
[1] S. List et al., Microelectron. Eng. 83, 2200 (2006).<br />
[2] R. H. Baughman, A. A. Zakhidov, and W. A. de Heer,<br />
Science 297, 787 (2002).<br />
[3] A. Javey et al., Phys. Rev. Lett. 92, 106804 (2004).<br />
[4] M. S. Purewal et al., Phys. Rev. Lett. 98, 186808<br />
(2007).<br />
[5] J. Y. Park et al., Nano Lett. 4, 517 (2004).<br />
[6] D. Mann et al., Nano Lett. 3, 1541 (2003).<br />
[7] P. Sundqvist et al., Nano Lett. 7, 2568 (2007).<br />
[8] C. L. Kane et al., Europhys. Lett. 41, 683 (1998).<br />
[9] V. Perebe<strong>in</strong>os, J. Tersoff, and P. Avouris, Phys. Rev. Lett.<br />
94, 086802 (2005).<br />
[10] G. Penn<strong>in</strong>gton and N. Goldsman, Phys. Rev. B 68, 045426<br />
(2003).<br />
[11] Z. Yao, C. L. Kane, and C. Dekker, Phys. Rev. Lett. 84,<br />
2941 (2000).<br />
[12] L. M. Huang et al., J. Phys. Chem. B 108, 16 451<br />
(2004).<br />
[13] B. Chandra et al., Phys. Status Solidi B 243, 3359<br />
(2006).<br />
[14] M. Y. Sfeir et al., Science 312, 554 (2006).<br />
[15] M. Y. Sfeir et al., Science 306, 1540 (2004).<br />
[16] X. M. H. Huang et al., Nano Lett. 5, 1515 (2005).<br />
[17] M. Ouyang et al., Science 292, 702 (2001).<br />
[18] V. V. Deshpande et al., Science 323, 106 (2009).<br />
[19] S. He<strong>in</strong>ze et al., Phys. Rev. Lett. 89, 106801 (2002).<br />
[20] E. Pop et al., J. Appl. Phys. 101, 093710 (2007).<br />
[21] V. Perebe<strong>in</strong>os and J. Tersoff, Phys. Rev. B 79, 241409<br />
(2009).<br />
[22] J. H. Chen et al., Nature Nanotech. 3, 206 (2008).<br />
[23] V. Perebe<strong>in</strong>os et al., Nano Lett. 9, 312 (2009).<br />
[24] S. Q. Wang and G. D. Mahan, Phys. Rev. B 6, 4517<br />
(1972).<br />
[25] A. G. Petrov and S. V. Rotk<strong>in</strong>, JETP Lett. 84, 156<br />
(2006).<br />
[26] M. V. Fischetti, D. A. Neumayer, and E. A. Cartier, J.<br />
Appl. Phys. 90, 4587 (2001).<br />
[27] See Supplemental Material at http://l<strong>in</strong>k.aps.org/<br />
supplemental/10.1103/PhysRevLett.107.146601 for dependence<br />
of the CNT mean free path on the surface to<br />
CNT distance and CNT chirality.<br />
146601-4
SUPPORTING INFORMATION<br />
<strong>Low</strong> bias electron scatter<strong>in</strong>g <strong>in</strong> structure-identified s<strong>in</strong>gle wall carbon nanotubes:<br />
Role of substrate polar phonons<br />
Bhupesh Chandra* #† , Vasilli Perebe<strong>in</strong>os # , Stéphane Berciaud § , Jyoti Katoch ‡ , Masa<br />
Ishigami ‡ , Philip Kim § , Tony F. He<strong>in</strong>z § , James Hone †<br />
† Department of Mechanical Eng<strong>in</strong>eer<strong>in</strong>g, Columbia University, New York, NY10027<br />
# <strong>IBM</strong> Research Division, T.J. Watson Research Center, Yorktown Heights, NY10598<br />
§ Department of Physics, Columbia University, New York, NY 10027<br />
‡ Department of Physics and Nanoscience Technology Center, University of Central<br />
Florida, Orlando, FL 32816<br />
Effect of surface to CNT distance (h) on electronic mean free path<br />
4<br />
L m (μm)<br />
1<br />
SPP Activation Temperature (SiO 2 )<br />
h = 2.5 Å<br />
h = 3.5 Å<br />
h = 5.0 Å<br />
h = Inf<strong>in</strong>ite<br />
0.2<br />
20 100 700<br />
T (K)<br />
Fig. S1. Model results for mean free path (L m ) dependence on temperature (T) at<br />
vary<strong>in</strong>g surface to nanotube distance (h) for the (26,11) metallic CNT on SiO 2
It is clear from Fig. S1 that chang<strong>in</strong>g ‘h’ (~±30% of h=3.5 Å used <strong>in</strong> manuscript)<br />
does not change the activation temperature, which depends on the phonon energies<br />
of bottom substrates only. In fact, the magnitudes of resistivity changes only by a<br />
factor of 15-20% at T=400K between these h-values. This proves that even if the<br />
‘h’ is changed, the argument for SPP scatter<strong>in</strong>g still rema<strong>in</strong>s valid.<br />
Gate Voltage dependence of CNT Resistivity<br />
The plot for resistivity vs. gate voltage for the (26, 11) metallic CNT is shown <strong>in</strong><br />
the follow<strong>in</strong>g figure:<br />
120.0<br />
100.0<br />
ρ (kΩ/μm)<br />
80.0<br />
60.0<br />
40.0<br />
20.0<br />
0.0<br />
-8 -6 -4 -2 0 2 4 6 8 10 12<br />
V G<br />
-V n<br />
(V)<br />
Fig. S2. Experimental dataset for resistivity (ρ) vs. gate voltage (V g -V n ) for<br />
(26,11) CNT at T=300K.<br />
The resistivity <strong>in</strong>creases dramatically near the charge neutrality po<strong>in</strong>t (Fig. S2).<br />
This modulation <strong>in</strong> resistivity comes from two factors:<br />
1. Curvature <strong>in</strong>duced band gap<br />
2. <strong>Electron</strong>-electron <strong>in</strong>teraction ( Mott <strong>in</strong>sulat<strong>in</strong>g state)<br />
The second effect is found to be much larger than the first one, for details please<br />
refer to author’s previous published work on “Mott Insulat<strong>in</strong>g State <strong>in</strong> Ultraclean
Carbon Nanotubes”, Science, 323, p.106 (2009). The region near charge neutrality<br />
po<strong>in</strong>t is more affected by many-body <strong>in</strong>teractions. Whereas, resistivity away from<br />
charge neutrality po<strong>in</strong>t comes primarily from phonon scatter<strong>in</strong>g, hence it’s easier<br />
to ascerta<strong>in</strong> phonon contribution <strong>in</strong> this region.<br />
Chirality dependence of CNT resistivity<br />
The results from numerical simulation predict a very small dependence on tube<br />
chirality. Figure 4b <strong>in</strong> manuscript uses a tube chirality of (28, 0) with a diameter of<br />
2.2 nm. Fig. S3 shows the temperature dependence of the resistivity for (17,15)<br />
and (21,11) and (28,0) CNTs due to tube phonon and SPP modes. These CNTs<br />
have the same diameter but very different chiral angles. It is clear that the SPP<br />
scatter<strong>in</strong>g has very little or no dependence on tube chirality.<br />
2<br />
L m<br />
(μm)<br />
1<br />
(17,15)<br />
(21,11)<br />
(28,00)<br />
0.3<br />
20 100 700<br />
T (K)<br />
Fig. S3. Model results with SPP scatter<strong>in</strong>g for different chirality semiconduct<strong>in</strong>g<br />
CNTs with d=2.2 nm placed over AlN substrate.