Hongkong Land Holdings Limited - Bermuda Stock Exchange
Hongkong Land Holdings Limited - Bermuda Stock Exchange
Hongkong Land Holdings Limited - Bermuda Stock Exchange

Create successful ePaper yourself
Turn your PDF publications into a flip-book with our unique Google optimized e-Paper software.
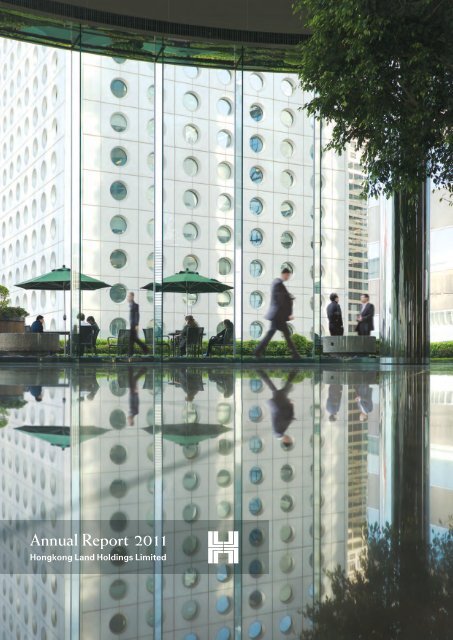
Annual Report 2011<br />
<strong>Hongkong</strong> <strong>Land</strong> <strong>Holdings</strong> <strong>Limited</strong>
Jardine House as seen from The Rotunda,<br />
<strong>Exchange</strong> Square. Both properties are part<br />
of <strong>Hongkong</strong> <strong>Land</strong>’s Central portfolio<br />
(front cover).<br />
Contents<br />
Corporate Overview 1<br />
Corporate Information 2<br />
Highlights 3<br />
Chairman’s Statement 4<br />
Chief Executive’s Review 6<br />
Financial Review 12<br />
Directors’ Profiles 18<br />
Financial Statements 20<br />
Independent Auditors’ Report 61<br />
Five Year Summary 62<br />
Responsibility Statement 63<br />
Corporate Governance 64<br />
Principal Risks and Uncertainties 68<br />
Shareholder Information 69<br />
Offices 70<br />
Report of the Valuers 71<br />
Major Property Portfolio 72
is one of Asia’s leading property<br />
investment, management and development groups. Founded<br />
in Hong Kong in 1889, <strong>Hongkong</strong> <strong>Land</strong>’s business is built on<br />
partnership, integrity and excellence.<br />
In Hong Kong, the Group owns and manages some 450,000 sq. m.<br />
(five million sq. ft) of prime commercial space that defines the<br />
heart of the Central Business District. In Singapore, it has been<br />
instrumental in the creation of the city-state’s new Central<br />
Business District at Marina Bay with the expansion of its joint<br />
venture portfolio of new developments. <strong>Hongkong</strong> <strong>Land</strong>’s<br />
properties in these and other Asian centres are recognised as<br />
market leaders and house the world’s foremost financial, business<br />
and luxury retail names.<br />
<strong>Hongkong</strong> <strong>Land</strong> develops premium residential properties in a<br />
number of cities in the region, principally in China and Singapore<br />
where its subsidiary, MCL <strong>Land</strong>, is a significant developer.<br />
<strong>Hongkong</strong> <strong>Land</strong> <strong>Holdings</strong> <strong>Limited</strong> is incorporated in <strong>Bermuda</strong>.<br />
It has a premium listing on the London <strong>Stock</strong> <strong>Exchange</strong>, and<br />
secondary listings in <strong>Bermuda</strong> and Singapore. The Group’s assets<br />
and investments are managed from Hong Kong by <strong>Hongkong</strong><br />
<strong>Land</strong> <strong>Limited</strong>. <strong>Hongkong</strong> <strong>Land</strong> is a member of the Jardine<br />
Matheson Group.<br />
Annual Report 2011 1
Corporate Information<br />
Directors<br />
Simon Keswick Chairman<br />
Ben Keswick Managing Director<br />
Y.K. Pang Chief Executive<br />
Charles Allen-Jones<br />
Mark Greenberg<br />
Jenkin Hui<br />
Adam Keswick<br />
Sir Henry Keswick<br />
Lord Leach of Fairford<br />
Dr Richard Lee<br />
A.J.L. Nightingale<br />
Lord Powell of Bayswater KCMG<br />
James Watkins<br />
Percy Weatherall<br />
John R. Witt<br />
<strong>Hongkong</strong> <strong>Land</strong> <strong>Limited</strong><br />
Directors<br />
Ben Keswick Chairman<br />
Y.K. Pang Chief Executive<br />
R.M.J. Chow<br />
R. Garman<br />
Mark Greenberg<br />
Adam Keswick<br />
D.P. Lamb<br />
N. Leung<br />
James Riley<br />
J.A. Robinson<br />
Giles White<br />
John R. Witt Chief Financial Officer<br />
R. Wong<br />
Company Secretary and<br />
Registered Office<br />
John C. Lang<br />
Jardine House<br />
33–35 Reid Street<br />
Hamilton<br />
<strong>Bermuda</strong><br />
Corporate Secretary<br />
N.M. McNamara<br />
2<br />
<strong>Hongkong</strong> <strong>Land</strong>
Highlights<br />
• Strong commercial leasing performance<br />
• Lower underlying profit due to fewer Singapore residential completions<br />
• Net assets per share up 22% on higher capital values<br />
• Prime commercial site secured in Beijing<br />
Results<br />
2011 2010 Change<br />
US$m US$m %<br />
Underlying profit attributable to shareholders* 703 810 (13 )<br />
Profit attributable to shareholders 5,306 4,739 12<br />
Shareholders’ funds 24,739 19,457 27<br />
Net debt 2,359 2,358 –<br />
US¢ US¢ %<br />
Underlying earnings per share 30.29 36.02 (16 )<br />
Earnings per share 228.48 210.70 8<br />
Dividends per share 16.00 16.00 –<br />
US$ US$ %<br />
Net asset value per share 10.58 8.64 22<br />
* The Group uses ‘underlying profit attributable to shareholders’ in its internal financial reporting to distinguish between ongoing business performance and<br />
non-trading items, as more fully described in Note 1 to the financial statements. Management considers this to be a key measure which provides<br />
additional information to enhance understanding of the Group’s underlying business performance.<br />
Annual Report 2011 3
Chairman’s Statement<br />
Overview<br />
The Group’s office and retail portfolio in Hong Kong<br />
produced strong results, and its growing Singapore<br />
portfolio made an increased contribution. This<br />
improvement was, however, more than offset by<br />
lower profits from its residential business with only one<br />
Singapore project completed during the year compared<br />
with three last year. Several new development sites<br />
were secured in the year, including a prime commercial<br />
site in central Beijing and residential sites in Chongqing<br />
and Singapore.<br />
Performance<br />
Underlying profit attributable to shareholders for 2011<br />
was US$703 million, 13% below the record result of<br />
2010. Underlying earnings per share decreased by<br />
16%, which also reflected the larger number of issued<br />
shares due to the conversion of convertible bonds<br />
during the year.<br />
Taking into account the net gains resulting from higher<br />
independent valuations of the Group’s investment<br />
properties, including its share of properties in joint<br />
ventures, the profit attributable to shareholders<br />
for 2011 was US$5,306 million, compared with<br />
US$4,739 million for 2010. Net asset value per share<br />
was US$10.58, a 22% increase from the end of 2010.<br />
The Directors are recommending a final dividend of<br />
US¢10.00 per share for 2011, providing a total dividend<br />
for the year of US¢16.00 per share, unchanged<br />
from 2010.<br />
Group Review<br />
In Hong Kong, limited new supply of office space<br />
underpinned the market in 2011 against a background<br />
of increasing economic uncertainties. Rental reversions<br />
were largely positive, particularly in the second half,<br />
and vacancy stood at only 2.0% at the year end<br />
compared with 2.9% at the end of 2010. The Group’s<br />
luxury retail portfolio continued to enjoy full occupancy<br />
with increasing rents.<br />
In Singapore, where market conditions remained<br />
stable, the Group benefited from its first full year’s<br />
rental income from the initial two towers of Marina Bay<br />
Financial Centre. The third tower of this development,<br />
which will complete during 2012, is 65% pre-let. At the<br />
Group’s joint venture office development in Jakarta<br />
pre-letting of the fourth tower currently under<br />
construction is now some 80%.<br />
In August, a prime site was secured in Wangfujing,<br />
Beijing which will be developed as a premier retail<br />
centre including a small luxury hotel. The Group also<br />
acquired a property portfolio in Cambodia including<br />
two sites in Phnom Penh for future development.<br />
On the residential side, a further 23 apartments in the<br />
Serenade development in Hong Kong were handed<br />
over to buyers in the year. In Macau, at the One<br />
Central joint venture, 75 units of the project’s final<br />
phase, The Residences & Apartments at Mandarin<br />
Oriental, were handed over to buyers.<br />
In Singapore, only one residential project, Peak@Balmeg<br />
was completed, compared with three projects in 2010.<br />
The three new projects launched for sale in 2011 were<br />
well received and there was a US$44 million reversal<br />
of writedowns previously made in respect of two<br />
of the projects. A site for future development was<br />
acquired in May.<br />
In mainland China, continuing development profits<br />
were earned from 50%-owned Bamboo Grove in<br />
Chongqing and 90%-owned Maple Place in Beijing.<br />
Mid-year sales launches in Chongqing and Shenyang<br />
were well received despite difficult market conditions.<br />
However, sales volumes across the market have<br />
now decreased significantly in response to various<br />
government measures. In December, a 52 hectare site<br />
was secured in Chongqing for a premium residential<br />
development which is adjacent to the Group’s existing<br />
Yorkville project.<br />
4<br />
<strong>Hongkong</strong> <strong>Land</strong>
People<br />
The Group’s excellent reputation for the quality of its<br />
commercial and residential projects and our ongoing<br />
performance reflects the high level of professionalism,<br />
commitment and diligence of our staff which is<br />
much appreciated.<br />
R.C. Kwok retired from the Board on 12th May 2011.<br />
Anthony Nightingale will step down as Managing<br />
Director at the end of March 2012, and will remain as a<br />
non-executive Director. On behalf of the Board, I would<br />
like to thank them for their significant contributions to<br />
the Group. We also welcome Ben Keswick, who will<br />
join the Board as Managing Director on 1st April 2012,<br />
and Adam Keswick, who will become a Director on<br />
the same date.<br />
Outlook<br />
General economic uncertainty is likely to have a<br />
negative influence on the Group’s businesses. In<br />
addition, in 2012 the Group has only one residential<br />
project scheduled for completion in Singapore and<br />
residential sales, particularly in China, may be more<br />
challenging. Nevertheless, the Hong Kong portfolio<br />
should continue to benefit from the limited supply of<br />
new commercial space and the Group’s financial and<br />
market position is strong.<br />
Simon Keswick<br />
Chairman<br />
1st March 2012<br />
Annual Report 2011 5
Chief Executive’s Review<br />
The Group’s well-positioned commercial property<br />
portfolio produced an increased contribution in 2011<br />
and significant capital appreciation, but underlying<br />
profitability was lower than the previous two years<br />
following a reduction in earnings from residential<br />
developments which had made record results in<br />
both these years.<br />
Our intention is to continue to upgrade the office space<br />
throughout the portfolio, ensuring it remains the most<br />
prestigious within Hong Kong. At the same time, we<br />
will seek to grow our rental yields over the long term,<br />
recognising the desirability of both the quality of space<br />
and of service which it is <strong>Hongkong</strong> <strong>Land</strong>’s mandate<br />
to provide to each of our tenants.<br />
Business Model and Strategy<br />
Hong Kong’s Central Portfolio<br />
The Group’s most important investment is its prime<br />
portfolio in the heart of Hong Kong’s Central district<br />
of some 450,000 sq. m. of Grade A office and luxury<br />
retail space. The location of this portfolio and its<br />
significant size provides a strong competitive position<br />
to the Group. Continued focus on the returns from<br />
this portfolio is fundamental to the ongoing success<br />
of the Group. While demand for space depends on<br />
overall economic conditions, the tenor of the lease<br />
arrangements provides some protection against<br />
market volatility.<br />
We continue to manage our 12 Grade A office and<br />
retail buildings as a large, integrated mixed-use<br />
development and look for opportunities to improve<br />
their value. In December 2011, we announced that one<br />
of these buildings, The Forum in <strong>Exchange</strong> Square,<br />
which was previously retail space, will be redeveloped<br />
as a high quality office building. At the same time,<br />
significant enhancements will be made to the<br />
surrounding <strong>Exchange</strong> Square Plaza.<br />
Retail space in the Central portfolio totals 55,000 sq. m.<br />
and our objective is to ensure that this continues to<br />
be viewed as the most exclusive shopping and dining<br />
destination in Hong Kong. In turn, this contributes<br />
significantly to the prestige and convenience of the<br />
office space, which increases its attraction for premium<br />
tenants. The restaurants across the portfolio, several<br />
of which have been recognised with Michelin stars,<br />
are performing well and are attracting customers to<br />
Central throughout the day and in the evenings.<br />
2006 42% Banks and other financial services<br />
22% Legal 4% Property<br />
9% Accounting 3% Trading<br />
6% Governments 14% Others<br />
2011 39% Banks and other financial services<br />
27% Legal<br />
5% Property<br />
9% Accounting 3% Trading<br />
5% Governments 12% Others<br />
Central portfolio tenant profile<br />
by area occupied<br />
6<br />
<strong>Hongkong</strong> <strong>Land</strong>
Top five office tenants (in alphabetical order)<br />
in 2011<br />
BNP Paribas<br />
Credit Suisse<br />
JPMorgan<br />
KPMG<br />
PricewaterhouseCoopers<br />
Top five retail tenants (in alphabetical order)<br />
in 2011<br />
Dickson Concepts<br />
Giorgio Armani<br />
Gucci<br />
Louis Vuitton<br />
Richemont Group<br />
Commercial Property Investments in Asia<br />
Over the past few years, the Group has extended its<br />
commercial property interests outside of Hong Kong.<br />
Expansion has been based both on the Group’s strong<br />
financial position and its reputation for quality. To date,<br />
the principal focus has been in Singapore where the<br />
Group now has attributable interests of 164,000 sq. m.<br />
(including its share of properties held through joint<br />
ventures). This is principally premium Grade A office<br />
space and includes the third tower of Marina Bay<br />
Financial Centre which is due for completion in 2012.<br />
The intention is also to develop further the Group’s<br />
portfolio of prime office space in Jakarta which is held<br />
by a 50%-owned joint venture. Construction of a<br />
fourth office tower of 61,000 sq. m. is on schedule<br />
for completion in 2012. In general, our performance<br />
in each of these markets depends on the levels<br />
of demand for and supply of commercial space,<br />
both of which are influenced by the overall<br />
economic environment.<br />
We continue to look for attractive high-quality<br />
commercial projects throughout Asia which will<br />
offer development profits as well as providing<br />
investments to be held for long-term returns including<br />
capital appreciation. In 2011, we secured an iconic<br />
site in Wangfujing located in the heart of Beijing for<br />
approximately US$450 million, which we will develop<br />
and position as the most prestigious shopping and<br />
dining destination in the city. This mixed-use project of<br />
some 131,000 sq. m. will also include a small luxury<br />
hotel and office component. A property portfolio<br />
in Cambodia, principally in Phnom Penh, was also<br />
acquired in 2011. Planning has already commenced<br />
for development of one of these prime sites as a high<br />
quality office and retail complex.<br />
Residential Developments<br />
Based on the Group’s experience throughout Asia,<br />
a strong and profitable residential business has been<br />
established, focusing on premium properties. While<br />
our investment in this activity is significantly smaller<br />
than our commercial business, the residential projects<br />
enhance the Group’s overall profits and returns<br />
on capital.<br />
Annual returns from residential developments<br />
fluctuate due to the nature of the projects and the<br />
accounting policy of only recognising profits on sales<br />
at completion. Demand is also dependent on overall<br />
economic conditions, which can be significantly<br />
affected by government policies. While the Group’s<br />
residential contribution decreased in 2011 compared<br />
with the record levels achieved in 2010 and 2009, the<br />
residential business remains an important contributor<br />
to the Group’s overall profits. Ongoing land acquisitions<br />
are necessary to continue to build this income stream<br />
over the longer term, and in 2011 new sites were<br />
acquired in Singapore and in Chongqing, China.<br />
Annual Report 2011 7
Chief Executive’s Review<br />
Review of Commercial Property<br />
Hong Kong<br />
While the overall level of demand for office space<br />
softened in the final months of 2011, rents rose for<br />
most of the year reflecting continuing demand and<br />
the limited supply of Grade A office space throughout<br />
Hong Kong and in the Central District specifically.<br />
Rents reached record levels surpassing those achieved<br />
in the last cycle which peaked in mid-2008. As a result,<br />
rental reversions were generally positive across the<br />
portfolio, particularly in the second half. The average<br />
rent in 2011 was HK$87.0 per sq. ft compared with<br />
HK$84.3 per sq. ft in 2010, while the office vacancy<br />
at the end of 2011 was 2.0% compared with 2.9%<br />
a year earlier. This vacancy level is unusually low<br />
having been achieved only three times before over<br />
the past 20 years. Financial institutions, law firms and<br />
accounting firms continue to comprise approximately<br />
75% of the office tenants in the Central portfolio.<br />
Economic uncertainties may reduce demand for<br />
office space in 2012 which could affect market rents.<br />
Nevertheless, the Group’s objective of maintaining<br />
positive, or at least neutral, rental reversions is helped<br />
by the lower level of rents on existing leases which<br />
are expiring or are subject to rent review over the next<br />
year compared with current rents.<br />
The Group’s retail portfolio in Hong Kong also<br />
performed well with strong retail sales creating<br />
continued demand for prime space. At the end of<br />
2011, the portfolio was fully occupied, similar to<br />
the end of last year. The average retail rent was<br />
HK$148.3 per sq. ft, an 8% increase over the 2010<br />
average of HK$137.1 per sq. ft.<br />
Central portfolio<br />
at 31st December 2011<br />
Office<br />
Retail<br />
Capital value (US$m) 17,615 4,098 *<br />
Gross revenue (US$m) 576 188 *<br />
Equivalent yield (%)<br />
– One and Two <strong>Exchange</strong> Square 4.50<br />
– The <strong>Land</strong>mark Atrium 4.50<br />
Average unexpired term<br />
of leases (years) 4.1 2.3<br />
Area subject to renewal/review<br />
in 2012 (%) 20 35<br />
* includes hotel<br />
Long-term capital appreciation also has an important<br />
impact on the Group. During the year, the value of<br />
the Group’s Hong Kong portfolio increased by 26%,<br />
including 7% in the second half, based on independent<br />
valuations performed at 31st December 2011. The total<br />
value of the portfolio is now US$21.7 billion compared<br />
with US$17.3 billion at the end of 2010. This was due<br />
to rising rents as capitalisation rates or equivalent yields<br />
remained stable from a year earlier.<br />
Singapore<br />
Following an active 2010, overall leasing activity in<br />
the Singapore market was significantly lower in 2011<br />
while rents were relatively stable. Nevertheless,<br />
<strong>Hongkong</strong> <strong>Land</strong>’s improved performance benefited<br />
from a full year’s rental contribution from its one-third<br />
share in the first two towers of Marina Bay Financial<br />
Centre which were completed in 2010. There is no<br />
significant vacancy across the existing portfolio,<br />
including the wholly-owned One Raffles Link and<br />
the one-third owned One Raffles Quay.<br />
8<br />
<strong>Hongkong</strong> <strong>Land</strong>
In 2012, the final office tower of Marina Bay<br />
Financial Centre will be completed. This 122,000 sq. m.<br />
tower has been 65% pre-let with DBS Bank as the<br />
largest tenant.<br />
Market conditions are expected to be challenging given<br />
the relative weakness in demand for Grade A office<br />
space, particularly from the financial services sector,<br />
combined with the overall availability of office space<br />
in the market. However, there are no significant leases<br />
expiring in 2012 across the Group’s existing portfolio,<br />
and its quality will enable it to maintain a strong<br />
competitive position.<br />
Other Commercial Property Investments<br />
In Macau, the retail centre at our 47%-owned joint<br />
venture project, One Central, had a strong year<br />
benefiting from growing retail sales. The retail mall<br />
of some 20,000 sq. m. features the world’s leading<br />
luxury brands and is considered the preeminent<br />
shopping venue in the city. Overall occupancy at<br />
the end of 2011 was 93%, including 7% of the space<br />
for which contracts are signed but operations have<br />
yet to begin. The hotel component of One Central,<br />
Mandarin Oriental, Macau, is now firmly established<br />
as the most exclusive hotel in the market.<br />
In Jakarta, the Group’s 50%-owned joint venture<br />
currently owns and manages some 80,000 sq. m.<br />
of space in three buildings located prominently in<br />
the city’s Central Business District. These are 99.7%<br />
let. A fourth tower, which is under construction and<br />
expected to complete in 2012, is nearly 80% pre-let.<br />
Market conditions are generally encouraging, although<br />
rental levels remain low compared with other major<br />
Asian markets.<br />
The Group has other commercial investment properties<br />
in Hanoi, Bangkok and <strong>Bermuda</strong>, the overall results of<br />
which continue to be satisfactory. The two buildings in<br />
Hanoi, which are approximately 70% owned, remain<br />
fully let at premium rates to the market. In Bangkok,<br />
at the Group’s 49%-owned luxury retail and office<br />
complex, Gaysorn Plaza, trading conditions for the<br />
retailers remained challenging. In <strong>Bermuda</strong>, Jardine<br />
Gibbons Property, in which <strong>Hongkong</strong> <strong>Land</strong> has a 40%<br />
interest, owns four commercial buildings in the centre<br />
of Hamilton.<br />
10.84<br />
10.85<br />
11.18<br />
8.52<br />
6.33<br />
5.08<br />
4.69<br />
4.04<br />
3.78<br />
4.83<br />
2002<br />
2003<br />
2004<br />
2005<br />
2006<br />
2007<br />
2008<br />
2009<br />
2010<br />
2011<br />
Central portfolio average office effective rent (US$/sq. ft per month)<br />
Annual Report 2011 9
Chief Executive’s Review<br />
Review of Residential Property<br />
In 2011, residential markets across the region were<br />
affected by both softening buyer sentiment and<br />
various government measures to dampen markets<br />
after a period of strong growth. The contribution from<br />
<strong>Hongkong</strong> <strong>Land</strong>’s residential business was significantly<br />
lower than the record years of 2010 and 2009 which<br />
had benefited from the completion of a number of<br />
major projects. Despite this, the year was active<br />
with eight new projects or phases being launched,<br />
comprising three in Singapore and five in mainland<br />
China. Two significant site acquisitions were also made<br />
to expand the business further.<br />
Hong Kong<br />
At the Group’s 97-unit Serenade project, 23 additional<br />
units were handed over to buyers in 2011. At the end<br />
of the year, there were 41 units remaining which will<br />
be released for sale depending on market conditions.<br />
Macau<br />
In Macau, 75 units of the last residential phase of<br />
One Central were handed over to buyers. This phase,<br />
The Residences & Apartments at Mandarin Oriental,<br />
consists of 92 apartments of which 89% have<br />
been sold.<br />
Singapore<br />
In 2011, only one project was completed in Singapore,<br />
the 180 units of the fully pre-sold Peak@Balmeg.<br />
In the previous year, three projects were completed,<br />
including the Group’s one-third owned project,<br />
Marina Bay Residences, which consisted of<br />
428 luxury apartments.<br />
During the year, three new projects were launched<br />
for sale by MCL <strong>Land</strong>, the Group’s wholly-owned<br />
Singapore-based residential developer. In May,<br />
Terrasse was launched and 80% of the 414 units<br />
had been sold by the end of the year. Uber 388 was<br />
launched at the end of July and 58% of the 95 units<br />
were sold in 2011. Both of these projects are<br />
scheduled for completion in 2014. In October,<br />
the 121 freehold townhouses of Este Villa were<br />
released for sale and 120 units had been sold by<br />
the end of the year. This project is scheduled for<br />
completion in 2013. In addition, construction continued<br />
at three other projects which have been fully pre-sold.<br />
The only project which is due for completion in 2012<br />
is Parvis, a 248-unit development held through a<br />
50%-owned joint venture. In 2013, four projects<br />
are scheduled for completion. Three are MCL <strong>Land</strong><br />
projects totalling 794 units, almost all of which have<br />
been pre-sold. The fourth is Marina Bay Suites,<br />
a one-third owned joint venture which consists of<br />
221 luxury apartments which were 70% pre-sold at<br />
the end of 2011.<br />
Planning continues at three other projects which have<br />
yet to be launched. This includes a residential site in<br />
Pasir Ris which was acquired in May 2011. In total,<br />
these projects will provide some 82,000 sq. m. of<br />
residential space.<br />
Mainland China<br />
The Group is active in four cities across mainland<br />
China and continues to look for opportunities to expand<br />
further. Most of the current projects are in what are<br />
referred to as second tier cities, which we view as<br />
providing attractive long-term opportunities. However,<br />
current conditions throughout China are difficult,<br />
particularly due to various government measures<br />
to cool the residential property market.<br />
In Chongqing, the largest city in western China,<br />
the Group now has four projects including a new site<br />
which was acquired in December 2011.<br />
At the Group’s first project in the city, Bamboo Grove,<br />
a 50%-owned joint venture with Longfor Properties,<br />
three additional residential phases were completed<br />
during the year. Phase 3B consists of 143 townhouses<br />
which were 100% pre-sold. Phase 4A is 667 high-rise<br />
apartment units in four towers which were all sold and<br />
mostly handed over to buyers by the end of 2011.<br />
Phase 4B is 1,363 high-rise apartment units in eight<br />
towers. Of these, 579 units were handed over to<br />
buyers by the end of 2011, and of the remaining units<br />
which will be completed in the first quarter of 2012,<br />
53% have been sold. These are the only units which<br />
are scheduled for completion in 2012.<br />
Construction of the next phases is progressing<br />
well. Phase 5A consists of 624 garden apartments,<br />
while Phase 5B is 1,167 high-rise apartment units.<br />
On completion, the Bamboo Grove development will<br />
comprise some 1.4 million sq. m. of mainly residential<br />
10 <strong>Hongkong</strong> <strong>Land</strong>
space, including villas, townhouses and apartments. Of<br />
this, 570,000 sq. m. have already been developed and<br />
sold while 320,000 sq. m. are now under construction.<br />
The Group’s second project in Chongqing is <strong>Land</strong>mark<br />
Riverside at Dan Zishi, a 50%-owned joint venture with<br />
China Merchants Group established in late 2009. This<br />
project will consist of approximately 1.5 million sq. m.<br />
residential and some prime retail space built over the<br />
34 hectare site in phases. During 2011, construction of<br />
Phase 1 commenced which consists of 1,253 high-rise<br />
apartments. Presale of a minor portion of Phase 1<br />
began at the end of December 2011.<br />
The Group’s third project is Yorkville at Zhaomushan,<br />
near the core area of the new Two-River New<br />
Area, which is in the vicinity of the Bamboo Grove<br />
development. This wholly-owned project consists<br />
of a site of almost 386,000 sq. m. for mainly residential<br />
development with a small portion of retail. The total<br />
developable area is approximately 880,000 sq. m.,<br />
which is also being developed in a number of phases.<br />
During 2011, construction of the first phase<br />
commenced consisting of 324 townhouses.<br />
In December 2011, the Group acquired a 52 hectare<br />
site adjacent to the Yorkville project at a cost of<br />
approximately US$600 million. The new site is to<br />
be developed in phases as a premium residential<br />
development, with a total gross floor area of some<br />
one million sq. m.<br />
In Chengdu, at the 50%-owned joint venture with KWG<br />
Property Holding Group set-up in late 2010, planning<br />
is progressing well. The project consists of a site of<br />
approximately 190,000 sq. m. which will be used<br />
for the development of residential and commercial<br />
properties. The total developable area is approximately<br />
900,000 sq. m. with 65% residential, including serviced<br />
apartments for strata-sale, and 35% commercial,<br />
including office and retail components and a hotel.<br />
In Shenyang, construction continued at two of our<br />
50%-owned residential projects in the city, which are<br />
located to the north and south of the Central Business<br />
District. At One Capitol, Phase 1A is under construction<br />
which consists of 236 townhouses and low-rise<br />
apartments of which approximately 51% had been<br />
pre-sold by the end of 2011. At Park Life, Phases 2A<br />
and 2B are under construction. These consist of 140<br />
townhouses and 234 low-rise apartments, respectively.<br />
These have been 53% pre-sold following their launch<br />
in mid-2011. Planning at our third project is underway<br />
with construction targeted to commence in 2012.<br />
In Beijing, at the Group’s 90%-owned project, Maple<br />
Place, 20 additional units were handed over to buyers.<br />
A further 110 units are available for future sale. These<br />
consist of villas, townhouses and apartments with<br />
a total area of 26,000 sq. m. Most of the units are<br />
currently leased but our intention remains to refurbish<br />
and sell these units.<br />
At Central Park, our 40%-owned joint venture with<br />
the Vantone Group continues to hold 72 apartments<br />
which are being operated as serviced apartments.<br />
Conclusion<br />
The Group is in a strong financial position to deal<br />
with the challenging economic conditions which are<br />
expected to continue in the foreseeable future. At the<br />
same time, given this strength, our extensive network<br />
throughout the region and our long experience, there<br />
may be significant opportunities for both our<br />
commercial and residential businesses.<br />
The results in 2012 will continue to be affected by<br />
lower residential profits due to the scheduled timing<br />
of project completions. In 2013, however, the Group<br />
should see a rebound in residential profits as four<br />
projects in Singapore are due to complete. Beyond<br />
2013, we also expect to see growing profits from<br />
our residential business in mainland China resulting<br />
from the significant investments we have made over<br />
the past three years. In the meantime, we continue<br />
to monitor market conditions and anticipate that this<br />
year will be challenging, particularly in the China<br />
residential sector.<br />
Finally, we will continue to ensure that our existing<br />
investment properties, in particular the prime portfolio<br />
in Hong Kong’s Central District, are maintained at the<br />
highest standard both in terms of product and service<br />
quality for our tenants and customers alike. This is<br />
what will protect our strong competitive position over<br />
the long term.<br />
Y.K. Pang<br />
Chief Executive<br />
1st March 2012<br />
Annual Report 2011 11
Financial Review<br />
Accounting Policies<br />
The accounting policies are consistent with those of<br />
the previous year. The Directors continue to review the<br />
appropriateness of the accounting policies adopted by<br />
the Group with regard to developments in International<br />
Financial Reporting Standards.<br />
Results<br />
Underlying Profit<br />
The Group’s underlying profit attributable to<br />
shareholders in 2011 was US$703 million (or US¢30.29<br />
on an earnings per share basis). This result can be<br />
analysed between the contribution from Commercial<br />
Property, the contribution from Residential Property<br />
and unallocated expenses, which include corporate<br />
costs, net financing charges and tax. Each of these<br />
items includes the Group’s share of results from its<br />
joint ventures.<br />
2011 2010<br />
US$m US$m<br />
Commercial property 759 686<br />
Residential property 288 483<br />
Corporate costs, net financing<br />
charges and tax (338) (313)<br />
Non-controlling interests (6) (46)<br />
Underlying profit attributable<br />
to shareholders 703 810<br />
US¢<br />
US¢<br />
Underlying earnings per share 30.29 36.02<br />
In 2011, the contribution from Commercial Property<br />
increased by 11% to US$759 million. Rental revenues<br />
from the Group’s Hong Kong portfolio increased by 4%<br />
as the average rent per square foot for both the office<br />
and retail space rose due to positive rental reversions.<br />
Growth also came from the Group’s commercial<br />
property investments in Singapore whose contribution<br />
increased by 81%. This was principally because the<br />
Group benefited from a full year of income from its<br />
one-third interest in the first two towers at Marina Bay<br />
Financial Centre. The first two towers opened in 2010,<br />
and construction of the third tower will be completed<br />
in the first half of 2012.<br />
The contribution from Residential Property decreased<br />
by 40% to US$288 million from 2010 due to fewer<br />
project completions, specifically in Singapore.<br />
In Singapore, only one project was completed<br />
during the year, the Peak@Balmeg (180 units)<br />
which had been entirely pre-sold prior to completion.<br />
In addition, the Group benefited from a US$44 million<br />
(2010: US$51 million) reversal of writedowns previously<br />
made in respect of two residential projects, Este Villa<br />
and Uber 388, following the successful launches of<br />
these projects in 2011. The Group continues to carry<br />
writedowns of approximately US$100 million, which<br />
were originally made in 2008, in respect of other<br />
development projects owned by MCL <strong>Land</strong>, its<br />
wholly-owned Singapore residential developer.<br />
In Hong Kong, profits were also derived from further<br />
sales of 23 apartments which were handed over<br />
to buyers at the 97-unit Serenade development.<br />
In Macau, the Group benefited from its share of the<br />
profit from 75 units which were handed over to buyers<br />
at the final residential component of One Central,<br />
Macau – The Residences & Apartments at Mandarin<br />
Oriental. On the Mainland, profits were principally<br />
generated from sales at the 90%-owned Maple Place<br />
in Beijing (20 units) and at the 50%-owned Bamboo<br />
Grove development in Chongqing (1,384 units).<br />
In 2010, the record contribution of US$483 million<br />
came from across the broad geographic base of the<br />
Group’s residential business. It included the results<br />
from the completion of two MCL <strong>Land</strong> projects,<br />
Waterfall Gardens (132 units) and D’Pavilion (50 units),<br />
as well as the contribution from the Group’s one-third<br />
interest in Marina Bay Residences (428 units) which<br />
had all been pre-sold. In Hong Kong, it principally<br />
included the sale of 33 apartments of the Serenade,<br />
while on the Mainland it was mainly due to ongoing<br />
sales at Bamboo Grove and Maple Place.<br />
Net financing charges in 2011, including the Group’s<br />
share of net financing charges within joint ventures,<br />
remained steady at US$97 million compared to<br />
US$95 million in 2010. While the Group benefited<br />
from lower interest costs due to the conversion of<br />
12 <strong>Hongkong</strong> <strong>Land</strong>
a significant number of convertible bonds, particularly<br />
at the beginning of the year, this was offset by higher<br />
facility fees and a higher interest cost at the joint<br />
venture level due to the completion of the first phase<br />
of Marina Bay Financial Centre. During construction,<br />
interest costs had been capitalised.<br />
The average interest rate on Group borrowings was<br />
2.6% in 2011, compared to 2.8% in 2010. The average<br />
interest rate on Group deposits was 0.5% in 2011,<br />
compared with 0.7% in 2010.<br />
The Group’s underlying tax charge, including the Group’s<br />
share of joint ventures, increased to US$190 million<br />
from US$163 million in 2010. The Group’s effective<br />
tax rate was 16.8%, compared with 15.9% in 2010.<br />
Non-Trading Gains<br />
In 2011, the Group had non-trading gains of<br />
US$4.6 billion compared with US$3.9 billion in 2010.<br />
These arose on revaluations of the Group’s investment<br />
properties, including its share of joint ventures,<br />
which were performed at 31st December 2011 by<br />
independent valuers.<br />
The most significant increase in valuations came<br />
from the Group’s Hong Kong portfolio in Central.<br />
This increased in value by 26% to US$21.7 billion<br />
(2010: US$17.3 billion) as a result of increasing rents.<br />
Capitalisation rates, or equivalent yields, were<br />
principally unchanged from those used in the<br />
valuations as at 31st December 2010.<br />
Cash Flows<br />
The Group’s consolidated cash flows are summarised as follows:<br />
2011 2010<br />
US$m<br />
US$m<br />
Operating activities<br />
Operating profit, excluding non-trading items 832 881<br />
Net interest paid (57) (52)<br />
Tax paid (118) (170)<br />
Dividends received from joint ventures 58 272<br />
Purchase of sites for residential development (373) (454)<br />
Other 89 213<br />
431 690<br />
Investing activities<br />
Major renovations capex (51) (34)<br />
Funding of joint ventures (257) (213)<br />
Additional 20% interest purchased in Shenyang joint venture – (80)<br />
Loan repayments from joint ventures 111 275<br />
Development expenditure – Wangfujing site, China (93) –<br />
– Phnom Penh properties, Cambodia (34) –<br />
Other (6) (2)<br />
(330) (54)<br />
Financing activities<br />
Dividends paid by the Company (371) (358)<br />
Purchase of additional interest in MCL <strong>Land</strong> – (160)<br />
Other (129) 23<br />
(500 ) (495 )<br />
Net (decrease)/increase in cash and cash equivalents (399) 141<br />
Cash and cash equivalents at 1st January 1,366 1,225<br />
Cash and cash equivalents at 31st December 967 1,366<br />
Annual Report 2011 13
Financial Review<br />
In 2011, cash flows from operating activities were<br />
US$431 million, compared with US$690 million in<br />
2010. While the Group’s operating profit, excluding<br />
non-trading items was US$49 million lower than in<br />
2010, the decrease in cash flows was primarily due<br />
to lower dividends received from joint ventures.<br />
In 2010, the Group benefited from significant dividends<br />
following residential completions at One Central,<br />
Macau and at Marina Bay Residences in Singapore.<br />
In 2011, the Group’s subsidiaries paid US$373 million<br />
in respect of the purchase of sites for future residential<br />
development, compared with US$454 million in 2010.<br />
This included MCL <strong>Land</strong>’s purchase of a site in Pasir<br />
Ris, Singapore for US$210 million. Additional land<br />
payments were also made for the Group’s residential<br />
sites in mainland China.<br />
Under investing activities in 2011, the Group had<br />
outlays of US$330 million, up from US$54 million<br />
in 2010. These included US$51 million of capital<br />
expenditure related to major renovations, principally<br />
in respect of the Hong Kong Central portfolio, and<br />
US$257 million to fund construction at both the<br />
Group’s one-third owned Marina Bay Financial Centre<br />
project in Singapore and its various joint venture<br />
projects in mainland China. Also, under investment<br />
activities, the Group received US$111 million of<br />
loan repayments from joint ventures, including<br />
US$55 million from One Central, Macau and<br />
US$46 million from Bamboo Grove, compared with<br />
US$275 million in 2010. The repayments in 2010<br />
resulted from the refinancing of One Raffles Quay<br />
in Singapore.<br />
The Group acquired several sites for the development<br />
of commercial property for investment. A site in<br />
Wangfujing, Beijing was secured and US$93 million<br />
was paid in 2011 out of the total site cost of some<br />
US$450 million. Four sites in Cambodia were<br />
purchased for US$34 million and it is expected<br />
that the purchase of a fifth site in Cambodia, in Siem<br />
Reap, will be completed in 2012 for US$2 million.<br />
In 2010, investing activities included US$213 million<br />
to fund construction at various joint ventures<br />
in Singapore, Macau and mainland China and<br />
US$80 million to purchase an additional 20% interest<br />
in the Group’s Shenyang joint venture.<br />
Under financing activities, the Company paid dividends<br />
of US$371 million, being the final 2010 dividend of<br />
US¢10.00 and the 2011 interim dividend of US¢6.00.<br />
In 2010, the Group spent US$160 million on purchasing<br />
an additional 22.6% interest in MCL <strong>Land</strong> pursuant to<br />
its privatisation and exit offer to the minorities. This<br />
was completed in early 2011 and MCL <strong>Land</strong> is now a<br />
wholly-owned subsidiary of <strong>Hongkong</strong> <strong>Land</strong>.<br />
The Group’s year end cash and cash equivalents<br />
totalled US$1.0 billion compared with US$1.4 billion<br />
in 2010. At 31st December 2011, the Group’s net debt<br />
was US$2.4 billion, unchanged from US$2.4 billion at<br />
the beginning of the year.<br />
Dividends<br />
The Board is recommending an unchanged final<br />
dividend of US¢10.00 per share for 2011 that will<br />
maintain the full-year dividend at US¢16.00 per share.<br />
The final dividend will be payable on 16th May 2012,<br />
subject to approval at the Annual General Meeting<br />
to be held on 9th May 2012, to shareholders on the<br />
register of members at the close of business on<br />
16th March 2012. No scrip alternative is being offered<br />
in respect of the dividend.<br />
14 <strong>Hongkong</strong> <strong>Land</strong>
Treasury Policy<br />
The Group manages its treasury activities within<br />
established risk management objectives and policies<br />
using a variety of techniques and instruments. The<br />
main objectives are to manage exchange, interest rate<br />
and liquidity risks and to provide a degree of certainty<br />
in respect of costs. The investment of the Group’s<br />
cash balances is managed so as to minimise risk<br />
while seeking to enhance yield.<br />
The Group’s Treasury operations are managed as<br />
cost centres and are not permitted to undertake<br />
speculative transactions unrelated to underlying<br />
financial exposures. Appropriate credit guidelines<br />
are in place to manage counterparty credit risk.<br />
When economically sensible to do so, borrowings<br />
are taken in local currencies to hedge foreign<br />
currency exposures on investments. A portion of<br />
borrowings is denominated in fixed rates. Adequate<br />
headroom in committed facilities is maintained<br />
to facilitate the Group’s capacity to pursue new<br />
investment opportunities.<br />
Funding<br />
The Group is well financed with strong liquidity<br />
and gearing of 10%, down from 12% in 2010.<br />
The decrease in gearing was due to the higher<br />
shareholders’ funds resulting from the increase in value<br />
of investment properties. Interest cover, calculated as<br />
the underlying operating profits, including the Group’s<br />
share of joint ventures’ operating profits, divided by<br />
net financing charges including the Group’s share of<br />
joint ventures’ net financing charges, was strong at<br />
10.3 times, compared with 11.7 times in 2010.<br />
Year-end debt summary*<br />
<br />
Net debt 2,359 2,358<br />
17% 19% 16% 12% 10%<br />
2007 2008 2009 2010 2011<br />
Net debt<br />
Equity<br />
Net debt as a percentage of equity<br />
2011 2010<br />
US$m US$m<br />
US$ convertible bonds 57 373<br />
US$ bonds/notes 1,151 1,707<br />
US$ bank loans – 1<br />
HK$ bonds/notes 609 530<br />
HK$ bank loans 673 335<br />
<br />
S$ bonds/notes 446 449<br />
S$ bank loans 391 330<br />
Gross debt 3,327 3,725<br />
<br />
Cash 968 1,367<br />
* Before currency swaps<br />
Annual Report 2011 15
Financial Review<br />
<br />
<br />
<br />
Both Moody’s and Standard & Poor’s have maintained<br />
their credit ratings of <strong>Hongkong</strong> <strong>Land</strong> <strong>Holdings</strong> <strong>Limited</strong><br />
at A3 and A- respectively.<br />
During the year, the Group refinanced a syndicated<br />
facility of S$800 million with facilities from eight<br />
relationship banks totalling S$1.12 billion. A term<br />
of five years applies to S$870 million and a term of<br />
seven years applies to the remaining S$250 million.<br />
The Group also issued US$65 million of bonds under<br />
its US$3.0 billion Medium Term Note programme,<br />
with maturities ranging from 15 to 20 years. Also,<br />
US$336 million of the Group’s 2.75% convertible<br />
bonds due in December 2012 were converted<br />
into equity leaving US$58 million outstanding at<br />
31st December 2011.<br />
The average tenor of the Group’s debt was 5.3 years<br />
at 31st December 2011, compared with 5.2 years at<br />
the end of 2010.<br />
At the end of 2011, the Group had total committed<br />
lines of approximately US$5.2 billion. Of these lines,<br />
57% was sourced from banks with the remaining<br />
43% from capital markets. The Group had drawn<br />
US$3.3 billion from these lines leaving US$1.9 billion<br />
of committed, but unused facilities. Adding the Group’s<br />
year-end cash balances, the Group had overall liquidity<br />
at 31st December 2011 of US$2.9 billion. This is in<br />
line with the Group’s overall liquidity at 31st December<br />
2010 of US$3.0 billion (after excluding the proceeds of<br />
the early refinancing in 2010 of the US$600 million<br />
bonds due in early May 2011).<br />
<br />
<br />
<br />
Interest<br />
rate<br />
52% Fixed<br />
48% Floating<br />
<br />
<br />
* After currency swaps<br />
Currency*<br />
69% HK$<br />
29% S$<br />
2% US$<br />
Debt profile at 31st December 2011<br />
260<br />
1,101<br />
1,250<br />
2012 2013 2014<br />
369<br />
2015<br />
Maturity<br />
43% >5 years<br />
35% 2-5 years<br />
20% 1-2 years<br />
2%
Gross Assets<br />
The Group’s gross assets, including its share of joint<br />
ventures, (excluding cash balances) is analysed below,<br />
by activity and by location.<br />
92% Commercial<br />
8% Residential<br />
92% Commercial<br />
8% Residential<br />
80% Hong Kong<br />
14% Southeast Asia<br />
5% Mainland China<br />
1% Macau<br />
By activity<br />
By location<br />
Principal Risks and Uncertainties<br />
A review of the principal risks and uncertainties facing<br />
the Group is set out on page 68.<br />
John R. Witt<br />
Chief Financial Officer<br />
80% Hong Kong<br />
1st March 2012<br />
14% Southeast Asia<br />
5% Mainland China<br />
1% Macau<br />
Annual Report 2011 17
Directors’ Profiles<br />
Simon Keswick Chairman<br />
Mr Simon Keswick has been a Director of the Group’s<br />
holding company since 1983. He was Chairman from<br />
1983 to 1988 and was subsequently re-appointed in 1989.<br />
He joined the Jardine Matheson group in 1962 and is<br />
also chairman of Dairy Farm and Mandarin Oriental, and<br />
a director of Jardine Lloyd Thompson, Jardine Matheson<br />
and Jardine Strategic.<br />
Ben Keswick* Managing Director<br />
Mr Ben Keswick joined the Board as Managing Director<br />
in April 2012. He has held a number of executive<br />
positions since joining the Jardine Matheson group in<br />
1998, including finance director and then chief executive<br />
officer of Jardine Pacific between 2003 and 2007 and,<br />
thereafter, group managing director of Jardine Cycle &<br />
Carriage until March 2012. He has an MBA from INSEAD.<br />
Mr Keswick is chairman of Jardine Matheson <strong>Limited</strong><br />
and Jardine Cycle & Carriage, and a commissioner of<br />
Astra and United Tractors. He is also managing director<br />
of Dairy Farm, Jardine Matheson, Jardine Strategic and<br />
Mandarin Oriental, and a director of Jardine Pacific and<br />
Jardine Motors.<br />
Y.K. Pang* Chief Executive<br />
Mr Pang joined the Board and was appointed Chief<br />
Executive of the Group in 2007. He previously held<br />
a number of senior executive positions in the Jardine<br />
Matheson group, which he joined in 1984. He is a director<br />
of Jardine Matheson <strong>Limited</strong>, Jardine Matheson and<br />
Jardine Matheson (China) <strong>Limited</strong>. He is also chairman<br />
of the Employers’ Federation of Hong Kong and<br />
vice chairman of the Hong Kong General Chamber<br />
of Commerce.<br />
John R. Witt* Chief Financial Officer<br />
Mr Witt joined the Board as Chief Financial Officer in<br />
2010. He is a Chartered Accountant and has an MBA from<br />
INSEAD. He has been with the Jardine Matheson group<br />
since 1993 during which time he has held a number of<br />
senior finance positions. Most recently, he was the chief<br />
financial officer of Mandarin Oriental.<br />
Charles Allen-Jones<br />
Mr Allen-Jones joined the Board in 2001. He was formerly<br />
senior partner of Linklaters, where he had been a partner<br />
for 33 years until 2001. Mr Allen-Jones is a non-executive<br />
director of Jardine Strategic and Caledonia Investments<br />
and vice chairman of the Council of the Royal College<br />
of Art.<br />
Mark Greenberg<br />
Mr Greenberg joined the Board in 2006. He is group<br />
strategy director of Jardine Matheson. He had previously<br />
spent 16 years in investment banking with Dresdner<br />
Kleinwort Wasserstein in London. He is also a director<br />
of Jardine Matheson <strong>Limited</strong>, Dairy Farm, Jardine Cycle<br />
& Carriage and Mandarin Oriental, and a commissioner<br />
of Astra and Bank Permata.<br />
Jenkin Hui<br />
Mr Hui joined the Board in 1994 and is a director of<br />
Jardine Matheson, Jardine Strategic, Central Development<br />
and a number of property and investment companies.<br />
Adam Keswick<br />
Mr Adam Keswick joined the Board in April 2012. He is<br />
deputy managing director of Jardine Matheson, chairman<br />
of Jardine Pacific, and chairman and chief executive of<br />
Jardine Motors. He has held a number of executive<br />
positions since joining the Jardine Matheson group<br />
from N M Rothschild & Sons in 2001, including group<br />
strategy director and, thereafter, group managing director<br />
of Jardine Cycle & Carriage between 2003 and 2007.<br />
Mr Keswick is also deputy chairman of Jardine Matheson<br />
<strong>Limited</strong>, and a director of Dairy Farm, Jardine Strategic,<br />
Mandarin Oriental and Rothschilds Continuation.<br />
Sir Henry Keswick<br />
Sir Henry first served on the Board of the Group’s holding<br />
company between 1970 and 1975 and was re-appointed<br />
a Director in 1988. He is chairman of Jardine Matheson,<br />
having first joined the group in 1961, and is also chairman<br />
of Jardine Strategic. He is a director of Dairy Farm and<br />
Mandarin Oriental. He is also vice chairman of the Hong<br />
Kong Association.<br />
* Executive Director<br />
18 <strong>Hongkong</strong> <strong>Land</strong>
Lord Leach of Fairford<br />
Lord Leach has been a Director of the Group’s holding<br />
company since 1985. He is deputy chairman of<br />
Jardine Lloyd Thompson, and a director of Dairy Farm,<br />
Jardine Matheson, Jardine Strategic, Mandarin Oriental<br />
and Rothschilds Continuation. He joined the Jardine<br />
Matheson group in 1983 after a career in banking and<br />
merchant banking.<br />
Dr Richard Lee<br />
Dr Lee joined the Board in 2003. Dr Lee’s principal<br />
business interests are in the manufacturing of textiles<br />
and apparel in Southeast Asia, and he is the chairman of<br />
TAL Apparel. He is also a director of Jardine Matheson<br />
and Mandarin Oriental.<br />
A.J.L. Nightingale<br />
Mr Nightingale joined the Board in 2006 and was<br />
Managing Director of the Company from 2006 to March<br />
2012. He held a number of senior positions since first<br />
joining the Jardine Matheson group in 1969 until his<br />
retirement from executive office in March 2012. He is also<br />
a director of Dairy Farm, Jardine Cycle & Carriage, Jardine<br />
Matheson, Jardine Strategic and Mandarin Oriental, and a<br />
commissioner of Astra. Mr Nightingale is also a member<br />
of the Commission on Strategic Development, a member<br />
of the Committee on Strategic Enhancement of Hong<br />
Kong as an International Financial Centre, a vice president<br />
of The Real Estate Developers Association of Hong Kong,<br />
a council member of the Employers’ Federation of Hong<br />
Kong, a Hong Kong representative to the APEC Business<br />
Advisory Council, a member of Chongqing Mayor’s<br />
International Economic Advisory Council and a member<br />
of the UK ASEAN Business Council Advisory Panel.<br />
He is also chairman of The Sailors Home and Missions<br />
to Seamen in Hong Kong.<br />
Lord Powell of Bayswater KCMG<br />
Lord Powell rejoined the Board in 2008, having first served<br />
as a Director between 1992 and 2000. He was previously<br />
Private Secretary and adviser on foreign affairs and<br />
defence to British Prime Ministers, Baroness Thatcher<br />
and Rt Hon John Major. He is a director of Caterpillar,<br />
LVMH Moët Hennessy Louis Vuitton, Matheson & Co,<br />
Mandarin Oriental, Capital Generation Partners, Textron<br />
Corporation, Schindler Holding, Northern Trust Global<br />
Services and Magna <strong>Holdings</strong>. He is co-chairman of the<br />
UK Government’s Asia Task Force and was previously<br />
president of the China-Britain Business Council and<br />
chairman of the Singapore-British Business Council.<br />
James Watkins<br />
Mr Watkins joined the Board in 2009. He was a director<br />
and group general counsel of Jardine Matheson from<br />
1997 to 2003. Mr Watkins qualified as a solicitor in 1969<br />
and was formerly a partner of Linklaters. He is also a<br />
director of Advanced Semiconductor Manufacturing<br />
Corporation, Asia Satellite Telecommunications <strong>Holdings</strong>,<br />
Global Sources, IL&FS India Realty Fund II, Jardine Cycle<br />
& Carriage and Mandarin Oriental.<br />
Percy Weatherall<br />
Mr Weatherall joined the Board in 1994 and was<br />
Managing Director from 2000 to 2006. He first joined<br />
the Jardine Matheson group in 1976 and retired from<br />
executive office in 2006. He is also a director of Dairy<br />
Farm, Jardine Matheson, Jardine Strategic and Mandarin<br />
Oriental. He is chairman of Corney and Barrow.<br />
1st April 2012<br />
Annual Report 2011 19
Consolidated Profit and Loss Account<br />
for the year ended 31st December 2011<br />
2011 2010<br />
Underlying Non- Underlying Nonbusiness<br />
trading business trading<br />
performance items Total performance items Total<br />
Note US$m US$m US$m US$m US$m US$m<br />
Revenue 5 1,223.7 – 1,223.7 1,340.6 – 1,340.6<br />
Net operating costs 6 (392.0 ) – (392.0 ) (459.2 ) – (459.2 )<br />
831.7 – 831.7 881.4 – 881.4<br />
Change in fair value of investment properties 11 – 4,382.7 4,382.7 – 3,197.6 3,197.6<br />
Asset impairment provisions, reversals<br />
and disposals 11 – – – – 0.1 0.1<br />
Operating profit 831.7 4,382.7 5,214.4 881.4 3,197.7 4,079.1<br />
Financing charges (99.7) – (99.7) (112.3) – (112.3)<br />
Financing income 33.2 – 33.2 35.2 – 35.2<br />
Net financing charges 7 (66.5) – (66.5) (77.1) – (77.1)<br />
Share of results of associates and joint ventures 8 76.3 221.7 298.0 173.9 731.4 905.3<br />
Profit before tax 841.5 4,604.4 5,445.9 978.2 3,929.1 4,907.3<br />
Tax 9 (133.6 ) (0.9 ) (134.5 ) (122.8 ) 0.7 (122.1 )<br />
Profit after tax 707.9 4,603.5 5,311.4 855.4 3,929.8 4,785.2<br />
Attributable to:<br />
Shareholders of the Company 703.4 4,603.0 5,306.4 810.2 3,929.2 4,739.4<br />
Non-controlling interests 4.5 0.5 5.0 45.2 0.6 45.8<br />
707.9 4,603.5 5,311.4 855.4 3,929.8 4,785.2<br />
US¢<br />
US¢<br />
Earnings per share 10<br />
– basic 228.48 210.70<br />
– diluted 227.13 202.30<br />
20 <strong>Hongkong</strong> <strong>Land</strong>
Consolidated Statement of Comprehensive Income<br />
for the year ended 31st December 2011<br />
2011 2010<br />
Note US$m US$m<br />
Profit for the year 5,311.4 4,785.2<br />
Revaluation of other investments 14 (10.7) 11.0<br />
Net actuarial (loss)/gain on employee benefit plans (4.6) 0.2<br />
Net exchange translation differences 36.9 59.1<br />
Cash flow hedges<br />
– net loss arising during the year (1.2) (17.1)<br />
– transfer to profit and loss 5.8 7.2<br />
4.6 (9.9)<br />
Share of other comprehensive income of associates and joint ventures 2.8 80.8<br />
Tax relating to components of other comprehensive income 9 (0.2) 1.1<br />
Other comprehensive income for the year 28.8 142.3<br />
Total comprehensive income for the year 5,340.2 4,927.5<br />
Attributable to:<br />
Shareholders of the Company 5,335.2 4,870.4<br />
Non-controlling interests 5.0 57.1<br />
5,340.2 4,927.5<br />
Annual Report 2011 21
Consolidated Balance Sheet<br />
at 31st December 2011<br />
At 31st December<br />
2011 2010<br />
Note US$m US$m<br />
Net operating assets<br />
Tangible assets 12<br />
Investment properties 22,529.9 18,036.0<br />
Others 5.3 4.2<br />
22,535.2 18,040.2<br />
Associates and joint ventures 13 3,551.8 3,177.7<br />
Other investments 14 48.6 59.2<br />
Deferred tax assets 15 5.5 7.1<br />
Pension assets 16 6.4 10.6<br />
Non-current debtors 18 72.0 51.5<br />
Non-current assets 26,219.5 21,346.3<br />
Properties for sale 17 1,521.2 1,184.4<br />
Current debtors 18 313.5 245.1<br />
Current tax assets 1.5 –<br />
Bank balances 19 967.9 1,366.7<br />
Current assets 2,804.1 2,796.2<br />
Current creditors 20 (746.3 ) (723.4 )<br />
Current borrowings 21 (58.0 ) (859.7 )<br />
Current tax liabilities (82.5 ) (69.2 )<br />
Current liabilities (886.8) (1,652.3)<br />
Net current assets 1,917.3 1,143.9<br />
Long-term borrowings 21 (3,269.2) (2,864.8)<br />
Deferred tax liabilities 15 (59.4) (54.8)<br />
Non-current creditors 20 (44.4) (93.1)<br />
24,763.8 19,477.5<br />
Total equity<br />
Share capital 22 233.8 225.1<br />
Revenue and other reserves 24,504.7 19,231.5<br />
Shareholders’ funds 24,738.5 19,456.6<br />
Non-controlling interests 25.3 20.9<br />
24,763.8 19,477.5<br />
Approved by the Board of Directors on 1st March 2012<br />
A.J.L. Nightingale<br />
Y.K. Pang<br />
Directors<br />
22 <strong>Hongkong</strong> <strong>Land</strong>
Consolidated Statement of Changes in Equity<br />
for the year ended 31st December 2011<br />
Attributable<br />
Attributable to shareholders of the Company<br />
to non-<br />
Share Share Revenue Capital Hedging <strong>Exchange</strong> controlling Total<br />
capital premium reserves reserves reserves reserves Total interests equity<br />
Note US$m US$m US$m US$m US$m US$m US$m US$m US$m<br />
2011<br />
At 1st January 225.1 5.3 18,900.7 62.5 (16.2) 279.2 19,456.6 20.9 19,477.5<br />
Total comprehensive income – – 5,291.9 – 2.5 40.8 5,335.2 5.0 5,340.2<br />
Dividends paid by the<br />
Company 23 – – (372.5) – – – (372.5) – (372.5)<br />
Dividends paid to<br />
non-controlling<br />
shareholders – – – – – – – (0.6) (0.6)<br />
Issue of shares 8.7 310.5 – – – – 319.2 – 319.2<br />
Transfer – – 61.0 (61.0) – – – – –<br />
At 31st December 233.8 315.8 23,881.1 1.5 (13.7 ) 320.0 24,738.5 25.3 24,763.8<br />
2010<br />
At 1st January 224.9 – 14,504.6 63.4 (7.4) 150.6 14,936.1 135.4 15,071.5<br />
Total comprehensive income – – 4,750.6 – (8.8) 128.6 4,870.4 57.1 4,927.5<br />
Dividends paid by the<br />
Company 23 – – (359.9) – – – (359.9) – (359.9)<br />
Dividends paid to<br />
non-controlling<br />
shareholders – – – – – – – (8.1) (8.1)<br />
Issue of shares 0.2 5.3 – – – – 5.5 – 5.5<br />
Change in interests<br />
in subsidiaries – – 4.5 – – – 4.5 (163.5) (159.0)<br />
Transfer – – 0.9 (0.9) – – – – –<br />
At 31st December 225.1 5.3 18,900.7 62.5 (16.2 ) 279.2 19,456.6 20.9 19,477.5<br />
The comprehensive income included in revenue reserves comprises profit attributable to shareholders of US$5,306.4 million<br />
(2010: US$4,739.4 million), net fair value loss on other investments of US$10.7 million (2010: gain of US$11.0 million) and net<br />
actuarial loss on employee benefit plans of US$3.8 million (2010: gain of US$0.2 million). Cumulative net fair value gain on other<br />
investments and net actuarial loss on employee benefit plans amounted to US$8.8 million (2010: US$19.5 million) and US$3.0 million<br />
(2010: gain of US$0.8 million), respectively.<br />
Annual Report 2011 23
Consolidated Cash Flow Statement<br />
for the year ended 31st December 2011<br />
2011 2010<br />
Note US$m US$m<br />
Operating activities<br />
Operating profit 5,214.4 4,079.1<br />
Depreciation 6 1.7 1.1<br />
Reversal of writedowns on development properties held for sale 6 (44.2) (50.9)<br />
Change in fair value of investment properties (4,382.7) (3,197.6)<br />
Asset impairment provisions, reversals and disposals – (0.1)<br />
Increase in properties for sale (298.8) (296.6)<br />
(Increase)/decrease in debtors, prepayments and others (70.7) 79.3<br />
Increase in creditors and accruals 33.2 26.1<br />
Interest received 35.8 38.2<br />
Interest and other financing charges paid (93.0) (90.2)<br />
Tax paid (117.4) (169.7)<br />
Dividends from associates and joint ventures 58.0 271.7<br />
Cash flows from operating activities 336.3 690.4<br />
Investing activities<br />
Major renovations expenditure (50.8) (34.6)<br />
Developments capital expenditure (38.3) (0.2)<br />
Investments in and loans to associates and joint ventures (146.2) (17.9)<br />
Purchase of other investments – (2.0)<br />
Cash flows from investing activities (235.3) (54.7)<br />
Financing activities<br />
Drawdown of borrowings 1,068.1 1,404.2<br />
Repayment of borrowings (1,193.4) (1,380.6)<br />
Change in interests in subsidiaries 24 – (159.9)<br />
Repayment to non-controlling shareholders (6.1) (11.1)<br />
Dividends paid by the Company (370.9) (358.2)<br />
Dividends paid to non-controlling shareholders (0.6) (7.8)<br />
Cash flows from financing activities (502.9) (513.4)<br />
Effect of exchange rate changes 2.9 18.4<br />
Net (decrease)/increase in cash and cash equivalents (399.0 ) 140.7<br />
Cash and cash equivalents at 1st January 1,365.7 1,225.0<br />
Cash and cash equivalents at 31st December 24 966.7 1,365.7<br />
24 <strong>Hongkong</strong> <strong>Land</strong>
Notes to the Financial Statements<br />
1 Principal Accounting Policies<br />
Basis of preparation<br />
The financial statements have been prepared in accordance with International Financial Reporting Standards, including<br />
International Accounting Standards and Interpretations adopted by the International Accounting Standards Board. The financial<br />
statements have been prepared under the historical cost convention except as disclosed in the accounting policies below.<br />
Standards, amendments and interpretations effective in 2011 which are relevant to the Group’s operations<br />
Revised IAS 24<br />
Amendment to IAS 32<br />
Amendments to IFRIC 14<br />
IFRIC 19<br />
Improvements to IFRSs (2010)<br />
Related Party Disclosures<br />
Classification of Rights Issues<br />
Prepayments of a Minimum Funding Requirement<br />
Extinguishing Financial Liabilities with Equity Instruments<br />
The adoption of these standards, amendments and interpretations does not have a material impact on the Group’s<br />
accounting policies.<br />
Revised IAS 24 ‘Related Party Disclosures’ supersedes IAS 24 (as revised in 2003). It simplifies the disclosure requirements<br />
for government-related entities and clarifies the definition of a related party.<br />
Amendment to IAS 32 ‘Classification of Rights Issues’ clarifies that rights issues are equity instruments when they<br />
are denominated in a currency other than the issuer’s functional currency and are issued pro-rata to an entity’s existing<br />
shareholders for a fixed amount of currency.<br />
Amendments to IFRIC 14 ‘Prepayments of a Minimum Funding Requirement’ require an entity to recognise an asset for<br />
a prepayment that will reduce future minimum funding contributions required by the entity.<br />
IFRIC 19 ‘Extinguishing Financial Liabilities with Equity Instruments’ provides guidance on the application of IAS 39 and IAS 32<br />
when an entity issues its own equity instruments to extinguish all or part of a financial liability.<br />
The Improvements to IFRSs (2010) comprise a number of non-urgent but necessary amendments to IFRSs. The amendments<br />
which are relevant to the Group’s operations include IFRS 3 (amendments) ‘Business Combinations’, IFRS 7 (amendments)<br />
‘Financial Instruments: Disclosures’, IAS 1 (amendments) ‘Presentation of Financial Statements’, IAS 34 (amendments) ‘Interim<br />
Financial Reporting’ and IFRIC 13 (amendment) ‘Customer Loyalty Programmes’.<br />
IFRS 3 (amendments) ‘Business Combinations’ clarify the transition requirements for contingent consideration from business<br />
combination that occurred before the effective date of the revised IFRS, the measurement of non-controlling interests and<br />
un-replaced and voluntarily replaced share-based payment awards.<br />
IFRS 7 (amendments) ‘Financial Instruments: Disclosures’ emphasise the interaction between qualitative and quantitative<br />
disclosures and the nature and extent of risks associated with financial instruments.<br />
IAS 1 (amendments) ‘Presentation of Financial Statements’ clarify that entities may present the required reconciliations<br />
for each component of other comprehensive income either in the statement of changes in equity or in the notes to the<br />
financial statements.<br />
IAS 34 (amendments) ‘Interim Financial Reporting’ provide guidance to illustrate how to apply disclosure principles in IAS 34 and<br />
add disclosure requirements around the circumstances likely to affect fair values of financial instruments and their classification,<br />
transfers of financial instruments between different levels of fair value hierarchy, changes in classification of financial assets and<br />
changes in contingent liabilities and assets.<br />
IFRIC 13 (amendment) ‘Customer Loyalty Programmes’ clarifies that when the fair value of award credits is measured on the<br />
basis of the value of the awards for which they could be redeemed, the fair value of the award credits should take account of<br />
expected forfeitures as well as the discounts or incentives that would otherwise be offered to customers who have not earned<br />
award credits from an initial sale.<br />
Annual Report 2011 25
Notes to the Financial Statements<br />
1 Principal Accounting Policies continued<br />
Basis of preparation continued<br />
Standards and amendments effective after 2011 which are relevant to the Group’s operations and yet to be adopted<br />
Amendments to IFRS 7<br />
IFRS 9<br />
IFRS 10<br />
IFRS 11<br />
IFRS 12<br />
IFRS 13<br />
Amendments to IAS 1<br />
IAS 19 (amended 2011)<br />
IAS 27 (2011)<br />
IAS 28 (2011)<br />
Financial Instruments: Disclosures on Derecognition<br />
Financial Instruments<br />
Consolidated Financial Statements<br />
Joint Arrangements<br />
Disclosure of Interests in Other Entities<br />
Fair value Measurement<br />
Presentation of Items of Other Comprehensive Income<br />
Employee Benefits<br />
Separate Financial Statements<br />
Investments in Associates and Joint Ventures<br />
Amendments to IFRS 7 ‘Financial Instruments: Disclosures on Derecognition’ (effective for annual period beginning 1st July 2011)<br />
promotes transparency in the reporting of transfer transactions and improves users’ understanding of the risk exposures relating<br />
to transfer of financial assets and the effect of those risks on an entity’s financial position particularly those involving securitisation<br />
of financial assets.<br />
IFRS 9 ‘Financial Instruments’ (effective from 1st January 2015) is the first standard issued as part of a wider project to replace<br />
IAS 39. IFRS 9 retains but simplifies the mixed measurement model and establishes two primary measurement categories for<br />
financial assets: amortised cost and fair value. The basis of classification depends on the entity’s business model and the<br />
contractual cash flow characteristics of the financial asset. IFRS 9 is likely to affect the Group’s accounting for its financial<br />
assets. The Group has yet to assess the full impact of IFRS 9 and will apply the standard from 1st January 2015.<br />
IFRS 10 ‘Consolidated Financial Statements’ (effective 1st January 2013) replaces SIC Interpretation 12 ‘Consolidation –<br />
Special Purpose Entities’ and most of IAS 27 ‘Consolidated and Separate Financial Statements’. It contains a new single<br />
consolidation model that identifies control as the basis for consolidation for all types of entities. It provides a definition of control<br />
that comprises the elements of power over an investee; exposure of rights to variable returns from an investees; and ability<br />
to use power to affect the reporting entity’s returns. The Group has yet to assess the full impact of IFRS 10 and will apply<br />
the standard from 1st January 2013.<br />
IFRS 11 ‘Joint Arrangements’ (effective 1st January 2013) replaces IAS 31 ‘Interests in Joint Ventures’ and classifies joint<br />
arrangements as either joint operations (whereby the parties that have joint control have rights to the assets and obligations for<br />
the liabilities of the joint arrangements) or joint ventures (whereby the parties that have joint control have rights to the net assets<br />
of the joint arrangements). It prescribes the accounting for interests in joint operations as its interest in the assets, liabilities,<br />
revenues and expenses. The current option permitted by IAS 28 (amended) to proportionately consolidate for joint ventures is<br />
no longer permitted. The Group has yet to assess the full impact of IFRS 11 and will apply the standard from 1st January 2013.<br />
IFRS 12 ‘Disclosure of Interests in Other Entities’ (effective 1st January 2013) requires entities to disclose information that helps<br />
financial statements readers to evaluate the nature, risks and financial effects associated with the entity’s interests in subsidiaries,<br />
associates, joint arrangements and unconsolidated structured entities. Disclosure required includes significant judgements and<br />
assumptions made in determining whether an entity controls, jointly controls, significantly influences or has some other interest<br />
in other entities. The Group will apply the standard from 1st January 2013.<br />
IFRS 13 ‘Fair Value Measurement’ (effective 1st January 2013) requires entities to disclose information about the valuation<br />
techniques and inputs used to measure fair value, as well as information about the uncertainty inherent in fair value measurements.<br />
The standard applies to both financial and non-financial items measured at fair value. Fair value is now defined as ‘the price that<br />
would be received to sell an asset or paid to transfer a liability in an orderly transaction between market participants at the<br />
measurement date’ (i.e. an exit price). The Group will apply the standard from 1st January 2013.<br />
Amendments to IAS 1 ‘Presentation of Items of Other Comprehensive Income’ (effective from 1st July 2012) improves the<br />
consistency and clarity of the presentation of items of other comprehensive income. The amendments require entities to separate<br />
items presented in other comprehensive income into two groups, based on whether or not they may be recycled to profit or<br />
loss in the future. Items that will not be recycled − such as actuarial gains or losses on defined benefit pension plans − will be<br />
presented separately from items that may be recycled in the future − such as deferred gains and losses on cash flow hedges.<br />
The amounts of tax related to the two groups are required to be allocated on the same basis. The Group will apply the standard<br />
from 1st January 2013.<br />
26 <strong>Hongkong</strong> <strong>Land</strong>
1 Principal Accounting Policies continued<br />
Basis of preparation continued<br />
Standards and amendments effective after 2011 which are relevant to the Group’s operations and yet to be adopted<br />
continued<br />
IAS 19 (amended 2011) ‘Employee Benefits’ (effective 1st January 2013) requires the assumed return on plan assets recognised<br />
in the profit and loss to be the same as the rate used to discount the defined benefit obligation. It also requires actuarial gains<br />
and losses to be recognised immediately in other comprehensive income and past service costs immediately in profit or<br />
loss. Additional disclosures are required to present the characteristics of benefit plans, the amount recognised in the financial<br />
statements, and the risks arising from defined benefit plans and multi-employer plans. The Group will apply the standard from<br />
1st January 2013.<br />
IAS 27 (2011) ‘Separate Financial Statements’ (effective 1st January 2013) supersedes IAS 27 (2008) and prescribes the<br />
accounting and disclosure requirements for investments in subsidiaries, joint ventures and associates when an entity prepares<br />
separate financial statements. There will be no impact on the consolidated financial statements as the changes only affect the<br />
separate financial statements of the investing entity.<br />
IAS 28 (2011) ‘Investments in Associates and Joint Ventures’ (effective 1st January 2013) supersedes IAS 28 (2008) and<br />
prescribes the accounting for investments in associates and joint ventures and sets out the requirements for the application<br />
of the equity method when accounting for investments in associates and joint ventures. The adoption of this standard is not<br />
expected to have any significant impact on the results of the Group as the Group is already following the standard.<br />
In addition to the above, the IASB has also issued IFRS 9 ‘Financial Instruments’ (2009) and IFRS 9 (2010) which are effective<br />
from 1st January 2013. However, in August 2011, the IASB issued an exposure draft that proposes to delay the effective date<br />
of IFRS 9, ‘Financial instruments’, to annual periods beginning on or after 1st January 2015. The original effective date was for<br />
annual periods beginning on or after from 1st January 2013. This proposal is a result of the extension of the IASB’s timeline<br />
for completing the remaining phases (for example, impairment and hedge accounting) of its project to replace IAS 39 beyond<br />
June 2011. IFRS 9 (2009) is the first standard issued as part of a wider project to replace IAS 39. It retains but simplifies the<br />
mixed measurement model and establishes two primary measurement categories for financial assets: amortised cost and fair<br />
value. The basis of classification depends on the entity’s business model and the contractual cash flow characteristics of the<br />
financial asset. The guidance in IAS 39 on impairment of financial assets and hedge accounting continues to apply. IFRS 9 (2010)<br />
adds the requirements related to the classification and measurement of financial liabilities, and derecognition of financial assets<br />
and liabilities, to the version issued in November 2009. It also includes those paragraphs of IAS 39 dealing with how to measure<br />
fair value and accounting for derivatives embedded in a contract that contains a host that is not a financial asset, as well as the<br />
requirements of IFRIC 9 ‘Remeasurement of Embedded Derivatives’. The Group will apply the standard from 1st January 2015.<br />
The principal operating subsidiaries, associates and joint ventures have different functional currencies in line with the economic<br />
environments of the locations in which they operate. The functional currency of the Company is United States dollars. The consolidated<br />
financial statements are presented in United States dollars.<br />
The Group’s reportable segments are set out in Note 4.<br />
Basis of consolidation<br />
i) The consolidated financial statements include the financial statements of the Company, its subsidiaries, and its associates<br />
and joint ventures.<br />
ii)<br />
Subsidiaries are entities over which the Group has the power to govern the financial and operating policies. The purchase<br />
method of accounting is used to account for the acquisition of subsidiaries by the Group. The cost of an acquisition includes<br />
the fair value at the acquisition date of any contingent consideration. In a business combination achieved in stages, the Group<br />
remeasures its previously held interest in the acquiree at its acquisition-date fair value and recognised the resulting gain or<br />
loss in profit and loss. Changes in a parent’s ownership interest in a subsidiary that do not result in the loss of control are<br />
accounted for as equity transactions. When control over a previous subsidiary is lost, any remaining interest in the entity<br />
is remeasured at fair value and the resulting gain or loss is recognised in profit and loss.<br />
All material intercompany transactions, balances and unrealised surpluses and deficits on transactions between Group<br />
companies have been eliminated. The cost of and related income arising from shares held in the Company by subsidiaries<br />
are eliminated from shareholders’ funds and non-controlling interests, and profit respectively.<br />
Annual Report 2011 27
Notes to the Financial Statements<br />
1 Principal Accounting Policies continued<br />
Basis of consolidation continued<br />
iii) Associates are entities, not being subsidiaries or joint ventures, over which the Group exercises significant influence.<br />
Joint ventures are entities which the Group jointly controls with one or more other venturers. Associates and joint ventures<br />
are included on the equity basis of accounting.<br />
iv) Non-controlling interests represent the proportion of the results and net assets of subsidiaries and their associates and<br />
joint ventures not attributable to the Group.<br />
v) The results of subsidiaries, associates and joint ventures are included or excluded from their effective dates of acquisition<br />
or disposal respectively. The results of entities other than subsidiaries, associates and joint ventures are included to the<br />
extent of dividends received when the right to receive such dividend is established.<br />
Foreign currencies<br />
Transactions in foreign currencies are accounted for at the exchange rates ruling at the transaction dates.<br />
Assets and liabilities of subsidiaries, associates and joint ventures, together with all other monetary assets and liabilities<br />
expressed in foreign currencies, are translated into United States dollars at the rates of exchange ruling at the year end. Results<br />
expressed in foreign currencies are translated into United States dollars at the average rates of exchange ruling during the year,<br />
which approximate the exchange rates at the dates of the transactions.<br />
<strong>Exchange</strong> differences arising from the retranslation of the net investment in foreign subsidiaries, associates and joint ventures,<br />
and of financial instruments which are designated as hedges of such investments, are recognised in other comprehensive income<br />
and accumulated in equity under exchange reserves. On the disposal of these investments which results in the loss of control,<br />
such exchange differences are recognised in profit and loss. <strong>Exchange</strong> differences on available-for-sale investments are recognised<br />
in other comprehensive income as part of the gains and losses arising from changes in their fair value. <strong>Exchange</strong> differences<br />
relating to changes in the amortised cost of monetary securities classified as available-for-sale and all other exchange differences<br />
are recognised in profit and loss.<br />
Goodwill and fair value adjustments arising on acquisition of a foreign entity after 1st January 2003 are treated as assets and<br />
liabilities of the foreign entity and translated into United States dollars at the rate of exchange ruling at the year end.<br />
Impairment<br />
Assets that have indefinite useful lives are not subject to amortisation and are tested for impairment annually and whenever there<br />
is an indication that the assets may be impaired. Assets that are subject to amortisation are reviewed for impairment whenever<br />
events or changes in circumstances indicate that the carrying amount may not be recoverable. For the purpose of assessing<br />
impairment, assets are grouped at the lowest level for which there is separately identifiable cash flows. Cash-generating units or<br />
groups of cash-generating units to which goodwill has been allocated are tested for impairment annually and whenever there is<br />
an indication that the units may be impaired. An impairment loss is recognised for the amount by which the carrying amount of<br />
the asset exceeds its recoverable amount, which is the higher of an asset’s fair value less costs to sell and value in use.<br />
Intangible assets<br />
Goodwill represents the excess of the cost of an acquisition over the fair value of the Group’s share of the net identifiable assets<br />
of the acquired subsidiary, associate or joint venture at the effective date of acquisition. Non-controlling interests are measured at<br />
their proportionate share of the net identifiable assets at the acquisition date. If the cost of acquisition is less than the fair value of<br />
the net assets acquired, the difference is recognised directly in profit and loss. Goodwill on acquisitions of subsidiaries is included<br />
in intangible assets. Goodwill on acquisitions of associates and joint ventures is included in investment in associates and joint<br />
ventures. Goodwill is allocated to cash-generating units or groups of cash-generating units for the purpose of impairment testing<br />
and is carried at cost less accumulated impairment loss.<br />
The profit or loss on disposal of subsidiaries, associates and joint ventures includes the carrying amount of goodwill relating to<br />
entity sold.<br />
28 <strong>Hongkong</strong> <strong>Land</strong>
1 Principal Accounting Policies continued<br />
Tangible fixed assets and depreciation<br />
Depreciation of tangible fixed assets is calculated on the straight line basis to allocate the cost or valuation of each asset to<br />
its residual value over its estimated useful life. The residual values and useful lives are reviewed at each balance sheet date.<br />
The estimated useful lives are as follows:<br />
Furniture, equipment and motor vehicles<br />
3 – 10 years<br />
Where the carrying amount of a tangible fixed asset is greater than its estimated recoverable amount, it is written down<br />
immediately to its recoverable amount.<br />
The profit or loss on disposal of tangible fixed assets is recognised by reference to their carrying amount.<br />
Investment properties<br />
Properties including those under operating leases which are held for long-term rental yields or capital gains are classified and<br />
accounted for as investment properties, but the business model does not necessarily envisage that the properties will be held<br />
for their entire useful life. Investment properties are carried at fair value, representing estimated open market value determined<br />
annually by independent qualified valuers who have recent experience in the location and category of the investment property<br />
being valued. The market value of each property is calculated on the discounted net rental income allowing for reversionary<br />
potential. Changes in fair value are recognised in profit and loss.<br />
Investments<br />
i) Investments are classified by management as available for sale or held to maturity on initial recognition. Available-for-sale<br />
investments are shown at fair value. Gains and losses arising from changes in the fair value are recognised in other<br />
comprehensive income. On the disposal of an investment or when an investment is determined to be impaired, the<br />
cumulative gain or loss previously deferred in equity is recognised in profit and loss. Held-to-maturity investments are<br />
shown at amortised cost. Investments are classified under non-current assets unless they are expected to be realised<br />
within twelve months after the balance sheet date.<br />
ii)<br />
At each balance sheet date, the Group assesses whether there is objective evidence that an investment is impaired.<br />
In the case of equity securities classified as available for sale, a significant or prolonged decline in the fair value of the<br />
security below its cost is considered as an indicator that the securities are impaired.<br />
iii) All purchases and sales of investments are recognised on the trade date, which is the date that the Group commits to<br />
purchase or sell the investment.<br />
Leases<br />
Leases are classified as finance leases when the terms of the lease transfer substantially all the risks and rewards of ownership<br />
to the lessee. All other leases are classified as operating leases.<br />
Properties for sale<br />
Properties for sale, which comprise land and buildings held for resale, are stated at the lower of cost and net realisable value.<br />
The cost of properties for sale comprises land cost, and construction and other development costs.<br />
Debtors<br />
Debtors, excluding derivative financial instruments, are measured at amortised cost except where the effect of discounting would<br />
be immaterial. Provision for impairment is established when there is objective evidence that the outstanding amounts will not be<br />
collected. Significant financial difficulties of the debtor, probability that the debtor will enter bankruptcy or financial reorganisation,<br />
and default or delinquency in payments are considered indicators that the debtor is impaired. The carrying amount of the asset is<br />
reduced through the use of an allowance account and the amount of the loss is recognised in arriving at operating profit. When<br />
a debtor is uncollectible, it is written off against the allowance account. Subsequent recoveries of amount previously written off<br />
are credited to profit and loss.<br />
Debtors with maturities greater than twelve months after the balance sheet date are classified under non-current assets.<br />
Annual Report 2011 29
Notes to the Financial Statements<br />
1 Principal Accounting Policies continued<br />
Cash and cash equivalents<br />
For the purposes of the cash flow statement, cash and cash equivalents comprise deposits with banks, and bank and cash<br />
balances, net of bank overdrafts. In the balance sheet, bank overdrafts are included in current borrowings.<br />
Provisions<br />
Provisions are recognised when the Group has present legal or constructive obligations as a result of past events, it is probable<br />
that an outflow of resources embodying economic benefits will be required to settle the obligations, and a reliable estimate of<br />
the amount of the obligations can be made.<br />
Borrowings and borrowing costs<br />
Borrowings are initially recognised at fair value, net of transaction costs incurred. In subsequent periods, borrowings are stated<br />
at amortised cost using the effective interest method.<br />
On the issue of convertible bonds, the fair value of the liability portion is determined using a market interest rate for an<br />
equivalent non-convertible bond; this amount is included in long-term borrowings on the amortised cost basis until extinguished<br />
on conversion or maturity of the bond. The remainder of the proceeds is allocated to the conversion option which is recognised<br />
and included in shareholders’ funds.<br />
Borrowing costs relating to major development projects are capitalised until the asset is substantially completed. Capitalised<br />
borrowing costs are included as part of the cost of the asset. All other borrowing costs are expensed as incurred.<br />
Borrowings are classified under non-current liabilities unless they are due to be settled within twelve months after the balance<br />
sheet date.<br />
Deferred tax<br />
Deferred tax is provided, using the liability method, for all temporary differences arising between the tax bases of assets and<br />
liabilities and their carrying values. Deferred tax is determined using tax rates and laws that have been enacted or substantially<br />
enacted by the balance sheet date and are expected to apply when the related deferred tax asset is realised or the deferred tax<br />
liability is settled.<br />
Provision for deferred tax is made on the revaluation of certain non-current assets and, in relation to acquisitions, on the difference<br />
between the fair value of the net assets acquired and their tax base. Deferred tax is provided on temporary differences associated<br />
with investments in subsidiaries, associates and joint ventures, except where the Group is able to control the reversal of the<br />
temporary difference and it is probable that the temporary difference will not reverse in the foreseeable future. Deferred tax<br />
assets relating to the carry forward of unused tax losses are recognised to the extent that it is probable that future taxable profit<br />
will be available against which the unused tax losses can be utilised.<br />
Pension obligations<br />
The Group operates a number of defined benefit and defined contribution plans, the assets of which are held in trustee<br />
administered funds.<br />
Pension accounting costs for defined benefit plans are assessed using the projected unit credit method. Under this method,<br />
the costs of providing pensions are charged to profit and loss spreading the regular cost over the service lives of employees in<br />
accordance with the advice of qualified actuaries, who carry out a full valuation of major plans every year. The pension obligations<br />
are measured as the present value of the estimated future cash outflows by reference to market yields on high quality corporate<br />
bonds which have terms to maturity approximating the terms of the related liability. Plan assets are measured at fair value.<br />
Actuarial gains and losses are recognised in other comprehensive income in the year in which they occur.<br />
The Group’s total contributions relating to the defined contribution plans are charged to profit and loss in the year to which<br />
they relate.<br />
Non-current assets held for sale<br />
Non-current assets are classified as assets held for sale and stated at the lower of carrying amount and fair value less costs to<br />
sell if their carrying amount is recovered principally through a sale transaction rather than through continuing use.<br />
30 <strong>Hongkong</strong> <strong>Land</strong>
1 Principal Accounting Policies continued<br />
Derivative financial instruments<br />
The Group only enters into derivative financial instruments in order to hedge underlying exposures. Derivative financial instruments<br />
are initially recognised at fair value on the date a derivative contract is entered into and are subsequently remeasured at their fair<br />
value. The method of recognising the resulting gain or loss is dependent on the nature of the item being hedged. The Group<br />
designates certain derivatives as a hedge of the fair value of a recognised asset or liability (fair value hedge), or a hedge of a<br />
forecast transaction or of the foreign currency risk on a firm commitment (cash flow hedge), or a hedge of a net investment in<br />
a foreign entity.<br />
Changes in the fair value of derivatives that are designated and qualify as fair value hedges and that are highly effective, are<br />
recognised in profit and loss, along with any changes in the fair value of the hedged asset or liability that is attributable to the<br />
hedged risk. When a hedging instrument expires or is sold, or when a hedge no longer meets the criteria for hedge accounting,<br />
the cumulative adjustment to the carrying amount of a hedged item for which the effective interest method is used is amortised<br />
to profit and loss over the residual period to maturity.<br />
Changes in the fair value of derivatives that are designated and qualify as cash flow hedges and that are highly effective, are<br />
recognised in other comprehensive income and accumulated in equity under hedging reserves. Where the forecast transaction<br />
or firm commitment results in the recognition of a non-financial asset or of a non-financial liability, the gains and losses previously<br />
deferred in hedging reserves are transferred from hedging reserves and included in the initial measurement of the cost of the<br />
asset or liability. Otherwise, amounts deferred in hedging reserves are transferred to profit and loss in the same periods during<br />
which the hedged firm commitment or forecast transaction affects profit and loss. When a hedging instrument expires or is sold,<br />
or when a hedge no longer meets the criteria for hedge accounting, any cumulative gain or loss existing in hedging reserves at<br />
that time remains in the hedging reserves and is recognised when the committed or forecast transaction ultimately is recognised<br />
in profit and loss. When a committed or forecast transaction is no longer expected to occur, the cumulative gain or loss that was<br />
reported in hedging reserves is immediately transferred to profit and loss.<br />
Certain derivative transactions, while providing effective economic hedges under the Group’s risk management policies, do not<br />
qualify for hedge accounting under the specific rules in IAS 39. Changes in the fair value of any derivative instruments that do not<br />
qualify for hedge accounting under IAS 39 are recognised immediately in profit and loss.<br />
Hedges of net investments in foreign entities are accounted for on a similar basis to that used for cash flow hedges. Any gain or<br />
loss on the hedging instrument relating to the effective portion of the hedge is recognised in exchange reserves; the gain or loss<br />
relating to the ineffective portion is recognised immediately in profit and loss.<br />
The fair value of derivatives which are designated and qualify as effective hedges are classified as non-current assets or liabilities<br />
if the remaining maturities of the hedged assets or liabilities are greater than twelve months after the balance sheet date.<br />
Financial guarantee contracts<br />
Financial guarantee contracts under which the Group accepts significant risk from a third party by agreeing to compensate<br />
that party on the occurrence of a specified uncertain future event are accounted for in a manner similar to insurance contracts.<br />
Provisions are recognised when it is probable that the Group has obligations under such guarantees and an outflow of resources<br />
embodying economic benefits will be required to settle the obligations.<br />
Non-trading items<br />
Non-trading items are separately identified to provide greater understanding of the Group’s underlying business performance.<br />
Items classified as non-trading items include fair value gains or losses on revaluation of investment properties; gains and losses<br />
arising from the sale of businesses, investments and investment properties; impairment of non-depreciable intangible assets and<br />
other investments; provisions for the closure of businesses; acquisition-related costs in business combinations; and other credits<br />
and charges of a non-recurring nature that require inclusion in order to provide additional insight into underlying business<br />
performance.<br />
Earnings per share<br />
Basic earnings per share are calculated on profit attributable to shareholders and on the weighted average number of shares in<br />
issue during the year. For the purpose of calculating diluted earnings per share, profit attributable to shareholders is adjusted for<br />
the effects of the conversion of dilutive potential ordinary shares, and the weighted average number of shares is adjusted for<br />
the number of shares which are deemed to be issued on the conversion of convertible bonds into ordinary shares.<br />
Annual Report 2011 31
Notes to the Financial Statements<br />
1 Principal Accounting Policies continued<br />
Dividends<br />
Dividends proposed or declared after the balance sheet date are not recognised as a liability at the balance sheet date.<br />
Revenue recognition<br />
Revenue is measured at the fair value of the consideration received and receivable and represents amounts receivable for goods<br />
and services provided in the normal course of business, net of discounts and sales related taxes.<br />
i) Revenue from sale of properties is recognised on the transfer of significant risks and rewards of ownership, which generally<br />
coincides with the time when the properties are delivered to customers.<br />
ii)<br />
Receipts under operating leases are accounted for on an accrual basis over the lease terms.<br />
iii) Revenue from rendering of services is recognised when services are performed, provided that the amount can be<br />
measured reliably.<br />
iv) Dividend income is recognised when the right to receive payment is established.<br />
2 Financial Risk Management<br />
Financial risk factors<br />
The Group’s activities expose it to a variety of financial risks: market risk (including foreign exchange risk, interest rate risk and<br />
price risk), credit risk and liquidity risk.<br />
The Group’s treasury function co-ordinates, under the directions of the Board of <strong>Hongkong</strong> <strong>Land</strong> <strong>Limited</strong>, financial risk management<br />
policies and their implementation on a group-wide basis. The Group’s treasury policies are designed to manage the financial<br />
impact of fluctuations in interest rates and foreign exchange rates and to minimise the Group’s financial risks. The Group uses<br />
derivative financial instruments, principally interest rate swaps, cross-currency swaps and forward foreign exchange contracts as<br />
appropriate for hedging transactions and managing the Group’s assets and liabilities in accordance with the Group’s financial risk<br />
management policies. Financial derivative contracts are executed between third party banks and the Group entity that is directly<br />
exposed to the risk being hedged. Certain derivative transactions, while providing effective economic hedges under the Group’s<br />
risk management policies, do not qualify for hedge accounting under the specific rules in IAS 39. Changes in the fair value of any<br />
derivative instruments that do not qualify for hedge accounting under IAS 39 are recognised immediately in profit and loss account.<br />
It is the Group’s policy not to enter into derivative transactions for speculative purposes. The notional amounts and fair values of<br />
derivative financial instruments at 31st December 2011 are disclosed in Note 25.<br />
i) Market risk<br />
Foreign exchange risk<br />
Entities within the Group are exposed to foreign exchange risk from future commercial transactions, net investments in<br />
foreign operations and net monetary assets and liabilities that are denominated in a currency that is not the entity’s<br />
functional currency.<br />
Entities in the Group use forward foreign exchange contracts in a consistent manner to hedge firm and anticipated foreign<br />
exchange commitments and manage their foreign exchange risk arising from future commercial transactions. The Group does<br />
not usually hedge its net investments in foreign operations except in circumstances where there is a material exposure arising<br />
from a currency that is anticipated to be volatile and the hedging is cost effective. Group companies are required to manage<br />
their foreign exchange risk against their functional currency. Foreign currency borrowings are swapped into the entity’s<br />
functional currency using cross-currency swaps except where the foreign currency borrowings are repaid with cash flows<br />
generated in the same foreign currency. The purpose of these hedges is to mitigate the impact of movements in foreign<br />
exchange rates on assets and liabilities and the profit and loss account of the Group.<br />
Currency risks as defined by IFRS 7 arise on account of monetary assets and liabilities being denominated in a currency that<br />
is not the functional currency. At 31st December 2011, there are no significant monetary balances held by group companies<br />
that are denominated in a non-functional currency. Differences resulting from the translation of financial statements into the<br />
Group’s presentation currency are not taken into consideration.<br />
Since the Group manages the interdependencies between foreign exchange risk and interest rate risk of foreign currency<br />
borrowings using cross-currency swaps, the sensitivity analysis on financial impacts arising from cross-currency swaps is<br />
included in the sensitivity assessment on interest rates under the interest rate risk section.<br />
32 <strong>Hongkong</strong> <strong>Land</strong>
2 Financial Risk Management continued<br />
Financial risk factors continued<br />
i) Market risk continued<br />
Interest rate risk<br />
The Group is exposed to interest rate risk through the impact of rate changes on interest bearing liabilities and assets. These<br />
exposures are managed partly by using natural hedges that arise from offsetting interest rate sensitive assets and liabilities,<br />
and partly through the use of derivative financial instruments such as interest rate swaps. The Group monitors interest rate<br />
exposure on a monthly basis by currency and business unit, taking into consideration proposed financing and hedging<br />
arrangements. The Group’s guideline is to maintain 40% to 60% of its gross borrowings in fixed rate instruments with an<br />
average tenor of two to three years. At 31st December 2011, the Group’s interest rate hedge was 52% (2010: 62%) with<br />
an average tenor of nine years (2010: six years). The interest rate profile of the Group’s borrowings after taking into account<br />
hedging transactions are set out in Note 21.<br />
Cash flow interest rate risk is the risk that changes in market interest rates will impact cash flows arising from variable rate<br />
financial instruments. Borrowings at floating rates therefore expose the Group to cash flow interest rate risk. The Group<br />
manages this risk by using forward rate agreements to a maturity of one year, and by entering into interest rate swaps for<br />
a maturity of up to five years. Forward rate agreements and interest rate swaps have the economic effect of converting<br />
borrowings from floating rate to fixed rate.<br />
Fair value interest rate risk is the risk that the value of a financial asset or liability and derivative financial instrument will<br />
fluctuate because of changes in market interest rates. The Group manages its fair value interest rate risk by entering into<br />
interest rate swaps which have the economic effect of converting borrowings from fixed rate to floating rate.<br />
At 31st December 2011, if interest rates had been 100 basis points higher/lower with all other variables held constant,<br />
the Group’s profit after tax would have been US$5 million (2010: US$7 million) higher/lower, and hedging reserve would<br />
have been US$54 million (2010: US$45 million) higher/lower as a result of fair value changes to cash flow hedges. The<br />
sensitivity analysis has been determined assuming that the change in interest rates had occurred at the balance sheet<br />
date and had been applied to the exposure to interest rate risk for both derivative and non-derivative financial instruments<br />
in existence at that date. The 100 basis point increase or decrease represents management’s assessment of a reasonably<br />
possible change in those interest rates which have the most impact on the Group, specifically the United States, Hong Kong<br />
and Singapore rates, over the period until the next annual balance sheet date. In the case of effective fair value hedges,<br />
changes in fair value of the hedged item caused by interest rate movements balance out in profit and loss account against<br />
changes in the fair value of the hedging instruments. Changes in market interest rates affect the interest income or expense<br />
of non-derivative variable-interest financial instruments, the interest payments of which are not designated as hedged items<br />
of cash flow hedges against interest rate risks. As a consequence, they are included in the calculation of profit after tax<br />
sensitivities. Changes in the market interest rate of financial instruments that were designated as hedging instruments in<br />
a cash flow hedge to hedge payment fluctuations resulting from interest rate movements affect the hedging reserves and<br />
are therefore taken into consideration in the equity-related sensitivity calculations.<br />
Price risk<br />
The Group is exposed to securities price risk because of listed investments which are available for sale and held by the Group<br />
at fair value. Gains and losses arising from changes in the fair value of available-for-sale investments are recognised in other<br />
comprehensive income. The performance of the Group’s listed and unlisted available-for-sale investments are monitored<br />
regularly, together with an assessment of their relevance to the Group’s long term strategic plans. Details of the Group’s<br />
available-for-sale investments are contained in Note 14.<br />
Available-for-sale investments are unhedged. At 31st December 2011, if the price of listed and unlisted available-for-sale<br />
investments had been 25% higher/lower with all other variables held constant, total equity would have been US$12 million<br />
(2010: US$15 million) higher/lower. The sensitivity analysis has been determined based on a reasonable expectation of<br />
possible valuation volatility over the next twelve months.<br />
Annual Report 2011 33
Notes to the Financial Statements<br />
2 Financial Risk Management continued<br />
Financial risk factors continued<br />
ii) Credit risk<br />
The Group’s credit risk is primarily attributable to deposits with banks, credit exposures to customers and derivative financial<br />
instruments with a positive fair value. The Group has credit policies in place and the exposures to these credit risks are<br />
monitored on an ongoing basis.<br />
The Group manages its deposits with banks and financial institutions and transactions involving derivative financial<br />
instruments by monitoring credit ratings and capital adequacy ratios of counterparties, and limiting the aggregate risk to any<br />
individual counterparty. The utilisation of credit limits is regularly monitored. At 31st December 2011, 90% (2010: 100%) of<br />
deposits and balances with banks were made to institutions with credit ratings of no less than A3 and 10% with credit rating<br />
at Baa3 (Moody’s). Similarly transactions involving derivative financial instruments are with banks with sound credit ratings<br />
and capital adequacy ratios. In developing countries it may be necessary to deposit money with banks that have a lower credit<br />
rating, however the Group only enters into derivative transactions with counterparties which have credit ratings of at least<br />
investment grade. Management does not expect any counterparty to fail to meet its obligations.<br />
In respect of credit exposures to customers, the Group has policies in place to ensure that investment properties are let<br />
principally to corporate companies with appropriate credit history. Rental deposits in the form of cash or bank guarantee<br />
are usually received from tenants. The Group receives progress payments from sales of residential properties to individual<br />
customers prior to the completion of transactions. In the event of default by customers, Group companies undertake legal<br />
proceedings to recover the property. Amounts due from associates and joint ventures are generally supported by the<br />
underlying assets.<br />
The maximum exposure to credit risk is represented by the carrying amount of each financial asset in the balance sheet after<br />
deducting any impairment allowance.<br />
iii) Liquidity risk<br />
Prudent liquidity risk management includes managing the profile of debt maturities and funding sources, maintaining sufficient<br />
cash and marketable securities, and ensuring the availability of funding from an adequate amount of committed credit facilities<br />
and the ability to close out market positions. The Group’s ability to fund its existing and prospective debt requirements is<br />
managed by maintaining diversified funding sources with adequate committed funding lines from high quality lenders, and by<br />
monitoring rolling short-term forecasts of the Group’s cash and gross debt on the basis of expected cash flows. In addition<br />
long-term cash flows are projected to assist with the Group’s long-term debt financing plans.<br />
At 31st December 2011, total committed and uncommitted borrowing facilities amounted to US$5,459 million<br />
(2010: US$6,184 million) of which US$3,327 million (2010: US$3,725 million) was drawn down. Undrawn committed<br />
facilities, in the form of revolving credit and term loan facilities, totalled US$1,934 million (2010: US$2,262 million).<br />
34 <strong>Hongkong</strong> <strong>Land</strong>
2 Financial Risk Management continued<br />
Financial risk factors continued<br />
iii) Liquidity risk continued<br />
The table below analyses the Group’s non-derivative financial liabilities and net-settled derivative financial liabilities into<br />
relevant maturity groupings based on the remaining period at the balance sheet date to the contractual maturity date.<br />
Derivative financial liabilities are included in the analysis if their contractual maturities are essential for an understanding<br />
of the timing of the cash flows. The amounts disclosed in the table are the contractual undiscounted cash flows.<br />
Between Between Between Between Total<br />
Within one and two and three and four and Beyond undiscounted<br />
one year two years three years four years five years five years cash flow<br />
US$m US$m US$m US$m US$m US$m US$m<br />
At 31st December 2011<br />
Borrowings 166.5 784.9 610.2 358.9 365.6 1,846.8 4,132.9<br />
Creditors 307.2 38.6 49.2 20.4 10.6 20.7 446.7<br />
Net settled derivative<br />
financial instruments 5.7 3.5 1.5 – – – 10.7<br />
At 31st December 2010<br />
Borrowings 976.4 548.7 456.8 574.6 354.1 1,757.7 4,668.3<br />
Creditors 314.8 50.6 38.8 15.2 18.7 16.0 454.1<br />
Net settled derivative<br />
financial instruments 8.4 6.2 3.8 1.5 – – 19.9<br />
Capital management<br />
The Group’s objectives when managing capital are to safeguard the Group’s ability to continue as a going concern whilst seeking<br />
to maximise benefits to shareholders and other stakeholders. Capital is equity as shown in the consolidated balance sheet plus<br />
net debt.<br />
The Group actively and regularly reviews and manages its capital structure to ensure optimal capital structure and shareholder<br />
returns, taking into consideration the future capital requirements of the Group and capital efficiency, prevailing and projected<br />
profitability, projected operating cash flows, projected capital expenditures and projected strategic investment opportunities.<br />
In order to maintain or adjust the capital structure, the Group may adjust the amount of dividends paid to shareholders, purchase<br />
Group shares, return capital to shareholders, issue new shares or sell assets to reduce debt.<br />
The Group monitors capital on the basis of the Group’s consolidated gearing ratio and consolidated interest cover. The gearing<br />
ratio is calculated as net debt divided by total equity. Net debt is calculated as total borrowings less bank balances. Interest cover<br />
is calculated as underlying operating profit including the Group’s share of operating profit within associates and joint ventures<br />
divided by net financing charges including the Group’s share of net financing charges within associates and joint ventures. The<br />
Group does not have a defined gearing or interest cover benchmark or range.<br />
The ratios at 31st December 2010 and 2011 are as follows:<br />
2011 2010<br />
Gearing ratio (%) 10 12<br />
Interest cover (times) 10 12<br />
Annual Report 2011 35
Notes to the Financial Statements<br />
2 Financial Risk Management continued<br />
Fair value estimation<br />
i) Financial instruments that are measured at fair value<br />
For financial instruments that are measured at fair value in the balance sheet, the corresponding fair value measurements<br />
are disclosed by level of the following fair value measurement hierarchy:<br />
a) Quoted prices (unadjusted) in active markets for identical assets or liabilities (‘quoted prices in active markets’)<br />
The fair value of listed securities, which are classified as available-for-sale, is based on quoted prices in active markets<br />
at the balance sheet date. The quoted market price used for listed investments held by the Group is the current bid price.<br />
b) Inputs other than quoted prices in active markets that are observable for the asset or liability, either directly or indirectly<br />
(‘observable current market transactions’)<br />
The fair values of interest rate swaps and forward foreign exchange contracts have been determined using rates quoted<br />
by the Group’s bankers at the balance sheet date which are calculated by reference to the market interest rates and<br />
foreign exchange rates.<br />
c) Inputs for the asset or liability that are not based on observable market data (‘unobservable inputs’)<br />
The fair value of unlisted securities, which are classified as available-for-sale, is determined using valuation techniques<br />
by reference to observable current market transactions or the market prices of the underlying investments with certain<br />
degree of entity specific estimates.<br />
ii) Financial instruments that are not measured at fair value<br />
The fair values of current debtors, bank balances, current creditors and current borrowings are assumed to approximate<br />
their carrying amounts due to the short-term maturities of these assets and liabilities.<br />
The fair values of long-term borrowings are based on market prices or are estimated using the expected future payments<br />
discounted at market interest rates.<br />
3 Critical Accounting Estimates and Judgements<br />
Estimates and judgements used in preparing the financial statements are continually evaluated and are based on historical<br />
experience and other factors, including expectations of future events that are believed to be reasonable. The resulting accounting<br />
estimates will, by definition, seldom equal the related actual results. The estimates and assumptions that have a significant effect<br />
on the carrying amounts of assets and liabilities are discussed below.<br />
Acquisition of subsidiaries, associates and joint ventures<br />
The initial accounting on the acquisition of subsidiaries, associates and joint ventures involves identifying and determining the<br />
fair values to be assigned to the identifiable assets, liabilities and contingent liabilities of the acquired entities. The fair values of<br />
leasehold land, tangible assets and investment properties are determined by independent valuers by reference to market prices<br />
or present value of expected net cash flows from the assets. Any changes in the assumptions used and estimates made in<br />
determining the fair values, and management’s ability to measure reliably the contingent liabilities of the acquired entity will<br />
impact the carrying amount of these assets and liabilities.<br />
Investment properties<br />
The fair values of investment properties are determined by independent valuers on an open market for existing use basis<br />
calculated on the discounted net income allowing for reversionary potential.<br />
In making the judgement, considerations have been given to assumptions that are mainly based on market conditions existing<br />
at the balance sheet date and appropriate capitalisation rates. These estimates are regularly compared to actual market data and<br />
actual transactions entered into by the Group.<br />
36 <strong>Hongkong</strong> <strong>Land</strong>
3 Critical Accounting Estimates and Judgements continued<br />
Impairment of assets<br />
The Group tests annually whether goodwill and other assets that have indefinite useful lives suffered any impairment. Other<br />
assets are reviewed for impairment whenever events or changes in circumstances indicate that the carrying amount of the asset<br />
exceeds its recoverable amount. The recoverable amount of an asset or a cash generating unit is determined based on the higher<br />
of its fair value less costs to sell and its value-in-use, calculated on the basis of management’s assumptions and estimates.<br />
Changing the key assumptions, including the discount rates or the growth rate assumptions in the cash flow projections,<br />
could materially affect the value-in-use calculations.<br />
In determining when an available-for-sale equity investment is impaired, significant judgement is required. In making this<br />
judgement, the Group evaluates, among other factors, the duration and extent to which the fair value of an investment is less<br />
than its cost; and the financial health of and near-term business outlook for the investee, including factors such as industry and<br />
sector performance, changes in technology and operational and financial cash flows.<br />
Income taxes<br />
The Group is subject to income taxes in numerous jurisdictions. Significant judgement is required in determining the worldwide<br />
provision for income taxes. There are many transactions and calculations for which the ultimate tax determination is uncertain<br />
during the ordinary course of business. Where the final tax outcome of these matters is different from the amounts that were<br />
initially recorded, such differences will impact the income tax and deferred tax provisions in the period in which such determination<br />
is made.<br />
Provision of deferred tax follows the way management expects to recover or settle the carrying amount of the related assets or<br />
liabilities, which the management may expect to recover through use, sale or combination of both. Accordingly, deferred tax will<br />
be calculated at income tax rate, capital gains tax rate or combination of both. There is a rebuttable presumption in International<br />
Financial Reporting Standards that investment properties measured at fair value are recovered through sale. Thus, deferred tax<br />
on revaluation of investment properties held by the Group are calculated at the capital gains tax rate.<br />
Recognition of deferred tax assets, which principally relate to tax losses, depends on the management’s expectation of future<br />
taxable profit that will be available against which the tax losses can be utilised. The outcome of their actual utilisation may be<br />
different.<br />
Pension obligations<br />
The present value of the pension obligations depends on a number of factors that are determined on an actuarial basis using<br />
a number of assumptions. The assumptions used in determining the net cost/income for pensions include the expected long-term<br />
rate of return on the relevant plan assets and the discount rate. Any changes in these assumptions will impact the carrying<br />
amount of pension obligations.<br />
The expected return on plan assets assumption is determined on a uniform basis, taking into consideration long-term historical<br />
returns, asset allocation and future estimates of long-term investment returns.<br />
The Group determines the appropriate discount rate at the end of each year. This is the interest rate that should be used to<br />
determine the present value of estimated future cash outflows expected to be required to settle the pension obligations. In<br />
determining the appropriate discount rate, the Group considers the interest rates of high-quality corporate bonds that are<br />
denominated in the currency in which the benefits will be paid, and that have terms to maturity approximating the terms of<br />
the related pension liability.<br />
Other key assumptions for pension obligations are based in part on current market conditions.<br />
Non-trading items<br />
The Group uses underlying business performance in its internal financial reporting to distinguish between the underlying profits<br />
and non-trading items. The identification of non-trading items requires judgement by management.<br />
Annual Report 2011 37
Notes to the Financial Statements<br />
4 Segmental Information<br />
Operating segments are identified on the basis of internal reports about components of the Group that are regularly reviewed<br />
by the Board for the purpose of resource allocation and performance assessment. The Group operates in two operating<br />
segments namely Commercial Property and Residential Property. No operating segments have been aggregated to form<br />
the reportable segments.<br />
Underlying profit<br />
Revenue Operating profit attributable to shareholders Segment assets Segment liabilities<br />
2011 2010 2011 2010 2011 2010 2011 2010 2011 2010<br />
US$m US$m US$m US$m US$m US$m US$m US$m US$m US$m<br />
By business<br />
Commercial property 804.2 775.3 673.1 649.0 755.9 684.5 22,596.6 18,047.7 (295.1) (309.2)<br />
Residential property 419.5 565.3 209.1 287.1 282.0 432.5 1,835.2 1,465.4 (426.0) (440.3)<br />
Corporate, net financing charges and tax – – (50.5) (54.7) (334.5) (306.8) – – – –<br />
1,223.7 1,340.6 831.7 881.4 703.4 810.2 24,431.8 19,513.1 (721.1) (749.5)<br />
Change in fair value of investment properties – – 4,382.7 3,197.6 – – – – – –<br />
Asset impairment provisions, reversals and disposals – – – 0.1 – – – – – –<br />
1,223.7 1,340.6 5,214.4 4,079.1 703.4 810.2 24,431.8 19,513.1 (721.1 ) (749.5 )<br />
By geographical location<br />
Greater China 937.6 935.9 5,077.0 3,821.3 817.7 761.7 22,754.6 18,081.6 (334.0) (385.3)<br />
Southeast Asia and others 286.1 404.7 187.9 312.5 220.2 355.3 1,677.2 1,431.5 (387.1) (364.2)<br />
Corporate, net financing charges and tax – – (50.5) (54.7) (334.5) (306.8) – – – –<br />
1,223.7 1,340.6 5,214.4 4,079.1 703.4 810.2 24,431.8 19,513.1 (721.1 ) (749.5 )<br />
Operating profit 5,214.4 4,079.1 Segment assets and liabilities 24,431.8 19,513.1 (721.1) (749.5)<br />
Results of associates and joint ventures 298.0 905.3 Investments in associates and joint ventures 3,551.8 3,177.7 – –<br />
Net financing charges and tax (201.0) (199.2) Unallocated assets and liabilities 1,040.0 1,451.7 (3,538.7) (3,915.5)<br />
Profit after tax 5,311.4 4,785.2 Total assets and liabilities 29,023.6 24,142.5 (4,259.8 ) (4,665.0 )<br />
Greater China includes Hong Kong, Macau, mainland China and Taiwan.<br />
Unallocated assets and liabilities include tax assets and liabilities, bank balances and borrowings.<br />
38 <strong>Hongkong</strong> <strong>Land</strong><br />
Annual Report 2011 39
Notes to the Financial Statements<br />
5 Revenue<br />
2011 2010<br />
US$m<br />
US$m<br />
Rental income 700.3 681.8<br />
Service income 110.9 102.2<br />
Sales of properties 412.5 556.6<br />
1,223.7 1,340.6<br />
Service income includes service and management charges and hospitality service income.<br />
Total contingent rents included in rental income amounted to US$12.5 million (2010: US$9.9 million).<br />
2011 2010<br />
US$m<br />
US$m<br />
The future minimum rental payments receivable under non-cancellable leases<br />
are as follows:<br />
Within one year 633.4 598.8<br />
Between one and two years 481.5 376.3<br />
Between two and five years 479.1 402.2<br />
Beyond five years 79.1 76.3<br />
1,673.1 1,453.6<br />
Generally the Group’s operating leases are for terms of three years or more.<br />
6 Net Operating Costs<br />
2011 2010<br />
US$m<br />
US$m<br />
Cost of sales (320.2) (382.6)<br />
Other income 4.0 5.0<br />
Administrative expenses (75.8) (81.6)<br />
(392.0 ) (459.2 )<br />
The following credits/(charges) are included in net operating costs:<br />
Cost of properties for sale recognised as expense (229.3) (309.4)<br />
Operating expenses arising from investment properties (135.1) (124.1)<br />
Reversal of writedowns on development properties held for sale 44.2 50.9<br />
Depreciation of tangible assets (see Note 12) (1.7) (1.1)<br />
Staff costs<br />
– salaries and benefits in kind (68.7) (73.9)<br />
– defined contribution pension plan (2.6) (2.3)<br />
– defined benefit pension plan (see Note 16) 0.1 –<br />
(71.2) (76.2)<br />
Auditors’ remuneration<br />
– audit (1.1) (1.1)<br />
– non-audit services (0.2) (0.1)<br />
(1.3 ) (1.2 )<br />
The number of employees at 31st December 2011 was 1,257 (2010: 1,144).<br />
40 <strong>Hongkong</strong> <strong>Land</strong>
7 Net Financing Charges<br />
2011 2010<br />
US$m<br />
US$m<br />
Interest expenses<br />
– bank loans and overdrafts (13.7 ) (24.1 )<br />
– other borrowings (69.0 ) (80.4 )<br />
Total interest expenses (82.7 ) (104.5 )<br />
Interest capitalised 0.3 2.7<br />
(82.4 ) (101.8 )<br />
Commitment and other fees (17.3 ) (10.5 )<br />
Financing charges (99.7 ) (112.3 )<br />
Financing income 33.2 35.2<br />
(66.5 ) (77.1 )<br />
Financing charges and financing income are stated after taking into account hedging gains or losses.<br />
8 Share of Results of Associates and Joint Ventures<br />
2011 2010<br />
US$m<br />
US$m<br />
By business<br />
Commercial Property<br />
– operating profit 85.0 37.2<br />
– net financing charges (27.8) (14.0)<br />
– tax (10.7) (2.6)<br />
– net profit 46.5 20.6<br />
Residential Property<br />
– operating profit 79.6 196.1<br />
– net financing charges (2.6) (4.2)<br />
– tax (45.8) (37.8)<br />
– non-controlling interests (1.4) (0.8)<br />
– net profit 29.8 153.3<br />
Underlying business performance 76.3 173.9<br />
Non-trading items:<br />
Change in fair value of investment properties (net of deferred tax)<br />
– Commercial Property 235.8 722.4<br />
– Residential Property 2.9 9.0<br />
238.7 731.4<br />
Asset impairment provisions, reversals and disposals (17.0) –<br />
221.7 731.4<br />
298.0 905.3<br />
The share of revenue of associates and joint ventures was US$386.0 million (2010: US$555.6 million).<br />
Annual Report 2011 41
Notes to the Financial Statements<br />
9 Tax<br />
2011 2010<br />
US$m<br />
US$m<br />
Current tax (128.6) (115.4)<br />
Deferred tax<br />
– changes in fair value of investment properties (0.9) 0.7<br />
– other temporary differences (5.0) (7.4)<br />
(5.9) (6.7)<br />
(134.5 ) (122.1 )<br />
Reconciliation between tax expense and tax at applicable tax rate:<br />
Tax at applicable tax rate (851.5) (659.9)<br />
Change in fair value of investment properties not taxable in determining<br />
taxable profit 722.2 528.7<br />
Expenses not deductible in determining taxable profit (11.8) (11.8)<br />
Income not subject to tax 17.0 22.3<br />
Utilisation of previously unrecognised tax losses 0.3 2.2<br />
(Under)/overprovision in prior years (3.1) 0.9<br />
Losses not recognised (0.8) (0.1)<br />
Deferred tax assets written off (1.2) (0.2)<br />
Deferred tax liabilities written back 0.3 –<br />
Withholding tax (5.9) (4.2)<br />
(134.5 ) (122.1 )<br />
Tax relating to components of other comprehensive income is analysed as follows:<br />
Pension assets 0.8 –<br />
Cash flow hedges (1.0) 1.1<br />
(0.2 ) 1.1<br />
The applicable tax rate for the year of 16.5% (2010: 16.8%) represents the weighted average of the rates of taxation prevailing in<br />
the territories in which the Group operates. The decrease in the applicable tax rate is caused by a change in the profitability of the<br />
Group’s subsidiaries in the respective territories.<br />
The Group has no tax payable in the United Kingdom (2010: Nil).<br />
Share of tax of associates and joint ventures of US$61.8 million (2010: US$62.0 million) is included in share of results of<br />
associates and joint ventures.<br />
42 <strong>Hongkong</strong> <strong>Land</strong>
10 Earnings per Share<br />
Basic earnings per share is calculated on profit attributable to shareholders of US$5,306.4 million (2010: US$4,739.4 million) and<br />
on the weighted average number of 2,322.5 million (2010: 2,249.4 million) shares in issue during the year.<br />
Diluted earnings per share is calculated on profit attributable to shareholders of US$5,309.5 million (2010: US$4,760.6 million),<br />
which is after adjusting for the effects of the conversion of convertible bonds, and on the weighted average number of<br />
2,337.6 million (2010: 2,353.2 million) shares in issue during the year. The weighted average number of shares for basic<br />
and diluted earnings per share is reconciled as follows:<br />
Ordinary shares in millions<br />
2011 2010<br />
Weighted average number of shares in issue 2,322.5 2,249.4<br />
Adjustment for shares to be issued on conversion of convertible bonds 15.1 103.8<br />
Weighted average number of shares for diluted earnings per share calculation 2,337.6 2,353.2<br />
Earnings per share is additionally calculated based on underlying profit attributable to shareholders. The difference between<br />
underlying profit attributable to shareholders and profit attributable to shareholders is reconciled as follows:<br />
2011 2010<br />
Basic Diluted Basic Diluted<br />
earnings earnings earnings earnings<br />
per share per share per share per share<br />
US$m US¢ US¢ US$m US¢ US¢<br />
Underlying profit attributable to shareholders 703.4 30.29 30.22 810.2 36.02 35.33<br />
Non-trading items (see Note 11) 4,603.0 3,929.2<br />
Profit attributable to shareholders 5,306.4 228.48 4,739.4 210.70<br />
Interest expense on convertible bonds (net of tax) 3.1 21.2<br />
Profit for calculation of diluted earnings per share 5,309.5 227.13 4,760.6 202.30<br />
11 Non-trading Items<br />
An analysis of non-trading items after interest, tax and non-controlling interests attributable to shareholders of the Company is set<br />
out below:<br />
2011 2010<br />
US$m<br />
US$m<br />
Change in fair value of investment properties 4,382.7 3,197.6<br />
Deferred tax on change in fair value of investment properties (0.9) 0.7<br />
Share of change in fair value of investment properties of associates and<br />
joint ventures (net of deferred tax) 238.7 731.4<br />
Asset impairment provisions, reversals and disposals – 0.1<br />
Share of asset impairment provisions, reversals and disposals of associates and<br />
joint ventures (17.0) –<br />
Non-controlling interests (0.5) (0.6)<br />
4,603.0 3,929.2<br />
Annual Report 2011 43
Notes to the Financial Statements<br />
12 Tangible Assets<br />
Investment<br />
Other<br />
properties assets Total<br />
US$m US$m US$m<br />
2011<br />
Cost or valuation 18,036.0 15.1 18,051.1<br />
Cumulative depreciation – (10.9) (10.9)<br />
Net book value at 1st January 18,036.0 4.2 18,040.2<br />
<strong>Exchange</strong> differences 28.1 – 28.1<br />
Additions 83.1 2.8 85.9<br />
Depreciation – (1.7) (1.7)<br />
Net revaluation surplus 4,382.7 – 4,382.7<br />
Net book value at 31st December 22,529.9 5.3 22,535.2<br />
Cost or valuation 22,529.9 17.8 22,547.7<br />
Cumulative depreciation – (12.5) (12.5)<br />
22,529.9 5.3 22,535.2<br />
2010<br />
Cost or valuation 14,817.7 13.9 14,831.6<br />
Cumulative depreciation – (10.0) (10.0)<br />
Net book value at 1st January 14,817.7 3.9 14,821.6<br />
<strong>Exchange</strong> differences (6.9) 0.1 (6.8)<br />
Additions 27.6 1.3 28.9<br />
Depreciation – (1.1) (1.1)<br />
Net revaluation surplus 3,197.6 – 3,197.6<br />
Net book value at 31st December 18,036.0 4.2 18,040.2<br />
Cost or valuation 18,036.0 15.1 18,051.1<br />
Cumulative depreciation – (10.9) (10.9)<br />
18,036.0 4.2 18,040.2<br />
The Group’s investment properties were revalued at 31st December 2011 by independent qualified valuers. The Group employed<br />
Jones Lang LaSalle to value its commercial investment properties in Hong Kong, Singapore, Vietnam and Cambodia which<br />
are either held under leases with unexpired lease terms of more than 20 years or freehold. The valuations, which conform to the<br />
International Valuation Standards issued by the International Valuation Standards Committee and the HKIS Valuation Standards<br />
on Properties issued by the Hong Kong Institute of Surveyors, were arrived at by reference to the net income allowing for<br />
reversionary potential of each property. The Report of the valuers is set out on page 71.<br />
44 <strong>Hongkong</strong> <strong>Land</strong>
13 Associates and Joint Ventures<br />
2011 2010<br />
US$m<br />
US$m<br />
Share of unlisted associates and joint ventures’ net assets 3,551.8 3,132.2<br />
Goodwill on acquisition – 45.5<br />
3,551.8 3,177.7<br />
The Group’s share of assets, liabilities, capital commitments and contingent<br />
liabilities of associates and joint ventures are summarised below:<br />
Non-current assets 3,306.2 2,986.1<br />
Current assets 1,547.1 1,142.4<br />
Current liabilities (592.5) (497.0)<br />
Non-current liabilities (660.6) (496.4)<br />
Non-controlling interests (48.4) (2.9)<br />
3,551.8 3,132.2<br />
Capital commitments 55.6 112.4<br />
Contingent liabilities 64.8 36.6<br />
Movements of associates and joint ventures for the year:<br />
At 1st January 3,177.7 2,352.2<br />
<strong>Exchange</strong> differences (14.2) 89.9<br />
Share of results after tax and non-controlling interests 298.0 905.3<br />
Share of other comprehensive income after tax and non-controlling interests 2.8 80.8<br />
Dividends received and receivable (56.3) (270.5)<br />
Net acquisitions and increases in attributable interests 146.2 17.9<br />
Others (2.4) 2.1<br />
At 31st December 3,551.8 3,177.7<br />
Annual Report 2011 45
Notes to the Financial Statements<br />
14 Other Investments<br />
2011 2010<br />
US$m<br />
US$m<br />
Listed securities 46.5 57.2<br />
Unlisted securities 2.1 2.0<br />
48.6 59.2<br />
Movements for the year:<br />
At 1st January 59.2 46.4<br />
<strong>Exchange</strong> differences 0.1 (0.2)<br />
Additions – 2.0<br />
Net revaluation (deficit)/surplus (10.7) 11.0<br />
At 31st December 48.6 59.2<br />
The fair value measurements of available-for-sale financial assets are based on<br />
the following data:<br />
Quoted prices in active markets 46.5 57.2<br />
Unobservable inputs 2.1 2.0<br />
48.6 59.2<br />
15 Deferred Tax Assets and Liabilities<br />
Revaluation<br />
Accelerated surpluses of Other<br />
capital investment temporary<br />
Tax losses allowances properties differences Total<br />
US$m US$m US$m US$m US$m<br />
2011<br />
At 1st January 1.0 (46.2) (1.0) (1.5) (47.7)<br />
<strong>Exchange</strong> differences – (0.1) – – (0.1)<br />
(Charged)/credited to profit and loss 0.4 (4.2) (0.9) (1.2) (5.9)<br />
Charged to other comprehensive income – – – (0.2) (0.2)<br />
At 31st December 1.4 (50.5 ) (1.9 ) (2.9 ) (53.9 )<br />
Deferred tax assets 1.4 – – 4.1 5.5<br />
Deferred tax liabilities – (50.5) (1.9) (7.0) (59.4)<br />
1.4 (50.5 ) (1.9 ) (2.9 ) (53.9 )<br />
46 <strong>Hongkong</strong> <strong>Land</strong>
15 Deferred Tax Assets and Liabilities continued<br />
Revaluation<br />
Accelerated surpluses of Other<br />
capital investment temporary<br />
Tax losses allowances properties differences Total<br />
US$m US$m US$m US$m US$m<br />
2010<br />
At 1st January 0.5 (41.9) (1.7) 0.8 (42.3)<br />
<strong>Exchange</strong> differences 0.1 0.1 – – 0.2<br />
(Charged)/credited to profit and loss 0.4 (4.4) 0.7 (3.4) (6.7)<br />
Credited to other comprehensive income – – – 1.1 1.1<br />
At 31st December 1.0 (46.2 ) (1.0 ) (1.5 ) (47.7 )<br />
Deferred tax assets 1.0 – – 6.1 7.1<br />
Deferred tax liabilities – (46.2) (1.0) (7.6) (54.8)<br />
1.0 (46.2 ) (1.0 ) (1.5 ) (47.7 )<br />
Deferred tax balances predominantly comprise non-current items. Deferred tax assets and liabilities are netted when the taxes<br />
relate to the same taxation authority and where offsetting is allowed.<br />
Deferred tax assets of US$1.3 million (2010: US$0.8 million) arising from unused tax losses of US$8.6 million<br />
(2010: US$4.7 million) have not been recognised in the financial statements. Of the unused tax losses, US$5.0 million<br />
(2010: US$4.4 million) have no expiry date and the balance will expire in 2015.<br />
16 Pension Plans<br />
The Group has a number of defined benefit pension plans, covering all the main territories in which it operates with the major<br />
plans relating to employees in Hong Kong. Most of the pension plans are final salary defined benefit plans and are funded. The<br />
assets of the funded plans are held independently of the Group’s assets in separate trustee administered funds. The Group’s<br />
major plans are valued by independent actuaries annually using the projected unit credit method.<br />
The principal actuarial assumptions used for accounting purposes at 31st December are as follows:<br />
2011 2010<br />
Weighted<br />
Weighted<br />
average<br />
average<br />
% %<br />
Discount rate applied to pension obligations 4.50 4.85<br />
Expected return on plan assets 7.50 7.50<br />
Future salary increases 5.00 5.00<br />
The expected return on plan assets is determined on the basis of long-term average returns on global equities of 3.8% to 11.4%<br />
(2010: 4.3% to 11.4%) per annum and global bonds of 2.8% to 4.4% (2010: 3.6% to 5.2%) per annum, and the long-term<br />
benchmark allocation of assets between equities and bonds in the plan.<br />
Annual Report 2011 47
Notes to the Financial Statements<br />
16 Pension Plans continued<br />
The amounts recognised in the consolidated balance sheet are as follows:<br />
2011 2010<br />
Fair value of plan assets 30.3 33.8<br />
Present value of pension obligations (23.9) (23.2)<br />
US$m<br />
US$m<br />
6.4 10.6<br />
Movements in the fair value of plan assets:<br />
At 1st January 33.8 31.4<br />
<strong>Exchange</strong> differences 0.1 (0.1)<br />
Expected return on plan assets 2.5 2.3<br />
Contributions from employers and plan members 0.3 0.5<br />
Benefits paid (2.0) (0.9)<br />
Actuarial (loss)/gain (4.3) 0.6<br />
Transfer to other plans (0.1) –<br />
At 31st December 30.3 33.8<br />
Movements in the present value of pension obligations:<br />
At 1st January 23.2 21.4<br />
<strong>Exchange</strong> differences 0.1 –<br />
Current service cost 1.3 1.3<br />
Interest cost 1.1 1.0<br />
Benefits paid (2.0) (0.9)<br />
Actuarial loss 0.3 0.4<br />
Transfer to other plans (0.1) –<br />
At 31st December 23.9 23.2<br />
The analysis of the fair value of plan assets at 31st December is as follows:<br />
Equity instruments 14.6 15.8<br />
Debt instruments 9.4 9.6<br />
Other assets 6.3 8.4<br />
30.3 33.8<br />
The estimated amount of contributions expected to be paid to the plans in 2012 is US$0.3 million.<br />
The amounts recognised in the consolidated profit and loss account are as follows:<br />
2011 2010<br />
US$m<br />
US$m<br />
Current service cost 1.3 1.3<br />
Interest cost 1.1 1.0<br />
Expected return on plan assets (2.5) (2.3)<br />
Income recognised (0.1 ) –<br />
Actual (loss)/return on plan assets in the year (1.8 ) 2.9<br />
The above amounts are all recognised in arriving at operating profit and are included in cost of sales and administrative expenses.<br />
48 <strong>Hongkong</strong> <strong>Land</strong>
16 Pension Plans continued<br />
The five year history of experience adjustments is as follows:<br />
2011 2010 2009 2008 2007<br />
US$m US$m US$m US$m US$m<br />
Fair value of plan assets 30.3 33.8 31.4 25.1 38.2<br />
Present value of pension obligations (23.9 ) (23.2 ) (21.4 ) (19.0 ) (20.9 )<br />
Surplus 6.4 10.6 10.0 6.1 17.3<br />
Experience adjustments on plan assets (4.3 ) 0.6 4.3 (14.5 ) 2.5<br />
Percentage of plan assets (%) 14 2 14 58 7<br />
Experience adjustments on pension obligations 0.1 0.1 1.2 – (0.1 )<br />
Percentage of pension obligations (%) – – 6 – –<br />
17 Properties for Sale<br />
2011 2010<br />
US$m<br />
US$m<br />
Properties under development<br />
– land and development costs 1,459.8 1,114.8<br />
– interest and other expenses capitalised 26.7 29.0<br />
1,486.5 1,143.8<br />
Provision for impairment (112.0 ) (156.7 )<br />
1,374.5 987.1<br />
Completed properties 146.7 197.3<br />
1,521.2 1,184.4<br />
At 31st December 2011, no properties for sale (2010: US$404.7 million) were pledged as security for borrowings<br />
(2010: US$41.2 million) as shown in Note 21.<br />
18 Debtors<br />
2011 2010<br />
US$m<br />
US$m<br />
Trade debtors 22.6 32.8<br />
Other debtors<br />
– third parties 278.0 178.3<br />
– associates and joint ventures 84.9 85.5<br />
385.5 296.6<br />
Non-current 72.0 51.5<br />
Current 313.5 245.1<br />
385.5 296.6<br />
Annual Report 2011 49
Notes to the Financial Statements<br />
18 Debtors continued<br />
2011 2010<br />
US$m<br />
US$m<br />
By geographical area of operation<br />
Greater China 271.7 179.6<br />
Southeast Asia and others 113.8 117.0<br />
385.5 296.6<br />
An allowance for impairment of trade debtors is made based on the estimated irrecoverable amount. Significant financial<br />
difficulties of the debtor, probability that the debtor will enter bankruptcy or financial reorganisation, and default or delinquency<br />
in payment are considered indicators that the debt is impaired.<br />
At 31st December 2011, no trade debtors (2010: Nil) were impaired and fully provided.<br />
At 31st December 2011, trade debtors of US$4.2 million (2010: US$4.4 million) were past due but not impaired. The ageing<br />
analysis of these trade debtors is as follows:<br />
2011 2010<br />
US$m<br />
US$m<br />
Below 30 days 3.8 3.2<br />
Between 31 and 60 days 0.4 1.1<br />
Between 61 and 90 days – 0.1<br />
4.2 4.4<br />
The risk of trade debtors that are neither past due nor impaired at 31st December 2011 becoming impaired is low as most of the<br />
balances have been settled subsequent to the year end.<br />
Other debtors are further analysed as follows:<br />
2011 2010<br />
US$m<br />
US$m<br />
Prepayments 178.4 91.2<br />
Derivative financial instruments 70.0 55.2<br />
Amounts due from associates and joint ventures 84.9 85.5<br />
Others 29.6 31.9<br />
362.9 263.8<br />
The fair value of debtors other than derivative financial instruments approximates their carrying amount, as the impact of<br />
discounting is not significant. Derivative financial instruments are stated at fair value.<br />
50 <strong>Hongkong</strong> <strong>Land</strong>
19 Bank Balances<br />
Bank balances of certain subsidiaries amounting to US$92.9 million (2010: US$80.6 million) are held under the Housing<br />
Developers (Project Account) Rules in Singapore, withdrawals from which are subject to the provision of these Rules.<br />
The weighted average interest rate on bank balances of US$911.0 million (2010: US$1,309.9 million) is 0.6% (2010: 0.3%)<br />
per annum.<br />
20 Creditors<br />
2011 2010<br />
US$m<br />
US$m<br />
Trade creditors 222.8 231.1<br />
Tenants’ deposits 165.3 156.6<br />
Other creditors 58.6 66.4<br />
Derivative financial instruments 22.0 70.9<br />
Financial liabilities 468.7 525.0<br />
Rent received in advance 6.9 11.6<br />
Proceeds from property for sale received in advance 315.1 279.9<br />
790.7 816.5<br />
Non-current 44.4 93.1<br />
Current 746.3 723.4<br />
790.7 816.5<br />
By geographical area of operation<br />
Greater China 375.2 427.1<br />
Southeast Asia and others 415.5 389.4<br />
790.7 816.5<br />
The remaining contractual maturities of financial liabilities other than<br />
derivative financial instruments are analysed as follows:<br />
Within one year 307.2 314.8<br />
Between one and two years 38.6 50.6<br />
Between two and five years 80.2 72.7<br />
Beyond five years 20.7 16.0<br />
446.7 454.1<br />
Derivative financial instruments are stated at fair value. Other creditors are stated at amortised cost. The fair value of these<br />
creditors approximates their carrying amounts.<br />
Annual Report 2011 51
Notes to the Financial Statements<br />
21 Borrowings<br />
2011 2010<br />
Carrying<br />
Carrying<br />
amount Fair value amount Fair value<br />
US$m US$m US$m US$m<br />
Current<br />
Bank overdrafts 1.2 1.2 1.0 1.0<br />
Current portion of long-term borrowings<br />
– bank loans 0.3 0.3 253.8 253.8<br />
– 7% United States dollar bonds due 2011 – – 604.9 609.0<br />
– 2.75% United States dollar convertible bonds due 2012 56.5 53.3 – –<br />
58.0 54.8 859.7 863.8<br />
Long-term<br />
Bank loans 1,062.7 1,062.7 410.7 410.7<br />
5.5% United States dollar bonds due 2014 544.8 544.8 548.3 548.3<br />
3.65% Singapore dollar notes due 2015 290.3 297.2 293.3 301.4<br />
2.75% United States dollar convertible bonds due 2012 – – 372.8 395.1<br />
Medium term notes<br />
– due 2017 41.0 41.0 39.4 39.4<br />
– due 2019 102.8 102.1 102.6 100.3<br />
– due 2020 312.7 313.1 307.9 302.4<br />
– due 2021 71.6 71.6 62.4 62.4<br />
– due 2025 644.6 675.5 592.6 554.0<br />
– due 2026 38.4 38.2 – –<br />
– due 2030 103.0 102.7 102.8 102.8<br />
– due 2031 25.3 25.6 – –<br />
– due 2040 32.0 29.8 32.0 27.2<br />
1,371.4 1,399.6 1,239.7 1,188.5<br />
3,269.2 3,304.3 2,864.8 2,844.0<br />
3,327.2 3,359.1 3,724.5 3,707.8<br />
Secured – 41.2<br />
Unsecured 3,327.2 3,683.3<br />
3,327.2 3,724.5<br />
The fair values are based on market prices or are estimated using the expected future payments discounted at market interest<br />
rates ranging from 0.6% to 2.1% (2010: 0.4% to 3.5%) per annum. The fair values of current borrowings approximate their<br />
carrying amount, as the impact of discounting is not significant.<br />
Secured borrowings at 31st December 2010 were certain subsidiaries’ bank borrowings which were secured against its<br />
properties for sale.<br />
The 5.5% bonds with nominal value of US$500 million due on 28th April 2014 were issued by a wholly-owned subsidiary<br />
and are listed on the Singapore <strong>Exchange</strong>.<br />
52 <strong>Hongkong</strong> <strong>Land</strong>
21 Borrowings continued<br />
The 3.65% notes due on 5th October 2015 with nominal value of S$375 million, were issued by a wholly-owned subsidiary and<br />
are listed on the Singapore <strong>Exchange</strong>.<br />
The 2.75% convertible bonds with nominal value of US$400 million due on 21st December 2012 are convertible up to and<br />
including 11th December 2012 into fully paid ordinary shares of the Company at a conversion price of US$3.85 per ordinary share,<br />
which is subject to adjustment for subdivision or consolidation of shares, bonus issues, right issues and other dilutive events.<br />
The fair value of the liability component is calculated using a market interest rate for an equivalent non-convertible bond at the<br />
time of issue, and is recorded as long-term borrowings on the amortised cost basis, until extinguished on conversion or maturity<br />
of the bonds. The residual amount, representing the value of the equity conversion component determined on issue of the bonds,<br />
is included in shareholders’ funds.<br />
During the year, the Group issued the following notes under the US$3,000 million medium term note programme:<br />
– 3.75% 15-year notes with nominal value of HK$302 million due on 25th November 2026<br />
– 4.125% 20-year notes with nominal value of HK$200 million due on 22nd December 2031<br />
The convertible bonds are recognised in the consolidated balance sheet as follows:<br />
2011 2010<br />
US$m<br />
US$m<br />
Liability component at 1st January 372.8 368.1<br />
Interest expense at effective interest rate 5.0 21.2<br />
Interest accrued at coupon rate (2.1) (11.0)<br />
Conversion (319.2) (5.5)<br />
Liability component at 31st December 56.5 372.8<br />
The borrowings are further summarised as follows:<br />
Fixed rate borrowings<br />
Weighted Weighted Floating<br />
average average period rate<br />
interest rates outstanding borrowings Total<br />
% Years US$m US$m US$m<br />
By currency<br />
2011<br />
Hong Kong dollar 2.3 11.1 1,050.4 1,236.0 2,286.4<br />
Singapore dollar 2.6 4.7 609.8 374.0 983.8<br />
United States dollar 5.5 1.0 56.5 0.5 57.0<br />
1,716.7 1,610.5 3,327.2<br />
2010<br />
Hong Kong dollar 2.8 8.2 1,234.6 1,196.5 2,431.1<br />
Singapore dollar 2.7 5.0 699.1 220.7 919.8<br />
United States dollar 5.5 2.0 372.8 0.8 373.6<br />
2,306.5 1,418.0 3,724.5<br />
Annual Report 2011 53
Notes to the Financial Statements<br />
21 Borrowings continued<br />
The weighted average interest rates and period of fixed rate borrowings are stated after taking into account hedging transactions.<br />
The remaining contractual maturities of the borrowings, including the contractual interest payments, are analysed below. The<br />
interest payments are computed using contractual rates and, in the case of floating rate borrowings, based on market rates at the<br />
balance sheet date before taking into account hedging transactions. Cash flows denominated in currencies other than United<br />
States dollars are converted into United States dollars at the rates of exchange ruling at the balance sheet date.<br />
2011 2010<br />
US$m<br />
US$m<br />
Within one year 166.5 976.4<br />
Between one and two years 784.9 548.7<br />
Between two and five years 1,334.7 1,385.5<br />
Beyond five years 1,846.8 1,757.7<br />
4,132.9 4,668.3<br />
22 Share Capital<br />
Ordinary shares in millions 2011 2010<br />
2011 2010 US$m US$m<br />
Authorised<br />
Shares of US$0.10 each 4,000.0 4,000.0 400.0 400.0<br />
Issued and fully paid<br />
At 1st January 2,250.8 2,249.3 225.1 224.9<br />
Issued on conversion of convertible bonds 87.3 1.5 8.7 0.2<br />
At 31st December 2,338.1 2,250.8 233.8 225.1<br />
23 Dividends<br />
2011 2010<br />
US$m<br />
US$m<br />
Final dividend in respect of 2010 of US¢10.00 (2009: US¢10.00) per share 232.3 224.9<br />
Interim dividend in respect of 2011 of US¢6.00 (2010: US¢6.00) per share 140.2 135.0<br />
372.5 359.9<br />
A final dividend in respect of 2011 of US¢10.00 (2010: US¢10.00) per share amounting to a total of US$233.8 million<br />
(2010: US$232.3 million) is proposed by the Board. The dividend proposed will not be accounted for until it has been approved<br />
at the Annual General Meeting. The amount will be accounted for as an appropriation of revenue reserves in the year ending<br />
31st December 2012.<br />
54 <strong>Hongkong</strong> <strong>Land</strong>
24 Notes to Consolidated Cash Flow Statement<br />
a) Change in interests in subsidiaries<br />
The increase in 2010 represented the Group’s increased attributable interests in MCL <strong>Land</strong> from 77.4% to 100%.<br />
b) Cash and cash equivalents<br />
2011 2010<br />
US$m<br />
US$m<br />
Bank balances 967.9 1,366.7<br />
Bank overdrafts (see Note 21) (1.2) (1.0)<br />
966.7 1,365.7<br />
25 Derivative Financial Instruments<br />
The fair values of derivative financial instruments at 31st December are as follows:<br />
2011 2010<br />
Positive Negative Positive Negative<br />
fair value fair value fair value fair value<br />
US$m US$m US$m US$m<br />
Designated as cash flow hedges<br />
– interest rate swaps – 9.5 1.1 11.7<br />
– cross currency swaps 0.2 12.5 0.2 15.4<br />
Designated as fair value hedges<br />
– interest rate swaps 9.8 – 0.6 1.8<br />
– cross currency swaps 60.0 – 53.3 42.0<br />
The remaining contractual maturities of derivative financial instruments, based on their undiscounted cash outflows, are analysed<br />
as follows:<br />
Within Between Between Beyond<br />
one one and two and five<br />
year two years five years years<br />
US$m US$m US$m US$m<br />
2011<br />
Net settled<br />
– interest rate swaps 5.7 3.5 1.5 –<br />
Gross settled<br />
– cross currency swaps 29.3 29.3 575.0 936.2<br />
35.0 32.8 576.5 936.2<br />
2010<br />
Net settled<br />
– interest rate swaps 8.4 6.2 5.3 –<br />
Gross settled<br />
– cross currency swaps 635.5 26.2 571.4 935.2<br />
643.9 32.4 576.7 935.2<br />
Annual Report 2011 55
Notes to the Financial Statements<br />
25 Derivative Financial Instruments continued<br />
Interest rate swaps<br />
The notional principal amounts of the outstanding interest rate swap contracts at 31st December 2011 were US$483.4 million<br />
(2010: US$611.9 million).<br />
At 31st December 2011, the fixed interest rates relating to interest rate swaps vary from 1.84% to 4.28% (2010: 1.84% to<br />
4.28%).<br />
The fair values of interest rate swaps are based on the estimated cash flows discounted at market rates ranging from 0.38%<br />
to 1.86% (2010: 0.28% to 3.32%) per annum.<br />
Cross currency swaps<br />
The contract amounts of the outstanding cross currency swap contracts at 31st December 2011 were US$1,252.2 million<br />
(2010: US$1,853.5 million).<br />
26 Commitments<br />
2011 2010<br />
US$m<br />
US$m<br />
Capital commitments<br />
Authorised not contracted 475.6 147.8<br />
Contracted not provided 415.5 35.1<br />
891.1 182.9<br />
Contribution to associates and joint ventures 480.2 845.0<br />
Operating lease commitments<br />
Due within one year 1.6 1.3<br />
Due between one and two years 0.8 0.5<br />
Due between two and three years 0.6 –<br />
3.0 1.8<br />
27 Contingent Liabilities<br />
Various Group companies are involved in litigation arising in the ordinary course of their respective businesses. Having reviewed<br />
outstanding claims and taking into account legal advice received, the Directors are of the opinion that adequate provisions have<br />
been made in the financial statements.<br />
28 Related Party Transactions<br />
The parent company of the Group is Jardine Strategic <strong>Holdings</strong> <strong>Limited</strong> and the ultimate holding company is Jardine Matheson<br />
<strong>Holdings</strong> <strong>Limited</strong>. Both companies are incorporated in <strong>Bermuda</strong>.<br />
In the normal course of business, the Group has entered into a variety of transactions with the subsidiaries, associates and joint<br />
ventures of Jardine Matheson <strong>Holdings</strong> <strong>Limited</strong> (‘Jardine Matheson group members’). The more significant of these transactions<br />
are described below:<br />
Management fee<br />
The management fee payable by the Group, under an agreement entered into in 1995, to Jardine Matheson <strong>Limited</strong> in 2011 was<br />
US$3.5 million (2010: US$4.0 million), being 0.5% per annum of the Group’s underlying profit in consideration for management<br />
consultancy services provided by Jardine Matheson <strong>Limited</strong>, a wholly-owned subsidiary of Jardine Matheson <strong>Holdings</strong> <strong>Limited</strong>.<br />
56 <strong>Hongkong</strong> <strong>Land</strong>
28 Related Party Transactions continued<br />
Property and other services<br />
The Group rented properties to Jardine Matheson group members. Gross rents on such properties in 2011 amounted to<br />
US$20.6 million (2010: US$19.3 million).<br />
Jardine Matheson group members provided property construction, maintenance and other services to the Group in 2011 in<br />
aggregate amounting to US$30.0 million (2010: US$30.5 million).<br />
The outstanding balances arising from the above services at 31st December 2011 are not material.<br />
Hotel management services<br />
Jardine Matheson group members provided hotel management services to the Group in 2011 amounting to US$1.9 million<br />
(2010: US$1.4 million).<br />
The outstanding balances arising from the above services at 31st December 2011 are not material.<br />
Outstanding balances with associates and joint ventures<br />
Amounts of outstanding balances with associates and joint ventures are included in debtors and creditors as appropriate<br />
(see Notes 18 and 20).<br />
Directors’ emoluments<br />
Details of Directors’ emoluments (being the key management personnel compensation) are shown on page 65 under<br />
the heading of ‘Directors’ Appointment, Retirement, Remuneration and Service Contracts’.<br />
29 Summarised Balance Sheet of the Company<br />
Included below is certain summarised balance sheet information of the Company disclosed in accordance with <strong>Bermuda</strong> law.<br />
2011 2010<br />
US$m<br />
US$m<br />
Net operating assets<br />
Investments at cost<br />
Unlisted shares in subsidiaries 4,481.7 4,481.7<br />
Net amounts due from subsidiaries 499.2 213.7<br />
4,980.9 4,695.4<br />
Creditors and other accruals (21.1) (19.7)<br />
4,959.8 4,675.7<br />
Total equity<br />
Share capital (see Note 22) 233.8 225.1<br />
Revenue and other reserves<br />
Contributed surplus 2,249.6 2,249.6<br />
Share premium 331.9 5.3<br />
Revenue reserves 2,144.5 2,195.7<br />
4,726.0 4,450.6<br />
Shareholders’ funds 4,959.8 4,675.7<br />
Subsidiaries are shown at cost less amounts provided.<br />
The contributed surplus was set up on the formation of the Company in 1989 and, under the Bye-laws of the Company,<br />
is distributable.<br />
Annual Report 2011 57
Notes to the Financial Statements<br />
30 Principal Subsidiaries, Associates and Joint Ventures<br />
The principal subsidiaries, associates and joint ventures of the Group at 31st December 2011 are set out below.<br />
Attributable interests %<br />
Country of<br />
2011 2010 Issued share capital Main activities incorporation<br />
Subsidiaries<br />
<strong>Hongkong</strong> <strong>Land</strong> International 100 100 * USD 200,000,000 Investment holding <strong>Bermuda</strong><br />
<strong>Holdings</strong> <strong>Limited</strong><br />
<strong>Hongkong</strong> <strong>Land</strong> China <strong>Holdings</strong> 100 100 * USD 200,000,000 Investment holding <strong>Bermuda</strong><br />
<strong>Limited</strong><br />
<strong>Hongkong</strong> <strong>Land</strong> <strong>Limited</strong> 100 100 * USD 12,000 Group management <strong>Bermuda</strong><br />
The <strong>Hongkong</strong> <strong>Land</strong> Company, 100 100 HKD 1,293,180,006 Property investment Hong Kong<br />
<strong>Limited</strong><br />
The <strong>Hongkong</strong> <strong>Land</strong> Property 100 100 HKD 200 Property investment Hong Kong<br />
Company, <strong>Limited</strong><br />
Central Building Ltd. 71 71 USD 1,991,547 Property investment Vietnam<br />
Doan Ket International Co. Ltd. 73.9 73.9 USD 7,291,500 Property investment Vietnam<br />
HKL (Esplanade) Pte <strong>Limited</strong> 100 100 SGD 150,000,000 Property investment Singapore<br />
HKL Treasury (Singapore) Pte <strong>Limited</strong> 100 100 SGD 2 Finance Singapore<br />
<strong>Hongkong</strong> <strong>Land</strong> CB (2005) <strong>Limited</strong> 100 100 USD 2 Finance British Virgin<br />
Islands<br />
<strong>Hongkong</strong> <strong>Land</strong> Singapore (Pte) Ltd 100 100 SGD 100,000 Property management Singapore<br />
The <strong>Hongkong</strong> <strong>Land</strong> Treasury Services 100 100 SGD 2 Finance Singapore<br />
(Singapore) Pte <strong>Limited</strong><br />
MCL <strong>Land</strong> <strong>Limited</strong> (details are 100 100 SGD 369,985,977 Property development Singapore<br />
shown on page 60)<br />
Radiant Team <strong>Limited</strong> 100 – USD 2 Investment holding British Virgin<br />
Islands<br />
Reid Street Properties <strong>Limited</strong> 100 100 USD 400 Investment holding British Virgin<br />
Islands<br />
Ample Keen <strong>Limited</strong> 100 100 HKD 2 Property investment Hong Kong<br />
HKL (<strong>Land</strong>mark Hotel) <strong>Limited</strong> 100 100 HKD 2 Hotel investment Hong Kong<br />
King Kok Investment <strong>Limited</strong> 90 90 USD 10,000 Property investment Mauritius<br />
Starsome Investments <strong>Limited</strong> 100 100 USD 2 Investment holding British Virgin<br />
Islands<br />
WFJ Development <strong>Limited</strong> 95 95 HKD 725,010,000 Property investment Hong Kong<br />
Beijing Yee Zhi Real Estate 100 100 USD 150,000 Property consultancy Mainland China<br />
Consultancy Co Ltd<br />
* Owned directly<br />
58 <strong>Hongkong</strong> <strong>Land</strong>
30 Principal Subsidiaries, Associates and Joint Ventures continued<br />
Attributable interests %<br />
Country of<br />
2011 2010 Issued share capital Main activities incorporation<br />
Subsidiaries continued<br />
<strong>Hongkong</strong> <strong>Land</strong> (Beijing) Management 100 100 USD 150,000 Property management Mainland China<br />
Co Ltd<br />
<strong>Hongkong</strong> <strong>Land</strong> (Chongqing) 100 100 USD 150,000 Property investment, Mainland China<br />
Management Co Ltd<br />
development and<br />
management<br />
<strong>Hongkong</strong> <strong>Land</strong> (One Central) Retail 100 100 MOP 25,000 Management and Macau<br />
Property Management <strong>Limited</strong><br />
administration<br />
services<br />
<strong>Hongkong</strong> <strong>Land</strong> (Property Management) 100 100 HKD 20 Property management Hong Kong<br />
<strong>Limited</strong><br />
HKL (Chater House) <strong>Limited</strong> 100 100 HKD 1,500,000 Property investment Hong Kong<br />
HKL (Prince’s Building) <strong>Limited</strong> 100 100 HKD 200 Property investment Hong Kong<br />
The <strong>Hongkong</strong> <strong>Land</strong> Finance 100 100 USD 2 Finance Cayman<br />
(Cayman Islands) Company <strong>Limited</strong><br />
Islands<br />
The <strong>Hongkong</strong> <strong>Land</strong> Notes Company 100 100 USD 2 Finance British Virgin<br />
<strong>Limited</strong><br />
Islands<br />
Mulberry <strong>Land</strong> Company <strong>Limited</strong> 100 100 HKD 200 Property investment Hong Kong<br />
Tong Yan Development Co., <strong>Limited</strong> 100 100 HKD 400 Property development Hong Kong<br />
HK Glory Properties <strong>Limited</strong> 100 100 USD 2 Property development British Virgin<br />
Islands<br />
Associates and joint ventures<br />
Ampang Investments Pte <strong>Limited</strong> 40 40 SGD 10 Hotel investment Singapore<br />
BFC Development Pte <strong>Limited</strong> 33.3 33.3 SGD 6 Property development Singapore<br />
Central Boulevard Development 33.3 33.3 SGD 6 Property investment Singapore<br />
Pte <strong>Limited</strong><br />
Gaysorn <strong>Land</strong> Company <strong>Limited</strong> 49 49 THB 61,250,000 Property investments Thailand<br />
and operations<br />
Jardine Gibbons Properties <strong>Limited</strong> 40 40 BD 600,000 ‘A’ Property holding <strong>Bermuda</strong><br />
400,000 ‘B’<br />
NorthPine <strong>Land</strong> Inc 40 40 Peso 1,224,635,200 Property investment The Philippines<br />
One Raffles Quay Pte <strong>Limited</strong> 33.3 33.3 SGD 6 Property development Singapore<br />
P.T. Jakarta <strong>Land</strong> 50 50 IDR 3,320,000,000 Property development Indonesia<br />
and asset<br />
management<br />
Annual Report 2011 59
Notes to the Financial Statements<br />
30 Principal Subsidiaries, Associates and Joint Ventures continued<br />
Attributable interests %<br />
Country of<br />
2011 2010 Issued share capital Main activities incorporation<br />
Associates and joint ventures continued<br />
Basecity Investments <strong>Limited</strong> 46.6 46.6 USD 10,000 Property investment British Virgin<br />
Islands<br />
Beijing Premium Real Estate <strong>Limited</strong> 40 40 USD 12,000,000 Property development Mainland China<br />
Cosmo City <strong>Limited</strong> 50 50 HKD 2 Property investment Hong Kong<br />
Longhu <strong>Land</strong> <strong>Limited</strong> 50 50 USD 12,000,000 Property development Mainland China<br />
Raise Up Enterprises <strong>Limited</strong> 50 50 USD 10,000 Property investment British Virgin<br />
Islands<br />
Total Champ <strong>Limited</strong> 50 50 HKD 3 Property investment Hong Kong<br />
Normelle Estates <strong>Limited</strong> 50 50 HKD 10,000 Property investment Hong Kong<br />
MCL <strong>Land</strong> <strong>Limited</strong>’s principal subsidiaries, associates and joint ventures<br />
MCL <strong>Land</strong> <strong>Holdings</strong> Pte Ltd 100 100 SGD 6,000,000 Property investment Singapore<br />
Caseldine Investments Pte Ltd 100 100 SGD 1,000,000 Property development Singapore<br />
Kedron Investments Pte Ltd 100 100 SGD 1,000,000 Property development Singapore<br />
MCL <strong>Land</strong> (Century Gardens) Sdn. Bhd. 100 100 MYR 6,608,763 Property investment Malaysia<br />
MCL <strong>Land</strong> Development Pte. Ltd. 100 100 SGD 1,000,000 Property development Singapore<br />
MCL <strong>Land</strong> (Pantai View) Sdn. Bhd. 100 100 MYR 2,000,000 Property investment Malaysia<br />
MCL <strong>Land</strong> (Pasir Ris) Pte Ltd 100 – SGD 1,000,000 Property development Singapore<br />
MCL <strong>Land</strong> (Prime) Pte. Ltd. 100 100 SGD 1,000,000 Property development Singapore<br />
MCL <strong>Land</strong> (Serangoon) Pte Ltd 100 100 SGD 1,000,000 Property development Singapore<br />
MCL <strong>Land</strong> (Warren) Pte Ltd 100 100 SGD 1,000,000 Property development Singapore<br />
Maxgrowth Pte. Ltd. 100 100 SGD 1,000,000 Property development Singapore<br />
Calne Pte Ltd 50 50 SGD 1,000,000 Property development Singapore<br />
Golden Quantum Acres Sdn Bhd 50 50 MYR 2,764,210 Property development Malaysia<br />
Grange Development Pte Ltd 53.5 53.5 SGD 1,000,000 Property development Singapore<br />
MSL Properties Sdn Bhd 50 50 MYR 3,000,000 Property development Malaysia<br />
Sunrise MCL <strong>Land</strong> Sdn Bhd 50 50 MYR 2,000,000 Property development Malaysia<br />
60 <strong>Hongkong</strong> <strong>Land</strong>
Independent Auditors’ Report<br />
To the Members of <strong>Hongkong</strong> <strong>Land</strong> <strong>Holdings</strong> <strong>Limited</strong><br />
Report on the Financial Statements<br />
We have audited the accompanying consolidated financial statements of <strong>Hongkong</strong> <strong>Land</strong> <strong>Holdings</strong> <strong>Limited</strong> and its subsidiaries<br />
(the ‘Group’) which comprise the Consolidated Balance Sheet as at 31st December 2011 and the Consolidated Profit and Loss Account,<br />
Consolidated Statement of Comprehensive Income, Consolidated Statement of Changes in Equity and Consolidated Cash Flow<br />
Statement for the year then ended and a summary of significant accounting policies and other explanatory notes.<br />
Directors’ Responsibility for the Financial Statements<br />
The Company’s Directors are responsible for the preparation and fair presentation of these consolidated financial statements in<br />
accordance with International Financial Reporting Standards and with the requirements of Section 90 of the <strong>Bermuda</strong> Companies Act.<br />
This responsibility includes: designing, implementing and maintaining internal control relevant to the preparation and fair presentation<br />
of financial statements that are free from material misstatement, whether due to fraud or error; selecting and applying appropriate<br />
accounting policies; and making accounting estimates that are reasonable in the circumstances.<br />
Auditors’ Responsibility<br />
Our responsibility is to express an opinion on these consolidated financial statements based on our audit. We conducted our audit in<br />
accordance with International Standards on Auditing. Those Standards require that we comply with ethical requirements and plan and<br />
perform the audit to obtain reasonable assurance whether the financial statements are free from material misstatement.<br />
An audit involves performing procedures to obtain audit evidence about the amounts and disclosures in the financial statements.<br />
The procedures selected depend on the auditors’ judgement, including the assessment of the risks of material misstatement of the<br />
financial statements, whether due to fraud or error. In making those risk assessments, the auditors consider internal control relevant<br />
to the entity’s preparation and fair presentation of the financial statements in order to design audit procedures that are appropriate in<br />
the circumstances, but not for the purpose of expressing an opinion on the effectiveness of the entity’s internal control. An audit also<br />
includes evaluating the appropriateness of accounting policies used and the reasonableness of accounting estimates made by<br />
management, as well as evaluating the overall presentation of the financial statements.<br />
We believe that the audit evidence we have obtained is sufficient and appropriate to provide a basis for our audit opinion.<br />
Opinion<br />
In our opinion, the accompanying consolidated financial statements present fairly, in all material respects, the financial position of<br />
the Group as at 31st December 2011, and its financial performance and its cash flows for the year then ended in accordance with<br />
International Financial Reporting Standards and with the requirements of the <strong>Bermuda</strong> Companies Act.<br />
Report on Legal and Regulatory Requirements<br />
We have nothing to report in respect of the following matters that under the UK Listing Rules we are required to review:<br />
• Directors’ statement in relation to going concern; and<br />
• the part of the Corporate Governance Statement relating to the Company’s compliance with the UK Corporate Governance Code<br />
specified for our review.<br />
Other Matters<br />
This report, including the opinion, has been prepared for and only for the Company’s members as a body in accordance with Section 90<br />
of the <strong>Bermuda</strong> Companies Act and for no other purpose. We do not, in giving this opinion, accept or assume responsibility for any other<br />
purpose or to any other person to whom this report is shown or into whose hands it may come save where expressly agreed by our<br />
prior consent in writing.<br />
PricewaterhouseCoopers LLP<br />
Chartered Accountants<br />
London<br />
United Kingdom<br />
1st March 2012<br />
Annual Report 2011 61
Five Year Summary<br />
2007 2008 2009 2010 2011<br />
US$m US$m US$m US$m US$m<br />
Profit/(loss) attributable to shareholders 3,324 (337 ) 1,813 4,739 5,306<br />
Underlying profit attributable to shareholders 345 375 777 810 703<br />
<br />
Investment properties<br />
<br />
14,261 13,703 14,818 18,036 22,530<br />
12<br />
<br />
Net debt 2,431 2,601 2,417 2,358 2,359<br />
<br />
10<br />
Shareholders’ funds 14,041<br />
8<br />
13,308 14,936 19,457 24,739<br />
<br />
6<br />
<br />
<br />
US$ 4<br />
US$ US$ US$ US$<br />
<br />
Net asset value per share 6.122<br />
5.92 6.64 8.64 10.58<br />
0<br />
34.55<br />
36.02<br />
30.29<br />
10.58<br />
8.64<br />
15.02<br />
13.00<br />
16.41<br />
13.00<br />
16.00 16.00 16.00<br />
6.12<br />
5.92<br />
6.64<br />
2007<br />
2008<br />
2009<br />
2010<br />
2011<br />
Underlying earnings<br />
Dividends<br />
2007<br />
2008<br />
2009<br />
2010<br />
2011<br />
Underlying earnings/dividends<br />
per share (US¢)<br />
Net asset value per share (US$)<br />
62 <strong>Hongkong</strong> <strong>Land</strong>
Responsibility Statement<br />
The Directors of the Company confirm to the best of their knowledge that:<br />
a. the consolidated financial statements have been prepared in accordance with International Financial Reporting Standards,<br />
including International Accounting Standards and Interpretations adopted by the International Accounting Standards Board; and<br />
b. the sections of this Report, including the Chairman’s Statement, Chief Executive’s Review and Principal Risks and Uncertainties,<br />
which constitute the management report include a fair review of all information required to be disclosed by the Disclosure and<br />
Transparency Rules 4.1.8 to 4.1.11 issued by the Financial Services Authority of the United Kingdom.<br />
For and on behalf of the Board<br />
Y.K. Pang<br />
John R. Witt<br />
Directors<br />
1st March 2012<br />
Annual Report 2011 63
Corporate Governance<br />
<strong>Hongkong</strong> <strong>Land</strong> <strong>Holdings</strong> <strong>Limited</strong> is incorporated in <strong>Bermuda</strong>. The Group’s property interests are almost entirely in Asia. The Company’s<br />
equity shares have a premium listing on the London <strong>Stock</strong> <strong>Exchange</strong>, and secondary listings in <strong>Bermuda</strong> and Singapore. The Company<br />
attaches importance to the corporate stability that is fundamental to the Group’s ability to pursue a long-term strategy in Asian markets.<br />
It is committed to high standards of governance. Its approach, however, developed over many years, differs from that envisaged by<br />
the UK Corporate Governance Code (the ‘UK Code’), which was originally introduced as a guide for United Kingdom incorporated<br />
companies listed on the London <strong>Stock</strong> <strong>Exchange</strong>. As provided in the Listing Rules issued by the Financial Services Authority in the<br />
United Kingdom, the Company’s premium listed status requires that this Report address how the main principles of the UK Code have<br />
been applied by the Company, and explain the reasons for the different approach adopted by the Company as compared to the UK<br />
Code’s provisions. The Company’s governance differs from that contemplated by provisions of the UK Code on board balance and<br />
refreshment, director independence, board evaluation procedures, nomination and remuneration committees and the appointment<br />
of a senior independent director.<br />
The Management of the Group<br />
The Company has its dedicated executive management under the Chief Executive. The Memorandum of Association of the Company,<br />
however, provides for the chairman of Jardine Matheson <strong>Holdings</strong> <strong>Limited</strong> (‘Jardine Matheson’) to be, or to appoint, the Managing<br />
Director of the Company. The managing director of Jardine Matheson has been so appointed. Reflecting this, and the 50% interest<br />
of the Jardine Matheson group in the Company’s share capital, the Chief Executive and the Managing Director meet regularly. Similarly,<br />
the board of the Hong Kong-based Group management company, <strong>Hongkong</strong> <strong>Land</strong> <strong>Limited</strong> (‘HKL’), and its finance committee are chaired<br />
by the Managing Director and include Group executives as well as the deputy managing director, the group finance director, the group<br />
strategy director and the group general counsel of Jardine Matheson.<br />
The Board<br />
The Company currently has a Board of 15 Directors: the Chief Executive and Chief Financial Officer; six executives of Jardine<br />
Matheson; and seven non-executive Directors. Their names and brief biographies appear on pages 18 and 19 of this Report. The<br />
Chairman has been appointed in accordance with the provisions of the Bye-laws of the Company, which provide that the chairman of<br />
Jardine Matheson, or any Director nominated by him, shall be the Chairman of the Company. The composition and operation of the<br />
Board reflect the Company’s commitment to its long-term strategy, shareholding structure and tiered approach to oversight and<br />
management as described in this Report. These factors explain the balance on the Board between executive and non-executive<br />
Directors, the stability of the Board, the absence of nomination and remuneration committees and the conduct of Board evaluation<br />
procedures. The Board regards Asian business experience and relationships as more valuable attributes of its non-executive Directors<br />
than formal independence criteria. Accordingly the Board has not designated a ‘senior independent director’ as set out in the UK Code.<br />
Recommendations and decisions on remuneration result from consultations between the Chairman and the Managing Director and<br />
other Directors as they consider appropriate.<br />
Among the matters which the Board of the Company decides are the Group’s business strategy, its annual budget, dividends and major<br />
corporate activities. Responsibility for implementing the Group’s strategy is delegated to the Company’s executive management, with<br />
decision-making authority within designated financial parameters delegated to the HKL finance committee. In addition, as part of the<br />
Company’s tiered approach to oversight and management, certain Directors of the Company who do not serve on the board of HKL and<br />
who are based outside Asia make regular visits to Asia and <strong>Bermuda</strong> where they participate in four annual strategic reviews. All of these<br />
reviews precede the Board meetings. These Directors are not directly involved in the operational management of the Group’s business<br />
activities, but their knowledge and close oversight of the Group’s affairs reinforces the process by which business is reviewed before<br />
consideration by the Board.<br />
The Board is scheduled to hold four meetings in 2012 and ad hoc procedures are adopted to deal with urgent matters. In 2011 one<br />
meeting was held in <strong>Bermuda</strong> and three were held in Asia. All current Directors who held office in 2011 attended all four Board<br />
meetings, save that Jenkin Hui attended three meetings and Lord Powell of Bayswater attended two meetings. The Board receives<br />
high quality, up to date information for each of its meetings, which has previously been considered and approved at meetings of the<br />
board of HKL. This information is also the subject of a strategy review in a cycle of meetings (in <strong>Bermuda</strong> or Asia, as appropriate) prior<br />
to consideration by the Board itself.<br />
The division of responsibilities between the Chairman, the Managing Director and the Chief Executive is well established. The<br />
Chairman’s role is to lead the Board as it oversees the Group’s strategic and financial direction. The Managing Director’s principal<br />
role is to act as chairman of HKL and of its finance committee, while the responsibility for running the Group’s business and all the<br />
executive matters affecting the Group rests with the Chief Executive.<br />
64 <strong>Hongkong</strong> <strong>Land</strong>
Directors’ Appointment, Retirement, Remuneration and Service Contracts<br />
Candidates for appointment as executive Directors of the Company, as executive directors of HKL or as senior executives elsewhere<br />
in the Group may be sourced internally, from the Jardine Matheson group or externally using the services of specialist executive search<br />
firms. The aim is to appoint individuals who combine international best practice with adaptability to Asian markets.<br />
Each new Director is appointed by the Board and, in accordance with Bye-law 92 of the Company’s Bye-laws, each new Director is<br />
subject to retirement at the first Annual General Meeting after appointment. Thereafter, the Director will be subject to retirement by<br />
rotation pursuant to Bye-law 85 whereby one-third of the Directors retire at the Annual General Meeting each year. These provisions<br />
apply to both executive and non-executive Directors, but the requirement to retire by rotation pursuant to Bye-law 85 does not extend<br />
to the Chairman or Managing Director.<br />
R.C. Kwok retired from the Board of the Company on 12th May 2011. On 1st April 2012, Ben Keswick succeeded A.J.L. Nightingale<br />
as Managing Director and Adam Keswick was appointed as a Director of the Company. A.J.L. Nightingale remains as a non-executive<br />
Director of the Company. In accordance with Bye-law 85, Mark Greenberg, A.J.L. Nightingale, James Watkins and Percy Weatherall<br />
retire by rotation at the Annual General Meeting and, being eligible, offer themselves for re-election. In accordance with Bye-law 92,<br />
Adam Keswick and Ben Keswick will also retire, and, being eligible, offer themselves for re-election. None of the Directors proposed<br />
for re-election has a service contract with the Company or its subsidiaries.<br />
The Company’s policy is to offer competitive remuneration packages to its senior executives. It is recognised that, due to the nature<br />
of the Group and its diverse geographic base, a number of its senior executives are required to be offered international terms and<br />
the nature of the remuneration packages is designed to reflect this.<br />
Directors’ fees, which are payable to all Directors other than the Chief Executive and the Chief Financial Officer, are decided upon by<br />
shareholders in general meeting as provided for by the Company’s Bye-laws. For the year ended 31st December 2011, the Directors<br />
received US$5.2 million (2010: US$3.8 million) in Directors’ fees and employee benefits, being US$0.6 million (2010: US$0.6 million)<br />
in Directors’ fees, US$4.5 million (2010: US$3.1 million) in short-term employee benefits including salary, bonuses, accommodation<br />
and deemed benefits in kind and US$0.1 million (2010: US$0.1 million) in post-employment benefits. The information set out in this<br />
paragraph forms part of the audited financial statements.<br />
The Company has in place shadow share option schemes under which cash bonuses are paid based on the performance of the<br />
Company’s share price over a period. The shadow schemes were established to provide longer-term incentives for executive Directors<br />
and senior managers. Shadow share options are granted after consultation between the Chairman, the Managing Director and the<br />
Chief Executive and other Directors as they consider appropriate.<br />
The Company purchases insurance to cover its Directors against their costs in defending themselves in civil proceedings taken against<br />
them in that capacity and in respect of damages resulting from the unsuccessful defence of any proceedings. To the extent permitted<br />
by law, the Company also indemnifies its Directors. Neither the insurance nor the indemnity provides cover where the Director has<br />
acted fraudulently or dishonestly.<br />
Directors’ Responsibilities in respect of the Financial Statements<br />
The Directors are required under the <strong>Bermuda</strong> Companies Act 1981 to prepare financial statements for each financial year and to<br />
present them annually to the Company’s shareholders at the Annual General Meeting. The financial statements should present fairly<br />
in accordance with International Financial Reporting Standards (‘IFRS’) the financial position of the Group at the end of the year and<br />
the results of its operations and its cash flows for the year then ended. The Directors consider that applicable accounting policies<br />
under IFRS, applied on a consistent basis and supported by prudent and reasonable judgements and estimates, have been followed<br />
in preparing the financial statements.<br />
Going Concern<br />
The Directors are required to consider whether it is appropriate to prepare financial statements on the basis that the Company and the<br />
Group are going concerns. The Group prepares comprehensive financial forecasts and, based on these forecasts, cash resources and<br />
existing credit facilities, the Directors consider that the Company and the Group have adequate resources to continue in business for<br />
the foreseeable future. For this reason, the Directors continue to adopt the going concern basis in preparing the financial statements.<br />
Annual Report 2011 65
Corporate Governance<br />
Code of Conduct<br />
The Group conducts business in a professional, ethical and even-handed manner. Its ethical standards are clearly set out in the Group’s<br />
Code of Conduct, a set of guidelines to which every employee must adhere. The code requires that all Group companies comply with<br />
all laws of general application, all rules and regulations that are industry specific and proper standards of business conduct. The code<br />
prohibits the giving or receiving of illicit payments, and requires all employees to be treated fairly, impartially and with respect. It also<br />
requires that all managers must be fully aware of their obligations under the Code of Conduct and establish procedures to ensure<br />
compliance at all levels within their organisations. The Group has in place procedures by which employees can raise, in confidence,<br />
matters of serious concern in areas such as financial reporting or compliance.<br />
Risk Management and Internal Control<br />
The Board has overall responsibility for the Group’s system of risk management and internal control. The system of internal control is<br />
designed to manage, rather than eliminate, business risk; to help safeguard the Group’s assets against fraud and other irregularities;<br />
and to give reasonable, but not absolute, assurance against material financial misstatement or loss.<br />
The principal risks and uncertainties facing the Company are set out on page 68.<br />
The Board has delegated to the audit committee of HKL responsibility for reviewing areas of risk and uncertainty, the operation and<br />
effectiveness of the Group’s system of internal control and the procedures by which these are monitored. The audit committee<br />
considers the system and procedures on a regular basis, and reports to the Board semi-annually. The members of the audit committee<br />
of HKL are Ben Keswick, Mark Greenberg, Adam Keswick, James Riley and Giles White; they have extensive knowledge of the Group<br />
while at the same time not being directly involved in operational management. Ben Keswick and Adam Keswick became members of<br />
the HKL audit committee upon their appointment to the Board on 1st April 2012 and Ben Keswick succeeded A.J.L. Nightingale as<br />
chairman of the audit committee on that date. The Board considers that the members of the audit committee of HKL have, collectively,<br />
the requisite skills, knowledge and experience to enable it to discharge its responsibilities in a proper manner. All the then current<br />
members of the audit committee attended both its meetings during the year. The chief executive and chief financial officer of HKL,<br />
together with representatives of the internal and external auditors, also attend the audit committee meetings by invitation.<br />
Executive management is responsible for the implementation of the system of internal control throughout the Group. The internal<br />
audit function monitors the effectiveness of the system and the approach taken by the business units to risk. The internal audit function<br />
is outside the operating businesses and reports its findings, and recommendations for any corrective action required, to the audit<br />
committee of HKL. The audit committee of HKL also reviews the effectiveness of the internal audit function.<br />
The Group has in place an organisational structure with defined lines of responsibility and delegation of authority. There are established<br />
policies and procedures for financial planning and budgeting; for information and reporting systems; for assessment of risk; and for<br />
monitoring the Group’s operations and performance. The information systems in place are designed to ensure that the financial<br />
information reported is reliable and up to date.<br />
The Company’s policy on commercial conduct underpins the Group’s internal control process, particularly in the area of compliance.<br />
The policy, as set out in the Code of Conduct, is reinforced and monitored by an annual compliance certification process.<br />
The audit committee of HKL has also been given the responsibility to oversee the effectiveness of the formal procedures for employees<br />
to raise any matters of serious concern, and is required to review any reports made under those procedures that are referred to it by<br />
the internal audit function.<br />
Prior to completion and announcement of the half-year and year-end results, a review of the financial information and of any issues<br />
raised in connection with the preparation of the results, including the adoption of new accounting policies, is undertaken by the audit<br />
committee of HKL with the executive management and a report is received from the external auditors. The audit committee of HKL<br />
also assesses any reports on frauds identified during the period under review. The external auditors also have access to the full Board,<br />
in addition to the Chief Executive, Chief Financial Officer and other senior executives.<br />
The audit committee of HKL keeps under review the nature, scope and results of the external audit and the audits conducted by the<br />
internal audit function. The audit committee of HKL also keeps under review the independence and objectivity of the external auditors,<br />
and as part of that process considers and approves the level and nature of non-audit work performed. The terms of reference of the<br />
audit committee of HKL can be found on the Company’s website at www.hkland.com.<br />
66 <strong>Hongkong</strong> <strong>Land</strong>
Directors’ Share Interests<br />
The Directors of the Company in office on 1st April 2012 had interests (within the meaning of the Disclosure and Transparency<br />
Rules (‘DTRs’) of the Financial Services Authority (the ‘FSA’) of the United Kingdom) in the ordinary share capital of the Company at<br />
22nd March 2012 as set out below. These interests included those notified to the Company in respect of the Directors’ connected<br />
persons (as that term is used in the DTRs in relation to companies incorporated outside the United Kingdom).<br />
Simon Keswick 74,521<br />
Y.K. Pang 38,000<br />
Charles Allen-Jones 60,000<br />
Dr Richard Lee 3,678,685<br />
A.J.L. Nightingale 2,184<br />
Substantial Shareholders<br />
As a non-UK issuer, the Company is subject to the DTRs pursuant to which a person must in certain circumstances notify the Company<br />
of the percentage of voting rights attaching to the share capital of the Company that he holds. The obligation to notify arises if that<br />
person acquires or disposes of shares in the Company which results in the percentage of voting rights which he holds reaching,<br />
exceeding or falling below 5%, 10%, 15%, 20%, 25%, 30%, 50% and 75%.<br />
The Company has been informed of the holding of voting rights of 5% or more attaching to the Company’s issued ordinary share<br />
capital by Jardine Strategic <strong>Holdings</strong> <strong>Limited</strong> (‘Jardine Strategic’), which is directly interested in 1,176,616,646 ordinary shares carrying<br />
50.23% of the voting rights. By virtue of its interest in Jardine Strategic, Jardine Matheson is also interested in the same ordinary<br />
shares. Apart from this shareholding, the Company is not aware of any holders of voting rights of 5% or more attaching to the issued<br />
ordinary share capital of the Company as at 22nd March 2012.<br />
There were no contracts of significance with corporate substantial shareholders during the year under review.<br />
Relations with Shareholders<br />
The 2012 Annual General Meeting will be held at The Fairmont Southampton, <strong>Bermuda</strong> on 9th May 2012. The full text of the resolutions<br />
and explanatory notes in respect of the meeting are contained in the Notice of Meeting which accompanies this Report. All shareholders<br />
are invited to attend the Annual General Meeting and participate in communicating with the Company. The Company holds regular<br />
meetings with institutional shareholders. A corporate website is maintained containing a wide range of information of interest to<br />
investors at www.hkland.com.<br />
Securities Purchase Arrangements<br />
At the Annual General Meeting held on 11th May 2011, shareholders renewed the approval of a general mandate authorising the<br />
Directors to effect purchases by the Company or its subsidiaries of the Company’s own ordinary shares of less than 15% in aggregate<br />
of its issued share capital.<br />
Related Party Transactions<br />
Details of transactions with related parties entered into by the Company during the course of the year are included in Note 28 to the<br />
financial statements on pages 56 and 57. There were no transactions entered into by the Company during the course of the year to<br />
which the related party transaction rules of the FSA in the United Kingdom apply.<br />
Annual Report 2011 67
Principal Risks and Uncertainties<br />
The Board has overall responsibility for risk management and internal control. The process by which the Group identifies and manages<br />
risk is set out in more detail on page 66 of the Corporate Governance section of this Report. The following are the principal risks and<br />
uncertainties facing the Company as required to be disclosed pursuant to the Disclosure and Transparency Rules issued by the<br />
Financial Services Authority in the United Kingdom and are in addition to the matters referred to in the Chairman’s Statement and<br />
Chief Executive’s Review.<br />
Economic Risk<br />
The Group is exposed to the risk of negative developments in global and regional economies, and financial and property markets, either<br />
directly or through the impact on the Group’s joint venture partners, bankers, suppliers or tenants. These developments can result in:<br />
• recession, inflation, deflation and currency fluctuations;<br />
• restrictions in the availability of credit, increases in financing and construction costs and business failures; and<br />
• reductions in office and retail rents, office and retail occupancy and sales prices of, and demand for, residential developments.<br />
Such developments might increase costs of sales and operating costs, reduce revenues, or result in reduced valuations of the Group’s<br />
investment properties or in the Group being unable to meet in full its strategic objectives.<br />
Commercial Risk and Financial Risk<br />
Risks are an integral part of normal commercial practices, and where practicable steps are taken to mitigate such risks. These risks are<br />
further pronounced when operating in volatile markets.<br />
The Group makes significant investment decisions in respect of commercial and residential development projects that take time to<br />
come to fruition and achieve the desired returns and are, therefore, subject to market risks. These risks are further pronounced when<br />
operating in volatile markets.<br />
The Group operates in areas that are highly competitive, and failure to compete effectively in terms of price, product specification or<br />
levels of service can have an adverse effect on earnings as can construction risks in relation to new developments. Significant pressure<br />
from such competition may lead to reduced margins. The quality and safety of the products and services provided by the Group are also<br />
important and there is an associated risk if they are below standard.<br />
The steps taken by the Group to manage its exposure to financial risk are set out in the Financial Review on page 15 and Note 2 to<br />
the financial statements on pages 32 to 36.<br />
Regulatory and Political Risk<br />
The Group is subject to a number of regulatory environments in the territories in which it operates. Changes in the regulatory approach<br />
to such matters as foreign ownership of assets and businesses, exchange controls, planning controls, tax rules and employment<br />
legislation have the potential to impact the operations and profitability of the Group. Changes in the political environment in such<br />
territories can also affect the Group.<br />
Terrorism, Pandemic and Natural Disasters<br />
A number of the Group’s interests are vulnerable to the effects of terrorism, either directly through the impact of an act of terrorism<br />
or indirectly through the impact of generally reduced economic activity in response to the threat of or an actual act of terrorism.<br />
The Group would be impacted by a global or regional pandemic which could be expected to seriously affect economic activity and the<br />
ability of our business to operate smoothly. In addition, many of the territories in which the Group is active can experience from time<br />
to time natural disasters such as earthquakes and typhoons.<br />
68 <strong>Hongkong</strong> <strong>Land</strong>
Shareholder Information<br />
Financial Calendar<br />
2011 full-year results announced 1st March 2012<br />
Share registers closed 19th to 23rd March 2012<br />
Annual General Meeting to be held 9th May 2012<br />
2011 final dividend payable 16th May 2012<br />
2012 half-year results to be announced 26th July 2012 *<br />
Share registers to be closed 20th to 24th August 2012 *<br />
2012 interim dividend payable 10th October 2012 *<br />
* Subject to change<br />
Dividends<br />
Shareholders will receive their dividends in United States dollars, unless they are registered on the Jersey branch register where they<br />
will have the option to elect for sterling. These shareholders may make new currency elections for the 2011 final dividend by notifying<br />
the United Kingdom transfer agent in writing by 20th April 2012. The sterling equivalent of dividends declared in United States dollars<br />
will be calculated by reference to a rate prevailing on 2nd May 2012. Shareholders holding their shares through The Central Depository<br />
(Pte) <strong>Limited</strong> (‘CDP’) in Singapore will receive United States dollars unless they elect, through CDP, to receive Singapore dollars.<br />
Registrars and Transfer Agent<br />
Shareholders should address all correspondence with regard to their shareholdings or dividends to the appropriate registrar or<br />
transfer agent.<br />
Principal Registrar<br />
Jardine Matheson International Services <strong>Limited</strong><br />
P.O. Box HM 1068<br />
Hamilton HM EX<br />
<strong>Bermuda</strong><br />
Jersey Branch Registrar<br />
Singapore Branch Registrar<br />
Capita Registrars (Jersey) <strong>Limited</strong><br />
M & C Services Private <strong>Limited</strong><br />
12 Castle Street 138 Robinson Road #17-00<br />
St Helier, Jersey JE2 3RT<br />
The Corporate Office<br />
Channel Islands Singapore 068906<br />
United Kingdom Transfer Agent<br />
Capita Registrars<br />
The Registry<br />
34 Beckenham Road<br />
Beckenham, Kent BR3 4TU<br />
England<br />
Press releases and other financial information can be accessed through the internet at www.hkland.com.<br />
Annual Report 2011 69
Offices<br />
Offices<br />
<strong>Hongkong</strong> <strong>Land</strong> <strong>Holdings</strong> <strong>Limited</strong><br />
Jardine House<br />
33-35 Reid Street<br />
Hamilton<br />
<strong>Bermuda</strong><br />
Tel +1441 292 0515<br />
Fax +1441 292 4072<br />
E-mail: gpobox@hkland.com<br />
John C. Lang<br />
<strong>Hongkong</strong> <strong>Land</strong> <strong>Limited</strong><br />
One <strong>Exchange</strong> Square, 8th Floor<br />
Hong Kong<br />
Tel +852 2842 8428<br />
Fax +852 2845 9226<br />
E-mail: gpobox@hkland.com<br />
Y.K. Pang<br />
<strong>Hongkong</strong> <strong>Land</strong> (Singapore) Pte. <strong>Limited</strong><br />
One Raffles Quay<br />
North Tower #34–03<br />
Singapore 048583<br />
Tel +65 6238 1121<br />
Fax +65 6238 1131<br />
E-mail: gpobox.sg@hkland.com<br />
Robert Garman<br />
<strong>Hongkong</strong> <strong>Land</strong> (Asia Management) <strong>Limited</strong><br />
Suite 204, 2/F Central Building<br />
31 Hai Ba Trung<br />
Hoan Kiem<br />
Hanoi<br />
Vietnam<br />
Tel +844 3824 0753<br />
Fax +844 3824 0769<br />
E-mail: gpobox.hanoi@hkland.com<br />
Stephen Bruce<br />
<strong>Hongkong</strong> <strong>Land</strong> (Beijing)<br />
Management Company <strong>Limited</strong><br />
Room 303, Block 26, Central Park<br />
No. 6 Chaoyangmenwai Avenue<br />
Chaoyang District<br />
Beijing 100020<br />
China<br />
Tel +8610 6597 0921<br />
Fax +8610 6597 0925<br />
E-mail: gpobox.bj@hkland.com<br />
Joe Kwok / Stanley Ko<br />
<strong>Hongkong</strong> <strong>Land</strong> (Chongqing)<br />
Management Company <strong>Limited</strong><br />
7/F, Zone D, Neptune Building<br />
No. 62 Star Light Road<br />
New North Zone<br />
Chongqing 401147<br />
China<br />
Tel +8623 6703 3016-8<br />
Fax +8623 6703 3888<br />
E-mail: gpobox.cq@hkland.com<br />
Joe Kwok / Ling Chang Feng<br />
<strong>Hongkong</strong> <strong>Land</strong> (Premium Investments) <strong>Limited</strong><br />
A-One Building, No. 1A, St. 102<br />
Khan Daun Penh, Sangkat Wat Phnom<br />
Phnom Penh<br />
Cambodia<br />
Tel +855 2398 6810<br />
Fax +855 2399 0588<br />
E-mail: gpobox.cambodia@hkland.com<br />
Daniel Parkes<br />
Representative Offices<br />
Shanghai<br />
Unit 1109C, Bund Centre<br />
222 Yanan Road (East)<br />
Shanghai 200002<br />
China<br />
Tel +8621 6335 1220<br />
Fax +8621 6335 0100<br />
E-mail: gpobox.sh@hkland.com<br />
Stanley Ko / Vincent Sun<br />
Vietnam<br />
Unit 503, 5/F Gemadept Tower<br />
2 bis-4-6 Le Thauh Ton, District 1<br />
Ho Chi Minh City<br />
Vietnam<br />
Tel +848 3827 9006<br />
Fax +848 3827 9020<br />
E-mail: gpobox.hcmc@hkland.com<br />
Cosimo Jencks<br />
70 <strong>Hongkong</strong> <strong>Land</strong>
Report of the Valuers<br />
To <strong>Hongkong</strong> <strong>Land</strong> <strong>Holdings</strong> <strong>Limited</strong><br />
Dear Sirs<br />
Revaluation of Commercial Investment Properties Held under Freehold and Leasehold<br />
Further to your instructions, we have valued in our capacity as external valuers the commercial investment properties held under<br />
freehold and leasehold as described in Note 12 to the consolidated financial statements of <strong>Hongkong</strong> <strong>Land</strong> <strong>Holdings</strong> <strong>Limited</strong>. We are of<br />
the opinion that the market value of the commercial investment properties held under freehold in Cambodia and leasehold in Hong<br />
Kong, Singapore and Vietnam as at 31st December 2011, totalled US$22,391,500,000 (United States Dollars Twenty Two Billion Three<br />
Hundred Ninety One Million and Five Hundred Thousand).<br />
Our valuations are prepared in accordance with the International Valuation Standards by the International Valuation Standards Committee<br />
and The HKIS Valuation Standards on Properties by The Hong Kong Institute of Surveyors.<br />
We have inspected the properties without either making structural surveys or testing the services. We have been supplied with details<br />
of tenure, tenancies and other relevant information.<br />
In arriving at our opinion, each property was valued individually, on market value basis, calculated on the net income allowing for<br />
reversionary potential, however no allowance has been made for expenses of realisation or for taxation which might arise in the event<br />
of disposal.<br />
Yours faithfully<br />
Jones Lang LaSalle <strong>Limited</strong><br />
Hong Kong, 1st March 2012<br />
Annual Report 2011 71
Major Property Portfolio<br />
at 31st December 2011<br />
Commercial Investment Property<br />
Attributable<br />
LETTABLE AREA<br />
interests % Total Office Retail<br />
Hong Kong<br />
(in thousands of square metres)<br />
Alexandra House 100 35 30 5<br />
Chater House 100 43 39 4<br />
<strong>Exchange</strong> Square 100 139<br />
One <strong>Exchange</strong> Square 100 53 –<br />
Two <strong>Exchange</strong> Square 100 47 –<br />
Three <strong>Exchange</strong> Square 100 30 –<br />
Podium 100 – 5<br />
The Forum (under redevelopment) 100 4 –<br />
Jardine House 100 63 59 4<br />
The <strong>Land</strong>mark 100 123<br />
Gloucester Tower 100 44 –<br />
Atrium 100 – 24<br />
Edinburgh Tower 100 32 13<br />
York House 100 10 –<br />
Prince’s Building 100 51 38 13<br />
454 386 68<br />
Macau<br />
One Central 46.6 19 – 19<br />
Singapore<br />
One Raffles Link 100 29 22 7<br />
One Raffles Quay 33.3 124<br />
North Tower 71 –<br />
South Tower 53 –<br />
Marina Bay Financial Centre 33.3 283<br />
Tower 1 58 1<br />
Tower 2 95 7<br />
Tower 3 (under construction) 114 8<br />
436 413 23<br />
Jakarta, Indonesia<br />
Jakarta <strong>Land</strong> 50 139<br />
Wisma Metropolitan I 15 2<br />
Wisma Metropolitan II 16 2<br />
World Trade Center 37 6<br />
World Trade Center II (under construction) 57 4<br />
139 125 14<br />
Bangkok, Thailand<br />
Gaysorn Plaza 49 17 5 12<br />
Hanoi, Vietnam<br />
Central Building 71 4 4 –<br />
63 L’y Thái Tô’ 73.9 7 6 1<br />
11 10 1<br />
72 <strong>Hongkong</strong> <strong>Land</strong>
Residential Development Property for Sale<br />
Attributable<br />
Available units at<br />
interests % Location 31st December 2011<br />
Completed development<br />
Hong Kong<br />
The Sail at Victoria 100 Victoria Road 4<br />
Serenade 100 Tai Hang Road 41<br />
Mainland China<br />
Maple Place 90 Beijing 113<br />
Macau<br />
One Central Residences 46.6 Avenida Dr Sun Yat Sen 8<br />
The Residences & Apartments at Mandarin Oriental 46.6 Avenida Dr Sun Yat Sen 17<br />
Attributable<br />
Approximate<br />
interests % Location site area<br />
Under development<br />
(in square metres)<br />
Singapore<br />
Parvis 50 Holland Hill 22,863<br />
D’Mira 100 Boon Teck Road 2,588<br />
The Estuary 100 Yishun Avenue 1/Avenue 2 26,949<br />
A site at Ewe Boon Road 100 Ewe Boon Road 5,906<br />
A site at Sixth Avenue 100 Sixth Avenue 6,412<br />
Uber 388 100 Upper East Coast Road 6,103<br />
Este Villa 100 Nim Road 17,955<br />
Terrasse 100 Hougang Avenue 2 30,196<br />
Ripple Bay 100 Jalan Loyang Besar/ 27,055<br />
Pasir Ris Drive 4<br />
Marina Bay Suites 33.3 Central Boulevard 5,290<br />
Mainland China<br />
Bamboo Grove 50 Chongqing 778,648<br />
<strong>Land</strong>mark Riverside 50 Chongqing 336,600<br />
Yorkville 100 Chongqing 385,943<br />
A site in New North Zone 100 Chongqing 519,791<br />
W.E. City 50 Chengdu 190,253<br />
Park Life 50 Shenyang 572,419<br />
One Capitol 50 Shenyang 346,721<br />
A site in Shenbei District 50 Shenyang 356,624<br />
Annual Report 2011 73
Major Property Portfolio<br />
hong kong – central district<br />
Q U E E N ’ S<br />
R O A D C E N T R A L<br />
Bank of<br />
China<br />
The <strong>Land</strong>mark<br />
Mandarin Oriental<br />
I C E H O U S E S T R E E T<br />
Standard<br />
Chartered<br />
Bank<br />
HSBC<br />
DES VOEUX ROAD CENTRAL<br />
10<br />
Statue<br />
Square<br />
J A C K S O N R O A D<br />
C H A T E R R O A D<br />
11<br />
12<br />
9<br />
I C E H O U S E S T R E E T<br />
Statue<br />
Square<br />
Q U E E N ’ S R O A D C E N T R A L<br />
7<br />
8<br />
Mandarin<br />
Oriental<br />
P E D D E R S T R E E T<br />
C O N N A U G H T R O A D C E N T R A L<br />
6<br />
D E S V O E U X R O A D C E N T R A L<br />
5<br />
General<br />
Post Office<br />
C O N N A U G H T R O A D C E N T R A L<br />
1 2<br />
<strong>Stock</strong><br />
<strong>Exchange</strong><br />
H A R B O U R V I E W S T R E E T<br />
M A N Y I U S T R E E T<br />
4<br />
L U N G W O R O A D MAN CHEUNG STREET<br />
3<br />
Airport Express Station<br />
<strong>Hongkong</strong> <strong>Land</strong> properties<br />
Public car park<br />
Pedestrian bridges<br />
Mass Transit Railway access<br />
MAN KAT STREET<br />
9 8<br />
1 2<br />
11<br />
5<br />
10<br />
7<br />
6<br />
3<br />
12<br />
4<br />
1 One <strong>Exchange</strong> Square<br />
2 Two <strong>Exchange</strong> Square<br />
3 Three <strong>Exchange</strong> Square<br />
4 The Forum – under redevelopment<br />
5 Jardine House<br />
6 Chater House<br />
7 Alexandra House<br />
8 Gloucester Tower<br />
9 Edinburgh Tower<br />
10 York House<br />
11 <strong>Land</strong>mark Atrium<br />
12 Prince’s Building<br />
74 <strong>Hongkong</strong> <strong>Land</strong>
hong kong<br />
macau<br />
Serenade<br />
One Central<br />
indonesia<br />
Jakarta <strong>Land</strong> – Wisma Metropolitan I & II and WTC I<br />
vietnam<br />
thailand<br />
Jakarta <strong>Land</strong> – WTC II<br />
63 Lý Thái Tô’ Central Building<br />
Gaysorn
eijing, CHINA<br />
The Newly Acquired Wangfujing Site<br />
CHONGQING, CHINA<br />
Central Park<br />
Maple Place<br />
Yorkville *<br />
CHONGQING, CHINA<br />
<strong>Land</strong>mark Riverside *<br />
chengdu, CHINA<br />
shenyang, CHINA<br />
Bamboo Grove<br />
W.E. City *<br />
One Capitol<br />
* This rendering is for reference only, subject to change and government approval
SINGAPORE<br />
Marina Bay Financial Centre<br />
One Raffles Quay<br />
Marina Bay Link Mall<br />
CityLink Mall<br />
One Raffles Link<br />
Marina Bay Residences<br />
Marina Bay Suites<br />
The Peak@Balmeg<br />
Este Villa<br />
Uber 388<br />
Terrasse
<strong>Hongkong</strong> <strong>Land</strong> <strong>Holdings</strong> <strong>Limited</strong><br />
Jardine House Hamilton <strong>Bermuda</strong><br />
www.hkland.com