Methods - Michigan Breeding Bird Atlas Website
Methods - Michigan Breeding Bird Atlas Website
Methods - Michigan Breeding Bird Atlas Website

Create successful ePaper yourself
Turn your PDF publications into a flip-book with our unique Google optimized e-Paper software.
<strong>Methods</strong><br />
The Second <strong>Michigan</strong> <strong>Breeding</strong> <strong>Bird</strong> <strong>Atlas</strong><br />
Table of Contents<br />
List of Figures..................................................................................................................... 1<br />
Introduction......................................................................................................................... 2<br />
Survey Period...................................................................................................................... 2<br />
Grid and Sampling Design.................................................................................................. 2<br />
Coverage Goals................................................................................................................... 4<br />
Survey Procedures .............................................................................................................. 5<br />
<strong>Breeding</strong> Codes................................................................................................................... 6<br />
Data Collection ................................................................................................................... 7<br />
Other Data Sources ........................................................................................................... 11<br />
Data Processing and Analysis........................................................................................... 12<br />
Editing and Verification.................................................................................................... 12<br />
Mapping............................................................................................................................ 12<br />
Limitations and Biases...................................................................................................... 13<br />
Literature Cited................................................................................................................. 14<br />
Suggested Citation ............................................................................................................ 14<br />
List of Figures<br />
Figure 1: A typical township showing <strong>Atlas</strong> blocks .......................................................... 3<br />
Figure 2: <strong>Michigan</strong> <strong>Atlas</strong> regions ..................................................................................... 5<br />
Figure 3: <strong>Atlas</strong> survey checklist form................................................................................ 8<br />
Figure 4: Rare bird observation form................................................................................. 9<br />
Figure 5: Casual bird observation card ............................................................................ 10<br />
Figure 6: Point count data form ....................................................................................... 11<br />
© 2012 Kalamazoo Nature Center<br />
1 of 14
<strong>Methods</strong><br />
The Second <strong>Michigan</strong> <strong>Breeding</strong> <strong>Bird</strong> <strong>Atlas</strong><br />
Introduction<br />
The second <strong>Michigan</strong> <strong>Breeding</strong> <strong>Bird</strong> <strong>Atlas</strong> (MBBA II) had two major goals: to document<br />
the current distribution of the state’s breeding birds and to provide a comparison with<br />
results from the first <strong>Michigan</strong> <strong>Breeding</strong> <strong>Bird</strong> <strong>Atlas</strong> (MBBA I). In order to accomplish<br />
the second goal it was necessary to conduct MBBA II in a manner consistent with the<br />
methodology used in MBBA I. A secondary goal of MBBA II was to collect abundance<br />
data. This was accomplished through development of a point count system throughout<br />
the state, and recording the number of breeding pairs or their equivalent in each block<br />
survey. Data on abundance have not been considered in this publication.<br />
The timing of this second <strong>Atlas</strong> was based on recommendations by the North American<br />
Ornithological <strong>Atlas</strong> Committee that <strong>Atlas</strong> projects be repeated at approximately 20-year<br />
intervals (McGowan and Corwin 2008). Field work for MBBA I was carried out from<br />
1983 to 1988 while the field work for MBBA II extended primarily from 2002 through<br />
2008. For both <strong>Atlas</strong>es, the Kalamazoo Nature Center served as the headquarters,<br />
provided the <strong>Atlas</strong> coordinator, organized the volunteers, collected and analyzed the data,<br />
and hired additional staff.<br />
A statewide <strong>Atlas</strong> project requires the labor and commitment of many people. In addition<br />
to paid field staff, over 800 volunteers submitted bird data, 73 authors wrote species<br />
accounts, 37 photographers donated their pictures, and 17 individuals reviewed data or<br />
articles. Additionally, several staff of the <strong>Michigan</strong> Department of Natural Resources<br />
(MDNR) reviewed data, chapters, and species accounts for this publication or contributed<br />
through participation on committees. This project would not have been possible without<br />
the financial and logistical support of the <strong>Michigan</strong> Department of Natural Resources and<br />
the numerous other supporters and contributors listed in the acknowledgements.<br />
Additionally, advances in technology – particularly Geographic Information Systems<br />
(GIS) – greatly increased the efficiency of analyzing and mapping the data.<br />
Survey Period<br />
As indicated above, field work for MBBA II was conducted primarily from 2002 through<br />
2008. During a pilot year (2001), a small number of surveys were done to fine-tune the<br />
protocol, evaluate methodology, and develop field data forms. Field work was extended<br />
into 2008 to fill in remaining coverage gaps and achieve coverage levels comparable to<br />
those of MBBA I.<br />
Grid and Sampling Design<br />
As <strong>Michigan</strong> was opened to settlement, surveyors working for the General Land Office<br />
used the Rectangular Public Land Survey System (PLSS) to create a grid of township,<br />
range, and section lines across the state (Webster and Leib 2011); these survey lines are<br />
regulated by the U. S. Bureau of Land Management. In <strong>Michigan</strong>, private ownership of<br />
some lands predates the implementation of the PLSS; these lands are commonly referred<br />
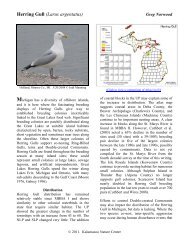
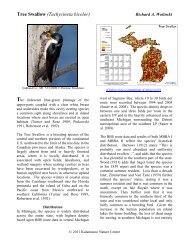
to as the French Claims and are not included in the PLSS. Within this system a typical<br />
geographic township consists of 36 one-mile-square sections arranged in a 6 mile x 6<br />
mile square (Figure 1: A typical township showing <strong>Atlas</strong> blocks<br />
© 2012 Kalamazoo Nature Center<br />
2 of 14
<strong>Methods</strong><br />
The Second <strong>Michigan</strong> <strong>Breeding</strong> <strong>Bird</strong> <strong>Atlas</strong><br />
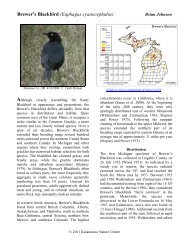
It is important to note that the boundaries of political townships do not necessarily follow<br />
the underlying geographical township boundaries, which can cause confusion. Partial<br />
townships occur along the edges of physical or political boundaries, land survey<br />
correction lines, and the <strong>Michigan</strong> Meridian, the state’s central north-south line. The<br />
<strong>Atlas</strong> block (Figure1) is the only spatial unit that is not inherent in the PLSS system. A<br />
block is one quarter of a township, each being comprised of nine sections of a standard<br />
square township. The PLSS grid, with the addition of quarter-township “blocks,” was<br />
used in MBBA I (McPeek and Adams 1991).<br />
Sections<br />
6 5 4 3 2 1<br />
7 8 9 10 11 12<br />
18 17 16 15 14 13<br />
19 20 21 22 23 24<br />
30 29 28 27 26 25<br />
31 32 33 34 35 36<br />
Figure 1: A typical township showing <strong>Atlas</strong> blocks<br />
Blocks<br />
2 1<br />
3 4<br />
The MDNR provided the historical GIS files that formed the basis of MBBA I’s grid.<br />
Advances in GIS technology allowed staff at the Kalamazoo Nature Center to extend the<br />
grid for MBBA II to include all land area, such as remote islands and coastal areas. The<br />
Great Lakes were six feet lower during the MBBA II survey period compared to lake<br />
levels during the MBBA I survey period (GLERL 2010) but the lake level differences<br />
had a minimal impact on the number of townships and blocks. The extension of the grid<br />
resulted in 1,927 townships and 7,192 blocks for MBBA II, an increase of 1%. The small<br />
difference between the two <strong>Atlas</strong>es in total number of townships and blocks does not<br />
appear to impact comparisons of results or affect statements of trends within this<br />
publication. Failure to extend the grid would have affected results for species limited to<br />
the shores of the Great Lakes.<br />
The PLSS grid is useful for four reasons. First, it employs the familiar township-rangesection<br />
designation used in plat books and most county maps. For example, the bulk of<br />
the city of Lansing is located in T-04-N R-02-W. Second, many of the state’s roads<br />
follow section boundaries, giving observers identifiable boundaries for <strong>Atlas</strong> blocks.<br />
Third, the recommended grid size for bird atlases is a multiple of 5 km or “a close<br />
English equivalent” (Robbins and Geissler 1990); one side of a block is 3 miles,<br />
equivalent to 4.8 km. And fourth, using the same grid system allowed easy comparisons<br />
with results from the first <strong>Atlas</strong>.<br />
<strong>Michigan</strong> encompasses a large mass of land and water, making it impractical to survey<br />
every block with limited human and financial resources. Consequently priority blocks<br />
were established so that coverage would be adequate to accomplish the project’s goals<br />
and objectives. During the first <strong>Atlas</strong>, all blocks in each township in the SLP were<br />
© 2012 Kalamazoo Nature Center<br />
3 of 14
<strong>Methods</strong><br />
The Second <strong>Michigan</strong> <strong>Breeding</strong> <strong>Bird</strong> <strong>Atlas</strong><br />
chosen as priority blocks; in the NLP, two of the four blocks in a township were<br />
randomly selected; and only one block was randomly selected in the UP. These decisions<br />
were based primarily on the availability of volunteers in the different regions of the state.<br />
Because of the difficulty of achieving coverage goals in MBBA I, fewer priority blocks<br />
were used in MBBA II: A single priority block was chosen in each township, regardless<br />
of the region. To facilitate comparisons between the <strong>Atlas</strong> projects, the MBBA II priority<br />
blocks are a subset of those used in MBBA I. Therefore, while a priority block was<br />
randomly selected out of the four possibilities per township in the SLP, there were only<br />
two possibilities per township in the NLP and one possibility per township in the UP. A<br />
secondary block was selected in each township for MBBA II in roughly the same fashion.<br />
Observers were directed to survey the priority blocks first. If they were unable to travel<br />
to a more distant priority block, the secondary and non-priority blocks could be surveyed.<br />
Thus, data from all blocks were accepted, regardless of priority status, with the additional<br />
coverage expanding our knowledge of species-specific distributions. Because block<br />
coverage was unequal in MBBA II and MBBA I, results have been compiled by township<br />
to facilitate comparisons within and between <strong>Atlas</strong>es.<br />
Coverage Goals<br />
A major objective of the field work portion of MBBA II was to adequately cover each<br />
priority block. As in MBBA I, a minimum count of 50 species was used to signify an<br />
adequate level of coverage (McPeek and Adams 1991). This was an internal quality<br />
control measure and surveys were never cut short at this number. While blocks in some<br />
habitats (urban centers, agricultural areas, and deep forest) might not reach 50 species,<br />
this measurement was useful in identifying locations in need of additional coverage. In<br />
addition to number of species, coverage can be described by field hours (effort) and by<br />
the number of records obtained. While these metrics had no defined goal, they provide a<br />
useful summary of coverage information for MBBA II. The standard <strong>Atlas</strong> forms are the<br />
casual card, the point count form, and the survey checklist form. Effort was collected on<br />
two forms: The point count protocol stipulated that observers spend five minutes at each<br />
point, so a standard 25-point survey counted as approximately two hours, while the<br />
survey checklist asked for hours spent in the field. Each species listed on a form was<br />
considered a record.<br />
While effort seems a very straightforward measurement, the number of hours needed to<br />
cover a block varies with the skill of the individual observer. How observers recorded<br />
and perceived their time spent in a block also varied. Surveys from volunteers which did<br />
not include time were assigned field hours at the rate of one hour per 30 species reported.<br />
Because data on hours were not available from MBBA I, no comparisons can be made in<br />
terms of hours of effort with MBBA II.<br />
© 2012 Kalamazoo Nature Center<br />
4 of 14
<strong>Methods</strong><br />
The Second <strong>Michigan</strong> <strong>Breeding</strong> <strong>Bird</strong> <strong>Atlas</strong><br />
Survey Procedures<br />
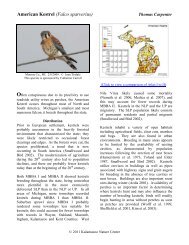
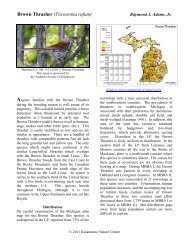
The state was divided into 26 regions, each with two to four counties (Figure 2).<br />
Regional Coordinators helped with recruiting volunteers, distributing information, and<br />
monitoring coverage. If a region did not have a coordinator, MBBA II staff at KNC<br />
organized observers for that area.<br />
Figure 2: <strong>Michigan</strong> <strong>Atlas</strong> regions<br />
© 2012 Kalamazoo Nature Center<br />
5 of 14
<strong>Methods</strong><br />
The Second <strong>Michigan</strong> <strong>Breeding</strong> <strong>Bird</strong> <strong>Atlas</strong><br />
<strong>Atlas</strong> participants were assigned blocks typically near where they lived or visited (e.g., a<br />
cabin up north). Some volunteers were willing to travel to do MBBA surveys. Each<br />
participant was given a packet with supplies and information including a participant<br />
handbook, other instructions, maps, data collection forms, and pertinent information<br />
about local species. Newsletters and workshops provided by <strong>Atlas</strong> staff and direct<br />
communication with regional coordinators and other participants were the main avenues<br />
for field work coordination and distribution of information. Participants were encouraged<br />
to survey priority blocks first and to visit all habitats within that block. Once the priority<br />
blocks were surveyed, they could visit other areas known to have unique or rare<br />
ecological communities. While priority blocks were emphasized, data were accepted<br />
from any area of the state. When a priority block was inaccessible (e.g., roadless,<br />
flooded, or private property) or a poor representation of the habitat within that township,<br />
a secondary or non-priority block could be substituted. During MBBA II, maximizing<br />
species counts in each block was encouraged over spending extra time to confirm<br />
breeding (KNC 2004).<br />
Paid field staff used the “blockbusting” survey method to cover more area in less time.<br />
Blockbusting consisted of covering all habitats in a block in a three- to five-hour period,<br />
with a goal of more than 50 species. Most field staff could cover two to four blocks per<br />
day using this method. Staff recorded the number of pairs observed in each block and<br />
were asked to visit each of their blocks twice at least a week apart.<br />
A subset of participants conducted MBBA II point counts. The goal was to obtain point<br />
count data for at least 25% of priority blocks. Observers were supplied with the point<br />
count handbook, maps, and data forms. Participants were asked to survey 25 points, 20<br />
on-road and five off-road (where conditions permitted). Initial maps contained 150<br />
points from which to choose; later maps contained fewer points, selected from the<br />
original 150 using a stratified random sample provided by the MDNR. Using either map,<br />
participants chose 25 points that resulted in uniform distribution within their block (KNC<br />
2005).<br />
<strong>Breeding</strong> Codes<br />
<strong>Breeding</strong> codes used in MBBA II were changed only slightly from those used in MBBA I<br />
(McPeek and Adams 1991) and closely follow standards set by the North American<br />
Ornithological <strong>Atlas</strong> Committee (Laughlin et al. 1990). The 20 criteria fall into four<br />
categories: observed, possible, probable, and confirmed. These codes and their<br />
explanations were on the back of the survey checklist forms and casual cards and in the<br />
<strong>Atlas</strong> Handbook.<br />
OBSERVED:<br />
O—Species observed during its breeding season but no evidence of breeding in block.<br />
Individual birds in unlikely breeding habitat, flying over, or out of their normal<br />
breeding range without any indication of breeding belong in this category.<br />
POSSIBLE:<br />
#—Species observed in suitable nesting habitat during its breeding season.<br />
© 2012 Kalamazoo Nature Center<br />
6 of 14
<strong>Methods</strong><br />
The Second <strong>Michigan</strong> <strong>Breeding</strong> <strong>Bird</strong> <strong>Atlas</strong><br />
X—Singing male present in suitable nesting habitat during its breeding season.<br />
PROBABLE:<br />
S—Singing male present at same location on at least two dates at least seven days apart<br />
or multiple (five or more) singing males on the same date during the breeding<br />
season.<br />
P—Pair observed in suitable nesting habitat during breeding season.<br />
T—Territorial behavior (chasing individuals of the same species).<br />
C—Courtship behavior or copulation.<br />
N—Visiting probable nest site.<br />
A—Agitated behavior or anxiety calls from adult.<br />
B—Nest building by wrens or excavation of holes by woodpeckers.<br />
CONFIRMED:<br />
NB—Nest building by all except woodpeckers and wrens.<br />
PE—Physiological evidence of breeding or brooding based on bird in hand. Banders or<br />
biologists actually handling the birds are to use this code.<br />
DD—Distraction display or injury feigning.<br />
UN—Used nests or eggshells found. Caution: These must be carefully identified.<br />
FL—Recently fledged young (of altricial species) incapable of sustained flight, or downy<br />
young (of precocial species) restricted to the natal area by dependence on adults<br />
or limited mobility.<br />
ON—Occupied nest: Adults entering or leaving a nest site in circumstances indicating<br />
occupied nest (includes high nests or nest holes, the contents of which cannot be<br />
seen) or adult incubating or brooding.<br />
FY—Adults with food for young (carrying food) or feeding young. Use caution as some<br />
species will continue to feed young for a number of weeks after leaving the nest<br />
and may move some distance.<br />
FS—Adult carrying fecal sac.<br />
NE—Nest with eggs.<br />
NY—Nest with young seen or heard. Presence of a Brown-headed Cowbird egg or<br />
young is confirmation for both the cowbird and the host species.<br />
Data Collection<br />
<strong>Atlas</strong> participants collected data using standard forms supplied by MBBA II staff and<br />
regional coordinators. Observers could also enter their sightings using a web-based form<br />
designed and maintained by Keith Saylor of Northern <strong>Michigan</strong> <strong>Bird</strong>ing; the forms at<br />
were available during the second half of MBBA II.<br />
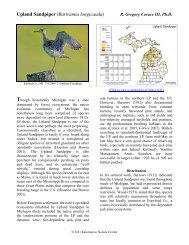
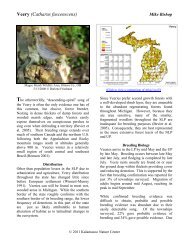
The survey checklist form was used when observers surveyed an entire block (Error!<br />
Reference source not found.). Observers recorded location (down to section, if needed),<br />
date(s), hours, and contact information on the front panel. Every species potentially<br />
breeding in <strong>Michigan</strong> was included in the checklist. Species requiring additional<br />
documentation were marked in bold, with an asterisk and an explanatory code. For each<br />
species, the highest number of pairs seen, highest breeding evidence code, and date were<br />
recorded. The back panels listed the breeding codes and the <strong>Atlas</strong> ethics.<br />
© 2012 Kalamazoo Nature Center<br />
7 of 14
<strong>Methods</strong><br />
The Second <strong>Michigan</strong> <strong>Breeding</strong> <strong>Bird</strong> <strong>Atlas</strong><br />
Figure 3: <strong>Atlas</strong> survey checklist form<br />
© 2012 Kalamazoo Nature Center<br />
8 of 14
<strong>Methods</strong><br />
The Second <strong>Michigan</strong> <strong>Breeding</strong> <strong>Bird</strong> <strong>Atlas</strong><br />
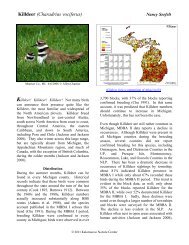
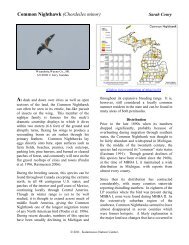
Additional documentation was recorded on <strong>Michigan</strong> Natural Features Inventory (MNFI)<br />
rare bird observation form. Documentation was required for all <strong>Michigan</strong> listed species<br />
(including special concern) and any species that had not been confirmed during MBBA I<br />
(Figure 4).<br />
Figure 4: Rare bird observation form<br />
© 2012 Kalamazoo Nature Center<br />
9 of 14
<strong>Methods</strong><br />
The Second <strong>Michigan</strong> <strong>Breeding</strong> <strong>Bird</strong> <strong>Atlas</strong><br />
Casual bird observation cards were used to collect incidental observations (Error!<br />
Reference source not found.). <strong>Bird</strong>s encountered during the course of other activities<br />
(e.g., driving to work, at the dog park) could be easily reported using the casual card.<br />
Figure 5: Casual bird observation card<br />
Participants who conducted MBBA II point counts used the point count data forms<br />
(Error! Reference source not found.). Each five-minute count period was broken into<br />
three-minute and two-minute intervals. <strong>Bird</strong>s were recorded in four distance categories:<br />
within 50 m, 50-100 m, more than 100 m, and “flyover”. The latitude and longitude of<br />
each point, weather conditions, and the dominant habitat were also recorded. For<br />
inclusion in the maps, point count data from each block were compiled onto survey<br />
checklist forms.<br />
© 2012 Kalamazoo Nature Center<br />
10 of 14
<strong>Methods</strong><br />
The Second <strong>Michigan</strong> <strong>Breeding</strong> <strong>Bird</strong> <strong>Atlas</strong><br />
Figure 6: Point count data form<br />
Other Data Sources<br />
Data from other sources were included when feasible. Many organizations and<br />
independent biologists were conducting species-specific avian research, population<br />
inventories, or geographically restricted studies of birds and many were willing to share<br />
their data. They are acknowledged in the <strong>Atlas</strong> Participants section. Published<br />
information was also used when it was relevant and could be located to the block level.<br />
Appropriate breeding codes were assigned by MBBA II staff (e.g., courtship behavior<br />
was assigned at leks). These studies seldom followed MBBA II protocols and often took<br />
place in unique biological communities. These data greatly improved the distribution<br />
maps for certain species.<br />
In particular, the MDNR provided MNFI with funding to support the MNFI mission,<br />
which also furthered the goals and objectives of MBBA II. These projects included<br />
surveys for secretive marshland and grassland birds, including Yellow and King Rails<br />
and Henslow’s Sparrow, a three-year owl survey, and surveys of Northern Goshawk and<br />
Red-shouldered Hawk. Other surveys provided data for federally listed species (Piping<br />
Plover and Kirtland’s Warbler), other <strong>Michigan</strong> listed species (Trumpeter Swan,<br />
Common Loon, Peregrine Falcon, Caspian and Common Terns, Prairie and Yellowthroated<br />
Warblers) and game species (Northern Bobwhite, Ring-necked Pheasant, Ruffed<br />
and Sharp-tailed Grouse, Wild Turkey, and American Woodcock). Data for colonial<br />
nesting birds were submitted by the Great Lakes Colonial Waterbird Survey, a project<br />
conducted by the University of Minnesota for the U.S. Fish and Wildlife Service and<br />
Canadian Wildlife Service. Data on Eastern Bluebirds and other cavity-nesting species<br />
were obtained from NestWatch, a project of the Cornell Lab of Ornithology. Most Purple<br />
Martin information was obtained from the website .<br />
<strong>Breeding</strong> records noted in the <strong>Michigan</strong> <strong>Bird</strong> Survey, published in <strong>Michigan</strong> <strong>Bird</strong>s and<br />
© 2012 Kalamazoo Nature Center<br />
11 of 14
<strong>Methods</strong><br />
The Second <strong>Michigan</strong> <strong>Breeding</strong> <strong>Bird</strong> <strong>Atlas</strong><br />
Natural History, were cross-referenced with <strong>Atlas</strong> data and new records were added for<br />
less common species.<br />
KNC provided additional data from a variety of related surveys including an avian<br />
inventory of the Four Townships area in Barry and Kalamazoo Counties, a long-term<br />
survey of the birds of the Fort Custer Military Training Center, Kalamazoo <strong>Breeding</strong> <strong>Bird</strong><br />
Surveys, and other projects of the Conservation Stewardship Department.<br />
Data Processing and Analysis<br />
Most <strong>Atlas</strong> volunteers submitted their data forms directly to KNC, the <strong>Atlas</strong> headquarters,<br />
and printouts of the data were later provided to regional coordinators. A few regional<br />
coordinators received the data directly, checked it, and forwarded it to KNC. As<br />
indicated, some volunteers entered the data on-line. Data from the North American<br />
<strong>Breeding</strong> <strong>Bird</strong> Survey were provided by the USGS Patuxent Wildlife Research Center.<br />
All data received were then entered into a Filemaker Pro TM database. To allow<br />
integration with ESRI-compatible GIS data sets, these data were later transferred to a<br />
Microsoft Access TM database.<br />
Each winter, data were summarized by block and species, allowing MBBA II staff to set<br />
objectives and assign areas in need of coverage for the coming season.<br />
Editing and Verification<br />
It took about a year to edit all the collected data. The records were verified by doublechecking<br />
for field and data entry errors. Some species’ breeding criteria codes were<br />
edited for proper use and consistency. <strong>Breeding</strong> codes of some colonial nesting species<br />
(i.e., Double-crested Cormorant, Ring-billed and Herring Gull, Caspian and Common<br />
Tern) were downgraded from possible to observed since many of these birds can be nonbreeding<br />
wanderers. Various species-specific filters, customized to the published<br />
migration periods and breeding seasons, were also applied to the data to separate possible<br />
early or late migrants from possible breeding birds. Preliminary maps were sent to<br />
species account authors and others experienced with those species; these people looked<br />
for observations occurring outside the known range.<br />
Observers were required to submit written documentation to support reports of rare<br />
species. This documentation was sent to the <strong>Michigan</strong> <strong>Bird</strong> Records Committee (MBRC)<br />
for verification. The MBRC was formed in 1987 to maintain a comprehensive list of<br />
birds occurring in the state and to review records of species classified as “casual” or<br />
“accidental” based on defined criteria (Granlund 1988). MBRC decisions determined<br />
whether specific records of casual or accidental species were entered into the <strong>Atlas</strong><br />
database. Many atlas projects take this same cooperative approach with their state<br />
records committees (e.g., New York; McGowan and Corwin 2008).<br />
Mapping<br />
Species occurrence and all other maps were created using ArcMap TM 9.2 from queries<br />
generated from the main dataset in Microsoft Access TM . Information was compiled at the<br />
township level for increased visibility and comparison to MBBA I. Township-level<br />
© 2012 Kalamazoo Nature Center<br />
12 of 14
<strong>Methods</strong><br />
The Second <strong>Michigan</strong> <strong>Breeding</strong> <strong>Bird</strong> <strong>Atlas</strong><br />
mapping also offset the differences resulting from intensive block coverage in SW<br />
<strong>Michigan</strong>. Using a PLSS data layer provided by MDNR, MBBA II staff built a<br />
township/ block layer and extended it to cover all land areas in the state. MBBA II staff<br />
also extended shoreline townships to full 36 square mile areas to balance the visual<br />
weight of the final product. The creation of new blocks was necessary in a few areas that<br />
were not in the original file; this included small unpopulated islands.<br />
Occurrence maps for each species indicated the highest breeding category recorded for<br />
that township: confirmed, probable, or possible. Records in the observed category were<br />
not mapped.<br />
Limitations and Biases<br />
Inherently, there are limitations and biases when conducting a statewide survey of birds.<br />
These include observer skill and experience, the amount of effort, and the number and<br />
distribution of observers. All of these influence the quality of the final data set,<br />
especially for analysis at the block level. Summarizing results by township mitigates<br />
some of the effects caused by observer-related inconsistencies as well as regional<br />
sampling differences.<br />
For MBBA II, 1,733 blocks were designated as priority for coverage. This was a more<br />
attainable number than the 4,300 attempted during MBBA I. One limiting factor was the<br />
number of volunteers during MBBA II, which was less than in MBBA I. As in MBBA I,<br />
there was an observer bias toward surveying popular birding areas and habitats and less<br />
effort expended surveying on private land or land that would yield a low species count.<br />
Industrial, agricultural, and urban areas were less likely to be surveyed while forests,<br />
coastlines, parks, marshes, and edge habitat drew more attention. There was also limited<br />
success covering some Great Lakes islands due to their remote nature.<br />
Most <strong>Atlas</strong> field work took place from late May to mid-July and during the early morning<br />
hours. Therefore, the data tend to be biased against species that nest early or late in the<br />
season. The data also tend to be biased against crepuscular, nocturnal, and marshland<br />
birds; MNFI surveys for these species groups greatly improved coverage for <strong>Atlas</strong> II.<br />
The inclusion of data from species-specific surveys, such as gamebird counts or raptor<br />
nesting studies, also biased the data. These studies were often focused on public lands<br />
while much of <strong>Michigan</strong>’s land is in private hands; effort may have been less<br />
concentrated on private land, even when permission was granted by landowners. More<br />
specific references to limitations and biases can be found in the individual species<br />
accounts.<br />
© 2012 Kalamazoo Nature Center<br />
13 of 14
<strong>Methods</strong><br />
The Second <strong>Michigan</strong> <strong>Breeding</strong> <strong>Bird</strong> <strong>Atlas</strong><br />
Literature Cited<br />
Granlund, J. 1988. Bylaws of the <strong>Michigan</strong> <strong>Bird</strong> Records Committee and the <strong>Michigan</strong><br />
bird list. Jack-Pine Warbler 66: 175-180.<br />
Great Lakes Environmental Research Laboratory [GLERL]. 2010. Water Levels of the<br />
Great Lakes. NOAA/GLERL, Ann Arbor, <strong>Michigan</strong>, USA. . Accessed 7 March 2011.<br />
Kalamazoo Nature Center [KNC]. 2004. <strong>Michigan</strong> <strong>Breeding</strong> <strong>Bird</strong> <strong>Atlas</strong> II Handbook.<br />
Kalamazoo Nature Center, Kalamazoo, <strong>Michigan</strong>, USA.<br />
Kalamazoo Nature Center [KNC]. 2005. <strong>Michigan</strong> <strong>Breeding</strong> <strong>Bird</strong> <strong>Atlas</strong> II Point Count<br />
Handbook. Kalamazoo Nature Center, Kalamazoo, <strong>Michigan</strong>, USA.<br />
Laughlin, S.B., J.R. Carroll, and S.M. Sutcliffe. 1990. Standardized <strong>Breeding</strong> Criteria<br />
Codes: Recommendations for North American <strong>Breeding</strong> <strong>Bird</strong> <strong>Atlas</strong> Projects. In C.R.<br />
Smith, editor. Handbook for <strong>Atlas</strong>ing North American <strong>Breeding</strong> <strong>Bird</strong>s. North<br />
American Ornithological <strong>Atlas</strong> Committee. .<br />
Accessed 1 January 2010.<br />
McGowan, K.J., and K. Corwin, editors. 2008. The Second <strong>Atlas</strong> of <strong>Breeding</strong> <strong>Bird</strong>s in<br />
New York State. Cornell University Press, Ithaca, New York, USA.<br />
McPeek, G.A., and R.J. Adams, Jr. 1991. The <strong>Atlas</strong> Survey. Pages 1-9 in R. Brewer,<br />
G.A. McPeek, and R.J. Adams, Jr., editors. The <strong>Atlas</strong> of <strong>Breeding</strong> <strong>Bird</strong>s of <strong>Michigan</strong>.<br />
<strong>Michigan</strong> State University Press, East Lansing, <strong>Michigan</strong>, USA.<br />
Robbins, C.S., and P.H. Geissler. Survey <strong>Methods</strong> and Mapping Grids. In C.R. Smith,<br />
editor. Handbook for <strong>Atlas</strong>ing North American <strong>Breeding</strong> <strong>Bird</strong>s. North American<br />
Ornithological <strong>Atlas</strong> Committee. .<br />
Accessed 1 January 2010.<br />
Webster, G.R., and J. Leib. 2011. Living on the Grid: The US Rectangular Public Land<br />
Survey System and the Engineering of the American Landscape. Pages 2123-2138 in<br />
S.D.D. Brunn, editor. Engineering Earth: The Impacts of Megaengineering Projects.<br />
Springer, New York, New York, USA.<br />
Suggested Citation<br />
Chartier, A.T., J.J. Baldy, and J.M. Brenneman, editors. 2012. The Second <strong>Michigan</strong><br />
<strong>Breeding</strong> <strong>Bird</strong> <strong>Atlas</strong>. Kalamazoo Nature Center, Kalamazoo, <strong>Michigan</strong>, USA.<br />
Accessed online at .<br />
© 2012 Kalamazoo Nature Center<br />
14 of 14