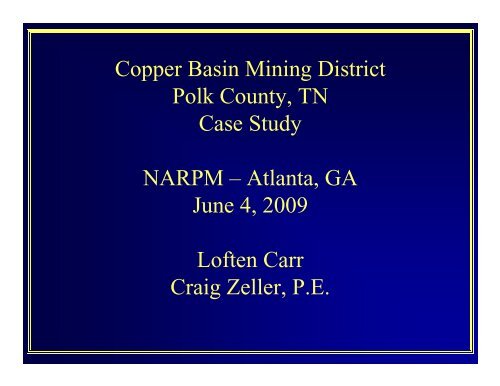
Copper Basin Mining District Polk County, TN Case Study NARPM ...
Copper Basin Mining District Polk County, TN Case Study NARPM ...
Copper Basin Mining District Polk County, TN Case Study NARPM ...

Create successful ePaper yourself
Turn your PDF publications into a flip-book with our unique Google optimized e-Paper software.
<strong>Copper</strong> <strong>Basin</strong> <strong>Mining</strong> <strong>District</strong><br />
<strong>Polk</strong> <strong>County</strong>, <strong>TN</strong><br />
<strong>Case</strong> <strong>Study</strong><br />
<strong>NARPM</strong> – Atlanta, GA<br />
June 4, 2009<br />
Loften Carr<br />
Craig Zeller, P.E.
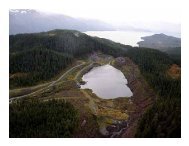
<strong>Copper</strong> <strong>Basin</strong> Vicinity Map<br />
North Potato Creek Watershed<br />
Tennessee<br />
Georgia<br />
White Water<br />
Center<br />
Davis Mill Creek Watershed
Site History<br />
• 150 years of copper, zinc and iron mining ,<br />
beneficiation, mineral processing and chemical<br />
manufacturing.<br />
• 1850 – Hiwassee Mine opens. Ore production begins<br />
and continued with brief interruptions until 1987.<br />
• Legacy of contaminated waters, excessive erosion<br />
and sedimentation, and devastated ecosystems.<br />
• Deforestation to fuel open roasting of ore, and<br />
emissions of acid gas, left tens of thousands of acres<br />
totally denuded by the early 1900s. Reforestation<br />
efforts were largely unsuccessful until the 1980s<br />
• Total ore production (mostly underground workings)<br />
from nine ore bodies exceeded 95 million tons.
Site History Con’t<br />
• Mines and processing facilities produced blister copper,<br />
copper, iron and zinc concentrates and a variety of<br />
non-metallic chemical products.<br />
• Smelting and roasting of ores occurred at 20 individual<br />
sites in the basin.<br />
• Flotation, concentration occurred at 4 sites<br />
• Sulfuric acid production occurred at 9 different plants.
Environmental Concerns<br />
• Acid Mine Drainage<br />
• Heavy Metals<br />
• PCBs<br />
• Erosion/sedimentation
1912 Eroded hills ( Note man in fore ground ).
This photo from the early 1900s shows how bad the<br />
erosion problems at the site once were.
1939 Ore train in <strong>Copper</strong> <strong>Basin</strong>.
1912 Chamber Acid Plant/Smelter at <strong>Copper</strong> Hill.
1939 London Mine/London Mill Flotation Plant
Eastern Desert (1973): Aerial view of Isabella area in<br />
North Potato Creek watershed
Same aerial view in 1996 of re-vegetated <strong>Copper</strong> <strong>Basin</strong>.
January 2001 MOU<br />
• Collaborative agreement between EPA<br />
Region 4, TDEC and Glenn Springs<br />
Holdings (Occidental Petroleum)<br />
• EPA focus on Davis Mill Creek watershed<br />
• TDEC focus on North Potato Creek<br />
watershed<br />
• Glenn Springs to fund and implement<br />
removal actions in DMC/NPC<br />
• EPA Fund Lead RI/FS on Ocoee River
Davis Mill Creek Watershed<br />
Remedial Investigations and<br />
Removal Actions
Davis Mill Creek<br />
•Watershed contains over<br />
15 million tons of mining related waste materials<br />
•Ocoee River is 303d listed as non-supporting for pH, metals, and<br />
suspended solids<br />
•Davis Mill Creek contributes ~1% of the water to the Ocoee River<br />
•DMC is the largest single source of acidity, Al, Cu, Fe, Mn, Zn and<br />
other heavy metals
CANTRELL FLATS WATER TREATMENT PLANT<br />
‣The Cantrell Flats Water Treatment Plant was<br />
refurbished in 2002 and began treatment of<br />
water from Davis Mill in November of that year.<br />
Since then, the treatment plant has removed<br />
95% of the dissolved metals that previously<br />
discharged to the Ocoee River.<br />
‣The plant removes over 8,000<br />
pounds per day of dissolved<br />
metals and neutralizes nearly<br />
15,000 pounds per day of<br />
acidity prior to discharge to the<br />
Ocoee River.
SUMMARY OF DAVIS MILL ACID AND METALS LOADING<br />
REMOVED BY CFWTP<br />
NOVEMBER 18, 2002 – SEPTEMBER 2007<br />
LOAD REMOVED<br />
BY CFWTP (lbs.)<br />
Daily Removal (lbs.)<br />
Iron<br />
11,444,304<br />
6,437<br />
Zinc<br />
1,747,367 983<br />
Manganese<br />
<strong>Copper</strong><br />
1,091,139<br />
17,266<br />
614<br />
10<br />
Lead<br />
1,217 1<br />
Cadmium 1,744<br />
1<br />
TOTAL: 14,303,038 8,044<br />
Acidity 26,214,035<br />
14,744
Activities in Davis<br />
Mill Creek<br />
Watershed<br />
Gypsum<br />
Pond<br />
Gypsum Pond Diversion<br />
Sediment Dam No. 1, 2<br />
and 3 Modifications<br />
Davis Mill Mill Creek Creek<br />
3<br />
2<br />
1<br />
Belltown Creek Diversion<br />
Belltown Creek<br />
Cantrell Flats Wastewater<br />
Treatment Plant<br />
Refurbishment<br />
Ocoee
MODIFIED DAMS FOR SEDIMENT PONDS 1, 2, and 3 IN DAVIS MILL<br />
Completed in 2004 to provide<br />
storm water detention capacity<br />
so that Davis Mill storm flows<br />
can be treated by Cantrell Flats<br />
Water Treatment Plant<br />
Fill at Silt Dam #1<br />
Removing Concrete at Silt Dam #1<br />
Riprap at Silt Dam #1 Wall at Silt Dam #1
THE GYPSUM POND AND<br />
BELLTOWN CREEK<br />
DIVERSIONS<br />
Gypsum Pond Diversion<br />
Belltown Creek Diversion<br />
Gypsum Pond<br />
Belltown Creek<br />
The diversions were constructed to:<br />
‣ Prevent commingling of clean<br />
Gypsum Pond and Belltown Creek<br />
water with contaminated Davis Mill<br />
water.<br />
‣ Prevent Gypsum Pond and Belltown<br />
Creek water from requiring<br />
treatment at Cantrell Flats Water<br />
Treatment Plant.<br />
‣ Completed in 2004
Belltown Creek Diversion Construction
Belltown Creek Diversion Construction Complete - 2004
September 2006<br />
• OXY GSHI completed the Report of Water Quality and Substrate<br />
Monitoring, Davis Mill Creek Watershed<br />
• Belltown / Gypsum Pond water quality is degraded as it passes<br />
through the Sub OU 3D from Dam # 3 to the Ocoee River<br />
• The flow of water through this reach of DMC and the West<br />
Drainage Channel flow discharge approximately 1,850 lbs of<br />
contamination (i.e., 350 lbs of metals and 1,500 lbs of acidity)<br />
per day to the Ocoee River
Amendment to<br />
April 4, 2004 PRP<br />
Lead Non-time Critical<br />
Removal Action<br />
Davis Mill Creek<br />
• Construct Dam # 4 near<br />
CTWWTP<br />
• Maximum discharge of 4,000 gpm.<br />
• Maximum impoundment of 130<br />
acre feet (10 year 24 hr storm<br />
event)<br />
• Conform to <strong>TN</strong> Safe Dams Act<br />
standards w/ spillway<br />
• Designed at 36 feet in height<br />
• Construct Dam # 5 at mouth<br />
of DMC (at RR bridge)<br />
• Pump Station with 5,250 gpm<br />
capacity to CFWWTP<br />
• 10 year 24 hr storm event =<br />
1,250 gpm base flow + 4,000 gpm<br />
storm flow<br />
• Designed at 7 feet in height w/<br />
bi-directional flow<br />
Est. Cost: $1,725,000
Combined Pending<br />
Removal Actions -<br />
Davis Mill Creek<br />
• Construct Two New<br />
Dams in Lower<br />
Davis Mill Creek<br />
• Extend Belltown<br />
Diversion to the<br />
Ocoee River
March 2009<br />
72 inch ID Acid Resistant Concrete<br />
Pipe Installation
Davis Mill Creek<br />
Watershed<br />
On Going Construction of the<br />
Belltown Creek Diversion<br />
Extension: 72 inch I.D. Acid<br />
Resistant Concrete Pipe<br />
Installation
Pressure Testing Pipe Joints
March 2009<br />
84’’<br />
Pipe
North Potato<br />
Creek<br />
Watershed
Activities in North Potato<br />
Creek<br />
Tailings<br />
Pond<br />
North Potato Creek Water<br />
Treatment Plant<br />
Burra Burra<br />
Creek<br />
South Mine Pit<br />
North Potato Creek<br />
Ocoee
TREATMENT SUMMARY NORTH POTATO CREEK WATER TREATMENT PLANT<br />
Average Concentration<br />
at SW9 During EE/CA<br />
Average<br />
Concentration at<br />
SW9 Effluent April<br />
28th, 2005 to<br />
Present*<br />
(μg/L) (μg/L) (%) (mgd) (lbs.) (lbs.)<br />
Aluminum (Dissolved) 1127.7 60.7 94.6% 10.89 96.94 70,768<br />
Cadmium (Dissolved) 0.7 0.08 87.9% 10.89 0.06 41<br />
<strong>Copper</strong> (Dissolved) 105.9 1.21 98.9% 10.89 9.51 6,944<br />
Iron (Dissolved) 3452.1 13.23 99.6% 10.89 312.44 228,083<br />
Manganese (Dissolved) 2460.6 1103.73 55.1% 10.89 123.28 89,994<br />
Lead (Dissolved) 5.7 0.09 98.4% 10.89 0.51 372<br />
Zinc (Dissolved) 577.8 5.5 99.0% 10.89 51.99 37,956<br />
pH (lab) 3.34 8.59<br />
Average<br />
Percent<br />
Removal<br />
Average Daily SW9<br />
Flow<br />
April 28th, 2005 to<br />
Present*<br />
Average Daily Loading<br />
Reduction<br />
Total Loading Reduction at<br />
SW9 January 10th, 2005 to<br />
January 10th, 2007 Based<br />
on Plant Removal Rates<br />
TOTAL: 595 434,158<br />
*April 28th, 2005: Plant was near stabilization<br />
*Data received up to 11/30/2006
NORTH POTATO CREEK<br />
WATER TREATMENT PLANT<br />
The North Potato Creek Water Treatment Plant began<br />
treating water on January 10, 2005, and is removing 840<br />
lbs. per day of dissolved metals from North Potato<br />
Creek prior to discharge to the Ocoee River<br />
Ocoee River<br />
North Potato Creek<br />
Pump<br />
Pumping<br />
Flow Diversion<br />
Diversion Channel<br />
Structure<br />
North Potato<br />
Creek Pump<br />
South<br />
Station<br />
Mine Pit<br />
SMP<br />
Discharge to<br />
Recycle<br />
Lime Feed<br />
NPC through<br />
Pump<br />
SMP Deep<br />
System<br />
Existing Outlet<br />
Pit Pump<br />
Rapid Mix/<br />
Aeration<br />
Tank<br />
Conceptual Design<br />
South Mine Pit<br />
SMP Discharge<br />
to NPC Through<br />
Existing Outlet<br />
Lime Feed<br />
System<br />
Rapid<br />
Mix/Aeration<br />
Tank<br />
North Potato<br />
Creek<br />
North Potato<br />
Creek Pump<br />
Station<br />
5
NPC<br />
UPSTREAM<br />
TREATMENT<br />
PLANT<br />
DIVERSION<br />
STRUCTURE<br />
DIVERSION<br />
CHANNEL<br />
DISCHARGE<br />
INTO PIT<br />
DEEP PUMP<br />
BARGE<br />
RECYCLE<br />
BARGE<br />
IN PIT<br />
MONITORING<br />
STATION<br />
RECYCLE<br />
PIPELINE<br />
NPC DOWNSTREAM (OCOEE RIVER 2100 FEET)<br />
6
North Potato Creek Watershed<br />
Completed Remedial Actions in the London Mill Area<br />
After (2009)<br />
Before (2007)
North Potato Creek<br />
Watershed<br />
Completed Remedial Actions in<br />
the London Mill Area
Upper Eureka Roaster/Smelter 2002
2008 – Excavation of Area along Haul Road
Upper Eureka Roaster/Smelter - March 2009
North Potato Creek Watershed –<br />
Fencing Physical Hazards<br />
Over 6 miles of fence have been constructed to restrict access<br />
to physical hazards such as subsidence areas and mine shafts
North Potato Creek Watershed –<br />
Fencing Physical Hazards Around Boyd Mine
Continued Monitoring Subsidence Hazards
In the Summer of 2005, GSH began implementation of Phase One Removal Actions in the North Potato Creek<br />
watershed. The actions include the excavation and removal of Bevill exempt and other non-hazardous materials for<br />
disposal in the Isabella Pit.
Continued Monitoring Surface and Ground Water at Isabella Collapse
Former Isabella Lead Chamber Acid Plant<br />
ISABELLA LEAD CONTAINMENT CAP – Site of former Isabella Lead Chamber Sulfuric Acid Plant,<br />
which contained approximately 1,400 tons of lead. In 2004, construction of an engineered<br />
containment cap was completed in the area to isolate lead-contaminated soils. A perimeter<br />
security fence was installed and a cap maintenance program has been implemented.
Continued Monitoring the Isabella Lead Chamber Acid Plant Containment Cap<br />
Lead Chamber Acid Plant Containment Cap
Isabella Isabella Slag Slag Area Area - June - February 2004 2004<br />
ELLIS BRANCH SLAG - In 2004, a cap was constructed covering the slag adjacent to<br />
Ellis Branch to prevent human exposure to lead.
McPherson Wye - 2005<br />
McPherson Wye - 2006<br />
McPherson Wye - 2007
LONDON MILL TAILINGS POND<br />
REVEGETATION DEMONSTRATION<br />
• Conducted by University of Tennessee –<br />
Knoxville during 1998 and 1999<br />
• Funded by a grant from Glenn Springs<br />
Holdings, Inc.<br />
• Tested surface materials, several different<br />
mixtures of grasses and legumes,<br />
fertilizers, and biosolids.<br />
LONDON MILL TAILINGS POND - 1993<br />
• Phosphorous, an essential nutrient, was<br />
found to be absent.<br />
• Identified the mix of plants and fertilizer<br />
to use to best establish vegetation.<br />
LONDON MILL TAILINGS POND - 2007
WETLANDS AND STREAM CHANNEL<br />
RESTORATION DEMONSTRATION<br />
• In 1998, GSH constructed a passive<br />
treatment demonstration anaerobic<br />
wetland. An aerobic wetland and a rock<br />
filter were added in 2003. The purpose<br />
is to show the effectiveness of passive<br />
systems for treatment of acidic waters in<br />
the North Potato Creek Watershed.<br />
• In 2003, GSH added a restored<br />
stream segment at the discharge of<br />
the demonstration wetland to<br />
determine the feasibility of<br />
providing stream habitat that would<br />
support biological integrity, which is<br />
the goal of the North Potato Creek<br />
Reclamation.
Ocoee River RI/FS
Ocoee River RI/FS<br />
• ≈ $2M Fund-Lead RI/FS<br />
• 26 River Miles, 3 TVA dams, white water recreation<br />
• <strong>Study</strong> Area Split into 3 components<br />
- <strong>Copper</strong> <strong>Basin</strong> Reach<br />
- Ocoee No. 3 Reservoir<br />
- Parksville Delta<br />
• Comprehensive assessment, HH/eco risk<br />
assessments, and 1D/2D sediment transport<br />
modeling
APACHE BLAST SLAG REMOVAL
Blue Ridge Reservoir
<strong>Copper</strong> <strong>Basin</strong> Reach<br />
Island at mouth of North<br />
Potato Creek<br />
Sandbar near Barker Mill
Ocoee No. 3 Reservoir<br />
Collecting samples of sediment in<br />
Ocoee No. 3 Reservoir<br />
Mouth of Tumbling Creek
Ocoee No. 3 Dam<br />
Downstream face of Ocoee No. 3 Dam
White Water Reach
Ocoee No. 3 Pool Level & Blue<br />
Ridge discharge – January 09<br />
Sediment Sluice<br />
1460<br />
1800<br />
Ocoee 3 WSE<br />
Blue Ridge Discharge<br />
Ocoee 3 Headwater Elevation - ft<br />
1450<br />
1440<br />
1430<br />
1420<br />
1410<br />
1600<br />
1400<br />
1200<br />
1000<br />
800<br />
600<br />
400<br />
200<br />
Blue Ridge Reservoir Discharge - cfs<br />
1400<br />
0<br />
0 50 100 150 200<br />
Time - hrs
Results of 1/03/09 Sediment Sluice
1/03/09 Sediment Sluice Con’t
01/03/09 Sediment Sluice Con’t
Parksville Delta
Parksville Delta – Low Water
Parksville Delta – High Water<br />
Parksville Reservoir at summer high pool
Ocoee River FS<br />
• <strong>Copper</strong> <strong>Basin</strong> Reach – 1) MNR;<br />
2) ) Enhanced Sediment Capping<br />
• Ocoee No. 3 – 1) MNR; 2) Hydraulic<br />
Control (ICs)<br />
• Parksville Delta – ) MNR; 2) Permanent<br />
Inudation; ; 3) Hydraulic Dredging<br />
• Comprehensive monitoring already<br />
underway<br />
• ROD late 2009/early 2010
QUESTIONS?