Comprehensive food security and vulnerability analysis (CFSVA ...
Comprehensive food security and vulnerability analysis (CFSVA ...
Comprehensive food security and vulnerability analysis (CFSVA ...

You also want an ePaper? Increase the reach of your titles
YUMPU automatically turns print PDFs into web optimized ePapers that Google loves.
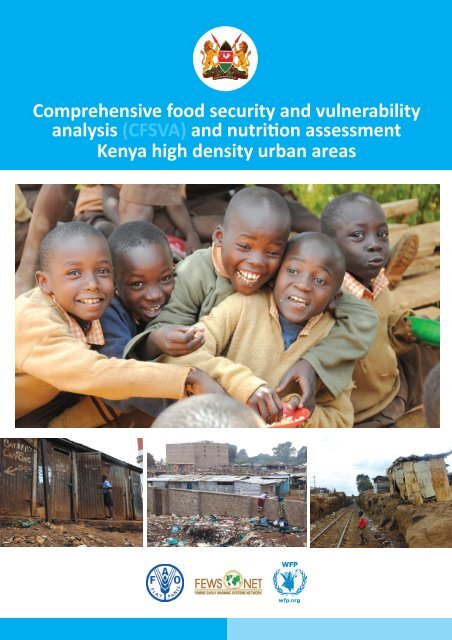
<strong>Comprehensive</strong> <strong>food</strong> <strong>security</strong> <strong>and</strong> <strong>vulnerability</strong><br />
<strong>analysis</strong> (<strong>CFSVA</strong>) <strong>and</strong> nutrion assessment<br />
Kenya high density urban areas
RAPID URBANIZATION EXPOSES TOWN DWELLING<br />
KENYANS TO FOOD INSECURITY AND MALNUTRITION<br />
Food <strong>security</strong> analyses for developing countries<br />
have mainly focused on rural areas because factors<br />
underlying <strong>food</strong> in<strong>security</strong> <strong>and</strong> malnutrion such<br />
as poverty, low educaon levels, poor sanitaon<br />
<strong>and</strong> lack of access to healthcare <strong>and</strong> compeve<br />
markets, are generally more severe.<br />
But rapid urbanizaon in developing countries,<br />
coupled with <strong>food</strong> price inflaon, is heightening<br />
poverty <strong>and</strong> <strong>food</strong> <strong>and</strong> nutrion in<strong>security</strong> in<br />
towns <strong>and</strong> cies, parcularly in Sub-Saharan-<br />
Africa. With economic growth unable to keep<br />
pace with such expansion, growing urban<br />
poverty is likely to hinder access to <strong>food</strong> with<br />
increasing force.<br />
Kenya is a low-income, <strong>food</strong>-deficit country with<br />
a GDP per capita of about US$775 (World Bank,<br />
2010) <strong>and</strong> a Gross Naonal Income (GNI) of US<br />
$1,492 (UNDP, 2011). The 2011 UNDP Human<br />
Development Report ranked it among the “low<br />
human development” countries of the world,<br />
placing it 143rd out of 187 countries.<br />
Its urban populaon has grown at 5% over<br />
the last decade, much faster than the average<br />
increase for Sub-Saharan Africa (2.3%).<br />
Town <strong>and</strong> ciity dwellers now account for an<br />
esmated 35% of the populaon. By 2020, a<br />
projected half of all Kenyans will live in cies<br />
<strong>and</strong> urban centres including unplanned urban<br />
selements.<br />
Almost all high density urban selements in<br />
Kenya are informal - oen on railway lines, river<br />
banks <strong>and</strong> near power plants. In Nairobi more<br />
than a fih live by rubbish dumps while across<br />
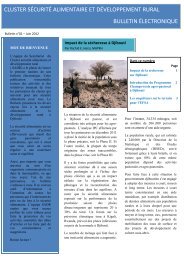
The livelihood clusters<br />
The urban populaon is oen mistakenly<br />
classified as one homogeneous group.<br />
Communies vary widely according to locaon,<br />
market specializaon <strong>and</strong> proximity to a specific<br />
pre-urban <strong>and</strong> urban border.<br />
Nine livelihood clusters were idenfied for this<br />
assessment:<br />
1. Nairobi<br />
2. Towns in NW pastoral<br />
3. Towns in NE pastoral<br />
4. Agro-pastoral (semi-arid) towns<br />
5. Towns in the SE marginal agricultural zone<br />
6. Towns in the high potenal mixed farming<br />
zone<br />
7. Towns in the high potenal dairy <strong>and</strong> cereal<br />
zone<br />
8. Towns in the coast marginal agricultural zone<br />
9. Towns in the mixed farming marginal zone<br />
the country up to 20% of the urban poor live on<br />
l<strong>and</strong> that is too steep for human habitaon. The<br />
households are oen exposed to hazards such as<br />
fires, vehicle <strong>and</strong> train accidents, l<strong>and</strong>slides <strong>and</strong><br />
polluon.<br />
The objecve of this survey is to analyze the<br />
<strong>food</strong> <strong>security</strong>, nutrional status <strong>and</strong> <strong>vulnerability</strong><br />
of the urban populaon of Kenya, to provide<br />
baseline informaon to the policy-makers<br />
<strong>and</strong> praconers, <strong>and</strong> to idenfy necessary<br />
intervenons. High populaon density urban<br />
areas only were considered 1 . It presents the<br />
findings of the assessment conducted in August<br />
<strong>and</strong> September 2010.<br />
1<br />
Low density urban areas who do not share the usual characteriscs of urban areas were eliminated from the sample universe. See the method secon.
THE STATE OF FOOD<br />
CONSUMPTION AND NUTRITION<br />
Poor dietary diversity underscores in<strong>security</strong><br />
Overall just 13% of high density urban households<br />
have unacceptable <strong>food</strong> consumpon (poor <strong>and</strong><br />
borderline FC) <strong>and</strong> fewer than 5% have poor FC.<br />
But in NW pastoral the proporon with poor FC is<br />
as high as 24%. Nairobi has the highest proporon<br />
of households with borderline FC (12%) followed<br />
by the coastal marginal zone (11%).<br />
Poor dietary diversity is the key driver of <strong>food</strong><br />
in<strong>security</strong> in urban Kenya. The 87% of urban<br />
households that have acceptable FC eat cereals<br />
<strong>and</strong> tubers, vegetables, sugar <strong>and</strong> oil on a daily<br />
basis. They also consume milk almost daily with<br />
animal proteins (meat <strong>and</strong> fish) <strong>and</strong> fruits on an<br />
average of three days a week. But those with<br />
poor <strong>and</strong> borderline FC have diets that are<br />
severely deficient in protein <strong>and</strong> micronutrients<br />
as they very rarely consume animal proteins,<br />
milk or fruits. Animal protein, milk <strong>and</strong> fruit<br />
consumpon is lowest in NW pastoral which also<br />
has the lowest FC score.<br />
Conversely NE pastoral households consume<br />
animal protein five days a week. Here the FC score<br />
is highest even though other factors associated<br />
with <strong>food</strong> in<strong>security</strong> are serious.<br />
Households with unacceptable consumpon<br />
are also lacking in energy. While urban Kenyans<br />
consume an average of 2005Kcals a day, 2 which<br />
is slightly below the recommended minimum<br />
dietary energy requirement of 2,133kcals per<br />
adult per day to lead an acve <strong>and</strong> healthy life,<br />
(FAO 2004), those with unacceptable FC consume<br />
fewer than 1800 kcals each a day.<br />
In the month running up to the survey one in ten<br />
urban households resorted to seven <strong>food</strong> related<br />
compromises mainly to cope with decreased<br />
income <strong>and</strong>/or <strong>food</strong> price increases. These coping<br />
mechanisms include relying on credit to buy<br />
<strong>food</strong>, eang fewer or smaller meals, restricng<br />
adult consumpon, borrowing <strong>food</strong> <strong>and</strong> eang<br />
cheaper products. Again the proporon was the<br />
highest in the NW pastoral (35%) <strong>and</strong> it was<br />
considerably higher for poor (44%) <strong>and</strong> borderline<br />
(40%) FC households.<br />
Household <strong>food</strong> shortages are seasonal with a<br />
higher proporon (31%) reporng difficulties<br />
feeding their families in January <strong>and</strong> between<br />
April <strong>and</strong> July – months when expenditures<br />
are also highest. The NW pastoral reported<br />
very high levels of difficulty in acquiring <strong>food</strong>,<br />
especially from December to February <strong>and</strong> June to<br />
August.<br />
About 12% of households reported having<br />
received <strong>food</strong> aid (mainly maize) over the last<br />
year rising to some 40% in the drier NW pastoral.<br />
About 14% of those in Nairobi’s informal<br />
selements receive <strong>food</strong> aid. Aid is more likely to<br />
go to elderly <strong>and</strong> women headed households.<br />
More than a quarter of children are stunted<br />
The nutrional status of urban children is beer<br />
than that of rural Kenyans, based on weight for<br />
height, height for age <strong>and</strong> weight for age, probably<br />
because of beer access to health care services,<br />
higher income levels, <strong>and</strong> beer infrastructure<br />
<strong>and</strong> market integraon that increases availability<br />
<strong>and</strong> accessibility to a variety of <strong>food</strong>s.<br />
2<br />
The State of the World Food In<strong>security</strong>, FAO, 2010
The rate of acute malnutrion is within the<br />
WHO acceptable rate (less than 5%) in all<br />
the livelihood clusters except NE pastoral<br />
(11%) where it is considered ‘serious’ based on<br />
the WHO guidelines 3 <strong>and</strong> agro pastoral (8%)<br />
<strong>and</strong> NW pastoral (7%) where it is considered<br />
‘poor’. Apart from the chronic <strong>food</strong> in<strong>security</strong><br />
because of prolonged drought in the arid<br />
<strong>and</strong> semi-arid pastoral l<strong>and</strong>s, the areas have<br />
poorly developed infrastructure parcularly in<br />
NW <strong>and</strong> NE pastoral, liming availability <strong>and</strong><br />
accessibility to a variety of <strong>food</strong>s <strong>and</strong> to health<br />
services.<br />
At 26.5% stunng rates are above the WHO<br />
acceptable level (20%) with the excepon<br />
of NE pastoral. The high stunng rates may<br />
be indicave of the impact of chronic <strong>food</strong><br />
in<strong>security</strong> <strong>and</strong>/or repeated infecons, poor IYCF<br />
pracces <strong>and</strong> inadequate access to maternal <strong>and</strong><br />
child health services.<br />
The highest rates (>30%) are in the mixed<br />
farming (cash crop <strong>and</strong> dairy) zone, coastal<br />
marginal, Nairobi, <strong>and</strong> agro-pastoral, where the<br />
nutrion situaon is considered “serious” based<br />
on the WHO cut-off-points of 30– 39%. 4 The<br />
stunng levels in high potenal mixed farming,<br />
marginal mixed farming, NW pastoral <strong>and</strong> SE<br />
marginal are categorized as “poor”.<br />
The global underweight rate for all the livelihood<br />
clusters is 13.1% with proporons peaking in<br />
NW pastoral, coastal marginal, agro pastoral, NE<br />
pastoral <strong>and</strong> SE marginal. The lowest rate is in<br />
Nairobi.<br />
Prevalence of malnutrion<br />
Livelihood zone Global acute Severe acute Global Severe Global Severe<br />
malnutrion malnutrion chronic chronic underweight underweight<br />
(GAM) (SAM) malnutrion malnutrion<br />
Agro-pastoral<br />
8.2<br />
Coast marginal 4.1<br />
Mixed farming HP 2.6<br />
Marginal<br />
2.7<br />
mixed farming<br />
2.4<br />
1.3<br />
1.0<br />
0.6<br />
29.6<br />
30.7<br />
28.8<br />
20.7<br />
7.9<br />
10.3<br />
9.7<br />
8.0<br />
16.0<br />
17.3<br />
9.4<br />
6.7<br />
6.1<br />
3.8<br />
1.9<br />
0.6<br />
Mixed farming 3.3<br />
(Cash crop & dairy)<br />
0.6<br />
32.5<br />
13.6<br />
12.4<br />
3.0<br />
Nairobi<br />
2.4<br />
NE pastoral 10.7<br />
NW pastoral 7.1<br />
SE marginal<br />
3.8<br />
OVERALL<br />
5.0<br />
URBAN<br />
5.3<br />
(naonal level)*<br />
0.7<br />
2.7<br />
1.1<br />
1.4<br />
1.3<br />
1.3<br />
30.5<br />
16.3<br />
22.7<br />
28.5<br />
26.5<br />
26.4<br />
9.7<br />
6.9<br />
7.1<br />
9.7<br />
9.2<br />
8.7<br />
10.1<br />
14.9<br />
18.6<br />
13.5<br />
13.1<br />
10.3<br />
1.7<br />
1.6<br />
4.2<br />
2.0<br />
2.7<br />
1.2<br />
RURAL<br />
NATIONAL<br />
(urban + rural)*<br />
7.0<br />
6.7<br />
2.0<br />
1.9<br />
37.1<br />
35.3<br />
15.3<br />
15.3<br />
17.3<br />
16.1<br />
4.1<br />
3.6<br />
3<br />
WHO cut off points for wasng using Z scores (
A PROFILE OF THE FOOD<br />
INSECURE AND MALNOURISHED<br />
Rising urban poverty drives<br />
<strong>food</strong> in<strong>security</strong> <strong>and</strong> malnutrion<br />
Wealth quinles by livelihood cluster<br />
Although poverty in Kenya has largely been<br />
perceived as a rural phenomenon, the<br />
proporon of the urban poor has been rising<br />
steadily. Recent World Bank esmates suggest<br />
that by 2020, urban poverty will represent<br />
almost half of the total poverty in the country.<br />
The socio-economic status of urban households<br />
is more likely to influence <strong>food</strong> access <strong>and</strong><br />
the nutrional status of children because the<br />
households’ main source of <strong>food</strong> is through<br />
purchase compared to rural areas where <strong>food</strong><br />
is more oen home produced. The poorer the<br />
household the more likely it is to have poor or<br />
borderline FCS. A quarter of the poorest have an<br />
unacceptable FCS.<br />
Household FCS by wealth groups<br />
Wealth quinles<br />
Poorest Poor Medium Wealthy Wealthiest<br />
Poor FCS 11.4% 3.6% 4.0% 1.6% 0.4%<br />
Borderline<br />
FCS 13.4% 9.5% 9.5% 6.1% 5.7%<br />
Acceptable<br />
FCS 75.2% 86.9% 86.5% 92.3% 93.9%<br />
The highest proporons of very poor households<br />
are in the NW <strong>and</strong> NE pastoral <strong>and</strong> coastal<br />
marginal agric clusters. More than half of<br />
poor casual labourers are in the two poorest<br />
wealth quinles (a quarter of urban workers<br />
are classified as poor casual labourers, though<br />
it’s a third in Nairobi <strong>and</strong> agro-pastoral.) This<br />
group is considerably more likely to have an<br />
unacceptable FCS.<br />
Unsurprisingly, dependents (beggars, borrowers,<br />
remiance receivers) are also likely to be very<br />
poor (42% in the poorest quinle) <strong>and</strong> a quarter<br />
of them have unacceptable <strong>food</strong> consumpon.<br />
There are a parcularly high percentage of<br />
dependents in NE pastoral.<br />
Those with unacceptable FC spend far less<br />
on <strong>food</strong> than those with acceptable. Food<br />
expenditure is lowest in the NW pastoral zone,<br />
<strong>and</strong> highest in NE, even though it’s the second<br />
poorest zone. But both zones have the highest<br />
proporon of expenditures devoted to <strong>food</strong><br />
purchases (62% <strong>and</strong> 65% respecvely).<br />
The poor are at the<br />
whim of market forces<br />
Urban households are highly dependent<br />
on buying their <strong>food</strong> - chiefly maize meal,<br />
milk, sugar, wheat flour, pasta, rice <strong>and</strong> bread -<br />
purchasing between 97% <strong>and</strong> 100% of their <strong>food</strong><br />
from markets.<br />
Supply to remote markets is errac. Nearly<br />
40% of traders reported inadequate supplies<br />
especially in January, March <strong>and</strong> August rising<br />
to 57% in remote NE <strong>and</strong> NW pastoral zones<br />
where infrastructure is poor.<br />
Prices are also errac: maize prices generally<br />
increased between 2008 -2010, tending to be<br />
higher in Nairobi, marginal mixed farming, NW<br />
<strong>and</strong> NE pastoral livelihood clusters. Food prices<br />
generally start rising from November to April.<br />
But in NW <strong>and</strong> NE pastoral prices usually peak<br />
in August during the lean season.<br />
Traders are oen unable to cope with increased<br />
dem<strong>and</strong> mainly because of lack of capital,<br />
competors or taxes, low profits, lack of credit,<br />
lack of supply, in<strong>security</strong> <strong>and</strong> lack of transport.
Households headed by women are more likely<br />
to be <strong>food</strong> insecure (6.5% have poor <strong>food</strong><br />
consumpon compared with 3.3% of maleheaded<br />
households). This is most likely because<br />
they are poorer because they spend less me in<br />
income generang acvies, are less likely to<br />
be employed, are paid less than men for the<br />
same task/period, <strong>and</strong> are less likely to get<br />
access to credit.<br />
Illness underscores <strong>food</strong> in<strong>security</strong> <strong>and</strong><br />
malnutrion<br />
Overall one in five individuals experienced<br />
some form of sickness - chiefly acute respiratory<br />
infecons (ARIs), malaria, fever <strong>and</strong> diarrheal<br />
disease, in the fortnight before the survey.<br />
Poorer households are slightly more likely to<br />
have ill members than wealthier.<br />
The prevalence of child morbidity in urban<br />
Kenya is high with over a third being ill<br />
in the fortnight running up to the survey. Long<br />
episodes of illness, parcularly of diarrheal<br />
diseases, ARI <strong>and</strong> malaria compromise the<br />
nutrional status of children. On average, the<br />
duraon of the last episode of illness was long -<br />
about one week. Rehabilitang <strong>and</strong> treang such<br />
a child is likely to take longer <strong>and</strong> be more costly.<br />
Infecons cause deterioraon of the nutrional<br />
status by depleng the crical body stores of<br />
protein, energy, minerals <strong>and</strong> vitamins. The loss<br />
of nutrient stores compromises the immunity<br />
status of children, rendering them more prone to<br />
infecons. The cycle of malnutrion-infeconfurther<br />
nutrional deterioraon-more infecons<br />
is a powerful pathway. A dual response on<br />
nutrion <strong>and</strong> infecon is needed to improve <strong>and</strong><br />
prevent the nutrional status of children from<br />
deteriorang.<br />
Timely health seeking was sought for less than<br />
half of children, dipping to 15.2% in coast<br />
marginal, mainly because of high costs <strong>and</strong><br />
inaccessibility. About a fih seek no assistance<br />
for their sick child because they view the illness<br />
as mild, but the cost of treatment is the main<br />
deterrant for 37% of those who did not<br />
seek care.<br />
A worryingly high proporon of mothers/<br />
caregivers endanger their children’s health by<br />
buying self prescribed drugs from shops/kiosks.<br />
Elderly-headed households are more<br />
vulnerable to hunger<br />
Over 22% of households headed by an elderly<br />
person have unacceptable FCS compared to 12%<br />
headed by the non elderly. Of these 7% have<br />
poor <strong>food</strong> consumpon compared with 4% of<br />
non-elderly headed households.<br />
Densely crowded households<br />
are more <strong>food</strong> insecure<br />
Households with poor FC have on average four<br />
individuals per room compared to three for<br />
those with an acceptable FC. Houses are generally<br />
small with nearly half having just one room.<br />
The crowding index is highest in the NE pastoral<br />
zone where about five people share a room,<br />
possibly a reflecon of prevailing cultural<br />
pracces. Again more crowded houses are more<br />
likely to be poor.
FCS by sex, age, household size<br />
<strong>and</strong> crowding index<br />
Gender<br />
of head<br />
Elderly<br />
Headed<br />
Male Female Yes No Household Crowding<br />
size index<br />
Poor FCS 3.3% 6.5% 6.9% 4.0% 5.5 4.1<br />
Borderline<br />
FCS 8.6% 9.4% 15.2% 8.1% 5.6 3.9<br />
Acceptable<br />
FCS 88.1% 84.0% 78.0% 87.8% 5.0 3.1<br />
Food in<strong>security</strong> <strong>and</strong> malnutrion are higher in<br />
households with unimproved sources of water<br />
<strong>and</strong> unimproved sanitaon<br />
Taps <strong>and</strong> boreholes for drinking water <strong>and</strong> toilet<br />
facilies are accessible to the majority of urban<br />
households with the excepon of the NW <strong>and</strong><br />
NE pastoral zones <strong>and</strong> SE marginal zone where<br />
the risk of water borne disease outbreaks are<br />
high, parcularly during the rainy season. Overall<br />
about a fifth of households sll access water<br />
from unprotected sources, where water is more<br />
impure.<br />
The main factors that restrict access to water<br />
include long waing mes at water points <strong>and</strong><br />
the relave high cost of water. The treatment<br />
of drinking water is poor <strong>and</strong> nearly half of<br />
households do not treat or boil water before<br />
consumpon though the percentage is<br />
considerably lower in NW pastoral <strong>and</strong> coast<br />
marginal agriculture.<br />
Most urban households (93%) have access to<br />
improved sanitaon, including 59.5% using<br />
tradional pit latrines, 19% using improved pit<br />
latrines <strong>and</strong> 12% using flush toilets. That sll<br />
leaves about 7% with no toilet facilies rising to<br />
more than a quarter in NE pastoral <strong>and</strong> almost a<br />
fih in NW pastoral.<br />
Households living in high density urban<br />
selements mainly share pit latrines with a large<br />
number of individuals. When full, they are closed<br />
or demolished <strong>and</strong> new ones are constructed<br />
nearby, or they are emped manually. It is<br />
reportedly not uncommon to see open areas<br />
used for excreta disposal, a serious health <strong>and</strong><br />
water polluon risk.<br />
The focus group discussion revealed that<br />
used water (e.g., soiled water from washing)<br />
is normally discarded outside houses, where<br />
drainage is generally poor, leading to pools of<br />
stagnant water. Solid waste disposal is a major<br />
problem in unplanned selements. In most<br />
urban areas it is disposed in open dumps or<br />
crude sanitary l<strong>and</strong>fills, is burned or turned into<br />
compost. Garbage collecon service is very poor.<br />
The commonest mode of disposal is dumping<br />
along streets, play fields <strong>and</strong> between houses.<br />
According to 1994-1996 Development Plan, the<br />
Nairobi City Council only collected a quarter of<br />
the nearly 340,000 tons of garbage generated in<br />
1992, a situaon that is likely to have worsened<br />
in subsequent years.<br />
Households who do not produce <strong>food</strong> <strong>and</strong>/or<br />
culvate fewer than two crops, <strong>and</strong> those who<br />
do not own animals are more likely to have<br />
poor FC<br />
Although high density urban households are<br />
almost totally market dependent, about a<br />
fih grow some crops (mainly maize, beans,<br />
other pulses <strong>and</strong> vegetables) <strong>and</strong> 16% own<br />
some livestock, chiefly poultry <strong>and</strong> cale.<br />
Crop producon is least frequent in NW <strong>and</strong><br />
NE pastoral zones, where livestock numbers<br />
are highest. The contribuon of livestock to<br />
household income <strong>and</strong> <strong>food</strong> is significant in NE<br />
pastoral <strong>and</strong> agro pastoral clusters. The main<br />
constraints to livestock producon include<br />
parasites <strong>and</strong> diseases, poor pasture <strong>and</strong><br />
in<strong>security</strong> or the.
The NW <strong>and</strong> NE pastoral livelihood clusters fair<br />
poorly on most factors associated with <strong>food</strong><br />
in<strong>security</strong> <strong>and</strong> malnutrion<br />
They have the highest crowding index; most<br />
frequent use of unimproved sources of water,<br />
sanitaon <strong>and</strong> waste disposal pracces;<br />
highest proporon of households in the<br />
poorest wealth quinle; highest proporon<br />
of expenditures devoted to <strong>food</strong> <strong>and</strong> among<br />
the lowest absolute value of expenditures<br />
per capita; high proporon of households<br />
adopng a “dependents” livelihood strategy<br />
(begging, borrowing, remiances); the lowest<br />
immunizaon, vitamin A <strong>and</strong> deworming<br />
coverage; the most frequent unmely<br />
introducon of complementary <strong>food</strong>s for<br />
children; <strong>and</strong> the lowest proporon of children<br />
meeng the minimum dietary diversity. The<br />
NW pastoral zone has the highest proporon<br />
of households with poor FC, <strong>and</strong> the highest<br />
average score on the coping strategy index. It<br />
also has the highest prevalence of underweight<br />
children <strong>and</strong> high prevalence of acute <strong>and</strong><br />
chronic malnutrion. Households in the NE<br />
pastoral zone do not have, on average, worse<br />
<strong>food</strong> consumpon scores than households<br />
in other zones. But they have the highest<br />
prevalence of acute malnutrion.<br />
The coastal marginal zone has a high proporon<br />
of households with borderline FC. It has a high<br />
percentage of women-headed households, <strong>and</strong> a<br />
higher proporon in the poorest wealth quinle<br />
compared to male-headed households. Rates of<br />
chronic malnutrion <strong>and</strong> underweight children<br />
are high as is the proporon of children affected<br />
by unmely introducon of complementary<br />
<strong>food</strong>s.<br />
Nairobi also has a high proporon of households<br />
with borderline FC <strong>and</strong> high rates of chronic<br />
malnutrion, highlighng the <strong>vulnerability</strong> of the<br />
populaon. A large proporon of households are<br />
engaged as poor casual wage labourers <strong>and</strong> few<br />
are involved in <strong>food</strong> producon.<br />
The agro-pastoral zone where use of unimproved<br />
sources of water is frequent <strong>and</strong> many are<br />
engaged as casual wage labourers. Levels of acute<br />
<strong>and</strong> chronic malnutrion are high. Food prices for<br />
maize <strong>and</strong> rice are among the highest.
WHAT OTHER FACTORS MAY BE DRIVING<br />
MALNUTRITION IN HIGH DENSITY URBAN KENYA?<br />
Vitamin A supplementaon is below the WHO<br />
cut-off-point of 80% in most livelihood clusters<br />
The frequency of supplementaon is inadequate<br />
with the majority of 12-59 month olds having<br />
received the supplement once <strong>and</strong> not the<br />
expected two mes in the 12 month-period<br />
preceding the survey. Of concern is the large<br />
proporon of children whose supplementaon<br />
is based on maternal <strong>and</strong> caregivers’ recall <strong>and</strong><br />
not on documentaon. Children with vitamin A<br />
deficiency suffer a dramacally increased risk<br />
of death, blindness <strong>and</strong> illness, especially from<br />
measles <strong>and</strong> diarrhoea. Vitamin A is essenal for<br />
the funconing of the immune system <strong>and</strong> the<br />
healthy growth <strong>and</strong> development of children.<br />
De-worming rates are low with no livelihood<br />
cluster meeng the acceptable level of 80%<br />
Certain types of intesnal parasites can cause<br />
anaemia. Periodic de-worming for organisms like<br />
helminthes <strong>and</strong> schistosomiasis (bilharzia) can<br />
improve children’s micronutrient <strong>and</strong> nutrional<br />
status. WHO recommends that children in<br />
developing countries exposed to poor sanitaon<br />
<strong>and</strong> lacking clean safe water should be de-wormed<br />
once every six months.<br />
Infant <strong>and</strong> young child feeding pracces are<br />
inappropriate for the majority of children<br />
The impact of under nutrion during the<br />
“window of opportunity” (from pregnancy<br />
to two years old) has irreversible long term<br />
effects on health <strong>and</strong> on cognive <strong>and</strong> physical<br />
development. About a quarter of children (<strong>and</strong><br />
half in NE pastoral) stopped breaseeding<br />
before the WHO recommended two years. The<br />
exclusive breaseeding rate is low. Despite the<br />
mely introducon of complementary feeding<br />
for the majority of the children, the frequency of<br />
feeding, parcularly for 9-23 month olds, is lower<br />
than the recommendaon for many children.<br />
Only two fihs of 6-23 month olds receive the<br />
minimum dietary diversity required to provide<br />
the necessary variety of nutrients for adequate<br />
growth <strong>and</strong> development. The lowest proporon<br />
of children is in NW pastoral (23.5%) probably<br />
because of poor knowledge of IYCF practices as<br />
well as <strong>food</strong> in<strong>security</strong> <strong>and</strong> cultural habits.<br />
Fewer than two thirds of caregivers wash their<br />
h<strong>and</strong>s before preparing <strong>food</strong> <strong>and</strong> only 35% aer<br />
h<strong>and</strong>ling a child’s stool<br />
Of equal concern is the low level (17%) who<br />
report washing their h<strong>and</strong>s before feeding a<br />
child. And only 30% wash their h<strong>and</strong>s with soap<br />
aer h<strong>and</strong>ling a child’s stool <strong>and</strong> 12% before<br />
feeding a child, exposing the child to a higher<br />
risk of contracng diseases.<br />
Hygiene st<strong>and</strong>ards <strong>and</strong> general facilies are<br />
oen poor at informal child day care centres<br />
These new centres are being set up in response<br />
to the need by mothers to leave home in search<br />
of work to support their families. Some are overcrowded,<br />
pung children at a high risk of crossinfecons.<br />
Many of the centres lack appropriate<br />
child care pracces with children le for long<br />
periods of me in wet nappies. Some lack water<br />
supply.<br />
Street <strong>food</strong>s are oen prepared <strong>and</strong> stored in<br />
unhygienic condions<br />
Urban households are eang more <strong>and</strong> more<br />
street <strong>food</strong>s because they are readily available,<br />
cheaper <strong>and</strong> convenient for many people with<br />
limited income <strong>and</strong> me.
RECOMMENDATIONS<br />
Target NW <strong>and</strong><br />
SE pastoral zones<br />
A comprehensive strategy is needed for the two zones, with an<br />
emphasis on increasing access to improved water <strong>and</strong> sanitaon,<br />
poverty alleviaon <strong>and</strong> livelihood /skills training for dependent<br />
households. Immunizaon <strong>and</strong> care pracces must be strengthened<br />
with the minimum objecve of reaching the level achieved in other high<br />
density urban areas.<br />
Evaluate the contribuon of urban agriculture to <strong>food</strong> <strong>security</strong> in the<br />
high populaon density informal selements.<br />
Urban agriculture<br />
KFSSG agriculture <strong>and</strong> livestock sector working group to effecvely<br />
parcipate in the formulaon of urban <strong>and</strong> peri-urban policy on<br />
agriculture.<br />
Evaluate producon per animal <strong>and</strong> its contribuon to consumpon<br />
<strong>and</strong> income; assess feed types, quality <strong>and</strong> sources; determine common<br />
livestock diseases (zoonoc diseases); <strong>and</strong> assess producon systems<br />
<strong>and</strong> livestock welfare.<br />
Markets <strong>and</strong> trade<br />
Carry out a comprehensive market study for urban high density<br />
areas to beer underst<strong>and</strong> how market structure, behaviour <strong>and</strong><br />
performance influences <strong>food</strong> in<strong>security</strong> in those areas.<br />
Establish a system to monitor prices of main <strong>food</strong> commodies<br />
regularly (maize meal, milk, sugar, wheat flour, pasta, rice <strong>and</strong> bread)<br />
Address constraints that prevent traders from meeng dem<strong>and</strong><br />
Improve supply to remote urban markets
Improve coverage of vitamin A supplementaon <strong>and</strong> de-worming. Improve<br />
documentaon of vaccinaons <strong>and</strong> supplementaon on child health cards to<br />
prevent unnecessary re-vaccinaon <strong>and</strong> reduce the chances of children receiving toxic<br />
doses of vitamin A.<br />
Establish or upscale strategies to cut child morbidity prevalence. Provide inseccide<br />
treated bed-nets to children under-five <strong>and</strong> pregnant mothers <strong>and</strong> advise on how to<br />
manage condions such as diarrhoea <strong>and</strong> fever.<br />
Scale up ongoing sensizaon <strong>and</strong> educaon regarding: the importance of seeking<br />
medical aenon for sick children in a mely way <strong>and</strong> the dangers of self-prescripon of<br />
drugs; opmal breaseeding <strong>and</strong> complementary feeding pracces including providing<br />
parcipatory sessions on how locally available <strong>food</strong>s can be used to prepare appropriate<br />
dishes for children; the importance of personal hygiene pracces such as washing of<br />
h<strong>and</strong>s with soap aer vising the latrine, before preparing <strong>food</strong>, before feeding children<br />
<strong>and</strong> aer h<strong>and</strong>ling a child’s faeces.<br />
Health <strong>and</strong> nutrion<br />
Work with the government to draw up guidelines for the operaon of informal child day<br />
care centres.<br />
Work with the department of public health to ensure that street <strong>food</strong> vendors operate<br />
in a clean <strong>and</strong> safe environment. Vendors should be licensed by local authories <strong>and</strong><br />
regularly inspected. Food h<strong>and</strong>lers should undergo medical tests, sanitaon should be<br />
improved <strong>and</strong> clean water availability assured.<br />
Iniate a health <strong>and</strong> nutrion informaon database that includes data on:<br />
• Growth monitoring of under-fives using health facility data (weight-for-age, heightfor-age<br />
<strong>and</strong> MUAC)<br />
• Child morbidity rates parcularly for diarrheal diseases, malaria, measles, parasic<br />
infecons, fever <strong>and</strong> acute respiratory infecons<br />
• Immunizaon coverage, vitamin A supplementaon <strong>and</strong> de-worming<br />
• IYCF indicators<br />
• Provision of health <strong>and</strong> nutrion educaon to women <strong>and</strong> the community at large<br />
• Maternal ante-natal <strong>and</strong> post-natal aendance<br />
• Coverage of iron/folate supplementaon for pregnant women<br />
• Rate of health facility delivery<br />
• Rate of vitamin A supplementaon for lactang women<br />
• Family planning coverage<br />
• Household <strong>food</strong> dietary diversity <strong>and</strong> <strong>food</strong> consumpon paerns from results of<br />
surveys conducted in informal selements.
For more informaon please contact:<br />
WFP Kenya<br />
Yvonne Forsen<br />
Yvonne.Forsen@wfp.org<br />
or<br />
Allan Kute<br />
allan.kute@wfp.org<br />
WFP CSVA global coordinator, Rome<br />
Siemon Hollema<br />
siemon.hollema@wfp.org