Sample IEEE Paper for A4 Page Size - IJETT-International Journal ...
Sample IEEE Paper for A4 Page Size - IJETT-International Journal ...
Sample IEEE Paper for A4 Page Size - IJETT-International Journal ...

You also want an ePaper? Increase the reach of your titles
YUMPU automatically turns print PDFs into web optimized ePapers that Google loves.
<strong>International</strong> <strong>Journal</strong> of Engineering Trends and Technology (<strong>IJETT</strong>) - Volume4 Issue8- August 2013<br />
CFD ANALYSIS OF STATIC PRESSURE AND DYNAMIC PRESSURE FOR NACA 4412<br />
Mr. Arvind Prabhakar,<br />
Mechanical engineering student, manipal institute of technology, Karnataka.<br />
Flat # 203, c-19, suryanagar, Ghaziabad, uttar Pradesh-201011<br />
Abstract— The static pressure and dynamic pressure are<br />
important parameters and have a strong influence on airplane<br />
wing lift and stagnation point. In this paper NACA 4412 airfoil<br />
profile is considered <strong>for</strong> analysis of an airplane wing .The<br />
NACA 4412 airfoil is created using CATIA V5 And CFD<br />
analysis is carried out using commercial code ANSYS 13.0<br />
FLUENT at an inlet boundary condition of V sound (i.e. 340.29<br />
m/s) <strong>for</strong> angles of attack of 0˚, 6, 12 AND 16˚. Standard k-ε<br />
turbulence model with standard wall function is used <strong>for</strong><br />
analysis. Variations of static pressure and dynamic pressure<br />
are plotted in <strong>for</strong>m of contour.<br />
Keywords— computational fluid dynamics, angle of attack<br />
(AOA) , airfoil , Vsound<br />
I. INTRODUCTION<br />
It is important to study static and dynamic pressure<br />
contours on an airfoil at Vsound with varying angle of<br />
attacks to understand the impacts on lift and stagnation<br />
point. The sum of static and dynamic pressure is the total<br />
pressure, and its difference on the upper and lower surface<br />
of the airfoil is the cause of lift.<br />
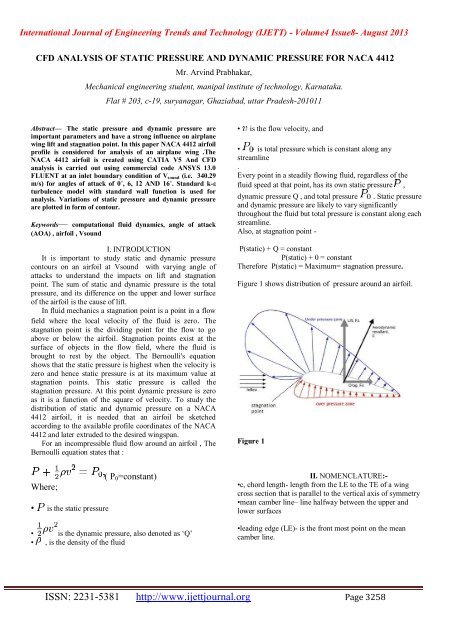
In fluid mechanics a stagnation point is a point in a flow<br />
field where the local velocity of the fluid is zero. The<br />
stagnation point is the dividing point <strong>for</strong> the flow to go<br />
above or below the airfoil. Stagnation points exist at the<br />
surface of objects in the flow field, where the fluid is<br />
brought to rest by the object. The Bernoulli's equation<br />
shows that the static pressure is highest when the velocity is<br />
zero and hence static pressure is at its maximum value at<br />
stagnation points. This static pressure is called the<br />
stagnation pressure. At this point dynamic pressure is zero<br />
as it is a function of the square of velocity. To study the<br />
distribution of static and dynamic pressure on a NACA<br />
4412 airfoil, it is needed that an airfoil be sketched<br />
according to the available profile coordinates of the NACA<br />
4412 and later extruded to the desired wingspan.<br />
For an incompressible fluid flow around an airfoil , The<br />
Bernoulli equation states that :<br />
• is the flow velocity, and<br />
• is total pressure which is constant along any<br />
streamline<br />
.<br />
Every point in a steadily flowing fluid, regardless of the<br />
fluid speed at that point, has its own static pressure ,<br />
dynamic pressure Q , and total pressure . Static pressure<br />
and dynamic pressure are likely to vary significantly<br />
throughout the fluid but total pressure is constant along each<br />
streamline.<br />
Also, at stagnation point -<br />
P(static) + Q = constant<br />
P(static) + 0 = constant<br />
There<strong>for</strong>e P(static) = Maximum= stagnation pressure.<br />
Figure 1 shows distribution of pressure around an airfoil.<br />
Figure 1<br />
Where;<br />
• is the static pressure<br />
( P 0 =constant)<br />
• is the dynamic pressure, also denoted as ‘Q’<br />
• , is the density of the fluid<br />
II. NOMENCLATURE:-<br />
•c, chord length- length from the LE to the TE of a wing<br />
cross section that is parallel to the vertical axis of symmetry<br />
•mean camber line– line halfway between the upper and<br />
lower surfaces<br />
•leading edge (LE)- is the front most point on the mean<br />
camber line.<br />
ISSN: 2231-5381 http://www.ijettjournal.org <strong>Page</strong> 3258
<strong>International</strong> <strong>Journal</strong> of Engineering Trends and Technology (<strong>IJETT</strong>) - Volume4 Issue8- August 2013<br />
•trailing edge (TE)- is the most rearward point on mean<br />
camber line<br />
•camber– maximum distance between the mean camber line<br />
and the chord line, measured perpendicular to the chord line<br />
-0 camber or uncambered means the airfoil is symmetric<br />
above and below the chord line<br />
•thickness– distance between upper surface and lower<br />
surface measured perpendicular to the mean camber line.<br />
Angle of attack ( AOA) - angle between the relative airflow<br />
and chord of airfoil<br />
Figure3. creating fluid domain on design modeller.<br />
IV. MESHING:-<br />
Mesh was created using ‘ANSYS ICEM CFD’ as shown in<br />
figure 4. Sizing , relevance centre was set as medium.<br />
III. SOLID MODELLING OF THE<br />
AIRFOIL AND FLOW<br />
DOMAIN<br />
The solid modeling of the airfoil was made with the help of<br />
CAD tools CATIA v5 as shown in Figure 2. The chord of<br />
the airfoil was selected as 10 cms and extruded to a<br />
wingspan of 27.5 cms , Considering the airfoil as one half of<br />
a wing, and wing aspect ratio as 5.5.<br />
Figure 4, meshing of fluid domain in ICEM CFD<br />
V. FLOW ANALYSIS:-<br />
a) Numerical algorithm:- Standard k–ε turbulence<br />
viscosity model with SIMPLE pressure-velocity<br />
coupling and First-Order Upwind discretization<br />
scheme was used <strong>for</strong> the analysis.<br />
Figure2. modelling of airfoil on CATIA v5.<br />
Flow domain was created using ANSYS 13.0 workbench ,<br />
design modeller as shown in figure 3.<br />
b) Boundary conditions:- Boundary conditions were<br />
specified at inlet with a velocity of 340.29 m/s.<br />
c) solution initialization:- Standard initialization was<br />
used and was computed from inlet.<br />
ISSN: 2231-5381 http://www.ijettjournal.org <strong>Page</strong> 3259
<strong>International</strong> <strong>Journal</strong> of Engineering Trends and Technology (<strong>IJETT</strong>) - Volume4 Issue8- August 2013<br />
solver<br />
VI. FLUENT input parameters:-<br />
pressure based steady<br />
state<br />
static pressures on upper surface of airfoils at angle of attack<br />
(0,6,12 and 16) , it is observed that static pressure has been<br />
increasing , but mostly on the surface away from leading<br />
edge and towards the trailing side of the upper surface.<br />
viscous-laminar<br />
k–ε<br />
density(kg/m3) 1.225<br />
viscosity(kg/m –s) 1.7894*10 -5<br />
inlet velocity(m/s) 340.29<br />
pressure<br />
standard<br />
VII. RESULT OF STATIC AND<br />
DYNAMIC PRESSURE<br />
DISTRIBUTION:-<br />
•Figure 1 to 6 below show the dynamic and static pressure<br />
distribution on different surfaces (i.e. lower surface ,upper<br />
surface and leading edge) on an airfoil with angle of attack 0<br />
degrees.<br />
•Figure 7 to 12 below show the dynamic and static<br />
pressure distribution on different surfaces (i.e. lower surface<br />
,upper surface and leading edge) on an airfoil with angle of<br />
attack 6 degrees.<br />
•Figure13 to 18 below show the dynamic and static<br />
pressure distribution on different surfaces (i.e. lower surface<br />
,upper surface and leading edge) on an airfoil with angle of<br />
attack 12 degrees.<br />
•Figure 19 to 24 below show the dynamic and static<br />
pressure distribution on different surfaces (i.e. lower surface<br />
,upper surface and leading edge) on an airfoil with angle of<br />
attack 16 degrees.<br />
•ANALYSIS OF OBSERVATIONS:-<br />
a)On comparing figure 1,7,13,19 (i.e. contour of dynamic<br />
pressures on upper surface of airfoil at angle of attacks<br />
0,6,12 and 16 respectively) , it is observed thatdynamic<br />
pressure on the upper surface except <strong>for</strong> some surface close<br />
to leading edge of airfoil , is decreasing as angle of attack is<br />
increased from 0 to 6,12,16 degrees.<br />
Similarly, on comparing figures 4,10,16,22 (i.e. contour of<br />
The decrease in dynamic pressure can be attributed to the<br />
decreasing velocity as it moves over the top surface of the<br />
airfoil as dynamic pressure is a function of the square of<br />
velocity. As a result of decrease in dynamic pressure a<br />
simultaneous increase in static pressure results from the<br />
bernoulli’s theorem or which can also be understood as<br />
conservation of total pressure where , P 0 =constant=dynamic<br />
pressure + static pressure.<br />
b)On comparing figures 3,9,15,21 , it can be clearly seen<br />
that dynamic pressure on leading edge is decreasing with<br />
increasing angle of attack and figures 6,12,18,24 show that<br />
static pressure is increasing with increasing angle of attack.<br />
This is again on account of conservation of total pressure P 0 .<br />
c)A similar interpretation can be applied to lower surface<br />
contours of dynamic and static pressures on airfoil, from<br />
figures 2,8,14,20 it can be observed that the dynamic<br />
pressure on lower surface is decreasing with increasing<br />
angle of attack whereas, figures 5,11,17,23 show that static<br />
pressure is increasing on lower surface. Which is a<br />
consequence of conservation of total pressure P 0 ?<br />
d) At a point near maximum thickness, maximum velocity<br />
and minimum static pressure will occur. For example, if we<br />
consider effect of thickness on the upper surface of the<br />
airfoil (AOA 0 degrees) then this is evident from figures 1<br />
and 4 , where maximum dynamic pressure occurs at upper<br />
surface on a location near and around maximum camber,<br />
and minimum static pressure occurs at and around the same<br />
location.<br />
Similarly, this explanation applies to lower surface as well.<br />
e) From figures 3,6 it can be seen that the minimum<br />
dynamic pressure and maximum static pressure occurs at the<br />
leading edge of the airfoil, this is the stagnation point .<br />
figure 9,12 indicate that the position of stagnation point is<br />
shifted slightly lower to the leading edge of the airfoil.<br />
Figures 15,18 further show that, as the AOA is increased to<br />
12 degrees the stagnation point moves further on the lower<br />
surface of the airfoil, away from the leading edge. Figures<br />
21 and 24 further bolster this observation , the stagnation<br />
ISSN: 2231-5381 http://www.ijettjournal.org <strong>Page</strong> 3260
<strong>International</strong> <strong>Journal</strong> of Engineering Trends and Technology (<strong>IJETT</strong>) - Volume4 Issue8- August 2013<br />
point has moved further away from the leading edge.<br />
There<strong>for</strong>e, as the angle of attack is increased the stagnation<br />
point moves away from leading edge on the lower surface of<br />
the airfoil.<br />
figure 4 , static pressure on upper surface of airfoil (AOA 0 degrees)<br />
figure 1 , dynamic pressure on upper surface of airfoil (AOA 0<br />
degrees)<br />
figure 5, static pressure on lower surface of airfoil (AOA 0 degrees)<br />
figure 2 , dynamic pressure on lower surface of airfoil (AOA 0 degrees)<br />
figure 3 , dynamic pressure on leading edge of airfoil (AOA 0 degrees)<br />
figure 6, static pressure on leading edge of airfoil (AOA 0 degrees)<br />
ISSN: 2231-5381 http://www.ijettjournal.org <strong>Page</strong> 3261
<strong>International</strong> <strong>Journal</strong> of Engineering Trends and Technology (<strong>IJETT</strong>) - Volume4 Issue8- August 2013<br />
figure 7 , dynamic pressure on upper surface of airfoil (AOA 6 degrees)<br />
figure 10 , static pressure on upper surface of airfoil (AOA 6 degrees)<br />
figure 8 , dynamic pressure on lower surface of airfoil (AOA 6 degrees)<br />
figure 11 , static pressure on lower surface of airfoil (AOA 6 degrees)<br />
figure 9, dynamic pressure on leading edge of airfoil (AOA 6 degrees)<br />
figure 12 , static pressure on leading edge of airfoil (AOA 6 degrees)<br />
ISSN: 2231-5381 http://www.ijettjournal.org <strong>Page</strong> 3262
<strong>International</strong> <strong>Journal</strong> of Engineering Trends and Technology (<strong>IJETT</strong>) - Volume4 Issue8- August 2013<br />
figure 13 , dynamic pressure on upper surface of airfoil (AOA 12 degrees)<br />
figure 16 , static pressure on upper surace of airfoil (AOA 12 degrees)<br />
figure 14 , dynamic pressure on lower surface of airfoil (AOA 12 degrees)<br />
figure 17 , static pressure on lower surface of airfoil (AOA 12 degrees)<br />
figure 15 , dynamic pressure on leading edge of airfoil (AOA 12 degrees)<br />
figure 18 , static pressure on leading edge of airfoil (AOA 12 degrees)<br />
ISSN: 2231-5381 http://www.ijettjournal.org <strong>Page</strong> 3263
<strong>International</strong> <strong>Journal</strong> of Engineering Trends and Technology (<strong>IJETT</strong>) - Volume4 Issue8- August 2013<br />
figure 19, dynamic pressure on upper surface of airfoil (AOA 16 degrees)<br />
figure 22, static pressure on upper surface of airfoil (AOA 16 degrees)<br />
figure 20, dynamic pressure on lower surface of airfoil (AOA 16 degrees)<br />
figure 23, static pressure on lower surface of airfoil (AOA 16 degrees)<br />
figure 21, dynamic pressure on leading edge of airfoil (AOA 16 degrees)<br />
figure 24, static pressure on leading edge of airfoil (AOA 16 degrees)<br />
ISSN: 2231-5381 http://www.ijettjournal.org <strong>Page</strong> 3264
<strong>International</strong> <strong>Journal</strong> of Engineering Trends and Technology (<strong>IJETT</strong>) - Volume4 Issue8- August 2013<br />
REFERENCES:-<br />
VIII. CONCLUSION:-<br />
A. It is observed that dynamic pressure on the upper<br />
surface (mostly on surface away from leading<br />
edge) of airfoil is decreasing as angle of attack is<br />
increased at MACH1 progressively from 0 to 16<br />
degrees and static pressure has been increasing ,<br />
but mostly on the surface away from leading edge<br />
and towards the trailing side of the upper surface.<br />
B. Dynamic pressure on leading edge is decreasing<br />
with increasing angle of attack and static pressure<br />
is increasing with increasing angle of attack.<br />
C. Dynamic pressure on lower surface is decreasing<br />
with increasing angle of attack whereas, static<br />
pressure is increasing on lower surface.<br />
i.http://en.wikipedia.org/wiki/Static_pressure<br />
ii.http://en.wikipedia.org/wiki/Dynamic_pressure<br />
iii.http://kgraham.eng.ua.edu/classes/AEM314/lecture_notes<br />
/airfoil_nomenclature.pdf<br />
iv.http://www.ijettjournal.org/volume-4/issue-5/<strong>IJETT</strong>-<br />
V4I5P142.pdf<br />
v.‘Flight Theory and Aerodynamics: A Practical Guide <strong>for</strong><br />
Operational Safety’ By Charles E. Dole, James E. Lewis<br />
vi.http://flightmechanics.blogspot.in/2010/10/stagnationpoint.html<br />
D. maximum dynamic pressure occurs at upper<br />
surface near and around maximum camber and<br />
minimum static pressure occurs at and around the<br />
same location.Similarly, this explanation applies to<br />
lower surface as well.<br />
E. As the angle of attack is increased the stagnation<br />
point moves away from leading edge on the lower<br />
surface of the airfoil.<br />
ISSN: 2231-5381 http://www.ijettjournal.org <strong>Page</strong> 3265