Satellite Remote Sensing
Satellite Remote Sensing
Satellite Remote Sensing

Create successful ePaper yourself
Turn your PDF publications into a flip-book with our unique Google optimized e-Paper software.
<strong>Satellite</strong> <strong>Remote</strong> <strong>Sensing</strong><br />
GE 4150- Natural Hazards<br />
Some slides taken from Ann Maclean: Introduction to<br />
Digital Image Processing
<strong>Remote</strong> <strong>Sensing</strong><br />
“the art, science, and technology of obtaining<br />
reliable information about physical objects and the<br />
environment, through the process of recording,<br />
measuring and interpreting imagery and digital<br />
representations of energy patterns derived from<br />
noncontact sensor systems”. (Cowell 1997)<br />
Taken from: Introductory Digital Image Processing. 3 rd edition.<br />
Jensen, 2004
<strong>Remote</strong> <strong>Sensing</strong><br />
A remote sensing instrument<br />
collects information about an<br />
object or phenomenon within the<br />
instantaneous-field-of-view<br />
(IFOV) of the sensor system<br />
without being in direct physical<br />
contact with it. The sensor is<br />
located on a suborbital<br />
or satellite platform.<br />
Introductory Digital Image Processing. 3rd edition. Jensen, 2004
<strong>Remote</strong> <strong>Sensing</strong><br />
<strong>Remote</strong> sensing is a tool or technique similar to<br />
mathematics. Using sensors to measure the<br />
amount of electromagnetic radiation (EMR)<br />
exiting an object or geographic area from a<br />
distance and then extracting valuable<br />
information from the data using mathematically<br />
and statistically based algorithms is a scientific<br />
activity. It functions in harmony with other spatial<br />
data-collection techniques or tools of the<br />
mapping sciences, including cartography and<br />
geographic information systems (GIS) (Clarke,<br />
2001).<br />
Introductory Digital Image Processing. 3rd edition. Jensen, 2004
<strong>Remote</strong> <strong>Sensing</strong><br />
Information about an Object or Area<br />
Sensors can be used to obtain specific information about<br />
an object (e.g., the diameter of a cottonwood tree crown)<br />
or the geographic extent of a phenomenon (e.g., the<br />
boundary of a cottonwood stand). The EMR reflected,<br />
emitted, or back-scattered from an object or geographic<br />
area is used as a surrogate for the actual property under<br />
investigation. The electromagnetic energy<br />
measurements must be calibrated and turned into<br />
information using visual and/or digital image processing<br />
techniques.<br />
Introductory Digital Image Processing. 3rd edition. Jensen, 2004
Introductory Digital Image Processing. 3rd edition. Jensen, 2004
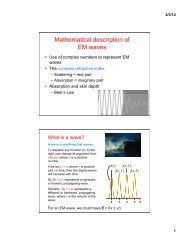
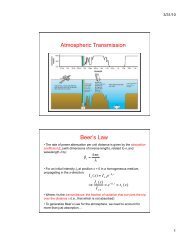
Electromagnetic Energy<br />
Introductory Digital Image Processing. 3rd edition. Jensen, 2004<br />
Thermonuclear fusion on the surface of the Sun yields a continuous spectrum of electromagnetic energy.<br />
The 6,000 K temperature of this process produces a large amount of short wavelength energy (from 0.4 -<br />
0.7 µm; blue, green, and red light) that travels through the vacuum of space at the speed of light. Some<br />
energy is intercepted by the Earth where it interacts with the atmosphere and surface materials. The Earth<br />
may reflect some of the energy directly back out to space or it may absorb the short wavelength energy<br />
and then re-emit emit it at a longer wavelength.
Wavelength<br />
in meters (m)<br />
10 -14<br />
Gamma<br />
and x-ray<br />
Electromagnetic Spectrum and the<br />
Photon Energy of Visible Light<br />
Photon energy of<br />
visible light in<br />
electron volts (eV)<br />
4.0<br />
3.5<br />
Photon wavelength<br />
in nanometers (nm)<br />
ultraviolet<br />
Sun<br />
10 -8<br />
10<br />
-6<br />
10 -12 3.10<br />
Ultraviolet<br />
Visible<br />
Infrared<br />
Earth<br />
3.0<br />
2.5<br />
2.0<br />
2.75<br />
400<br />
violet limit<br />
450<br />
blue<br />
2.48 500<br />
green<br />
2.25<br />
550<br />
green limit<br />
2.14<br />
580<br />
yellow<br />
2.06<br />
600<br />
orange<br />
1.91<br />
650<br />
red<br />
1.77 700 red limit<br />
1.5<br />
1.24<br />
1000<br />
near-infrared<br />
10 -2<br />
Microwave and<br />
radio waves<br />
1.0<br />
0.5<br />
0.041<br />
30k<br />
far infrared<br />
10<br />
0<br />
Introductory Digital Image Processing. 3rd edition. Jensen, 2004
Sensors<br />
Passive<br />
Sun’s energy which is reflected<br />
(visible) or<br />
Absorbed and re-emitted emitted as<br />
thermal infrared wavelengths<br />
ASTER, Landsat, AVHRR<br />
Active<br />
Emit radiation<br />
Radiation reflected is detected and<br />
measured<br />
LIDAR, RADAR, and SONAR<br />
http://ccrs.nrcan.gc.ca/resource/tutor/fundam/chapter1/06_e.php
Introductory Digital Image Processing. 3rd edition. Jensen, 2004<br />
Spectral Resolution
Introductory Digital Image Processing. 3rd edition. Jensen, 2004<br />
Spatial Resolution
Temporal Resolution<br />
<strong>Remote</strong> Sensor Data Acquisition<br />
June 1, 2004 June 17, 2004 July 3, 2004<br />
16 days
Radiometric Resolution<br />
0<br />
0<br />
7-bit<br />
(0 - 127)<br />
8-bit<br />
(0 - 255)<br />
0<br />
9-bit<br />
(0 - 511)<br />
0<br />
10-bit<br />
(0 - 1023)
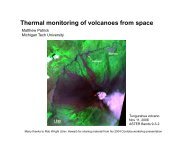
Volcanology<br />
Map lava flows and eruptive deposits<br />
(lahars)<br />
Analyze SO 2 in volcanic plumes<br />
Thermal monitoring<br />
Digital Elevation Models<br />
Volcanic ash analysis
MODIS<br />
Moderate Resolution Imaging<br />
Spectroradiometer<br />
Launched in 1999 on NASA’s Earth<br />
Orbiting System (EOS) platform<br />
36 spectral bands<br />
http://terra.nasa.gov/About/MODIS/modis_<br />
swath.html
MODVOLC<br />
Algorithm created by University of Hawaii<br />
“The MODVOLC algorithm automatically<br />
scans each 1 kilometer pixel within it to<br />
check for the presence of high-<br />
temperature hot-spots.”<br />
Used not only for volcanic eruptions, but<br />
wildfires as well.<br />
http://modis.higp.hawaii.edu/
Mount Belinda<br />
<br />
South Sandwich Islands<br />
<br />
Eruption first recorded<br />
using MODVOLC<br />
<br />
Used MODIS, Landsat<br />
7ETM+, ASTER, and<br />
RADARSAT-1<br />
<br />
Identified first recorded<br />
eruption ever<br />
http://www.intute.ac.uk/sciences/worldguide/satellite/2374.jpg
Selected high spatial-resolution images of Montagu Island. North is up. A) Landsat 7 ETM+ Band 8 image from 4 Jan<br />
2002 showing diffuse plume (P) emanating from Mount Belinda s summit (MB) and tephra deposits on north flank.<br />
Scale bar applies to A, B and C. B) ASTER visible band composite image (Bands 3–2-1) on 7 Dec 2003, showing<br />
tephra deposits and 2003 lava flow (L2). C) RADARSAT-1 image from 30 Oct 2003 showing recent morphology, with<br />
inset (D). Arrows point to approximate summit of Mount Belinda and vent location (MB), ash plumes (P), 600 m long<br />
lava flow first observed in Jan 2002 (L1), entrenched 2 km long lava flow first observed in Aug 2003 (L2), and arcuate<br />
fractures unrelated to this eruption (F). RADARSAT image was provided by the Alaska <strong>Satellite</strong> Facility, and is<br />
copyright 2003 CSA
ASTER<br />
Advanced Spaceborne Thermal Emission<br />
and Reflection Radiometer<br />
Launched in 1999, part of NASA’s EOS<br />
Spatial Resolution 15m(VNIR),<br />
30m(SWIR), 90(TIR). 16 day temporal<br />
resolution possible<br />
Per request basis
ASTER Uses<br />
Volcanological Studies<br />
Mineralogical Studies<br />
Hydrothermal Studies<br />
Forest Fires<br />
Glacier Studies<br />
Limnological Studies<br />
Climatology Studies<br />
Digital Elevation Models<br />
http://asterweb.jpl.nasa.gov/gallerymap.asp
http://asterweb.jpl.nasa.gov/content/03_data/05_Application_Examples/volcanology/default.htm
ASTER<br />
North Shore<br />
Oahu, HI<br />
15 x 15 m<br />
(RGB= 1,4,3)
LANDSAT<br />
Launched in 1972,<br />
Managed by NASA and<br />
USGS<br />
ETM 7+ has 7 bands (30<br />
and 60 m) and a<br />
panchromatic (15)<br />
<br />
<br />
Collected every 16 days<br />
Mapping lava flows,<br />
thermal monitoring,<br />
extrusion rates<br />
Landsat 7 Image of<br />
Palm Spring, CA<br />
30 x 30 m<br />
(bands 4,3,2 = RGB)<br />
Introductory Digital Image Processing. 3rd edition. Jensen, 2004
AVHRR<br />
Advanced Very High Resolution<br />
Radiometer<br />
First launched in 1978 by NOAA<br />
Global coverage 4.4 km, U.S 1 km (low<br />
spatial resolution<br />
Collected twice a day (High temporal<br />
resolution)
http://www.geo.mtu.edu/volcanoes/research/avhrr/images/spurr/
IKONOS<br />
Panchromatic Images<br />
of Washington, DC<br />
1 x 1 m spatial resolution<br />
Jensen, 2004<br />
First satellite launched by a private company, launched in 1999<br />
1 meter panchromatic, 4 m visible and near infrared
Active Sensors<br />
Emits energy pulse, measure backscatter,<br />
records as a digital number<br />
Long wavelength-microwave<br />
Penetrates clouds and vegetation<br />
RADAR always black and white with speckled<br />
texture
RADAR<br />
European <strong>Remote</strong> <strong>Sensing</strong> 1 satellite radar image of stormwater runoff plumes from Los<br />
Angeles and San Gabriel Rivers into the Los Angeles and Long Beach Harbors. Dec. 28,<br />
1992. Image credit: ESA<br />
http://www.jpl.nasa.gov/images/earth/california/sar-la-browse.jpg
LIDAR<br />
Light Detection and Ranging<br />
Transmits a laser light to target<br />
15 cm accuracy<br />
http://vulcan.wr.usgs.gov/Volcanoes/MSH/<br />
Eruption04/LIDAR/