PDF (836 KB) - The Angle Orthodontist
PDF (836 KB) - The Angle Orthodontist
PDF (836 KB) - The Angle Orthodontist

Create successful ePaper yourself
Turn your PDF publications into a flip-book with our unique Google optimized e-Paper software.
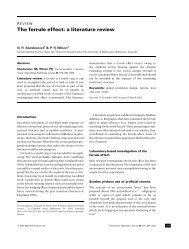
Original Article<br />
Age-related changes of the soft tissue profile from the second to the fourth<br />
decades of life<br />
Lino Torlakovic a ; Espen Færøvig b<br />
ABSTRACT<br />
Objective: To describe the age-related changes of the soft tissue facial profile from the second to<br />
fourth decades of life.<br />
Materials and Methods: Cephalograms from the same subjects in their 20s, 30s, and 40s were<br />
analyzed. A coordinate system analysis based on stable landmarks is used. A line connecting<br />
Walker’s point (W) and sphenoethmoidal (SE) created the x-axis. Walker’s point was origin.<br />
Depending on data distribution, landmark displacements from T1 to T2, from T2 to T3, and from T1<br />
to T3 were analyzed using the paired t-test or the Wilcoxon test for zero expected change versus a<br />
two-sided alternative. For each landmark the mean, standard deviation, P value, and lower and<br />
higher 95% confidence intervals were calculated.<br />
Results: During T2–T1, for males, the whole profile was displaced anteriorly and slightly<br />
superiorly, and for females, the lower facial profile was displaced in a posterior and inferior<br />
direction. Greater changes occurred in the female profile than the male profile. During T3–T2, the<br />
female profile changed slightly while the male profile underwent great changes: the upper facial<br />
profile was displaced anteriorly, and the lower profile was displaced posteriorly. <strong>The</strong> whole profile<br />
was displaced in the inferior direction.<br />
Conclusions: Significant changes occurred in the soft tissue facial profile from the second to<br />
fourth decades. Aging of the male facial profile began 10 years later than for females; however,<br />
when the changes did occur, they were of greater magnitude. <strong>The</strong> upper facial profile was<br />
displaced in the anterior direction and the whole profile was displaced inferiorly for both sexes.<br />
(<strong>Angle</strong> Orthod. 2011;81:50–57.)<br />
KEY WORDS: Coordinate system; Soft tissue; Age-related changes; Facial profile<br />
INTRODUCTION<br />
<strong>The</strong> standard method and its variations are most<br />
commonly used methods to analyze lateral cephalograms.<br />
<strong>The</strong>y are based on the structural method<br />
developed by Björk 1 in 1963. When studying changes<br />
over time with the standard method, cephalograms<br />
from the time periods of interest are superimposed on,<br />
for example, the fairly stable structures of the anterior<br />
cranial base. <strong>The</strong>n a line chosen on, for example, the<br />
a<br />
PhD student, Department of Orthodontics, Faculty of<br />
Dentistry, University of Oslo, Oslo, Norway.<br />
b<br />
Instructor, Department of Orthodontics, Faculty of Dentistry,<br />
University of Oslo, Oslo, Norway.<br />
Corresponding author: Lino Torlakovic, Department of Orthodontics,<br />
Faculty of Dentistry, University of Oslo, Postboks 1109<br />
Blindern, 0317 Oslo, Norway<br />
(e-mail: linot@odont.uio.no)<br />
Accepted: June 2010. Submitted: April 2010.<br />
G 2011 by <strong>The</strong> EH <strong>Angle</strong> Education and Research Foundation,<br />
Inc.<br />
first cephalogram is transferred to all the others while<br />
the cephalograms are held in place.<br />
A limitation of the standard method (and its<br />
variations) is that an individual landmark cannot be<br />
studied on its own. All information is based on relations<br />
to other landmarks, either through angles or distances.<br />
Another common problem is how to superimpose<br />
lateral cephalograms and then how to register the<br />
changes found. Several different methods are used:<br />
(1) best fit of anterior cranial base anatomy; (2)<br />
superimposition on the SN line, registered at S, (3)<br />
superimposition on registration point R with Boltonnasion<br />
planes parallel; and (4) superimposition on<br />
Basion-nasion (Ricketts), registered at point CC or<br />
point N. 2 One common method has been to use SNL<br />
as the reference line. Nasion has been shown not to be<br />
stable. 3 Methods to correct for this have been tried. 4<br />
Even if this superposition is perfect, how does one<br />
mathematically and scientifically register these points,<br />
lines, and even curves and the changes they undergo?<br />
<strong>Angle</strong> <strong>Orthodontist</strong>, Vol 81, No 1, 2011<br />
50<br />
DOI: 10.2319/042110-215.1
AGE-RELATED CHANGES OF THE FACIAL PROFILE 51<br />
Coordinate system–based analysis techniques have<br />
been developed to solve these issues.<br />
In this article a coordinate system–based method to<br />
analyze lateral cephalograms is used. In literature two<br />
main types of coordinate systems are used for<br />
cephalometric analysis. <strong>The</strong> x-axis chosen for the<br />
different coordinate systems is either (1) the sellanasion<br />
line 5,6 or (2) the sella-nasion line followed by a 7u<br />
(the angle can vary) posterior rotation. 7,8 Once the x-axis<br />
is established a landmark is chosen in order to draw the<br />
y-axis. <strong>The</strong> landmarks that define the x and y landmarks<br />
of these methods are often not completely stable<br />
themselves. 3 Any movement of the landmarks defining<br />
the different coordinate systems also displaces the<br />
coordinates of all the landmarks being studied. This<br />
creates systematic errors in all longitudinal measurements.<br />
<strong>The</strong> landmarks used to construct the coordinate<br />
system for this study are based on the same landmarks<br />
found stable by Björk’s implant studies 1,9–13 and Melsen’s<br />
14 histologic studies on human biopsy material.<br />
<strong>The</strong>se landmarks have been also previously used for<br />
coordinate system construction. 15<br />
<strong>The</strong> age-related changes of the soft tissue facial<br />
profile have not only been of interest to the medical<br />
professional but also to laypeople. <strong>The</strong> development of<br />
the soft tissue profile is a result of complex changes<br />
within the hard and soft tissue structures of the face. <strong>The</strong><br />
anterior cranial base lengthens until the end of normal<br />
growth via bone apposition at the nasion. This elongates<br />
the cranial base. <strong>The</strong> nasion influences the sagittal<br />
maxillary relationships. <strong>The</strong> face and dentition develop<br />
along the nasion-gonion and sella-gnathion distance.<br />
During growth, the viscerocranium increases in height. 16<br />
Even after the growth period the soft tissue visibly<br />
changes; a man’s face in his 20s looks different than it<br />
will when he is in his 40s. <strong>The</strong> modern orthodontist looks<br />
beyond occlusion and is putting more emphasis on the<br />
influence of the treatment on the facial profile. <strong>The</strong>refore<br />
it can be an advantage for the orthodontist to know what<br />
the natural age-related changes of the soft tissue profile<br />
are, as it might influence treatment planning.<br />
In this study we examined how the facial profile<br />
changes from the second to the fourth decade of life in<br />
horizontal and vertical directions. <strong>The</strong>re can be big<br />
differences between individuals. <strong>The</strong> aim of this study<br />
was to examine the overall common age-related changes<br />
irrespective of such factors as occlusion, mandibular<br />
plane angle, lip position or thickness, and so on. <strong>The</strong> field<br />
of interest was from glabella to the soft tissue menton.<br />
MATERIALS AND METHODS<br />
Longitudinal lateral head cephalograms of 56 white<br />
subjects with northern European ancestry, 25 of whom<br />
were men, were selected from the archives of<br />
Table 1. Mean Ages for T1, T2, and T3 and Mean Years Elapsed<br />
T2–T1, T3–T2<br />
T1 T2 T3 T2–T1 T3–T2<br />
N 56 56 53 56 53<br />
Mean 22.5 33.2 43.8 10.8 9.8<br />
Median 22.3 33.0 42.8 10.6 9.7<br />
SD 1.0 1.3 1.4 0.8 1.4<br />
Maximum 26.1 37.3 46.9 13.0 13.8<br />
Minimum 21.0 31.3 41.1 9.9 7.2<br />
orthodontist and associated professor Olav Bondevik<br />
at the University of Oslo. <strong>The</strong> subjects were third-year<br />
Norwegian dental students at the University of Oslo,<br />
Norway, from 1972 to 1989 (T1). All the subjects had<br />
lateral cephalograms taken by the same x-ray machine;<br />
Lumex B Cephalostat (Siemens Norge A/S,<br />
Oslo, Norway) and sat in the same chair which was<br />
nailed to the ground. <strong>The</strong> focus-median plane was<br />
180 cm, and the film-median plane was 10 cm. <strong>The</strong><br />
cephalograms were checked to make sure they had<br />
the same linear expansion coefficient. <strong>The</strong> cephalograms<br />
were taken of the same people in their second<br />
(T1), third (T2), and fourth decade (T3) of life. Detailed<br />
information regarding the time periods can be found in<br />
Table 1. A letter of exemption for this study has been<br />
received from the Regional Ethical Committee.<br />
All of the cephalometric radiographs were scanned<br />
using the Epson Expression 1680 Pro scanner (Epson,<br />
Long Beach, Calif) with the help of Adobe Photoshop 6<br />
(Adobe Systems Inc, San Jose, Calif). At the same time,<br />
the program corrected for the 5.6% enlargement of the<br />
cephalograms that occurred during the scanning process.<br />
<strong>The</strong> following criteria were used to select the<br />
sample.<br />
N None of the subjects received orthodontic treatment<br />
or oral surgery during the observation period.<br />
N Three radiographs were taken at the second, third,<br />
and fourth decade of life.<br />
N A soft tissue demarcation was visible on all radiographs.<br />
<strong>The</strong> 24 soft tissue landmarks based on the Rickett’s<br />
factor analysis, Walker’s point [W] (A. Bjõrk) and<br />
sphenoethmoidal [SE] are shown and listed in Figure 1.<br />
<strong>The</strong>se two landmarks are also known as tuberculum<br />
sella (T) and wing (W), respectively.<br />
<strong>The</strong> use of the sphenoethmoidal as a stable<br />
reference point was recommended by others. 17,18<br />
Walker’s point was found to be stable after the age<br />
of 5. 16 Arat and coworkers 15 also found that the length<br />
of the mid-cranial base (W-SE) remains unchanged in<br />
all periods of pubertal growth.<br />
A line was drawn connecting Walker’s point [W] and<br />
the sphenoethmoidal [SE], creating the x-axis. <strong>The</strong>re-<br />
<strong>Angle</strong> <strong>Orthodontist</strong>, Vol 81, No 1, 2011
52 TORLAKOVIC, FÆRØVIG<br />
ments were carried out by the same operator. No<br />
systematic difference in locating the landmarks was<br />
found between the first and the second measurements<br />
of these 15 cephalograms. Random error was calculated<br />
using Dahlberg’s formula: Se~HSd2=2n to be<br />
0.35 mm or less for the x-axis and 0.58 mm or less for<br />
the y-axis.<br />
Because the coordinate system rotates with the<br />
head in the anterior-posterior direction, different<br />
natural head positions that might occur while taking<br />
cephalograms do not affect the measurements. Coordinate<br />
system–based cephalometric analysis techniques<br />
cannot be traced by hand, unlike the standard<br />
method; however, Sayinsu and colleagues 20 demonstrated<br />
that the use of computer software for cephalometric<br />
analysis carried out on scanned images does<br />
not increase measurement error compared with hand<br />
tracing.<br />
Figure 1. Coordinate system applied to lateral cephalogram with 24<br />
soft tissue cephalometric landmarks: 1 5 glabella, 2 5 halfway<br />
between glabella and soft tissue nasion, 3 5 soft tissue nasion, 4 5<br />
at junction of inferior limit of the concavity overlying the naso-frontal<br />
suture, 5 5 nasal sorsum (halfway from nasion to pronasale), 6 5 at<br />
junction of the dorsom and the tip of the nose, 7 5 superior nasal tip,<br />
8 5 pronasale, 9 5 inferior nasal tip, 10 5 columella, 11 5<br />
subnasale, 12 5 superior labial sulcus, 13 5 labrale superius, 14 5<br />
midway between labre superius and stomion superius, 15 5 stomion<br />
superius, 16 5 stomion inferius, 17 5 midway between stomion<br />
inferius and labre inferius, 18 5 labrale inferius, 19 5 midway<br />
between labre inferius and labiomental fold, 20 5 labiomental fold,<br />
21 5 midway between labiomental fold and soft tissue pogonion, 22<br />
5 soft tissue pogonion, 23 5 soft tissue gnathion, and 24 5 soft<br />
tissue menton.<br />
after a second line was drawn 90u to the first line<br />
creating the y-axis. Walker’s point was chosen as<br />
origin. <strong>The</strong> coordinate system is illustrated in Figure 1.<br />
<strong>The</strong> program Facad (Ilexis AB, Linköping, Sweden)<br />
was used to digitally place the landmarks and analyze<br />
the cephalograms. After statistical analysis figures were<br />
constructed using the mathematical software Graph<br />
(IES National Center for Educational Statistics, Washington,<br />
DC) to allow for a visual analysis of the data. 19<br />
Error of Method<br />
Random error was assessed by statistically analyzing<br />
the difference between double measurements<br />
taken two weeks apart on 15 cephalograms. Measure-<br />
Statistical Method<br />
<strong>The</strong> raw data were transferred to the statistical<br />
program. Evaluation of the data distribution was<br />
performed by means of the Shapiro-Wilk test. For the<br />
data found to be normally distributed, analysis of<br />
changes for men and women from T1 to T2, from T2 to<br />
T3, and from T1 to T3 was performed by the paired t-<br />
test to test the null hypothesis of zero expected<br />
change, versus a two-sided alternative. For the data<br />
for which the Shapiro-Wilk test was rejected, that is, for<br />
which the distribution was not normal, we used the<br />
nonparametric Wilcoxon test. Using the appropriate<br />
test, the displacement data were calculated in terms of<br />
the mean, median, standard deviation, P value, and<br />
lower and higher 95% confidence intervals for each<br />
landmark at all three time periods.<br />
RESULTS<br />
Figure 2 illustrates mean female profiles at T1, T2,<br />
and T3. Figure 2 shows the upper facial profile with<br />
slight horizontal growth in the area of the frontal sinus<br />
from T2 to T3. <strong>The</strong> dorsum of the nose experiences<br />
horizontal growth. <strong>The</strong> tip of the nose grows outward<br />
and downward. <strong>The</strong> subnasal landmark is fairly stable<br />
throughout the whole observational period. <strong>The</strong> lower<br />
facial profile shows downward movement of both lips,<br />
especially from T1 to T2. <strong>The</strong> chin area from T1 to T2<br />
shows a posterior and inferior movement. From T2 to<br />
T3 the area shows anterior movement.<br />
Figure 3 illustrates mean male profiles at T1, T2,<br />
and T3. In the upper facial profile, the area of frontal<br />
sinus grows evenly through T1 to T3 and is more<br />
pronounced than in women. <strong>The</strong> dorsum of the nose<br />
remains stable. <strong>The</strong> tip grows outward, as in women,<br />
but with less of a downward growth. As with women,<br />
<strong>Angle</strong> <strong>Orthodontist</strong>, Vol 81, No 1, 2011
AGE-RELATED CHANGES OF THE FACIAL PROFILE 53<br />
Figure 2. Mean female profile at T1, T2, and T3. Figure 3. Mean male profile at T1, T2, and T3.<br />
the subnasal landmark remains fairly stable throughout<br />
the observation period. <strong>The</strong> lower facial profile shows<br />
the upper lip flattened out. <strong>The</strong> chin area grows in an<br />
outward and slightly downward direction.<br />
Figure 4 compares the male and female profiles at<br />
T1, T2, and T3. This view allows for a visual analysis of<br />
how the relation between the mean male and female<br />
profiles changes over time. It is, for example, apparent<br />
that the male profile is larger than the female profile.<br />
Bar graphs for men and women from the same time<br />
periods are side by side for easier comparison.<br />
Figure 5 shows all changes that occurred from T1 to<br />
T2. In women, the lower facial profile is displaced in a<br />
posterior and inferior direction. In men, the whole<br />
profile is displaced anteriorly and also slightly superiorly.<br />
Greater changes occur in the female profile than<br />
the male profile.<br />
Figure 6 shows all the changes from T2 to T3. Major<br />
differences between the sexes are seen. <strong>The</strong> female<br />
profile experiences only minor changes during this<br />
period—almost no displacement in the inferior direction<br />
and only a minor displacement in the anterior<br />
direction (except for soft tissue menton). For men, the<br />
situation is different. <strong>The</strong> upper facial profile is<br />
displaced anteriorly, and the lower profile is displaced<br />
posteriorly. <strong>The</strong> whole profile is also displaced in the<br />
inferior direction. Greater changes occur in the male<br />
profile than the female profile.<br />
Figure 7 shows all changes that occurred during the<br />
whole observation period of 20 years. Even though the<br />
male and female profiles aged differently from the<br />
second to third and the third to fourth decades of life,<br />
Figure 7 shows that in the end the trends are the<br />
same. <strong>The</strong> upper facial profile is displaced in an<br />
anterior direction, and the whole profile is displaced<br />
inferiorly for both sexes. Bar graphs show that inferior<br />
displacement of landmarks along facial profile is<br />
greater than anterior displacement.<br />
Tables 2 through 4 display all the landmarks for both<br />
sexes that experienced statistically significant changes<br />
during the respective time periods T2–T1, T3–T2, and<br />
T3–T1. <strong>The</strong> tables indicate the same thing as the bar<br />
graphs: female profile experiences greater changes<br />
from T1 to T2, and the male profile experiences<br />
greater changes from T2 to T3.<br />
DISCUSSION<br />
<strong>The</strong> results displayed in Tables 2 through 4 clearly<br />
indicate that significant changes are occurring in the<br />
soft tissue facial profile from the second to fourth<br />
decades of life. It can be also seen from the figures<br />
and tables that the soft tissue facial profile of women<br />
ages more from T1 to T2, whereas the facial profile of<br />
men ages more from T2 to T3. <strong>The</strong> data indicate that<br />
aging of the facial profile is not a gradual process; it<br />
occurs in spurts and at different periods of life for the<br />
two sexes. Even though it can be said that the aging of<br />
the facial profile begins 10 years later for men than for<br />
women, when the changes do occur, they are of<br />
greater magnitude.<br />
<strong>Angle</strong> <strong>Orthodontist</strong>, Vol 81, No 1, 2011
54 TORLAKOVIC, FÆRØVIG<br />
Figure 4. Male and female profile at T1, T2, and T3.<br />
Figure 5. All changes for the male and female profiles, period T2–T1.<br />
Figure 6. All changes for the male and female profiles, period T3–T2.<br />
Figure 7. All changes for the male and female profiles, period T3–T1.<br />
<strong>Angle</strong> <strong>Orthodontist</strong>, Vol 81, No 1, 2011
AGE-RELATED CHANGES OF THE FACIAL PROFILE 55<br />
Table 2. All Significant Changes T2–T1 (in millimeters) for the<br />
Horizontal (x) and Vertical (y) Directions a<br />
Landmark N Mean SD P Value Lower CI Upper CI<br />
Men<br />
2x 15 21.313 2.021 .025 22.433 20.194<br />
13y 19 21.830 2.536 .006 23.053 20.608<br />
14y 19 21.581 2.438 .011 22.756 20.405<br />
15y 19 21.161 2.379 .048 22.307 20.014<br />
Women<br />
13x 19 22.512 3.219 .003 24.064 20.961<br />
14x 19 22.290 3.140 .005 23.804 20.777<br />
15x 19 21.465 2.764 .033 22.798 20.133<br />
16x 19 21.345 2.653 .040 22.623 20.066<br />
17x 19 21.716 3.010 .023 23.167 20.265<br />
8x 19 21.858 3.029 .015 23.318 20.398<br />
19x 19 21.830 3.001 .016 23.276 20.383<br />
20x 22 21.910 3.204 .011 23.330 20.489<br />
21x 22 22.183 3.389 .007 23.686 20.680<br />
23x 22 21.727 3.158 .018 23.127 20.327<br />
a<br />
95% level of significance.<br />
Even though the male and female profiles age<br />
differently from second to third and from the third to<br />
fourth decades of life, Figure 7 shows that in the end<br />
the trends are the same. <strong>The</strong> upper facial profile is<br />
displaced in the anterior direction (the nose and frontal<br />
sinus area increase in size) and the whole profile is<br />
displaced inferiorly for both sexes. <strong>The</strong> greatest<br />
displacement along the facial profile was found to take<br />
place in the inferior direction for both men and women.<br />
<strong>The</strong> same fact was noted by Ferrario and colleagues. 21<br />
In women the average soft tissue profile of the chin<br />
moved in a posterior and inferior direction from the<br />
second to third decades of life. This could be partly due<br />
to a posterior rotation of mandible, observed by<br />
Bondevik. 2 From the third to fourth decades, the<br />
average soft tissue profile of the chin is displaced<br />
anteriorly. This reversal may be due to many factors,<br />
including an increased length of the mandible. 1 During<br />
the observation period the upper lip of the average<br />
male profile had visibly flattened. <strong>The</strong> flattening of lips<br />
has been noted in many other studies. 2,22 <strong>The</strong> reason<br />
why the same characteristic was not observed in<br />
women could be because overjet and overbite<br />
decrease significantly only in men. 23 <strong>The</strong> observation<br />
that the soft tissue of the chin in men continues to grow<br />
in an outward and slightly downward direction has<br />
been previously observed. 3<br />
Since this coordinate system analysis is based on<br />
stable reference points that are not displaced after<br />
early childhood, superimposition is not necessary as<br />
the coordinates for the landmarks can be compared<br />
directly from different time periods (Figures 2–4). This<br />
avoids the errors that may occur during superimpositioning.<br />
On the other hand, the [W–SE] line that makes<br />
Table 3. All Significant Changes T3–T2 (in millimeters) for the<br />
Horizontal (x) and Vertical (y) Directions a<br />
Landmark N Mean SD P Value Lower CI Upper CI<br />
Men<br />
1x 22 20.984 1.583 .008 21.686 20.282<br />
1y 22 21.939 3.644 .021 23.555 20.324<br />
2x 21 21.080 1.791 .012 21.895 20.265<br />
2y 21 21.244 2.616 .041 22.435 20.054<br />
3x 21 21.951 2.200 .001 22.953 20.950<br />
4x 22 20.909 1.574 .013 21.607 20.211<br />
5y 23 21.841 3.270 .013 23.256 20.427<br />
6x 21 21.471 2.463 .013 22.592 20.350<br />
6y 21 21.977 2.989 .007 23.338 20.617<br />
7y b 14 22.195 3.285 .030 24.646 20.359<br />
10y 21 21.711 2.591 .007 22.890 20.532<br />
11y b 23 21.268 2.833 .048 22.127 20.027<br />
12y 23 22.398 2.871 .001 23.639 21.156<br />
13y 23 22.346 3.322 .003 23.783 20.909<br />
14y 23 22.036 2.644 .001 23.179 20.892<br />
15y 23 21.771 2.650 .004 22.917 20.625<br />
16y 23 21.670 2.594 .005 22.791 20.548<br />
17y 23 21.857 2.697 .003 23.023 20.690<br />
18y 23 21.601 2.952 .016 22.878 20.325<br />
19y 23 21.512 2.395 .006 22.548 20.476<br />
20y 23 21.160 2.403 .030 22.199 20.121<br />
23y 23 21.705 3.097 .015 23.045 20.366<br />
24y 21 21.345 2.252 .013 22.370 20.319<br />
Women<br />
4x 22 21.200 2.084 .013 22.124 20.276<br />
5x 25 20.983 2.204 .035 21.893 20.073<br />
a<br />
95% level of significance.<br />
b<br />
Distribution was not normal; nonparametric Wilcoxon test was<br />
used.<br />
up the horizontal axis is relatively short. A measurement<br />
error (especially in the vertical direction) on the<br />
landmarks W and SE may cause an undesirable<br />
rotational error of the coordinate system. <strong>The</strong> error can<br />
be minimized through operator experience and by<br />
simultaneously displaying onscreen the cephalograms<br />
being analyzed. Any differences then found between<br />
the reference landmarks can then be corrected for. It is<br />
clear that the error obtained using the standard method<br />
during superimposition has been replaced with another<br />
kind of error, and it would be interesting to compare the<br />
methods.<br />
CONCLUSIONS<br />
N <strong>The</strong> results correspond well with the limited information<br />
available concerning the changes of the soft<br />
tissue profile from the second to fourth decades of<br />
life obtained from previous studies that used the<br />
standard method to obtain their results.<br />
N <strong>The</strong> soft tissue profiles of men and women age<br />
differently, however many similarities were also<br />
found. Even though it can be said that aging of the<br />
facial profile begins 10 years later for men than for<br />
<strong>Angle</strong> <strong>Orthodontist</strong>, Vol 81, No 1, 2011
56 TORLAKOVIC, FÆRØVIG<br />
Table 4. All Significant Changes T3–T1 (in millimeters) for the<br />
Horizontal (x) and Vertical (y) Directions a<br />
Landmark N Mean SD P Value<br />
Male<br />
L. Conf<br />
Int*<br />
U. Conf<br />
Int*<br />
1x 18 21.587 1.629 0.001 22.397 20.777<br />
2x 17 22.271 1.210 0.000 22.893 21.650<br />
3x 14 22.873 1.851 0.000 23.941 21.804<br />
4x 17 22.043 2.042 0.001 23.093 20.994<br />
4y 17 22.428 4.367 0.036 24.674 20.183<br />
6x 22 21.734 3.057 0.015 23.089 20.378<br />
6y 22 23.254 4.198 0.002 25.115 21.393<br />
7y 19 23.377 4.964 0.008 25.770 20.985<br />
8y 16 23.350 4.701 0.012 25.855 20.845<br />
9y 19 22.098 4.189 0.043 24.117 20.078<br />
10y 22 22.159 4.282 0.028 24.057 20.260<br />
12y 21 22.941 3.740 0.002 24.644 21.239<br />
13y 20 24.067 3.762 0.000 25.828 22.306<br />
14y b 20 23.456 3.572 0.001 25.580 21.869<br />
15y 20 22.950 3.630 0.002 24.649 21.251<br />
16y 20 22.651 3.658 0.004 24.363 20.939<br />
17y 20 22.275 4.095 0.022 24.191 20.358<br />
19y 20 22.028 3.639 0.022 23.731 20.325<br />
20y 22 22.419 3.194 0.002 23.835 21.003<br />
23y 23 21.692 3.802 0.044 23.336 20.048<br />
24y 20 22.102 2.860 0.004 23.441 20.764<br />
Female<br />
1x 18 21.373 1.612 0.002 22.175 20.572<br />
2x 17 21.773 1.589 0.000 22.589 20.956<br />
3x 15 22.059 1.588 0.000 22.939 21.180<br />
4x 17 21.525 2.043 0.007 22.575 20.474<br />
5x 17 21.476 2.261 0.016 22.639 20.314<br />
6x 19 21.529 2.218 0.008 22.598 20.460<br />
7y 18 22.888 4.610 0.017 25.180 20.595<br />
8y 18 22.630 4.754 0.031 24.994 20.266<br />
9y 18 22.478 4.450 0.030 24.691 20.265<br />
10y 19 22.122 3.709 0.023 23.909 20.334<br />
12y 19 22.503 3.534 0.006 24.207 20.800<br />
13y 19 23.729 3.338 0.000 25.337 22.120<br />
14y 19 23.275 3.220 0.000 24.827 21.723<br />
15y 19 22.615 2.726 0.001 23.929 21.301<br />
16y 19 22.496 2.543 0.000 23.722 21.271<br />
17y 19 22.625 2.892 0.001 24.019 21.231<br />
18y 19 22.330 3.013 0.003 23.783 20.878<br />
19y 18 22.453 2.696 0.001 23.794 21.112<br />
20y 20 22.991 3.278 0.001 24.525 21.457<br />
21y 21 22.656 3.524 0.003 24.260 21.052<br />
22y 21 22.123 3.619 0.014 23.770 20.476<br />
23y 21 22.704 2.881 0.000 24.015 21.392<br />
24y 20 22.702 2.919 0.001 24.068 21.336<br />
a<br />
95% level of significance.<br />
b<br />
Distribution was not normal; nonparametric Wilcoxon test was<br />
used.<br />
women, when the changes do occur, they are of<br />
greater magnitude.<br />
N Aging of the soft tissue profile is not a gradual<br />
process; it occurs in spurts. Women experienced<br />
greater age-related changes from the second to third<br />
decades while men experienced greater age-related<br />
changes from the third to fourth decades. <strong>The</strong><br />
greatest changes in the soft tissue profile for both<br />
sexes occurred in the inferior direction.<br />
ACKNOWLEDGMENTS<br />
<strong>The</strong> authors thank Els-Marie Andersson, DDS, for her advice<br />
and support; Anita Åsheim, DDS, for her cooperation; Professor<br />
Emeritus Olav Bondevik, DDS, PhD, for use of his cephalometric<br />
material; Steffen Grønneberg, MS in mathematics, for his help<br />
with the statistical analysis, and Professor Ingar Olsen, DDS,<br />
PhD, for his advice.<br />
REFERENCES<br />
1. Björk A. Variations in the growth pattern of the human<br />
mandible: longitudinal radiographic study by the implant<br />
method. J Dent Res. 1963;42(pt 2):400–411.<br />
2. Ghafari J, Engel FE, Laster LL. Cephalometric superimposition<br />
on the cranial base: a review and a comparison of<br />
four methods. Am J Orthod Dentofacial Orthop. 1987;91:<br />
403–413.<br />
3. Bondevik O. Growth changes in the cranial base and the face:<br />
a longitudinal cephalometric study of linear and angular<br />
changes in adult Norwegians. Eur J Orthod. 1995;17:525–532.<br />
4. Sarhan OA. Sella-nasion line revisited. J Oral Rehabil. 1995;<br />
22:905–908.<br />
5. Satoh K, Wada T, Tachimura T, Fukuda J. Velar ascent and<br />
morphological factors affecting velopharyngeal function in<br />
patients with cleft palate and noncleft controls: a cephalometric<br />
study. Int J Oral Maxillofac Surg. 2005;34:122–126.<br />
6. Satoh K, Wada T, Tachimura T, Sakoda S, Shiba R. A<br />
cephalometric study of the relationship between the level of<br />
velopharyngeal closure and the palatal plane in patients<br />
with repaired cleft palate and controls without clefts.<br />
J Craniomaxillofac Surg. 1998;26:394–399.<br />
7. Alves PV, Mazucheli J, Vogel CJ, Bolognese AM. A protocol<br />
for cranial base reference in cephalometric studies.<br />
J Craniofac Surg. 2008;19:211–215.<br />
8. Wen-Ching KE, Figueroa AA, Polley JW. Soft tissue profile<br />
changes after maxillary advancement with distraction<br />
osteogenesis by use of a rigid external distraction device:<br />
a 1-year follow-up. JOralMaxillofacSurg. 2000;58:959–969;<br />
discussion 969–970.<br />
9. Björk A. Facial growth in man; x-ray studies with implanted<br />
metal indicators. Tandlaegebladet. 1955;59:55–66.<br />
10. Björk A. Facial growth in man, studied with the aid of metallic<br />
implants. Acta Odontol Scand. 1955;13:9–34.<br />
11. Björk A. Sutural growth of the upper face studied by the<br />
implant method. Acta Odontol Scand. 1966;24:109–127.<br />
12. Björk A. Growth in width of the maxilla studied by the implant<br />
method. Scand J Plast Reconstr Surg. 1974;8:26–33.<br />
13. Björk A, Skieller V. Growth and development of the maxillary<br />
complex. Inf Orthod Kieferorthop. 1984;16:9–52.<br />
14. Melsen B. <strong>The</strong> cranial base: the postnatal development of<br />
the cranial base studied histologically on human autopsy<br />
material. Acta Odont Scan. 1974; Vol 32, Suppl 62.<br />
15. Arat M, Köklü A, Ozdiler E, Rübendüz M, Erdoğan B.<br />
Craniofacial growth and skeletal maturation: a mixed<br />
longitudinal study. Eur J Orthod. 2001;23:355–361.<br />
16. Hahn von Dorsche S, Fanghänel J, Kubein-Meesenburg D,<br />
Nägerl H, Hanschke M. Interpretation of the vertical and<br />
longitudinal growth of the human skull. Ann Anat. 1999;181:<br />
99–103.<br />
17. Nelson TO. Analysis of the facial growth utilizing elements of<br />
the cranial base as registrations. Am J Orthod. 1960;46:379.<br />
<strong>Angle</strong> <strong>Orthodontist</strong>, Vol 81, No 1, 2011
AGE-RELATED CHANGES OF THE FACIAL PROFILE 57<br />
18. Athanasiou EA. Orthodontic Cephalometry. St Louis, MO:<br />
Mosby-Year Book; 1995:109.<br />
19. Create a Graph. Available at: http://nces.ed.gov/nceskids/<br />
creategraph/default.aspx. Accessed December 3, 2010.<br />
20. Sayinsu K, Isik F, Trakyali G, Arun T. An evaluation of the<br />
errors in cephalometric measurements on scanned cephalometric<br />
images and conventional tracings. Eur J Orthod.<br />
2007;29:105–108.<br />
21. Ferrario VF,Sforza C,SerraoG, Ciusa V, Dellavia C. Growth and<br />
aging of facial soft tissues: a computerized three-dimensional<br />
mesh diagram analysis. Clin Anat. 2003;16:420–433.<br />
22. Formby WA, Nanda RS, Currier GF. Longitudinal changes<br />
in the adult facial profile. Am J Orthod Dentofacial Orthop.<br />
1994;105:464–476.<br />
23. Bondevik O. Changes in occlusion between 23 and 34 years.<br />
<strong>Angle</strong> Orthod. 1998;68:75–80.<br />
<strong>Angle</strong> <strong>Orthodontist</strong>, Vol 81, No 1, 2011